

Informe sobre la PYME 2010 - Dirección General de PolÃtica de la ...
Informe sobre la PYME 2010 - Dirección General de PolÃtica de la ...
Informe sobre la PYME 2010 - Dirección General de PolÃtica de la ...

Create successful ePaper yourself
Turn your PDF publications into a flip-book with our unique Google optimized e-Paper software.
<strong>Informe</strong> <strong>sobre</strong> <strong>la</strong> <strong>PYME</strong> <strong>2010</strong><br />
Tab<strong>la</strong> 3.3.10. Variación <strong>de</strong> trabajadores, 2008-2009<br />
Agrario 2.600<br />
No Agrario –505.000<br />
Industria –184.900<br />
Construcción –275.900<br />
Servicios –44.200<br />
Total –502.400<br />
Fuente: Boletín Estadísticas Laborales, MTIN.<br />
El comportamiento <strong>de</strong> 2009 mantiene <strong>la</strong> línea <strong>de</strong><br />
inflexión que se produce en los dos años anteriores<br />
cambiando <strong>la</strong> ten<strong>de</strong>ncia <strong>de</strong> <strong>la</strong> línea <strong>de</strong> aumento en <strong>la</strong><br />
contratación <strong>de</strong> trabajadores que se producía <strong>de</strong>s<strong>de</strong><br />
2002 en todos los sectores, <strong>sobre</strong> todo en el <strong>de</strong> <strong>la</strong> construcción.<br />
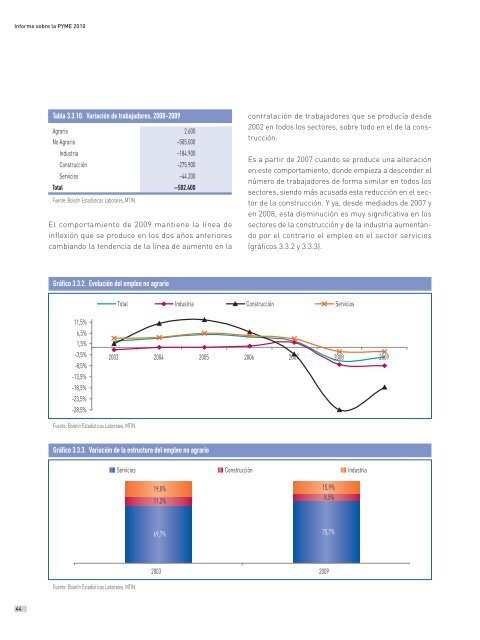
Es a partir <strong>de</strong> 2007 cuando se produce una alteración<br />
en este comportamiento, don<strong>de</strong> empieza a <strong>de</strong>scen<strong>de</strong>r el<br />
número <strong>de</strong> trabajadores <strong>de</strong> forma simi<strong>la</strong>r en todos los<br />
sectores, siendo más acusada esta reducción en el sector<br />
<strong>de</strong> <strong>la</strong> construcción. Y ya, <strong>de</strong>s<strong>de</strong> mediados <strong>de</strong> 2007 y<br />
en 2008, esta disminución es muy significativa en los<br />
sectores <strong>de</strong> <strong>la</strong> construcción y <strong>de</strong> <strong>la</strong> industria aumentando<br />
por el contrario el empleo en el sector servicios<br />
(gráficos 3.3.2 y 3.3.3).<br />
Gráfico 3.3.2. Evolución <strong>de</strong>l empleo no agrario<br />
Total Industria Construcción Servicios<br />
11,5%<br />
6,5%<br />
1,5%<br />
-3,5%<br />
-8,5%<br />
-13,5%<br />
-18,5%<br />
-23,5%<br />
-28,5%<br />
2003 2004 2005 2006 2007 2008 2009<br />
Fuente: Boletín Estadísticas Laborales, MTIN.<br />
Gráfico 3.3.3. Variación <strong>de</strong> <strong>la</strong> estructura <strong>de</strong>l empleo no agrario<br />
Servicios Construcción Industria<br />
19,0%<br />
11,2%<br />
15,9%<br />
8,5%<br />
69,7% 75,7%<br />
2003 2009<br />
Fuente: Boletín Estadísticas Laborales, MTIN.<br />
44


