

Informe sobre la PYME 2010 - Dirección General de PolÃtica de la ...
Informe sobre la PYME 2010 - Dirección General de PolÃtica de la ...
Informe sobre la PYME 2010 - Dirección General de PolÃtica de la ...

You also want an ePaper? Increase the reach of your titles
YUMPU automatically turns print PDFs into web optimized ePapers that Google loves.
<strong>Informe</strong> <strong>sobre</strong> <strong>la</strong> <strong>PYME</strong> <strong>2010</strong><br />
3.2<br />
Estructura espacial<br />
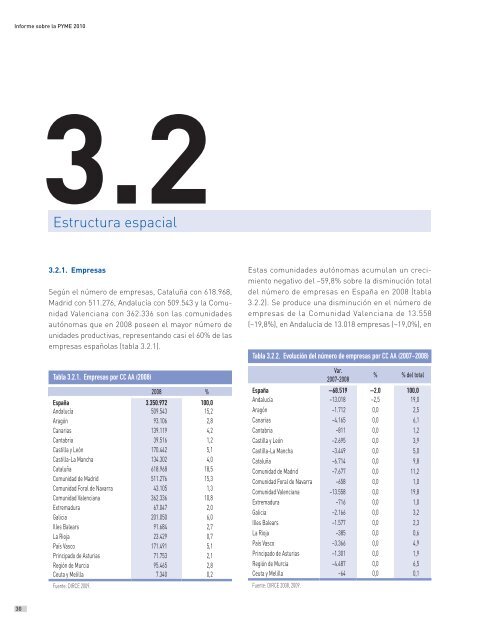
3.2.1. Empresas<br />
Según el número <strong>de</strong> empresas, Cataluña con 618.968,<br />
Madrid con 511.276, Andalucía con 509.543 y <strong>la</strong> Comunidad<br />
Valenciana con 362.336 son <strong>la</strong>s comunida<strong>de</strong>s<br />
autónomas que en 2008 poseen el mayor número <strong>de</strong><br />
unida<strong>de</strong>s productivas, representando casi el 60% <strong>de</strong> <strong>la</strong>s<br />
empresas españo<strong>la</strong>s (tab<strong>la</strong> 3.2.1).<br />
Tab<strong>la</strong> 3.2.1. Empresas por CC AA (2008)<br />
2008 %<br />
España 3.350.972 100,0<br />
Andalucía 509.543 15,2<br />
Aragón 93.106 2,8<br />
Canarias 139.119 4,2<br />
Cantabria 39.516 1,2<br />
Castil<strong>la</strong> y León 170.442 5,1<br />
Castil<strong>la</strong>-La Mancha 134.302 4,0<br />
Cataluña 618.968 18,5<br />
Comunidad <strong>de</strong> Madrid 511.276 15,3<br />
Comunidad Foral <strong>de</strong> Navarra 43.105 1,3<br />
Comunidad Valenciana 362.336 10,8<br />
Extremadura 67.047 2,0<br />
Galicia 201.050 6,0<br />
Illes Balears 91.684 2,7<br />
La Rioja 23.429 0,7<br />
País Vasco 171.491 5,1<br />
Principado <strong>de</strong> Asturias 71.753 2,1<br />
Región <strong>de</strong> Murcia 95.465 2,8<br />
Ceuta y Melil<strong>la</strong> 7.340 0,2<br />
Fuente: DIRCE 2009.<br />
Estas comunida<strong>de</strong>s autónomas acumu<strong>la</strong>n un crecimiento<br />
negativo <strong>de</strong>l –59,8% <strong>sobre</strong> <strong>la</strong> disminución total<br />
<strong>de</strong>l número <strong>de</strong> empresas en España en 2008 (tab<strong>la</strong><br />
3.2.2). Se produce una disminución en el número <strong>de</strong><br />
empresas <strong>de</strong> <strong>la</strong> Comunidad Valenciana <strong>de</strong> 13.558<br />
(–19,8%), en Andalucía <strong>de</strong> 13.018 empresas (–19,0%), en<br />
Tab<strong>la</strong> 3.2.2. Evolución <strong>de</strong>l número <strong>de</strong> empresas por CC AA (2007-2008)<br />
Var.<br />
2007-2008<br />
% % <strong>de</strong>l total<br />
España –68.519 –2,0 100,0<br />
Andalucía –13.018 –2,5 19,0<br />
Aragón –1.712 0,0 2,5<br />
Canarias –4.165 0,0 6,1<br />
Cantabria –811 0,0 1,2<br />
Castil<strong>la</strong> y León –2.695 0,0 3,9<br />
Castil<strong>la</strong>-La Mancha –3.449 0,0 5,0<br />
Cataluña –6.714 0,0 9,8<br />
Comunidad <strong>de</strong> Madrid –7.677 0,0 11,2<br />
Comunidad Foral <strong>de</strong> Navarra –658 0,0 1,0<br />
Comunidad Valenciana –13.558 0,0 19,8<br />
Extremadura –716 0,0 1,0<br />
Galicia –2.166 0,0 3,2<br />
Illes Balears –1.577 0,0 2,3<br />
La Rioja –385 0,0 0,6<br />
País Vasco –3.366 0,0 4,9<br />
Principado <strong>de</strong> Asturias –1.301 0,0 1,9<br />
Región <strong>de</strong> Murcia –4.487 0,0 6,5<br />
Ceuta y Melil<strong>la</strong> –64 0,0 0,1<br />
Fuente: DIRCE 2008, 2009.<br />
30


