Anexo III. Inventario de residuos peligrosos de la CAPV 2004
Anexo III. Inventario de residuos peligrosos de la CAPV 2004
Anexo III. Inventario de residuos peligrosos de la CAPV 2004

You also want an ePaper? Increase the reach of your titles
YUMPU automatically turns print PDFs into web optimized ePapers that Google loves.
<strong>Inventario</strong> <strong>de</strong> Residuos Peligrosos <strong>de</strong> <strong>la</strong> <strong>CAPV</strong> – Año <strong>2004</strong><br />
3.4.2 Análisis excluyendo los <strong>residuos</strong> históricos<br />
Si se elimina <strong>la</strong> influencia <strong>de</strong> los <strong>residuos</strong> históricos, el porcentaje <strong>de</strong> gestión en <strong>la</strong> <strong>CAPV</strong> <strong>de</strong> los<br />
<strong>residuos</strong> <strong>peligrosos</strong> generados ascien<strong>de</strong> hasta el 67,00%.<br />
Territorialmente, <strong>la</strong> única variación se observa en Bizkaia, cuya tasa <strong>de</strong> gestión en <strong>la</strong> <strong>CAPV</strong><br />
ascien<strong>de</strong> hasta el 60,53% al eliminar <strong>la</strong> influencia <strong>de</strong> <strong>la</strong>s tierras contaminadas.<br />
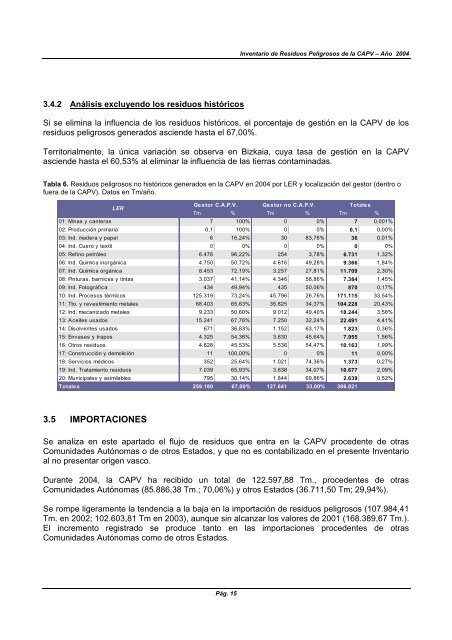
Tab<strong>la</strong> 6. Residuos <strong>peligrosos</strong> no históricos generados en <strong>la</strong> <strong>CAPV</strong> en <strong>2004</strong> por LER y localización <strong>de</strong>l gestor (<strong>de</strong>ntro o<br />
fuera <strong>de</strong> <strong>la</strong> <strong>CAPV</strong>). Datos en Tm/año.<br />
LER<br />
Gestor C.A.P.V. Gestor no C.A.P.V. Totales<br />
Tm % Tm % Tm %<br />
01: Minas y canteras 7 100% 0 0% 7 0,001%<br />
02: Producción primaria 0,1 100% 0 0% 0,1 0,00%<br />
03: Ind. ma<strong>de</strong>ra y papel 6 16,24% 30 83,76% 36 0,01%<br />
04: Ind. Cuero y textil 0 0% 0 0% 0 0%<br />
05: Refino petróleo 6.476 96,22% 254 3,78% 6.731 1,32%<br />
06: Ind. Química inorgánica 4.750 50,72% 4.616 49,28% 9.366 1,84%<br />
07: Ind. Química orgánica 8.453 72,19% 3.257 27,81% 11.709 2,30%<br />
08: Pinturas, barnices y tintas 3.037 41,14% 4.346 58,86% 7.384 1,45%<br />
09: Ind. Fotográfica 434 49,94% 435 50,06% 870 0,17%<br />
10: Ind. Procesos térmicos 125.319 73,24% 45.796 26,76% 171.115 33,54%<br />
11: Tto. y revestimiento metales 68.403 65,63% 35.825 34,37% 104.228 20,43%<br />
12: Ind. mecanizado metales 9.233 50,60% 9.012 49,40% 18.244 3,58%<br />
13: Aceites usados 15.241 67,76% 7.250 32,24% 22.491 4,41%<br />
14: Disolventes usados 671 36,83% 1.152 63,17% 1.823 0,36%<br />
15: Envases y trapos 4.325 54,36% 3.630 45,64% 7.955 1,56%<br />
16: Otros <strong>residuos</strong> 4.628 45,53% 5.536 54,47% 10.163 1,99%<br />
17: Construcción y <strong>de</strong>molición 11 100,00% 0 0% 11 0,00%<br />
18: Servicios médicos 352 25,64% 1.021 74,36% 1.373 0,27%<br />
19: Ind. Tratamiento <strong>residuos</strong> 7.039 65,93% 3.638 34,07% 10.677 2,09%<br />
20: Municipales y asimi<strong>la</strong>bles 795 30,14% 1.844 69,86% 2.639 0,52%<br />
Totales 259.180 67,00% 127.641 33,00% 386.821<br />
3.5 IMPORTACIONES<br />
Se analiza en este apartado el flujo <strong>de</strong> <strong>residuos</strong> que entra en <strong>la</strong> <strong>CAPV</strong> proce<strong>de</strong>nte <strong>de</strong> otras<br />
Comunida<strong>de</strong>s Autónomas o <strong>de</strong> otros Estados, y que no es contabilizado en el presente <strong>Inventario</strong><br />
al no presentar origen vasco.<br />
Durante <strong>2004</strong>, <strong>la</strong> <strong>CAPV</strong> ha recibido un total <strong>de</strong> 122.597,88 Tm., proce<strong>de</strong>ntes <strong>de</strong> otras<br />
Comunida<strong>de</strong>s Autónomas (85.886,38 Tm.; 70,06%) y otros Estados (36.711,50 Tm; 29,94%).<br />
Se rompe ligeramente <strong>la</strong> ten<strong>de</strong>ncia a <strong>la</strong> baja en <strong>la</strong> importación <strong>de</strong> <strong>residuos</strong> <strong>peligrosos</strong> (107.984,41<br />
Tm. en 2002; 102.603,81 Tm en 2003), aunque sin alcanzar los valores <strong>de</strong> 2001 (168.389,67 Tm.).<br />
El incremento registrado se produce tanto en <strong>la</strong>s importaciones proce<strong>de</strong>ntes <strong>de</strong> otras<br />
Comunida<strong>de</strong>s Autónomas como <strong>de</strong> otros Estados.<br />
Pág. 15