Anexo III. Inventario de residuos peligrosos de la CAPV 2004
Anexo III. Inventario de residuos peligrosos de la CAPV 2004
Anexo III. Inventario de residuos peligrosos de la CAPV 2004

You also want an ePaper? Increase the reach of your titles
YUMPU automatically turns print PDFs into web optimized ePapers that Google loves.
<strong>Inventario</strong><br />
<strong>de</strong> Residuos Peligrosos<br />
<strong>de</strong> <strong>la</strong> Comunidad Autónoma<br />
<strong>de</strong>l País Vasco<br />
2 0 0 4
<strong>Inventario</strong> <strong>de</strong> Residuos Peligrosos <strong>de</strong> <strong>la</strong> <strong>CAPV</strong> – Año <strong>2004</strong><br />
Índice<br />
0. NOTA PREVIA ................................................................................................................................1<br />
1. INTRODUCCIÓN.............................................................................................................................2<br />
2. METODOLOGÍA..............................................................................................................................3<br />
2.1 PROCEDIMIENTO PARA LA REALIZACIÓN DEL INVENTARIO .................................................................3<br />
2.2 ANÁLISIS DE LA INFORMACIÓN.........................................................................................................3<br />
3. ANÁLISIS GLOBAL........................................................................................................................5<br />
3.1 TIPOS Y CANTIDADES DE RESIDUOS INVENTARIADOS ........................................................................5<br />
3.1.1 Análisis consi<strong>de</strong>rando los <strong>residuos</strong> históricos ........................................................................5<br />
3.1.2 Análisis excluyendo los <strong>residuos</strong> históricos............................................................................7<br />
3.2 GESTIÓN DE RESIDUOS PELIGROSOS ..............................................................................................8<br />
3.2.1 Análisis consi<strong>de</strong>rando los <strong>residuos</strong> históricos ........................................................................8<br />
3.2.2 Análisis excluyendo los <strong>residuos</strong> históricos............................................................................9<br />
3.3 DISTRIBUCIÓN GEOGRÁFICA DE LOS RESIDUOS PELIGROSOS ............................................................9<br />
3.3.1 Análisis consi<strong>de</strong>rando los <strong>residuos</strong> históricos ........................................................................9<br />
3.3.2 Análisis excluyendo los <strong>residuos</strong> históricos..........................................................................11<br />
3.4 DESTINO DE LA GESTIÓN ..............................................................................................................12<br />
3.4.1 Análisis consi<strong>de</strong>rando los <strong>residuos</strong> históricos ......................................................................12<br />
3.4.2 Análisis excluyendo los <strong>residuos</strong> históricos..........................................................................15<br />
3.5 IMPORTACIONES ..........................................................................................................................15<br />
3.5.1 Importaciones proce<strong>de</strong>ntes <strong>de</strong> otras Comunida<strong>de</strong>s Autónomas..........................................16<br />
3.5.2 Importaciones proce<strong>de</strong>ntes <strong>de</strong> otros Estados ......................................................................17<br />
3.6 EXPORTACIONES .........................................................................................................................19<br />
3.6.1 Exportaciones a otras Comunida<strong>de</strong>s Autónomas.................................................................19<br />
3.6.2 Exportaciones a otros Estados .............................................................................................21<br />
3.7 AUTOGESTIÓN .............................................................................................................................23<br />
3.8 EVOLUCIÓN INTERANUAL..............................................................................................................24<br />
3.8.1 Análisis consi<strong>de</strong>rando los <strong>residuos</strong> históricos ......................................................................24<br />
3.8.2 Análisis excluyendo los <strong>residuos</strong> históricos..........................................................................26<br />
4. ANÁLISIS POR CATEGORÍAS LER............................................................................................31<br />
4.1 LER 01: RESIDUOS DE MINAS Y CANTERAS ...................................................................................32<br />
4.2 LER 02: RESIDUOS DE LOS PRODUCCIÓN AGROALIMENTARIA.........................................................33<br />
4.3 LER 03: RESIDUOS DE LA INDUSTRIA DE LA MADERA Y DEL PAPEL..................................................34<br />
4.4 LER 04: RESIDUOS DE LA INDUSTRIA TEXTIL Y DE LA PIEL ..............................................................36<br />
4.5 LER 05: RESIDUOS DE LA INDUSTRIA DEL PETRÓLEO, GAS NATURAL Y CARBÓN ..............................37<br />
4.6 LER 06: RESIDUOS DE PROCESOS QUÍMICOS INORGÁNICOS ..........................................................39<br />
4.7 LER 07: RESIDUOS DE PROCESOS QUÍMICOS ORGÁNICOS .............................................................41<br />
4.8 LER 08: RESIDUOS DE PINTURAS, BARNICES Y TINTAS...................................................................44<br />
4.9 LER 09: RESIDUOS DE LA INDUSTRIA FOTOGRÁFICA......................................................................46<br />
4.10 LER 10: RESIDUOS DE PROCESOS TÉRMICOS ...............................................................................48<br />
4.11 LER 11: RESIDUOS DEL TRATAMIENTO Y REVESTIMIENTO DE METALES...........................................51<br />
4.12 LER 12: RESIDUOS DEL MOLDEADO DE METALES Y PLÁSTICOS ......................................................53<br />
4.13 LER 13: RESIDUOS DE ACEITES NO COMESTIBLES.........................................................................55<br />
4.14 LER 14: RESIDUOS DE DISOLVENTES ...........................................................................................57<br />
4.15 LER 15: RESIDUOS DE ENVASES, TRAPOS Y ROPAS DE PROTECCIÓN..............................................59<br />
4.16 LER 16: RESIDUOS NO ESPECIFICADOS EN OTRA CATEGORÍA ........................................................61<br />
4.17 LER 17: RESIDUOS DE CONSTRUCCIÓN Y DEMOLICIÓN..................................................................64<br />
4.18 LER 18: RESIDUOS MÉDICOS O VETERINARIOS..............................................................................66<br />
I
<strong>Inventario</strong> <strong>de</strong> Residuos Peligrosos <strong>de</strong> <strong>la</strong> <strong>CAPV</strong> – Año <strong>2004</strong><br />
4.19 LER 19: RESIDUOS DE INSTALACIONES DE TRATAMIENTO DE RESIDUOS O AGUA .............................68<br />
4.20 LER 20: RESIDUOS URBANOS......................................................................................................70<br />
5. ANÁLISIS DETALLADO DE CIERTOS RESIDUOS....................................................................72<br />
5.1 RESIDUOS DE DISOLVENTES USADOS ............................................................................................73<br />
5.2 RESIDUOS DE PILAS Y ACUMULADORES .........................................................................................76<br />
5.3 RESIDUOS DE APARATOS ELÉCTRICOS Y ELECTRÓNICOS................................................................78<br />
5.4 VEHÍCULOS FUERA DE USO...........................................................................................................79<br />
5.5 RESIDUOS “HISTÓRICOS” .............................................................................................................81<br />
5.5.1 Tierras y piedras que contienen sustancias peligrosas........................................................81<br />
5.5.2 Aceites con PCB y aparatos contaminados con PCB ..........................................................81<br />
5.5.3 Residuos <strong>de</strong> amianto ............................................................................................................82<br />
6. CONCLUSIONES..........................................................................................................................84<br />
7. ANEXO I. DATOS DESAGREGADOS .........................................................................................86<br />
II
<strong>Inventario</strong> <strong>de</strong> Residuos Peligrosos <strong>de</strong> <strong>la</strong> <strong>CAPV</strong> – Año <strong>2004</strong><br />
0. NOTA PREVIA<br />
Los aparentes errores aritméticos que puedan <strong>de</strong>tectarse en <strong>la</strong>s operaciones (sumas y<br />
porcentajes) presentes en <strong>la</strong>s tab<strong>la</strong>s <strong>de</strong> este <strong>Inventario</strong> se <strong>de</strong>ben a <strong>la</strong> <strong>de</strong>cisión adoptada <strong>de</strong><br />
consi<strong>de</strong>rar todas <strong>la</strong>s cifras <strong>de</strong>cimales <strong>de</strong> cada sumando, in<strong>de</strong>pendientemente <strong>de</strong>l número<br />
<strong>de</strong> cifras <strong>de</strong>cimales que hayan sido visualizadas en cada caso.<br />
Se consi<strong>de</strong>ra que esta opción garantiza que el resultado <strong>de</strong> cada operación no se vea<br />
reducido por el redon<strong>de</strong>o que pueda haberse efectuado en <strong>la</strong> presentación <strong>de</strong> cada<br />
sumando.<br />
1.<br />
Pág. 1
<strong>Inventario</strong> <strong>de</strong> Residuos Peligrosos <strong>de</strong> <strong>la</strong> <strong>CAPV</strong> – Año <strong>2004</strong><br />
INTRODUCCIÓN<br />
La necesidad <strong>de</strong> e<strong>la</strong>borar un <strong>Inventario</strong> Permanente re<strong>la</strong>tivo a <strong>la</strong> generación y gestión <strong>de</strong> los<br />
<strong>residuos</strong> <strong>peligrosos</strong> <strong>de</strong> <strong>la</strong> Comunidad Autónoma <strong>de</strong>l País Vasco nace en 1992 con <strong>la</strong> publicación<br />
por parte <strong>de</strong> <strong>la</strong> Sociedad Pública <strong>de</strong> Gestión Medio Ambiental IHOBE, S.A. <strong>de</strong>l “P<strong>la</strong>n <strong>de</strong> Gestión<br />
<strong>de</strong> Residuos Especiales <strong>de</strong> <strong>la</strong> <strong>CAPV</strong>”, que recoge <strong>la</strong>s estrategias <strong>de</strong> actuación en esta materia<br />
durante el periodo 1994-2000.<br />
El “P<strong>la</strong>n <strong>de</strong> Gestión <strong>de</strong> Residuos Peligrosos <strong>de</strong> <strong>la</strong> <strong>CAPV</strong> 2003-2006” mantenía este requisito en su<br />
apartado 7.2 Instrumentos <strong>de</strong> actuación: Sistema <strong>de</strong> información y control:<br />
“Los principales retos a los que <strong>de</strong>be hacer frente el sistema <strong>de</strong> información pue<strong>de</strong>n resumirse<br />
en los siguientes puntos:<br />
…<br />
• Producción <strong>de</strong> un informe anual con datos <strong>de</strong> generación, tratamiento y movimiento <strong>de</strong> los<br />
<strong>residuos</strong>, que permita <strong>la</strong> comparación y el seguimiento <strong>de</strong> los objetivos marcados por el<br />
P<strong>la</strong>n”.<br />
Como respuesta a este mandato se han e<strong>la</strong>borado hasta <strong>la</strong> fecha siete <strong>Inventario</strong>s <strong>de</strong> Residuos<br />
Peligrosos, correspondientes a los años 1994, 1998, 1999, 2000, 2001, 2002 y 2003. El presente<br />
documento constituye el octavo <strong>Inventario</strong>, re<strong>la</strong>tivo a los <strong>residuos</strong> <strong>peligrosos</strong> generados durante el<br />
año <strong>2004</strong>.<br />
En esta edición el inventario se incorpora como <strong>Anexo</strong> al “P<strong>la</strong>n <strong>de</strong> Prevención y Gestión <strong>de</strong><br />
Residuos Peligrosos 2008-2011”, y ha sido utilizado como fuente <strong>de</strong> información y contraste para<br />
valorar el grado <strong>de</strong> cumplimiento <strong>de</strong> los compromisos adquiridos por el P<strong>la</strong>n cuya vigencia finalizó<br />
en 2006.<br />
2.<br />
Pág. 2
<strong>Inventario</strong> <strong>de</strong> Residuos Peligrosos <strong>de</strong> <strong>la</strong> <strong>CAPV</strong> – Año <strong>2004</strong><br />
METODOLOGÍA<br />
2.1 PROCEDIMIENTO PARA LA REALIZACIÓN DEL INVENTARIO<br />
Para <strong>la</strong> e<strong>la</strong>boración <strong>de</strong>l presente <strong>Inventario</strong> se ha adoptado <strong>la</strong> misma metodología utilizada en el<br />
diseño <strong>de</strong> los seis <strong>Inventario</strong>s previos (1998-2003), basada en <strong>la</strong> información que genera <strong>la</strong><br />
gestión <strong>de</strong> <strong>residuos</strong> <strong>peligrosos</strong> a través <strong>de</strong>:<br />
• Los Documentos <strong>de</strong> Control y Seguimiento, (en a<strong>de</strong><strong>la</strong>nte D.C.S.), que se tramitan entre<br />
el productor y el gestor cada vez que se realiza un tras<strong>la</strong>do <strong>de</strong> un residuo peligroso,<br />
según lo establecido en el Real Decreto 833/88.<br />
• Los Documentos B, cumplimentados en el momento en que un recogedor autorizado <strong>de</strong><br />
aceites o un productor realiza una entrega a un gestor, tal y como queda regu<strong>la</strong>do en el<br />
Decreto 259/98 <strong>de</strong> <strong>la</strong> Comunidad Autónoma <strong>de</strong>l País Vasco.<br />
• Las Memorias Anuales <strong>de</strong> los gestores, especialmente <strong>de</strong> aquéllos que son<br />
consi<strong>de</strong>rados autogestores, es <strong>de</strong>cir, que han sido autorizados para gestionar alguno <strong>de</strong><br />
los <strong>residuos</strong> que generan.<br />
• La información <strong>de</strong> Importaciones y Exportaciones <strong>de</strong> <strong>residuos</strong> <strong>peligrosos</strong>, <strong>de</strong>rivada <strong>de</strong>l<br />
cumplimiento <strong>de</strong> <strong>la</strong>s normas vigentes en materia <strong>de</strong> tras<strong>la</strong>dos interestatales <strong>de</strong> <strong>residuos</strong>.<br />
Tras ser <strong>de</strong>bidamente informatizada <strong>la</strong> documentación necesaria, se ha procedido a <strong>la</strong> asignación<br />
<strong>de</strong>l código LER a cada corriente <strong>de</strong> <strong>residuos</strong>, utilizando criterios comunes y homogéneos con el<br />
objeto <strong>de</strong> garantizar <strong>la</strong> fiabilidad y comparabilidad <strong>de</strong> <strong>la</strong> información a analizar.<br />
Finalmente, una a<strong>de</strong>cuada explotación informática <strong>de</strong> los datos almacenados ha permitido<br />
generar <strong>la</strong>s diferentes tab<strong>la</strong>s y gráficos que conforman el presente <strong>Inventario</strong>, no sin antes haber<br />
realizado algunos ajustes con el fin <strong>de</strong>:<br />
• Eliminar <strong>la</strong> doble contabilidad generada por los Centros <strong>de</strong> Transferencia, que <strong>de</strong>ben<br />
cumplimentar, para cada residuo, un documento tanto a <strong>la</strong> entrada como a <strong>la</strong> salida <strong>de</strong> <strong>la</strong><br />
p<strong>la</strong>nta.<br />
• Determinar el tratamiento final que se aplica realmente a los diferentes <strong>residuos</strong><br />
recogidos por los Centros <strong>de</strong> Transferencia.<br />
2.2 ANÁLISIS DE LA INFORMACIÓN<br />
La información contenida en el <strong>Inventario</strong> se presenta en este documento en diferentes niveles <strong>de</strong><br />
agregación.<br />
En primer lugar, se realiza un análisis global en el que se <strong>de</strong>scriben los resultados obtenidos al<br />
nivel <strong>de</strong> categoría LER (2 dígitos). Ello permite obtener<br />
una visión general <strong>de</strong> <strong>la</strong>s principales<br />
corrientes <strong>de</strong> <strong>residuos</strong> <strong>peligrosos</strong> existentes en <strong>la</strong> Comunidad Autónoma <strong>de</strong>l País Vasco y <strong>de</strong> <strong>la</strong><br />
evolución que han experimentado <strong>de</strong>s<strong>de</strong> el anterior <strong>Inventario</strong> <strong>de</strong> 2003.<br />
Pág. 3
<strong>Inventario</strong> <strong>de</strong> Residuos Peligrosos <strong>de</strong> <strong>la</strong> <strong>CAPV</strong> – Año <strong>2004</strong><br />
Posteriormente, cada una <strong>de</strong> <strong>la</strong>s categorías LER es objeto <strong>de</strong> un capítulo diferenciado en el que<br />
se <strong>de</strong>scriben y analizan en <strong>de</strong>talle los resultados <strong>de</strong> cada corriente <strong>de</strong> <strong>residuos</strong>, llegando al nivel<br />
<strong>de</strong> código LER (6 dígitos).<br />
La información se analiza en función <strong>de</strong> cuatro variables básicas a lo <strong>la</strong>rgo <strong>de</strong> todo el documento:<br />
• Tipología <strong>de</strong>l residuo, en base al código LER.<br />
• Proce<strong>de</strong>ncia <strong>de</strong>l residuo, a nivel <strong>de</strong> Territorios Históricos.<br />
• Destino <strong>de</strong> <strong>la</strong> gestión <strong>de</strong>l residuo, dividido en dos categorías:<br />
− Gestores ubicados en <strong>la</strong> Comunidad Autónoma <strong>de</strong>l País Vasco.<br />
− Gestores ubicados fuera <strong>de</strong> <strong>la</strong> Comunidad Autónoma <strong>de</strong>l País Vasco.<br />
• Tipo <strong>de</strong> gestión <strong>de</strong>l residuo, dividido en cuatro categorías generales:<br />
− Eliminación, que agrupa el tratamiento fisicoquímico y el confinamiento en<br />
<strong>de</strong>pósito <strong>de</strong> seguridad, o cualquier combinación <strong>de</strong> <strong>la</strong>s mismas.<br />
− Incineración sin aprovechamiento energético.<br />
− Valorización energética.<br />
− Recic<strong>la</strong>je o valorización <strong>de</strong> <strong>la</strong> materia.<br />
Para los <strong>residuos</strong> gestionados por Centros <strong>de</strong> Transferencia con p<strong>la</strong>nta en <strong>la</strong> Comunidad<br />
Autónoma se ha asignado, en <strong>la</strong> medida <strong>de</strong> lo posible, el tipo <strong>de</strong> gestión y <strong>la</strong> ubicación geográfica<br />
correspondientes a los gestores finales <strong>de</strong> cada residuo.<br />
La elimin ación y <strong>la</strong> incineración aglutinan los sistemas <strong>de</strong> gestión recogidos en <strong>la</strong> Parte A <strong>de</strong>l<br />
Anejo I <strong>de</strong> <strong>la</strong> Or<strong>de</strong>n MAM/304/2002, <strong>de</strong> 8 <strong>de</strong> febrero, por <strong>la</strong> que se publican <strong>la</strong>s operaciones <strong>de</strong><br />
valorización y eliminación <strong>de</strong> <strong>residuos</strong> y <strong>la</strong> lista europea <strong>de</strong> <strong>residuos</strong>, esto es, operaciones <strong>de</strong><br />
eliminación que no conducen a una posible recuperación o valoración, regeneración, reutilización,<br />
recic<strong>la</strong>do o cualquier otra utilización <strong>de</strong> los <strong>residuos</strong> y que en el citado Anejo se codifican con <strong>la</strong><br />
letra D.<br />
Por el contrario, <strong>la</strong> valorización energética y el recic<strong>la</strong>je aglutinan <strong>la</strong>s operaciones que llevan a una<br />
posible recuperación o valorización, regeneración, reutilización, recic<strong>la</strong>do o cualquier otra<br />
utilización <strong>de</strong> los <strong>residuos</strong>, que se codifican con <strong>la</strong> letra R (Parte B <strong>de</strong>l Anejo I <strong>de</strong> <strong>la</strong> Or<strong>de</strong>n<br />
MAM/304/2002).<br />
In<strong>de</strong>pendientemente <strong>de</strong>l tipo <strong>de</strong> gestión al que hayan sido sometidos, todos los <strong>residuos</strong><br />
contenidos en el presente <strong>Inventario</strong> han sido gestionados con arreglo a <strong>la</strong> normativa vigente.<br />
Pág. 4
<strong>Inventario</strong> <strong>de</strong> Residuos Peligrosos <strong>de</strong> <strong>la</strong> <strong>CAPV</strong> – Año <strong>2004</strong><br />
3. ANÁLISIS GLOBAL<br />
3.1 TIPOS Y CANTIDADES DE RESIDUOS INVENTARIADOS<br />
3.1.1 Análisis consi<strong>de</strong>rando los <strong>residuos</strong> históricos<br />
La Comunidad Autónoma <strong>de</strong>l País Vasco ha gestionado durante <strong>2004</strong> un total <strong>de</strong> 510.205 Tm. <strong>de</strong><br />
<strong>residuos</strong> <strong>peligrosos</strong>.<br />
La gran novedad en el presente inventario es <strong>la</strong> significativa aportación <strong>de</strong> <strong>la</strong>s tierras<br />
contaminadas, que alcanzan <strong>la</strong>s 118.228 tone<strong>la</strong>das, convirtiéndose en el segundo residuo <strong>de</strong><br />
mayor generación tras los polvos <strong>de</strong> acería (123.435 Tm), a distancia <strong>de</strong> los ácidos <strong>de</strong> <strong>de</strong>capado<br />
que constituyen <strong>la</strong> tercera corriente en importancia (79.471 Tm).<br />
Por tipos <strong>de</strong> actividad, <strong>la</strong> industria <strong>de</strong> producción y transformación <strong>de</strong> metales, englobada en los<br />
LER 10, 11 y 12, constituye un año más el sector <strong>de</strong> mayor contribución. Residuos tales como<br />
polvos <strong>de</strong> acería, escorias salinas, ácidos <strong>de</strong> <strong>de</strong>capado y ta<strong>la</strong>drinas, entre otros, suman un total <strong>de</strong><br />
293.587 Tm., el 57,54% <strong>de</strong>l total generado.<br />
En un segundo nivel, se encuentran <strong>la</strong> industria química orgánica (LER 07, 11.709 Tm) e<br />
inorgánica (LER 06, 9.366 Tm) y <strong>la</strong> industria petroquímica (LER 05, 6.731 Tm).<br />
Respecto a <strong>la</strong>s corrientes c<strong>la</strong>sificadas en torno a <strong>la</strong> naturaleza <strong>de</strong>l residuo, <strong>de</strong>staca este año <strong>la</strong><br />
aportación <strong>de</strong> los aceites usados (LER 13, 22.917 Tm) y los <strong>residuos</strong> <strong>de</strong> <strong>la</strong>s insta<strong>la</strong>ciones <strong>de</strong><br />
tratamiento <strong>de</strong> <strong>residuos</strong> (LER 19, 10.677 Tm), que experimentan un notable incremento. Otras<br />
corrientes tales como <strong>la</strong>s pinturas (LER 08, 7.384 Tm) y los envases y absorbentes (LER 15,<br />
7.955 Tm) siguen creciendo año tras año, lo que se interpreta positivamente dada <strong>la</strong> dificultad <strong>de</strong><br />
incorporar al circuito <strong>de</strong> gestión partidas <strong>de</strong> generación tan atomizada.<br />
Pág. 5
<strong>Inventario</strong> <strong>de</strong> Residuos Peligrosos <strong>de</strong> <strong>la</strong> <strong>CAPV</strong> – Año <strong>2004</strong><br />
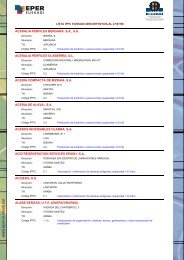
Tab<strong>la</strong> 1. Residuos <strong>peligrosos</strong> generados en <strong>la</strong> <strong>CAPV</strong> en <strong>2004</strong> por LER y tipo <strong>de</strong> gestión. Datos en Tm/año.<br />
LER<br />
Elim inación Incineración Recic<strong>la</strong>je Valor. Energ.<br />
Totales<br />
Tm % Tm % Tm % Tm % Tm %<br />
01: Minas y canteras 7 100% 0 0% 0 0% 0 0% 7 0,001%<br />
02: Producción primaria 0,1 100% 0 0% 0 0% 0 0% 0,1 0%<br />
03: Ind. ma<strong>de</strong>ra y papel 6 16,24% 30 83,76% 0 0% 0 0% 36 0,01%<br />
04: Ind. Cuero y textil 0 0% 0 0% 0 0% 0 0% 0 0%<br />
05: Refino petróleo 1.265 18,79% 0 0% 5.466 81,21% 0 0% 6.731 1,32%<br />
06: Ind. Química inorgánica 9.271 98,98% 0 0% 85 0,91% 10 0,11% 9.366 1,84%<br />
07: Ind. Química orgánica 9.533 81,42% 46 0,39% 627 5,36% 1.503 12,83% 11.709 2,30%<br />
08: Pinturas, barnices y tintas 5.403 73,18% 0 0% 1.618 21,91% 363 4,91% 7.384 1,45%<br />
09: Ind. Fotográfica 465 53,47% 0 0% 405 46,53% 0 0% 870 0,17%<br />
10: Ind. Procesos térmicos 68.995 40,32% 0 0% 102.119 59,68% 0 0,00% 171.115 33,54%<br />
11: Tto. y revestimiento metales 40.870 39,21% 0 0% 63.299 60,73% 60 0,06% 104.228 20,43%<br />
12: Ind. mecanizado metales 14.966 82,03% 251 1,37% 2.660 14,58% 368 2,02% 18.244 3,58%<br />
13: Aceites usados 8.965 39,12% 454 1,98% 10.357 45,19% 3.141 13,71% 22.917 4,49%<br />
14: Disolventes usados 254 13,91% 94 5,13% 1.408 77,24% 68 3,71% 1.823 0,36%<br />
15: Envases y trapos 4.915 61,79% 6 0,08% 2.909 36,57% 124 1,56% 7.955 1,56%<br />
16: Otros <strong>residuos</strong> 4.623 45,16% 30 0,29% 4.667 45,60% 916 8,95% 10.236 2,01%<br />
17: Construcción y <strong>de</strong>molición 122.503 99,68% 0 0% 392 0,32% 0 0% 122.895 24,09%<br />
18: Servicios médicos 229 16,68% 1.144 83,32% 0 0% 0 0% 1.373 0,27%<br />
19: Ind. Tratamiento <strong>residuos</strong> 10.451 97,89% 0 0% 226 2,11% 0 0% 10.677 2,09%<br />
20: Municipales y asimi<strong>la</strong>bles 3 0,11% 0 0% 2.636 99,89% 0 0% 2.639 0,52%<br />
Totales 302.724 59,33% 2.054 0,40% 198.873 38,98% 6.553 1,28% 510.205<br />
LER<br />
01<br />
02<br />
03<br />
04<br />
05<br />
06<br />
07<br />
08<br />
09<br />
10<br />
11<br />
12<br />
13<br />
14<br />
15<br />
16<br />
17<br />
18<br />
19<br />
20<br />
Tm<br />
0 25.000 50.000 75.000 100.000 125.000 150.000 175.000<br />
Eliminación Incineración Recic<strong>la</strong>je Valor. Energ.<br />
Figura 1. Residuos <strong>peligrosos</strong> generados en <strong>la</strong> <strong>CAPV</strong> en <strong>2004</strong> por tipo <strong>de</strong> gestión. Datos en Tm/año.<br />
La totalidad <strong>de</strong> los <strong>residuos</strong> <strong>peligrosos</strong> analizados hasta el momento pue<strong>de</strong>n dividirse en tres<br />
gran<strong>de</strong>s grupos:<br />
• Los <strong>residuos</strong> <strong>peligrosos</strong> asociados a <strong>la</strong> actividad económica anual, objeto<br />
fundamental <strong>de</strong> <strong>la</strong>s políticas <strong>de</strong> prevención y valorización, y cuyo comportamiento<br />
condiciona el grado <strong>de</strong> <strong>de</strong>sacop<strong>la</strong>miento existente entre <strong>la</strong> producción <strong>de</strong> <strong>residuos</strong> y el<br />
crecimiento económico.<br />
• Los <strong>residuos</strong> <strong>peligrosos</strong> proce<strong>de</strong>ntes <strong>de</strong> tratamientos <strong>de</strong> fin <strong>de</strong> línea, ya sean <strong>de</strong>l<br />
tratamiento <strong>de</strong> aguas residuales (tortas <strong>de</strong> <strong>de</strong>puradora, <strong>residuos</strong> <strong>de</strong> separadores <strong>de</strong><br />
Pág. 6
<strong>Inventario</strong> <strong>de</strong> Residuos Peligrosos <strong>de</strong> <strong>la</strong> <strong>CAPV</strong> – Año <strong>2004</strong><br />
hidrocarburos, etc.) o <strong>de</strong> <strong>la</strong> <strong>de</strong>puración <strong>de</strong> emisiones atmosféricas (<strong>residuos</strong> sólidos <strong>de</strong>l<br />
tratamiento <strong>de</strong> gases, lodos <strong>de</strong> filtración, etc.). Estas corrientes están asociadas<br />
c<strong>la</strong>ramente a <strong>la</strong> producción y a <strong>la</strong> actividad económica anual, pero su incremento se<br />
valora como muy positivo ya que su insta<strong>la</strong>ción implica <strong>la</strong> reducción <strong>de</strong> <strong>la</strong> contaminación<br />
tras<strong>la</strong>dada al medio. Asimismo, el aumento <strong>de</strong> <strong>la</strong> eficacia <strong>de</strong> los sistemas <strong>de</strong> tratamiento<br />
fin <strong>de</strong> línea ya existentes conlleva una mayor producción <strong>de</strong> residuo por unidad<br />
producida al mismo tiempo que minimiza el impacto en el medio. Por lo tanto, se <strong>de</strong>be<br />
consi<strong>de</strong>rar positivo el aumento <strong>de</strong> <strong>residuos</strong> producidos en los tratamientos <strong>de</strong> fin <strong>de</strong><br />
línea. Del mismo modo, estas circunstancias <strong>de</strong>ben condicionar su aportación al cálculo<br />
<strong>de</strong>l grado <strong>de</strong> <strong>de</strong>sacop<strong>la</strong>miento.<br />
• Los <strong>de</strong>nominados <strong>residuos</strong> históricos, conformados básicamente por tierras<br />
contaminadas, <strong>residuos</strong> <strong>de</strong> amianto y aceites y aparatos con PCB, constituyen un flujo<br />
muy específico cuya pauta <strong>de</strong> generación no respon<strong>de</strong> a criterios <strong>de</strong> <strong>de</strong>sarrollo<br />
económico, sino que <strong>de</strong>pen<strong>de</strong> fundamentalmente <strong>de</strong> <strong>la</strong>s obligaciones <strong>de</strong> gestión<br />
asociadas a cada corriente en concreto. La incorporación al circuito autorizado <strong>de</strong><br />
gestión <strong>de</strong> estas corrientes se valora como muy positiva en <strong>la</strong> medida en que garantiza<br />
un proceso <strong>de</strong> <strong>de</strong>scontaminación gradual <strong>de</strong> los emp<strong>la</strong>zamientos en los que se<br />
encuentran, por lo que <strong>la</strong> aplicación <strong>de</strong> ciertos principios como el <strong>de</strong> prevención carecen<br />
<strong>de</strong> sentido en este caso.<br />
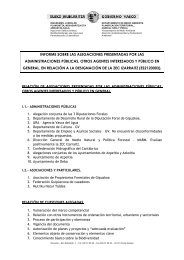
En <strong>2004</strong> <strong>la</strong> <strong>CAPV</strong> ha generado 221.822 Tm <strong>de</strong> <strong>residuos</strong> <strong>peligrosos</strong> asociados a <strong>la</strong> actividad<br />
económica anual (44%), 164.999 Tm <strong>de</strong> <strong>residuos</strong> <strong>peligrosos</strong> proce<strong>de</strong>ntes <strong>de</strong> tratamientos <strong>de</strong> fin <strong>de</strong><br />
línea (32%) y 123.384 Tm <strong>de</strong> <strong>residuos</strong> históricos (24%, fundamentalmente tierras contaminadas),<br />
lo que da i<strong>de</strong>a <strong>de</strong> <strong>la</strong> importancia que en el mo<strong>de</strong>lo vasco <strong>de</strong> generación <strong>de</strong> <strong>residuos</strong> <strong>peligrosos</strong><br />
presentan estas corrientes cuyo incremento se consi<strong>de</strong>ra medioambientalmente beneficioso aún<br />
cuando reducen <strong>la</strong>s posibilida<strong>de</strong>s <strong>de</strong> <strong>de</strong>sacop<strong>la</strong>miento.<br />
24%<br />
44%<br />
32%<br />
RP asociados a producción RP fin <strong>de</strong> línea RP históricos<br />
Figura 2. Desglose <strong>de</strong> <strong>la</strong> producción <strong>de</strong> <strong>residuos</strong> <strong>peligrosos</strong> según tipo genérico <strong>de</strong> residuo.<br />
3.1.2 Análisis excluyendo los <strong>residuos</strong> históricos<br />
La inci<strong>de</strong>ncia <strong>de</strong> los <strong>residuos</strong> históricos en el presente inventario resulta muy significativa, por <strong>la</strong><br />
ya comentada aportación <strong>de</strong> <strong>la</strong>s tierras contaminadas. Los <strong>residuos</strong> <strong>de</strong> amianto (LER 170601 y<br />
170605; 4.657 Tm), los aceites con PCBs (LER 130301; 426 Tm) y los aparatos contaminados por<br />
PCBs (LER 160209; 72 Tm) completan esta situación.<br />
Pág. 7
<strong>Inventario</strong> <strong>de</strong> Residuos Peligrosos <strong>de</strong> <strong>la</strong> <strong>CAPV</strong> – Año <strong>2004</strong><br />
Si se resta <strong>la</strong> influencia <strong>de</strong> estas cuatro fracciones <strong>de</strong> <strong>residuos</strong>, se pue<strong>de</strong> <strong>de</strong>cir que <strong>la</strong> generación<br />
<strong>de</strong> <strong>residuos</strong> <strong>peligrosos</strong> asociada a <strong>la</strong> actividad económica anual <strong>de</strong> <strong>la</strong> <strong>CAPV</strong> en <strong>2004</strong> (fin <strong>de</strong> línea<br />
incluidos) <strong>de</strong>scien<strong>de</strong> a 386.821 Tm.<br />
Tab<strong>la</strong> 2. Residuos <strong>peligrosos</strong> no históricos generados en <strong>la</strong> <strong>CAPV</strong> en <strong>2004</strong> por LER y tipo <strong>de</strong> gestión. Datos en Tm/año.<br />
LER<br />
Elim inación Incineración Recic<strong>la</strong>je<br />
Valor. Energ.<br />
Totales<br />
Tm % Tm % Tm % Tm % Tm %<br />
01: Minas y canteras 7 100% 0 0% 0 0% 0 0% 7 0,001%<br />
02: Producción primaria 0,1 100% 0 0% 0 0% 0 0% 0,1 0,00%<br />
03: Ind. ma<strong>de</strong>ra y papel 6 16,24% 30 83,76% 0 0% 0 0% 36 0,01%<br />
04: Ind. Cuero y textil 0 0% 0 0% 0 0% 0 0% 0 0%<br />
05: Refino petróleo 1.265 18,79% 0 0% 5.466 81,21% 0 0% 6.731 1,32%<br />
06: Ind. Química inorgánica 9.271 98,98% 0 0% 85 0,91% 10 0,11% 9.366 1,84%<br />
07: Ind. Química orgánica 9.533 81,42% 46 0,39% 627 5,36% 1.503 12,83% 11.709 2,30%<br />
08: Pinturas, barnices y tintas 5.403 73,18% 0 0% 1.618 21,91% 363 4,91% 7.384 1,45%<br />
09: Ind. Fotográfica 465 53,47% 0 0% 405 46,53% 0 0% 870 0,17%<br />
10: Ind. Procesos térmicos 68.995 40,32% 0 0% 102.119 59,68% 0 0,00% 171.115 33,54%<br />
11: Tto. y revestimiento metales 40.870 39,21% 0 0% 63.299 60,73% 60 0,06% 104.228 20,43%<br />
12: Ind. mecanizado metales 14.966 82,03% 251 1,37% 2.660 14,58% 368 2,02% 18.244 3,58%<br />
13: Aceites usados 8.965 39,86% 28 0,12% 10.357 46,05% 3.141 13,97% 22.491 4,41%<br />
14: Disolventes usados 254 13,91% 94 5,13% 1.408 77,24% 68 3,71% 1.823 0,36%<br />
15: Envases y trapos 4.915 61,79% 6 0,08% 2.909 36,57% 124 1,56% 7.955 1,56%<br />
16: Otros <strong>residuos</strong> 4.623 45,48% 0,01 0,0001% 4.625 45,50% 916 9,01% 10.163 1,99%<br />
17: Construcción y <strong>de</strong>molición 10 97,79% 0 0% 0,2 2,21% 0 0% 11 0,00%<br />
18: Servicios médicos 229 16,68% 1.144 83,32% 0 0% 0 0% 1.373 0,27%<br />
19: Ind. Tratamiento <strong>residuos</strong> 10.451 97,89% 0 0% 226 2,11% 0 0% 10.677 2,09%<br />
20: Municipales y asimi<strong>la</strong>bles 3 0,11% 0 0% 2.636 99,89% 0 0% 2.639 0,52%<br />
Totales 180.231 46,59% 1.598 0,41% 198.439 51,30% 6.553 1,69% 386.821<br />
3.2 GESTIÓN DE RESIDUOS PELIGROSOS<br />
3.2.1 Análisis consi<strong>de</strong>rando los <strong>residuos</strong> históricos<br />
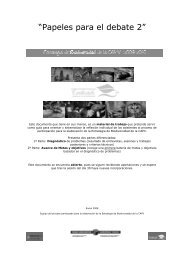
El 40,26% <strong>de</strong> los <strong>residuos</strong> gestionados son valorizados, ya sea mediante recic<strong>la</strong>je (38,98%) o por<br />
valorización energética (1,28%). Sobre el resto se aplican fundamentalmente operaciones <strong>de</strong><br />
eliminación (59,33%), siendo incinerados únicamente el 0,40% <strong>de</strong>l total.<br />
Siete <strong>de</strong> los veinte códigos LER superan el 50% en <strong>la</strong> tasa <strong>de</strong> Valorización:<br />
• LER 05, Residuos petroquímicos: 81,21%<br />
• LER 10, Residuos <strong>de</strong> procesos térmicos: 59,68%<br />
• LER 11, Residuos <strong>de</strong> tratamiento químico <strong>de</strong> superficie: 60,79%<br />
• LER 13, Aceites usados: 58,90%<br />
• LER 14, Disolventes agotados: 80,95%<br />
• LER 16, Residuos sin grupo propio tales como baterías y equipos eléctrico-electrónicos<br />
<strong>de</strong> origen industrial y <strong>residuos</strong> <strong>de</strong> limpieza <strong>de</strong> cisternas: 54,55%<br />
• LER 20, Residuos municipales: 99,89%<br />
La naturaleza <strong>de</strong> ciertas corrientes <strong>de</strong> <strong>residuos</strong> dificulta su valorización:<br />
Pág. 8
<strong>Inventario</strong> <strong>de</strong> Residuos Peligrosos <strong>de</strong> <strong>la</strong> <strong>CAPV</strong> – Año <strong>2004</strong><br />
• Los <strong>residuos</strong> médicos infecciosos (LER 18) suelen ser gestionados mediante<br />
incineración.<br />
• La eliminación es mayoritaria en el sector químico (LER 06 y 07) y en el <strong>de</strong> mecanizado<br />
<strong>de</strong> metal (LER 12), así como en corrientes tales como <strong>la</strong>s tierras contaminadas (incluidas<br />
en LER 17) y los <strong>residuos</strong> <strong>de</strong> <strong>la</strong>s p<strong>la</strong>ntas <strong>de</strong> tratamiento <strong>de</strong> <strong>residuos</strong> (LER 19).<br />
LER<br />
01<br />
02<br />
03<br />
04<br />
05<br />
06<br />
07<br />
08<br />
09<br />
10<br />
11<br />
12<br />
13<br />
14<br />
15<br />
16<br />
17<br />
18<br />
19<br />
20<br />
GLOBAL<br />
0% 25% 50% 75% 100%<br />
Eliminación Incineración Recic<strong>la</strong>je Valor. Energ.<br />
Figura 3. Tipos <strong>de</strong> gestión <strong>de</strong> <strong>residuos</strong> <strong>peligrosos</strong> en <strong>la</strong> <strong>CAPV</strong>, c<strong>la</strong>sificados por LER. En <strong>2004</strong> no se gestionó ningún<br />
<strong>residuos</strong> peligroso correspondiente al LER 04.<br />
3.2.2 Análisis excluyendo los <strong>residuos</strong> históricos<br />
Si se elimina <strong>la</strong> influencia <strong>de</strong> los <strong>de</strong>nominados <strong>residuos</strong> históricos, el porcentaje <strong>de</strong> valorización<br />
ascien<strong>de</strong> hasta el 52,99% (51,30% valorización material; 1,69% valorización energética). Se<br />
camina por tanto hacia el cumplimiento <strong>de</strong>l objetivo recogido en el “P<strong>la</strong>n <strong>de</strong> Gestión <strong>de</strong> Residuos<br />
Peligrosos <strong>de</strong> <strong>la</strong> <strong>CAPV</strong> 2003-2006” <strong>de</strong> alcanzar el 60% en <strong>la</strong> tasa <strong>de</strong> recic<strong>la</strong>je en 2006.<br />
La eliminación (46,59%) y <strong>la</strong> incineración (0,41%) completan <strong>la</strong>s opciones <strong>de</strong> gestión.<br />
3.3 DISTRIBUCIÓN GEOGRÁFICA DE LOS RESIDUOS PELIGROSOS<br />
3.3.1 Análisis consi<strong>de</strong>rando los <strong>residuos</strong> históricos<br />
La generación territorial <strong>de</strong> los <strong>residuos</strong> <strong>peligrosos</strong> correspondiente a <strong>2004</strong> (Bizkaia 64,24%;<br />
Gipuzkoa 21,58%; Araba 14,18%) coinci<strong>de</strong> con <strong>la</strong> distribución <strong>de</strong>mográfica <strong>de</strong> <strong>la</strong> <strong>CAPV</strong> para el<br />
caso <strong>de</strong> Araba, mientras que para los Territorios <strong>de</strong> Bizkaia y Gipuzkoa el reparto <strong>de</strong> los <strong>residuos</strong><br />
<strong>peligrosos</strong> generados se aleja sensiblemente <strong>de</strong>l perfil <strong>de</strong> pob<strong>la</strong>ción (Bizkaia 54%; Gipuzkoa 32%).<br />
Pág. 9
<strong>Inventario</strong> <strong>de</strong> Residuos Peligrosos <strong>de</strong> <strong>la</strong> <strong>CAPV</strong> – Año <strong>2004</strong><br />
En Bizkaia se han generado 117.390 Tm. <strong>de</strong> tierras contaminadas, muy por <strong>de</strong><strong>la</strong>nte <strong>de</strong> <strong>la</strong>s 47.473<br />
Tm <strong>de</strong> polvos <strong>de</strong> acería, segundo residuo más numeroso. En Gipuzkoa, polvos <strong>de</strong> acería (67.572<br />
Tm) y ácidos <strong>de</strong> <strong>de</strong>capado (5.905 Tm) ocupan <strong>la</strong>s primeras posiciones, mientras que en Araba se<br />
invierten estas posiciones (30.287 Tm <strong>de</strong> ácidos <strong>de</strong> <strong>de</strong>capado y 8.390 Tm <strong>de</strong> polvos <strong>de</strong> acería).<br />
Tab<strong>la</strong> 3. Residuos <strong>peligrosos</strong> generados en <strong>la</strong> <strong>CAPV</strong> por LER y Territorio Histórico <strong>de</strong> origen. Datos en Tm/año.<br />
LER<br />
Araba Gipuzkoa Bizkaia<br />
Totales<br />
Tm % Tm % Tm % Tm %<br />
01: Minas y canteras 0 0% 0 0% 7 100% 7 0,001%<br />
02: Producción primaria 0,1 100% 0 0% 0 0% 0,1 0%<br />
03: Ind. ma<strong>de</strong>ra y papel 3 8,58% 30 83,76% 3 7,67% 36 0,01%<br />
04: Ind. Cuero y textil 0 0% 0 0% 0 0% 0 0%<br />
05: Refino petróleo 0 0% 0 0% 6.731 100% 6.731 1,32%<br />
06: Ind. Química inorgánica 327 3,49% 457 4,88% 8.583 91,64% 9.366 1,84%<br />
07: Ind. Química orgánica 3.834 32,74% 962 8,22% 6.914 59,04% 11.709 2,30%<br />
08: Pinturas, barnices y tintas 2.779 37,64% 2.172 29,41% 2.433 32,95% 7.384 1,45%<br />
09: Ind. Fotográfica 102 11,77% 316 36,37% 451 51,86% 870 0,17%<br />
10: Ind. Procesos térmicos 11.956 6,99% 69.687 40,73% 89.471 52,29% 171.115 33,54%<br />
11: Tto. y revestimiento metales 35.239 33,81% 14.676 14,08% 54.314 52,11% 104.228 20,43%<br />
12: Ind. mecanizado metales 3.375 18,50% 6.197 33,97% 8.672 47,53% 18.244 3,58%<br />
13: Aceites usados 4.423 19,30% 7.288 31,80% 11.206 48,90% 22.917 4,49%<br />
14: Disolventes usados 434 23,83% 652 35,79% 736 40,39% 1.823 0,36%<br />
15: Envases y trapos 2.547 32,02% 2.163 27,19% 3.245 40,80% 7.955 1,56%<br />
16: Otros <strong>residuos</strong> 2.091 20,43% 2.157 21,07% 5.988 58,50% 10.236 2,01%<br />
17: Construcción y <strong>de</strong>molición 1.098 0,89% 1.836 1,49% 119.962 97,61% 122.895 24,09%<br />
18: Servicios médicos 182 13,24% 414 30,17% 777 56,59% 1.373 0,27%<br />
19: Ind. Tratamiento <strong>residuos</strong> 3.720 34,84% 436 4,09% 6.521 61,08% 10.677 2,09%<br />
20: Municipales y asimi<strong>la</strong>bles 247 9,36% 650 24,62% 1.742 66,02% 2.639 0,52%<br />
Totales 72.357 14,18% 110.093 21,58% 327.755 64,24% 510.205<br />
01<br />
02<br />
03<br />
04<br />
05<br />
06<br />
07<br />
08<br />
09<br />
10<br />
11<br />
12<br />
13<br />
14<br />
15<br />
16<br />
17<br />
18<br />
19<br />
20<br />
GLOBAL<br />
LER<br />
0% 20% 40% 60% 80% 100%<br />
Araba Gipuzkoa Bizkaia<br />
Figura 4. Residuos <strong>peligrosos</strong> generados por Territorio Histórico y LER.<br />
Pág. 10
<strong>Inventario</strong> <strong>de</strong> Residuos Peligrosos <strong>de</strong> <strong>la</strong> <strong>CAPV</strong> – Año <strong>2004</strong><br />
140.000<br />
120.000<br />
100.000<br />
Tm/año<br />
80.000<br />
60.000<br />
40.000<br />
20.000<br />
0<br />
01 02 03 04 05 06 07 08 09 10 11 12 13 14 15 16 17 18 19 20<br />
LER<br />
Araba Gipuzkoa Bizkaia<br />
Figura 5. Residuos <strong>peligrosos</strong> generados por LER y Territorio Histórico <strong>de</strong> origen.<br />
Araba es el único Territorio Histórico que supera <strong>la</strong> media <strong>de</strong> valorización en <strong>la</strong> <strong>CAPV</strong>, al aplicar<br />
este tratamiento a un 50,99% <strong>de</strong> los <strong>residuos</strong> <strong>peligrosos</strong> que genera, frente al 40,56% <strong>de</strong> Bizkaia y<br />
el 32,33% <strong>de</strong> Gipuzkoa.<br />
El confinamiento <strong>de</strong> <strong>la</strong>s tierras contaminadas en <strong>de</strong>pósitos <strong>de</strong> seguridad (ubicados fuera <strong>de</strong> <strong>la</strong><br />
<strong>CAPV</strong>) explica el comportamiento <strong>de</strong>l Territorio Histórico <strong>de</strong> Bizkaia, mientras que el bajo<br />
porcentaje alcanzado en Gipuzkoa se <strong>de</strong>be a que buena parte <strong>de</strong> los polvos <strong>de</strong> acería generados<br />
en <strong>2004</strong> era aún eliminados mediante estabilización-solidificación.<br />
0% 20% 40% 60% 80% 100%<br />
Araba<br />
Gipuzkoa<br />
Bizkaia<br />
Totales<br />
35.059<br />
73.943<br />
193.723<br />
302.724<br />
400<br />
2.054 1.094<br />
560<br />
34.387<br />
34.053<br />
130.433<br />
198.873<br />
6.553 2.505 1.537 2.511<br />
Eliminación Incineración Recic<strong>la</strong>je Valor. Energ.<br />
Figura 6. Tipos <strong>de</strong> gestión por Territorio Histórico. Datos en Tm/año.<br />
3.3.2 Análisis excluyendo los <strong>residuos</strong> históricos<br />
Si se obvia <strong>la</strong> influencia <strong>de</strong> los <strong>residuos</strong> históricos, se comprueba que Bizkaia se acerca a su<br />
porcentaje <strong>de</strong>mográfico (53,65% frente al 54% pob<strong>la</strong>cional), mientras que Araba acentúa su<br />
diferencia (18,39% frente al 14% <strong>de</strong>mográfico) en <strong>de</strong>trimento <strong>de</strong> Gipuzkoa (27,96% frente al 32%<br />
pob<strong>la</strong>cional).<br />
Pág. 11
<strong>Inventario</strong> <strong>de</strong> Residuos Peligrosos <strong>de</strong> <strong>la</strong> <strong>CAPV</strong> – Año <strong>2004</strong><br />
Tab<strong>la</strong> 4. Residuos <strong>peligrosos</strong> no históricos generados en <strong>la</strong> <strong>CAPV</strong> por LER y Territorio Histórico <strong>de</strong> origen. Datos en<br />
Tm/año.<br />
LER<br />
Araba Gipuzkoa Bizkaia<br />
Tm % Tm % Tm % Tm %<br />
01: Minas y canteras 0 0% 0 0% 7 100% 7 0,001%<br />
02: Producción primaria 0,1 100% 0 0% 0 0% 0,1 0,00%<br />
03: Ind. ma<strong>de</strong>ra y papel 3 8,58% 30 83,76% 3 7,67% 36 0,01%<br />
04: Ind. Cuero y textil 0 0% 0 0% 0 0% 0 0%<br />
05: Refino petróleo 0 0% 0 0% 6.731 100% 6.731 1,32%<br />
06: Ind. Química inorgánica 327 3,49% 457 4,88% 8.583 91,64% 9.366 1,84%<br />
07: Ind. Química orgánica 3.834 32,74% 962 8,22% 6.914 59,04% 11.709 2,30%<br />
08: Pinturas, barnices y tintas 2.779 37,64% 2.172 29,41% 2.433 32,95% 7.384 1,45%<br />
09: Ind. Fotográfica 102 11,77% 316 36,37% 451 51,86% 870 0,17%<br />
10: Ind. Procesos térmicos 11.956 6,99% 69.687 40,73% 89.471 52,29% 171.115 33,54%<br />
11: Tto. y revestimiento metales 35.239 33,81% 14.676 14,08% 54.314 52,11% 104.228 20,43%<br />
12: Ind. mecanizado metales 3.375 18,50% 6.197 33,97% 8.672 47,53% 18.244 3,58%<br />
13: Aceites usados 4.293 19,09% 7.243 32,20% 10.955 48,71% 22.491 4,41%<br />
14: Disolventes usados 434 23,83% 652 35,79% 736 40,39% 1.823 0,36%<br />
15: Envases y trapos 2.547 32,02% 2.163 27,19% 3.245 40,80% 7.955 1,56%<br />
16: Otros <strong>residuos</strong> 2.085 20,51% 2.110 20,76% 5.969 58,73% 10.163 1,99%<br />
17: Construcción y <strong>de</strong>molición 0 0% 4 40,20% 6 59,80% 11 0,00%<br />
18: Servicios médicos 182 13,24% 414 30,17% 777 56,59% 1.373 0,27%<br />
19: Ind. Tratamiento <strong>residuos</strong> 3.720 34,84% 436 4,09% 6.521 61,08% 10.677 2,09%<br />
20: Municipales y asimi<strong>la</strong>bles 247 9,36% 650 24,62% 1.742 66,02% 2.639 0,52%<br />
Totales 71.123 18,39% 108.169 27,96% 207.529 53,65% 386.821<br />
Totales<br />
3.4 DESTINO DE LA GESTIÓN<br />
3.4.1 Análisis consi<strong>de</strong>rando los <strong>residuos</strong> históricos<br />
El 51,69% <strong>de</strong> los <strong>residuos</strong> <strong>peligrosos</strong> generados durante <strong>2004</strong> ha sido gestionado por empresas<br />
autorizadas ubicadas en <strong>la</strong> <strong>CAPV</strong>.<br />
Los <strong>residuos</strong> <strong>de</strong> <strong>la</strong>s industrias petroquímica (LER 05; 96,22%), química orgánica (LER 07;<br />
72,19%), <strong>de</strong> procesos térmicos (LER 10; 73,24%), <strong>de</strong> tratamientos superficiales (LER 11; 65,63%)<br />
y <strong>de</strong> gestión <strong>de</strong> corrientes residuales (LER 19; 65,93%) superan o igua<strong>la</strong>n este porcentaje <strong>de</strong><br />
tratamiento en <strong>la</strong> <strong>CAPV</strong>.<br />
Dentro <strong>de</strong> los procesos industriales <strong>de</strong> relevancia, únicamente los <strong>residuos</strong> <strong>de</strong> <strong>la</strong> industria química<br />
inorgánica (LER 06; 50,72%) y <strong>de</strong>l sector <strong>de</strong> mecanizado (LER 12; 50,60%) registran valores <strong>de</strong><br />
tratamiento en <strong>la</strong> <strong>CAPV</strong> ligeramente inferiores a <strong>la</strong> media.<br />
Respecto a los <strong>residuos</strong> <strong>de</strong> producción atomizada, los aceites (LER 13; 66,50%) y los envases y<br />
absorbentes (LER 15; 54,36%) superan <strong>la</strong> media <strong>de</strong> gestión en <strong>la</strong> <strong>CAPV</strong>, mientras que otras<br />
corrientes tales como pinturas (LER 08; 41,14%), disolventes (LER 14; 36,83%) o <strong>residuos</strong><br />
sanitarios (LER 18; 25,64%) no alcanzan el valor medio <strong>de</strong> <strong>la</strong> Comunidad Autónoma.<br />
Pág. 12
<strong>Inventario</strong> <strong>de</strong> Residuos Peligrosos <strong>de</strong> <strong>la</strong> <strong>CAPV</strong> – Año <strong>2004</strong><br />
Tab<strong>la</strong> 5. Residuos <strong>peligrosos</strong> generados en <strong>la</strong> <strong>CAPV</strong> en <strong>2004</strong> por LER y localización <strong>de</strong>l gestor (<strong>de</strong>ntro o fuera <strong>de</strong> <strong>la</strong><br />
<strong>CAPV</strong>). Datos en Tm/año.<br />
LER<br />
Gestor C.A.P.V. Gestor no C.A.P.V. Totales<br />
Tm % Tm % Tm %<br />
01: Minas y canteras 7 100% 0 0% 7 0,001%<br />
02: Producción primaria 0,1 100% 0 0% 0,1 0%<br />
03: Ind. ma<strong>de</strong>ra y papel 6 16,24% 30 83,76% 36 0,01%<br />
04: Ind. Cuero y textil 0 0% 0 0% 0 0%<br />
05: Refino petróleo 6.476 96,22% 254 3,78% 6.731 1,32%<br />
06: Ind. Química inorgánica 4.750 50,72% 4.616 49,28% 9.366 1,84%<br />
07: Ind. Química orgánica 8.453 72,19% 3.257 27,81% 11.709 2,30%<br />
08: Pinturas, barnices y tintas 3.037 41,14% 4.346 58,86% 7.384 1,45%<br />
09: Ind. Fotográfica 434 49,94% 435 50,06% 870 0,17%<br />
10: Ind. Procesos térmicos 125.319 73,24% 45.796 26,76% 171.115 33,54%<br />
11: Tto. y revestimiento metales 68.403 65,63% 35.825 34,37% 104.228 20,43%<br />
12: Ind. mecanizado metales 9.233 50,60% 9.012 49,40% 18.244 3,58%<br />
13: Aceites usados 15.241 66,50% 7.677 33,50% 22.917 4,49%<br />
14: Disolventes usados 671 36,83% 1.152 63,17% 1.823 0,36%<br />
15: Envases y trapos 4.325 54,36% 3.630 45,64% 7.955 1,56%<br />
16: Otros <strong>residuos</strong> 4.628 45,21% 5.608 54,79% 10.236 2,01%<br />
17: Construcción y <strong>de</strong>molición 4.568 3,72% 118.327 96,28% 122.895 24,09%<br />
18: Servicios médicos 352 25,64% 1.021 74,36% 1.373 0,27%<br />
19: Ind. Tratamiento <strong>residuos</strong> 7.039 65,93% 3.638 34,07% 10.677 2,09%<br />
20: Municipales y asimi<strong>la</strong>bles 795 30,14% 1.844 69,86% 2.639 0,52%<br />
Totales 263.737 51,69% 246.467 48,31% 510.205<br />
01<br />
02<br />
03<br />
04<br />
05<br />
06<br />
07<br />
08<br />
09<br />
10<br />
11<br />
12<br />
13<br />
14<br />
15<br />
16<br />
17<br />
18<br />
19<br />
20<br />
GLOBAL<br />
LER<br />
0% 20% 40% 60% 80% 100%<br />
Gestor C.A.P.V.<br />
Gestor no C.A.P.V.<br />
Figura 7. Residuos <strong>peligrosos</strong> generados en <strong>la</strong> <strong>CAPV</strong> por LER y origen <strong>de</strong>l gestor.<br />
Los gestores vascos consiguen tratar un 69,21% <strong>de</strong>l total <strong>de</strong> <strong>residuos</strong> que son valorizados<br />
materialmente. En materia <strong>de</strong> eliminación, incineración o valorización energética, son los centros<br />
<strong>de</strong> tratamiento ubicados fuera <strong>de</strong> <strong>la</strong> <strong>CAPV</strong> los que gestionan una mayor cantidad.<br />
Pág. 13
<strong>Inventario</strong> <strong>de</strong> Residuos Peligrosos <strong>de</strong> <strong>la</strong> <strong>CAPV</strong> – Año <strong>2004</strong><br />
0% 20% 40% 60% 80% 100%<br />
Eliminación<br />
124.156<br />
178.568<br />
Incineración<br />
352<br />
1.702<br />
Recic<strong>la</strong>je<br />
137.645<br />
61.229<br />
Valor. Energ.<br />
1.584<br />
4.969<br />
Totales<br />
263.737<br />
246.467<br />
Gestor C.A.P.V.<br />
Gestor no C.A.P.V.<br />
Figura 8. Tipos <strong>de</strong> gestión <strong>de</strong>sglosados por origen <strong>de</strong>l gestor. Datos en Tm/año.<br />
El porcentaje <strong>de</strong> tratamiento <strong>de</strong>ntro <strong>de</strong> <strong>la</strong> Comunidad Autónoma <strong>de</strong> los <strong>residuos</strong> generados en<br />
Bizkaia (39,06%) es inferior a <strong>la</strong> media (51,69%), mientras que Araba (62,36%) y Gipuzkoa<br />
(82,29%) superan con suficiencia dicha referencia.<br />
En Bizkaia, el importante volumen <strong>de</strong> tierras contaminadas es gestionado mediante <strong>de</strong>pósito <strong>de</strong><br />
seguridad ubicado fuera <strong>de</strong> <strong>la</strong> <strong>CAPV</strong>, mientras que <strong>la</strong> gran cantidad <strong>de</strong> escorias salinas <strong>de</strong><br />
segunda fusión <strong>de</strong> aluminio son enviadas a un gestor único en su género en todo el territorio <strong>de</strong>l<br />
Estado español.<br />
Por su parte, Gipuzkoa logra gestionar con empresas vascas el 82,29% <strong>de</strong> los <strong>residuos</strong> que<br />
genera por <strong>la</strong> influencia <strong>de</strong> los polvos <strong>de</strong> acería.<br />
0% 20% 40% 60% 80% 100%<br />
Araba<br />
45.122<br />
27.235<br />
Gipuzkoa<br />
90.593<br />
19.499<br />
Bizkaia<br />
128.021<br />
199.733<br />
Totales<br />
263.737<br />
246.467<br />
Gestor C.A.P.V.<br />
Gestor no C.A.P.V.<br />
Figura 9. Generación en cada Territorio Histórico en función <strong>de</strong> <strong>la</strong> localización <strong>de</strong>l gestor. Datos en Tm/año.<br />
Pág. 14
<strong>Inventario</strong> <strong>de</strong> Residuos Peligrosos <strong>de</strong> <strong>la</strong> <strong>CAPV</strong> – Año <strong>2004</strong><br />
3.4.2 Análisis excluyendo los <strong>residuos</strong> históricos<br />
Si se elimina <strong>la</strong> influencia <strong>de</strong> los <strong>residuos</strong> históricos, el porcentaje <strong>de</strong> gestión en <strong>la</strong> <strong>CAPV</strong> <strong>de</strong> los<br />
<strong>residuos</strong> <strong>peligrosos</strong> generados ascien<strong>de</strong> hasta el 67,00%.<br />
Territorialmente, <strong>la</strong> única variación se observa en Bizkaia, cuya tasa <strong>de</strong> gestión en <strong>la</strong> <strong>CAPV</strong><br />
ascien<strong>de</strong> hasta el 60,53% al eliminar <strong>la</strong> influencia <strong>de</strong> <strong>la</strong>s tierras contaminadas.<br />
Tab<strong>la</strong> 6. Residuos <strong>peligrosos</strong> no históricos generados en <strong>la</strong> <strong>CAPV</strong> en <strong>2004</strong> por LER y localización <strong>de</strong>l gestor (<strong>de</strong>ntro o<br />
fuera <strong>de</strong> <strong>la</strong> <strong>CAPV</strong>). Datos en Tm/año.<br />
LER<br />
Gestor C.A.P.V. Gestor no C.A.P.V. Totales<br />
Tm % Tm % Tm %<br />
01: Minas y canteras 7 100% 0 0% 7 0,001%<br />
02: Producción primaria 0,1 100% 0 0% 0,1 0,00%<br />
03: Ind. ma<strong>de</strong>ra y papel 6 16,24% 30 83,76% 36 0,01%<br />
04: Ind. Cuero y textil 0 0% 0 0% 0 0%<br />
05: Refino petróleo 6.476 96,22% 254 3,78% 6.731 1,32%<br />
06: Ind. Química inorgánica 4.750 50,72% 4.616 49,28% 9.366 1,84%<br />
07: Ind. Química orgánica 8.453 72,19% 3.257 27,81% 11.709 2,30%<br />
08: Pinturas, barnices y tintas 3.037 41,14% 4.346 58,86% 7.384 1,45%<br />
09: Ind. Fotográfica 434 49,94% 435 50,06% 870 0,17%<br />
10: Ind. Procesos térmicos 125.319 73,24% 45.796 26,76% 171.115 33,54%<br />
11: Tto. y revestimiento metales 68.403 65,63% 35.825 34,37% 104.228 20,43%<br />
12: Ind. mecanizado metales 9.233 50,60% 9.012 49,40% 18.244 3,58%<br />
13: Aceites usados 15.241 67,76% 7.250 32,24% 22.491 4,41%<br />
14: Disolventes usados 671 36,83% 1.152 63,17% 1.823 0,36%<br />
15: Envases y trapos 4.325 54,36% 3.630 45,64% 7.955 1,56%<br />
16: Otros <strong>residuos</strong> 4.628 45,53% 5.536 54,47% 10.163 1,99%<br />
17: Construcción y <strong>de</strong>molición 11 100,00% 0 0% 11 0,00%<br />
18: Servicios médicos 352 25,64% 1.021 74,36% 1.373 0,27%<br />
19: Ind. Tratamiento <strong>residuos</strong> 7.039 65,93% 3.638 34,07% 10.677 2,09%<br />
20: Municipales y asimi<strong>la</strong>bles 795 30,14% 1.844 69,86% 2.639 0,52%<br />
Totales 259.180 67,00% 127.641 33,00% 386.821<br />
3.5 IMPORTACIONES<br />
Se analiza en este apartado el flujo <strong>de</strong> <strong>residuos</strong> que entra en <strong>la</strong> <strong>CAPV</strong> proce<strong>de</strong>nte <strong>de</strong> otras<br />
Comunida<strong>de</strong>s Autónomas o <strong>de</strong> otros Estados, y que no es contabilizado en el presente <strong>Inventario</strong><br />
al no presentar origen vasco.<br />
Durante <strong>2004</strong>, <strong>la</strong> <strong>CAPV</strong> ha recibido un total <strong>de</strong> 122.597,88 Tm., proce<strong>de</strong>ntes <strong>de</strong> otras<br />
Comunida<strong>de</strong>s Autónomas (85.886,38 Tm.; 70,06%) y otros Estados (36.711,50 Tm; 29,94%).<br />
Se rompe ligeramente <strong>la</strong> ten<strong>de</strong>ncia a <strong>la</strong> baja en <strong>la</strong> importación <strong>de</strong> <strong>residuos</strong> <strong>peligrosos</strong> (107.984,41<br />
Tm. en 2002; 102.603,81 Tm en 2003), aunque sin alcanzar los valores <strong>de</strong> 2001 (168.389,67 Tm.).<br />
El incremento registrado se produce tanto en <strong>la</strong>s importaciones proce<strong>de</strong>ntes <strong>de</strong> otras<br />
Comunida<strong>de</strong>s Autónomas como <strong>de</strong> otros Estados.<br />
Pág. 15
<strong>Inventario</strong> <strong>de</strong> Residuos Peligrosos <strong>de</strong> <strong>la</strong> <strong>CAPV</strong> – Año <strong>2004</strong><br />
3.5.1 Importaciones proce<strong>de</strong>ntes <strong>de</strong> otras Comunida<strong>de</strong>s Autónomas<br />
Durante <strong>2004</strong>, <strong>la</strong> Comunidad Autónoma <strong>de</strong>l País Vasco ha importado 85.886,38 Tm <strong>de</strong> <strong>residuos</strong><br />
<strong>peligrosos</strong> proce<strong>de</strong>ntes <strong>de</strong> otras Comunida<strong>de</strong>s Autónomas:<br />
• Aumenta <strong>la</strong> importación <strong>de</strong>s<strong>de</strong> tierras cata<strong>la</strong>nas, que se refuerza como flujo mayoritario<br />
(26.458,67 Tm; 30,81%), no tanto por los polvos <strong>de</strong> acería, que se mantienen en niveles<br />
<strong>de</strong> 2003, sino por los ácidos <strong>de</strong> tratamientos <strong>de</strong> superficies <strong>de</strong>stinados a un eliminador<br />
vasco.<br />
• Navarra se mantiene en segundo lugar, al aportar 14.989,10 Tm. (17,45%), siendo los<br />
ácidos <strong>de</strong> <strong>de</strong>capado <strong>la</strong> corriente mayoritaria.<br />
• Aragón se convierte en <strong>la</strong> tercera Comunidad Autónoma que más <strong>residuos</strong> <strong>peligrosos</strong><br />
envía a <strong>la</strong> <strong>CAPV</strong> (9.442,02 Tm; 10,99%), al aumentar a 7891,72 Tm. los polvos <strong>de</strong><br />
acería que remite para su valorización.<br />
30.000<br />
Tm/año importadas <strong>de</strong> CCAA<br />
25.000<br />
20.000<br />
15.000<br />
10.000<br />
5.000<br />
0<br />
AN AR AS CL CM CN CT EU EX GA IC LR MD MU NA PV<br />
02 04 06 07 08 09 10 11 12 13 14 15 16 17 18 19 20<br />
Figura 10. Importaciones <strong>de</strong> <strong>residuos</strong> <strong>peligrosos</strong> en <strong>2004</strong>, <strong>de</strong>sglosados por Comunidad Autónoma <strong>de</strong> origen y LER.<br />
AN=Andalucía; AR=Aragón; AS=Asturias; CL=Castil<strong>la</strong> y León; CM=Castil<strong>la</strong> La Mancha; CN=Cantabria; CT=Cataluña;<br />
EX=Extremadura; GA=Galicia; IB=Is<strong>la</strong>s Baleares; IC=Is<strong>la</strong>s Canarias; LR=La Rioja; MD=Madrid; MU= Murcia;<br />
NA=Navarra; PV=País Valenciano.<br />
Aumenta el porcentaje <strong>de</strong> <strong>residuos</strong> <strong>peligrosos</strong> <strong>de</strong> origen estatal recepcionado por el Territorio<br />
Histórico <strong>de</strong> Gipuzkoa (5,85% en 2003; 10,71% en <strong>2004</strong>), en <strong>de</strong>trimento <strong>de</strong> Bizkaia (78,32% en<br />
2003; 73,49% en <strong>2004</strong>), manteniéndose Araba en torno al 15%.<br />
Pág. 16
<strong>Inventario</strong> <strong>de</strong> Residuos Peligrosos <strong>de</strong> <strong>la</strong> <strong>CAPV</strong> – Año <strong>2004</strong><br />
Tab<strong>la</strong> 7. Importaciones <strong>de</strong> <strong>residuos</strong> <strong>peligrosos</strong> en <strong>2004</strong> proce<strong>de</strong>ntes <strong>de</strong> otras CC.AA.<br />
LER Araba Gipuzkoa Bizkaia Total %<br />
01: Minas y canteras 0,00 0,00 0,00 0,00 0%<br />
02: Producción primaria 0,00 0,00 83,18 83,18 0,10%<br />
03: Ind. ma<strong>de</strong>ra y papel 0,00 0,00 0,00 0,00 0%<br />
04: Ind. Cuero y textil 0,20 0,00 11,22 11,42 0,01%<br />
05: Refino petróleo 0,00 0,00 0,00 0,00 0%<br />
06: Ind. Química inorgánica 54,41 3,00 290,02 347,43 0,40%<br />
07: Ind. Química orgánica 2.972,43 0,00 958,36 3.930,80 4,58%<br />
08: Pinturas, barnices y tintas 954,02 15,45 854,94 1.824,41 2,12%<br />
09: Ind. Fotográfica 54,48 444,76 132,11 631,35 0,74%<br />
10: Ind. Procesos térmicos 838,96 172,48 39.536,83 40.548,27 47,21%<br />
11: Tto. y revestimiento metales 5.259,75 4.571,53 7.792,99 17.624,26 20,52%<br />
12: Ind. mecanizado metales 172,38 0,00 1.455,87 1.628,25 1,90%<br />
13: Aceites usados 531,89 1,28 4.733,55 5.266,73 6,13%<br />
14: Disolventes usados 241,91 0,00 397,44 639,35 0,74%<br />
15: Envases y trapos 1.333,37 31,54 3.747,17 5.112,07 5,95%<br />
16: Otros <strong>residuos</strong> 935,27 947,25 2.084,67 3.967,19 4,62%<br />
17: Construcción y <strong>de</strong>molición 139,70 0,00 327,82 467,52 0,54%<br />
18: Servicios médicos 66,58 1.356,88 0,67 1.424,13 1,66%<br />
19: Ind. Tratamiento <strong>residuos</strong> 1,70 1.650,40 503,72 2.155,81 2,51%<br />
20: Municipales y asimi<strong>la</strong>bles 16,62 0,00 207,59 224,21 0,26%<br />
Total 13.573,67 9.194,57 63.118,14 85.886,38 100,00%<br />
% 15,80% 10,71% 73,49% 100,00%<br />
Los <strong>residuos</strong> <strong>peligrosos</strong> proce<strong>de</strong>ntes <strong>de</strong> otras Comunida<strong>de</strong>s Autónomas son importados<br />
mayoritariamente para su valorización en <strong>la</strong> <strong>CAPV</strong> (71,72%).<br />
30.000<br />
Tm/año importadas <strong>de</strong> CCAA<br />
25.000<br />
20.000<br />
15.000<br />
10.000<br />
5.000<br />
0<br />
AN AR AS CL CM CN CT EU EX GA IC LR MD MU NA PV<br />
Eliminación Incineración Recic<strong>la</strong>je Val. energ.<br />
Figura 11. Importaciones <strong>de</strong> <strong>residuos</strong> <strong>peligrosos</strong> en <strong>2004</strong>, <strong>de</strong>sglosados por Comunidad Autónoma <strong>de</strong> origen y tipo <strong>de</strong><br />
tratamiento. AN=Andalucía; AR=Aragón; AS=Asturias; CL=Castil<strong>la</strong> y León; CM=Castil<strong>la</strong> La Mancha; CN=Cantabria;<br />
CT=Cataluña; EX=Extremadura; GA=Galicia; IB=Is<strong>la</strong>s Baleares; IC=Is<strong>la</strong>s Canarias; LR=La Rioja; MD=Madrid; MU=<br />
Murcia; NA=Navarra; PV=País Valenciano.<br />
3.5.2 Importaciones proce<strong>de</strong>ntes <strong>de</strong> otros Estados<br />
En <strong>2004</strong> se importaron 36.711,50 Tm <strong>de</strong> <strong>residuos</strong> <strong>peligrosos</strong> proce<strong>de</strong>ntes <strong>de</strong> otros Estados, un<br />
33,06% más que en 2003, siendo significativo el incremento registrado en <strong>la</strong> importación <strong>de</strong><br />
<strong>residuos</strong> <strong>de</strong> cobre y filtros <strong>de</strong> aceite, para su valorización en una empresa <strong>de</strong> Bizkaia y otra <strong>de</strong><br />
Gipuzkoa, respectivamente.<br />
Pág. 17
<strong>Inventario</strong> <strong>de</strong> Residuos Peligrosos <strong>de</strong> <strong>la</strong> <strong>CAPV</strong> – Año <strong>2004</strong><br />
Se mantiene el peso <strong>de</strong> los <strong>residuos</strong> <strong>de</strong> producción y transformación <strong>de</strong> metales sobre el total<br />
importado (97,02%). El resto correspon<strong>de</strong> prácticamente a <strong>residuos</strong> recepcionados por Centros <strong>de</strong><br />
Transferencia vascos <strong>de</strong>s<strong>de</strong> países como Portugal para su envío a otros Estados europeos.<br />
Francia se mantiene como principal proveedor, con 16.817 Tm. en <strong>2004</strong>.<br />
Tab<strong>la</strong> 8. Importaciones <strong>de</strong> <strong>residuos</strong> <strong>peligrosos</strong> en <strong>2004</strong> proce<strong>de</strong>ntes <strong>de</strong> otros Estados.<br />
LER Nombre <strong>de</strong> producto Origen Tratamiento Tm %<br />
080501 Isocianatos y ureas PT TRANSFERENCIA 36,39 0,10%<br />
100207 Polvos <strong>de</strong> acería FR RECICLAJE 15.947,93 43,44%<br />
100321 Polvos <strong>de</strong> molienda <strong>de</strong> escoria <strong>de</strong> aluminio IT RECICLAJE 341,56 0,93%<br />
100604 Finos <strong>de</strong> <strong>la</strong>tón IT RECICLAJE 2.465,33 6,72%<br />
100699 Residuos <strong>de</strong> cobre BE RECICLAJE 2.806,02 7,64%<br />
CH RECICLA JE 23,42 0,06%<br />
DE RECICLA JE 2.514,97 6,85%<br />
GB RECICLA JE 717,68 1,95%<br />
IT RECICLA JE 3.155,64 8,60%<br />
NO RECICLA JE 2.140,91 5,83%<br />
PT RECICLA JE 478,65 1,30%<br />
US RECICLA JE 3.553,57 9,68%<br />
130301 PCB líquido CL TRANSFERENCIA 35,50 0,10%<br />
140603 Disolventes no halogenados PT RECICLAJE 22,73 0,06%<br />
160107 Filtros <strong>de</strong> aceite usados FR RECICLAJE 673,40 1,83%<br />
160209 Transformadores contaminados con PCB's CL TRANSFERENCIA 78,05 0,21%<br />
160215 Tubos <strong>de</strong> rayos catódicos CH RECICLAJE 1.276,80 3,48%<br />
FR RECICLA JE 195,28 0,53%<br />
160504 Aerosoles, halones y freones a presión PT TRANSFERENCIA 18,66 0,05%<br />
170601 Materiales <strong>de</strong> ais<strong>la</strong>miento contaminados con PT TRANSFERENCIA 0,40 0,001%<br />
180103 Residuos sanitarios PT TRANSFERENCIA 228,62 0,62%<br />
TOTAL 36.711,50 100,00%<br />
20.000<br />
15.000<br />
Tm/año<br />
10.000<br />
5.000<br />
0<br />
BE CH CL DE FR GB IT NO PT US<br />
08 10 14 16 13 17 18<br />
Figura 12. Importaciones <strong>de</strong> <strong>residuos</strong> <strong>peligrosos</strong> en <strong>2004</strong>, <strong>de</strong>sglosados por País <strong>de</strong> origen y LER.<br />
BE=Bélgica; CH=Suiza; CL=Chile; DE=Alemania; FR=Francia; GB=Gran Bretaña; IT=Italia; NO=Noruega; PT=Portugal;<br />
US=Estados Unidos.<br />
Pág. 18
<strong>Inventario</strong> <strong>de</strong> Residuos Peligrosos <strong>de</strong> <strong>la</strong> <strong>CAPV</strong> – Año <strong>2004</strong><br />
3.6 EXPORTACIONES<br />
Se mantiene el alto número <strong>de</strong> gestores autorizados que actúan en calidad <strong>de</strong> Centros <strong>de</strong><br />
Transferencia, por lo que resulta complicado <strong>de</strong>terminar en algunos casos el <strong>de</strong>stino geográfico<br />
final <strong>de</strong> los <strong>residuos</strong> generados.<br />
Por lo tanto, a continuación se analizan exclusivamente los envíos directos a gestores <strong>de</strong> otras<br />
Comunida<strong>de</strong>s Autónomas, sin intermediación <strong>de</strong> los Centros <strong>de</strong> Transferencia vascos.<br />
3.6.1 Exportaciones a otras Comunida<strong>de</strong>s Autónomas<br />
Durante <strong>2004</strong> han sido entregadas 235.203,22 Tm. <strong>de</strong> <strong>residuos</strong> <strong>peligrosos</strong> a gestores ubicados en<br />
otras Comunida<strong>de</strong>s Autónomas <strong>de</strong> forma directa, sin intermediarios. A esto hay que sumar una<br />
parte <strong>de</strong> <strong>la</strong>s 54.598,78 Tm. que se entregaron inicialmente a Centros <strong>de</strong> Transferencia vascos<br />
pero que pue<strong>de</strong>n acabar en manos <strong>de</strong> gestores finales <strong>de</strong> <strong>la</strong> <strong>CAPV</strong>, <strong>de</strong> otras Comunida<strong>de</strong>s o <strong>de</strong><br />
otros Estados.<br />
Si se analiza el flujo <strong>de</strong> entregas directas a gestores ubicados en otras Comunida<strong>de</strong>s Autónomas,<br />
se observa que:<br />
• El flujo mayoritario durante <strong>2004</strong> tuvo como <strong>de</strong>stino Castil<strong>la</strong> y León (70.449 Tm),<br />
comunidad que aplica casi por igual tratamientos <strong>de</strong> recic<strong>la</strong>je material y <strong>de</strong> eliminación<br />
sobre los <strong>residuos</strong> que recibe <strong>de</strong> <strong>la</strong> <strong>CAPV</strong>.<br />
• Galicia (43.468 Tm), Andalucía (42.629 Tm) y Cantabria (38.048 Tm) se encuentran<br />
parejas como segunda opción, aplicando todas el<strong>la</strong>s <strong>de</strong> forma mayoritaria tratamientos<br />
<strong>de</strong> eliminación.<br />
El efecto <strong>de</strong> <strong>la</strong>s tierras contaminadas se <strong>de</strong>ja sentir también en el reparto porcentual <strong>de</strong> los tipos<br />
<strong>de</strong> tratamiento aplicados. Así, el 72,71% <strong>de</strong> los <strong>residuos</strong> tratados directamente por gestores <strong>de</strong><br />
otras Comunida<strong>de</strong>s Autónomas reciben tratamientos <strong>de</strong> eliminación, frente al 56,18% <strong>de</strong> 2003.<br />
Los <strong>residuos</strong> <strong>de</strong> <strong>la</strong> producción y transformación <strong>de</strong> metales continúan siendo los más numerosos<br />
<strong>de</strong> entre los asociados al crecimiento económico anual (49.201 Tm <strong>de</strong>l LER 10 y 35.684 Tm. <strong>de</strong>l<br />
LER 11).<br />
De los <strong>residuos</strong> <strong>peligrosos</strong> remitidos <strong>de</strong>s<strong>de</strong> <strong>la</strong> <strong>CAPV</strong> a otras Comunida<strong>de</strong>s Autónomas para su<br />
gestión, Gipuzkoa envía el 7,52%, Araba el 9,96% y Bizkaia el 82,53 %. El valor <strong>de</strong> este último<br />
Territorio Histórico queda condicionado tanto por <strong>la</strong> gran cantidad <strong>de</strong> tierras contaminadas que<br />
precisan <strong>de</strong>pósitos <strong>de</strong> seguridad como por <strong>la</strong> ubicación en Castil<strong>la</strong> y León <strong>de</strong>l único gestor a nivel<br />
estatal <strong>de</strong> escorias salinas <strong>de</strong> segunda fusión <strong>de</strong> aluminio.<br />
Pág. 19
<strong>Inventario</strong> <strong>de</strong> Residuos Peligrosos <strong>de</strong> <strong>la</strong> <strong>CAPV</strong> – Año <strong>2004</strong><br />
Tab<strong>la</strong> 9. Exportaciones en <strong>2004</strong> <strong>de</strong> <strong>residuos</strong> <strong>peligrosos</strong> con origen vasco hacia otras CC.AA. (sin intervención <strong>de</strong><br />
Centros <strong>de</strong> Transferencia vascos).<br />
Exportaciones hacia otras Comunida<strong>de</strong>s Autónomas<br />
LER Araba Gipuzkoa Bizkaia Total %<br />
01: Minas y canteras 0,00 0,00 0,00 0,00 0%<br />
02: Producción primaria 0,00 0,00 0,00 0,00 0%<br />
03: Ind. ma<strong>de</strong>ra y papel 0,00 0,00 0,00 0,00 0%<br />
04: Ind. Cuero y textil 49,11 0,00 0,00 49,11 0%<br />
05: Refino petróleo 0,00 0,00 254,20 254,20 0,11%<br />
06: Ind. Química inorgánica 87,80 200,78 4.352,08 4.640,65 1,97%<br />
07: Ind. Química orgánica 1.324,74 121,04 893,03 2.338,81 0,99%<br />
08: Pinturas, barnices y tintas 2.075,30 989,79 1.128,58 4.193,66 1,78%<br />
09: Ind. Fotográfica 51,01 71,59 188,69 311,28 0,13%<br />
10: Ind. Procesos térmicos 4.552,43 2.068,53 42.579,97 49.200,92 20,92%<br />
11: Tto. y revestimiento metales 8.828,33 4.062,58 22.793,01 35.683,91 15,17%<br />
12: Ind. mecanizado metales 1.948,86 3.904,89 2.679,96 8.533,71 3,63%<br />
13: Aceites usados 461,70 2.983,96 1.822,24 5.267,89 2,24%<br />
14: Disolventes usados 127,14 212,19 161,21 500,55 0,21%<br />
15: Envases y trapos 1.072,92 922,23 1.642,37 3.637,52 1,55%<br />
16: Otros <strong>residuos</strong> 987,55 1.625,15 1.873,31 4.486,01 1,91%<br />
17: Construcción y <strong>de</strong>molición 188,53 262,69 112.670,44 113.121,65 48,10%<br />
18: Servicios médicos 169,25 0,25 56,53 226,03 0,10%<br />
19: Ind. Tratamiento <strong>residuos</strong> 1.465,02 153,49 972,72 2.591,22 1,10%<br />
20: Municipales y asimi<strong>la</strong>bles 25,94 103,74 36,39 166,07 0,07%<br />
Total 23.415,62 17.682,89 194.104,71 235.203,22 100,00%<br />
% 9,96% 7,52% 82,53% 100,00%<br />
Tm/año Origen <strong>CAPV</strong> - <strong>de</strong>stino<br />
DIRECTO otras CCAA<br />
80.000<br />
70.000<br />
60.000<br />
50.000<br />
40.000<br />
30.000<br />
20.000<br />
10.000<br />
0<br />
AN AR AS CL CM CN CT GA LR MD MU NA PV<br />
Eliminación Incineración Recic<strong>la</strong>je Val. Energét.<br />
Figura 13. Exportaciones directas (sin intervención <strong>de</strong> Centros <strong>de</strong> Transferencia vascos).<strong>de</strong> <strong>residuos</strong> <strong>peligrosos</strong> en<br />
<strong>2004</strong>, <strong>de</strong>sglosados por CCAA <strong>de</strong> <strong>de</strong>stino y tipo <strong>de</strong> tratamiento. AN=Andalucía; AR=Aragón; AS=Asturias; CL=Castil<strong>la</strong> y<br />
León; CM=Castil<strong>la</strong> La Mancha; CN=Cantabria; CT=Cataluña; GA=Galicia; LR=La Rioja; MD=Madrid; MU= Murcia;<br />
NA=Navarra; PV=País Valenciano<br />
Pág. 20
<strong>Inventario</strong> <strong>de</strong> Residuos Peligrosos <strong>de</strong> <strong>la</strong> <strong>CAPV</strong> – Año <strong>2004</strong><br />
Tm/año Origen C.A.P.V. - Destino<br />
DIRECTO otras CC.AA.<br />
80.000<br />
70.000<br />
60.000<br />
50.000<br />
40.000<br />
30.000<br />
20.000<br />
10.000<br />
0<br />
AN AR AS CL CM CN CT GA LR MD MU NA PV<br />
04 05 06 07 08 09 10 11 12 13 14 15 16 17 18 19 20<br />
Figura 14. Exportaciones directas (sin intervención <strong>de</strong> Centros <strong>de</strong> Transferencia vascos).<strong>de</strong> <strong>residuos</strong> <strong>peligrosos</strong> en<br />
<strong>2004</strong>, <strong>de</strong>sglosados por CCAA <strong>de</strong> <strong>de</strong>stino y código LER. AN=Andalucía; AR=Aragón; AS=Asturias; CL=Castil<strong>la</strong> y León;<br />
CM=Castil<strong>la</strong> La Mancha; CN=Cantabria; CT=Cataluña; GA=Galicia; LR=La Rioja; MD=Madrid; MU= Murcia;<br />
NA=Navarra; PV=País Valenciano<br />
3.6.2 Exportaciones a otros Estados<br />
Durante <strong>2004</strong> se exportaron hacia otros Estados 8.626,30 Tm. (+21,27%) <strong>de</strong> <strong>residuos</strong> <strong>peligrosos</strong><br />
<strong>de</strong>s<strong>de</strong> empresas ubicadas en <strong>la</strong> <strong>CAPV</strong>, bien productores, bien gestores o Centros <strong>de</strong><br />
Transferencia que habían adquirido parte <strong>de</strong> dichos <strong>residuos</strong> en otras Comunida<strong>de</strong>s Autónomas:<br />
• Se afianza <strong>la</strong> inci<strong>de</strong>ncia <strong>de</strong> los Centros <strong>de</strong> Transferencia en <strong>la</strong> exportación internacional,<br />
al alcanzar el 97,44% <strong>de</strong>l total en <strong>2004</strong> (97,09% en 2003), <strong>de</strong>bido a <strong>la</strong> necesidad <strong>de</strong><br />
aplicar tratamientos <strong>de</strong> incineración a <strong>residuos</strong> halogenados, <strong>residuos</strong> sanitarios y<br />
<strong>de</strong>terminados <strong>residuos</strong> químicos o <strong>de</strong> <strong>la</strong>boratorio.<br />
• Se mantiene <strong>la</strong> cantidad exportada por empresas gestoras <strong>de</strong> <strong>residuos</strong> <strong>peligrosos</strong><br />
producidos durante sus propios procesos <strong>de</strong> tratamiento (146,29 Tm en 2003; 125,57<br />
Tm en <strong>2004</strong>).<br />
• Se mantiene como anecdótica <strong>la</strong> aportación <strong>de</strong> los productores <strong>de</strong> <strong>residuos</strong> <strong>peligrosos</strong><br />
que exportan directamente a otros Estados una parte <strong>de</strong> sus <strong>residuos</strong> (133,95 Tm en<br />
2002; 60,94 Tm en 2003; 95,58 Tm en <strong>2004</strong>).<br />
Los <strong>residuos</strong> sanitarios enviados a Francia constituyen un año más el principal flujo <strong>de</strong> exportación<br />
interestatal (2.507,29 Tm; 29,07% <strong>de</strong>l total). Sin embargo, aumenta <strong>la</strong> exportación a otros países<br />
<strong>de</strong> disolventes (+789 Tm) y <strong>de</strong> tierras contaminadas (+1.816 Tm), mientras que disminuye <strong>la</strong> <strong>de</strong><br />
pinturas (-573 Tm).<br />
Pág. 21
<strong>Inventario</strong> <strong>de</strong> Residuos Peligrosos <strong>de</strong> <strong>la</strong> <strong>CAPV</strong> – Año <strong>2004</strong><br />
Tab<strong>la</strong> 10. Residuos exportados <strong>de</strong>s<strong>de</strong> <strong>la</strong> <strong>CAPV</strong> hacia otros Estados durante <strong>2004</strong>.<br />
LER Nombre <strong>de</strong> producto Tratamiento Destino Tm %<br />
070107 Hidrocarburos halogenados INCINERACIÓN FR 14,49 0,17%<br />
Pentacloruro <strong>de</strong> antimonio RECICLAJE US 9,88 0,11%<br />
070208 Productos redundantes proce<strong>de</strong>ntes <strong>de</strong> <strong>la</strong> fabricación <strong>de</strong> fibras <strong>de</strong> INCINERACIÓN BE 8,44 0,10%<br />
Dimeti<strong>la</strong>cetamida(DMAC)líquido y polímero <strong>de</strong> aramida conteniendo ELIMINACIÓN BE 6,28 0,07%<br />
070408 Pesticidas líquidos y sólidos INCINERACIÓN BE 16,18 0,19%<br />
INCINERA CIÓN DE 7,00 0,08%<br />
070707 Residuos orgánicos clorados y no clorados RECICLA JE FR 402,44 4,67%<br />
080111 Residuos <strong>de</strong> pinturas y barnices VALORIZACIÓN DE 77,88 0,90%<br />
Residuos <strong>de</strong> pintura, barnices y <strong>de</strong> <strong>de</strong>sti<strong>la</strong>ción no halogenados VALORIZACIÓN BE 730,24 8,47%<br />
080501 Polímero sólido ELIMINA CIÓN BE 18,20 0,21%<br />
100604 Cobre y metales preciosos RECICLA JE A T 25,20 0,29%<br />
100899 Residuos <strong>de</strong> Sn/Pb RECICLA JE BE 84,62 0,98%<br />
110107 Cloruro cuproamónico RECICLAJE FR 207,94 2,41%<br />
Solución amoniacal saturada <strong>de</strong> cobre RECICLAJE IT 71,21 0,83%<br />
110205 Fangos <strong>de</strong> electrolisis RECICLAJE BE 15,75 0,18%<br />
130301 Aceite contaminado con PCB INCINERACIÓN DE 45,14 0,52%<br />
Residuos líquidos con PCB´s INCINERACIÓN FR 204,82 2,37%<br />
PCB líquido ELIMINA CIÓN FR 80,18 0,93%<br />
140602 Hidrocarburos clorados INCINERACIÓN BE 23,86 0,28%<br />
Disolventes halogenados INCINERACIÓN FR 222,30 2,58%<br />
Mezc<strong>la</strong>s y lodos <strong>de</strong> disolventes halogenados INCINERACIÓN DE 236,07 2,74%<br />
140603 Mezc<strong>la</strong> <strong>de</strong> disolventes orgánicos no halogenados VALORIZACIÓN FR 190,96 2,21%<br />
Disolvente no halogenado RECICLAJE FR 601,78 6,98%<br />
140604 Mezc<strong>la</strong>s y lodos <strong>de</strong> disolventes halogenados INCINERACIÓN DE 42,98 0,50%<br />
Lodos <strong>de</strong> percloroetileno ELIMINACIÓN FR 85,60 0,99%<br />
150202 Papel y ma<strong>de</strong>ra contaminados con PCB's ELIMINACIÓN DE 8,52 0,10%<br />
160209 Con<strong>de</strong>nsadores, materiales contaminados con PCB o PCT INCINERA CIÓN DE 80,91 0,94%<br />
Residuos contaminados con PCB/PCT ELIMINA CIÓN DE 335,98 3,89%<br />
160506 Residuos <strong>de</strong> <strong>la</strong>boratorio INCINERACIÓN DE 128,93 1,49%<br />
160602 Acumu<strong>la</strong>dores <strong>de</strong> Ni-Cd RECICLAJE FR 122,20 1,42%<br />
170503 Tierras y escombros contaminados con PCB's RECICLAJE BE 384,08 4,45%<br />
Tierras contaminadas con PCB ELIMINACIÓN DE 493,52 5,72%<br />
Tierras y escombros contaminados con sustancias peligrosas RECICLAJE NL 1.007,68 11,68%<br />
180103 Residuos sanitarios INCINERACIÓN FR 2.507,29 29,07%<br />
180106 Medicamentos caducados INCINERACIÓN DE 10,58 0,12%<br />
180106 Medicamentos INCINERACIÓN FR 117,17 1,36%<br />
TOTAL 8.626,30 100,00%<br />
Pág. 22
<strong>Inventario</strong> <strong>de</strong> Residuos Peligrosos <strong>de</strong> <strong>la</strong> <strong>CAPV</strong> – Año <strong>2004</strong><br />
5.000<br />
4.000<br />
Tm/año<br />
3.000<br />
2.000<br />
1.000<br />
0<br />
A T BE DE FR IT NL US<br />
Eliminac ión Inc iner ac ión Recic<strong>la</strong>je Val. energét.<br />
Figura 15. Distribución <strong>de</strong> los <strong>residuos</strong> exportados <strong>de</strong>s<strong>de</strong> <strong>la</strong> <strong>CAPV</strong> en <strong>2004</strong> por país <strong>de</strong> <strong>de</strong>stino y tratamiento.<br />
AT=Austria; BE=Bélgica; DE=Alemania; FR=Francia; IT=Italia; NL=Ho<strong>la</strong>nda; US=Estados Unidos.<br />
3.7 AUTOGESTIÓN<br />
En <strong>2004</strong> se han autogestionado 11.712 Tm <strong>de</strong> <strong>residuos</strong> <strong>peligrosos</strong>, lo que supone un incremento<br />
<strong>de</strong>l 32,24%. El número <strong>de</strong> empresas que disponen <strong>de</strong> autorización para autogestionar alguno <strong>de</strong><br />
sus <strong>residuos</strong> generados aumenta <strong>de</strong> veinte a veinticuatro.<br />
La variación más importante se <strong>de</strong>tecta en <strong>la</strong> industria química orgánica (LER 070101 y 070701).<br />
Aumenta también <strong>la</strong> autogestión <strong>de</strong> ta<strong>la</strong>drinas (LER 120109).<br />
Pág. 23
<strong>Inventario</strong> <strong>de</strong> Residuos Peligrosos <strong>de</strong> <strong>la</strong> <strong>CAPV</strong> – Año <strong>2004</strong><br />
Tab<strong>la</strong> 11. Residuos <strong>peligrosos</strong> autogestionados por empresas <strong>de</strong> <strong>la</strong> <strong>CAPV</strong>. Datos en Tm/año.<br />
CER DESCRIPCIÓN 2003 (Tm ) <strong>2004</strong> (Tm ) DIF. 04-03 % EVOL.<br />
070000<br />
070100<br />
070101<br />
RESIDUOS DE PROCESOS QUÍMICOS ORGÁNICOS<br />
Residuos <strong>de</strong> <strong>la</strong> FFDU <strong>de</strong> productos químicos orgánicos <strong>de</strong> base<br />
Líquidos <strong>de</strong> limpieza y licores madre acuosos 1.872,49 0,00 -1.872,49<br />
070700 Residuos <strong>de</strong> <strong>la</strong> FFDU <strong>de</strong> productos químicos resultantes <strong>de</strong> <strong>la</strong> química fina y productos químicos no especificados en otra<br />
070701<br />
categoría<br />
Líquidos <strong>de</strong> limpieza y licores madre acuosos 0,00 4.266,51 4.266,51<br />
070708 Otros <strong>residuos</strong> <strong>de</strong> reacción y <strong>de</strong> <strong>de</strong>sti<strong>la</strong>ción 1.807,21 1.091,19 -716,02 -39,62%<br />
070711 Lodos <strong>de</strong>l tratamiento in situ <strong>de</strong> efluentes que contienen sustancias<br />
866,36 743,36 -123,00 -14,20%<br />
peligrosas<br />
110000<br />
110100<br />
110105<br />
RESIDUOS DE TRA TA MIENTO QUIMICO DE SUPERFICIE<br />
Residuos <strong>de</strong>l tratamiento químico <strong>de</strong> superficie<br />
Ácidos <strong>de</strong> <strong>de</strong>capado 292,58 292,58 0,00 0,00%<br />
110107 Bases <strong>de</strong> <strong>de</strong>capado 675,00 675,00 0,00 0,00%<br />
110108 Lodos <strong>de</strong> fosfatación 0,00 370,52 370,52<br />
110111 Líquidos acuosos <strong>de</strong> enjuague que contienen sustancias peligrosas 0,00 45,00 45,00<br />
110113 Residuos <strong>de</strong> <strong>de</strong>sengrasado que contienen sustancias peligrosas 0,00 26,86 26,86<br />
110198 Otros <strong>residuos</strong> que contienen sustancias peligrosas 2,66 2,66 0,00 0,00%<br />
120000<br />
120100<br />
RESIDUOS DEL MOLDEA DO Y DEL TRA TA MIENTO FÍSICO Y MECÁ NICO DE SUPERFICIE<br />
Residuos <strong>de</strong>l mol<strong>de</strong>ado y <strong>de</strong>l tratamiento físico y mecánico <strong>de</strong> superficie <strong>de</strong> metales y plásticos<br />
120109 Emulsiones y disoluciones <strong>de</strong> mecanizado sin halógenos 1.467,55 2.169,61 702,06 47,84%<br />
130000<br />
130800<br />
130802<br />
RESIDUOS DE A CEITES Y DE COMBUSTIBLES LÍQUIDOS<br />
Residuos <strong>de</strong> aceites no especificados en otra categoría<br />
Otras emulsiones 1.406,21 1.576,86 170,65 12,14%<br />
150000<br />
150110<br />
RESIDUOS DE ENV A SES; A BSORBENTES, TRA POS; MA TERIA L DE FILTRA CIÓN<br />
Envases que contienen restos <strong>de</strong> sustancias peligrosas 87,98 72,38 -15,60 -17,73%<br />
150202 Absorbentes, materiales <strong>de</strong> filtración contaminados con sust. peligrosas 20,32 20,70 0,38 1,87%<br />
160000<br />
160107<br />
RESIDUOS NO ESPECIFICA DOS EN OTRO CA PITULO DE LA LISTA<br />
Filtros <strong>de</strong> aceite 3,05 0,00 -3,05<br />
180000 RESIDUOS DE SERV ICIOS MÉDICOS O V ETERINA RIOS O DE INV ESTIGA ClÓN A SOCIA DA (salvo los <strong>residuos</strong> <strong>de</strong> cocina y <strong>de</strong><br />
restaurante no proce<strong>de</strong>ntes directamente <strong>de</strong> <strong>la</strong> prestación <strong>de</strong> cuidados sanitarios)<br />
180100 Residuos <strong>de</strong> maternida<strong>de</strong>s, <strong>de</strong>l diagnóstico, tratamiento o prevención <strong>de</strong> enfermeda<strong>de</strong>s humanas<br />
180103 Residuos cuya recogida y eliminación es objeto <strong>de</strong> requisitos especiales 332,34 338,01 5,66 1,70%<br />
para prevenir infecciones<br />
180108 Medicamentos citotóxicos y citostáticos 21,03 13,32 -7,70 -36,64%<br />
190000<br />
190813<br />
RESIDUOS DE INSTA LA CIONES<br />
Lodos que contienen sustancias peligrosas <strong>de</strong> trat. <strong>de</strong> aguas resid. ind. 1,84 7,34 5,50 299,29%<br />
TOTALES 8.856,62 11.711,90 2.855,28 32,24%<br />
3.8 EVOLUCIÓN INTERANUAL<br />
3.8.1 Análisis consi<strong>de</strong>rando los <strong>residuos</strong> históricos<br />
En el periodo 2003-04 se produce un aumento en <strong>la</strong> generación <strong>de</strong> <strong>residuos</strong> <strong>peligrosos</strong> en <strong>la</strong><br />
<strong>CAPV</strong> <strong>de</strong> un 37,22%, frente al 7,42% <strong>de</strong>l periodo 2002-03. Esta diferencia tan notable se <strong>de</strong>be<br />
fundamentalmente a <strong>la</strong> influencia <strong>de</strong> los <strong>de</strong>nominados <strong>residuos</strong> históricos, en concreto a <strong>la</strong>s tierras<br />
contaminadas.<br />
Los <strong>residuos</strong> <strong>de</strong> procesos térmicos para <strong>la</strong> producción <strong>de</strong> metales (LER 10) y <strong>de</strong>l tratamiento<br />
químico <strong>de</strong> los mismos (LER 11) experimentan incrementos <strong>de</strong> 13.195 Tm y 11.372 Tm.<br />
respectivamente, <strong>de</strong>bido al aumento <strong>de</strong> producción registrada por estos sectores durante <strong>2004</strong>.<br />
Pág. 24
<strong>Inventario</strong> <strong>de</strong> Residuos Peligrosos <strong>de</strong> <strong>la</strong> <strong>CAPV</strong> – Año <strong>2004</strong><br />
Destaca también <strong>la</strong> aparición <strong>de</strong> 6.399 nuevas tone<strong>la</strong>das asociadas al sector <strong>de</strong> tratamiento <strong>de</strong><br />
corrientes residuales (LER 19), así como el incremento mantenido <strong>de</strong> <strong>la</strong>s corrientes <strong>de</strong> producción<br />
atomizada tales como pinturas (LER 08) y envases y absorbentes (LER 15).<br />
El principal <strong>de</strong>scenso se observa en el sector petroquímico, al generarse 1.896 Tm. menos que en<br />
2003, aunque también resulta significativo <strong>la</strong> reducción <strong>de</strong> 401 Tm. <strong>de</strong> disolventes sin pinturas<br />
(LER 14).<br />
175.000<br />
150.000<br />
125.000<br />
Tm/año<br />
100.000<br />
75.000<br />
50.000<br />
25.000<br />
0<br />
01 02 03 04 05 06 07 08 09 10 11 12 13 14 15 16 17 18 19 20<br />
LER<br />
2000 2001 2002 2003 <strong>2004</strong><br />
Figura 16. Evolución <strong>de</strong>l LER en el periodo 2000-<strong>2004</strong>. Datos en Tm/año.<br />
Respecto al tipo <strong>de</strong> gestión aplicada, un 40,26% <strong>de</strong> los <strong>residuos</strong> generados son sometidos a<br />
tratamientos <strong>de</strong> valorización material o energética, lo que supone una pérdida <strong>de</strong> 7,40 puntos<br />
respecto al valor alcanzado en 2003. De nuevo resulta patente <strong>la</strong> influencia <strong>de</strong> <strong>la</strong>s tierras<br />
contaminadas, que son enviadas mayoritariamente a <strong>de</strong>pósitos <strong>de</strong> seguridad ubicados fuera <strong>de</strong> <strong>la</strong><br />
<strong>CAPV</strong>.<br />
Aún así, han sido valorizadas 28.202 Tm más que en 2003, localizadas básicamente en el sector<br />
<strong>de</strong> procesos térmicos <strong>de</strong> producción <strong>de</strong> metales (LER10, +14.277 Tm. respecto a 2003) y el <strong>de</strong><br />
tratamiento químico <strong>de</strong> los mismos (LER 11, +11.697 Tm. respecto a 2003).<br />
Pág. 25
<strong>Inventario</strong> <strong>de</strong> Residuos Peligrosos <strong>de</strong> <strong>la</strong> <strong>CAPV</strong> – Año <strong>2004</strong><br />
0% 10% 20% 30% 40% 50% 60% 70% 80% 90% 100%<br />
2000<br />
108.943<br />
219.172<br />
2001<br />
126.870<br />
209.970<br />
2002<br />
157.724<br />
188.408<br />
2003<br />
177.224<br />
194.597<br />
<strong>2004</strong><br />
205.426<br />
304.778<br />
Valorización<br />
Eliminación<br />
Figura 17. Evolución <strong>de</strong>l tipo <strong>de</strong> gestión en el periodo 2000-<strong>2004</strong>. Datos en Tm/año.<br />
Respecto al cumplimiento <strong>de</strong> los principios <strong>de</strong> proximidad y autosuficiencia, se registra<br />
también un cierto retroceso en el porcentaje <strong>de</strong> <strong>residuos</strong> gestionados <strong>de</strong>ntro <strong>de</strong> <strong>la</strong> <strong>CAPV</strong> (63,91%<br />
en 2003; 51,69% en <strong>2004</strong>)), asociado fundamentalmente al importante incremento <strong>de</strong> tierras<br />
contaminadas, que son gestionadas fuera <strong>de</strong> <strong>la</strong> <strong>CAPV</strong>.<br />
0% 10% 20% 30% 40% 50% 60% 70% 80% 90% 100%<br />
2000<br />
2001<br />
2002<br />
2003<br />
<strong>2004</strong><br />
223.944<br />
208.753<br />
226.558<br />
237.613<br />
263.737<br />
104.171<br />
128.087<br />
119.575<br />
134.208<br />
246.467<br />
Gestor C.A.P.V.<br />
Gestor no C.A.P.V.<br />
Figura 18. Evolución <strong>de</strong>l origen <strong>de</strong>l gestor en el periodo 2000-<strong>2004</strong>. Datos en Tm/año.<br />
3.8.2 Análisis excluyendo los <strong>residuos</strong> históricos<br />
Si se elimina <strong>la</strong> influencia <strong>de</strong> los <strong>de</strong>nominados <strong>residuos</strong> históricos (aquellos no <strong>de</strong>rivados <strong>de</strong> <strong>la</strong><br />
actividad industrial anual, tales como tierras contaminadas, <strong>residuos</strong> <strong>de</strong> amianto y<br />
aceites/aparatos con PCB), el incremento anual se mo<strong>de</strong>ra (11,64%) aunque sigue siendo<br />
superior al <strong>de</strong>l periodo 2002-03 (3,29%).<br />
Pág. 26
<strong>Inventario</strong> <strong>de</strong> Residuos Peligrosos <strong>de</strong> <strong>la</strong> <strong>CAPV</strong> – Año <strong>2004</strong><br />
550.000<br />
500.000<br />
450.000<br />
400.000<br />
Tm/año<br />
350.000<br />
300.000<br />
250.000<br />
328.115<br />
321.358<br />
336.840<br />
320.538<br />
346.133<br />
335.468<br />
371.821<br />
346.491<br />
510.205<br />
386.821<br />
200.000<br />
2000 2001 2002 2003 <strong>2004</strong><br />
Total<br />
Sin amianto, tierras contaminadas ni aceites/aparatos con PCBs<br />
Figura 19. Evolución <strong>de</strong> <strong>la</strong> generación <strong>de</strong> <strong>residuos</strong> <strong>peligrosos</strong> en <strong>la</strong> <strong>CAPV</strong> 2000-<strong>2004</strong>. Comparación entre <strong>la</strong> cantidad<br />
total y <strong>la</strong> cantidad total sin tierras contaminadas, <strong>residuos</strong> <strong>de</strong> amianto ni aceites/aparatos con PCB/PCTs.<br />
Por tercer año consecutivo se observa que el incremento interanual <strong>de</strong> <strong>residuos</strong> <strong>peligrosos</strong> supera<br />
el porcentaje <strong>de</strong> crecimiento <strong>de</strong>l Valor Añadido Bruto <strong>de</strong>l sector industrial <strong>de</strong>l periodo 2003-<strong>2004</strong><br />
(2,89%). Así, en <strong>2004</strong> se han gestionado 26,9 Tm <strong>de</strong> <strong>residuos</strong> <strong>peligrosos</strong> (sin <strong>residuos</strong> históricos)<br />
por cada millón <strong>de</strong> euros generado (24,8 en 2003), habiendo sido actualizados los datos <strong>de</strong>l VAB<br />
a precios constantes <strong>de</strong>l año 2005.<br />
Tm /año / millón <strong>de</strong> euros<br />
30,0<br />
25,0<br />
20,0<br />
15,0<br />
10,0<br />
5,0<br />
24,6<br />
23,6<br />
23,9<br />
23,4<br />
24,3<br />
24,8<br />
26,9<br />
0,0<br />
1998 1999 2000 2001 2002 2003 <strong>2004</strong><br />
Figura 20. Comparación <strong>de</strong> <strong>la</strong> variación interanual <strong>de</strong> <strong>la</strong> cantidad gestionada <strong>de</strong> <strong>residuos</strong> <strong>peligrosos</strong> frente al Valor<br />
Añadido Bruto Industrial en <strong>la</strong> <strong>CAPV</strong> 1998-<strong>2004</strong>, excluidas tierras contaminadas, <strong>residuos</strong> <strong>de</strong> amianto y<br />
aceites/aparatos con PCB/PCTs. VAB <strong>de</strong>l sector industrial a precios constantes <strong>de</strong> mercado con respecto al año 2005.<br />
(Incluida corrección <strong>de</strong>l amianto en los datos <strong>de</strong> 1998 a 2002).<br />
Respecto al tipo <strong>de</strong> gestión, se alcanza el mejor resultado <strong>de</strong> los últimos años, al ser valorizados<br />
material o energéticamente el 52,99% <strong>de</strong> los <strong>residuos</strong> gestionados, frente al 51,03% <strong>de</strong> 2003.<br />
Pág. 27
<strong>Inventario</strong> <strong>de</strong> Residuos Peligrosos <strong>de</strong> <strong>la</strong> <strong>CAPV</strong> – Año <strong>2004</strong><br />
0% 10% 20% 30% 40% 50% 60% 70% 80% 90% 100%<br />
2000<br />
108.224<br />
213.133<br />
2001<br />
125.383<br />
195.155<br />
2002<br />
157.147<br />
178.320<br />
2003<br />
176.807<br />
169.684<br />
<strong>2004</strong><br />
204.992<br />
181.829<br />
Valorización<br />
Eliminación<br />
Figura 21. Evolución <strong>de</strong>l tipo <strong>de</strong> gestión en el periodo 2000-<strong>2004</strong>, excluidas tierras contaminadas, <strong>residuos</strong> <strong>de</strong><br />
amianto y aceites/aparatos con PCB/PCTs. Datos en Tm/año.<br />
La tasa <strong>de</strong> gestión interna se mantiene en niveles muy simi<strong>la</strong>res a 2003 (a pesar <strong>de</strong>l incremento<br />
registrado en <strong>la</strong> cantidad generada), al ser gestionados en <strong>la</strong> <strong>CAPV</strong> un 67,00% <strong>de</strong> los <strong>residuos</strong>,<br />
frente al 67,41% <strong>de</strong> 2003.<br />
0% 10% 20% 30% 40% 50% 60% 70% 80% 90% 100%<br />
2000<br />
2001<br />
2002<br />
2003<br />
<strong>2004</strong><br />
223.930<br />
208.727<br />
224.473<br />
233.576<br />
259.180<br />
97.428<br />
111.811<br />
110.995<br />
112.915<br />
127.641<br />
Gestor C.A.P.V.<br />
Gestor no C.A.P.V.<br />
Figura 22. Evolución <strong>de</strong>l origen <strong>de</strong>l gestor en el periodo 2000-<strong>2004</strong>, excluidas tierras contaminadas, <strong>residuos</strong> <strong>de</strong><br />
amianto y aceites/aparatos con PCB/PCTs. Datos en Tm/año.<br />
Pág. 28
<strong>Inventario</strong> <strong>de</strong> Residuos Peligrosos <strong>de</strong> <strong>la</strong> <strong>CAPV</strong> – Año <strong>2004</strong><br />
Tab<strong>la</strong> 12. Evolución <strong>de</strong> los <strong>Inventario</strong>s <strong>de</strong> Residuos Peligrosos (2000-<strong>2004</strong>). Datos en Tm/año.<br />
LER<br />
Tm/00<br />
2000 2001 2002<br />
Ge s tor<br />
<strong>CAPV</strong><br />
Tm/01<br />
Ge stor<br />
<strong>CAPV</strong><br />
Tm/02<br />
Gestor<br />
<strong>CAPV</strong><br />
Tm/03<br />
2003 <strong>2004</strong><br />
Gestor<br />
<strong>CAPV</strong><br />
Tm/04<br />
Valorización<br />
Valorización<br />
Valorización<br />
Valorización<br />
Valorización<br />
01 5 0% 100% 5 0% 100% 14 0% 100% 6 0% 100% 7 0% 100%<br />
02 425 0% 100% 355 0% 87,40% 196 0% 73,15% 5 0% 0% 0 0% 100%<br />
03 22 0% 100% 12 0% 96,11% 6 0% 100% 9 0% 100% 36 0% 16,24%<br />
04 47 0% 100% 23 0% 100%<br />
05 5.974 87,54% 97,14% 7.653 89,17% 98,85% 7.408 98,07% 98,51% 8.626 78,64% 95,43% 6.731 81,21% 96,22%<br />
06 13.792 0,04% 56,64% 10.129 0,12% 42,21% 9.401 0,60% 56,36% 8.827 1,13% 48,56% 9.366 1,02% 50,72%<br />
07 8.517 5,51% 73,78% 7.910 7,55% 69,70% 9.203 7,79% 75,90% 10.109 12,80% 74,26% 11.709 18,19% 72,19%<br />
08 4.313 14,56% 63,71% 4.962 18,76% 54,59% 5.386 21,51% 53,28% 6.330 25,59% 48,05% 7.384 26,82% 41,14%<br />
09 720 58,32% 61,33% 798 59,10% 64,33% 874 48,54% 65,25% 804 50,21% 65,41% 870 46,53% 49,94%<br />
10 149.286 34,00% 71,43% 150.150 38,20% 72,10% 158.212 49,35% 74,87% 157.919 55,62% 76,16% 171.115 59,68% 73,24%<br />
11 92.193 37,07% 75,17% 88.511 45,99% 60,96% 90.408 54,82% 60,56% 92.856 55,64% 63,50% 104.228 60,79% 65,63%<br />
12 17.196 5,49% 47,60% 16.857 4,27% 49,11% 18.199 5,22% 53,78% 17.001 16,71% 54,33% 18.244 16,60% 50,60%<br />
13 16.146 64,94% 59,29% 17.028 61,87% 65,30% 16.748 62,25% 59,68% 20.788 66,51% 54,47% 22.917 58,90% 66,50%<br />
14 1.800 73,00% 34,92% 2.672 86,80% 32,00% 2.597 86,69% 24,94% 2.224 80,22% 27,41% 1.823 80,95% 36,83%<br />
15 2.676 34,91% 59,21% 3.444 33,78% 46,52% 4.864 33,52% 50,11% 6.166 36,91% 56,40% 7.955 38,13% 54,36%<br />
16 4.353 49,60% 46,89% 6.575 60,41% 28,33% 6.515 55,69% 39,47% 8.270 54,52% 38,01% 10.236 54,55% 45,21%<br />
17 5.419 0% 0,26% 13.765 0% 0,30% 9.176 0,10% 23,68% 24.128 0,02% 16,82% 122.895 0,32% 3,72%<br />
18 1.156 0,58% 27,88% 1.244 0% 27,65% 1.272 0% 25,82% 1.306 0% 27,05% 1.373 0% 25,64%<br />
19 2.810 7,09% 64,90% 3.458 0,44% 37,77% 3.998 0,09% 49,03% 4.278 2,69% 45,00% 10.677 2,11% 65,93%<br />
20 1.266 96,20% 18,96% 1.311 94,39% 17,82% 1.632 96,10% 15,12% 2.170 99,80% 29,88% 2.639 99,89% 30,14%<br />
328.115 33,20% 68,25% 336.840 37,66% 61,97% 346.133 45,57% 65,45% 371.821 47,66% 63,91% 510.205 40,26% 51,69%<br />
Gestor<br />
<strong>CAPV</strong><br />
Pág. 29
<strong>Inventario</strong> <strong>de</strong> Residuos Peligrosos <strong>de</strong> <strong>la</strong> <strong>CAPV</strong> – Año <strong>2004</strong><br />
Tab<strong>la</strong> 13. Evolución <strong>de</strong> los <strong>Inventario</strong>s <strong>de</strong> Residuos Peligrosos (2000-<strong>2004</strong>), excluidas <strong>la</strong>s tierras contaminadas y los aceites/aparatos con PCB/PCTs.<br />
Datos en Tm/año.<br />
2000 2001 2002<br />
2003 <strong>2004</strong><br />
LER<br />
Tm/00<br />
Gestor<br />
<strong>CAPV</strong><br />
Tm/01<br />
Ge stor<br />
<strong>CAPV</strong><br />
Tm/02<br />
Gestor<br />
<strong>CAPV</strong><br />
Tm/03<br />
Gestor<br />
<strong>CAPV</strong><br />
Tm/04<br />
Valorización<br />
Valorización<br />
Valorización<br />
Valorización<br />
Valorización<br />
Gestor<br />
<strong>CAPV</strong><br />
01 5 0% 100% 5 0% 100% 14 0% 100% 6 0% 100% 7 0% 100%<br />
02 425 0% 100% 355 0% 87,40% 196 0% 73,15% 5 0% 0% 0 0% 100%<br />
03 22 0% 100% 12 0% 96,11% 6 0% 100% 9 0% 100% 36 0% 16,24%<br />
04 47 0% 100% 23 0% 100% 0<br />
05 5.974 87, 54% 97,14% 7.653 89,17% 98,85% 7.408 98,07%<br />
98,51% 8.626 78,64% 95,43% 6.731 81,21% 96,22%<br />
06 13.792 0,04% 56,64% 10.129 0,12% 42,21% 9.401 0,60% 56,36% 8.827 1,13% 48,56% 9.366 1,02% 50,72%<br />
07 8.517 5,51% 73,78% 7.910 7,55% 69,70% 9.203 7,79% 75,90% 10.109 12,80% 74,26% 11.709 18,19% 72,19%<br />
08 4.313 14,56% 63,71% 4.962 18,76% 54,59% 5.386 21,51% 53,28% 6.330 25,59% 48,05% 7.384 26,82% 41,14%<br />
09 720 58,32% 61,33% 798 59,10% 64,33% 874 48,54% 65,25% 804 50,21% 65,41% 870 46,53% 49,94%<br />
10 149.286 34,00% 71,43% 150.150 38,20% 72,10% 158.212 49,35% 74,87% 157.919 55,62% 76,16% 171.115 59,68% 73,24%<br />
11 92.193 37,07% 75,17% 88.511 45,99% 60,96% 90.408 54,82% 60,56% 92.856 55,64% 63,50% 104.228 60,79% 65,63%<br />
12 17.196 5,49% 47,60% 16.857 4,27% 49,11% 18.199 5,22% 53,78% 17.001 16,71% 54,33% 18.244 16,60% 50,60%<br />
13 15.606 67,19% 61,35% 16.013 65,79% 69,44% 15.743 66,22%<br />
63,49% 19.992 69,16% 56,64% 22.491 60,02% 67,76%<br />
14 1.800 73,00% 34,92% 2.672 86,80% 32,00% 2.597 86,69% 24,94% 2.224 80,22% 27,41% 1.823 80,95% 36,83%<br />
15 2.676 34,91% 59,21% 3.444 33,78% 46,52% 4.864 33,52% 50,11% 6.166 36,91% 56,40% 7.955 38,13% 54,36%<br />
16 3.546 40,62% 57,56% 5.028 49,42% 37,04% 5.912 51,74% 43,50% 7.829 52,27% 40,16% 10.163 54,52% 45,53%<br />
17 9 0% 0% 25 0% 59,56% 119 1,09% 73,86% 35 12,08% 59,04% 11 2,21% 100%<br />
18 1.156 0,58% 27, 88% 1.244 0% 27,65% 1.272 0% 25,82% 1.306 0% 27,05% 1.373 0% 25,64%<br />
19 2.810 7,09% 64,90% 3.458 0,44% 37,77% 3.998 0,09% 49,03% 4.278 2,69% 45,00% 10.677 2,11% 65,93%<br />
20 1.266 96,20% 18,96% 1.311 94,39% 17,82% 1.632 96,10% 15,12% 2.170 99,80% 29,88% 2.639 99,89% 30,14%<br />
321.358 33,68% 69,68% 320.538 39,12% 65,12% 335.468 46,84% 66,91% 346.491 51,03% 67,41% 386.821 52,99% 67,00%<br />
Pág. 30
<strong>Inventario</strong> <strong>de</strong> Residuos Peligrosos <strong>de</strong> <strong>la</strong> <strong>CAPV</strong> – Año <strong>2004</strong><br />
4. ANÁLISIS POR CATEGORÍAS LER<br />
Pág. 31
<strong>Inventario</strong> <strong>de</strong> Residuos Peligrosos <strong>de</strong> <strong>la</strong> <strong>CAPV</strong> – Año <strong>2004</strong><br />
4.1 LER 01: RESIDUOS DE MINAS Y CANTERAS<br />
La gestión <strong>de</strong> los <strong>residuos</strong> <strong>peligrosos</strong> proce<strong>de</strong>ntes <strong>de</strong> minas, canteras o activida<strong>de</strong>s <strong>de</strong> tratamiento<br />
<strong>de</strong> minerales se mantiene en <strong>2004</strong> en condiciones simi<strong>la</strong>res a los registrados el año anterior, tanto<br />
en lo que se refiere a <strong>la</strong> cantidad, como al Territorio Histórico <strong>de</strong> generación, el tipo <strong>de</strong> tratamiento<br />
o <strong>la</strong> ubicación <strong>de</strong>l gestor.<br />
Tab<strong>la</strong> 14. Resultados <strong>de</strong>l LER 01 en <strong>2004</strong> y evolución 2003-<strong>2004</strong>. Datos en Tm/año.<br />
CER DESCRIPCIÓN 2003 (Tm ) <strong>2004</strong> (Tm ) DIF. 04-03 %<br />
010000 RESIDUOS DE LA PROSPECCIÓN, EXTRACClÓN DE MINAS Y CANTERAS Y TRATAMIENTOS FÍSlCOS Y QUÍMICOS DE MINERALES<br />
010400<br />
010407<br />
Residuos <strong>de</strong> <strong>la</strong> transformación física y química <strong>de</strong> minerales no metálicos<br />
Residuos que contienen sustancias peligrosas proce<strong>de</strong>ntes <strong>de</strong> <strong>la</strong><br />
6,00 6,90 0,90 15,00%<br />
transformación física y química <strong>de</strong> minerales no metálicos<br />
TOTALES 6,00 6,90 0,90 15,00%<br />
Por gestor<br />
Por TH<br />
Por tratamiento<br />
6,90<br />
6,90<br />
6,90<br />
Vasco<br />
No Vasco<br />
Araba<br />
Gipuzkoa<br />
Bizkaia<br />
Eliminación<br />
Incineracion<br />
Valor. Energ.<br />
Recic<strong>la</strong>je<br />
0% 20% 40% 60% 80% 100%<br />
Figura 23. Cantidad <strong>de</strong> <strong>residuos</strong> <strong>de</strong>l LER 01 por origen <strong>de</strong> gestor, Territorio Histórico y tratamiento. Datos en Tm/año.<br />
15<br />
100%<br />
80%<br />
Tm/año<br />
10<br />
5<br />
60%<br />
40%<br />
%<br />
5<br />
5<br />
14<br />
6<br />
7<br />
20%<br />
0<br />
2000 2001 2002 2003 <strong>2004</strong><br />
Tm/año %Valorización % Gestión <strong>CAPV</strong><br />
0%<br />
Figura 24. Evolución 2000-<strong>2004</strong> <strong>de</strong> <strong>la</strong> generación <strong>de</strong> <strong>residuos</strong> <strong>de</strong>l LER 01 (cantidad, % valorización, % gestión <strong>CAPV</strong>).<br />
Pág. 32
<strong>Inventario</strong> <strong>de</strong> Residuos Peligrosos <strong>de</strong> <strong>la</strong> <strong>CAPV</strong> – Año <strong>2004</strong><br />
4.2 LER 02: RESIDUOS DE LOS PRODUCCIÓN AGROALIMENTARIA<br />
Se confirma un año más <strong>la</strong> ausencia <strong>de</strong> pautas <strong>de</strong> comportamiento en <strong>la</strong> generación <strong>de</strong> <strong>residuos</strong><br />
<strong>peligrosos</strong> por parte <strong>de</strong>l sector <strong>de</strong> producción agroalimentaria, tras <strong>la</strong> retirada <strong>de</strong>l inventario <strong>de</strong> los<br />
<strong>residuos</strong> no <strong>peligrosos</strong> gestionados como <strong>peligrosos</strong> que se produjo a partir <strong>de</strong>l año 2003.<br />
Durante <strong>2004</strong>, <strong>la</strong> única corriente gestionada ha correspondido a <strong>residuos</strong> agroquímicos generados<br />
en Araba y entregados a un eliminador ubicado en <strong>la</strong> <strong>CAPV</strong>.<br />
Tab<strong>la</strong> 15. Resultados <strong>de</strong>l LER 02 en <strong>2004</strong> y evolución 2003-<strong>2004</strong>. Datos en Tm/año.<br />
CER DESCRIPCIÓN 2003 (Tm ) <strong>2004</strong> (Tm ) DIF. 04-03 %<br />
020000 RESIDUOS DE LA A GRICULTURA , HORTICULTURA , A CUICULTURA , SILV ICULTURA , CA ZA Y PESCA ; RESIDUOS DE LA PREPA RA ClÓN Y<br />
ELABORACIÓN DE ALIMENTOS<br />
020100<br />
020108<br />
Residuos <strong>de</strong> <strong>la</strong> agricultura, horticultura, acuicultura, silvicultura, caza y pesca<br />
Residuos agroquímicos que contienen sustancias peligrosas 4,98 0,11 -4,87 -97,81%<br />
TOTALES 4,98 0,11 -4,87 -97,81%<br />
Por gestor<br />
Por TH<br />
Por tratamiento<br />
0,11<br />
0,11<br />
0,11<br />
Vasco<br />
No Vasco<br />
Araba<br />
Gipuzkoa<br />
Bizkaia<br />
Eliminación<br />
Incineracion<br />
Valor. Energ.<br />
Recic<strong>la</strong>je<br />
0% 20% 40% 60% 80% 100%<br />
Figura 25. Cantidad <strong>de</strong> <strong>residuos</strong> <strong>de</strong>l LER 02 por origen <strong>de</strong> gestor, Territorio Histórico y tratamiento. Datos en Tm/año.<br />
500<br />
100%<br />
400<br />
80%<br />
Tm/año<br />
300<br />
200<br />
60%<br />
40%<br />
%<br />
100<br />
0<br />
425<br />
355<br />
196<br />
5 0<br />
2000 2001 2002 2003 <strong>2004</strong><br />
20%<br />
0%<br />
Tm/año %Valorización % Gestión <strong>CAPV</strong><br />
Figura 26. Evolución 2000-<strong>2004</strong> <strong>de</strong> <strong>la</strong> generación <strong>de</strong> <strong>residuos</strong> <strong>de</strong>l LER 02 (cantidad, % valorización, % gestión <strong>CAPV</strong>)<br />
Pág. 33
<strong>Inventario</strong> <strong>de</strong> Residuos Peligrosos <strong>de</strong> <strong>la</strong> <strong>CAPV</strong> – Año <strong>2004</strong><br />
4.3 LER 03: RESIDUOS DE LA INDUSTRIA DE LA MADERA Y DEL PAPEL<br />
Durante <strong>2004</strong> aumenta significativamente <strong>la</strong> cantidad <strong>de</strong> <strong>residuos</strong> <strong>peligrosos</strong> gestionados por parte<br />
<strong>de</strong> <strong>la</strong> industria <strong>de</strong> <strong>la</strong> ma<strong>de</strong>ra y el papel, <strong>de</strong>bido a <strong>la</strong> incorporación <strong>de</strong> 29,74 Tm. <strong>de</strong> conservantes <strong>de</strong><br />
ma<strong>de</strong>ra organoclorados, hecho que se valora muy positivamente.<br />
El carácter halogenado <strong>de</strong> esta corriente supone <strong>la</strong> aplicación <strong>de</strong> un tratamiento <strong>de</strong> incineración<br />
fuera <strong>de</strong> <strong>la</strong> <strong>CAPV</strong>, por lo que <strong>la</strong>s tasas <strong>de</strong> valorización y gestión en <strong>la</strong> <strong>CAPV</strong> <strong>de</strong>l conjunto <strong>de</strong>l grupo<br />
registran valores bajos.<br />
Tab<strong>la</strong> 16. Resultados <strong>de</strong>l LER 03 en <strong>2004</strong> y evolución 2003-<strong>2004</strong>. Datos en Tm/año.<br />
CER DESCRIPCIÓN 2003 (Tm ) <strong>2004</strong> (Tm ) DIF. 04-03 %<br />
030000 RESIDUOS DE LA TRA NSFORMA CIÓN DE LA MA DERA Y DE LA PRODUCClÓN DE TA BLEROS Y MUEBLES, PA STA DE PA PEL, PA PEL Y<br />
CA RTÓN<br />
030100 Residuos <strong>de</strong> <strong>la</strong> transformación <strong>de</strong> <strong>la</strong> ma<strong>de</strong>ra y <strong>de</strong> <strong>la</strong> producción <strong>de</strong> tableros y muebles<br />
030104 Serrín, virutas, recortes, ma<strong>de</strong>ra, tableros <strong>de</strong> partícu<strong>la</strong>s y chapas que<br />
contienen sustancias peligrosas<br />
6,10 0,00 -6,10<br />
030200<br />
030201<br />
Residuos <strong>de</strong> los tratamientos <strong>de</strong> conservación <strong>de</strong> <strong>la</strong> ma<strong>de</strong>ra<br />
Conservantes <strong>de</strong> <strong>la</strong> ma<strong>de</strong>ra orgánicos no halogenados 0,00 3,42 3,42<br />
030202 Conservantes <strong>de</strong> <strong>la</strong> ma<strong>de</strong>ra organoclorados 0,00 29,74 29,74<br />
030204 Conservantes <strong>de</strong> <strong>la</strong> ma<strong>de</strong>ra inorgánicos 0,00 0,04 0,04<br />
030205 Otros conservantes <strong>de</strong> <strong>la</strong> ma<strong>de</strong>ra, que contienen sustancias peligrosas 2,48 2,31 -0,16 -6,62%<br />
TOTALES 8,58 35,51 26,93 313,98%<br />
Por gestor<br />
5,77<br />
29,74<br />
Vasco<br />
No Vasco<br />
Por TH<br />
3,05<br />
29,74<br />
2,72<br />
Araba<br />
Gipuzkoa<br />
Bizkaia<br />
Por tratamiento<br />
5,77<br />
29,74<br />
Eliminación<br />
Incineracion<br />
Valor. Energ.<br />
Recic<strong>la</strong>je<br />
0% 20% 40% 60% 80% 100%<br />
Figura 27. Cantidad <strong>de</strong> <strong>residuos</strong> <strong>de</strong>l LER 03 por origen <strong>de</strong> gestor, Territorio Histórico y tratamiento. Datos en Tm/año.<br />
Pág. 34
<strong>Inventario</strong> <strong>de</strong> Residuos Peligrosos <strong>de</strong> <strong>la</strong> <strong>CAPV</strong> – Año <strong>2004</strong><br />
Tm/año<br />
40<br />
30<br />
20<br />
10<br />
0<br />
36<br />
22<br />
12<br />
6<br />
9<br />
2000 2001 2002 2003 <strong>2004</strong><br />
Tm/año %Valorización % Gestión <strong>CAPV</strong><br />
100%<br />
80%<br />
60%<br />
40%<br />
20%<br />
0%<br />
%<br />
Figura 28. Evolución 2000-<strong>2004</strong> <strong>de</strong> <strong>la</strong> generación <strong>de</strong> <strong>residuos</strong> <strong>de</strong>l LER 03 (cantidad, % valorización, % gestión <strong>CAPV</strong>)<br />
Pág. 35
<strong>Inventario</strong> <strong>de</strong> Residuos Peligrosos <strong>de</strong> <strong>la</strong> <strong>CAPV</strong> – Año <strong>2004</strong><br />
4.4 LER 04: RESIDUOS DE LA INDUSTRIA TEXTIL Y DE LA PIEL<br />
Por segundo año consecutivo, no se han gestionado <strong>residuos</strong> <strong>peligrosos</strong> <strong>de</strong>rivados <strong>de</strong> <strong>la</strong>s<br />
industrias textil o <strong>de</strong> <strong>la</strong> piel.<br />
50<br />
100%<br />
40<br />
80%<br />
Tm/año<br />
30<br />
20<br />
60%<br />
40%<br />
%<br />
10<br />
47 23<br />
20%<br />
0<br />
2000 2001 2002 2003 <strong>2004</strong><br />
Tm/año %Valorización % Gestión <strong>CAPV</strong><br />
0%<br />
Figura 29. Evolución 2000-<strong>2004</strong> <strong>de</strong> <strong>la</strong> generación <strong>de</strong> <strong>residuos</strong> <strong>de</strong>l LER 04 (cantidad, % valorización, % gestión <strong>CAPV</strong>)<br />
Pág. 36
<strong>Inventario</strong> <strong>de</strong> Residuos Peligrosos <strong>de</strong> <strong>la</strong> <strong>CAPV</strong> – Año <strong>2004</strong><br />
4.5 LER 05: RESIDUOS DE LA INDUSTRIA DEL PETRÓLEO, GAS NATURAL Y<br />
CARBÓN<br />
Durante <strong>2004</strong> se observa una reducción <strong>de</strong>l 21,96% en <strong>la</strong> generación <strong>de</strong> <strong>residuos</strong> <strong>peligrosos</strong><br />
petroquímicos. Estas variaciones interanuales suelen quedar condicionadas por <strong>la</strong>s condiciones<br />
<strong>de</strong> producción y <strong>de</strong> logística <strong>de</strong> mantenimiento adoptadas por <strong>la</strong> refinería <strong>de</strong> Bizkaia.<br />
Las tasas <strong>de</strong> valorización (81,21%) y <strong>de</strong> gestión en <strong>la</strong> <strong>CAPV</strong> (96,22%) se mantienen en valores<br />
simi<strong>la</strong>res a los <strong>de</strong> 2003.<br />
Tab<strong>la</strong> 17. Resultados <strong>de</strong>l LER 05 en <strong>2004</strong> y evolución 2003-<strong>2004</strong>. Datos en Tm/año.<br />
CER DESCRIPCIÓN 2003 (Tm ) <strong>2004</strong> (Tm ) DIF. 04-03 %<br />
050000 RESIDUOS DEL REFINO DE PETRÓLEO, PURIFICA ClÓN DEL GA S NA TURA L Y TRA TA MIENTO PIROLÍTICO DEL CA RBÓN<br />
050100<br />
050103<br />
Residuos <strong>de</strong>l refino <strong>de</strong> petróleo<br />
Lodos <strong>de</strong> fondos <strong>de</strong> tanques 1.159,27 398,48 -760,79 -65,63%<br />
050104 Lodos <strong>de</strong> alquil ácido 317,80 337,75 19,95 6,28%<br />
050109 Lodos <strong>de</strong>l tratamiento in situ <strong>de</strong> efluentes que contienen sustancias<br />
7.110,00 5.977,58 -1.132,42 -15,93%<br />
peligrosas<br />
050115 Arcil<strong>la</strong>s <strong>de</strong> filtración usadas 39,20 16,80 -22,40 -57,14%<br />
TOTALES 8.626,27 6.730,61 -1.895,66 -21,98%<br />
Por gestor<br />
6.476,41<br />
254,20<br />
Vasco<br />
No Vasco<br />
Por TH<br />
6.730,61<br />
Araba<br />
Gipuzkoa<br />
Bizkaia<br />
Por tratamiento<br />
1.264,98<br />
5.465,63<br />
Eliminación<br />
Incineracion<br />
Valor. Energ.<br />
Recic<strong>la</strong>je<br />
0% 20% 40% 60% 80% 100%<br />
Figura 30. Cantidad <strong>de</strong> <strong>residuos</strong> <strong>de</strong>l LER 05 por origen <strong>de</strong> gestor, Territorio Histórico y tratamiento. Datos en Tm/año.<br />
Pág. 37
<strong>Inventario</strong> <strong>de</strong> Residuos Peligrosos <strong>de</strong> <strong>la</strong> <strong>CAPV</strong> – Año <strong>2004</strong><br />
10.000<br />
100%<br />
8.000<br />
80%<br />
Tm/año<br />
6.000<br />
4.000<br />
60%<br />
40%<br />
%<br />
2.000<br />
5.974<br />
7.653<br />
7.408<br />
8.626<br />
6.731<br />
20%<br />
0<br />
2000 2001 2002 2003 <strong>2004</strong><br />
Tm/año %Valorización % Gestión <strong>CAPV</strong><br />
0%<br />
Figura 31. Evolución 2000-<strong>2004</strong> <strong>de</strong> <strong>la</strong> generación <strong>de</strong> <strong>residuos</strong> <strong>de</strong>l LER 05 (cantidad, % valorización, % gestión <strong>CAPV</strong>)<br />
Pág. 38
<strong>Inventario</strong> <strong>de</strong> Residuos Peligrosos <strong>de</strong> <strong>la</strong> <strong>CAPV</strong> – Año <strong>2004</strong><br />
4.6 LER 06: RESIDUOS DE PROCESOS QUÍMICOS INORGÁNICOS<br />
Durante <strong>2004</strong> se gestionaron 9.365,99 Tm. <strong>de</strong> <strong>residuos</strong> <strong>peligrosos</strong> proce<strong>de</strong>ntes <strong>de</strong> <strong>la</strong> industria<br />
química inorgánica, lo que supone un 6,11% más que en 2003.<br />
La variación más importante se registra en el LER 060205 “Otras bases”, que aumenta su gestión<br />
en 1.424,41 Tm., <strong>de</strong>bido fundamentalmente a <strong>la</strong> incorporación <strong>de</strong> <strong>la</strong>s disoluciones alcalinas<br />
generadas por una empresa <strong>de</strong> limpiezas industriales y por dos nuevos productores. Se retorna a<br />
valores más cercanos a los registrados en 2002, tras <strong>la</strong> caída <strong>de</strong>tectada en 2003.<br />
Aunque <strong>de</strong> menor entidad, <strong>de</strong>staca igualmente el <strong>de</strong>scenso <strong>de</strong> 671,50 Tm. en <strong>la</strong> generación <strong>de</strong><br />
hidróxido cálcico, achacable al comportamiento <strong>de</strong> una empresa <strong>de</strong> fabricación <strong>de</strong> acetileno.<br />
La distribución territorial se mantiene constante, ostentando Bizkaia el 91,64% <strong>de</strong> <strong>la</strong> generación<br />
global.<br />
La naturaleza <strong>de</strong> los <strong>residuos</strong> <strong>de</strong> este grupo condiciona el tipo <strong>de</strong> gestión a aplicar, ya que<br />
únicamente el 1,02% <strong>de</strong> los <strong>residuos</strong> generados recibe tratamientos <strong>de</strong> valorización. Al igual que<br />
en 2003, <strong>la</strong> gestión se reparte <strong>de</strong> manera equitativa entre gestores ubicados <strong>de</strong>ntro y fuera <strong>de</strong> <strong>la</strong><br />
<strong>CAPV</strong>.<br />
Tab<strong>la</strong> 18. Resultados <strong>de</strong>l LER 06 en <strong>2004</strong> y evolución 2003-<strong>2004</strong>. Datos en Tm/año.<br />
CER DESCRIPCIÓN 2003 (Tm ) <strong>2004</strong> (Tm ) DIF. 04-03 %<br />
060000 RESIDUOS DE PROCESOS QUíMICOS INORGÁNICOS<br />
060100<br />
060101<br />
Residuos <strong>de</strong> <strong>la</strong> fabricación, formu<strong>la</strong>ción, distribución y utilización (FFDU) <strong>de</strong> ácidos<br />
Ácido sulfúrico y ácido sulfuroso 6,50 12,81 6,31 97,05%<br />
060102 Ácido clorhídrico 36,71 8,28 -28,43 -77,44%<br />
060103 Ácido fluorhídrico 0,00 0,33 0,33<br />
060104 Ácido fosfórico y ácido fosforoso 52,99 45,75 -7,24 -13,67%<br />
060105 Ácido nítrico y ácido nitroso 6,60 12,16 5,56 84,28%<br />
060106 Otros ácidos 309,64 198,44 -111,20 -35,91%<br />
060200<br />
060201<br />
Residuos <strong>de</strong> <strong>la</strong> FFDU <strong>de</strong> bases<br />
Hidróxido cálcico 6.741,66 6.070,16 -671,50<br />
-9,96%<br />
060203 Hidróxido amónico 8,72 18,06 9,34 107,02%<br />
060204 Hidróxido potásico e hidróxido sódico 189,09 357,85 168,77 89,25%<br />
060205 Otras bases 706,93 2.131,34 1.424,41 201,49%<br />
060300<br />
060311<br />
Residuos <strong>de</strong> <strong>la</strong> FFDU <strong>de</strong> sales y sus soluciones y <strong>de</strong> óxidos metálicos<br />
Sales sólidas y soluciones que contienen cianuros 65,29 46,72 -18,57 -28,45%<br />
060313 Sales sólidas y soluciones que contienen metales pesados 44,76 123,01 78,25 174,80%<br />
060315 Óxidos metálicos que contienen metales pesados 178,38 184,24 5,86 3,29%<br />
060400<br />
060403<br />
Residuos que contienen metales distintos <strong>de</strong> los mencionados en el código 06 03<br />
Residuos que contienen arsénico 38,67 90,56 51,90 134,22%<br />
060404 Residuos que contienen mercurio 0,86 0,70 -0,16 -18,10%<br />
060405 Residuos que contienen otros metales pesados 92,12 65,59 -26,53 -28,80%<br />
060500<br />
060502<br />
Lodos <strong>de</strong>l tratamiento insitu <strong>de</strong> efluentes<br />
Lodos <strong>de</strong>l tratamiento insitu <strong>de</strong> efluentes que contienen sustancias<br />
12,75 0,00 -12,75<br />
peligrosas<br />
060600 Residuos <strong>de</strong> <strong>la</strong> FFDU <strong>de</strong> ptos qcos que contienen azufre, <strong>de</strong> procesos qcos <strong>de</strong>l azufre y <strong>de</strong> procesos <strong>de</strong> <strong>de</strong>sulfuración<br />
060602 Residuos que contienen sulfuros <strong>peligrosos</strong> 306,14 0,00 -306,14<br />
061300<br />
061303<br />
Residuos <strong>de</strong> procesos químicos inorgánicos no especificados en otra categoría<br />
Negro <strong>de</strong> carbón 29,08 0,00 -29,08 -100,00%<br />
TOTALES 8.826,87 9.365,99 539,12 6,11%<br />
Pág. 39
<strong>Inventario</strong> <strong>de</strong> Residuos Peligrosos <strong>de</strong> <strong>la</strong> <strong>CAPV</strong> – Año <strong>2004</strong><br />
Por gestor<br />
326,83<br />
Por TH<br />
456,60<br />
4.750,21<br />
8.582,56<br />
4.615,78<br />
Vasco<br />
No Vasco<br />
Araba<br />
Gipuzkoa<br />
Bizkaia<br />
Por tratamiento<br />
9.270,60<br />
85,24<br />
10,15<br />
Eliminación<br />
Incineracion<br />
Valor. Energ.<br />
Recic<strong>la</strong>je<br />
0% 20% 40% 60% 80% 100%<br />
Figura 32. Cantidad <strong>de</strong> <strong>residuos</strong> <strong>de</strong>l LER 06 por origen <strong>de</strong> gestor, Territorio Histórico y tratamiento. Datos en Tm/año.<br />
14.000<br />
100%<br />
Tm/año<br />
12.000<br />
10.000<br />
8.000<br />
6.000<br />
4.000<br />
2.000<br />
13.792<br />
10.129<br />
9.401<br />
8.827<br />
9.366<br />
80%<br />
60%<br />
40%<br />
20%<br />
%<br />
0<br />
2000 2001 2002 2003 <strong>2004</strong><br />
Tm/año %Valorización % Gestión <strong>CAPV</strong><br />
0%<br />
Figura 33. Evolución 2000-<strong>2004</strong> <strong>de</strong> <strong>la</strong> generación <strong>de</strong> <strong>residuos</strong> <strong>de</strong>l LER 06 (cantidad, % valorización, % gestión <strong>CAPV</strong>)<br />
Pág. 40
<strong>Inventario</strong> <strong>de</strong> Residuos Peligrosos <strong>de</strong> <strong>la</strong> <strong>CAPV</strong> – Año <strong>2004</strong><br />
4.7 LER 07: RESIDUOS DE PROCESOS QUÍMICOS ORGÁNICOS<br />
El importante incremento registrado en una empresa autorizada para realizar operaciones <strong>de</strong><br />
autogestión, y cuyos <strong>residuos</strong> han sido recodificados <strong>de</strong>l LER 070101 al LER 070701, explica que<br />
el LER 07 en su conjunto haya generado 11.709,36 Tm en <strong>2004</strong> (1.600,82 Tm. más que en 2003;<br />
+15,84%).<br />
La aportación <strong>de</strong>l Territorio Histórico <strong>de</strong> Araba al conjunto (32,74%) resulta muy superior a su tasa<br />
<strong>de</strong>mográfica (14%), al contrario que Gipuzkoa, que únicamente genera un 8,22% <strong>de</strong>l total <strong>de</strong>l LER<br />
07, frente al 32% correspondiente a este Territorrio en el reparto pob<strong>la</strong>cional.<br />
El ratio <strong>de</strong> tratamiento en <strong>la</strong> <strong>CAPV</strong> <strong>de</strong>scien<strong>de</strong> 2,07 puntos hasta llegar al 72,19%, pero se<br />
consigue valorizar un 18,19% <strong>de</strong> los <strong>residuos</strong> generados (5,39 puntos más que en 2003).<br />
Tab<strong>la</strong> 19. Resultados <strong>de</strong>l LER 07 en <strong>2004</strong> y evolución 2003-<strong>2004</strong>. Datos en Tm/año.<br />
CER DESCRIPCIÓN 2003 (Tm ) <strong>2004</strong> (Tm ) DIF. 04-03 %<br />
070000 RESIDUOS DE PROCESOS QUÍMICOS ORGÁNICOS<br />
070100 Residuos <strong>de</strong> <strong>la</strong> fabricación, formu<strong>la</strong>ción, distribución y utilización (FFDU) <strong>de</strong> productos químicos orgánicos <strong>de</strong> base<br />
070101 Líquidos <strong>de</strong> limpieza y licores madre acuosos 2.192,60 649,67 -1.542,93 -70,37%<br />
070103 Disolventes, líquidos <strong>de</strong> limpieza y licores madre organohalogenados 1,67 0,00 -1,67<br />
070104 Otros disolventes, líquidos <strong>de</strong> limpieza y licores madre orgánicos 165,53 55,56 -109,96 -66,43%<br />
070107 Residuos <strong>de</strong> reacción y <strong>de</strong> <strong>de</strong>sti<strong>la</strong>ción halogenados 41,29 14,49 -26,80 -64,91%<br />
070108 Otros <strong>residuos</strong> <strong>de</strong> reacción y <strong>de</strong> <strong>de</strong>sti<strong>la</strong>ción 320,31 104,04 -216,27 -67,52%<br />
070110 Otras tortas <strong>de</strong> filtración y absorbentes usados 58,78 53,57 -5,20 -8,85%<br />
070111 Lodos <strong>de</strong>l tratamiento in situ <strong>de</strong> efluentes que contienen sustancias<br />
110,89 139,53 28,64 25,82%<br />
peligrosas<br />
070200<br />
070201<br />
Residuos <strong>de</strong> <strong>la</strong> FFDU <strong>de</strong> plásticos, caucho sintético y fibras artificiales<br />
Líquidos <strong>de</strong> limpieza y licores madre acuosos 320,97 311,10 -9,88 -3,08%<br />
070203 Disolventes, líquidos <strong>de</strong> limpieza y licores madre organohalogenados 7,00 0,66 -6,33 -90,54%<br />
070204 Otros disolventes, líquidos <strong>de</strong> limpieza y licores madre orgánicos 53,74 43,23 -10,52 -19,57%<br />
070207 Residuos <strong>de</strong> reacción y <strong>de</strong> <strong>de</strong>sti<strong>la</strong>ción halogenados 2,50 1,56 -0,94 -37,76%<br />
070208 Otros <strong>residuos</strong> <strong>de</strong> reacción y <strong>de</strong> <strong>de</strong>sti<strong>la</strong>ción 648,28 1.054,16 405,88 62,61%<br />
070210 Otras tortas <strong>de</strong> filtración y absorbentes usados 98,16 50,61 -47,54 -48,44%<br />
070211 Lodos <strong>de</strong>l tratamiento in situ <strong>de</strong> efluentes que contienen sustancias<br />
221,60 317,77 96,17 43,40%<br />
peligrosas<br />
070300 Residuos <strong>de</strong> <strong>la</strong> FFDU <strong>de</strong> tintes y pigmentos orgánicos (excepto los <strong>de</strong>l subcapítulo 06 11)<br />
070304 Otros disolventes, líquidos <strong>de</strong> limpieza y licores madre orgánicos 0,63 5,82 5,19 822,35%<br />
070308 Otros <strong>residuos</strong> <strong>de</strong> reacción y <strong>de</strong> <strong>de</strong>sti<strong>la</strong>ción 1,06 3,04 1,99 188,16%<br />
070311 Lodos <strong>de</strong>l tratamiento in situ <strong>de</strong> efluentes que contienen sustancias<br />
peligrosas<br />
33,68 33,38 -0,30 -0,89%<br />
Pág. 41
<strong>Inventario</strong> <strong>de</strong> Residuos Peligrosos <strong>de</strong> <strong>la</strong> <strong>CAPV</strong> – Año <strong>2004</strong><br />
Tab<strong>la</strong> 19. Continuación.<br />
CER DESCRIPCIÓN 2003 (Tm ) <strong>2004</strong> (Tm ) DIF. 04-03 %<br />
070400 Residuos <strong>de</strong> <strong>la</strong> FFDU <strong>de</strong> productos fitosanitarios orgánicos (excepto los <strong>de</strong> los códigos 02 01 08 y 02 01 09), <strong>de</strong> conservantes <strong>de</strong> <strong>la</strong><br />
070401 Líquidos <strong>de</strong> limpieza y licores madre acuosos 14,58 0,00 -14,58<br />
070404 Otros disolventes, líquidos <strong>de</strong> limpieza y licores madre orgánicos 0,00 8,54 8,54<br />
070408 Otros <strong>residuos</strong> <strong>de</strong> reacción y <strong>de</strong> <strong>de</strong>sti<strong>la</strong>ción 3,16 330,36 327,20 10351,00%<br />
070410 Otras tortas <strong>de</strong> filtración y absorbentes usados 84,06 144,62 60,56 72,04%<br />
070500<br />
070501<br />
Residuos <strong>de</strong> <strong>la</strong> FFDU <strong>de</strong> productos farmacéuticos<br />
Líquidos <strong>de</strong> limpieza y licores madre acuosos 13,19 25,19 12,01 91,04%<br />
070503 Disolventes, líquidos <strong>de</strong> limpieza y licores madre organohalogenados 2,89 1,02 -1,88 -64,85%<br />
070504 Otros disolventes, líquidos <strong>de</strong> limpieza y licores madre orgánicos 13,54 0,22 -13,31 -98,37%<br />
070507 Residuos <strong>de</strong> reacción y <strong>de</strong> <strong>de</strong>sti<strong>la</strong>ción halogenados 4,46 0,00 -4,46<br />
070508 Otros <strong>residuos</strong> <strong>de</strong> reacción y <strong>de</strong> <strong>de</strong>sti<strong>la</strong>ción 17,70 39,54 21,84 123,36%<br />
070600 Residuos <strong>de</strong> <strong>la</strong> FFDU <strong>de</strong> grasas, jabones, <strong>de</strong>tergentes, <strong>de</strong>sinfectantes y cosméticos<br />
070601 Líquidos <strong>de</strong> limpieza y licores madre acuosos 949,18 510,91 -438,28 -46,17%<br />
070603 Disolventes, líquidos <strong>de</strong> limpieza y licores madre organohalogenados 1,60 0,96 -0,64 -39,94%<br />
070604 Otros disolventes, líquidos <strong>de</strong> limpieza y licores madre orgánicos 51,53 15,78 -35,75 -69,38%<br />
070607 Residuos <strong>de</strong> reacción y <strong>de</strong> <strong>de</strong>sti<strong>la</strong>ción halogenados 0,00 3,21 3,21<br />
070608 Otros <strong>residuos</strong> <strong>de</strong> reacción y <strong>de</strong> <strong>de</strong>sti<strong>la</strong>ción 729,21 290,13 -439,07 -60,21%<br />
070610 Otras tortas <strong>de</strong> filtración y absorbentes usados 98,04 53,72 -44,32 -45,21%<br />
070611 Lodos <strong>de</strong>l tratamiento in situ <strong>de</strong> efluentes que contienen sustancias<br />
0,00 82,19 82,19<br />
peligrosas<br />
070700 Residuos <strong>de</strong> <strong>la</strong> FFDU <strong>de</strong> productos químicos resultantes <strong>de</strong> <strong>la</strong> química fina y productos químicos no especificados en otra categoría<br />
070701 Líquidos <strong>de</strong> limpieza y licores madre acuosos 237,57 4.392,06 4.154,49 1748,76%<br />
070703 Disolventes, líquidos <strong>de</strong> limpieza y licores madre organohalogenados 4,21 1,83 -2,39 -56,68%<br />
070704 Otros disolventes, líquidos <strong>de</strong> limpieza y licores madre orgánicos 58, 55 43,34 -15,21 -25,98%<br />
070707 Residuos <strong>de</strong> reacción y <strong>de</strong> <strong>de</strong>sti<strong>la</strong>ción halogenados 27,52 2,59 -24,93 -90,58%<br />
070708 Otros <strong>residuos</strong> <strong>de</strong> reacción y <strong>de</strong> <strong>de</strong>sti<strong>la</strong>ción 2.633,81 2.075,54 -558,28 -21,20%<br />
070710 Otras tortas <strong>de</strong> filtración y absorbentes usados 18,70 0,00 -18,70<br />
070711 Lodos <strong>de</strong>l tratamiento in situ <strong>de</strong> efluentes que contienen sustancias<br />
866,36 849,43 -16,93 -1,95%<br />
peligrosas<br />
TOTALES 10.108,54 11.709,36 1.600,82 15,84%<br />
Por gestor<br />
8.452,78<br />
3.256,58<br />
Vasco<br />
No Vasco<br />
Por TH<br />
3.833,82<br />
961,99<br />
6.913,54<br />
Araba<br />
Gipuzkoa<br />
Bizkaia<br />
Por tratamiento<br />
9.533,48<br />
45,84<br />
1.502,79<br />
627,25<br />
Eliminación<br />
Incineracion<br />
Valor. Energ.<br />
Recic<strong>la</strong>je<br />
0% 20% 40% 60% 80% 100%<br />
Figura 34. Cantidad <strong>de</strong> <strong>residuos</strong> <strong>de</strong>l LER 07 por origen <strong>de</strong> gestor, Territorio Histórico y tratamiento. Datos en Tm/año.<br />
Pág. 42
<strong>Inventario</strong> <strong>de</strong> Residuos Peligrosos <strong>de</strong> <strong>la</strong> <strong>CAPV</strong> – Año <strong>2004</strong><br />
12.000<br />
100%<br />
10.000<br />
80%<br />
Tm/año<br />
8.000<br />
6.000<br />
4.000<br />
8.517<br />
7.910<br />
9.203<br />
10.109<br />
11.709<br />
60%<br />
40%<br />
%<br />
2.000<br />
20%<br />
0<br />
2000 2001 2002 2003 <strong>2004</strong><br />
0%<br />
Tm/año %Valorización % Gestión <strong>CAPV</strong><br />
Figura 35. Evolución 2000-<strong>2004</strong> <strong>de</strong> <strong>la</strong> generación <strong>de</strong> <strong>residuos</strong> <strong>de</strong>l LER 07 (cantidad, % valorización, % gestión <strong>CAPV</strong>)<br />
Pág. 43
<strong>Inventario</strong> <strong>de</strong> Residuos Peligrosos <strong>de</strong> <strong>la</strong> <strong>CAPV</strong> – Año <strong>2004</strong><br />
4.8 LER 08: RESIDUOS DE PINTURAS, BARNICES Y TINTAS<br />
La sensibilización en materia medioambiental asociada a este LER <strong>de</strong> producción tan atomizada<br />
ha permitido alcanzar en el periodo 2003-04 un incremento interanual <strong>de</strong>l 16,64%.<br />
A nivel territorial, <strong>la</strong> incorporación <strong>de</strong> un importante productor ubicado en Araba ha provocado que<br />
este Territorio Histórico sea durante <strong>2004</strong> el mayor productor, con 2.779,07 Tm. (37,64% <strong>de</strong>l total).<br />
El 26,82% <strong>de</strong> <strong>la</strong>s pinturas, barnices y tintas generadas han recibido tratamientos <strong>de</strong> valorización<br />
fundamentalmente material, aunque un año más ha <strong>de</strong>scendido <strong>la</strong> proporción gestionada en <strong>la</strong><br />
<strong>CAPV</strong>.<br />
Tab<strong>la</strong> 20. Resultados <strong>de</strong>l LER 08 en <strong>2004</strong> y evolución 2003-<strong>2004</strong>. Datos en Tm/año.<br />
CER DESCRIPCIÓN 2003 (Tm ) <strong>2004</strong> (Tm ) DIF. 04-03 %<br />
080000 RESIDUOS DE LA FA BRICA CIÓN, FORMULA CIÓN, DISTRIBUCIÓN Y UTILIZACIÓN (FFDU) DE REV ESTIMIENTOS (PINTURA S, BA RNICES Y<br />
ESMA LTES V ÍTREOS), A DHESIV OS, SELLANTES Y TINTA S DE IMPRESlÓN<br />
080100<br />
080111<br />
Residuos <strong>de</strong> <strong>la</strong> FFDU y <strong>de</strong>l <strong>de</strong>capado o eliminación <strong>de</strong> pintura y barniz<br />
Residuos <strong>de</strong> pintura y barniz que contienen disolventes orgánicos u<br />
2.056,72 2.829,13 772,41 37,56%<br />
otras sustancias peligrosas<br />
080113 Lodos <strong>de</strong> pintura y barniz que contienen disolventes orgánicos u otras 1.329,69 1.458,05 128,36 9,65%<br />
sustancias peligrosas<br />
080115 Lodos acuosos que contienen pintura o barniz con disolventes<br />
829,43 1.011,54 182,11 21,96%<br />
orgánicos u otras sustancias peligrosas<br />
080117 Residuos <strong>de</strong>l <strong>de</strong>capado o eliminación <strong>de</strong> pintura y barniz que contienen<br />
20,36 22,62 2,25 11,05%<br />
disolventes orgánicos u otras sustancias peligrosas<br />
080119 Suspensiones acuosas que contienen pintura o barnizcon disolventes<br />
55,99 23,01 -32,99 -58,91%<br />
orgánicas u otras sustancias peligrosas<br />
080300<br />
080312<br />
Residuos <strong>de</strong> <strong>la</strong> FFDU <strong>de</strong> tintas <strong>de</strong> impresión<br />
Residuos <strong>de</strong> tintas que contienen sustancias peligrosas 1.158,00 1.180,37 22,37 1,93%<br />
080314 Lodos <strong>de</strong> tinta que contienen sustancias peligrosas 29,82 22,07 -7,74 -25,97%<br />
080317 Residuos <strong>de</strong> tóner <strong>de</strong> impresión que contienen sustancias peligrosas 4,75 7,62 2,88 60,58%<br />
080400 Residuos <strong>de</strong> <strong>la</strong> FFDU <strong>de</strong> adhesivos y sel<strong>la</strong>ntes (incluyendo productos <strong>de</strong> impermeabilización)<br />
080409 Residuos <strong>de</strong> adhesivos y sel<strong>la</strong>ntes que contienen disolventes orgánicos 426,92 529,17 102,26 23,95%<br />
u otras sustancias peligrosas<br />
080411 Lodos <strong>de</strong> adhesivos y sel<strong>la</strong>ntes que contienen disolventes orgánicos u<br />
38,82 38,36 -0,46 -1,18%<br />
otras sustancias peligrosas<br />
080413 Lodos acuosos que contienen adhesivos o sel<strong>la</strong>ntes con disolventes<br />
307,99 244,23 -63,76 -20,70%<br />
orgánicos u otras sustancias peligrosas<br />
080415 Residuos líquidos acuosos que contienen adhesivos o sel<strong>la</strong>ntes con<br />
61,18 0,00 -61,18<br />
disolventes orgánicos u otras sustancias peligrosas<br />
080500<br />
080501<br />
Residuos no especificados <strong>de</strong> otra forma en el capítulo 08<br />
Isocianatos residuales 10,56 17,50 6,93 65,63%<br />
TOTALES 6.330,22 7.383,67 1.053,45 16,64%<br />
Pág. 44
<strong>Inventario</strong> <strong>de</strong> Residuos Peligrosos <strong>de</strong> <strong>la</strong> <strong>CAPV</strong> – Año <strong>2004</strong><br />
Por gestor<br />
Por TH<br />
Por tratamiento<br />
3.037,35<br />
4.346,33<br />
2.779,07 2.171,58 2.433,02<br />
5.403,28<br />
362,83<br />
1.617,56<br />
Vasco<br />
No Vasco<br />
Araba<br />
Gipuzkoa<br />
Bizkaia<br />
Eliminación<br />
Incineracion<br />
Valor. Energ.<br />
Recic<strong>la</strong>je<br />
0% 20% 40% 60% 80% 100%<br />
Figura 36. Cantidad <strong>de</strong> <strong>residuos</strong> <strong>de</strong>l LER 08 por origen <strong>de</strong> gestor, Territorio Histórico y tratamiento. Datos en Tm/año.<br />
8.000<br />
100%<br />
Tm/año<br />
7.000<br />
6.000<br />
5.000<br />
4.000<br />
3.000<br />
2.000<br />
1.000<br />
4.313<br />
4.962<br />
5.386<br />
6.330<br />
7.384<br />
80%<br />
60%<br />
%<br />
40%<br />
20%<br />
0<br />
2000 2001 2002 2003 <strong>2004</strong><br />
Tm/año %Valorización % Gestión <strong>CAPV</strong><br />
0%<br />
Figura 37. Evolución 2000-<strong>2004</strong> <strong>de</strong> <strong>la</strong> generación <strong>de</strong> <strong>residuos</strong> <strong>de</strong>l LER 08 (cantidad, % valorización, % gestión <strong>CAPV</strong>)<br />
Pág. 45
<strong>Inventario</strong> <strong>de</strong> Residuos Peligrosos <strong>de</strong> <strong>la</strong> <strong>CAPV</strong> – Año <strong>2004</strong><br />
4.9 LER 09: RESIDUOS DE LA INDUSTRIA FOTOGRÁFICA<br />
Tras el ligero <strong>de</strong>scenso <strong>de</strong>tectado en el periodo 2002-2003, se retorna a valores propios <strong>de</strong> 2002,<br />
al generarse 869,90 Tm.<br />
La distribución territorial se mantiene constante, con valores cercanos a los que caracterizan el<br />
reparto pob<strong>la</strong>cional.<br />
El incremento registrado en <strong>la</strong> generación <strong>de</strong> soluciones <strong>de</strong> reve<strong>la</strong>do, que reciben tratamientos<br />
físico-químicos, provoca una ligera reducción <strong>de</strong>l porcentaje <strong>de</strong> valorización <strong>de</strong>l conjunto <strong>de</strong>l<br />
grupo, hasta situarlo en el 46,53%.<br />
Más notorio resulta el <strong>de</strong>scenso <strong>de</strong> <strong>la</strong> tasa <strong>de</strong> gestión en <strong>la</strong> <strong>CAPV</strong>, que se ve reducida <strong>de</strong>l 65,41%<br />
al 49,94%.<br />
Tab<strong>la</strong> 21. Resultados <strong>de</strong>l LER 09 en <strong>2004</strong> y evolución 2003-<strong>2004</strong>. Datos en Tm/año.<br />
CER DESCRIPCIÓN 2003 (Tm ) <strong>2004</strong> (Tm ) DIF. 04-03 %<br />
090000<br />
090100<br />
090101<br />
RESIDUOS DE LA INDUSTRIA FOTOGRÁ FICA<br />
Residuos <strong>de</strong> <strong>la</strong> industria fotográfica<br />
Soluciones <strong>de</strong> reve<strong>la</strong>do y soluciones activadoras al agua 314,17 376,69 62,52 19,90%<br />
090102 Soluciones <strong>de</strong> reve<strong>la</strong>do <strong>de</strong> p<strong>la</strong>cas <strong>de</strong> impresión al agua 84,85 88,41 3,56 4,20%<br />
090104 Soluciones <strong>de</strong> fijado 223,77 248,38 24,61 11,00%<br />
090105 Soluciones <strong>de</strong> b<strong>la</strong>nqueo y soluciones <strong>de</strong> b<strong>la</strong>nqueo-fijado 174,56 144,88 -29,68 -17,00%<br />
090106 Residuos que contienen p<strong>la</strong>ta procen<strong>de</strong>nte <strong>de</strong>l tratamiento in situ <strong>de</strong><br />
6,89 11,54 4,65 67,43%<br />
<strong>residuos</strong> fotográficos<br />
TOTALES 804,24 869,90 65,66 8,16%<br />
Por gestor<br />
434,46<br />
435,43<br />
Vasco<br />
No Vasco<br />
Por TH<br />
102,36<br />
316,39 451,15<br />
Araba<br />
Gipuzkoa<br />
Bizkaia<br />
Por tratamiento<br />
465,10<br />
404,80<br />
Eliminación<br />
Incineracion<br />
Valor. Energ.<br />
Recic<strong>la</strong>je<br />
0% 20% 40% 60% 80% 100%<br />
Figura 38. Cantidad <strong>de</strong> <strong>residuos</strong> <strong>de</strong>l LER 09 por origen <strong>de</strong> gestor, Territorio Histórico y tratamiento. Datos en Tm/año.<br />
Pág. 46
<strong>Inventario</strong> <strong>de</strong> Residuos Peligrosos <strong>de</strong> <strong>la</strong> <strong>CAPV</strong> – Año <strong>2004</strong><br />
100%<br />
800<br />
80%<br />
Tm/año<br />
600<br />
400<br />
60%<br />
40%<br />
%<br />
200<br />
720<br />
798<br />
874<br />
804<br />
870<br />
20%<br />
0<br />
2000 2001 2002 2003 <strong>2004</strong><br />
Tm/año %Valorización % Gestión <strong>CAPV</strong><br />
0%<br />
Figura 39. Evolución 2000-<strong>2004</strong> <strong>de</strong> <strong>la</strong> generación <strong>de</strong> <strong>residuos</strong> <strong>de</strong>l LER 09 (cantidad, % valorización, % gestión <strong>CAPV</strong>)<br />
Pág. 47
<strong>Inventario</strong> <strong>de</strong> Residuos Peligrosos <strong>de</strong> <strong>la</strong> <strong>CAPV</strong> – Año <strong>2004</strong><br />
4.10 LER 10: RESIDUOS DE PROCESOS TÉRMICOS<br />
Durante <strong>2004</strong> se gestionaron 171.114,64 Tm <strong>de</strong> <strong>residuos</strong> <strong>peligrosos</strong> <strong>de</strong> procesos térmicos<br />
si<strong>de</strong>rometalúrgicos, lo que supone un incremento <strong>de</strong>l 8,36% en el LER <strong>de</strong> mayor generación <strong>de</strong>l<br />
<strong>Inventario</strong>, que pue<strong>de</strong> <strong>de</strong>berse no solo a razones <strong>de</strong> mercado sino también a <strong>la</strong> adopción por parte<br />
<strong>de</strong> ciertas empresas <strong>de</strong> mejoras en <strong>la</strong> captación <strong>de</strong> partícu<strong>la</strong>s <strong>de</strong> <strong>la</strong> insta<strong>la</strong>ción <strong>de</strong> tratamiento <strong>de</strong><br />
gases.<br />
Los mayores crecimientos se <strong>de</strong>tectan en <strong>la</strong> generación <strong>de</strong> polvos <strong>de</strong> acería (+9.306,15 Tm.) y <strong>de</strong><br />
escorias salinas <strong>de</strong> segunda fusión <strong>de</strong> aluminio (+4.251,77). Por su parte, se reducen en 1.315,71<br />
Tm. los polvos <strong>de</strong> aspiración <strong>de</strong> <strong>la</strong> termometalurgia <strong>de</strong>l cobre.<br />
Territorialmente, Bizkaia genera el 52,29% <strong>de</strong>l total, frente al 40,73% <strong>de</strong> Gipuzkoa y el 6,99% <strong>de</strong><br />
Araba.<br />
El recic<strong>la</strong>je <strong>de</strong> 14.286,79 Tm. más que en 2003 provoca un incremento <strong>de</strong> <strong>la</strong> tasa <strong>de</strong> valorización<br />
<strong>de</strong>l 55,62% al 59,68%. Sin embargo, en lo que respecta al ratio <strong>de</strong> gestión interna, aunque se han<br />
gestionado en <strong>la</strong> <strong>CAPV</strong> 5.053,01 Tm. más que en el año anterior, se produce un <strong>de</strong>scenso <strong>de</strong> 2,92<br />
puntos porcentuales (76,16% en 2003; 73,24% en <strong>2004</strong>).<br />
El incremento <strong>de</strong>l recic<strong>la</strong>je <strong>de</strong> polvos <strong>de</strong> acería <strong>de</strong>l 41,57% en 2003 al 48,30% en <strong>2004</strong> confirma el<br />
buen avance hacia el cumplimiento <strong>de</strong>l compromiso asumido por el Sector <strong>de</strong>l Acero <strong>de</strong> valorizar<br />
para principios <strong>de</strong> 2007 el 100% <strong>de</strong> los polvos <strong>de</strong> acería proce<strong>de</strong>ntes <strong>de</strong> <strong>la</strong> fabricación <strong>de</strong> acero no<br />
inoxidable.<br />
Pág. 48
<strong>Inventario</strong> <strong>de</strong> Residuos Peligrosos <strong>de</strong> <strong>la</strong> <strong>CAPV</strong> – Año <strong>2004</strong><br />
Tab<strong>la</strong> 22. Resultados <strong>de</strong>l LER 10 en <strong>2004</strong> y evolución 2003-<strong>2004</strong>. Datos en Tm/año.<br />
CER DESCRIPCIÓN 2003 (Tm ) <strong>2004</strong> (Tm ) DIF. 04-03 %<br />
100000 RESIDUOS DE PROCESOS TÉRMICOS<br />
100100 Residuos <strong>de</strong> centrales eléctricas y otras p<strong>la</strong>ntas <strong>de</strong> combustión (excepto el capítulo 19)<br />
100104 Cenizas vo<strong>la</strong>ntes y polvo <strong>de</strong> cal<strong>de</strong>ra <strong>de</strong> hidrocarburos 64,53 88,74 24,21 37,52%<br />
100120 Lodos <strong>de</strong>l tratamiento in situ <strong>de</strong> efluentes que contienen sustancias<br />
209,96 121,28 -88,68 -42,24%<br />
peligrosas<br />
100200<br />
100207<br />
Residuos <strong>de</strong> <strong>la</strong> industria <strong>de</strong>l hierro y <strong>de</strong>l acero<br />
Residuos sólidos <strong>de</strong>l tratamiento <strong>de</strong> gases que contienen sustancias 114.128,59 123.434,74 9.306,15 8,15%<br />
peligrosas<br />
100211 Residuos <strong>de</strong> tratamiento <strong>de</strong>l agua <strong>de</strong> refrigeración que contienen aceites 78,82 0,00 -78,82<br />
100213 Lodos y tortas <strong>de</strong> filtración <strong>de</strong>l tratamiento <strong>de</strong> gases que contienen<br />
160,10 112,34 -47,76 -29,83%<br />
sustancias peligrosas<br />
100300<br />
100308<br />
Residuos <strong>de</strong> <strong>la</strong> termometalurgia <strong>de</strong>l aluminio<br />
Escorias salinas <strong>de</strong> <strong>la</strong> producción secundaria 25.713,84 29.965,62 4.251,77 16,53%<br />
100309 Granzas negras <strong>de</strong> <strong>la</strong> producción secundaria 9.616,28 9.780,74 164,46 1,71%<br />
100319 Partícu<strong>la</strong>s, proce<strong>de</strong>ntes <strong>de</strong> los efluentes gaseosos, que contienen<br />
0,00 4,28 4,28<br />
sustancias peligrosas<br />
100323 Residuos sólidos <strong>de</strong>l tratamiento <strong>de</strong> gases que contienen sustancias<br />
1.258,22 1.923,04 664,82 52,84%<br />
peligrosas<br />
100500<br />
100503<br />
Residuos <strong>de</strong> <strong>la</strong> termometalurgia <strong>de</strong>l zinc<br />
Partícu<strong>la</strong>s proce<strong>de</strong>ntes <strong>de</strong> los efluentes gaseosos 605,54 0,00 -605,54<br />
100505 Residuos sólidos <strong>de</strong>l tratamiento <strong>de</strong> gases 425,17 46,34 -378,83 -89,10%<br />
100600<br />
100603<br />
Residuos <strong>de</strong> <strong>la</strong> termometalurgia <strong>de</strong>l cobre<br />
Partícu<strong>la</strong>s proce<strong>de</strong>ntes <strong>de</strong> los efluentes gaseosos 220,28 164,60 -55,68 -25,28%<br />
100606 Residuos sólidos <strong>de</strong>l tratamiento <strong>de</strong> gases 4.036,09 2.720,38 -1.315,71 -32,60%<br />
100900<br />
100907<br />
Residuos <strong>de</strong> <strong>la</strong> fundición <strong>de</strong> piezas férreas<br />
Machos y mol<strong>de</strong>s <strong>de</strong> fundición con co<strong>la</strong>da que contienen sustancias<br />
0,00 3,94 3,94<br />
peligrosas<br />
100909 Partícu<strong>la</strong>s, proce<strong>de</strong>ntes <strong>de</strong> los efluentes gaseosos, que contienen<br />
453,85 1.459,01 1.005,16 221,48%<br />
sustancias peligrosas<br />
100911 Otras partícu<strong>la</strong>s que contienen sustancias peligrosas 0,00 26,20 26,20<br />
100915 Residuos <strong>de</strong> agentes indicadores <strong>de</strong> fisuración que contienen<br />
0,00 24,41 24,41<br />
sustancias peligrosas<br />
101000<br />
101005<br />
Residuos <strong>de</strong> <strong>la</strong> fundición <strong>de</strong> piezas no férreas<br />
Machos y mol<strong>de</strong>s <strong>de</strong> fundición sin co<strong>la</strong>da que contienen sustancias<br />
12,40 0,00 -12,40<br />
peligrosas<br />
101009 Partícu<strong>la</strong>s, proce<strong>de</strong>ntes <strong>de</strong> los efluentes gaseosos, que contienen<br />
0,00 1,41 1,41<br />
sustancias peligrosas<br />
101011 Otras partícu<strong>la</strong>s que contienen sustancias peligrosas 13,21 15,22 2,01 15,22%<br />
101015 Residuos <strong>de</strong> agentes indicadores <strong>de</strong> fisuración que contienen<br />
1,86 16,02 14,16 762,68%<br />
sustancias peligrosas<br />
101100<br />
101109<br />
Residuos <strong>de</strong> <strong>la</strong> fabricación <strong>de</strong>l vidrio y sus <strong>de</strong>rivados<br />
Residuos <strong>de</strong> <strong>la</strong> preparación <strong>de</strong> mezc<strong>la</strong>s antes <strong>de</strong>l proceso <strong>de</strong> cocción<br />
0,06 0,31 0,25 416,95%<br />
que contienen sustancias peligrosas<br />
101113 Lodos proce<strong>de</strong>ntes <strong>de</strong>l pulido y esmeri<strong>la</strong>do <strong>de</strong>l vidrio, que contienen<br />
10,85 1,76 -9,09 -83,82%<br />
sustancias peligrosas<br />
101119 Residuos sólidos <strong>de</strong>l tratamiento in situ <strong>de</strong> efluentes que contienen<br />
909,82 1.204,28 294,46 32,36%<br />
sustancias peligrosas<br />
TOTALES 157.919,45 171.114,64 13.195,19 8,36%<br />
Pág. 49
<strong>Inventario</strong> <strong>de</strong> Residuos Peligrosos <strong>de</strong> <strong>la</strong> <strong>CAPV</strong> – Año <strong>2004</strong><br />
Por gestor<br />
Por TH<br />
Por tratamiento<br />
11.956,15<br />
125.318,89<br />
45.795,75<br />
69.687,33 89.471,16<br />
68.995,46<br />
102.119,18<br />
Vasco<br />
No Vasco<br />
Araba<br />
Gipuzkoa<br />
Bizkaia<br />
Eliminación<br />
Incineracion<br />
Valor. Energ.<br />
Recic<strong>la</strong>je<br />
0% 20% 40% 60% 80% 100%<br />
Figura 40. Cantidad <strong>de</strong> <strong>residuos</strong> <strong>de</strong>l LER 10 por origen <strong>de</strong> gestor, Territorio Histórico y tratamiento. Datos en Tm/año.<br />
175.000<br />
100%<br />
Tm/año<br />
150.000<br />
125.000<br />
100.000<br />
75.000<br />
50.000<br />
25.000<br />
0<br />
149.286<br />
150.150<br />
158.212<br />
157.919<br />
171.115<br />
80%<br />
60%<br />
40%<br />
20%<br />
0%<br />
2000 2001 2002 2003 <strong>2004</strong><br />
Tm/año %Valorización % Gestión <strong>CAPV</strong><br />
%<br />
Figura 41. Evolución 2000-<strong>2004</strong> <strong>de</strong> <strong>la</strong> generación <strong>de</strong> <strong>residuos</strong> <strong>de</strong>l LER 10 (cantidad, % valorización, % gestión <strong>CAPV</strong>)<br />
Pág. 50
<strong>Inventario</strong> <strong>de</strong> Residuos Peligrosos <strong>de</strong> <strong>la</strong> <strong>CAPV</strong> – Año <strong>2004</strong><br />
4.11 LER 11: RESIDUOS DEL TRATAMIENTO Y REVESTIMIENTO DE METALES<br />
La gestión <strong>de</strong> <strong>residuos</strong> <strong>peligrosos</strong> asociados a los tratamientos químicos superficiales <strong>de</strong> metales<br />
supuso en <strong>2004</strong> un total <strong>de</strong> 104.228,44 Tm, un 12,25% más que en 2003. El comportamiento <strong>de</strong><br />
este grupo queda condicionado por <strong>la</strong> dinámica <strong>de</strong> generación y gestión <strong>de</strong> los ácidos <strong>de</strong><br />
<strong>de</strong>capado.<br />
El incremento <strong>de</strong>tectado es absorbido por los tres Territorios Históricos <strong>de</strong> manera proporcional,<br />
por lo que el reparto porcentual entre ellos no se ve afectado (Araba 33,81%; Gipuzkoa 14,08%;<br />
Bizkaia 52,11%).<br />
La tasa <strong>de</strong> valorización mejora en 5,15 puntos (55,64% en 2003; 60,79% en <strong>2004</strong>), lo que supone<br />
el recic<strong>la</strong>je <strong>de</strong> 11.658,32 Tm. más que en 2003. El ratio <strong>de</strong> tratamiento en <strong>la</strong> <strong>CAPV</strong>, por su parte,<br />
alcanza el 65,63%, manteniendo también el ritmo <strong>de</strong> crecimiento progresivo registrado en los<br />
últimos años.<br />
El recic<strong>la</strong>je <strong>de</strong>l 73,87% <strong>de</strong> los ácidos <strong>de</strong> <strong>de</strong>capado generados permite ya en <strong>2004</strong> superar <strong>la</strong> meta<br />
<strong>de</strong>l 69% recogida en el “P<strong>la</strong>n <strong>de</strong> gestión <strong>de</strong> Residuos Peligrosos <strong>de</strong> <strong>la</strong> Comunidad Autónoma <strong>de</strong>l<br />
País Vasco 2003-2006” para 2006.<br />
Tab<strong>la</strong> 23. Resultados <strong>de</strong>l LER 11 en <strong>2004</strong> y evolución 2003-<strong>2004</strong>. Datos en Tm/año.<br />
CER DESCRIPCIÓN 2003 (Tm ) <strong>2004</strong> (Tm ) DIF. 04-03 %<br />
110000 RESIDUOS DEL TRA TA MIENTO QUÍMlCO DE SUPERFICIE Y DEL RECUBRIMIENTO DE META LES Y OTROS MA TERIA LES; RESIDUOS DE LA<br />
HIDROMETA LURGLA NO FÉRREA<br />
110100 Residuos <strong>de</strong>l tratamiento químico <strong>de</strong> superficie y <strong>de</strong>l recubrimiento <strong>de</strong> metales y otros materiales (por ejemplo, procesos <strong>de</strong> galvanización,<br />
procesos <strong>de</strong> recubrimiento con zinc, procesos <strong>de</strong> <strong>de</strong>capado, grabado, fosfatación, <strong>de</strong>sengrasado alcalino y anodización)<br />
110105 Ácidos <strong>de</strong> <strong>de</strong>capado 67.228,62 79.471,24 12.242,62 18,21%<br />
110106<br />
110107<br />
110108<br />
Ácidos no especificados en otra categoría<br />
Bases <strong>de</strong> <strong>de</strong>capado<br />
Lodos <strong>de</strong> fosfatación<br />
4.657,01<br />
2.965,26<br />
2.649,46<br />
2.626,89<br />
2.701,04<br />
2.264,87<br />
-2.030,12<br />
-264,22<br />
-384,59<br />
-43,59%<br />
-8,91%<br />
-14,52%<br />
110109 Lodos y tortas <strong>de</strong> filtración que contienen sustancias peligrosas 9.454,58 10.964,94 1.510,36 15,97%<br />
110111 Líquidos acuosos <strong>de</strong> enjuague que contienen sustancias peligrosas 1.181,53 1.308,43 126,90 10,74%<br />
110113 Residuos <strong>de</strong> <strong>de</strong>sengrasado que contienen sustancias peligrosas 3.471,42 3.303,80 -167,62<br />
-4,83%<br />
110116 Resinas intercambiadoras <strong>de</strong> iones saturadas o usadas 2,89 0,00<br />
110198 Otros <strong>residuos</strong> que contienen sustancias peligrosas 1.020,26 1.359,85 339,59 33,29%<br />
110200 Residuos <strong>de</strong> procesos hidrometalúrgicos no férreos<br />
110205 Residuos <strong>de</strong> procesos <strong>de</strong> <strong>la</strong> hidrometalurgia <strong>de</strong>l cobre que contienen<br />
sustancias peligrosas<br />
110300 Lodos y sólidos <strong>de</strong> procesos <strong>de</strong> temple<br />
110301<br />
110302<br />
110500<br />
Residuos que contienen cianuro<br />
Otros <strong>residuos</strong><br />
Residuos <strong>de</strong> procesos <strong>de</strong> galvanización en caliente<br />
52,40<br />
53,91<br />
38,25<br />
42,48<br />
-14,15<br />
-11,43<br />
-27,01%<br />
-21,21%<br />
110503 Residuos sólidos <strong>de</strong> tratamientos <strong>de</strong> gases 0,00 130,91 130,91<br />
110504 Fun<strong>de</strong>ntes usados 77,44 0,00<br />
-77,44<br />
TOTALES 92.856,38 104.228,44 11.372,06 12,25%<br />
-2,89<br />
41,61 15,75 -25,86 -62,14%<br />
Pág. 51
<strong>Inventario</strong> <strong>de</strong> Residuos Peligrosos <strong>de</strong> <strong>la</strong> <strong>CAPV</strong> – Año <strong>2004</strong><br />
Por gestor<br />
68.403,01<br />
35.825,43<br />
Vasco<br />
No Vasco<br />
Por TH<br />
35.238,96<br />
14.675,97<br />
54.313,51<br />
Araba<br />
Gipuzkoa<br />
Bizkaia<br />
Eliminación<br />
Incineracion<br />
Valor. Energ.<br />
Recic<strong>la</strong>je<br />
Por tratamiento<br />
40.869,63<br />
60,04<br />
63.298,78<br />
0% 20% 40% 60% 80% 100%<br />
Figura 42. Cantidad <strong>de</strong> <strong>residuos</strong> <strong>de</strong>l LER 11 por origen <strong>de</strong> gestor, Territorio Histórico y tratamiento. Datos en Tm/año.<br />
Tm/año<br />
100.000<br />
75.000<br />
50.000<br />
100%<br />
80%<br />
60%<br />
40%<br />
%<br />
25.000<br />
0<br />
92.193<br />
88.511<br />
90.408<br />
92.856<br />
104.228<br />
2000 2001 2002 2003 <strong>2004</strong><br />
Tm/año %Valorización % Gestión <strong>CAPV</strong><br />
20%<br />
0%<br />
Figura 43. Evolución 2000-<strong>2004</strong> <strong>de</strong> <strong>la</strong> generación <strong>de</strong> <strong>residuos</strong> <strong>de</strong>l LER 11 (cantidad, % valorización, % gestión <strong>CAPV</strong>)<br />
Pág. 52
<strong>Inventario</strong> <strong>de</strong> Residuos Peligrosos <strong>de</strong> <strong>la</strong> <strong>CAPV</strong> – Año <strong>2004</strong><br />
4.12 LER 12: RESIDUOS DEL MOLDEADO DE METALES Y PLÁSTICOS<br />
La gestión durante <strong>2004</strong> <strong>de</strong> 734,00 Tm. <strong>de</strong> lodos <strong>de</strong> mecanizado y 558,37 Tm. <strong>de</strong> ta<strong>la</strong>drinas más<br />
que en 2003 explica prácticamente el comportamiento <strong>de</strong> este LER que engloba los <strong>residuos</strong> <strong>de</strong>l<br />
mecanizado <strong>de</strong> metales.<br />
El reparto territorial se mantiene constante (Araba 18,50%; Gipuzkoa 33,97%; Bizkaia 47,53%),<br />
aunque se <strong>de</strong>tecta un ligero incremento <strong>de</strong> <strong>la</strong> cantidad proce<strong>de</strong>nte <strong>de</strong> Araba en <strong>de</strong>trimento <strong>de</strong><br />
Bizkaia.<br />
El porcentaje <strong>de</strong> valorización se mantiene estable (16,60%) mientras que el ratio <strong>de</strong> tratamiento en<br />
<strong>la</strong> <strong>CAPV</strong> <strong>de</strong>scien<strong>de</strong> ligeramente hasta el 50,60% (54,33% en 2003).<br />
Tab<strong>la</strong> 24. Resultados <strong>de</strong>l LER 12 en <strong>2004</strong> y evolución 2003-<strong>2004</strong>. Datos en Tm/año.<br />
CER DESCRIPCIÓN 2003 (Tm ) <strong>2004</strong> (Tm ) DIF. 04-03 %<br />
120000 RESIDUOS DEL MOLDEA DO Y DEL TRA TA MIENTO FÍSICO Y MECÁ NICO DE SUPERFICIE DE META LES Y PLÁ STICOS<br />
120100 Residuos <strong>de</strong>l mol<strong>de</strong>ado y tratamiento físico y mecánico <strong>de</strong> superficie <strong>de</strong> metales y plásticos<br />
120106 Aceites minerales <strong>de</strong> mecanizado que contienen halógenos (excepto <strong>la</strong>s 142,73 178,90 36,17 25,34%<br />
emulsiones o disoluciones)<br />
120107 Aceites minerales <strong>de</strong> mecanizado sin halógenos (excepto <strong>la</strong>s<br />
1.661,38 1.405,23 -256,15 -15,42%<br />
emulsiones o disoluciones)<br />
120108 Emulsiones y disoluciones <strong>de</strong> mecanizado que contienen halógenos 53,63 71,68 18,05 33,65%<br />
120109 Emulsiones y disoluciones <strong>de</strong> mecanizado sin halógenos 10.927, 51 11.485,88 558,37 5,11%<br />
120112 Ceras y grasas usadas 231, 77 277,39 45,62 19,68%<br />
120114 Lodos <strong>de</strong> mecanizado que contienen sustancias peligrosas 3.134, 16 3.868,17 734,00 23,42%<br />
120116 Residuos <strong>de</strong> granal<strong>la</strong>do o chorreado que contienen sustancias 127, 29 105,58 -21,71 -17,05%<br />
120118 Lodos metálicos (Iodos <strong>de</strong> esmeri<strong>la</strong>do, rectificado y <strong>la</strong>peado) que<br />
718, 39 820,43 102,04 14,20%<br />
contienen aceites<br />
120120 Mue<strong>la</strong>s y materiales <strong>de</strong> esmeri<strong>la</strong>do usados que contienen sustancias<br />
3, 76 31,08 27,33 727,36%<br />
peligrosas<br />
TOTALES 17.000, 61 18.244,33 1. 243,72 7,32%<br />
Por gestor<br />
9.232,52<br />
9.011,81<br />
Vasco<br />
No Vasco<br />
Por TH<br />
3.375,30<br />
6.197,08 8.671,95<br />
Araba<br />
Gipuzkoa<br />
Bizkaia<br />
Por tratamiento<br />
14.965,53<br />
250,57<br />
368,10<br />
2.660,12<br />
Eliminación<br />
Incineracion<br />
Valor. Energ.<br />
Recic<strong>la</strong>je<br />
0% 20% 40% 60% 80% 100%<br />
Figura 44. Cantidad <strong>de</strong> <strong>residuos</strong> <strong>de</strong>l LER 12 por origen <strong>de</strong> gestor, Territorio Histórico y tratamiento. Datos en Tm/año.<br />
Pág. 53
<strong>Inventario</strong> <strong>de</strong> Residuos Peligrosos <strong>de</strong> <strong>la</strong> <strong>CAPV</strong> – Año <strong>2004</strong><br />
20.000<br />
100%<br />
17.500<br />
15.000<br />
80%<br />
Tm/año<br />
12.500<br />
10.000<br />
7.500<br />
5.000<br />
2.500<br />
17.196<br />
16.857<br />
18.199<br />
17.001<br />
18.244<br />
60%<br />
%<br />
40%<br />
20%<br />
0<br />
2000 2001 2002 2003 <strong>2004</strong><br />
Tm/año %Valorización % Gestión <strong>CAPV</strong><br />
0%<br />
Figura 45. Evolución 2000-<strong>2004</strong> <strong>de</strong> <strong>la</strong> generación <strong>de</strong> <strong>residuos</strong> <strong>de</strong>l LER 12 (cantidad, % valorización, % gestión <strong>CAPV</strong>)<br />
Pág. 54
<strong>Inventario</strong> <strong>de</strong> Residuos Peligrosos <strong>de</strong> <strong>la</strong> <strong>CAPV</strong> – Año <strong>2004</strong><br />
4.13 LER 13: RESIDUOS DE ACEITES NO COMESTIBLES<br />
El comportamiento <strong>de</strong> <strong>la</strong> gestión <strong>de</strong> los aceites industriales usados experimenta durante <strong>2004</strong><br />
ciertas variaciones significativas.<br />
Así, <strong>la</strong> cantidad generada aumenta un 10,24% (+2.129,50 Tm), lo que se valora positivamente<br />
teniendo en cuenta <strong>la</strong> atomización que caracteriza <strong>la</strong> generación <strong>de</strong> este residuo.<br />
Por su parte, <strong>la</strong> tasa <strong>de</strong> gestión en <strong>la</strong> <strong>CAPV</strong> experimenta un incremento <strong>de</strong> 12,03 puntos<br />
porcentuales (54,47% en 2003; 66,50% en <strong>2004</strong>), mientras que el ratio <strong>de</strong> valorización <strong>de</strong>scien<strong>de</strong><br />
<strong>de</strong>l 66,51% al 58,90%, recuperándose valores propios <strong>de</strong> 2001 y 2002.<br />
A nivel territorial los cambios son menos perceptibles, aunque se registra una disminución <strong>de</strong>l<br />
peso <strong>de</strong> Araba en favor <strong>de</strong> Gipuzkoa.<br />
Tab<strong>la</strong> 25. Resultados <strong>de</strong>l LER 13 en <strong>2004</strong> y evolución 2003-<strong>2004</strong>. Datos en Tm/año.<br />
CER DESCRIPCIÓN 2003 (Tm ) <strong>2004</strong> (Tm ) DIF. 04-03 %<br />
130000<br />
130100<br />
RESIDUOS DE ACEITES Y DE COMBUSTIBLES LÍQUIDOS (excepto los aceites comestibles y los <strong>de</strong> los capítulos 05 12 y 19)<br />
Residuos <strong>de</strong> aceites hidráulicos<br />
130104 Emulsiones cloradas 0,00 9,00 9,00<br />
130105 Emulsiones no cloradas 437,22 412,80 -24,42<br />
-5,58%<br />
130109 Aceites hidráulicos minerales clorados 0,51 9,76 9,25 1813,33%<br />
130110 Aceites hidráulicos minerales no clorados 212,35 537,23 324,89 153,00%<br />
130200<br />
130204<br />
Residuos <strong>de</strong> aceites <strong>de</strong> motor, <strong>de</strong> transmisión mecánica y lubricantes<br />
Aceites minerales clorados <strong>de</strong> motor, <strong>de</strong> transmisión mecánica y<br />
9,93 13,02 3,10 31,20%<br />
lubricantes<br />
130205 Aceites minerales no clorados <strong>de</strong> motor, <strong>de</strong> transmisión mecánica y<br />
8.369,54 8.835,75 466,21 5,57%<br />
lubricantes<br />
130300<br />
130301<br />
Residuos <strong>de</strong> aceites <strong>de</strong> ais<strong>la</strong>miento y transmisión <strong>de</strong> calor<br />
Aceites <strong>de</strong> ais<strong>la</strong>miento y transmisión <strong>de</strong> calor que contienen PCB 795,31 426,41 -368,91 -46,38%<br />
130306 Aceites minerales clorados <strong>de</strong> ais<strong>la</strong>miento y transmisión <strong>de</strong> calor,<br />
4,08 4,83 0,76 18,53%<br />
distintos <strong>de</strong> los especificados en el código 1303031<br />
130307 Aceites minerales no clorados <strong>de</strong> ais<strong>la</strong>miento y transmisión <strong>de</strong> calor 271,80 79,88 -191,92 -70,61%<br />
130308 Aceites sintéticos <strong>de</strong> ais<strong>la</strong>miento y transmisión <strong>de</strong> calor 3,49 3,89 0,40 135,38%<br />
130400<br />
130402<br />
Aceites <strong>de</strong> sentinas<br />
Aceites <strong>de</strong> sentinas recogidos en muelles 2.462,21 1.584,40 -877,80 -35,65%<br />
130500<br />
130502<br />
Restos <strong>de</strong> separadores <strong>de</strong> agua/sustancias aceitosas<br />
Lodos <strong>de</strong> separadores <strong>de</strong> agua/sustancias aceitosas 1.626,97 1.681,79 54,82 3,37%<br />
130506 Aceites proce<strong>de</strong>ntes <strong>de</strong> separadores <strong>de</strong> agua/sustancias aceitosas 413,56 445,24 31,68 7,66%<br />
130507 Agua aceitosa proce<strong>de</strong>nte <strong>de</strong> separadores <strong>de</strong> agua/sustancias 3.406,57 4.014,87 608,30 17,86%<br />
130700<br />
130701<br />
Residuos <strong>de</strong> combustibles líquidos<br />
Fuel oil y gasóleo 449,53 1.097,20 647,67 144,08%<br />
130702 Gasolina 2,29 2,95 0,66 28,85%<br />
130703 Otros combustibles (incluidas mezc<strong>la</strong>s) 175,32 22,86 -152,46 -86,96%<br />
130800<br />
130802<br />
Residuos <strong>de</strong> aceites no especificados en otra categoría<br />
Otras emulsiones 1.751,16 3.429,62 1.678,46 95,85%<br />
130899 Residuos no especificados en otra categoría 395,82 305,64 -90,19 -22,78%<br />
TOTALES 20.787,65 22.917,14 2.129,50 10,24%<br />
Pág. 55
<strong>Inventario</strong> <strong>de</strong> Residuos Peligrosos <strong>de</strong> <strong>la</strong> <strong>CAPV</strong> – Año <strong>2004</strong><br />
Por gestor<br />
15.240,61<br />
7.676,53<br />
Vasco<br />
No Vasco<br />
Por TH<br />
4.423,32<br />
7.287,90<br />
11.205,93<br />
Araba<br />
Gipuzkoa<br />
Bizkaia<br />
Por tratamiento<br />
8.964,78<br />
454,02<br />
3.141,35<br />
10.357,00<br />
Eliminación<br />
Incineracion<br />
Valor. Energ.<br />
Recic<strong>la</strong>je<br />
0% 20% 40% 60% 80% 100%<br />
Figura 46. Cantidad <strong>de</strong> <strong>residuos</strong> <strong>de</strong>l LER 13 por origen <strong>de</strong> gestor, Territorio Histórico y tratamiento. Datos en Tm/año.<br />
25.000<br />
100%<br />
20.000<br />
80%<br />
Tm/año<br />
15.000<br />
10.000<br />
5.000<br />
16.146<br />
17.028<br />
16.748<br />
20.788<br />
22.917<br />
60%<br />
%<br />
40%<br />
20%<br />
0<br />
2000 2001 2002 2003 <strong>2004</strong><br />
Tm/año %Valorización % Gestión <strong>CAPV</strong><br />
0%<br />
Figura 47. Evolución 2000-<strong>2004</strong> <strong>de</strong> <strong>la</strong> generación <strong>de</strong> <strong>residuos</strong> <strong>de</strong>l LER 13 (cantidad, % valorización, % gestión <strong>CAPV</strong>)<br />
Pág. 56
<strong>Inventario</strong> <strong>de</strong> Residuos Peligrosos <strong>de</strong> <strong>la</strong> <strong>CAPV</strong> – Año <strong>2004</strong><br />
4.14 LER 14: RESIDUOS DE DISOLVENTES<br />
El comportamiento <strong>de</strong> los disolventes orgánicos englobados en el LER 14 observado durante <strong>2004</strong><br />
confirma el pau<strong>la</strong>tino <strong>de</strong>scenso en <strong>la</strong> producción registrado en los últimos años, <strong>de</strong>scenso que se<br />
centra en el LER 140603 correspondiente a los disolventes no halogenados. Así, en <strong>2004</strong> se han<br />
generado un total <strong>de</strong> 1.822,81 Tm. <strong>de</strong> disolventes orgánicos, un 18,03% menos que en el año<br />
anterior.<br />
A nivel territorial, este <strong>de</strong>scenso repercute fundamentalmente en Araba, que ve reducida su<br />
aportación <strong>de</strong>l 32,27% al 23,83%.<br />
La proporción <strong>de</strong> disolventes valorizados se mantiene en el 80,95%, mientras que mejora<br />
notablemente el porcentaje <strong>de</strong> disolventes tratados en <strong>la</strong> <strong>CAPV</strong> (27,41% en 2003; 36,83% en<br />
<strong>2004</strong>).<br />
Tab<strong>la</strong> 26. Resultados <strong>de</strong>l LER 14 en <strong>2004</strong> y evolución 2003-<strong>2004</strong>. Datos en Tm/año.<br />
CER DESCRIPCIÓN 2003 (Tm ) <strong>2004</strong> (Tm ) DIF. 04-03 %<br />
140000 RESIDUOS DE DISOLVENTES, REFRIGERANTES Y PROPELENTES ORGÁNICOS (excepto los <strong>de</strong> los capítulos 07 y 08)<br />
140600 Residuos <strong>de</strong> disolventes, refrigerantes y propelentes <strong>de</strong> espuma y aerosoles orgánicos<br />
140601 Clorofluorocarburos, HCFC, HFC 0,92 0,93 0,01 0,87%<br />
140602 Otros disolventes y mezc<strong>la</strong>s <strong>de</strong> disolventes halogenados 378,10 335,16 -42,94 -11,36%<br />
140603 Otros disolventes y mezc<strong>la</strong>s <strong>de</strong> disolventes 1.660,52 1.358, 99 -301,54 -18,16%<br />
140604 Lodos o <strong>residuos</strong> sólidos que contienen disolventes halogenados 37,74 57, 78 20,04 53,09%<br />
140605 Lodos o <strong>residuos</strong> sólidos que contienen otros disolventes 146,56 69, 95 -76,61 -52,27%<br />
TOTALES 2.223,85 1.822, 81 -401,04 -18,03%<br />
Por gestor<br />
671,29<br />
1.151,52<br />
Vasco<br />
No Vasco<br />
Por TH<br />
434,34<br />
652,32<br />
736,15<br />
Araba<br />
Gipuzkoa<br />
Bizkaia<br />
Por tratamiento<br />
253,64<br />
93,59<br />
67,65<br />
1.407,93<br />
Eliminación<br />
Incineracion<br />
Valor. Energ.<br />
Recic<strong>la</strong>je<br />
0% 20% 40% 60% 80% 100%<br />
Figura 48. Cantidad <strong>de</strong> <strong>residuos</strong> <strong>de</strong>l LER 14 por origen <strong>de</strong> gestor, Territorio Histórico y tratamiento. Datos en Tm/año.<br />
Pág. 57
<strong>Inventario</strong> <strong>de</strong> Residuos Peligrosos <strong>de</strong> <strong>la</strong> <strong>CAPV</strong> – Año <strong>2004</strong><br />
3.000<br />
100%<br />
2.500<br />
80%<br />
Tm/año<br />
2.000<br />
1.500<br />
1.000<br />
1.800<br />
2.672<br />
2.597<br />
2.224<br />
1.823<br />
60%<br />
40%<br />
%<br />
500<br />
20%<br />
0<br />
2000 2001 2002 2003 <strong>2004</strong><br />
Tm/año %Valorización % Gestión <strong>CAPV</strong><br />
0%<br />
Figura 49. Evolución 2000-<strong>2004</strong> <strong>de</strong> <strong>la</strong> generación <strong>de</strong> <strong>residuos</strong> <strong>de</strong>l LER 14 (cantidad, % valorización, % gestión <strong>CAPV</strong>)<br />
Pág. 58
<strong>Inventario</strong> <strong>de</strong> Residuos Peligrosos <strong>de</strong> <strong>la</strong> <strong>CAPV</strong> – Año <strong>2004</strong><br />
4.15 LER 15: RESIDUOS DE ENVASES, TRAPOS Y ROPAS DE PROTECCIÓN<br />
Un año más aumenta <strong>la</strong> incorporación al circuito autorizado <strong>de</strong> gestión <strong>de</strong> <strong>residuos</strong> <strong>de</strong> envases y<br />
absorbentes contaminados con sustancias peligrosas (+29,02%), lo que se valora como muy<br />
positivo <strong>de</strong>bido a <strong>la</strong> naturaleza <strong>de</strong> estas corrientes, <strong>de</strong> producción muy atomizada y con cierta<br />
ten<strong>de</strong>ncia a ser gestionados junto con el resto <strong>de</strong> <strong>residuos</strong> no <strong>peligrosos</strong>.<br />
Las insta<strong>la</strong>ciones existentes han sido capaces <strong>de</strong> asumir este incremento, al mantenerse los<br />
niveles <strong>de</strong> valorización (38,13%) y gestión en <strong>la</strong> <strong>CAPV</strong> (54,36%) en niveles simi<strong>la</strong>res a los <strong>de</strong><br />
2003.<br />
Tab<strong>la</strong> 27. Resultados <strong>de</strong>l LER 15 en <strong>2004</strong> y evolución 2003-<strong>2004</strong>. Datos en Tm/año.<br />
CER DESCRIPCIÓN 2003 (Tm ) <strong>2004</strong> (Tm ) DIF. 04-03 %<br />
150000 RESIDUOS DE ENVASES; ABSORBENTES, TRAPOS DE LIMPIEZA; MATERIALES DE FILTRACIÓN Y ROPAS DE PROTECClÓN NO<br />
ESPECIFICA DOS EN OTRA CA TEGORÍA<br />
150100<br />
150110<br />
Envases (incluidos los <strong>residuos</strong> <strong>de</strong> envases <strong>de</strong> <strong>la</strong> recogida selectiva municipal)<br />
Envases que contienen restos <strong>de</strong> sustancias peligrosas o están<br />
3.156,31 3.725,86 569,54 18,04%<br />
contaminados por el<strong>la</strong>s<br />
150200<br />
150202<br />
Absorbentes, materiales <strong>de</strong> filtración, trapos <strong>de</strong> limpieza y ropas protectoras<br />
Absorbentes, materiales <strong>de</strong> filtración (incluidos los filtros <strong>de</strong> aceite no 3.009,35 4.228,96 1.219,61 40,53%<br />
especificados en otra categoría), trapos <strong>de</strong> limpieza y ropas protectoras<br />
contaminados por sustancias peligrosas<br />
TOTALES 6.165,66 7.954,82 1.789,16 29,02%<br />
Por gestor<br />
Por TH<br />
Por tratamiento<br />
4.324,62<br />
3.630,20<br />
2.546,99 2.162,65 3.245,17<br />
4.915,42<br />
6,16<br />
124,26<br />
2.908,98<br />
Vasco<br />
No Vasco<br />
Araba<br />
Gipuzkoa<br />
Bizkaia<br />
Eliminación<br />
Incineracion<br />
Valor. Energ.<br />
Recic<strong>la</strong>je<br />
0% 20% 40% 60% 80% 100%<br />
Figura 50. Cantidad <strong>de</strong> <strong>residuos</strong> <strong>de</strong>l LER 15 por origen <strong>de</strong> gestor, Territorio Histórico y tratamiento. Datos en Tm/año.<br />
Pág. 59
<strong>Inventario</strong> <strong>de</strong> Residuos Peligrosos <strong>de</strong> <strong>la</strong> <strong>CAPV</strong> – Año <strong>2004</strong><br />
8.000<br />
100%<br />
Tm/año<br />
6.000<br />
4.000<br />
80%<br />
60%<br />
40%<br />
%<br />
2.000<br />
0<br />
2.676<br />
3.444<br />
4.864<br />
6.166<br />
7.955<br />
20%<br />
0%<br />
2000 2001 2002 2003 <strong>2004</strong><br />
Tm/año %Valorización % Gestión <strong>CAPV</strong><br />
Figura 51. Evolución 2000-<strong>2004</strong> <strong>de</strong> <strong>la</strong> generación <strong>de</strong> <strong>residuos</strong> <strong>de</strong>l LER 15 (cantidad, % valorización, % gestión <strong>CAPV</strong>)<br />
Pág. 60
<strong>Inventario</strong> <strong>de</strong> Residuos Peligrosos <strong>de</strong> <strong>la</strong> <strong>CAPV</strong> – Año <strong>2004</strong><br />
4.16 LER 16: RESIDUOS NO ESPECIFICADOS EN OTRA CATEGORÍA<br />
Tras el ligero receso <strong>de</strong> 2002, se confirma <strong>la</strong> ten<strong>de</strong>ncia al alza registrada en el LER 16,<br />
(conformado por <strong>residuos</strong> <strong>de</strong> diversa naturaleza sin grupo propio), al generarse durante <strong>2004</strong> un<br />
total <strong>de</strong> 10.235,72 Tm., un 23,77% más que en 2003.<br />
La variación más significativa se <strong>de</strong>tecta en el LER 160708 “Residuos que contienen<br />
hidrocarburos <strong>de</strong>rivados <strong>de</strong> <strong>la</strong> limpieza <strong>de</strong> cisternas <strong>de</strong> transporte y almacenamiento” (+1.028,23<br />
Tm.), <strong>de</strong>bido fundamentalmente a <strong>la</strong>s tareas <strong>de</strong> mantenimiento realizadas por parte <strong>de</strong> una<br />
empresa <strong>de</strong> distribución <strong>de</strong> hidrocarburos. En cualquier caso, <strong>la</strong> distribución territorial se mantiene<br />
estable (Araba 20,43%; Gipuzkoa 21,07%; Bizkaia 58,50%).<br />
El incremento en <strong>la</strong> cantidad generada no repercute en <strong>la</strong> tasa <strong>de</strong> valorización, que se mantiene<br />
en torno al 54%, mientras que aumenta favorablemente <strong>la</strong> opción <strong>de</strong> tratamiento en <strong>la</strong> <strong>CAPV</strong>,<br />
adoptada por un 45,21% <strong>de</strong> los <strong>residuos</strong> <strong>de</strong> este grupo.<br />
Pág. 61
<strong>Inventario</strong> <strong>de</strong> Residuos Peligrosos <strong>de</strong> <strong>la</strong> <strong>CAPV</strong> – Año <strong>2004</strong><br />
Tab<strong>la</strong> 28. Resultados <strong>de</strong>l LER 16 en <strong>2004</strong> y evolución 2003-<strong>2004</strong>. Datos en Tm/año.<br />
CER DESCRIPCIÓN 2003 (Tm ) <strong>2004</strong> (Tm ) DIF. 04-03 %<br />
160000 RESIDUOS NO ESPECIFICA DOS EN OTRO CA PÍTULO DE LA LISTA<br />
160100 Vehículos <strong>de</strong> diferentes medios <strong>de</strong> transporte (incluidas <strong>la</strong>s máquinas no <strong>de</strong> carretera) al final <strong>de</strong> su vida útil y <strong>residuos</strong> <strong>de</strong>l <strong>de</strong>sguace <strong>de</strong><br />
vehículos al final <strong>de</strong> su vida útil y <strong>de</strong>l mantenimiento <strong>de</strong> vehículos (excepto los <strong>de</strong> los capítulos 13, 14 y los subcap<br />
160107 Filtros <strong>de</strong> aceite 184,84 270,74 85,89 46,47%<br />
160113 Líquidos <strong>de</strong> frenos 11,99 18,53 6,54 54,57%<br />
160114 Anticonge<strong>la</strong>ntes que contienen sustancias peligrosas 77,55 172,93 95,38 123,00%<br />
160121 Componentes <strong>peligrosos</strong> distintos <strong>de</strong> los especificados en los códigos<br />
5,53 13,50 7,97 144,20%<br />
16 01 07 a 16 01 11. 16 01 13 y 16 01 14<br />
160200<br />
160209<br />
Residuos <strong>de</strong> equipos eléctricos y electrónicos<br />
Transformadores y con<strong>de</strong>nsadores que contienen PCB 441,14 72,34 -368,80 -83,60%<br />
160213 Equipos <strong>de</strong>sechados que contienen componentes <strong>peligrosos</strong> (2),<br />
92,05 401,86 309,81 336,56%<br />
distintos <strong>de</strong> los especificados en los códigos 16 02 09 y 16 02 12<br />
160215 Componentes <strong>peligrosos</strong> retirados <strong>de</strong> equipos <strong>de</strong>sechados 1.220,99 1.523,54 302,55 24,78%<br />
160300<br />
160303<br />
Lotes <strong>de</strong> productos fuera <strong>de</strong> especificación y productos no utilizados<br />
Residuos inorgánicos que contienen sustancias peligrosas 17,02 18,15 1,13 6,63%<br />
160305 Residuos orgánicos que contienen sustancias peligrosas 29,08 37,60 8,52 29,29%<br />
160500<br />
160504<br />
Gases en recipientes a presión y productos químicos <strong>de</strong>sechados<br />
Gases en recipientes a presión (incluidos los halones) que contienen<br />
45,42 66,39 20,96 46,15%<br />
sustancias peligrosas<br />
160506 Productos químicos <strong>de</strong> <strong>la</strong>boratorio que consisten en, o contienen,<br />
46,68 91,72 45,05 96,50%<br />
sustancias peligrosas, incluidas <strong>la</strong>s mezc<strong>la</strong>s <strong>de</strong> productos químicos <strong>de</strong><br />
<strong>la</strong>boratorio<br />
160507 Productos químicos inorgánicos <strong>de</strong>sechados que consisten en, o<br />
36,60 119,58 82,98 226,71%<br />
contienen, sustancias peligrosas<br />
160508 Productos químicos orgánicos <strong>de</strong>sechados que consisten en, o<br />
26,65 76,68 50,03 187,74%<br />
contienen, sustancias peligrosas<br />
160600 Pi<strong>la</strong>s y acumu<strong>la</strong>dores<br />
160601<br />
160602<br />
Baterías <strong>de</strong> plomo<br />
Acumu<strong>la</strong>dores <strong>de</strong> Ni-Cd<br />
2.401,36<br />
44,90<br />
2.169,06<br />
66,20<br />
-232,30<br />
21,30<br />
-9,67%<br />
47,45%<br />
160603 Pi<strong>la</strong>s que contienen mercurio 1,02 2,43 1,41 139,01%<br />
160606 Electrolitos <strong>de</strong> pi<strong>la</strong>s y acumu<strong>la</strong>dores recogidos selectivamente 56,27 56,26 -0,01<br />
-0,01%<br />
160700 Residuos <strong>de</strong> <strong>la</strong> limpieza <strong>de</strong> cisternas <strong>de</strong> transporte y almacenamiento y <strong>de</strong> <strong>la</strong> limpieza <strong>de</strong> cubas (excepto los <strong>de</strong> los capítulos 05 y 13)<br />
160708 Residuos que contienen hidrocarburos 2.566,05 3.594,28 1.028,23 40,07%<br />
160709 Residuos que contienen otras sustancias peligrosas 731,47 1.235,48 504,01 68,90%<br />
160800 Catalizadores usados<br />
160802 Catalizadores usados que contienen metales <strong>de</strong> transición (3)<br />
<strong>peligrosos</strong> o compuestos <strong>de</strong> metales <strong>de</strong> transición <strong>peligrosos</strong><br />
196,61 131,91 -64,69 -32,91%<br />
160806 Líquidos usados utilizados como catalizadores 0,00 9,88 9,88<br />
160807 Catalizadores usados contaminados con sustancias peligrosas 29,81 2,63 -27,17 -91,16%<br />
160900 Sustancias oxidantes<br />
160901 Permanganatos, por ejemplo, permanganato potásico 0,00 35,72 35,72<br />
160902 Cromatos, por ejemplo, cromato potásico, dicromato sódico o potásico 0,00 34,88 34,88<br />
160903 Peróxidos, por ejemplo, peróxido <strong>de</strong> hidrógeno 0,50 2,12 1,62 320,63%<br />
161100 Residuos <strong>de</strong> revestimientos <strong>de</strong> hornos y refractarios<br />
161103 Otros revestimientos y refractarios proce<strong>de</strong>ntes <strong>de</strong> procesos<br />
6,20 11,31 5,11 82,42%<br />
metalúrgicos que contienen sustancias peligrosas<br />
TOTALES 8.269,72 10.235,72 1.966,00 23,77%<br />
Pág. 62
<strong>Inventario</strong> <strong>de</strong> Residuos Peligrosos <strong>de</strong> <strong>la</strong> <strong>CAPV</strong> – Año <strong>2004</strong><br />
Por gestor<br />
Por TH<br />
Por tratamiento<br />
4.627,60<br />
5.608,12<br />
2.091,02 2.156,64 5.988,05<br />
4.622,67<br />
29,92<br />
916,12<br />
4.667,00<br />
Vasco<br />
No Vasco<br />
Araba<br />
Gipuzkoa<br />
Bizkaia<br />
Eliminación<br />
Incineracion<br />
Valor. Energ.<br />
Recic<strong>la</strong>je<br />
0% 20% 40% 60% 80% 100%<br />
Figura 52. Cantidad <strong>de</strong> <strong>residuos</strong> <strong>de</strong>l LER 16 por origen <strong>de</strong> gestor, Territorio Histórico y tratamiento. Datos en Tm/año.<br />
12.000<br />
100%<br />
Tm/año<br />
10.000<br />
8.000<br />
6.000<br />
4.000<br />
80%<br />
60%<br />
40%<br />
%<br />
2.000<br />
4.353<br />
6.575<br />
6.515<br />
8.270<br />
10.236<br />
20%<br />
0<br />
0%<br />
2000 2001 2002 2003 <strong>2004</strong><br />
Tm/año %Valorización % Gestión <strong>CAPV</strong><br />
Figura 53. Evolución 2000-<strong>2004</strong> <strong>de</strong> <strong>la</strong> generación <strong>de</strong> <strong>residuos</strong> <strong>de</strong>l LER 16 (cantidad, % valorización, % gestión <strong>CAPV</strong>)<br />
Pág. 63
<strong>Inventario</strong> <strong>de</strong> Residuos Peligrosos <strong>de</strong> <strong>la</strong> <strong>CAPV</strong> – Año <strong>2004</strong><br />
4.17 LER 17: RESIDUOS DE CONSTRUCCIÓN Y DEMOLICIÓN<br />
El comportamiento <strong>de</strong> los <strong>residuos</strong> <strong>de</strong> construcción y <strong>de</strong>molición <strong>de</strong> naturaleza peligrosa queda<br />
totalmente condicionada por <strong>la</strong> dinámica <strong>de</strong> generación <strong>de</strong> tierras contaminadas. Así, durante<br />
<strong>2004</strong> fueron gestionadas un total <strong>de</strong> 122.895,37 Tm. <strong>de</strong> RCD <strong>de</strong> carácter peligroso, <strong>de</strong> <strong>la</strong>s cuales<br />
118.227,74 Tm. correspon<strong>de</strong>n a <strong>la</strong> fracción citada.<br />
El 97,61% <strong>de</strong>l total generado correspon<strong>de</strong> a Bizkaia, al <strong>de</strong>sarrol<strong>la</strong>rse en este Territorio Histórico<br />
una obra <strong>de</strong> promotor no industrial que supone el 90,92% <strong>de</strong>l total <strong>de</strong> tierras contaminadas<br />
generadas a nivel <strong>de</strong> <strong>la</strong> <strong>CAPV</strong>.<br />
La naturaleza <strong>de</strong> los <strong>residuos</strong> contemp<strong>la</strong>dos en este LER hace que únicamente el 0,32% <strong>de</strong> los<br />
mismos reciba tratamientos <strong>de</strong> valorización. Dado que el confinamiento en <strong>de</strong>pósito <strong>de</strong> seguridad<br />
se erige como <strong>la</strong> opción <strong>de</strong> tratamiento mayoritaria, <strong>la</strong> tasa <strong>de</strong> gestión en <strong>la</strong> <strong>CAPV</strong> <strong>de</strong>scien<strong>de</strong> <strong>de</strong>l<br />
16,82% <strong>de</strong> 2003 al 3,72%.<br />
Tab<strong>la</strong> 29. Resultados <strong>de</strong>l LER 17 en <strong>2004</strong> y evolución 2003-<strong>2004</strong>. Datos en Tm/año.<br />
CER DESCRIPCIÓN 2003 (Tm ) <strong>2004</strong> (Tm ) DIF. 04-03 %<br />
170000<br />
170300<br />
RESIDUOS DE LA CONSTRUCCION Y DEMOLIClÓN (INCLUIDA LA TIERRA EXCAVADA DE ZONAS CONTAMINADAS)<br />
Mezc<strong>la</strong>s bituminosas, alquitrán <strong>de</strong> hul<strong>la</strong> y otros productos alquitranados<br />
170303<br />
170500<br />
Alquitrán <strong>de</strong> hul<strong>la</strong> y productos alquitranados<br />
Tierra (incluida <strong>la</strong> excavada <strong>de</strong> zonas contaminadas), piedras y Iodos <strong>de</strong> drenaje<br />
8,86 0,00 -8,86<br />
170503 Tierra y piedras que contienen sustancias peligrosas 19. 674,54 118.227,74 98.553,19 500,92%<br />
170600 Materiales <strong>de</strong> ais<strong>la</strong>miento y materiales <strong>de</strong> construcción que contienen amianto<br />
170601 Materiales <strong>de</strong> ais<strong>la</strong>miento que contienen amianto 254,00 185,59 -68,41 -26,93%<br />
170605 Materiales <strong>de</strong> construcción que contienen amianto 4. 164,30 4.471,43 307,14 7,38%<br />
170900 Otros <strong>residuos</strong> <strong>de</strong> construcción y <strong>de</strong>molición<br />
170902 Residuos <strong>de</strong> construcción y <strong>de</strong>molición que contienen PCBs<br />
170903 Otros <strong>residuos</strong> <strong>de</strong> construcción y <strong>de</strong>molición (incluidos los <strong>residuos</strong><br />
mezc<strong>la</strong>dos) que contienen sustancias peligrosas)<br />
5,41 0,00<br />
20,56 10,62<br />
-5,41<br />
-9,95<br />
-48,37%<br />
TOTALES 24.127,67 122.895,37 98.767,70 409,35%<br />
Por gestor<br />
1.097,62<br />
Por TH<br />
Por tratamiento<br />
4.567,94<br />
1.836,08<br />
118.327,43<br />
119.961,67<br />
122.503,39<br />
391,99<br />
Vasco<br />
No Vasco<br />
Araba<br />
Gipuzkoa<br />
Bizkaia<br />
Eliminación<br />
Incineracion<br />
Valor. Energ.<br />
Recic<strong>la</strong>je<br />
0% 20% 40% 60% 80% 100%<br />
Figura 54. Cantidad <strong>de</strong> <strong>residuos</strong> <strong>de</strong>l LER 17 por origen <strong>de</strong> gestor, Territorio Histórico y tratamiento. Datos en Tm/año.<br />
Pág. 64
<strong>Inventario</strong> <strong>de</strong> Residuos Peligrosos <strong>de</strong> <strong>la</strong> <strong>CAPV</strong> – Año <strong>2004</strong><br />
125.000<br />
100.000<br />
122.895<br />
100%<br />
80%<br />
Tm/año<br />
75.000<br />
50.000<br />
60%<br />
40%<br />
%<br />
24.128<br />
25.000<br />
20%<br />
13.765<br />
5.419<br />
9.176<br />
0<br />
0%<br />
2000 2001 2002 2003 <strong>2004</strong><br />
Tm/año %Valorización % Gestión <strong>CAPV</strong><br />
Figura 55. Evolución 2000-<strong>2004</strong> <strong>de</strong> <strong>la</strong> generación <strong>de</strong> <strong>residuos</strong> <strong>de</strong>l LER 17 (cantidad, % valorización, % gestión <strong>CAPV</strong>)<br />
Pág. 65
<strong>Inventario</strong> <strong>de</strong> Residuos Peligrosos <strong>de</strong> <strong>la</strong> <strong>CAPV</strong> – Año <strong>2004</strong><br />
4.18 LER 18: RESIDUOS MÉDICOS O VETERINARIOS<br />
Se confirma <strong>la</strong> ten<strong>de</strong>ncia <strong>de</strong> suave crecimiento (5,15% en el periodo 2003-<strong>2004</strong>) que en los<br />
últimos años ha caracterizado <strong>la</strong> gestión <strong>de</strong> los <strong>residuos</strong> sanitarios.<br />
La generación <strong>de</strong> este tipo <strong>de</strong> <strong>residuos</strong> se encuentra condicionada por el reparto pob<strong>la</strong>cional, por<br />
lo que <strong>la</strong> aportación <strong>de</strong> cada Territorio Histórico (Araba 13,24%; Gipuzkoa 30,17%; Bizkaia<br />
56,59%) se acerca cada vez más a <strong>la</strong> realidad <strong>de</strong>mográfica vasca.<br />
Por su naturaleza, el tratamiento mayoritario aplicado a los <strong>residuos</strong> sanitarios es <strong>la</strong> incineración<br />
en insta<strong>la</strong>ciones ubicadas fuera <strong>de</strong> <strong>la</strong> <strong>CAPV</strong>, por lo que los ratios <strong>de</strong> valorización (0%) y gestión en<br />
<strong>la</strong> <strong>CAPV</strong> (25,64%) presentan valores bajos en comparación con otras categorías <strong>de</strong> <strong>residuos</strong>.<br />
Tab<strong>la</strong> 30. Resultados <strong>de</strong>l LER 18 en <strong>2004</strong> y evolución 2003-<strong>2004</strong>. Datos en Tm/año.<br />
CER DESCRIPCIÓN 2003 (Tm ) <strong>2004</strong> (Tm ) DIF. 04-03 %<br />
180000 RESIDUOS DE SERVICIOS MÉDICOS 0 VETERINARIOS 0 DE INVÉSTIGAClÓN ASOCIADA (salvo los <strong>residuos</strong> <strong>de</strong> cocina y <strong>de</strong> restaurante<br />
no proce<strong>de</strong>ntes directamente <strong>de</strong> <strong>la</strong> prestación <strong>de</strong> cuidados sanitarios)<br />
180100 Residuos <strong>de</strong> maternida<strong>de</strong>s, <strong>de</strong>l diagnóstico, tratamiento o prevención <strong>de</strong> enfermeda<strong>de</strong>s humanas<br />
180103 Residuos cuya recogida y eliminación es objeto <strong>de</strong> requisitos especiales 1.222,96 1.293,52 70,56 5,77%<br />
para prevenir infecciones<br />
180108 Medicamentos citotóxicos y citostáticos 83,19 79,86 -3,33 -4,01%<br />
TOTALES 1.306,15 1.373,38 67,23 5,15%<br />
Por gestor<br />
352,20<br />
1.021,18<br />
Vasco<br />
No Vasco<br />
Por TH<br />
181,84<br />
414,31 777,23<br />
Araba<br />
Gipuzkoa<br />
Bizkaia<br />
Por tratamiento<br />
229,13<br />
1.144,25<br />
Eliminación<br />
Incineracion<br />
Valor. Energ.<br />
Recic<strong>la</strong>je<br />
0% 20% 40% 60% 80% 100%<br />
Figura 56. Cantidad <strong>de</strong> <strong>residuos</strong> <strong>de</strong>l LER 18 por origen <strong>de</strong> gestor, Territorio Histórico y tratamiento. Datos en Tm/año.<br />
Pág. 66
<strong>Inventario</strong> <strong>de</strong> Residuos Peligrosos <strong>de</strong> <strong>la</strong> <strong>CAPV</strong> – Año <strong>2004</strong><br />
1.500<br />
100%<br />
1.250<br />
80%<br />
Tm/año<br />
1.000<br />
750<br />
500<br />
1.156<br />
1.244<br />
1.272<br />
1.306<br />
1.373<br />
60%<br />
40%<br />
%<br />
250<br />
20%<br />
0<br />
0%<br />
2000 2001 2002 2003 <strong>2004</strong><br />
Tm/año %Valorización % Gestión <strong>CAPV</strong><br />
Figura 57. Evolución 2000-<strong>2004</strong> <strong>de</strong> <strong>la</strong> generación <strong>de</strong> <strong>residuos</strong> <strong>de</strong>l LER 18 (cantidad, % valorización, % gestión <strong>CAPV</strong>)<br />
Pág. 67
<strong>Inventario</strong> <strong>de</strong> Residuos Peligrosos <strong>de</strong> <strong>la</strong> <strong>CAPV</strong> – Año <strong>2004</strong><br />
4.19 LER 19: RESIDUOS DE INSTALACIONES DE TRATAMIENTO DE RESIDUOS O<br />
AGUA<br />
Los <strong>residuos</strong> <strong>peligrosos</strong> proce<strong>de</strong>ntes <strong>de</strong> insta<strong>la</strong>ciones <strong>de</strong> tratamiento <strong>de</strong> <strong>residuos</strong> o <strong>de</strong> agua<br />
experimentaron durante <strong>2004</strong> un incremento muy notable, hasta alcanzar <strong>la</strong>s 10.676,81 Tm.,<br />
6.398,66 Tm. más que en 2003.<br />
Esta variación se <strong>de</strong>be a <strong>la</strong> incorporación al circuito <strong>de</strong> gestión <strong>de</strong> los polvos <strong>de</strong> <strong>de</strong>puración <strong>de</strong><br />
gases <strong>de</strong> una nueva insta<strong>la</strong>ción <strong>de</strong> tratamiento <strong>de</strong> <strong>residuos</strong> y <strong>de</strong> los lixiviados proce<strong>de</strong>ntes <strong>de</strong> una<br />
insta<strong>la</strong>ción ya existente que ha modificado el sistema <strong>de</strong> gestión <strong>de</strong> dichos lixiviados <strong>de</strong>bido al<br />
aumento <strong>de</strong> <strong>la</strong> concentración <strong>de</strong> contaminantes en los mismos.<br />
La ubicación en Bizkaia <strong>de</strong> <strong>la</strong>s dos insta<strong>la</strong>ciones citadas implica que el porcentaje <strong>de</strong> generación<br />
<strong>de</strong> este Territorio Histórico ascien<strong>de</strong> hasta alcanzar el 61,08%.<br />
La naturaleza <strong>de</strong> los <strong>residuos</strong> hace que los tratamientos <strong>de</strong> eliminación, que incluyen también <strong>la</strong><br />
estabilización-solidificación, sean los <strong>de</strong> aplicación mayoritaria, siendo valorizado únicamente un<br />
2,11%.<br />
Prácticamente dos terceras partes (65,93%) <strong>de</strong> los <strong>residuos</strong> generados son gestionados por<br />
insta<strong>la</strong>ciones ubicadas en <strong>la</strong> <strong>CAPV</strong>.<br />
Tab<strong>la</strong> 31. Resultados <strong>de</strong>l LER 19 en <strong>2004</strong> y evolución 2003-<strong>2004</strong>. Datos en Tm/año.<br />
CER DESCRIPCIÓN 2003 (Tm ) <strong>2004</strong> (Tm ) DIF. 04-03 %<br />
190000 RESIDUOS DE LA S INSTA LA CIONES PA RA EL TRA TA MIENTO DE RESIDUOS, DE LA S PLA NTA S EXTERNA S DE TRA TA MIENTO DE<br />
A GUA S RESIDUA LES Y DE LA PREPA RA ClÓN DE A GUA PA RA CONSUMO HUMA NO Y DE A GUA PA RA USO INDUSTRIA L<br />
190100<br />
190105<br />
Residuos <strong>de</strong> <strong>la</strong> incineración o pirólisis <strong>de</strong> <strong>residuos</strong><br />
Tortas <strong>de</strong> filtración <strong>de</strong>l tratamiento <strong>de</strong> gases 0,00 8,26 8,26<br />
190107 Residuos sólidos <strong>de</strong>l tratamiento <strong>de</strong> gases 0,00 3.321,52 3.321,52<br />
190111 Cenizas <strong>de</strong> fondo <strong>de</strong> horno y escorias que contienen sustancias<br />
46,08 45,84 -0,24 -0,52%<br />
peligrosas<br />
190200 Residuos <strong>de</strong> tratamientos físicoquímicos <strong>de</strong> <strong>residuos</strong> (incluidas <strong>la</strong> <strong>de</strong>scromatación, <strong>de</strong>scianuración y neutralización)<br />
190205 Lodos <strong>de</strong> tratamientos fisicoquímicos que contienen sustancias<br />
683,39 692,73 9,34 1,37%<br />
peligrosas<br />
190207 Aceites y concentrados proce<strong>de</strong>ntes <strong>de</strong>l proceso <strong>de</strong> separación 211,48 246,44 34,96 16,53%<br />
190211 Otros <strong>residuos</strong> que contienen sustancias peligrosas 0,00 12,48 12,48<br />
190700<br />
190702<br />
Lixiviados <strong>de</strong> verte<strong>de</strong>ro<br />
Lixiviados <strong>de</strong> verte<strong>de</strong>ro que contienen sustancias peligrosas 233,16 2.959,47 2.726,31 1169,29%<br />
190800 Residuos <strong>de</strong> p<strong>la</strong>ntas <strong>de</strong> tratamiento <strong>de</strong> aguas residuales no especificados en otra categoría<br />
190806 Resinas intercambiadoras <strong>de</strong> iones saturadas o usadas 13,44 22,86 9,41 70,03%<br />
190810 Mezc<strong>la</strong>s <strong>de</strong> grasas y aceites proce<strong>de</strong>ntes <strong>de</strong> <strong>la</strong> separación <strong>de</strong><br />
96,84 205,66 108,82 112,37%<br />
aguas/sustancias aceitosas<br />
190813 Lodos que contienen sustancias peligrosas proce<strong>de</strong>ntes <strong>de</strong> otros<br />
2.993,76 3.137,70 143,94 4,81%<br />
tratamientos <strong>de</strong> aguas residuales industriales<br />
191200<br />
191211<br />
Residuos <strong>de</strong>l tratamiento mecánico <strong>de</strong> <strong>residuos</strong><br />
Otros <strong>residuos</strong> (incluidas mezc<strong>la</strong>s <strong>de</strong> materiales) proce<strong>de</strong>ntes <strong>de</strong>l<br />
0,00 23,86 23,86<br />
tratamiento mecánico <strong>de</strong> <strong>residuos</strong> que contienen sustancias peligrosas<br />
TOTALES 4.278,15 10.676,81 6.398,66 149,57%<br />
Pág. 68
<strong>Inventario</strong> <strong>de</strong> Residuos Peligrosos <strong>de</strong> <strong>la</strong> <strong>CAPV</strong> – Año <strong>2004</strong><br />
Por gestor<br />
7.039,09<br />
3.637,72<br />
Vasco<br />
No Vasco<br />
Por TH<br />
3.719,55<br />
436,34<br />
6.520,92<br />
Araba<br />
Gipuzkoa<br />
Bizkaia<br />
Por tratamiento<br />
10.451,16<br />
225,65<br />
Eliminación<br />
Incineracion<br />
Valor. Energ.<br />
Recic<strong>la</strong>je<br />
0% 20% 40% 60% 80% 100%<br />
Figura 58. Cantidad <strong>de</strong> <strong>residuos</strong> <strong>de</strong>l LER 19 por origen <strong>de</strong> gestor, Territorio Histórico y tratamiento. Datos en Tm/año.<br />
12.000<br />
100%<br />
Tm/año<br />
10.000<br />
8.000<br />
6.000<br />
4.000<br />
80%<br />
60%<br />
40%<br />
%<br />
2.000<br />
0<br />
2.810<br />
3.458<br />
3.998<br />
4.278<br />
10.677<br />
20%<br />
0%<br />
2000 2001 2002 2003 <strong>2004</strong><br />
Tm/año %Valorización % Gestión <strong>CAPV</strong><br />
Figura 59. Evolución 2000-<strong>2004</strong> <strong>de</strong> <strong>la</strong> generación <strong>de</strong> <strong>residuos</strong> <strong>de</strong>l LER 19 (cantidad, % valorización, % gestión <strong>CAPV</strong>)<br />
Pág. 69
<strong>Inventario</strong> <strong>de</strong> Residuos Peligrosos <strong>de</strong> <strong>la</strong> <strong>CAPV</strong> – Año <strong>2004</strong><br />
4.20 LER 20: RESIDUOS URBANOS<br />
Durante <strong>2004</strong> se mantiene <strong>la</strong> ten<strong>de</strong>ncia alcista que en los últimos años ha caracterizado a los<br />
<strong>residuos</strong> <strong>peligrosos</strong> <strong>de</strong> origen urbano o asimi<strong>la</strong>ble, al gestionarse 2.639,07 Tm., un 21,64% más<br />
que en 2003.<br />
Este incremento es más evi<strong>de</strong>nte en <strong>la</strong> corriente <strong>de</strong> baterías y acumu<strong>la</strong>dores, aunque también los<br />
<strong>residuos</strong> <strong>de</strong> aparatos eléctricos y electrónicos y, en menor medida, <strong>la</strong>s fluorescentes agotadas<br />
registran mayores volumenes <strong>de</strong> gestión. La atomización en <strong>la</strong> producción que caracteriza a estos<br />
<strong>residuos</strong> otorga aún más valor al hecho <strong>de</strong> haber aumentado <strong>la</strong> cantidad gestionada.<br />
Territorialmente se mantiene <strong>la</strong> distribución <strong>de</strong> 2003, aportando Bizkaia un 66,02% <strong>de</strong>l total<br />
generado.<br />
La naturaleza <strong>de</strong> los <strong>residuos</strong> recogidos permite su valorización en un 99,89% <strong>de</strong> los casos,<br />
mientras que el 30,14% recibe tratamiento en insta<strong>la</strong>ciones ubicadas en <strong>la</strong> <strong>CAPV</strong>.<br />
Tab<strong>la</strong> 32. Resultados <strong>de</strong>l LER 20 en <strong>2004</strong> y evolución 2003-<strong>2004</strong>. Datos en Tm/año.<br />
CER DESCRIPCIÓN 2003 (Tm ) <strong>2004</strong> (Tm ) DIF. 04-03 %<br />
200000 RESIDUOS MUNICIPA LES (RESIDUOS DOMÉSTICOS Y RESIDUOS A SIMILA BLES PROCEDENTES DE LOS COMERCIOS, INDUSTRIA S E<br />
INSTITUCIONES), INCLUIDA S LA S FRA CCIONES RECOGIDA S SELECTIV A MENTE<br />
200100 Fracciones recogidas selectivamente (excepto <strong>la</strong>s especificadas en el subcapítulo 15 01)<br />
200121 Tubos fluorescentes y otros <strong>residuos</strong> que contienen mercurio 101,62 137,68 36,06 35,49%<br />
200133 Baterías y acumu<strong>la</strong>dores especificados en los códigos 16 06 01, 16 06 1.435,70 1.733,07 297,37 20,71%<br />
02 o 16 06 03 y baterías y acumu<strong>la</strong>dores sin c<strong>la</strong>sificar que contienen<br />
esas baterías<br />
200135 Equipos eléctricos y electrónicos <strong>de</strong>sechados, distintos <strong>de</strong> los<br />
632,34 768,33 135,99 21,51%<br />
especificados en los códigos 200121 y 200123, que contienen<br />
componentes <strong>peligrosos</strong><br />
TOTALES 2.169,66 2.639,07 469,41 21,64%<br />
Por gestor<br />
Por TH<br />
3,01<br />
Por tratamiento<br />
247,04<br />
795,36<br />
1.843,71<br />
649,74 1.742,29<br />
2.636,07<br />
Vasco<br />
No Vasco<br />
Araba<br />
Gipuzkoa<br />
Bizkaia<br />
Eliminación<br />
Incineracion<br />
Valor. Energ.<br />
Recic<strong>la</strong>je<br />
0% 20% 40% 60% 80% 100%<br />
Figura 60. Cantidad <strong>de</strong> <strong>residuos</strong> <strong>de</strong>l LER 20 por origen <strong>de</strong> gestor, Territorio Histórico y tratamiento. Datos en Tm/año.<br />
Pág. 70
<strong>Inventario</strong> <strong>de</strong> Residuos Peligrosos <strong>de</strong> <strong>la</strong> <strong>CAPV</strong> – Año <strong>2004</strong><br />
3.000<br />
100%<br />
2.500<br />
80%<br />
Tm/año<br />
2.000<br />
1.500<br />
1.000<br />
500<br />
1.266<br />
1.311<br />
1.632<br />
2.170<br />
2.639<br />
60%<br />
%<br />
40%<br />
20%<br />
0<br />
2000 2001 2002 2003 <strong>2004</strong><br />
Tm/año %Valorización % Gestión <strong>CAPV</strong><br />
0%<br />
Figura 61. Evolución 2000-<strong>2004</strong> <strong>de</strong> <strong>la</strong> generación <strong>de</strong> <strong>residuos</strong> <strong>de</strong>l LER 20 (cantidad, % valorización, % gestión <strong>CAPV</strong>)<br />
Pág. 71
<strong>Inventario</strong> <strong>de</strong> Residuos Peligrosos <strong>de</strong> <strong>la</strong> <strong>CAPV</strong> – Año <strong>2004</strong><br />
5. ANÁLISIS DETALLADO DE CIERTOS RESIDUOS<br />
Pág. 72
<strong>Inventario</strong> <strong>de</strong> Residuos Peligrosos <strong>de</strong> <strong>la</strong> <strong>CAPV</strong> – Año <strong>2004</strong><br />
5.1 RESIDUOS DE DISOLVENTES USADOS<br />
En este capítulo se analiza <strong>la</strong> generación global <strong>de</strong> “disolventes usados” y “<strong>residuos</strong> con<br />
disolventes”, agrupando <strong>la</strong>s diferentes corrientes <strong>de</strong> esta naturaleza codificadas en los códigos<br />
LER 07 (química orgánica), 08 (pinturas, barnices y tintas) y 14 (disolventes orgánicos).<br />
Es importante resaltar <strong>la</strong> diferente gestión que se aplica a los disolventes usados (LER 07 y 14),<br />
que son recic<strong>la</strong>dos en gran medida, con respecto a los <strong>residuos</strong> con disolventes (LER 08), que<br />
básicamente consisten en lodos <strong>de</strong> pintura y barniz, a los que mayoritariamente se aplica un<br />
tratamiento para su eliminación.<br />
En <strong>2004</strong> han sido gestionadas 8.155,87 Tm. <strong>de</strong> <strong>residuos</strong> <strong>de</strong> disolventes, un 5,76% más que en<br />
2003. Como principales variaciones <strong>de</strong>stacan el incremento <strong>de</strong> los <strong>residuos</strong> <strong>de</strong> pinturas, ya sean<br />
en forma sólida o como lodos, y el <strong>de</strong>scenso un año más <strong>de</strong> los disolventes puros (LER 140603).<br />
Los disolventes halogenados también ven reducida su cantidad neta en 35,80 Tm, un 8,25%<br />
menos que en el periodo anterior.<br />
Territorialmente, Araba concentra el 37,50% <strong>de</strong> <strong>la</strong> producción, frente a un 32,69% <strong>de</strong> Gipuzkoa y<br />
el 29,81% <strong>de</strong> Bizkaia.<br />
Debido al incremento registrado en los <strong>residuos</strong> <strong>de</strong> pinturas, que reciben mayoritariamente<br />
tratamientos <strong>de</strong> eliminación, <strong>la</strong> tasa <strong>de</strong> valorización <strong>de</strong>scien<strong>de</strong> <strong>de</strong>l 43,81% al 39,35%. El<br />
porcentaje <strong>de</strong> tratamiento en <strong>la</strong> <strong>CAPV</strong> <strong>de</strong>scien<strong>de</strong> ligeramente hasta el 40,14%.<br />
Pág. 73
<strong>Inventario</strong> <strong>de</strong> Residuos Peligrosos <strong>de</strong> <strong>la</strong> <strong>CAPV</strong> – Año <strong>2004</strong><br />
Tab<strong>la</strong> 33. Residuos <strong>de</strong> disolventes inventariados en <strong>2004</strong> y evolución 2000-<strong>2004</strong>.<br />
CER DESCRIPCIÓN 2003 (Tm ) <strong>2004</strong> (Tm ) DIF. 04-03 %<br />
DISOLVENTES HALOGENADOS<br />
070103 Disolventes, líquidos <strong>de</strong> limpieza y licores madre organohalogenados 1,67 0,00 -1,67<br />
070203 Disolventes, líquidos <strong>de</strong> limpieza y licores madre organohalogenados 7,00 0,66 -6,33 -90,54%<br />
070503 Disolventes, líquidos <strong>de</strong> limpieza y licores madre organohalogenados 2,89 1,02 -1,88 -64,85%<br />
070603 Disolventes, líquidos <strong>de</strong> limpieza y licores madre organohalogenados 1,60 0,96 -0,64 -39,94%<br />
070703 Disolventes, líquidos <strong>de</strong> limpieza y licores madre organohalogenados 4,21 1,83 -2,39 -56,68%<br />
140601 Clorofluorocarburos, HCFC, HFC 0,92 0,93 0,01 0,87%<br />
140602 Otros disolventes y mezc<strong>la</strong>s <strong>de</strong> disolventes halogenados 378,10 335,16 -42,94 -11,36%<br />
140604 Lodos o <strong>residuos</strong> sólidos que contienen disolventes halogenados 37,74 57,78 20,04 53,09%<br />
SUBTOTALES HALOGENADOS 434,14 398,34 -35,80 -8,25%<br />
DISOLVENTES NO HALOGENADOS<br />
070104 Otros disolv., líquidos <strong>de</strong> limpieza y licores madre orgánicos 165,53 55,56 -109,96 -66,43%<br />
070204 Otros disolv., líquidos <strong>de</strong> limpieza y licores madre orgánicos 53,74 43,23 -10,52 -19,57%<br />
070304 Otros disolv., líquidos <strong>de</strong> limpieza y licores madre orgánicos 0,63 5,82 5,19 822,35%<br />
070404 Otros disolv., líquidos <strong>de</strong> limpieza y licores madre orgánicos 0,00 8,54 8,54<br />
070504 Otros disolv., líquidos <strong>de</strong> limpieza y licores madre orgánicos 13,54 0,22 -13,31 -98,37%<br />
070604 Otros disolv., líquidos <strong>de</strong> limpieza y licores madre orgánicos 51,53 15,78 -35,75 -69,38%<br />
070704 Otros disolv., líquidos <strong>de</strong> limpieza y licores madre orgánicos 58,55 43,34 -15,21 -25,98%<br />
080111 Residuos <strong>de</strong> pintura y barniz que contienen disolventes orgánicos u 2.056,72 2.829,13 772,41 37,56%<br />
080113 Lodos <strong>de</strong> pintura y barniz que contienen disolventes orgánicos u otras<br />
1.329,69 1.458,05 128,36 9,65%<br />
sustancias peligrosas<br />
080115 Lodos acuosos que contienen pintura o barniz con disolventes<br />
829,43 1.011,54 182,11 21,96%<br />
orgánicos u otras sustancias peligrosas<br />
080117 Residuos <strong>de</strong>l <strong>de</strong>capado o eliminación <strong>de</strong> pintura y barniz que contienen<br />
20,36 22,62 2,25 11,05%<br />
disolventes orgánicos u otras sustancias peligrosas<br />
080119 Suspensiones acuosas que contienen pintura o barniz con disolventes<br />
55,99 23,01 -32,99 -58,91%<br />
orgánicos u otras sustancias peligrosas<br />
080409 Residuos <strong>de</strong> adhesivos y sel<strong>la</strong>ntes que contienen disolventes orgánicos<br />
426,92 529,17 102,26 23,95%<br />
u otras sustancias peligrosas<br />
080411 Lodos <strong>de</strong> adhesivos y sel<strong>la</strong>ntes que contienen disolventes orgánicos u<br />
38,82 38,36 -0,46 -1,18%<br />
otras sustancias peligrosas<br />
080413 Lodos acuosos que contienen adhesivos o sel<strong>la</strong>ntes con disolventes<br />
307,99 244,23 -63,76 -20,70%<br />
orgánicos u otras sustancias peligrosas<br />
080415 Residuos líquidos acuosos que contienen adhesivos o sel<strong>la</strong>ntes con<br />
61,18 0,00<br />
-61,18<br />
disolventes orgánicos u otras sustancias peligrosas<br />
140603 Otros disolventes y mezc<strong>la</strong>s <strong>de</strong> disolventes 1.660,52 1.358,99 -301,54 -18,16%<br />
140605 Lodos o <strong>residuos</strong> sólidos que contienen otros disolventes 146,56 69,95 -76,61 -52,27%<br />
SUBTOTALES NO HALOGENADOS 7.277,70 7.757,53 479,84 6,59%<br />
TOTALES 7.711,83 8.155,87 444,04 5,76%<br />
Pág. 74
<strong>Inventario</strong> <strong>de</strong> Residuos Peligrosos <strong>de</strong> <strong>la</strong> <strong>CAPV</strong> – Año <strong>2004</strong><br />
Por tipo<br />
398<br />
7.758<br />
Halogenado<br />
No halogenado<br />
Vasco<br />
Por gestor<br />
3.274<br />
4.882<br />
No Vasco<br />
Por TH<br />
3.058<br />
2.666<br />
2.431<br />
Araba<br />
Gipuzkoa<br />
Bizkaia<br />
Por tratamiento<br />
4.851<br />
95<br />
482<br />
2.727<br />
Eliminación<br />
Incineracion<br />
Valor. Energ.<br />
Recic<strong>la</strong>je<br />
0% 20% 40% 60% 80% 100%<br />
Figura 62. Cantidad <strong>de</strong> <strong>residuos</strong> <strong>de</strong> disolventes por tipo <strong>de</strong> disolvente, origen <strong>de</strong> gestor, Territorio Histórico y<br />
tratamiento. Datos en Tm/año.<br />
8.000<br />
60%<br />
6.000<br />
50%<br />
40%<br />
Tm/año<br />
4.000<br />
2.000<br />
5.606<br />
563<br />
6.835<br />
681<br />
7.028<br />
443<br />
7.278<br />
434<br />
7.758<br />
398<br />
30%<br />
20%<br />
10%<br />
%<br />
0<br />
0%<br />
2.000 2.001 2.002 2.003 2.004<br />
No halogenados Halogenados % Valorización % Gestión <strong>CAPV</strong><br />
Figura 63. Evolución 2000-<strong>2004</strong> <strong>de</strong> <strong>la</strong> generación <strong>de</strong> disolventes (cantidad, % valorización, % gestión <strong>CAPV</strong>).<br />
Pág. 75
<strong>Inventario</strong> <strong>de</strong> Residuos Peligrosos <strong>de</strong> <strong>la</strong> <strong>CAPV</strong> – Año <strong>2004</strong><br />
5.2 RESIDUOS DE PILAS Y ACUMULADORES<br />
Se <strong>de</strong>scriben en este apartado los resultados obtenidos en el inventariado conjunto <strong>de</strong> pi<strong>la</strong>s y<br />
acumu<strong>la</strong>dores, ya que el LER dispone <strong>de</strong> dos categorías para diferenciar el origen industrial (LER<br />
16) o doméstico (LER 20) <strong>de</strong> los mismos.<br />
La cantidad <strong>de</strong> baterías <strong>de</strong> plomo gestionadas durante <strong>2004</strong> se mantiene en valores muy simi<strong>la</strong>res<br />
a los registrados en 2003, en lo que se i<strong>de</strong>ntifica como una posible saturación <strong>de</strong> <strong>la</strong> curva<br />
interanual <strong>de</strong> gestión.<br />
En lo que respecta a <strong>la</strong>s pi<strong>la</strong>s <strong>de</strong> carácter peligroso, los acumu<strong>la</strong>dores <strong>de</strong> níquel-cadmio y <strong>la</strong>s pi<strong>la</strong>s<br />
con mercurio registran pequeños incrementos, en <strong>la</strong> línea <strong>de</strong> mejora <strong>de</strong> <strong>la</strong> gestión ya <strong>de</strong>tectada en<br />
otras corrientes atomizadas.<br />
Tanto <strong>la</strong> tasa <strong>de</strong> valorización (99,84%) como el ratio <strong>de</strong> gestión en <strong>la</strong> <strong>CAPV</strong> (0,09%) se mantienen<br />
en valores simi<strong>la</strong>res a 2003.<br />
Tab<strong>la</strong> 34. Residuos <strong>de</strong> pi<strong>la</strong>s y acumu<strong>la</strong>dores inventariados en <strong>2004</strong> y evolución 2003-<strong>2004</strong>. Datos en Tm/año.<br />
LER DESCRIPCIÓN 2003 <strong>2004</strong> DIF. 04-03 %<br />
160601 + 200133-1 Baterías <strong>de</strong> plomo 3.824,92 3.893,03 68,11 1,78%<br />
160602 + 200133-2 Acumu<strong>la</strong>dores <strong>de</strong> Ni-Cd 55,30 73,42 18,12 32,77%<br />
160603 + 200133-3 Pi<strong>la</strong>s que contienen mercurio 2,75 4,31 1,55 56,36%<br />
TOTALES 3.882,97 3.970,75 87,78 2,26%<br />
Por gestor<br />
por TH<br />
Por tratamiento<br />
6,38 3,46<br />
3.967,29<br />
833,73 1.130,12 2.006,90<br />
3.964,37<br />
0% 20% 40% 60% 80% 100%<br />
Vasco<br />
No Vasco<br />
Araba<br />
Gipuzkoa<br />
Bizkaia<br />
Eliminación<br />
Incineracion<br />
Valor. Energ.<br />
Recic<strong>la</strong>je<br />
Figura 64. Cantidad <strong>de</strong> <strong>residuos</strong> <strong>de</strong> pi<strong>la</strong>s y acumu<strong>la</strong>dores por tipo <strong>de</strong> gestor, Territorio Histórico y tratamiento. Datos en<br />
Tm/año.<br />
Pág. 76
<strong>Inventario</strong> <strong>de</strong> Residuos Peligrosos <strong>de</strong> <strong>la</strong> <strong>CAPV</strong> – Año <strong>2004</strong><br />
4.000<br />
100%<br />
Tm/año<br />
3.000<br />
2.000<br />
1.000<br />
2.175,23<br />
2.291,20<br />
3.450,10<br />
3.882,97<br />
3.970,75<br />
80%<br />
60%<br />
40%<br />
20%<br />
0%<br />
%<br />
0<br />
2000 2001 2002 2003 <strong>2004</strong><br />
Tm/año % Valorización % Gestión <strong>CAPV</strong><br />
-20%<br />
Figura 65. Evolución 2000-<strong>2004</strong> <strong>de</strong> <strong>la</strong> generación <strong>de</strong> pi<strong>la</strong>s/acumu<strong>la</strong>dores (cantidad, % valorización, % gestión <strong>CAPV</strong>).<br />
4.000<br />
3.825<br />
3.893<br />
3.000<br />
2.862<br />
Tm/año<br />
2.000<br />
1.567<br />
1.730<br />
1.000<br />
608<br />
561<br />
588<br />
731<br />
605<br />
0<br />
2000 2001 2002 2003 <strong>2004</strong><br />
Baterías <strong>de</strong> plomo<br />
Pi<strong>la</strong>s (incluyendo no peligrosas)<br />
Figura 66. Evolución 2000-<strong>2004</strong> <strong>de</strong> <strong>la</strong> generación <strong>de</strong> pi<strong>la</strong>s y <strong>de</strong> acumu<strong>la</strong>dores (cantidad).<br />
Pág. 77
<strong>Inventario</strong> <strong>de</strong> Residuos Peligrosos <strong>de</strong> <strong>la</strong> <strong>CAPV</strong> – Año <strong>2004</strong><br />
5.3 RESIDUOS DE APARATOS ELÉCTRICOS Y ELECTRÓNICOS<br />
El presente <strong>Inventario</strong> ha contemp<strong>la</strong>do en los códigos:<br />
• LER 160213: “Equipos <strong>de</strong>sechados que contienen componentes <strong>peligrosos</strong>”.<br />
• LER 200135: “Equipos eléctricos y electrónicos <strong>de</strong>sechados, distintos <strong>de</strong> los<br />
especificados en los códigos 200121, 200123, que contienen componentes <strong>peligrosos</strong>”<br />
(<strong>de</strong> origen urbano o asimi<strong>la</strong>ble).<br />
los <strong>residuos</strong> <strong>de</strong> aparatos eléctricos y electrónicos que han sido gestionados mediante <strong>la</strong><br />
cumplimentación <strong>de</strong> Documentos <strong>de</strong> Control y Seguimiento.<br />
Sin embargo, al tratarse <strong>de</strong> una corriente tan atomizada y <strong>de</strong> naturaleza mayoritariamente urbana,<br />
resulta ciertamente significativa <strong>la</strong> cantidad <strong>de</strong> este tipo <strong>de</strong> <strong>residuos</strong> que no queda reflejada en los<br />
documentos administrativos vigentes en materia <strong>de</strong> <strong>residuos</strong> <strong>peligrosos</strong>.<br />
Si se integran los datos <strong>de</strong>l <strong>Inventario</strong> con otro tipo <strong>de</strong> informaciones existentes a nivel sectorial,<br />
se obtiene que durante <strong>2004</strong> han sido gestionadas 1.629,10 Tm. <strong>de</strong> <strong>residuos</strong> <strong>de</strong> aparatos<br />
eléctricos y electrónicos correspondientes a <strong>la</strong>s líneas marrón y gris y <strong>de</strong> origen tanto industrial<br />
como urbano, lo que supone un 18,23% más que en 2003.<br />
La distribución territorial (12,60% Araba; 21,59% Gipuzkoa; 65,81% Bizkaia) se mantiene en<br />
valores muy simi<strong>la</strong>res a los registrados en 2003.<br />
Tm/año<br />
1.250<br />
1.000<br />
750<br />
500<br />
250<br />
0<br />
1.072<br />
889<br />
784<br />
291 315 352<br />
132 173<br />
205<br />
2002 2003 <strong>2004</strong><br />
Araba Gipuzkoa Bizkaia<br />
Figura 67. Evolución 2002-<strong>2004</strong> <strong>de</strong> <strong>la</strong> cantidad <strong>de</strong> <strong>residuos</strong> <strong>de</strong> aparatos eléctricos y electrónicos por Territorio Histórico.<br />
Datos en Tm/año.<br />
Pág. 78
<strong>Inventario</strong> <strong>de</strong> Residuos Peligrosos <strong>de</strong> <strong>la</strong> <strong>CAPV</strong> – Año <strong>2004</strong><br />
5.4 VEHÍCULOS FUERA DE USO<br />
La entrada en vigor <strong>de</strong>l “Real Decreto 1383/2002, <strong>de</strong> 20 <strong>de</strong> diciembre, sobre gestión <strong>de</strong> vehículos<br />
al final <strong>de</strong> su vida útil” ha favorecido muy notablemente <strong>la</strong> correcta gestión <strong>de</strong> los vehículos y sus<br />
componentes. La necesidad <strong>de</strong> obtener un Certificado <strong>de</strong> Destrucción otorgado por un Centro<br />
Autorizado <strong>de</strong> Tratamiento (CAT) como requisito previo para po<strong>de</strong>r tramitar <strong>la</strong> baja <strong>de</strong>l vehículo ha<br />
supuesto:<br />
• La a<strong>de</strong>cuación y posterior autorización por parte <strong>de</strong>l órgano ambiental <strong>de</strong> más <strong>de</strong><br />
cuarenta <strong>de</strong>sguaces tradicionales <strong>de</strong> vehículos, que <strong>de</strong>ben garantizar <strong>la</strong> correcta<br />
<strong>de</strong>scontaminación <strong>de</strong> cada unidad para po<strong>de</strong>r operar como Centro Autorizado <strong>de</strong><br />
Tratamiento.<br />
• La garantía <strong>de</strong> que todos los vehículos van a ser <strong>de</strong>bidamente <strong>de</strong>scontaminados por<br />
agentes autorizados.<br />
Por lo tanto, el número <strong>de</strong> vehículos fuera <strong>de</strong> uso generados cada año se podría equiparar al<br />
número <strong>de</strong> bajas tramitadas administrativamente. Así, en <strong>2004</strong> se ha registrado un total <strong>de</strong> 53.571<br />
bajas <strong>de</strong> matricu<strong>la</strong>ción <strong>de</strong> vehículos en el conjunto <strong>de</strong> <strong>la</strong> <strong>CAPV</strong>, un 3,34% menos que en 2003, a<br />
pesar <strong>de</strong>l ligero incremento <strong>de</strong>tectado en el Territorio Histórico <strong>de</strong> Gipuzkoa.<br />
60.000<br />
Nº bajas <strong>de</strong> vehículos/año<br />
50.000<br />
40.000<br />
30.000<br />
20.000<br />
10.000<br />
0<br />
26.294 27.794 26.080<br />
18.992 18.013 18.415<br />
8.345 9.615 9.076<br />
2002 2003 <strong>2004</strong><br />
Araba Gipuzkoa Bizkaia<br />
Figura 68. Evolución 2002-04 <strong>de</strong>l número <strong>de</strong> bajas <strong>de</strong> vehículos por Territorio Histórico. Datos en unida<strong>de</strong>s/año.<br />
Estas bajas <strong>de</strong> matricu<strong>la</strong>ción correspon<strong>de</strong>n fundamentalmente a turismos (82,47%), ocupando el<br />
segundo lugar los camiones (11,27%). La distribución por tipo <strong>de</strong> vehículo es muy simi<strong>la</strong>r a <strong>la</strong><br />
registrada en 2003.<br />
Pág. 79
<strong>Inventario</strong> <strong>de</strong> Residuos Peligrosos <strong>de</strong> <strong>la</strong> <strong>CAPV</strong> – Año <strong>2004</strong><br />
60.000<br />
50.000<br />
Tractores<br />
Nº bajas vehículos/año<br />
40.000<br />
30.000<br />
20.000<br />
10.000<br />
43.629<br />
45.141<br />
44.180<br />
Autobuses<br />
Motos<br />
Remolques /<br />
semiremolques<br />
Camiones<br />
Turismos<br />
0<br />
2002 2003 <strong>2004</strong><br />
Figura 69. Evolución 2002-04 <strong>de</strong>l número <strong>de</strong> bajas <strong>de</strong> vehículos por tipo <strong>de</strong> vehículo. Datos en unida<strong>de</strong>s/año.<br />
La generación <strong>de</strong> <strong>residuos</strong> <strong>peligrosos</strong> <strong>de</strong>rivados <strong>de</strong> <strong>la</strong> <strong>de</strong>scontaminación <strong>de</strong> los vehículos (filtros<br />
<strong>de</strong> aceite, anticonge<strong>la</strong>ntes, líquidos <strong>de</strong> frenos, …) experimenta un incremento significativo<br />
(68,45%), ratificando <strong>la</strong> línea <strong>de</strong> crecimiento registrada en los últimos años.<br />
500<br />
400<br />
Tm/año<br />
300<br />
200<br />
100<br />
0<br />
2000 2001 2002 2003 <strong>2004</strong><br />
Filtros aceite Líquido frenos Anticonge<strong>la</strong>ntes<br />
Figura 70. Evolución 2000-04 <strong>de</strong> los <strong>residuos</strong> <strong>peligrosos</strong> <strong>de</strong>rivados <strong>de</strong> <strong>la</strong> <strong>de</strong>scontaminación <strong>de</strong> vehículos. Datos en<br />
Tm/año.<br />
Pág. 80
<strong>Inventario</strong> <strong>de</strong> Residuos Peligrosos <strong>de</strong> <strong>la</strong> <strong>CAPV</strong> – Año <strong>2004</strong><br />
5.5 RESIDUOS “HISTÓRICOS”<br />
5.5.1 Tierras y piedras que contienen sustancias peligrosas<br />
En <strong>2004</strong> se pone <strong>de</strong> manifiesto con <strong>la</strong> mayor c<strong>la</strong>ridad <strong>la</strong> ausencia <strong>de</strong> pautas <strong>de</strong> comportamiento en<br />
<strong>la</strong> generación <strong>de</strong> tierras contaminadas, al alcanzarse un total <strong>de</strong> 118.227, 74 Tm., <strong>de</strong> <strong>la</strong>s cuales un<br />
90,92% correspon<strong>de</strong>n a una única obra <strong>de</strong>sarrol<strong>la</strong>da en Bizkaia por un promotor no industrial.<br />
El volumen alcanzado hace que <strong>la</strong>s tierras contaminadas se erijan en <strong>la</strong> segunda corriente<br />
residual <strong>de</strong>l inventario <strong>de</strong> <strong>2004</strong>, por <strong>de</strong>trás <strong>de</strong> los polvos <strong>de</strong> acería (123.434,74 Tm) y por <strong>de</strong><strong>la</strong>nte<br />
<strong>de</strong> los ácidos <strong>de</strong> <strong>de</strong>capado (79.471,24 Tm).<br />
Con estos valores, se evi<strong>de</strong>ncia <strong>la</strong> influencia que los <strong>residuos</strong> históricos ejercen sobre el conjunto<br />
<strong>de</strong>l inventario, así como <strong>la</strong> necesidad <strong>de</strong> valorarlos en <strong>de</strong>terminados momentos <strong>de</strong> forma<br />
segregada respecto a los <strong>residuos</strong> asociados al crecimiento económico anual, para po<strong>de</strong>r<br />
observar <strong>de</strong>terminadas ten<strong>de</strong>ncias sin distorsiones.<br />
El “P<strong>la</strong>n <strong>de</strong> Suelos Contaminados 2007-2012” recoge como objetivo abordar esta situación.<br />
125.000<br />
100.000<br />
118.228<br />
75.000<br />
Tm/año<br />
50.000<br />
25.000<br />
5.352<br />
13.643<br />
8.798<br />
19.675<br />
0<br />
2000 2001 2002 2003 <strong>2004</strong><br />
Figura 71. Evolución 2000-<strong>2004</strong> <strong>de</strong> los <strong>residuos</strong> <strong>de</strong> tierras contaminadas con sustancias peligrosas. Datos en Tm/año.<br />
5.5.2 Aceites con PCB y aparatos contaminados con PCB<br />
En <strong>2004</strong>, el “Real Decreto 1378/1999, <strong>de</strong> 27 <strong>de</strong> agosto, por el que se establecen medidas para <strong>la</strong><br />
eliminación y gestión <strong>de</strong> los PCB, PCT y aparatos que los contengan” exigía <strong>la</strong> <strong>de</strong>scontaminación<br />
o eliminación <strong>de</strong> dichas sustancias antes <strong>de</strong>l 1 <strong>de</strong> enero <strong>de</strong> 2011. El Real Decreto 228/2006<br />
aprobado posteriormente ratifica esta obligación y establece porcentajes <strong>de</strong> <strong>de</strong>scontaminación<br />
anuales en función <strong>de</strong> <strong>la</strong> Dec<strong>la</strong>ración <strong>de</strong> Posesión, para evitar el co<strong>la</strong>pso <strong>de</strong> <strong>la</strong>s insta<strong>la</strong>ciones <strong>de</strong><br />
tratamiento en el año 2010.<br />
Pág. 81
<strong>Inventario</strong> <strong>de</strong> Residuos Peligrosos <strong>de</strong> <strong>la</strong> <strong>CAPV</strong> – Año <strong>2004</strong><br />
Este tipo <strong>de</strong> <strong>residuos</strong> correspon<strong>de</strong> a dos corrientes <strong>de</strong>l LER, representadas por los códigos<br />
130301 (aceites <strong>de</strong> ais<strong>la</strong>miento y transmisión <strong>de</strong> calor que contienen PCBs) y 160209<br />
(transformadores y con<strong>de</strong>nsadores que contienen PCBs).<br />
Los datos <strong>de</strong> gestión obtenidos en <strong>2004</strong> no confirman un aumento progresivo <strong>de</strong> <strong>la</strong> gestión <strong>de</strong> este<br />
tipo <strong>de</strong> <strong>residuos</strong> <strong>peligrosos</strong> tal y como cabría esperar, pero es <strong>de</strong> suponer que los nuevos<br />
porcentajes anuales <strong>de</strong> gestión regu<strong>la</strong>dos en el citado Real Decreto 228/2006 aceleren a partir <strong>de</strong><br />
ese año el ritmo <strong>de</strong> gestión, que bien es verdad se encuentra muy condicionado por <strong>la</strong>s<br />
actuaciones acometidas por una gran empresa eléctrica, que adapta su partida presupuestaria<br />
anual sin per<strong>de</strong>r <strong>de</strong> vista el horizonte <strong>de</strong> 2011.<br />
1.600<br />
1.400<br />
1.547<br />
Tm/año<br />
1.200<br />
1.000<br />
800<br />
600<br />
400<br />
541<br />
807<br />
1.015 1.005<br />
603<br />
795<br />
441<br />
426<br />
200<br />
0<br />
72<br />
2000 2001 2002 2003 <strong>2004</strong><br />
Aceites con PCB<br />
Aparatos contaminados con PCB<br />
Figura 72. Evolución 2000-<strong>2004</strong> <strong>de</strong> <strong>la</strong> gestión <strong>de</strong> aceites y aparatos contaminados con PCB. Datos en Tm/año.<br />
5.5.3 Residuos <strong>de</strong> amianto<br />
Por segundo año consecutivo se incorporan en calidad <strong>de</strong> <strong>residuos</strong> históricos los <strong>residuos</strong> <strong>de</strong><br />
amianto que se <strong>de</strong>positan en zonas <strong>de</strong>bidamente acondicionadas <strong>de</strong> ciertos verte<strong>de</strong>ros<br />
autorizados ubicados en <strong>la</strong> <strong>CAPV</strong>. Como se pue<strong>de</strong> observar, <strong>la</strong> cantidad gestionada en <strong>2004</strong> se<br />
mantiene en niveles simi<strong>la</strong>res a los registrados durante 2003.<br />
Pág. 82
<strong>Inventario</strong> <strong>de</strong> Residuos Peligrosos <strong>de</strong> <strong>la</strong> <strong>CAPV</strong> – Año <strong>2004</strong><br />
5.000<br />
4.000<br />
Tm/año<br />
3.000<br />
2.000<br />
1.000<br />
0<br />
4.418<br />
4.657<br />
58 97<br />
259<br />
2000 2001 2002 2003 <strong>2004</strong><br />
Figura 73. Evolución 2000-<strong>2004</strong> <strong>de</strong> <strong>la</strong> gestión <strong>de</strong> <strong>residuos</strong> con amianto. Datos en Tm/año.<br />
Pág. 83
<strong>Inventario</strong> <strong>de</strong> Residuos Peligrosos <strong>de</strong> <strong>la</strong> <strong>CAPV</strong> – Año <strong>2004</strong><br />
6. CONCLUSIONES<br />
Caracterización cualitativa y cuantitativa: Durante <strong>2004</strong> se han generado en <strong>la</strong> <strong>CAPV</strong> un<br />
total <strong>de</strong> 510.205 Tm. <strong>de</strong> <strong>residuos</strong> <strong>peligrosos</strong>, <strong>de</strong> los cuales 221.822 Tm están asociados a <strong>la</strong><br />
actividad económica anual (44%), 164.999 Tm proce<strong>de</strong>n <strong>de</strong> tratamientos <strong>de</strong> fin <strong>de</strong> línea (32%)<br />
y 123.384 Tm son <strong>residuos</strong> “históricos” (24%). Este reparto da i<strong>de</strong>a <strong>de</strong> <strong>la</strong> importancia que en el<br />
mo<strong>de</strong>lo vasco <strong>de</strong> generación <strong>de</strong> <strong>residuos</strong> <strong>peligrosos</strong> presentan estas corrientes cuyo<br />
incremento se consi<strong>de</strong>ra medioambientalmente beneficioso aún cuando reducen <strong>la</strong>s<br />
posibilida<strong>de</strong>s <strong>de</strong> <strong>de</strong>sacop<strong>la</strong>miento.<br />
Las tierras contaminadas se erigen en <strong>la</strong> segunda corriente mayoritaria (118.227,74 Tm), por<br />
<strong>de</strong>trás <strong>de</strong> los polvos <strong>de</strong> acería (123.434,74 Tm) y por <strong>de</strong><strong>la</strong>nte <strong>de</strong> los ácidos <strong>de</strong> <strong>de</strong>capado<br />
(79.471,24 Tm). Los <strong>residuos</strong> <strong>peligrosos</strong> no históricos alcanzan <strong>la</strong>s 386.821 Tm, un 11,64%<br />
más que en 2003.<br />
El ritmo <strong>de</strong> gestión <strong>de</strong> <strong>residuos</strong> <strong>peligrosos</strong> supera por tercer año consecutivo el porcentaje <strong>de</strong><br />
crecimiento <strong>de</strong>l Valor Añadido Bruto <strong>de</strong>l sector industrial (2,89%), hasta alcanzar una<br />
generación <strong>de</strong> 26,9 Tm <strong>de</strong> <strong>residuos</strong> <strong>peligrosos</strong> asociados al crecimiento económico por cada<br />
millón <strong>de</strong> euros generado, según precios constantes para el año base 2005.<br />
De entre los <strong>residuos</strong> <strong>de</strong>pendientes <strong>de</strong> <strong>la</strong> actividad económica anual y <strong>de</strong> tratamientos <strong>de</strong> fin<br />
<strong>de</strong> línea, los <strong>de</strong>rivados <strong>de</strong> <strong>la</strong> industria si<strong>de</strong>rometalúrgica (LER 10, 11 y 12) constituyen <strong>la</strong>s dos<br />
terceras partes (75,90%) <strong>de</strong>l total. Todos los sectores en general registran un aumento <strong>de</strong> <strong>la</strong>s<br />
cantida<strong>de</strong>s generadas, a excepción <strong>de</strong>l sector petroquímico (LER 05) y el conjunto <strong>de</strong> los<br />
disolventes no asociados a <strong>la</strong> industria química orgánica (LER 14).<br />
Origen geográfico <strong>de</strong> <strong>la</strong> producción: En lo que respecta a los <strong>residuos</strong> asociados a <strong>la</strong><br />
actividad económica anual (fin <strong>de</strong> línea incluidos), <strong>la</strong> distribución territorial que se registra<br />
(Araba 18,39%; Gipuzkoa 27,96%; Bizkaia 53,65%) ajusta <strong>la</strong> aportación <strong>de</strong> Bizkaia a su perfil<br />
<strong>de</strong>mográfico, mientras que Araba supera dicho referente en <strong>de</strong>trimento <strong>de</strong> Gipuzkoa. La<br />
ubicación en Bizkaia <strong>de</strong>l principal centro productor <strong>de</strong> tierras contaminadas hace que, si se<br />
consi<strong>de</strong>ran los <strong>residuos</strong> históricos, el porcentaje <strong>de</strong> este Territorio se vea incrementado hasta<br />
el 64,24%.<br />
Tipo <strong>de</strong> Gestión: La aplicación <strong>de</strong> tratamientos <strong>de</strong> valorización sobre los <strong>residuos</strong> asociados<br />
a <strong>la</strong> producción económica anual (fin <strong>de</strong> línea incluidos) ascien<strong>de</strong> en <strong>2004</strong> hasta el 52,99%<br />
(51,30% valorización material; 1,69% valorización energética), confirmando <strong>la</strong> línea <strong>de</strong><br />
Pág. 84
<strong>Inventario</strong> <strong>de</strong> Residuos Peligrosos <strong>de</strong> <strong>la</strong> <strong>CAPV</strong> – Año <strong>2004</strong><br />
crecimiento sostenido observada <strong>de</strong>s<strong>de</strong> 1999. La eliminación (46,59%) y <strong>la</strong> incineración<br />
(0,41%) completan <strong>la</strong>s opciones <strong>de</strong> gestión.<br />
Este incremento pau<strong>la</strong>tino se <strong>de</strong>be fundamentalmente al compromiso adquirido por el sector<br />
<strong>de</strong>l acero con <strong>la</strong> Administración vasca para <strong>la</strong> sustitución <strong>de</strong>l proceso <strong>de</strong> estabilizaciónsolidificación<br />
y <strong>de</strong>posición <strong>de</strong> los polvos <strong>de</strong> acería por técnicas que permitan el recic<strong>la</strong>je <strong>de</strong>l<br />
cinc y el plomo que contienen, y que para principios <strong>de</strong> 2007 <strong>de</strong>be afectar al 100% <strong>de</strong> los<br />
polvos <strong>de</strong> acería no inoxidables. En menor medida, influye también el incremento registrado<br />
en <strong>la</strong> valorización <strong>de</strong> ácidos <strong>de</strong> <strong>de</strong>capado.<br />
Des<strong>de</strong> el punto <strong>de</strong> vista territorial, y en lo que respecta a <strong>residuos</strong> asociados al crecimiento<br />
económico (fin <strong>de</strong> línea incluidos), el porcentaje <strong>de</strong> valorización en Araba (51,87%) se asemeja<br />
al <strong>de</strong>l conjunto <strong>de</strong> <strong>la</strong> <strong>CAPV</strong>. Bizkaia (63,86%) supera dicha media <strong>de</strong>bido en gran medida a <strong>la</strong><br />
cantidad <strong>de</strong> escorias <strong>de</strong> segunda fusión <strong>de</strong> aluminio que genera y al tratamiento <strong>de</strong><br />
recuperación que reciben <strong>la</strong>s mismas, teniendo en cuenta a<strong>de</strong>más que es el único Territorio<br />
Histórico que genera este residuo. Gipuzkoa valoriza únicamente el 32,88% <strong>de</strong> sus <strong>residuos</strong><br />
no históricos porque aún <strong>de</strong>riva a estabilización-solidificación parte <strong>de</strong> los polvos <strong>de</strong> acería que<br />
genera.<br />
Importaciones: Durante <strong>2004</strong>, <strong>la</strong> <strong>CAPV</strong> recibió un total <strong>de</strong> 122.597,88 Tm., proce<strong>de</strong>ntes <strong>de</strong><br />
otras Comunida<strong>de</strong>s Autónomas (85.886,38 Tm.; 70,06%) y otros Estados (36.711,50 Tm;<br />
29,94%). Los polvos <strong>de</strong> acería proce<strong>de</strong>ntes <strong>de</strong> Cataluña para su recic<strong>la</strong>do en <strong>la</strong> <strong>CAPV</strong><br />
constituyen <strong>la</strong> corriente mayoritaria.<br />
Proximidad geográfica <strong>de</strong> <strong>la</strong> gestión: Dos terceras partes (67,00%) <strong>de</strong> los <strong>residuos</strong><br />
asociados al crecimiento económico anual (fin <strong>de</strong> línea incluidos) son gestionados por<br />
insta<strong>la</strong>ciones <strong>de</strong> tratamiento ubicadas en <strong>la</strong> <strong>CAPV</strong>, por lo que se igua<strong>la</strong> el valor <strong>de</strong> 2003<br />
(67,41%) a pesar <strong>de</strong>l incremento <strong>de</strong> generación <strong>de</strong> <strong>residuos</strong> que ha tenido lugar.<br />
Las tierras contaminadas, por su parte, han sido enviadas mayoritariamente a <strong>de</strong>pósitos <strong>de</strong><br />
seguridad ubicados en otras Comunida<strong>de</strong>s Autónomas.<br />
Se produce un incremento <strong>de</strong>l 32,24% en <strong>la</strong> cantidad anual autogestionada, alcanzándose <strong>la</strong>s<br />
11.712 Tm, <strong>de</strong>bido fundamentalmente a <strong>residuos</strong> <strong>de</strong> <strong>la</strong> industria química orgánica (LER 07) y a<br />
<strong>la</strong>s ta<strong>la</strong>drinas (LER 12). El número <strong>de</strong> empresas que disponen <strong>de</strong> autorización para<br />
autogestionar alguno <strong>de</strong> sus <strong>residuos</strong> generados aumenta <strong>de</strong> veinte a veinticuatro.<br />
Pág. 85
<strong>Inventario</strong> <strong>de</strong> Residuos Peligrosos <strong>de</strong> <strong>la</strong> <strong>CAPV</strong> – Año <strong>2004</strong><br />
7. ANEXO I. DATOS DESAGREGADOS<br />
Pág. 86
<strong>Inventario</strong> <strong>de</strong> Residuos Peligrosos <strong>de</strong> <strong>la</strong> <strong>CAPV</strong> – Año <strong>2004</strong><br />
ARABA. Datos en Tm. De <strong>residuos</strong>. V = gestor <strong>de</strong> <strong>la</strong> C.A.P.V. N = gestor <strong>de</strong> fuera <strong>de</strong> <strong>la</strong> C.A.P.V. T = totales<br />
Eliminación Incineración Valor. Energ. Recic<strong>la</strong>je<br />
Totales<br />
CER V N T V N T V N T V N T V N T %<br />
01 0 0 0 0 0 0 0 0 0 0 0 0 0 0 0 0%<br />
02 0,1 0 0,1 0 0 0 0 0 0 0 0 0 0 0 0 0%<br />
03 3 0 3 0 0 0 0 0 0 0 0 0 3 0 3 0,004%<br />
04 0 0 0 0 0 0 0 0 0 0 0 0 0 0 0 0%<br />
05 0 0 0 0 0 0 0 0 0 0 0 0 0 0 0 0%<br />
06 231 32 263 0 0 0 0 0 0 64 0 64 294 32 327 0,45%<br />
07 1.602 985 2.587 0 2 2 0 749 749 34 462 496 1.635 2.198 3.834 5,30%<br />
08 341 2.039 2.380 0 0 0 0 6 6 146 247 393 487 2.292 2.779 3,84%<br />
09 28 24 52 0 0 0 0 0 0 14 37 51 42 61 102 0,14%<br />
10 1.987 2.330 4.317 0 0 0 0 0 0 5.417 2.222 7.639 7.404 4.552 11.956 16,52%<br />
11 5.349 8.698 14.047 0 0 0 0 0 0 20.962 229 21.192 26.312 8.927 35.239 48,70%<br />
12 1.178 1.900 3.079 0 239 239 0 0 0 32 25 57 1.210 2.165 3.375 4,66%<br />
13 578 324 903 0 135 135 1.577 36 1.613 1.674 98 1.773 3.829 594 4.423 6,11%<br />
14 8 57 66 0 2,97 2,97 0 0 0 139 226 366 148 286 434 0,60%<br />
15 253 1.296 1.549 0 2 2 0 56 56 692 249 941 945 1.602 2.547 3,52%<br />
16 729 319 1.049 0 2 2 0 87 87 251 703 954 980 1.111 2.091 2,89%<br />
17 621 476 1.098 0 0 0 0 0 0 0 0 0 621 476 1.098 1,52%<br />
18 0 164 164 0 18 18 0 0 0 0 0 0 0 182 182 0,25%<br />
19 999 2.502 3.501 0 0 0 0 0 0 198 20 218 1.197 2.522 3.720 5,14%<br />
20 3 0 3 0 0 0 0 0 0 11 233 244 14 233 247 0,34%<br />
TOTALES 13.911 21.148 35.059 0 400 400 1.577 934 2.511 29.635 4.752 34.387 45.122 27.235 72.357<br />
% 39,68% 60,32% 0,00% 100,00% 62,79% 37,21% 86,18% 13,82% 62,36% 37,64%<br />
Pág. 87
<strong>Inventario</strong> <strong>de</strong> Residuos Peligrosos <strong>de</strong> <strong>la</strong> <strong>CAPV</strong> – Año <strong>2004</strong><br />
GIPUZKOA. Datos en Tm. De <strong>residuos</strong>. V = gestor <strong>de</strong> <strong>la</strong> C.A.P.V. N = gestor <strong>de</strong> fuera <strong>de</strong> <strong>la</strong> C.A.P.V. T = totales<br />
Eliminación Incineración Valor. Energ. Recic<strong>la</strong>je<br />
Totales<br />
CER V N T V N T V N T V N T V N T %<br />
01 0 0 0 0 0 0 0 0 0 0 0 0 0 0 0 0%<br />
02 0 0 0 0 0 0 0 0 0 0 0 0 0 0 0 0%<br />
03 0 0 0 0 30 30 0 0 0 0 0 0 0 30 30 0%<br />
04 0 0 0 0 0 0 0 0 0 0 0 0 0 0 0 0%<br />
05 0 0 0 0 0 0 0 0 0 0 0 0 0 0 0 0%<br />
06 225 221 446 0 0 0 0 10 10 0 0 0 225 231 457 0,41%<br />
07 771 82 853 0 15 15 0 39 39 55 0 55 826 136 962 0,87%<br />
08 685 493 1.178 0 0 0 0,3 236 236 445 312 757 1.131 1.041 2.172 1,97%<br />
09 90 97 187 0 0 0 0 0 0 91 39 130 180 136 316 0,29%<br />
10 45.734 1.038 46.772 0 0 0 0 0 0 21.851 1.065 22.915 67.585 2.103 69.687 63,30%<br />
11 9.070 2.339 11.409 0 0 0 0 8 8 1.520 1.739 3.259 10.590 4.086 14.676 13,33%<br />
12 1.884 3.278 5.162 0 3 3 0 351 351 151 530 681 2.035 4.162 6.197 5,63%<br />
13 808 2.732 3.540 0 52 52 7 78 85 3.380 231 3.611 4.195 3.093 7.288 6,62%<br />
14 21 43 64 0 22 22 0 68 68 270 230 499 290 362 652 0,59%<br />
15 588 757 1.346 0 1,55 1,55 0 68 68 641 106 747 1.229 933 2.163 1,96%<br />
16 325 387 712 0 25 25 0 672 672 135 613 748 461 1.696 2.157 1,96%<br />
17 1.543 292 1.836 0 0 0 0 0 0 0 0 0 1543,6 292 1.836 1,67%<br />
18 0 2 2 0 413 413 0 0 0 0 0 0 0 414 414 0,38%<br />
19 289 148 436 0 0 0 0 0 0 0 0 0 289 148 436 0,40%<br />
20 0 0 0 0 0 0 0 0 0 13 636 650 13 636 650 0,59%<br />
TOTALES 62.034 11.908 73.943 0 560 560 7 1.530 1.537 28.552 5.501 34.053 90.593 19.499 110.093<br />
% 83,90% 16,10% 0,00% 100,00% 0,47% 99,53% 83,85% 16,15% 82,29% 17,71%<br />
Pág. 88
<strong>Inventario</strong> <strong>de</strong> Residuos Peligrosos <strong>de</strong> <strong>la</strong> <strong>CAPV</strong> – Año <strong>2004</strong><br />
BIZKAIA. Datos en Tm. De <strong>residuos</strong>. V = gestor <strong>de</strong> <strong>la</strong> C.A.P.V. N = gestor <strong>de</strong> fuera <strong>de</strong> <strong>la</strong> C.A.P.V. T = totales<br />
Eliminación Incineración Valor. Energ. Recic<strong>la</strong>je<br />
Totales<br />
CER V N T V N T V N T V N T V N T %<br />
01 7 0 7 0 0 0 0 0 0 0 0 0 7 0 7 0,002%<br />
02 0 0 0 0 0 0 0 0 0 0 0 0 0 0 0 0,000%<br />
03 3 0 3 0 0 0 0 0 0 0 0 0 3 0 3 0,001%<br />
04 0 0 0 0 0 0 0 0 0 0 0 0 0 0 0 0%<br />
05 1.011 254 1.265 0 0 0 0 0 0 5.466 0 5.466 6.476 254 6.731 2,05%<br />
06 4.209 4.352 8.561 0 0 0 0 0 0 22 0 22 4.230 4.352 8.583 2,62%<br />
07 5.937 157 6.094 0 29 29 0 714 714 54 22 77 5.991 922 6.914 2,11%<br />
08 1.089 756 1.846 0 0 0 0 121 121 330 137 467 1.419 1.014 2.433 0,74%<br />
09 99 128 227 0 0 0 0 0 0 113 111 224 213 239 451 0,14%<br />
10 10.621 7.286 17.907 0 0 0 0 0 0 39.710 31.855 71.564 50.331 39.141 89.471 27,30%<br />
11 7.428 7.984 15.413 0 0 0 0 53 53 24.072 14.776 38.848 31.501 22.813 54.314 16,57%<br />
12 4.065 2.659 6.724 0 8 8 0 17 17 1.922 0 1.922 5.987 2.685 8.672 2,65%<br />
13 3.213 1.309 4.523 0 268 268 0 1.443 1.443 4.003 970 4.973 7.216 3.990 11.206 3,42%<br />
14 12 112 124 0 69 69 0 0 0 221 322 543 233 503 736 0,22%<br />
15 1.135 886 2.021 0 3 3,06 0 0 0 1.015 205 1.221 2.150 1.095 3.245 0,99%<br />
16 1.432 1.429 2.862 0 4 4 0 158 158 1.754 1.211 2.965 3.187 2.801 5.988 1,83%<br />
17 2.403 117.167 119.570 0 0 0 0 0 0 0 392 392 2.403 117.559 119.962 36,60%<br />
18 0 64 64 352 361 713 0 0 0 0 0 0 352 425 777 0,24%<br />
19 5.546 968 6.514 0 0 0 0 0 0 7 0 7 5.553 968 6.521 1,99%<br />
20 0 0 0 0 0 0 0 0 0 768 974 1.742 768 974 1.742 0,53%<br />
TOTALES 48.211 145.511 193.723 352 742 1.094 0 2.505 2.505 79.458 50.975 130.433 128.021 199.733 327.755<br />
% 24,89% 75,11% 32,18% 67,82% 0,00% 100,00% 60,92% 39,08% 39,06% 60,94%<br />
Pág. 89
<strong>Inventario</strong> <strong>de</strong> Residuos Peligrosos <strong>de</strong> <strong>la</strong> <strong>CAPV</strong> – Año <strong>2004</strong><br />
C.A.P.V. Datos en Tm. De <strong>residuos</strong>. V = gestor <strong>de</strong> <strong>la</strong> C.A.P.V. N = gestor <strong>de</strong> fuera <strong>de</strong> <strong>la</strong> C.A.P.V. T = totales<br />
Eliminación Incineración Valor. Energ. Recic<strong>la</strong>je<br />
Totales<br />
CER V N T V N T V N T V N T V N T %<br />
01 7 0 7 0 0 0 0 0 0 0 0 0 7 0 7 0,001%<br />
02 0 0 0 0 0 0 0 0 0 0 0 0 0 0 0,1 0,000%<br />
03 6 0 6 0 30 30 0 0 0 0 0 0 6 30 36 0,007%<br />
04 0 0 0 0 0 0 0 0 0 0 0 0 0 0 0 0%<br />
05 1.011 254 1.265 0 0 0 0 0 0 5.466 0 5.466 6.476 254 6.731 1,32%<br />
06 4.665 4.606 9.271 0 0 0 0 10 10 85 0 85 4.750 4.616 9.366 1,84%<br />
07 8.310 1.224 9.533 0 46 46 0 1.503 1.503 143 484 627 8.453 3.257 11.709 2,30%<br />
08 2.115 3.288 5.403 0 0 0 0 363 363 922 696 1.618 3.037 4.346 7.384 1,45%<br />
09 217 248 465 0 0 0 0 0 0 218 187 405 434 435 870 0,17%<br />
10 58.341 10.654 68.995 0 0 0 0 0 0 66.977 35.142 102.119 125.319 45.796 171.115 33,54%<br />
11 21.848 19.022 40.870 0 0 0 0 60 60 46.555 16.744 63.299 68.403 35.825 104.228 20,43%<br />
12 7.128 7.838 14.966 0 251 251 0 368 368 2.105 555 2.660 9.233 9.012 18.244 3,58%<br />
13 4.599 4.365 8.965 0 454 454 1.584 1.557 3.141 9.057 1.300 10.357 15.241 7.677 22.917 4,49%<br />
14 41 212 254 0 94 94 0 68 68 630 778 1.408 671 1.152 1.823 0,36%<br />
15 1.976 2.939 4.915 0 6 6 0 124 124 2.349 560 2.909 4.325 3.630 7.955 1,56%<br />
16 2.487 2.136 4.623 0 30 30 0 916 916 2.141 2.526 4.667 4.628 5.608 10.236 2,01%<br />
17 4.568 117.936 122.503 0 0 0 0 0 0 0 392 392 4.568 118.327 122.895 24,09%<br />
18 0 229 229 352 792 1.144 0 0 0 0 0 0 352 1.021 1.373 0,27%<br />
19 6.834 3.617 10.451 0 0 0 0 0 0 205 20 226 7.039 3.638 10.677 2,09%<br />
20 3 0 3 0 0 0 0 0 0 792 1.844 2.636 795 1.844 2.639 0,52%<br />
TOTALES 124.156 178.568 302.724 352 1.702 2.054 1.584 4.969 6.553 137.645 61.229 198.873 263.737 246.467 510.205<br />
% 41,01% 58,99% 17,14% 82,86% 24,17% 75,83% 69,21% 30,79% 51,69% 48,31%<br />
Pág. 90