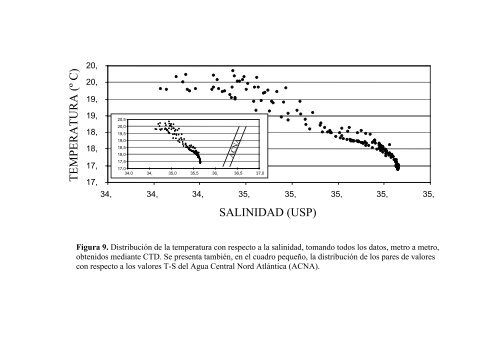
TEMPERATURA (º C) 20, 20, 19, 19, 18, 18, 17, 17, 20,5 20,0 19,5 19,0 18,5 18,0 17,5 ACNA 17,0 34,0 34, 35,0 35,5 36, 36,5 37,0 34, 34, 34, 35, 35, 35, 35, 35, SALINIDAD (USP) Figura 9. Distribución de la temperatura con respecto a la salinidad, tomando todos los datos, metro a metro, obtenidos mediante CTD. Se presenta también, en el cuadro pequeño, la distribución de los pares de valores con respecto a los valores T-S del Agua Central Nord Atlántica (ACNA).
BIOTOPO MARINO ALGORRI OM98011 3.- Otras variables físicas En este apartado se recogen variables que tienen que ver con la propiedades ópticas del medio, como el coeficiente de atenuación de la luz, la transmitancia, el color, la turbidez y la concentración de sólidos en suspensión. La turbidez se halla relacionada con el material en suspensión, tanto en lo que respecta a la cantidad como a la calidad (tamaño). Dentro del material en suspensión queda englobado el plancton, por lo que en ocasiones turbidez y clorofila se hallan relacionados. La transmitancia también depende fundamentalmente de la concentración y distribución de tamaño del material particulado, pero su medición es diferente a la de la turbidez. El color se determina sobre muestra filtrada y se relaciona con el material disuelto, especialmente el de carácter orgánico. El coeficiente de atenuación de luz difusa se mide mediante sensores de radiación, los cuales, situados a diferentes profundidades, permiten establecer los coeficientes de extinción de la luz en el agua, bien integrados para toda la columna de agua o bien en diferentes capas. La transparencia, normalmente estimada en términos de profundidad de visión del disco de Secchi, da una idea similar al parámetro anterior, por lo que cuando la columna de agua se halla bien mezclada suele existir una relación directa entre ambas variables. En todo caso, se trata de parámetros que engloban a todos los anteriores. En las campañas de verano de 1997 se estimó la profundidad de visión del disco de Secchi. A partir de ella se puede estimar k (coeficiente de atenuación de la luz difusa en el agua) como: K = 1,5 / Prof. Secchi Los datos medios y los rangos de algunas de estas variables, obtenidos en los trabajos antes mencionados, se exponen a continuación: V. HIDROGRAFÍA 42
- Page 1: Ref.: OM98011 INFORME ESTABLECIMIEN
- Page 5 and 6: BIOTOPO MARINO ALGORRI OM98011 INDI
- Page 7: BIOTOPO MARINO ALGORRI OM98011 IX.-
- Page 11 and 12: BIOTOPO MARINO ALGORRI OM98011 I.-
- Page 13 and 14: BIOTOPO MARINO ALGORRI OM98011 Para
- Page 16 and 17: BIOTOPO MARINO ALGORRI OM98011 II.-
- Page 18 and 19: BIOTOPO MARINO ALGORRI OM98011 brus
- Page 20: BIOTOPO MARINO ALGORRI OM98011 Esta
- Page 23 and 24: Fotografía 1. Acantilados y plataf
- Page 25 and 26: BIOTOPO MARINO ALGORRI OM98011 encu
- Page 27 and 28: BIOTOPO MARINO ALGORRI OM98011 A lo
- Page 30 and 31: BIOTOPO MARINO ALGORRI OM98011 IV.-
- Page 32 and 33: BIOTOPO MARINO ALGORRI OM98011 Figu
- Page 34: BIOTOPO MARINO ALGORRI OM98011 cons
- Page 37 and 38: 3 2 1 6 5 4 9 8 7 Getaria Deba Zuma
- Page 39 and 40: Tabla 3. Valores mínimos, máximos
- Page 41 and 42: 17,0 17,5 18,0 18,5 19,0 19,5 20,0
- Page 43: BIOTOPO MARINO ALGORRI OM98011 En l
- Page 47 and 48: BIOTOPO MARINO ALGORRI OM98011 No e
- Page 49 and 50: BIOTOPO MARINO ALGORRI OM98011 5.-
- Page 51 and 52: BIOTOPO MARINO ALGORRI OM98011 El v
- Page 53 and 54: BIOTOPO MARINO ALGORRI OM98011 máx
- Page 55 and 56: BIOTOPO MARINO ALGORRI OM98011 metr
- Page 57 and 58: BIOTOPO MARINO ALGORRI OM98011 Una
- Page 60 and 61: BIOTOPO MARINO ALGORRI OM98011 VI.-
- Page 62 and 63: BIOTOPO MARINO ALGORRI OM98011 2.1.
- Page 64 and 65: BIOTOPO MARINO ALGORRI OM98011 Como
- Page 66 and 67: BIOTOPO MARINO ALGORRI OM98011 En c
- Page 68 and 69: BIOTOPO MARINO ALGORRI OM98011 TABL
- Page 70 and 71: BIOTOPO MARINO ALGORRI OM98011 Comp
- Page 72 and 73: BIOTOPO MARINO ALGORRI OM98011 3.-
- Page 74 and 75: BIOTOPO MARINO ALGORRI OM98011 3.2.
- Page 76 and 77: BIOTOPO MARINO ALGORRI OM98011 geom
- Page 78 and 79: BIOTOPO MARINO ALGORRI OM98011 La d
- Page 80 and 81: BIOTOPO MARINO ALGORRI OM98011 De i
- Page 82 and 83: Figura 13. Corriente verticalmente
- Page 84 and 85: BIOTOPO MARINO ALGORRI OM98011 Dent
- Page 86 and 87: Figura 14. Corriente verticalmente
- Page 88 and 89: Figura 15. Corriente verticalmente
- Page 90 and 91: Figura 16. Mapas de igual amplitud.
- Page 92 and 93: BIOTOPO MARINO ALGORRI OM98011 Los
- Page 94 and 95:
BIOTOPO MARINO ALGORRI OM98011 una
- Page 96 and 97:
BIOTOPO MARINO ALGORRI OM98011 - Di
- Page 98 and 99:
Figura 19. Concentración de limos
- Page 100 and 101:
Figura 20. Concentración de limos
- Page 102:
Figura 21. Concentración de limos
- Page 105 and 106:
BIOTOPO MARINO ALGORRI OM98011 comp
- Page 107 and 108:
PROFUNDIDAD (m) 0,0 0,5 1,0 1,5 2,0
- Page 109 and 110:
BIOTOPO MARINO ALGORRI OM98011 mini
- Page 111 and 112:
BIOTOPO MARINO ALGORRI OM98011 de m
- Page 113 and 114:
BIOTOPO MARINO ALGORRI OM98011 Para
- Page 116 and 117:
BIOTOPO MARINO ALGORRI OM98011 VIII
- Page 118 and 119:
BIOTOPO MARINO ALGORRI OM98011 El c
- Page 120 and 121:
BIOTOPO MARINO ALGORRI OM98011 En l
- Page 122 and 123:
Figura 26. Especies con tendencia a
- Page 124 and 125:
Figura 28. Especies esporádicas.
- Page 126 and 127:
BIOTOPO MARINO ALGORRI OM98011 Por
- Page 128 and 129:
BIOTOPO MARINO ALGORRI OM98011 de 2
- Page 130 and 131:
BIOTOPO MARINO ALGORRI OM98011 3.4.
- Page 132 and 133:
BIOTOPO MARINO ALGORRI OM98011 IX.-
- Page 134 and 135:
Tabla 8. Continuación.
- Page 136 and 137:
Tabla 9. Continuación.
- Page 138 and 139:
BIOTOPO MARINO ALGORRI OM98011 Espe
- Page 140 and 141:
Figura 30. Representación gráfica
- Page 142 and 143:
BIOTOPO MARINO ALGORRI OM98011 X.-
- Page 144 and 145:
BIOTOPO MARINO ALGORRI OM98011 La d
- Page 146 and 147:
12 13 Fotografías 12 y 13. Rocas d
- Page 148 and 149:
BIOTOPO MARINO ALGORRI OM98011 incl
- Page 150 and 151:
BIOTOPO MARINO ALGORRI OM98011 cond
- Page 152 and 153:
FIGURA 32: Diferentes propuestas pa
- Page 154 and 155:
BIOTOPO MARINO ALGORRI OM98011 En d
- Page 156 and 157:
BIOTOPO MARINO ALGORRI OM98011 4. A
- Page 158 and 159:
BIOTOPO MARINO ALGORRI OM98011 XI.-
- Page 160 and 161:
BIOTOPO MARINO ALGORRI OM98011 ELOS
- Page 162 and 163:
BIOTOPO MARINO ALGORRI OM98011 L.C.
- Page 164:
BIOTOPO MARINO ALGORRI OM98011 VALE