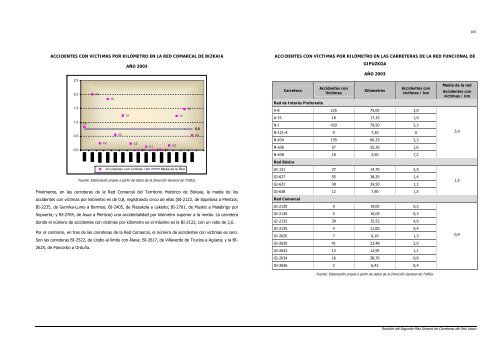
ACCIDENTES CON VÍCTIMAS POR KILÓMETRO EN LA RED DE INTERÉS PREFERENTE DE BIZKAIA 8,0 7,0 6,0 5,0 4,0 3,0 2,0 1,0 0,0 1,7 7,3 1,5 AÑO 2003 0,3 2,0 AP-68 A-8 N-240 N-629 N-633 N-634 N-636 N-637 N-639 N-644 Acci<strong>de</strong>ntes con victimas / km Media <strong>de</strong> <strong>la</strong> Red Fuente: E<strong>la</strong>boración propia a partir <strong>de</strong> datos <strong>de</strong> <strong>la</strong> Dirección General <strong>de</strong> Tráfico. De <strong>la</strong>s carreteras <strong>de</strong> <strong>la</strong> Red <strong>de</strong> Interés Preferente <strong>de</strong>l País Vasco, es en el Territorio Histórico <strong>de</strong> Bizkaia don<strong>de</strong> <strong>la</strong> media <strong>de</strong>l número <strong>de</strong> acci<strong>de</strong>ntes con víctimas / km es <strong>la</strong> mayor <strong>de</strong> todas, siendo su valor <strong>de</strong> 4,0. Tan sólo dos <strong>de</strong> <strong>la</strong>s diez carreteras incluidas en esta jerarquización tiene un ratio superior a dicho valor. Son <strong>la</strong> Autopista A-8 con 7,3 acci<strong>de</strong>ntes con víctimas por kilómetro y <strong>la</strong> N-637 con 6,0 acci<strong>de</strong>ntes con víctimas por kilómetro. En el extremo opuesto, se sitúa <strong>la</strong> carretera N-629 (en el Término Municipal <strong>de</strong> Lanestosa) con 0,3 acci<strong>de</strong>ntes con víctimas por kilómetro en el año 2003. 3,8 1,0 6,0 1,1 4,0 3,4 ACCIDENTES CON VÍCTIMAS POR KILÓMETRO EN LA RED BÁSICA DE BIZKAIA 12,0 10,0 8,0 6,0 4,0 2,0 0,0 5,5 1,3 0,0 2,7 AÑO 2003 0,3 2,3 1,0 3,4 3,2 3,0 BI-604 BI-623 BI-624 BI-625 BI-630 BI-631 BI-633 BI-634 BI-635 BI-636 BI-637 BI-638 Acci<strong>de</strong>ntes con victimas / km Media <strong>de</strong> <strong>la</strong> Red Fuente: E<strong>la</strong>boración propia a partir <strong>de</strong> datos <strong>de</strong> <strong>la</strong> Dirección General <strong>de</strong> Tráfico. En el caso <strong>de</strong> <strong>la</strong>s carreteras <strong>de</strong> <strong>la</strong> Red Básica, cinco <strong>de</strong> <strong>la</strong>s doce incluidas en este grupo tienen, en el año 2003, una acci<strong>de</strong>ntalidad por kilómetro superior a <strong>la</strong> media (que es <strong>de</strong> 2,5 acci<strong>de</strong>ntes con víctimas / km). Son <strong>la</strong> BI-604 (<strong>de</strong> Bilbao a Asua, por Enekuri), <strong>la</strong> BI-625 (Orduña - Bilbao), <strong>la</strong> BI-634 (Berango - Mungia), <strong>la</strong> BI-635 (Lemoa – Gernika-Lumo), <strong>la</strong> BI-636 (<strong>de</strong> Bilbao a Reinosa), y <strong>la</strong> carretera BI-637 (Erandio - Berango), <strong>de</strong>stacando esta última por registrar un valor muy superior a <strong>la</strong> media, 10,6 acci<strong>de</strong>ntes con víctimas por kilómetro. En el extremo opuesto se encuentran <strong>la</strong>s carreteras BI-604 y BI-638, con ningún acci<strong>de</strong>nte con víctimas en el año 2003. De <strong>la</strong> carretera BI-639 no existen datos disponibles. 104 Revisión <strong>de</strong>l Segundo P<strong>la</strong>n General <strong>de</strong> Carreteras <strong>de</strong>l País Vasco 10 ,6 2,5 0,0
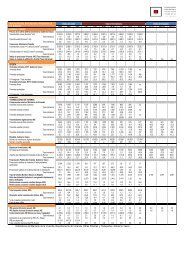
ACCIDENTES CON VÍCTIMAS POR KILÓMETRO EN LA RED COMARCAL DE BIZKAIA 2,5 2,0 1,5 1,0 0,5 0,0 0,8 2,0 0,2 1,8 0,5 AÑO 2003 1,2 0,2 0,0 0,1 0,0 0,0 Acci<strong>de</strong>ntes con victimas / km Media <strong>de</strong> <strong>la</strong> Red Fuente: E<strong>la</strong>boración propia a partir <strong>de</strong> datos <strong>de</strong> <strong>la</strong> Dirección General <strong>de</strong> Tráfico. Finalmente, en <strong>la</strong>s carreteras <strong>de</strong> <strong>la</strong> Red Comarcal <strong>de</strong>l Territorio Histórico <strong>de</strong> Bizkaia, <strong>la</strong> media <strong>de</strong> los acci<strong>de</strong>ntes con víctimas por kilómetro es <strong>de</strong> 0,8, registrando cinco <strong>de</strong> el<strong>la</strong>s (BI-2122, <strong>de</strong> Sope<strong>la</strong>na a Plentzia; BI-2235, <strong>de</strong> Gernika-Lumo a Bermeo; BI-2405, <strong>de</strong> P<strong>la</strong>zako<strong>la</strong> a Lekeito; BI-2701, <strong>de</strong> Muskiz a Ma<strong>la</strong>brigo por Sopuerta; y BI-2704, <strong>de</strong> Asua a Plentzia) una acci<strong>de</strong>ntalidad por kilómetro superior a <strong>la</strong> media. La carretera don<strong>de</strong> el número <strong>de</strong> acci<strong>de</strong>ntes con víctimas por kilómetro es el máximo es <strong>la</strong> BI-2122, con un ratio <strong>de</strong> 2,6. Por el contrario, en tres <strong>de</strong> <strong>la</strong>s carreteras <strong>de</strong> <strong>la</strong> Red Comarcal, el número <strong>de</strong> acci<strong>de</strong>ntes con víctimas es cero. Son <strong>la</strong>s carreteras BI-2522, <strong>de</strong> Llodio al límite con Á<strong>la</strong>va; BI-2617, <strong>de</strong> Vil<strong>la</strong>ver<strong>de</strong> <strong>de</strong> Trucios a Agüera; y <strong>la</strong> BI- 2625, <strong>de</strong> Pancorbo a Orduña. 0,2 1,2 1,5 0,8 0,5 ACCIDENTES CON VÍCTIMAS POR KILÓMETRO EN LAS CARRETERAS DE LA RED FUNCIONAL DE GIPUZKOA Carretera Acci<strong>de</strong>ntes con Víctimas AÑO 2003 Kilómetros Acci<strong>de</strong>ntes con víctimas / km Red <strong>de</strong> Interés Preferente A-8 225 75,00 3,0 A-15 18 17,32 1,0 N-I 420 79,50 5,3 N-121-A 0 7,20 0 N-634 155 66,33 2,3 N-636 57 35,35 1,6 N-638 18 2,50 7,2 Red Básica GI-131 37 14,70 2,5 GI-627 55 38,29 1,4 GI-631 38 34,50 1,1 GI-638 12 7,90 1,5 Red Comarcal GI-2120 9 19,00 0,5 GI-2130 5 16,09 0,3 GI-2132 39 15,53 4,9 GI-2135 4 11,00 0,4 GI-2620 7 6,10 1,3 GI-2630 41 23,48 2,0 GI-2633 13 12,95 1,1 GI-2634 16 38,76 0,8 GI-2636 2 6,42 0,4 Fuente: E<strong>la</strong>boración propia a partir <strong>de</strong> datos <strong>de</strong> <strong>la</strong> Dirección General <strong>de</strong> Tráfico. Media <strong>de</strong> <strong>la</strong> <strong>red</strong> Acci<strong>de</strong>ntes con víctimas / km 3,4 1,5 0,9 105 Revisión <strong>de</strong>l Segundo P<strong>la</strong>n General <strong>de</strong> Carreteras <strong>de</strong>l País Vasco
- Page 1 and 2:
2. ANÁLISIS DE LA SITUACIÓN ACTUA
- Page 3 and 4:
DISTRIBUCIÓN DE LA LONGITUD DE CAR
- Page 5 and 6:
En lo que se refiere a la Red de In
- Page 7 and 8:
DISTRIBUCIÓN DE LA RED BÁSICA SEG
- Page 9 and 10:
2,0 1,8 1,6 1,4 1,2 1,0 0,8 0,6 0,4
- Page 11 and 12:
RED OBJETO DE LA COMUNIDAD AUTÓNOM
- Page 13 and 14:
A la vista de estos datos de la Red
- Page 15 and 16:
0,25 0,20 0,15 0,10 0,05 0,00 DENSI
- Page 17 and 18:
Carretera N-622: de Vitoria-Gasteiz
- Page 19 and 20:
√ P.K. 18 a 30; radios inferiores
- Page 21 and 22:
Carretera Red de Interés Preferent
- Page 23 and 24:
2.1.2.3. Velocidades específicas A
- Page 26 and 27:
2.1.2.4. Caídas de Velocidad La p
- Page 29 and 30:
2.1.3 Radios de Curvatura El trazad
- Page 31 and 32:
Radios de Curvatura del Territorio
- Page 33 and 34:
Radios de Curvatura del Territorio
- Page 38 and 39:
2.1.4 Sección transversal 2.1.4.1.
- Page 40 and 41:
NÚMERO DE CARRILES EN LAS CARRETER
- Page 42 and 43:
NÚMERO DE CARRILES EN LAS AUTOPIST
- Page 44 and 45:
NÚMERO DE CARRILES EN LAS CARRETER
- Page 47 and 48: 2.1.4.2. Anchos de plataforma El es
- Page 49 and 50: Anchos de Plataforma del Territorio
- Page 51 and 52: Finalmente, en la Red Comarcal de B
- Page 53 and 54: ANCHOS DE PLATAFORMA EN LAS CARRETE
- Page 58 and 59: 2.1.5 Posibilidad de adelantamiento
- Page 60: Tal y como se observa en la gráfic
- Page 63 and 64: DISTRIBUCIÓN DEL TOTAL DE ACCIDENT
- Page 65 and 66: LESIVIDAD EN LAS CARRETERAS DE LA R
- Page 67 and 68: Territorio Histórico de Álava ACC
- Page 69 and 70: Territorio Histórico de Bizkaia AC
- Page 71 and 72: Tipo de accidente Absoluto 1999 200
- Page 73 and 74: DISTRIBUCIÓN DE ACCIDENTES SEGÚN
- Page 75 and 76: En el conjunto de las carreteras de
- Page 77 and 78: ACCIDENTES CON VÍCTIMAS SEGÚN MES
- Page 79 and 80: ACCIDENTES SEGÚN MES EN LAS CARRET
- Page 81 and 82: Carretera Accidentes con Víctimas
- Page 83 and 84: Carretera Accidentes con Víctimas
- Page 85 and 86: Carretera Accidentes con Víctimas
- Page 87 and 88: Carretera Accidentes con Víctimas
- Page 89 and 90: Carretera Accidentes con Víctimas
- Page 91 and 92: EVOLUCIÓN DEL NÚMERO DE ACCIDENTE
- Page 93 and 94: 2.1.6.8. Accidentes por kilómetro
- Page 95: Carretera Accidentes con Víctimas
- Page 99 and 100: ACCIDENTES POR KILÓMETRO EN LA RED
- Page 101 and 102: AUTOPISTAS, AUTOVÍAS Y CARRETERAS
- Page 103 and 104: DISTRIBUCIÓN DE TCA POR RANGOS DE
- Page 105: TCA EN LAS CARRETERAS DE LA RED FUN
- Page 108 and 109: INTERSECCIONES SEGÚN TIPOLOGÍA EN
- Page 111 and 112: 2.1.7.2. Red Funcional Además del
- Page 113 and 114: INTERSECCIONES POR KILÓMETRO EN LA
- Page 115 and 116: √ Número de semáforos. √ Núm
- Page 117 and 118: TRAVESÍAS DE CONFLICTIVIDAD ALTA E
- Page 119 and 120: TRAVESÍAS DE CONFLICTIVIDAD ALTA E
- Page 121: La distribución de TCAs en traves
- Page 124 and 125: A continuación se presenta la evol
- Page 126 and 127: En la siguiente tabla se presentan
- Page 128 and 129: Estación Carretera Tipo P.K. Local
- Page 130 and 131: Estación Carretera Tipo P.K. Local
- Page 132 and 133: Estación Carretera Tipo P.K. Local
- Page 134 and 135: Estación Carretera Tipo P.K. Local
- Page 136 and 137: Por su parte, aquellas carreteras d
- Page 138 and 139: 20.00% 18.00% 16.00% 14.00% 12.00%
- Page 140 and 141: INTENSIDAD DE PESADOS EN LA CARRETE
- Page 142 and 143: INTENSIDAD DE PESADOS EN LA CARRETE
- Page 144 and 145: PORCENTAJE DE PESADOS EN LA CARRETE
- Page 146 and 147:
PORCENTAJE DE PESADOS EN LA CARRETE
- Page 148 and 149:
El acceso al Aeropuerto de Loiu, en
- Page 150 and 151:
Estación Carretera Tipo P.K. Local
- Page 152 and 153:
Estación Carretera Tipo P.K. Local
- Page 154 and 155:
Estación Carretera Tipo P.K. Local
- Page 156 and 157:
Se presenta a continuación un grá
- Page 158 and 159:
4,500 4,000 3,500 3,000 2,500 2,000
- Page 160 and 161:
INTENSIDAD DE TRÁFICO EN LA CARRET
- Page 162 and 163:
INTENSIDAD DE TRÁFICO EN LA CARRET
- Page 164 and 165:
INTENSIDAD DE TRÁFICO EN LA CARRET
- Page 166 and 167:
40.000 35.000 30.000 25.000 20.000
- Page 168 and 169:
INTENSIDAD DE TRÁFICO EN LA CARRET
- Page 170 and 171:
INTENSIDAD DE TRÁFICO EN LA CARRET
- Page 172 and 173:
INTENSIDAD DE TRÁFICO EN LAS CARRE
- Page 174 and 175:
INTENSIDAD DE TRÁFICO EN LAS CARRE
- Page 176 and 177:
Estación Carretera Tipo P.K. Local
- Page 178 and 179:
Estación Carretera Tipo P.K. Local
- Page 180 and 181:
Estación Carretera Tipo P.K. Local
- Page 182 and 183:
FLUJOS TOTALES DE TRÁFICO EN LA RE
- Page 184 and 185:
Estación Carretera P.K. Localidad
- Page 186 and 187:
Estación Carretera P.K. Localidad
- Page 188 and 189:
Estación Carretera P.K. Localidad
- Page 190 and 191:
De manera análoga al análisis ant
- Page 192 and 193:
Estación Carretera P.K. Localidad
- Page 194 and 195:
Estación Carretera P.K. Localidad
- Page 196 and 197:
Estación Carretera P.K. Localidad
- Page 198 and 199:
Por último, de la Red Comarcal las
- Page 200 and 201:
Estación Carretera P.K. Localidad
- Page 202 and 203:
Estación Carretera P.K. Localidad
- Page 204 and 205:
Estación Carretera P.K. Localidad
- Page 206 and 207:
Estación Carretera P.K. Localidad
- Page 208 and 209:
Estación Carretera P.K. Localidad
- Page 210 and 211:
Estación Carretera P.K. Localidad
- Page 212 and 213:
40,00% 35,00% 30,00% 25,00% 20,00%
- Page 214 and 215:
25,00% 20,00% 15,00% 10,00% TRÁFIC
- Page 216 and 217:
80,00% 70,00% 60,00% 50,00% 40,00%
- Page 218 and 219:
2.2.2.6. Evolución del Tráfico se
- Page 223 and 224:
2.2.3 Capacidad de la red y niveles
- Page 225 and 226:
Cuando el tráfico no está formado
- Page 227 and 228:
2.2.3.2. Situación actual en la Re
- Page 229 and 230:
Respecto al conjunto de la Comunida
- Page 231 and 232:
NIVEL DE SERVICIO EN EL TERRITORIO
- Page 234 and 235:
2.2.3.3. Resto de la Red Funcional
- Page 236 and 237:
2.3. CARACTERIZACIÓN DE LA MOVILID
- Page 238 and 239:
La cuota de reparto modal correspon
- Page 240 and 241:
2.3.1.2. Transporte de mercancías
- Page 242 and 243:
La cuota de reparto modal correspon
- Page 244 and 245:
2.3.2 Transporte por carretera 2.3.
- Page 246 and 247:
En el día medio del año 2003 la d
- Page 248 and 249:
Naturaleza del viaje TONELADAS TRAN
- Page 250 and 251:
Naturaleza del viaje EuskoTren Cer.
- Page 252 and 253:
√ Núcleo de Donostia-San Sebasti
- Page 254 and 255:
Naturaleza del viaje DEMANDA DE TRA
- Page 256 and 257:
2.4. LA MOVILIDAD EN LA RED FUNCION
- Page 258 and 259:
Origen Destino Itinerario Total Lig
- Page 260 and 261:
Origen Destino Itinerario Total Lig
- Page 262 and 263:
Origen Destino Itinerario Total Lig
- Page 264 and 265:
Origen Destino Itinerario Total Lig
- Page 266 and 267:
Por último, la matriz Origen / Des
- Page 268 and 269:
ESQUEMA METODOLÓGICO 276 Revisión
- Page 270 and 271:
PUNTOS DE CONTROL DE AFOROS. AÑO 2
- Page 272 and 273:
Origen Interno País Vasco Externo
- Page 274:
Zonificación Nombre Zona Zonificac
- Page 277 and 278:
√ Estratificación de la demanda
- Page 280:
2.5.6 Isocronas Con el fin de visua
- Page 289:
Las zonas que presentan mejor acces