2. análisis de la situación actual de la red viaria - Garraioak
2. análisis de la situación actual de la red viaria - Garraioak
2. análisis de la situación actual de la red viaria - Garraioak

You also want an ePaper? Increase the reach of your titles
YUMPU automatically turns print PDFs into web optimized ePapers that Google loves.
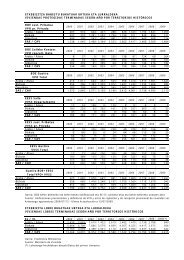
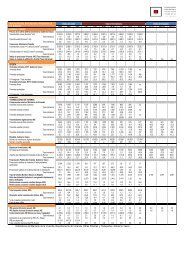
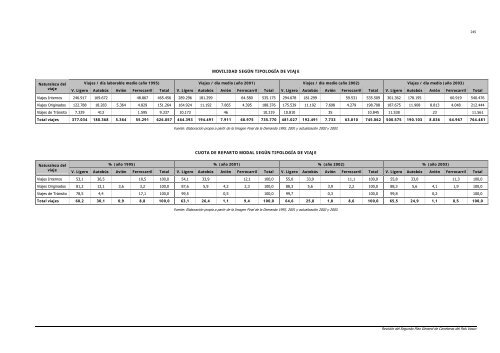
MOVILIDAD SEGÚN TIPOLOGÍA DE VIAJE<br />
Naturaleza <strong>de</strong>l Viajes / día <strong>la</strong>borable medio (año 1995) Viajes / día medio (año 2001) Viajes / día medio (año 2002) Viajes / día medio (año 2003)<br />
viaje<br />
V. Ligero Autobús Avión Ferrocarril Total V. Ligero Autobús Avión Ferrocarril Total V. Ligero Autobús Avión Ferrocarril Total V. Ligero Autobús Avión Ferrocarril Total<br />
Viajes Internos 246.917 169.672 48.867 465.456 289.296 181.299 64.580 535.175 294.678 181.299 59.531 535.509 301.362 178.195 60.919 540.476<br />
Viajes Originados 12<strong>2.</strong>788 18.283 5.364 4.829 151.264 164.924 11.192 7.865 4.395 188.376 175.539 11.192 7.698 4.279 198.708 187.675 11.908 8.813 4.048 21<strong>2.</strong>444<br />
Viajes <strong>de</strong> Tránsito 7.329 413 1.595 9.337 10.173 46 10.219 10.810 35 10.845 11.538 23 11.561<br />
Total viajes 377.034 188.368 5.364 55.291 626.057 464.393 194.491 7.911 68.975 735.770 481.027 19<strong>2.</strong>491 7.733 63.810 745.062 500.575 190.103 8.836 64.967 764.481<br />
Naturaleza <strong>de</strong>l<br />
viaje<br />
Fuente: E<strong>la</strong>boración propia a partir <strong>de</strong> <strong>la</strong> Imagen Final <strong>de</strong> <strong>la</strong> Demanda 1995, 2001 y <strong>actual</strong>ización 2002 y 2003.<br />
CUOTA DE REPARTO MODAL SEGÚN TIPOLOGÍA DE VIAJE<br />
% (año 1995) % (año 2001) % (año 2002) % (año 2003)<br />
V. Ligero Autobús Avión Ferrocarril Total V. Ligero Autobús Avión Ferrocarril Total V. Ligero Autobús Avión Ferrocarril Total V. Ligero Autobús Avión Ferrocarril Total<br />
Viajes Internos 53,1 36,5 10,5 100,0 54,1 33,9 12,1 100,0 55,0 33,9 11,1 100,0 55,8 33,0 11,3 100,0<br />
Viajes Originados 81,2 12,1 3,6 3,2 100,0 87,6 5,9 4,2 2,3 100,0 88,3 5,6 3,9 2,2 100,0 88,3 5,6 4,1 1,9 100,0<br />
Viajes <strong>de</strong> Tránsito 78,5 4,4 17,1 100,0 99,5 0,5 100,0 99,7 0,3 100,0 99,8 0,2 100,0<br />
Total viajes 60,2 30,1 0,9 8,8 100,0 63,1 26,4 1,1 9,4 100,0 64,6 25,8 1,0 8,6 100,0 65,5 24,9 1,1 8,5 100,0<br />
Fuente: E<strong>la</strong>boración propia a partir <strong>de</strong> <strong>la</strong> Imagen Final <strong>de</strong> <strong>la</strong> Demanda 1995, 2001 y <strong>actual</strong>ización 2002 y 2003.<br />
245<br />
Revisión <strong>de</strong>l Segundo P<strong>la</strong>n General <strong>de</strong> Carreteras <strong>de</strong>l País Vasco