Relatorio_final_BAI_10. - Cabo Verde
Relatorio_final_BAI_10. - Cabo Verde
Relatorio_final_BAI_10. - Cabo Verde

Create successful ePaper yourself
Turn your PDF publications into a flip-book with our unique Google optimized e-Paper software.
.110<br />
<strong>BAI</strong> - Relatório & Contas | 10 - 8. Análise Financeira<br />
<strong>BAI</strong> - Annual Report | 10 - 8. Financial Analysis<br />
Analisando os gráficos abaixo, podemos distinguir as flutuações<br />
do resultado líquido, tanto mensal como acumulado (em milhões<br />
de escudos):<br />
80<br />
60<br />
40<br />
20<br />
0<br />
-20<br />
-40<br />
-60<br />
-80<br />
-100<br />
-120<br />
-140<br />
0<br />
-50<br />
-100<br />
-150<br />
-200<br />
-250<br />
-300<br />
-12,7<br />
-35,1<br />
-47,0<br />
-91,1<br />
-158,5<br />
An analysis of the following charts shows monthly and accumulated fluctuations<br />
in net income for the period, (million escudos):<br />
Evolução Resultado Líquido Após Impostos Mensal<br />
Income after tax monthly<br />
-12,7<br />
Jan. 10<br />
Jan. 10<br />
Jan. 10<br />
Jan. 10<br />
-22,4<br />
Fev. 10<br />
Feb. 10<br />
Fev. 10<br />
Feb. 10<br />
-11,9<br />
Mar. 10<br />
Mar. 10<br />
Mar. 10<br />
Mar. 10<br />
-44,1<br />
Abr. 10<br />
Apr. 10<br />
Abr. 10<br />
Apr. 10<br />
-67,4<br />
Mai. 10<br />
May. 10<br />
Evolução Resultado Líquido Após Impostos Acumulado<br />
Accumulated income after tax<br />
Mai. 10<br />
May. 10<br />
-33,2<br />
Jun. 10<br />
Jun. 10<br />
-191,7<br />
Jun. 10<br />
Jun. 10<br />
55,0<br />
Jul. 10<br />
Jul. 10<br />
-136,7<br />
Jul. 10<br />
Jul. 10<br />
-42,1<br />
Ago. 10<br />
Aug. 10<br />
-178,8<br />
Ago. 10<br />
Aug. 10<br />
53,2<br />
Set. 10<br />
Sep. 10<br />
-125,6<br />
Set. 10<br />
Sep. 10<br />
-0,9<br />
Out. 10<br />
Oct. 10<br />
-126,5<br />
Out. 10<br />
Oct. 10<br />
-122,3<br />
Nov. 10<br />
Nov. 10<br />
-248,8<br />
Nov. 10<br />
Nov. 10<br />
47,4<br />
Dez. 10<br />
Dec. 10<br />
-201,4<br />
Dez. 10<br />
Dec. 10<br />
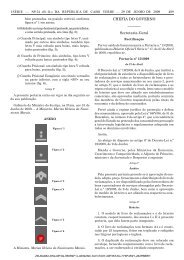
C.<br />
Rácios Prudenciais<br />
Prudential Ratios<br />
Apesar dos resultados negativos (Resultado Liquido do Exercício,<br />
bem como dos Resultados Transitados), os principais indicadores<br />
económicos de desempenho e prudenciais do <strong>BAI</strong>CV,<br />
registaram uma evolução positiva e favorável, apesar da conjuntura<br />
de crise internacional e duma concorrência cada vez<br />
mais agressiva a nível do pricing, no mercado bancário nacional.<br />
Rácios Prudenciais<br />
Prudential ratings<br />
<strong>BAI</strong> - Relatório & Contas | 10 - 8. Análise Financeira<br />
<strong>BAI</strong> - Annual Report | 10 - 8. Financial Analysis<br />
In spite of the losses (net income for the period and retained earnings), the evolution<br />
of <strong>BAI</strong>CV’s key economic performance and prudential indicators was both<br />
positive and favourable, notwithstanding an environment of international crisis<br />
and increasingly aggressive competition on a pricing level in the domestic banking<br />
market.<br />
2009<br />
2010<br />
Var. Variation<br />
Abs. total %<br />
.Fundos Próprios 860,747,000 1,071,097,815 210,350,815 24%<br />
Own funds<br />
.Rácio de Solvabilidade 36.04% 25.07% -11.0% -30%<br />
Solvency ratio<br />
.Rácio de Cobertura do Imobilizado 2<strong>10.</strong>00% 208.48% -1.5% -0.7%<br />
Fixed assets coverage ratio<br />
.Limite Concentração Risco Crédito-Empresa Grupo 197,670,038 247,865,938 50,195,900 25.4%<br />
Credit risk concentration limit-group<br />
.Limite Concentração Risco Crédito-Empresa Individual 247,087,547 309,832,422 62,744,875 25.4%<br />
Credit risk concentration limit-separate<br />
.Limite Concentração Risco Crédito-Grande Risco 98,835,019 123,932,969 25,097,950 25.4%<br />
Credit risk concentration limit-major risk<br />
.Rácio de Cobertura das Responsabilidades 149.20% 81.73% -67.5% -45.2%<br />
Liabilities coverage ratio<br />
.Rácio de Títulos de Divida Publica 6.40% 6.81% 0.4% 6.4%<br />
Public debt securities ratio<br />
111.