Departamento de Física Teórica, Atómica y Óptica - Quantalab ...
Departamento de Física Teórica, Atómica y Óptica - Quantalab ...
Departamento de Física Teórica, Atómica y Óptica - Quantalab ...

You also want an ePaper? Increase the reach of your titles
YUMPU automatically turns print PDFs into web optimized ePapers that Google loves.
C a+b (μg/cm 2 )<br />
a<br />
χ<br />
c<br />
60<br />
50<br />
40<br />
30<br />
20<br />
10<br />
0<br />
28/02/02 25/03/02 19/04/02 14/05/02 8/06/02<br />
12<br />
10<br />
8<br />
6<br />
4<br />
2<br />
0<br />
-2<br />
-4<br />
-6<br />
Fecha<br />
2<br />
Δdd 1<br />
2<br />
Δdd 2<br />
-8<br />
28/02/02 25/03/02 19/04/02 14/05/02 8/06/02<br />
Fecha<br />
BSL<br />
e<br />
1.6<br />
1.4<br />
1.2<br />
1<br />
0.8<br />
0.6<br />
0.4<br />
0.2<br />
2<br />
Δdd 1<br />
2<br />
Δ2 dd<br />
LAI<br />
b<br />
HotSpot<br />
d<br />
4.5<br />
4<br />
3.5<br />
3<br />
2.5<br />
2<br />
1.5<br />
1<br />
0.5<br />
0<br />
-0.5<br />
28/02/02 25/03/02 19/04/02 14/05/02 8/06/02<br />
1.4<br />
1.2<br />
1<br />
0.8<br />
0.6<br />
0.4<br />
0.2<br />
0<br />
-0.2<br />
-0.4<br />
0<br />
28/02/02 25/03/02 19/04/02 14/05/02 8/06/02<br />
Fecha<br />
Fecha<br />
2<br />
dd<br />
Δ1 2<br />
Δ2 -0.6<br />
28/02/02 25/03/02 19/04/02 14/05/02 8/06/02<br />
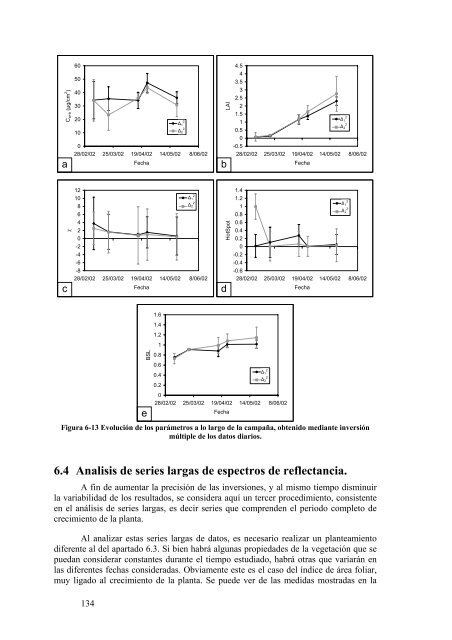
Figura 6-13 Evolución <strong>de</strong> los parámetros a lo largo <strong>de</strong> la campaña, obtenido mediante inversión<br />
múltiple <strong>de</strong> los datos diarios.<br />
2<br />
Δdd 1<br />
2<br />
Δdd 2<br />
Fecha<br />
6.4 Analisis <strong>de</strong> series largas <strong>de</strong> espectros <strong>de</strong> reflectancia.<br />
A fin <strong>de</strong> aumentar la precisión <strong>de</strong> las inversiones, y al mismo tiempo disminuir<br />
la variabilidad <strong>de</strong> los resultados, se consi<strong>de</strong>ra aquí un tercer procedimiento, consistente<br />
en el análisis <strong>de</strong> series largas, es <strong>de</strong>cir series que compren<strong>de</strong>n el periodo completo <strong>de</strong><br />
crecimiento <strong>de</strong> la planta.<br />
Al analizar estas series largas <strong>de</strong> datos, es necesario realizar un planteamiento<br />
diferente al <strong>de</strong>l apartado 6.3. Si bien habrá algunas propieda<strong>de</strong>s <strong>de</strong> la vegetación que se<br />
puedan consi<strong>de</strong>rar constantes durante el tiempo estudiado, habrá otras que variarán en<br />
las diferentes fechas consi<strong>de</strong>radas. Obviamente este es el caso <strong>de</strong>l índice <strong>de</strong> área foliar,<br />
muy ligado al crecimiento <strong>de</strong> la planta. Se pue<strong>de</strong> ver <strong>de</strong> las medidas mostradas en la<br />
134<br />
dd<br />
2<br />
dd<br />
Δ1 2<br />
Δ2 dd