Departamento de Física Teórica, Atómica y Óptica - Quantalab ...
Departamento de Física Teórica, Atómica y Óptica - Quantalab ...
Departamento de Física Teórica, Atómica y Óptica - Quantalab ...

You also want an ePaper? Increase the reach of your titles
YUMPU automatically turns print PDFs into web optimized ePapers that Google loves.
Número <strong>de</strong> píxeles<br />
a<br />
Número <strong>de</strong> píxeles<br />
b<br />
Número <strong>de</strong> píxeles<br />
c<br />
600000<br />
500000<br />
400000<br />
300000<br />
200000<br />
100000<br />
900000<br />
800000<br />
700000<br />
600000<br />
500000<br />
400000<br />
300000<br />
200000<br />
100000<br />
450000<br />
400000<br />
350000<br />
300000<br />
250000<br />
200000<br />
150000<br />
100000<br />
50000<br />
0<br />
0 0.2 0.4 0.6 0.8<br />
Reflectancia<br />
Banda 1<br />
Banda 2<br />
Banda 3<br />
Banda 4<br />
0<br />
0 0.2 0.4 0.6 0.8<br />
Reflectancia<br />
Banda 1<br />
Banda 2<br />
Banda 3<br />
Banda 4<br />
0<br />
0 0.2 0.4 0.6 0.8<br />
Reflectancia<br />
Banda 1<br />
Banda 2<br />
Banda 3<br />
Banda 4<br />
Número <strong>de</strong> Píxeles<br />
d<br />
Número <strong>de</strong> Píxeles<br />
e<br />
Número <strong>de</strong> Píxeles<br />
f<br />
700000<br />
600000<br />
500000<br />
400000<br />
300000<br />
200000<br />
100000<br />
900000<br />
800000<br />
700000<br />
600000<br />
500000<br />
400000<br />
300000<br />
200000<br />
100000<br />
450000<br />
400000<br />
350000<br />
300000<br />
250000<br />
200000<br />
150000<br />
100000<br />
50000<br />
0<br />
0 0.2 0.4 0.6 0.8<br />
Reflectancia<br />
Banda 1<br />
Banda 2<br />
Banda 3<br />
Banda 4<br />
0<br />
0 0.2 0.4 0.6 0.8<br />
Reflectancia<br />
Banda 1<br />
Banda 2<br />
Banda 3<br />
Banda 4<br />
0<br />
0 0.2 0.4 0.6 0.8<br />
Reflectancia<br />
Banda 1<br />
Banda 2<br />
Banda 3<br />
Banda 4<br />
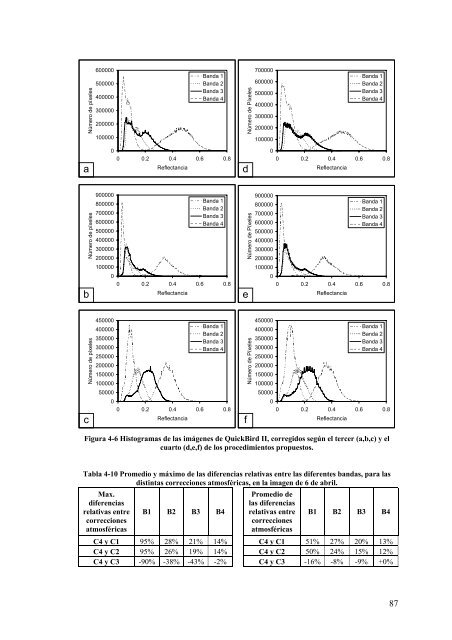
Figura 4-6 Histogramas <strong>de</strong> las imágenes <strong>de</strong> QuickBird II, corregidos según el tercer (a,b,c) y el<br />
cuarto (d,e,f) <strong>de</strong> los procedimientos propuestos.<br />
Tabla 4-10 Promedio y máximo <strong>de</strong> las diferencias relativas entre las diferentes bandas, para las<br />
distintas correcciones atmosféricas, en la imagen <strong>de</strong> 6 <strong>de</strong> abril.<br />
Max.<br />
diferencias<br />
relativas entre<br />
correcciones<br />
atmosféricas<br />
B1 B2 B3 B4<br />
Promedio <strong>de</strong><br />
las diferencias<br />
relativas entre<br />
correcciones<br />
atmosféricas<br />
B1 B2 B3 B4<br />
C4 y C1 95% 28% 21% 14% C4 y C1 51% 27% 20% 13%<br />
C4 y C2 95% 26% 19% 14% C4 y C2 50% 24% 15% 12%<br />
C4 y C3 -90% -38% -43% -2% C4 y C3 -16% -8% -9% +0%<br />
87