Estudio Hidrológico de la Cuenca del río Ilave 2008 - Autoridad ...
Estudio Hidrológico de la Cuenca del río Ilave 2008 - Autoridad ...
Estudio Hidrológico de la Cuenca del río Ilave 2008 - Autoridad ...

Create successful ePaper yourself
Turn your PDF publications into a flip-book with our unique Google optimized e-Paper software.
Ministerio <strong>de</strong> Agricultura<br />
<strong>Autoridad</strong> Nacional <strong>de</strong>l Agua<br />
Dirección <strong>de</strong> Conservación y P<strong>la</strong>neamiento <strong>de</strong> Recursos Hídricos<br />
Área <strong>de</strong> Aguas Superficiales<br />
Administración Local <strong>de</strong> Agua Huancané<br />
Proyecto:<br />
Evaluación <strong>de</strong> los Recursos Hídricos en <strong>la</strong>s <strong>Cuenca</strong>s<br />
<strong>de</strong> los Ríos Huancané y Suches<br />
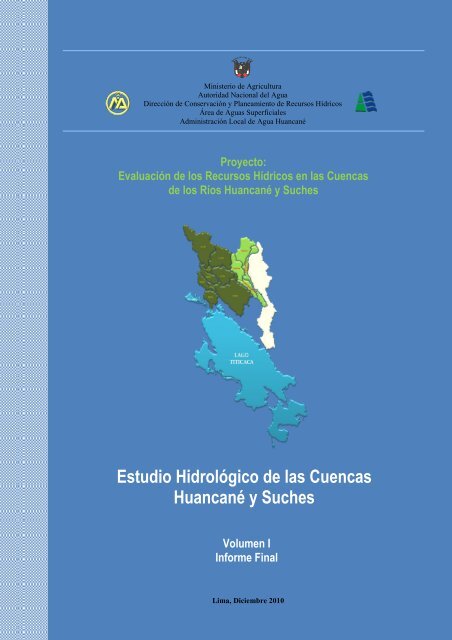
<strong>Estudio</strong> <strong>Hidrológico</strong> <strong>de</strong> <strong>la</strong>s <strong>Cuenca</strong>s<br />
Huancané y Suches<br />
Volumen I<br />
Informe Final<br />
Lima, Diciembre 2010
Ministerio <strong>de</strong> Agricultura<br />
<strong>Autoridad</strong> Nacional <strong>de</strong>l Agua<br />
Dirección <strong>de</strong> Conservación y P<strong>la</strong>neamiento <strong>de</strong> Recursos Hídricos<br />
Área <strong>de</strong> Aguas Superficiales<br />
Administración Local <strong>de</strong> Agua Huancané<br />
Proyecto:<br />
Evaluación <strong>de</strong> los Recursos Hídricos en <strong>la</strong>s <strong>Cuenca</strong>s <strong>de</strong> los Ríos<br />
Huancané y Suches<br />
Personal Directivo<br />
<strong>Estudio</strong> <strong>Hidrológico</strong><br />
Ing. Carlos Pagador Moya Jefe <strong>de</strong> <strong>la</strong> <strong>Autoridad</strong> Nacional <strong>de</strong>l Agua<br />
Ing. Óscar Ávalos Sanguinetti Director <strong>de</strong> Conservación y P<strong>la</strong>neamiento <strong>de</strong> Recursos<br />
Hídricos<br />
Ing. Emilse Benavi<strong>de</strong>s Casanoa Coordinador <strong>de</strong>l Área <strong>de</strong> Aguas Superficiales<br />
Ing. José Pitágoras Quispe Aragón Administrador Local <strong>de</strong> Agua Huancané<br />
Personal Participante<br />
César Ancco Carita (Ing. Agríco<strong>la</strong>) <strong>Estudio</strong> <strong>Hidrológico</strong><br />
Profesional Especialista <strong>de</strong> <strong>la</strong> DCPRH-ANA<br />
Omar Velásquez Figueroa (Ing. Agríco<strong>la</strong>) Asistente <strong>de</strong> Hidrología<br />
Miriam Glicet Ticona Sa<strong>la</strong>zar (Bach. Ing. Agríco<strong>la</strong>) Asistente <strong>de</strong> Hidrología<br />
Efraín Lujano Laura (Bach. Ing. Agríco<strong>la</strong>) Sistema <strong>de</strong> Información Geográfica (SIG)<br />
Abraham G. Morales Chiara (Bach. Ing. Agríco<strong>la</strong>) Técnico <strong>de</strong> Campo<br />
Erik Velásquez Cal<strong>la</strong> (Bach. Ing. Agríco<strong>la</strong>) Técnico <strong>de</strong> Campo<br />
Juan Quil<strong>la</strong> Chura (Bach. Ing. Agríco<strong>la</strong>) Técnico <strong>de</strong> Campo<br />
Deyvi Cristian Pari Huaquisto (Bach. Ing. Agríco<strong>la</strong>) Técnico <strong>de</strong> Campo<br />
Ernesto Ancco Carita (Bach. Ing. Agríco<strong>la</strong>) Técnico <strong>de</strong> Campo<br />
V<strong>la</strong>dimir Mamani Arizapana (Bach. Ing. Agríco<strong>la</strong>) Técnico <strong>de</strong> Campo<br />
Elvis Condori Condori (Bach. Ing. Agríco<strong>la</strong>) Técnico <strong>de</strong> Campo<br />
Lima, Diciembre 2010
<strong>Estudio</strong> <strong>Hidrológico</strong> <strong>de</strong> <strong>la</strong>s <strong>Cuenca</strong>s Huancané y Suches 2010<br />
RESUMEN<br />
El presente reporte proporciona <strong>la</strong> información respecto al estudio hidrológico realizado en el<br />
ámbito <strong>de</strong> <strong>la</strong>s cuencas Huancané y Suches. La cuenca Huancané políticamente se ubica en el<br />
<strong>de</strong>partamento <strong>de</strong> Puno, ocupa <strong>la</strong>s superficies <strong>de</strong> <strong>la</strong>s provincias <strong>de</strong> Huancané, Moho, San<br />
Antonio <strong>de</strong> Putina y Azángaro. La cuenca Suches se ubica en el <strong>de</strong>partamento <strong>de</strong> Puno (Perú) y<br />
La Paz (Bolivia), provincias <strong>de</strong> Huancané y San Antonio <strong>de</strong> Putina en el Perú y Franz Tamayo<br />
Camacho y Saavedra en Bolivia.<br />
La superficie total <strong>de</strong> <strong>la</strong> cuenca Huancané es <strong>de</strong> 3,631.18 km 2 , compuesto por nueve unida<strong>de</strong>s<br />
hidrográficas <strong>de</strong> nivel 5 (subcuenca Bajo Huancané, L<strong>la</strong>che, Medio Bajo Huancané, Tuyto,<br />
Medio Huancané, Muñani, Medio Alto Huancané, Pistune y Alto Huancané). La superficie<br />
total <strong>de</strong> <strong>la</strong> cuenca Suches es <strong>de</strong> 2930.73 km 2 (1160.75 km 2 correspon<strong>de</strong> al territorio peruano y<br />
1769.98 km 2 al territorio boliviano), <strong>la</strong>s subcuencas correspondientes al <strong>la</strong>do peruano son<br />
Chueña Huata Jahuira, Caylloma, Trapiche e intercuenca <strong>de</strong>l <strong>río</strong> Suches.<br />
Las fuentes <strong>de</strong> aguas superficiales se han i<strong>de</strong>ntificado a través <strong>de</strong> los trabajos <strong>de</strong> inventario,<br />
según los resultados en <strong>la</strong> cuenca Huancané existen un total <strong>de</strong> 1695 fuentes hídricas<br />
(distribuidas en <strong>río</strong>s, quebradas, manantiales y <strong>la</strong>gunas) y en <strong>la</strong> cuenca Suches (Perú) 482<br />
fuentes hídricas (distribuidas en <strong>río</strong>s, quebradas, manantiales, <strong>la</strong>gunas, bofedales y nevados).<br />
Las variables climatológicas evaluadas son <strong>la</strong> precipitación, temperatura (media, máxima y<br />
mínima), humedad re<strong>la</strong>tiva, evaporación, horas <strong>de</strong> sol, velocidad y dirección <strong>de</strong>l viento, y <strong>la</strong><br />
evapotranspiración potencial. Según <strong>la</strong> c<strong>la</strong>sificación climática <strong>la</strong>s cuencas Huancané y Suches<br />
correspon<strong>de</strong>n a <strong>la</strong> región <strong>de</strong> humedad <strong>de</strong> sub-húmedo a húmedo y a <strong>la</strong> región <strong>de</strong> temperatura <strong>de</strong><br />
taiga a microtérmico.<br />
La evaluación <strong>de</strong>l comportamiento pluviométrico <strong>de</strong> <strong>la</strong>s cuencas Huancané y Suches, se ha<br />
analizado <strong>la</strong> consistencia y completación <strong>de</strong> <strong>la</strong> información <strong>de</strong> precipitaciones mensuales <strong>de</strong> <strong>la</strong>s<br />
16 estaciones meteorológicas ubicadas en el ámbito <strong>de</strong> <strong>la</strong>s cuencas <strong>de</strong> estudio. A<strong>de</strong>más, con <strong>la</strong><br />
información pluviométrica consistente y tratada, se ha calcu<strong>la</strong>do <strong>la</strong> serie mensual <strong>de</strong> <strong>la</strong>s<br />
precipitaciones areales <strong>de</strong>l pe<strong>río</strong>do 1956-2009 para <strong>la</strong>s subcuencas <strong>de</strong> interés.<br />
La evaluación <strong>de</strong>l comportamiento hidrológico <strong>de</strong> <strong>la</strong>s cuencas Huancané y Suches, se ha<br />
analizado <strong>la</strong> consistencia y completación <strong>de</strong> <strong>la</strong> información <strong>de</strong> <strong>la</strong>s <strong>de</strong>scargas medias mensuales<br />
<strong>de</strong> los <strong>río</strong>s Huancané, Suches y Ramis. Con <strong>la</strong> información consistente y tratada <strong>de</strong>l pe<strong>río</strong>do<br />
1956-2009, se ha calcu<strong>la</strong>do <strong>la</strong> persistencia <strong>de</strong> caudales medios al 75% <strong>de</strong> persistencia para los<br />
<strong>río</strong>s en estudio.<br />
La mo<strong>de</strong><strong>la</strong>ción hidrológica <strong>de</strong> precipitación-escorrentía en <strong>la</strong>s cuencas Huancané y Suches, se<br />
ha realizado para <strong>la</strong> generación <strong>de</strong> <strong>la</strong>s <strong>de</strong>scargas medias en <strong>la</strong>s subcuencas <strong>de</strong> interés. Para ello<br />
se ha calibrado el mo<strong>de</strong>lo en los <strong>río</strong>s Huancané (estación hidrométrica Puente Huancané) y<br />
Suches (estación hidrométrica Puente Escoma), con los parámetros calibrados en ambos <strong>río</strong>s,<br />
se ha <strong>de</strong>sarrol<strong>la</strong>do el mo<strong>de</strong><strong>la</strong>miento hidrológico con <strong>la</strong> información <strong>de</strong> serie mensual <strong>de</strong> <strong>la</strong>s<br />
precipitaciones areales y generación <strong>de</strong> caudales para <strong>la</strong>s subcuencas <strong>de</strong> interés. A<strong>de</strong>más, se ha<br />
<strong>de</strong>sarrol<strong>la</strong>do <strong>la</strong> mo<strong>de</strong><strong>la</strong>ción estocástica para <strong>la</strong> generación <strong>de</strong> series sintéticas <strong>de</strong> caudales<br />
medios mensuales en <strong>la</strong>s subcuencas <strong>de</strong>l <strong>río</strong> Guanaco e Yaputira para el análisis <strong>de</strong> capacidad<br />
<strong>de</strong> almacenamiento <strong>de</strong> agua <strong>de</strong> los embalses propuestos Cal<strong>la</strong>tomaza e Yaputira.<br />
MINAG-ANA-DCPRH-AGUAS SUPERFICIALES Pág.1
<strong>Estudio</strong> <strong>Hidrológico</strong> <strong>de</strong> <strong>la</strong>s <strong>Cuenca</strong>s Huancané y Suches 2010<br />
La disponibilidad hídrica <strong>de</strong> <strong>la</strong>s cuencas Huancané y Suches, se ha obtenido a partir <strong>de</strong>l<br />
análisis <strong>de</strong> frecuencia <strong>de</strong> caudales al 75% <strong>de</strong> persistencia, para cada una <strong>de</strong> <strong>la</strong>s subcuencas <strong>de</strong><br />
interés. La fuente hídrica principal y único existente son aguas superficiales provenientes <strong>de</strong><br />
los <strong>río</strong>s <strong>de</strong> <strong>la</strong>s cuencas Huancané y Suches.<br />
La <strong>de</strong>manda hídrica total actual en <strong>la</strong> cuenca Huancané es <strong>de</strong> 35.87 hm 3 /año (33.83 hm 3 <strong>de</strong> uso<br />
agríco<strong>la</strong> <strong>de</strong> una superficie <strong>de</strong> 2345.62 ha bajo riego y 2.04 hm 3 <strong>de</strong> uso pob<strong>la</strong>cional) y el caudal<br />
ecológico estimado es <strong>de</strong> 31.67 hm 3 . Mientras en <strong>la</strong> cuenca Suches (Perú) el uso actual es <strong>de</strong><br />
16.09 hm 3 /año (uso agríco<strong>la</strong> 14.55 hm 3 cuya área es <strong>de</strong> 1358.43 ha, uso pob<strong>la</strong>cional 0.23 hm 3 y<br />
uso minero 1.31 hm 3 ). La <strong>de</strong>manda hídrica futura solo existe proyectado en <strong>la</strong> cuenca<br />
Huancané para uso agríco<strong>la</strong> <strong>de</strong> 10.66 hm 3 . El uso agríco<strong>la</strong> es <strong>de</strong> mayor significancia en <strong>la</strong>s<br />
cuencas <strong>de</strong> estudio.<br />
El ba<strong>la</strong>nce hídrico se ha <strong>de</strong>sarrol<strong>la</strong>do a nivel <strong>de</strong> subcuencas, con el propósito <strong>de</strong> conocer el<br />
déficit y exceso <strong>de</strong>l recurso hídrico existente en <strong>la</strong>s cuencas. Según el análisis <strong>de</strong> ba<strong>la</strong>nce<br />
hídrico en situación actual los resultados son: subcuenca L<strong>la</strong>che muestra déficit hídrico en los<br />
meses <strong>de</strong> agosto a octubre con ligera variación y el superávit en los meses <strong>de</strong> noviembre a julio<br />
con <strong>de</strong>manda atendida al 100%; en <strong>la</strong>s subcuencas Tuyto, Muñani y Alto Huancané (<strong>río</strong><br />
Puncune) existen superávit hídrico en todo el año y <strong>la</strong>s <strong>de</strong>mandas están atendidas al 100%; en<br />
<strong>la</strong> subcuenca Pistune existe el déficit hídrico en los meses <strong>de</strong> agosto y setiembre con ligera<br />
variación y el superávit en los meses <strong>de</strong> octubre a julio con <strong>de</strong>manda atendida al 100%; a nivel<br />
<strong>de</strong> <strong>la</strong> cuenca Huancané no existe déficit hídrico y <strong>la</strong>s <strong>de</strong>mandas están suministradas al 100%,<br />
cuyo superávit anual es <strong>de</strong> 341.78 hm 3 <strong>de</strong> <strong>la</strong> diferencia existente entre <strong>la</strong> oferta hídrica total <strong>de</strong><br />
409.32 hm 3 y <strong>la</strong> <strong>de</strong>manda hídrica total <strong>de</strong> 67.54 hm 3 . En <strong>la</strong> cuenca Suches (Perú) el ba<strong>la</strong>nce<br />
hídrico se ha <strong>de</strong>sarrol<strong>la</strong>do en tres subcuencas que disponen <strong>de</strong> información básica, los<br />
resultados muestran que en <strong>la</strong> subcuenca Chueña Huata Jahuira no existe déficit hídrico y <strong>la</strong>s<br />
<strong>de</strong>mandas están satisfechas al 100%, en <strong>la</strong> subcuenca Caylloma el déficit hídrico existe en los<br />
meses <strong>de</strong> agosto y setiembre con ligera variación y exceso hídrico en los meses <strong>de</strong> octubre a<br />
julio con cobertura <strong>de</strong> <strong>la</strong>s <strong>de</strong>mandas al 100%, en <strong>la</strong> subcuenca Trapiche el déficit hídrico existe<br />
en los meses <strong>de</strong> agosto a octubre y el superávit en los meses <strong>de</strong> noviembre a julio con <strong>la</strong>s<br />
<strong>de</strong>mandas atendidas al 100%; el ba<strong>la</strong>nce hídrico a nivel <strong>de</strong> <strong>la</strong> cuenca Suches (Perú-Bolivia) no<br />
se ha realizado por falta <strong>de</strong> <strong>la</strong> información <strong>de</strong> <strong>la</strong>s <strong>de</strong>mandas hídricas correspondiente a <strong>la</strong> zona<br />
<strong>de</strong> Bolivia. Los resultados <strong>de</strong> ba<strong>la</strong>nce hídrico en situación futura son: en <strong>la</strong> subcuenca<br />
Muñani muestra el déficit hídrico en los meses <strong>de</strong> agosto a octubre y superávit en los meses <strong>de</strong><br />
noviembre a julio con cobertura <strong>de</strong> <strong>la</strong>s <strong>de</strong>mandas al 100%; mientras en <strong>la</strong> cuenca Huancané<br />
(cuenca total) muestra el déficit hídrico en los meses <strong>de</strong> agosto y setiembre con ligera variación<br />
y el exceso hídrico en los meses <strong>de</strong> octubre a julio con cobertura <strong>de</strong> <strong>la</strong>s <strong>de</strong>mandas al 100%,<br />
cuyo superávit anual es <strong>de</strong> 331.12 hm 3 <strong>de</strong> <strong>la</strong> diferencia existente entre <strong>la</strong> oferta hídrica total<br />
anual <strong>de</strong> 409.32 hm 3 y <strong>la</strong> <strong>de</strong>manda hídrica total anual <strong>de</strong> 78.20 hm 3 .<br />
En los eventos hidrológicos extremos, se ha analizado y evaluado <strong>la</strong>s máximas avenidas y<br />
sequías, cuyos resultados obtenidos son los caudales máximos instantáneos para diferentes<br />
pe<strong>río</strong>dos <strong>de</strong> retorno para <strong>la</strong>s subcuencas <strong>de</strong> interés y <strong>la</strong> sequías meteorológica e hidrológica a<br />
nivel <strong>de</strong> <strong>la</strong>s cuencas Huancané y Suches.<br />
Los volúmenes <strong>de</strong> almacenamiento <strong>de</strong> agua en los embalses propuestos es <strong>la</strong> siguiente:<br />
Embalse Cal<strong>la</strong>tomaza 16 hm 3 <strong>de</strong> volumen total, 14 hm 3 <strong>de</strong> volumen útil y 48.22 m <strong>de</strong> altura <strong>de</strong><br />
<strong>la</strong> presa; Embalse Yaputira 17 hm 3 <strong>de</strong> volumen total, 15 hm 3 <strong>de</strong> volumen útil y 32.92 m <strong>de</strong><br />
altura <strong>de</strong> <strong>la</strong> presa.<br />
MINAG-ANA-DCPRH-AGUAS SUPERFICIALES Pág.2
<strong>Estudio</strong> <strong>Hidrológico</strong> <strong>de</strong> <strong>la</strong>s <strong>Cuenca</strong>s Huancané y Suches 2010<br />
TABLA DE CONTENIDO<br />
RESUMEN ................................................................................................................................................... 1<br />
TABLA DE CONTENIDO .......................................................................................................................... 3<br />
CAPÍTULO I ............................................................................................................................................. 7<br />
EL RECURSO AGUA ............................................................................................................................... 7<br />
CAPÍTULO II .......................................................................................................................................... 10<br />
ASPECTOS GENERALES ..................................................................................................................... 10<br />
2.1 INTRODUCCIÓN........................................................................................................................ 10<br />
2.2 ANTECEDENTES ....................................................................................................................... 11<br />
2.3 JUSTIFICACION ......................................................................................................................... 11<br />
2.4 OBJETIVOS ................................................................................................................................. 12<br />
2.4.1 Objetivo General ......................................................................................................... 12<br />
2.4.2 Objetivos Específicos .................................................................................................. 12<br />
2.5 METODOLOGÍA DEL TRABAJO ............................................................................................. 12<br />
2.5.1 Activida<strong>de</strong>s preliminares ............................................................................................. 12<br />
2.5.2 Método <strong>de</strong> recolección <strong>de</strong> <strong>la</strong> información ................................................................... 13<br />
2.5.3 Trabajos <strong>de</strong> campo ....................................................................................................... 13<br />
2.5.4 Trabajos <strong>de</strong> gabinete .................................................................................................... 13<br />
2.6 INFORMACIÓN BÁSICA .......................................................................................................... 13<br />
2.6.1 Información cartográfica ............................................................................................. 14<br />
2.6.2 Información hidrometeorológica ................................................................................. 14<br />
2.6.2.1 Información hidrométrica ........................................................................... 14<br />
2.6.2.2 Información meteorológica ......................................................................... 15<br />
CAPÍTULO III ........................................................................................................................................ 16<br />
DESCRIPCIÓN GENERAL DE LA CUENCA .................................................................................... 16<br />
3.1 UBICACIÓN DE LA CUENCA .................................................................................................. 16<br />
3.1.1 Ubicación geográfica ................................................................................................... 16<br />
3.1.2 Ubicación hidrográfica ................................................................................................ 16<br />
3.1.3 Ubicación política ........................................................................................................ 16<br />
3.1.4 Ubicación administrativa ............................................................................................. 17<br />
3.1.5 Límites hidrográficos................................................................................................... 18<br />
3.2 ACCESIBILIDAD - VÍAS DE COMUNICACIÓN .................................................................... 18<br />
3.3 ASPECTO SOCIO-ECONÓMICO .............................................................................................. 25<br />
3.3.1 Pob<strong>la</strong>ción - Demografía ............................................................................................... 25<br />
3.3.2 Caracterización socio-económica ................................................................................ 25<br />
3.4 DELIMITACIÓN HIDROGRÁFICA DE LA CUENCA ............................................................ 27<br />
3.4.1 Descripción <strong>de</strong> <strong>la</strong> cuenca ............................................................................................. 27<br />
3.5 GEOMORFOLOGÍA ................................................................................................................... 41<br />
3.5.1 Generalida<strong>de</strong>s .............................................................................................................. 41<br />
3.5.2 Descripción geomorfológica <strong>de</strong> <strong>la</strong> cuenca ................................................................... 41<br />
3.5.3 Caracterización geomorfológica <strong>de</strong> <strong>la</strong> cuenca ............................................................. 45<br />
3.5.3.1 Parámetros <strong>de</strong> forma <strong>de</strong> <strong>la</strong> cuenca .............................................................. 45<br />
3.5.3.2 Parámetros <strong>de</strong> relieve <strong>de</strong> <strong>la</strong> cuenca ............................................................. 49<br />
3.5.3.3 Parámetros <strong>de</strong> <strong>la</strong> red hidrográfica <strong>de</strong> <strong>la</strong> cuenca .......................................... 56<br />
3.6 ECOLOGÍA ................................................................................................................................. 65<br />
3.7 GEOLOGÍA ................................................................................................................................. 69<br />
3.8 SUELOS ....................................................................................................................................... 80<br />
3.8.1 Uso mayor <strong>de</strong> tierras .................................................................................................... 80<br />
3.9 RECURSOS HÍDRICOS SUPERFICIALES ............................................................................... 85<br />
3.9.1 <strong>Cuenca</strong> Huancané ........................................................................................................ 85<br />
3.9.1.1 Río .............................................................................................................. 87<br />
3.9.1.2 Quebrada..................................................................................................... 88<br />
3.9.1.3 Manantial .................................................................................................... 88<br />
3.9.1.4 Laguna ........................................................................................................ 89<br />
MINAG-ANA-DCPRH-AGUAS SUPERFICIALES Pág.3
<strong>Estudio</strong> <strong>Hidrológico</strong> <strong>de</strong> <strong>la</strong>s <strong>Cuenca</strong>s Huancané y Suches 2010<br />
3.9.2 <strong>Cuenca</strong> Suches (Perú) .................................................................................................. 90<br />
3.9.2.1 Río .............................................................................................................. 91<br />
3.9.1.2 Quebrada..................................................................................................... 92<br />
3.9.1.3 Manantial .................................................................................................... 92<br />
3.9.1.4 Laguna ........................................................................................................ 93<br />
3.9.1.5 Bofedal ....................................................................................................... 93<br />
3.9.1.6 Nevado ........................................................................................................ 94<br />
CAPÍTULO IV ........................................................................................................................................ 95<br />
CLIMATOLOGÍA DE LA CUENCA .................................................................................................... 95<br />
4.1 PARÁMETROS CLIMATOLÓGICOS ....................................................................................... 96<br />
4.1.1 Precipitación ................................................................................................................ 96<br />
4.1.2 Temperatura <strong>de</strong>l aire .................................................................................................. 105<br />
4.1.3 Humedad re<strong>la</strong>tiva ...................................................................................................... 118<br />
4.1.4 Evaporación ............................................................................................................... 123<br />
4.1.5 Horas <strong>de</strong> sol ............................................................................................................... 128<br />
4.1.6 Viento ........................................................................................................................ 131<br />
4.1.7 Evapotranspiración potencial .................................................................................... 137<br />
4.1.7.1 Definición ................................................................................................. 137<br />
4.1.7.2 Métodos <strong>de</strong> cálculo <strong>de</strong> evapotranspiración potencial ............................... 137<br />
4.1.7.3 Selección <strong>de</strong>l método <strong>de</strong> cálculo <strong>de</strong> evapotranspiración potencial ........... 143<br />
4.1.7.4 Evapotranspiración potencial <strong>de</strong> <strong>la</strong> cuenca ............................................... 146<br />
4.2 CLASIFICACIÓN CLIMÁTICA .............................................................................................. 151<br />
CAPÍTULO V ........................................................................................................................................ 152<br />
PLUVIOMETRÍA .................................................................................................................................. 152<br />
5.1 GENERALIDADES ................................................................................................................... 152<br />
5.2 RED DE ESTACIONES METEOROLÓGICAS ....................................................................... 152<br />
5.3 ANÁLISIS DE CONSISTENCIA DE LA INFORMACIÓN PLUVIOMÉTRICA ................... 154<br />
5.4 COMPLETACIÓN Y EXTENSIÓN DE LA INFORMACIÓN PLUVIOMÉTRICA............... 170<br />
5.5 PRECIPITACIÓN AREAL DE LA CUENCA .......................................................................... 173<br />
CAPÍTULO VI ...................................................................................................................................... 194<br />
HIDROMETRÍA .................................................................................................................................... 194<br />
6.1 GENERALIDADES ................................................................................................................... 194<br />
6.2 RED DE ESTACIONES HIDROMÉTRICAS ........................................................................... 194<br />
6.2.1 Estación hidrométrica Puente Huancané - Río Huancané ......................................... 196<br />
6.2.2 Estación hidrométrica Puente Escoma - Río Suches ................................................. 198<br />
6.2.3 Estación hidrométrica Puente Ramis - Río Ramis ..................................................... 198<br />
6.3 ANÁLISIS DE CONSISTENCIA DE LA INFORMACIÓN HIDROMÉTRICA ..................... 200<br />
6.4 COMPLETACIÓN Y EXTENSIÓN DE LA INFORMACIÓN HIDROMÉTRICA................. 207<br />
6.5 PERSISTENCIA DE LAS DESCARGAS MEDIAS MENSUALES ........................................ 210<br />
CAPÍTULO VII ..................................................................................................................................... 215<br />
MODELACIÓN HIDROLÓGICA-GENERACIÓN DE DESCARGAS MEDIAS MENSUALES ........ 215<br />
7.1 GENERALIDADES ................................................................................................................... 215<br />
7.2 IMPORTANCIA DE LA MODELACIÓN HIDROLÓGICA ................................................... 215<br />
7.3 MODELO HIDROLÓGICO DE LUTZ SCHOLZ .................................................................... 216<br />
7.3.1 Descripción general <strong>de</strong>l mo<strong>de</strong>lo ................................................................................ 217<br />
7.3.1.1 Mo<strong>de</strong><strong>la</strong>miento hidrológico para el año promedio ..................................... 217<br />
7.3.1.2 Generación <strong>de</strong> caudales mensuales para pe<strong>río</strong>dos extendidos .................. 222<br />
7.4 APLICACIÓN DEL MODELO ................................................................................................. 223<br />
7.4.1 Calibración <strong>de</strong>l mo<strong>de</strong>lo en <strong>la</strong> cuenca <strong>de</strong>l <strong>río</strong> Huancané ............................................. 223<br />
7.4.2 Calibración <strong>de</strong>l mo<strong>de</strong>lo en <strong>la</strong> cuenca <strong>de</strong>l <strong>río</strong> Suches ................................................. 229<br />
7.5 GENERACIÓN DE CAUDALES MEDIOS MENSUALES EN LOS PUNTOS DE INTERÉS ..... 235<br />
7.6 PERSISTENCIA DE LAS DESCARGAS MEDIAS MENSUALES ........................................ 245<br />
7.7 MODELACIÓN ESTOCÁSTICA ............................................................................................. 254<br />
7.7.1 Mo<strong>de</strong>lo estocástico autorregresivo ............................................................................ 254<br />
7.7.2 Mo<strong>de</strong><strong>la</strong>miento estocástico <strong>de</strong> series mensuales ......................................................... 260<br />
7.7.2 Generación <strong>de</strong> series sintéticas <strong>de</strong> caudales medios mensuales ................................. 272<br />
MINAG-ANA-DCPRH-AGUAS SUPERFICIALES Pág.4
<strong>Estudio</strong> <strong>Hidrológico</strong> <strong>de</strong> <strong>la</strong>s <strong>Cuenca</strong>s Huancané y Suches 2010<br />
CAPÍTULO VIII ................................................................................................................................... 277<br />
DISPONIBILIDAD HÍDRICA .............................................................................................................. 277<br />
8.1 GENERALIDADES ................................................................................................................... 277<br />
8.2 AGUAS SUPERFICIALES ....................................................................................................... 277<br />
8.3 AGUAS SUBTERRÁNEAS ...................................................................................................... 278<br />
8.4 AGUAS DE RECUPERACIÓN ................................................................................................ 278<br />
8.5 AGUAS DE ALMACENAMIENTO EN REPRESAS .............................................................. 278<br />
8.6 AGUAS DE TRASVASE .......................................................................................................... 279<br />
8.7 OTRAS FUENTES DE AGUA .................................................................................................. 279<br />
8.8 DISPONIBILIDAD HÍDRICA TOTAL DE LA CUENCA ...................................................... 279<br />
CAPÍTULO IX ...................................................................................................................................... 282<br />
DEMANDA HÍDRICA .......................................................................................................................... 282<br />
9.1 GENERALIDADES ................................................................................................................... 282<br />
9.2 DEMANDA HÍDRICA ACTUAL ............................................................................................. 283<br />
9.2.1 Demanda agríco<strong>la</strong> ...................................................................................................... 283<br />
9.2.1.1 Uso actual <strong>de</strong> <strong>la</strong> tierra y superficie <strong>de</strong> <strong>la</strong> cedu<strong>la</strong> <strong>de</strong> cultivo ....................... 283<br />
9.2.1.2 Cedu<strong>la</strong> <strong>de</strong> cultivo ...................................................................................... 289<br />
9.2.1.3 Coeficiente <strong>de</strong> cultivo (Kc) ....................................................................... 292<br />
9.2.1.4 Evapotranspiración potencial (ETP) ......................................................... 294<br />
9.2.1.5 Evapotranspiración <strong>de</strong> cultivo (ETc) ........................................................ 295<br />
9.2.1.6 Precipitación efectiva (PE) ....................................................................... 295<br />
9.2.1.7 Demanda hídrica neta (lámina <strong>de</strong> riego neta) ........................................... 296<br />
9.2.1.8 Eficiencia <strong>de</strong> riego (Er) ............................................................................. 297<br />
9.2.1.9 Demanda hídrica bruta (lámina <strong>de</strong> riego bruta) ........................................ 297<br />
9.2.2 Demanda pob<strong>la</strong>cional ................................................................................................ 303<br />
9.2.3 Demanda hídrica <strong>de</strong> uso minero ................................................................................ 307<br />
9.2.4 Caudal ecológico ....................................................................................................... 307<br />
9.3 DEMANDA HÍDRICA FUTURA ............................................................................................. 309<br />
9.4 ESQUEMA HIDRÁULICO ....................................................................................................... 309<br />
CAPÍTULO X ........................................................................................................................................ 312<br />
BALANCE HÍDRICO............................................................................................................................ 312<br />
10.1 GENERALIDADES ................................................................................................................... 312<br />
10.2 OFERTA HÍDRICA ................................................................................................................... 313<br />
10.3 DEMANDA HÍDRICA EN SITUACIÓN ACTUAL Y FUTURA ........................................... 313<br />
10.4 BALANCE HÍDRICO EN SITUACIÓN ACTUAL .................................................................. 313<br />
10.5 BALANCE HÍDRICO EN SITUACIÓN FUTURA .................................................................. 323<br />
CAPÍTULO XI ...................................................................................................................................... 325<br />
EVENTOS HIDROLÓGICOS EXTREMOS ...................................................................................... 325<br />
11.1 GENERALIDADES ................................................................................................................... 325<br />
11.2 ANÁLISIS DE MÁXIMAS AVENIDAS .................................................................................. 325<br />
11.2.1 Análisis <strong>de</strong> máximas avenidas en el <strong>río</strong> Huancané .................................................... 328<br />
11.2.1.1 Información básica ................................................................................... 328<br />
11.2.1.2 Análisis <strong>de</strong> frecuencia <strong>de</strong> caudales máximos instantáneos ....................... 330<br />
11.2.1.3 Caudales máximos instantáneos para diferentes pe<strong>río</strong>dos <strong>de</strong> retorno ....... 332<br />
11.2.2 Análisis <strong>de</strong> máximas avenidas en <strong>la</strong>s subcuencas ...................................................... 334<br />
11.2.2.1 Descripción <strong>de</strong>l método <strong>de</strong>l Hidrograma Unitario <strong>de</strong>l U.S. Soil<br />
Conservation Service (SCS) ..................................................................... 334<br />
11.2.2.2 Determinación <strong>de</strong> máximas avenidas ....................................................... 338<br />
11.3 ANÁLISIS DE SEQUÍAS .......................................................................................................... 352<br />
11.3.1 Generalida<strong>de</strong>s ............................................................................................................ 352<br />
11.3.2 Sequía meteorológica ................................................................................................ 354<br />
11.3.2.1 Información básica - Metodología <strong>de</strong> análisis .......................................... 354<br />
11.3.2.2 Cuantificación y <strong>de</strong>scripción <strong>de</strong> <strong>la</strong>s sequías críticas ................................. 355<br />
11.3.3 Sequía hidrológica ..................................................................................................... 365<br />
11.3.3.1 Información básica - Metodología <strong>de</strong> análisis .......................................... 365<br />
11.3.3.2 Cuantificación y <strong>de</strong>scripción <strong>de</strong> <strong>la</strong>s sequías críticas ................................. 366<br />
11.3.3.3 Análisis <strong>de</strong> pe<strong>río</strong>dos secos y húmedos ...................................................... 371<br />
MINAG-ANA-DCPRH-AGUAS SUPERFICIALES Pág.5
<strong>Estudio</strong> <strong>Hidrológico</strong> <strong>de</strong> <strong>la</strong>s <strong>Cuenca</strong>s Huancané y Suches 2010<br />
CAPÍTULO XII ..................................................................................................................................... 375<br />
PROPUESTA DE REPRESAMIENTO HÍDRICO EN LA CUENCA ............................................. 375<br />
12.1 GENERALIDADES ................................................................................................................... 375<br />
12.2 PROPUESTA DE EMBALSES DE REGULACIÓN DEL RECURSO HÍDRICO EN LA CUENCA .... 375<br />
12.3 DETERMINACIÓN DE LA CAPACIDAD DE EMBALSE .................................................... 378<br />
12.3.1 Método experimental - Rango ajustado ..................................................................... 378<br />
12.3.2 Resultados <strong>de</strong> <strong>la</strong> capacidad <strong>de</strong> embalse – Método experimental ............................... 384<br />
12.3.3 Cálculo <strong>de</strong>l volumen útil <strong>de</strong>l embalse ........................................................................ 389<br />
12.3.4 Parámetros hidráulicos <strong>de</strong> <strong>la</strong> presa ............................................................................ 398<br />
CAPÍTULO XIII ................................................................................................................................... 408<br />
CONCLUSIONES Y RECOMENDACIONES ....................................................................................... 408<br />
13.1 CONCLUSIONES...................................................................................................................... 408<br />
13.2 RECOMENDACIONES ............................................................................................................ 410<br />
CAPÍTULO XIV .................................................................................................................................... 411<br />
BIBLIOGRAFÍA .................................................................................................................................... 411<br />
ANEXOS ................................................................................................................................................. 413<br />
MINAG-ANA-DCPRH-AGUAS SUPERFICIALES Pág.6
<strong>Estudio</strong> <strong>Hidrológico</strong> <strong>de</strong> <strong>la</strong>s <strong>Cuenca</strong>s Huancané y Suches 2010<br />
CAPÍTULO I<br />
EL RECURSO AGUA<br />
El agua es un recurso indispensable para los seres vivientes (p<strong>la</strong>ntas, animales y humanos)<br />
en el p<strong>la</strong>neta. El agua como recurso natural apareció en este mundo hace más <strong>de</strong> 3000<br />
millones <strong>de</strong> años y <strong>de</strong>s<strong>de</strong> entonces ha <strong>de</strong>sempeñado un papel sumamente importante en <strong>la</strong><br />
evolución <strong>de</strong>l mismo. Por tal motivo, <strong>de</strong>bemos pensar que el agua que bebemos no es agua<br />
nueva sino que ésta ha sido varias veces recic<strong>la</strong>da gracias al ciclo hidrológico que se<br />
encarga <strong>de</strong> llevar a cabo este proceso.<br />
Ciclo hidrológico: el agua en <strong>la</strong> naturaleza está en movimiento constante, <strong>de</strong>scribiendo un<br />
circuito cerrado que se <strong>de</strong>nomina ciclo hidrológico. La Figura Nº 1.1 muestra una visión<br />
esquemática <strong>de</strong>l ciclo hidrológico, don<strong>de</strong> <strong>la</strong> radiación so<strong>la</strong>r produce <strong>la</strong> evaporación <strong>de</strong>l<br />
agua existente y por los procesos atmosféricos (enfriamiento) el vapor <strong>de</strong> agua se con<strong>de</strong>nsa<br />
y luego se precipita en forma <strong>de</strong> lluvia.<br />
Figura Nº 1.1 Ciclo hidrológico <strong>de</strong>l p<strong>la</strong>neta Tierra<br />
Fuente: C<strong>la</strong>rke, R. Water: The International Crisis. Londres, Earthscan, 1991.<br />
MINAG-ANA-DCPRH-AGUAS SUPERFICIALES Pág.7
<strong>Estudio</strong> <strong>Hidrológico</strong> <strong>de</strong> <strong>la</strong>s <strong>Cuenca</strong>s Huancané y Suches 2010<br />
El agua cubre <strong>la</strong>s ¾ partes (71%) <strong>de</strong> <strong>la</strong> superficie <strong>de</strong> <strong>la</strong> Tierra; el 97% <strong>de</strong> su volumen es<br />
agua sa<strong>la</strong>da que se encuentran en los océanos y mares, y sólo el 3% <strong>de</strong> su volumen es agua<br />
dulce que se encuentran en casquetes po<strong>la</strong>res y g<strong>la</strong>ciares, acuíferos, <strong>río</strong>s, <strong>la</strong>gos y <strong>la</strong>gunas.<br />
Figura Nº 1.2 Distribución <strong>de</strong>l agua en <strong>la</strong> Tierra<br />
Su importancia se fundamenta en los siguientes aspectos: el agua es fuente <strong>de</strong> vida, sin el<strong>la</strong><br />
no pue<strong>de</strong>n vivir <strong>la</strong>s p<strong>la</strong>ntas, animales ni el ser humano. Es indispensable en <strong>la</strong> vida diaria<br />
(uso doméstico, industrial, agríco<strong>la</strong>, pecuario, minero, energético, medicina, acuicultura,<br />
municipal, <strong>de</strong>porte-recreación, entre otros usos).<br />
Problemas que ocasiona el agua: La distribución espacial y temporal irregu<strong>la</strong>r <strong>de</strong>l recurso<br />
hídrico en <strong>la</strong>s cuencas hidrográficas, en épocas <strong>de</strong> avenida genera problemas <strong>de</strong><br />
inundaciones originados por el exceso <strong>de</strong> escurrimiento por altas precipitaciones, en épocas<br />
<strong>de</strong> estiaje genera problemas <strong>de</strong> sequía originados por <strong>la</strong> escasez <strong>de</strong> agua y anomalía <strong>de</strong> <strong>la</strong>s<br />
precipitaciones. Por otro <strong>la</strong>do también se generan conflictos <strong>de</strong> los usuarios por escasez y<br />
por mal manejo <strong>de</strong>l agua.<br />
Las activida<strong>de</strong>s humanas generan escasez <strong>de</strong> agua <strong>de</strong> tres maneras: por el crecimiento <strong>de</strong> <strong>la</strong><br />
pob<strong>la</strong>ción, por <strong>la</strong> utilización errónea <strong>de</strong>l agua y por <strong>la</strong> falta <strong>de</strong> equidad en el acceso a el<strong>la</strong>.<br />
El crecimiento <strong>de</strong> <strong>la</strong> pob<strong>la</strong>ción contribuye a <strong>la</strong> escasez <strong>de</strong> agua simplemente porque el<br />
suministro <strong>de</strong> agua disponible <strong>de</strong>be repartirse entre un número cada vez mayor <strong>de</strong><br />
personas. Cada región tiene una cantidad más o menos fija <strong>de</strong> recursos hídricos internos,<br />
que se <strong>de</strong>finen como el caudal medio anual <strong>de</strong> los <strong>río</strong>s y acuíferos generado por <strong>la</strong><br />
precipitación. Con el tiempo, esta reserva interna renovable va dividiéndose entre un<br />
número cada vez mayor <strong>de</strong> personas, hasta que sobreviene <strong>la</strong> escasez <strong>de</strong> agua.<br />
En los últimos años, los problemas <strong>de</strong>l agua han sido objeto <strong>de</strong> una preocupación y un<br />
<strong>de</strong>bate crecientes en el p<strong>la</strong>no internacional. En enero <strong>de</strong> 1992 tuvo lugar en Dublín<br />
(Ir<strong>la</strong>nda) <strong>la</strong> Conferencia Internacional sobre el Agua y el Medio Ambiente (ICWE),<br />
patrocinada por el sistema <strong>de</strong> <strong>la</strong>s Naciones Unidas. En 1993 el Banco Mundial publicó un<br />
exhaustivo documento <strong>de</strong> política en el que se <strong>de</strong>finían sus nuevos objetivos en el sector <strong>de</strong><br />
los recursos hídricos. La FAO, por su parte, ha establecido recientemente un Programa <strong>de</strong><br />
Acción Internacional sobre el Agua y el Desarrollo Agríco<strong>la</strong> Sostenible (PAI-ADAS). En<br />
MINAG-ANA-DCPRH-AGUAS SUPERFICIALES Pág.8
<strong>Estudio</strong> <strong>Hidrológico</strong> <strong>de</strong> <strong>la</strong>s <strong>Cuenca</strong>s Huancané y Suches 2010<br />
el 2006, en México se realiza el IV Foro mundial <strong>de</strong>l Agua. En el 2009, en Estambul <strong>de</strong><br />
Turquía se realiza el V Foro mundial <strong>de</strong>l agua; Naciones Unidas advertía en <strong>la</strong>s vísperas<br />
<strong>de</strong>l Foro que unos 1100 millones <strong>de</strong> personas en el p<strong>la</strong>neta carecían <strong>de</strong> suministro<br />
a<strong>de</strong>cuado <strong>de</strong> agua potable y que en el futuro <strong>la</strong> situación se agravaría <strong>de</strong> no modificarse <strong>la</strong>s<br />
políticas actuales sobre el manejo <strong>de</strong>l recurso hídrico.<br />
En nuestro territorio nacional, <strong>la</strong> inobjetable realidad situacional <strong>de</strong> los recursos hídricos<br />
<strong>de</strong>l país, cada vez más se escasea en <strong>la</strong> mayoría <strong>de</strong> <strong>la</strong>s cuencas hidrográficas <strong>de</strong>l Pacífico y<br />
en <strong>la</strong>s cuencas alto andinas <strong>de</strong> <strong>la</strong> sierra peruana, generalmente en épocas <strong>de</strong> estiaje;<br />
afectados por los fenómenos físicos, como el calentamiento global, cambio climático,<br />
fenómenos sociales como <strong>la</strong> migración, crecimiento pob<strong>la</strong>cional, nuevos asentamientos<br />
popu<strong>la</strong>res y entre otros factores influyentes. Frente a este problemática <strong>de</strong> escasez <strong>de</strong>l<br />
recurso agua más preciado para <strong>la</strong> pob<strong>la</strong>ción <strong>de</strong>l país, se <strong>de</strong>be conservarse almacenando en<br />
gran<strong>de</strong>s represas para enfrentar en a<strong>de</strong><strong>la</strong>nte <strong>la</strong> posible escasez <strong>de</strong>l agua, y sensibilizar a los<br />
usuarios a través <strong>de</strong> <strong>la</strong> capacitación para el buen manejo y uso eficiente para lograr el<br />
<strong>de</strong>sarrollo sostenible en <strong>la</strong> gestión integrada <strong>de</strong> los recursos hídricos en el país.<br />
Nevado Ananea Gran<strong>de</strong> - Subcuenca <strong>río</strong> Trapiche<br />
Nevado Palomani – Subcuenca <strong>río</strong> Suches Lagunas Salluyo-Cutini-Ccaccani-Pararani<br />
Subcuenca <strong>río</strong> Suches<br />
MINAG-ANA-DCPRH-AGUAS SUPERFICIALES Pág.9
<strong>Estudio</strong> <strong>Hidrológico</strong> <strong>de</strong> <strong>la</strong>s <strong>Cuenca</strong>s Huancané y Suches 2010<br />
2.1 INTRODUCCIÓN<br />
CAPÍTULO II<br />
ASPECTOS GENERALES<br />
Des<strong>de</strong> el año 2001, <strong>la</strong> Inten<strong>de</strong>ncia <strong>de</strong> Recursos Hídricos (Dirección General <strong>de</strong> Aguas y<br />
Suelos) <strong>de</strong>l ex Instituto Nacional <strong>de</strong> Recursos Naturales, actualmente <strong>la</strong> <strong>Autoridad</strong><br />
Nacional <strong>de</strong>l Agua (ANA) como ente rector y máxima autoridad técnico-normativa <strong>de</strong>l<br />
Sistema Nacional <strong>de</strong> Gestión <strong>de</strong> los Recursos Hídricos en el país, viene <strong>de</strong>sarrol<strong>la</strong>ndo<br />
estudios hidrológicos en diversas cuencas <strong>de</strong>l Perú, como es el caso <strong>de</strong> <strong>la</strong>s cuencas <strong>de</strong> los<br />
<strong>río</strong>s Cañete, Chancay-Huaral, Caplina, Chicama, Chili, Chillón, Pisco, San Juan, Yauca,<br />
Acarí, Cabanil<strong>la</strong>s y Lampa, Casma, Culebras, Ma<strong>la</strong>, Ocoña, Ramis, I<strong>la</strong>ve, Lacramarca,<br />
Nepeña, Tab<strong>la</strong>chaca, Urubamba, etc; y consiente <strong>de</strong> <strong>la</strong> necesidad <strong>de</strong>l país <strong>de</strong> disponer <strong>de</strong>l<br />
conocimiento integral y homogéneo <strong>de</strong> <strong>la</strong> potencialidad <strong>de</strong> sus recursos hídricos que<br />
conlleven a un uso racional y p<strong>la</strong>nificado, <strong>de</strong>s<strong>de</strong> los puntos <strong>de</strong> vista social, económico,<br />
ecológico y consi<strong>de</strong>rando <strong>la</strong> participación <strong>de</strong> todos los agentes consumidores <strong>de</strong> agua <strong>de</strong> <strong>la</strong><br />
cuenca, <strong>de</strong>ntro <strong>de</strong> sus limitaciones existentes, prosigue con sus objetivos iniciales<br />
extendiendo estos estudios en otras cuencas, como es el presente caso <strong>de</strong> los <strong>río</strong>s Huancané<br />
y Suches en <strong>la</strong> Región Puno.<br />
Bajo este marco y objetivo integral <strong>de</strong> proporcionar información valiosa para el<br />
or<strong>de</strong>namiento y gestión <strong>de</strong> los recursos hídricos; el presente estudio hidrológico <strong>de</strong> <strong>la</strong>s<br />
cuencas Huancané y Suches se sustenta, no sólo en <strong>la</strong> necesidad <strong>de</strong> contar con una<br />
<strong>de</strong>scripción, evaluación y cuantificación <strong>de</strong> su disponibilidad hídrica, sino también tener<br />
fundamentos que permitan enten<strong>de</strong>r el real funcionamiento hidrológico <strong>de</strong> <strong>la</strong> cuenca y <strong>de</strong><br />
ello concluir en cuanto a <strong>la</strong>s restricciones y bonda<strong>de</strong>s que nos ofrece este sistema natural<br />
como “generador” <strong>de</strong> agua superficial.<br />
Las principales activida<strong>de</strong>s socio-económicas en <strong>la</strong>s cuencas son <strong>la</strong> agricultura y <strong>la</strong><br />
gana<strong>de</strong>ría, constituyéndose éstas en un eje para el <strong>de</strong>sarrollo <strong>de</strong> otras <strong>la</strong>bores productivas<br />
como transporte, comercio y consumo. La agricultura está acentuada más en <strong>la</strong> cuenca<br />
media y baja, <strong>de</strong>bido a <strong>la</strong>s condiciones favorables <strong>de</strong> clima, relieve, calidad agrologica <strong>de</strong><br />
suelos y disponibilidad hídrica. La actividad pecuaria se concentra en toda <strong>la</strong> cuenca y con<br />
mayor inci<strong>de</strong>ncia en zonas con predominancia <strong>de</strong> pastos naturales. En <strong>la</strong> parte alta <strong>de</strong> <strong>la</strong>s<br />
cuencas, no es apropiado realizar <strong>la</strong>s activida<strong>de</strong>s agríco<strong>la</strong>s <strong>de</strong> cultivos <strong>de</strong> pan llevar, por los<br />
riesgos inherentes al clima (ocurrencia <strong>de</strong> sequías y he<strong>la</strong>das por bajas temperaturas).<br />
El uso <strong>de</strong> agua para fines pob<strong>la</strong>cionales en <strong>la</strong>s cuencas Huancané y Suches no implica<br />
mayor significado numérico si <strong>la</strong> comparamos con <strong>la</strong> agríco<strong>la</strong>. En <strong>la</strong>s cuencas no se tiene<br />
otros usos consuntivos mayores, distinguiéndose como consumos menores, pero muy<br />
importantes el pecuario y ecológico.<br />
Por consiguiente, el agua superficial <strong>de</strong> <strong>la</strong>s cuencas Huancané y Suches representa un<br />
“input” (entrada) económico <strong>de</strong> singu<strong>la</strong>r importancia para el <strong>de</strong>sarrollo socioeconómico <strong>de</strong><br />
<strong>la</strong> pob<strong>la</strong>ción <strong>de</strong> <strong>la</strong>s cuencas en estudio en <strong>la</strong> Región Puno.<br />
MINAG-ANA-DCPRH-AGUAS SUPERFICIALES Pág.10
<strong>Estudio</strong> <strong>Hidrológico</strong> <strong>de</strong> <strong>la</strong>s <strong>Cuenca</strong>s Huancané y Suches 2010<br />
2.2 ANTECEDENTES<br />
Como parte preliminar para el inicio <strong>de</strong>l <strong>de</strong>sarrollo <strong>de</strong>l presente estudio, se ha revisado los<br />
estudios antece<strong>de</strong>ntes referidos al recurso hídrico en <strong>la</strong>s cuencas Huancané y Suches, a<br />
continuación se muestran los estudios realizados por diferentes instituciones públicas,<br />
privadas y universida<strong>de</strong>s.<br />
ONERN (Oficina Nacional <strong>de</strong> Evaluación <strong>de</strong> Recursos Naturales): “Inventario<br />
y evaluación <strong>de</strong> los recursos naturales alto andinos”, cuenca <strong>de</strong>l <strong>río</strong> Huancané,<br />
1992.<br />
PELT (Proyecto Especial Lago Titicaca): “P<strong>la</strong>n Director Global Binacional <strong>de</strong><br />
Protección, Prevención <strong>de</strong> Inundaciones y Aprovechamiento <strong>de</strong> Recursos <strong>de</strong>l<br />
Lago Titicaca, Río Desagua<strong>de</strong>ro, Lago Poopó y Lago Sa<strong>la</strong>r <strong>de</strong> Coipasa (Sistema<br />
TDPS)”; Puno 1,993.<br />
PELT (Proyecto Especial Lago Titicaca) – Puno: “<strong>Estudio</strong> <strong>Hidrológico</strong> <strong>de</strong>l<br />
Sistema Hídrico Huancané – Suches; 2001, <strong>de</strong>terminándose los caudales y <strong>la</strong><br />
disponibilidad hídrica en <strong>la</strong>s cuencas mencionadas.<br />
ALT (<strong>Autoridad</strong> Binacional Autónoma <strong>de</strong>l Sistema Hídrico TDPS):<br />
“Disponibilidad hídrica <strong>de</strong> <strong>la</strong>s cuencas afluentes al <strong>la</strong>go Titicaca”, Puno 2005.<br />
ATDR Huancané (Administración Técnica <strong>de</strong>l Distrito <strong>de</strong> Riego Huancané):<br />
“Inventario <strong>de</strong> infraestructura <strong>de</strong> riego y padrón <strong>de</strong> usuarios <strong>de</strong>l distrito <strong>de</strong> riego<br />
Huancané, 2006.<br />
Carlos Nina Castro: “Ba<strong>la</strong>nce Hídrico <strong>de</strong> <strong>la</strong> <strong>Cuenca</strong> <strong>de</strong>l Rio Huancané”, Tesis<br />
<strong>de</strong> Grado, Facultad <strong>de</strong> Ingeniería Agríco<strong>la</strong>, Universidad Nacional <strong>de</strong>l Altip<strong>la</strong>no,<br />
Puno, <strong>2008</strong>.<br />
PRORRIDRE (Programa Regional <strong>de</strong> Riego y Drenaje): “<strong>Estudio</strong> hidrológico<br />
<strong>de</strong>l perfil <strong>de</strong>l proyecto <strong>de</strong> irrigación Muñani”, Gobierno Regional <strong>de</strong> Puno,<br />
2009.<br />
Efraín Lujano Laura: “<strong>Estudio</strong> hidrológico <strong>de</strong> <strong>la</strong> cuenca <strong>de</strong>l <strong>río</strong> Huancané”,<br />
Informe <strong>de</strong> prácticas pre-profesionales, Administración Local <strong>de</strong> Agua<br />
Huancané, Facultad <strong>de</strong> Ingeniería Agríco<strong>la</strong> - UNA-Puno, 2010.<br />
2.3 JUSTIFICACION<br />
El “<strong>Estudio</strong> hidrológico <strong>de</strong> <strong>la</strong>s cuencas Huancané y Suches” se ha realizado con <strong>la</strong><br />
finalidad <strong>de</strong> evaluar y cuantificar <strong>la</strong> potencialidad <strong>de</strong> los recursos hídricos superficiales,<br />
requerimiento <strong>de</strong> <strong>la</strong>s <strong>de</strong>mandas hídricas y ba<strong>la</strong>nce hídrico <strong>de</strong> <strong>la</strong>s cuencas en estudio.<br />
Los resultados obtenidos en el presente estudio, permitirá disponer <strong>de</strong> información básica<br />
necesaria para optimizar el or<strong>de</strong>namiento y gestión integral <strong>de</strong> los recursos hídricos en <strong>la</strong>s<br />
cuencas hidrográficas <strong>de</strong> estudio.<br />
El estudio hidrológico proporcionará aportes sustanciales, como <strong>la</strong>s características<br />
geomorfológicas <strong>de</strong> <strong>la</strong>s cuencas, inventario <strong>de</strong> fuentes <strong>de</strong> recursos hídricos superficiales,<br />
climatología, pluviometría, hidrometría, mo<strong>de</strong><strong>la</strong>ción hidrológica y generación <strong>de</strong> <strong>la</strong>s<br />
<strong>de</strong>scargas medias mensuales a partir <strong>de</strong> <strong>la</strong> precipitación areal <strong>de</strong> <strong>la</strong> cuenca, <strong>la</strong><br />
disponibilidad (oferta) y <strong>de</strong>manda hídrica, ba<strong>la</strong>nce hídrico, <strong>la</strong>s máximas avenidas y<br />
finalmente los episodios <strong>de</strong> sequía.<br />
MINAG-ANA-DCPRH-AGUAS SUPERFICIALES Pág.11
<strong>Estudio</strong> <strong>Hidrológico</strong> <strong>de</strong> <strong>la</strong>s <strong>Cuenca</strong>s Huancané y Suches 2010<br />
2.4 OBJETIVOS<br />
2.4.1 Objetivo General<br />
Realizar el estudio hidrológico <strong>de</strong> <strong>la</strong>s cuencas Huancané y Suches, con <strong>la</strong> finalidad <strong>de</strong><br />
evaluar y cuantificar <strong>la</strong> disponibilidad hídrica, para <strong>la</strong> p<strong>la</strong>nificación y gestión integral <strong>de</strong><br />
los recursos hídricos <strong>de</strong> <strong>la</strong>s cuencas en estudio. Haciendo énfasis en el uso <strong>de</strong>l agua para<br />
riego, promoviendo así su manejo eficiente, racional y equitativo.<br />
2.4.2 Objetivos Específicos<br />
Sistematizar <strong>la</strong> información cartográfica (mapas temáticas generadas) en un<br />
sistema <strong>de</strong> información geográfica (SIG).<br />
Determinar <strong>la</strong>s características físicas y ecológicas <strong>de</strong> <strong>la</strong> cuenca.<br />
I<strong>de</strong>ntificar y evaluar <strong>la</strong>s fuentes <strong>de</strong> agua superficial en <strong>la</strong>s cuencas a través <strong>de</strong><br />
un inventario sustentado en trabajos <strong>de</strong> campo y mediciones puntuales.<br />
Evaluación <strong>de</strong> <strong>la</strong>s variables meteorológicas.<br />
Evaluación <strong>de</strong>l comportamiento <strong>de</strong> <strong>la</strong> precipitación en <strong>la</strong>s cuencas.<br />
Evaluación <strong>de</strong>l comportamiento hidrológico <strong>de</strong> <strong>la</strong>s cuencas.<br />
Realizar <strong>la</strong> mo<strong>de</strong><strong>la</strong>ción hidrológica en <strong>la</strong> cuenca, y generación <strong>de</strong> <strong>de</strong>scargas<br />
medias mensuales en <strong>la</strong>s sub-cuencas <strong>de</strong> interés.<br />
Determinar <strong>la</strong> disponibilidad hídrica en <strong>la</strong>s cuencas y sub-cuencas <strong>de</strong> interés.<br />
Determinación <strong>de</strong> <strong>la</strong> <strong>de</strong>manda multisectorial (uso consuntivo) en situación<br />
actual y futura.<br />
Ba<strong>la</strong>nce hidrológico <strong>de</strong> <strong>la</strong> cuenca en situación actual y para condiciones futuras.<br />
Evaluación <strong>de</strong> los eventos hidrológicos extremos (máximas avenidas y sequías).<br />
<strong>Estudio</strong> <strong>de</strong> almacenamiento <strong>de</strong> agua en <strong>la</strong> cuenca para <strong>de</strong>terminar los<br />
volúmenes probables <strong>de</strong> embalse que podrían represarse.<br />
2.5 METODOLOGÍA DEL TRABAJO<br />
El presente estudio ha sido orientado y realizado mediante <strong>la</strong> ejecución secuencial <strong>de</strong> <strong>la</strong>s<br />
siguientes activida<strong>de</strong>s y con <strong>la</strong> participación <strong>de</strong> un equipo técnico-profesional en trabajos<br />
<strong>de</strong> esta naturaleza. La metodología a seguir para lograr los objetivos <strong>de</strong>l estudio<br />
hidrológico <strong>de</strong> <strong>la</strong>s cuencas Huancané y Suches, se <strong>de</strong>scriben a continuación.<br />
2.5.1 Activida<strong>de</strong>s preliminares<br />
Se ha realizado <strong>la</strong>s coordinaciones con <strong>la</strong> Administración Local <strong>de</strong> Agua Huancané, para <strong>la</strong><br />
ejecución <strong>de</strong>l <strong>Estudio</strong> <strong>Hidrológico</strong> <strong>de</strong> <strong>la</strong>s <strong>Cuenca</strong>s Huancané y Suches. Igualmente con el<br />
equipo técnico-profesional <strong>de</strong>l inventario <strong>de</strong> fuentes hídricas superficiales <strong>de</strong> <strong>la</strong>s cuencas<br />
en estudio.<br />
Se ha realizado <strong>la</strong> revisión <strong>de</strong> estudios antece<strong>de</strong>ntes sobre recursos hídricos realizados en<br />
<strong>la</strong>s cuencas Huancané y Suches, por <strong>la</strong>s entida<strong>de</strong>s públicas, privadas y universida<strong>de</strong>s;<br />
información base para el <strong>de</strong>sarrollo <strong>de</strong>l presente estudio.<br />
MINAG-ANA-DCPRH-AGUAS SUPERFICIALES Pág.12
<strong>Estudio</strong> <strong>Hidrológico</strong> <strong>de</strong> <strong>la</strong>s <strong>Cuenca</strong>s Huancané y Suches 2010<br />
2.5.2 Método <strong>de</strong> recolección <strong>de</strong> <strong>la</strong> información<br />
Las técnicas <strong>de</strong> recolección <strong>de</strong> datos y manejo <strong>de</strong> información que han contribuido en el<br />
<strong>de</strong>sarrollo <strong>de</strong>l presente estudio, es <strong>la</strong> siguiente:<br />
- Información documental<br />
- Información bibliográfica<br />
- Entrevista<br />
2.5.3 Trabajos <strong>de</strong> campo<br />
- Reconocimiento <strong>de</strong> <strong>la</strong>s cuencas en campo.<br />
- Evaluación hidrológica <strong>de</strong> <strong>la</strong>s cuencas (<strong>de</strong>limitación hidrográfica <strong>de</strong> <strong>la</strong>s<br />
cuencas, geomorfología, geología, cobertura vegetal, zonas potenciales <strong>de</strong><br />
retención hídrica).<br />
- I<strong>de</strong>ntificación <strong>de</strong> los principales agentes consumidores <strong>de</strong> agua.<br />
- Inventario <strong>de</strong> fuentes <strong>de</strong> agua superficial.<br />
- Evaluación <strong>de</strong> <strong>la</strong>s estaciones hidrometeorológicas.<br />
2.5.4 Trabajos <strong>de</strong> gabinete<br />
- Procesamiento <strong>de</strong> <strong>la</strong> información (análisis y <strong>de</strong>puración <strong>de</strong> <strong>la</strong> información<br />
hidrometeorológica recopi<strong>la</strong>da).<br />
- E<strong>la</strong>boración <strong>de</strong> mapas temáticos <strong>de</strong> <strong>la</strong>s cuencas.<br />
- Análisis <strong>de</strong> <strong>la</strong>s variables climatológicas, meteorológicas e hidrológicas.<br />
- Mo<strong>de</strong><strong>la</strong>ción y generación <strong>de</strong> <strong>la</strong>s <strong>de</strong>scargas medias en los puntos <strong>de</strong> interés.<br />
- Determinación <strong>de</strong> <strong>la</strong> disponibilidad hídrica, <strong>de</strong>manda hídrica y ba<strong>la</strong>nce hídrico<br />
<strong>de</strong> <strong>la</strong>s cuencas.<br />
- Análisis <strong>de</strong> eventos extremos (máximas avenidas y sequías).<br />
- Volumen <strong>de</strong> almacenamiento <strong>de</strong> agua en los embalses propuestos.<br />
- Redacción <strong>de</strong>l informe <strong>de</strong>l estudio.<br />
Herramientas utilizadas en el presente estudio: Microsoft office, software ARGIS,<br />
software CropWat-4 para el cálculo <strong>de</strong> <strong>la</strong> evapotranspiración potencial, software<br />
hidrológico Hec4 para <strong>la</strong> completación y extensión <strong>de</strong> <strong>la</strong> información<br />
hidrometeorológica, software FLFREQ para el análisis <strong>de</strong> frecuencia <strong>de</strong> caudales<br />
máximos instantáneos y precipitaciones máximas en 24 horas, Software SCS para<br />
el cálculo <strong>de</strong> <strong>la</strong>s máximas avenidas a partir <strong>de</strong> <strong>la</strong> precipitación.<br />
2.6 INFORMACIÓN BÁSICA<br />
Para el <strong>de</strong>sarrollo <strong>de</strong>l presente estudio se ha recurrido básicamente a <strong>la</strong> información<br />
cartográfica, hidrometeorológica (hidrométrica, pluviométrica y climatológica) y estudios<br />
antece<strong>de</strong>ntes. A continuación se <strong>de</strong>tal<strong>la</strong> cada una <strong>de</strong> estas informaciones en forma breve.<br />
MINAG-ANA-DCPRH-AGUAS SUPERFICIALES Pág.13
<strong>Estudio</strong> <strong>Hidrológico</strong> <strong>de</strong> <strong>la</strong>s <strong>Cuenca</strong>s Huancané y Suches 2010<br />
2.6.1 Información cartográfica<br />
La información cartográfica básica para el <strong>de</strong>sarrollo <strong>de</strong>l estudio hidrológico y <strong>la</strong><br />
generación <strong>de</strong> mapas temáticos <strong>de</strong> <strong>la</strong>s cuencas Huancané y Suches, es <strong>la</strong> siguiente:<br />
- Cartas Nacionales que abarca <strong>la</strong>s cuencas Huancané y Suches a esca<strong>la</strong> 1/100,000 <strong>de</strong>l<br />
Instituto Geográfico Nacional (IGN) digitalizado bajo el entorno <strong>de</strong> SIG con<br />
equidistancia mínima entre curvas <strong>de</strong> nivel <strong>de</strong> 50 m. Fuente ANA.<br />
- Información cartográfica complementaria existente en <strong>la</strong> Administración Local <strong>de</strong><br />
Agua Huancané: Mapa <strong>de</strong> <strong>de</strong>limitación administrativa con <strong>la</strong> <strong>de</strong>marcación <strong>de</strong><br />
sectores <strong>de</strong> riego; mapa <strong>de</strong> ubicación <strong>de</strong> <strong>la</strong> ALA Huancané en <strong>la</strong> Región Puno.<br />
- Mapa Geológico <strong>de</strong>l Perú. [Geological Map of Perú], <strong>de</strong>l Instituto <strong>de</strong> Geología y<br />
Minería <strong>de</strong> 1975, a esca<strong>la</strong> 1/100,000. Fuente Dirección General <strong>de</strong> Asuntos<br />
Ambientales <strong>de</strong>l Ministerio <strong>de</strong> Agricultura.<br />
- Mapa Ecológico <strong>de</strong>l Perú. [Ecological Map of Perú], <strong>de</strong> <strong>la</strong> Oficina Nacional <strong>de</strong><br />
Evaluación <strong>de</strong> Recursos Naturales (ONERN) <strong>de</strong> 1976, esca<strong>la</strong> 1/100,000. Fuente<br />
Dirección General <strong>de</strong> Asuntos Ambientales <strong>de</strong>l Ministerio <strong>de</strong> Agricultura.<br />
- Mapa Geomorfológico <strong>de</strong>l Perú, <strong>de</strong> <strong>la</strong> Oficina Nacional <strong>de</strong> Evaluación <strong>de</strong> Recursos<br />
Naturales (ONERN) <strong>de</strong> 1976, esca<strong>la</strong> 1/100,000. Fuente Dirección General <strong>de</strong><br />
Asuntos Ambientales <strong>de</strong>l Ministerio <strong>de</strong> Agricultura.<br />
- Mapa <strong>de</strong> Capacidad <strong>de</strong> Uso Mayor <strong>de</strong> <strong>la</strong>s Tierras <strong>de</strong>l Perú. [Land Use Map of Perú],<br />
<strong>de</strong> <strong>la</strong> Oficina Nacional <strong>de</strong> Evaluación <strong>de</strong> Recursos Naturales (ONERN) <strong>de</strong> 1981,<br />
esca<strong>la</strong> 1/100,000.<br />
2.6.2 Información hidrometeorológica<br />
2.6.2.1 Información hidrométrica<br />
En el ámbito <strong>de</strong> <strong>la</strong>s cuencas Huancané y Suches existen dos estaciones hidrométricas, como el<br />
Puente Huancané (contro<strong>la</strong>da por SENAMHI Puno) y Puente Escoma (contro<strong>la</strong>da por<br />
SENAMHI Bolivia). A<strong>de</strong>más existe una estación hidrométrica en <strong>la</strong> cuenca <strong>de</strong>l <strong>río</strong> Ramis<br />
(Puente Ramis), dicha información servirá para el análisis y completación <strong>de</strong> registros <strong>de</strong><br />
<strong>de</strong>scargas <strong>de</strong> los <strong>río</strong>s Huancané y Suches.<br />
En el siguiente cuadro se muestran <strong>la</strong>s características <strong>de</strong> <strong>la</strong>s estaciones hidrométricas<br />
consi<strong>de</strong>radas en el presente estudio.<br />
Nº<br />
Cuadro Nº 2.1 Estaciones hidrométricas en <strong>la</strong>s cuencas Huancané - Suches y estación <strong>de</strong> apoyo<br />
Río<br />
Estación<br />
Código<br />
Ubicación Política Ubicación Geográfica<br />
Dpto. Provincia Distrito<br />
Latitud<br />
Sur<br />
Longitud<br />
Oeste<br />
Altitud<br />
(msnm)<br />
1 Huancané Pte.Huancané HUAN Puno Huancané Huancané 15º12'57.1" 69º47'33.37" 3814.0<br />
2 Suches Pte.Escoma SUCH La Paz Camacho - 15º39'33" 69º08'00" 3817.0<br />
3 Ramis Pte.Ramis RAMI Puno Huancané Taraco 15º15'15" 69º52'52" 3813.0<br />
Propiedad<br />
Senamhi<br />
Puno<br />
Senamhi<br />
Bolivia<br />
Senamhi<br />
Puno<br />
MINAG-ANA-DCPRH-AGUAS SUPERFICIALES Pág.14
Nº<br />
<strong>Estudio</strong> <strong>Hidrológico</strong> <strong>de</strong> <strong>la</strong>s <strong>Cuenca</strong>s Huancané y Suches 2010<br />
2.6.2.2 Información meteorológica<br />
La información meteorológica, consistente en precipitación (total mensual y máxima en 24<br />
horas), temperatura (media, máxima y mínima), humedad re<strong>la</strong>tiva, evaporación, horas <strong>de</strong> sol y<br />
viento (velocidad y dirección); se ha recopi<strong>la</strong>do <strong>de</strong> <strong>la</strong>s estaciones correspondientes a <strong>la</strong>s<br />
cuencas Huancané, Suches y <strong>de</strong> <strong>la</strong>s estaciones vecinas a éstas.<br />
En el siguiente cuadro, se muestran <strong>la</strong>s características generales <strong>de</strong> <strong>la</strong>s estaciones<br />
meteorológicas consi<strong>de</strong>radas en el presente estudio.<br />
Estación<br />
Cuadro Nº 2.2 Estaciones meteorológicas <strong>de</strong> <strong>la</strong>s cuencas Huancané, Suches y cuencas vecinas<br />
Tipo Código<br />
<strong>Cuenca</strong><br />
Latitud Longitud Altitud<br />
Dpto. Provincia Distrito<br />
Sur Oeste (msnm)<br />
1 Huancané CO 000786 Puno Huancané Huancané 15º12'24.8" 69º45'29.7" 3840.0 Huancané Senamhi-Puno<br />
2 Putina CO 157414 Puno<br />
San Antonio <strong>de</strong><br />
Putina<br />
Putina 14º55'16.9" 69º52'25.7" 3856.0 Huancané Senamhi-Puno<br />
3 Muñani CO 000785 Puno Azángaro Muñani 14º45'42.02" 69º57'6.07" 3948.0 Huancané Senamhi-Puno<br />
4 Huaraya<br />
Moho<br />
CO 000787 Puno Moho Moho 15º23'17.14" 69º29'2.23" 3832.0 Titicaca Senamhi-Puno<br />
5 Cojata CO 000827 Puno Huancané Cojata 15º00'42.4" 69º21'40.5" 4327.0 Suches Senamhi-Puno<br />
6 Suches PLU SUC La Paz F.Tamayo - 14º47'27.0" 69º19'07.0" 4655.0 Suches Senamhi-Bolivia<br />
7 Ananea CO 000826 Puno<br />
Ubicación Política Ubicación Geográfica<br />
San Antonio <strong>de</strong><br />
Putina<br />
Ananea 14º40'43.4" 69º32'4.30" 4640.0 Azángaro Senamhi-Puno<br />
8 Crucero CO 007415 Puno Carabaya Crucero 14º21'44.4" 70º01'24.7" 4130.0 Azángaro Senamhi-Puno<br />
9 Progreso CO 000778 Puno Azángaro Asillo 14º40'37.4" 70º21'55.0" 3940.0 Azángaro Senamhi-Puno<br />
10 Azángaro CO 000781 Puno Azángaro Azángaro 14º54'52.2" 70º11'27.1" 3848.0 Azángaro Senamhi-Puno<br />
11 Arapa CO 000783 Puno Azángaro Arapa 15º09'14.1" 70º07'10.6" 3830.0 Titicaca Senamhi-Puno<br />
12 Taraco CO 000816 Puno Huancané Taraco 15º18'42.0" 69º58'20.9" 3820.0 Ramis Senamhi-Puno<br />
13 Conima C 157420 Puno Moho Conima 15º27'00" 69º26'00" 3860.0 Titicaca Senamhi-Puno<br />
14 Puerto Acosta C PUA La Paz Camacho - 15º32'30.66" 69º15'8.32" 3835.0 Titicaca Senamhi-Bolivia<br />
15 Escoma PLU ESC La Paz Camacho - 15º40'00" 69º08'00" 3828.0 Suches Senamhi-Bolivia<br />
16 Chahuaya PLU CHA La Paz Camacho - 15º45'00" 68º59'00" 4500.0 Titicaca Senamhi-Bolivia<br />
Según el Cuadro Nº 2.2, tres (03) estaciones correspon<strong>de</strong>n a <strong>la</strong> cuenca Huancané, tres (03)<br />
estaciones a <strong>la</strong> cuenca Suches y siete (10) estaciones meteorológicas se ubican en <strong>la</strong>s<br />
cuencas vecinas.<br />
MINAG-ANA-DCPRH-AGUAS SUPERFICIALES Pág.15<br />
Propiedad
<strong>Estudio</strong> <strong>Hidrológico</strong> <strong>de</strong> <strong>la</strong>s <strong>Cuenca</strong>s Huancané y Suches 2010<br />
3.1 UBICACIÓN DE LA CUENCA<br />
3.1.1 Ubicación geográfica<br />
CAPÍTULO III<br />
DESCRIPCIÓN GENERAL DE LA CUENCA<br />
La cuenca Huancané se encuentra ubicada en coor<strong>de</strong>nadas UTM (WGS84):<br />
Este : 376030 - 468557<br />
Norte : 8301965 - 8397410<br />
Altitud : 3,806 - 5,100 msnm<br />
La cuenca Suches se encuentra ubicada en coor<strong>de</strong>nadas UTM (WGS84):<br />
Este : 439048 - 487155<br />
Norte : 8311924 - 8384770<br />
Altitud : 4,250 - 5,829 msnm<br />
3.1.2 Ubicación hidrográfica<br />
Las cuencas Huancané y Suches, hidrográficamente se encuentran ubicadas en:<br />
Región Hidrográficas : Titicaca<br />
Sistema Hídrico : TDPS<br />
3.1.3 Ubicación política<br />
Las cuencas Huancané y Suches, políticamente se encuentran ubicadas en:<br />
<strong>Cuenca</strong> Huancané<br />
Región : Puno<br />
Provincia : Huancané, Moho, San Antonio <strong>de</strong> Putina y Azángaro.<br />
Distrito : Huancané, Moho, Huayrapata, Rosaspata, Vilque Chico,<br />
Cojata, Inchupal<strong>la</strong>, Huatasani, Pedro Vilca Apaza,<br />
Quilcapuncu, Putina, Muñani, Ananea y Potoni.<br />
Localidad : Varios<br />
<strong>Cuenca</strong> Suches (transfronteriza)<br />
Lado Perú<br />
Región : Puno<br />
Provincia : Huancané y San Antonio <strong>de</strong> Putina.<br />
Distrito : Cojata, Ananea, Quilcapuncu e Inchupal<strong>la</strong>.<br />
Localidad : Varios<br />
MINAG-ANA-DCPRH-AGUAS SUPERFICIALES Pág.16
<strong>Estudio</strong> <strong>Hidrológico</strong> <strong>de</strong> <strong>la</strong>s <strong>Cuenca</strong>s Huancané y Suches 2010<br />
Lado Bolivia<br />
Departamento : La Paz<br />
Provincia : Franz Tamayo, Camacho y Saavedra.<br />
Localidad : Varios<br />
Nº<br />
Cuadro Nº 3.1 Distribución distrital en <strong>la</strong> cuenca <strong>de</strong>l <strong>río</strong> Huancané<br />
MINAG-ANA-DCPRH-AGUAS SUPERFICIALES Pág.17<br />
(km 2 )<br />
1 Puno San Antonio <strong>de</strong> Putina Ananea 98.05 2.70<br />
2 Puno Huancané Cojata 199.82 5.50<br />
3 Puno Huancané Huancané 284.43 7.83<br />
4 Puno Huancané Huatasani 106.13 2.92<br />
5 Puno Moho Huayrapata 23.36 0.64<br />
6 Puno Huancané Inchupal<strong>la</strong> 295.64 8.14<br />
7 Puno Moho Moho 126.39 3.48<br />
8 Puno Azángaro Muñani 618.93 17.04<br />
9 Puno San Antonio <strong>de</strong> Putina Pedro Vilca Apaza 130.44 3.59<br />
10 Puno Azángaro Potoni 1.47 0.04<br />
11 Puno San Antonio <strong>de</strong> Putina Putina 578.13 15.92<br />
12 Puno San Antonio <strong>de</strong> Putina Quilcapuncu 447.74 12.33<br />
13 Puno Huancané Rosaspata 279.07 7.69<br />
14 Puno Huancané Vilque Chico 441.59 12.16<br />
Nº<br />
Departamento<br />
Provincia<br />
Total<br />
Distrito<br />
Cuadro Nº 3.2 Distribución distrital en <strong>la</strong> cuenca <strong>de</strong>l <strong>río</strong> Suches<br />
Departamento<br />
Área<br />
(%)<br />
3631.19 100.00<br />
(km 2 )<br />
1 Puno San Antonio <strong>de</strong> Putina Ananea 417.44 35.96<br />
2 Puno Huancané Cojata 674.67 58.12<br />
3 Puno Huancané Inchupal<strong>la</strong> 1.07 0.09<br />
4 Puno San Antonio <strong>de</strong> Putina Quilcapuncu 67.57 5.82<br />
3.1.4 Ubicación administrativa<br />
Provincia<br />
Total<br />
Distrito<br />
Área<br />
(%)<br />
1160.75 100.00<br />
Las cuencas <strong>de</strong> los <strong>río</strong>s Huancané y Suches se enmarca <strong>de</strong>ntro <strong>de</strong>l ámbito jurisdiccional <strong>de</strong><br />
<strong>la</strong> Administración Local <strong>de</strong> Agua Huancané, cuya <strong>de</strong>pen<strong>de</strong>ncia técnica, funcional y<br />
administrativa es <strong>de</strong> <strong>la</strong> <strong>Autoridad</strong> Nacional <strong>de</strong>l Agua (ANA), con se<strong>de</strong> en <strong>la</strong> ciudad <strong>de</strong><br />
Lima. La ANA, como ente rector y máxima autoridad técnico-normativa <strong>de</strong>l Sistema<br />
Nacional <strong>de</strong> Gestión <strong>de</strong> los Recursos Hídricos, está adscrito en el Ministerio <strong>de</strong><br />
Agricultura. La se<strong>de</strong> administrativa se encuentra ubicado en <strong>la</strong> ciudad <strong>de</strong> Huancané, <strong>de</strong>l<br />
distrito y provincia <strong>de</strong> Huancané en <strong>la</strong> región Puno.
<strong>Estudio</strong> <strong>Hidrológico</strong> <strong>de</strong> <strong>la</strong>s <strong>Cuenca</strong>s Huancané y Suches 2010<br />
3.1.5 Límites hidrográficos<br />
Las cuencas Huancané y Suches, limitan con <strong>la</strong>s siguientes cuencas hidrográficas:<br />
<strong>Cuenca</strong> Huancané<br />
Este : <strong>Cuenca</strong>s <strong>río</strong> Suches y <strong>río</strong> Huaycho.<br />
Oeste : <strong>Cuenca</strong> <strong>río</strong> Azángaro e intercuenca Ramis.<br />
Norte : <strong>Cuenca</strong> <strong>río</strong> Azángaro.<br />
Sur : Zona circun<strong>la</strong>custre <strong>de</strong>l <strong>la</strong>go Titicaca.<br />
<strong>Cuenca</strong> Suches(Perú)<br />
Este : <strong>Cuenca</strong> <strong>río</strong> Suches (<strong>la</strong>do Bolivia).<br />
Oeste : <strong>Cuenca</strong> <strong>río</strong> Azángaro y Huancané.<br />
Norte : <strong>Cuenca</strong> <strong>río</strong> Inambari.<br />
Sur . <strong>Cuenca</strong> <strong>río</strong> Suches (<strong>la</strong>do Bolivia) y subcuenca <strong>río</strong> Huaycho.<br />
A continuación se muestran los Mapas Nº 3.1 al 3.6 correspondientes a <strong>la</strong> ubicación<br />
geográfica, hidrográfica y política <strong>de</strong> <strong>la</strong>s cuencas Huancané y Suches.<br />
3.2 ACCESIBILIDAD - VÍAS DE COMUNICACIÓN<br />
La ciudad <strong>de</strong> Huancané es el centro urbano más relevante en <strong>la</strong>s cuencas Huancané y<br />
Suches, prácticamente <strong>la</strong>s vías <strong>de</strong> acceso en una unidad móvil <strong>de</strong>s<strong>de</strong> <strong>la</strong> ciudad <strong>de</strong> Huancané<br />
hacia a cualquier lugar <strong>de</strong> <strong>la</strong>s cuencas es accesible.<br />
Los principales ejes <strong>de</strong> vías <strong>de</strong> acceso a <strong>la</strong> cuenca <strong>de</strong>l <strong>río</strong> Huancané, <strong>de</strong>s<strong>de</strong> <strong>la</strong> ciudad <strong>de</strong><br />
Puno, es <strong>la</strong> siguiente:<br />
1) Puno-Paucarcol<strong>la</strong>-Caracoto-Juliaca-Caminaca-Samán-Taraco-Huancané-Vilque<br />
Chico-Rosaspata.<br />
2) Puno-Paucarcol<strong>la</strong>-Caracoto-Juliaca-Caminaca-Samán-Taraco-Huancané-<br />
Ayrampuni.<br />
3) Puno-Paucarcol<strong>la</strong>-Caracoto-Juliaca-Caminaca-Samán-Taraco-Huancané-<br />
Huatasani-Inchupal<strong>la</strong>-Qui<strong>la</strong>capuncu.<br />
4) Puno-Paucarcol<strong>la</strong>-Caracoto-Juliaca-Caminaca-Samán-Taraco-Huancané-<br />
Huatasani-Putina-Muñani.<br />
Los principales ejes <strong>de</strong> vías <strong>de</strong> acceso a <strong>la</strong> cuenca <strong>de</strong>l <strong>río</strong> Suches, <strong>de</strong>s<strong>de</strong> <strong>la</strong> ciudad <strong>de</strong> Puno,<br />
es <strong>la</strong> siguiente:<br />
1) Puno-Paucarcol<strong>la</strong>-Caracoto-Juliaca-Caminaca-Samán-Taraco-Huancané-Vilque<br />
Chico-Cojata-Trapiche.<br />
2) Puno-Paucarcol<strong>la</strong>-Caracoto-Juliaca-Ca<strong>la</strong>puja-Azángaro-Progreso-San Antón-<br />
Crucero-Ananea-Trapiche-Cojata.<br />
La distancia entre ciuda<strong>de</strong>s <strong>de</strong> <strong>la</strong>s vías <strong>de</strong> acceso a <strong>la</strong>s cuencas Huancané y Suches, se<br />
muestran en los Cuadros Nº 3.3 y 3.4.<br />
MINAG-ANA-DCPRH-AGUAS SUPERFICIALES Pág.18
<strong>Estudio</strong> <strong>Hidrológico</strong> <strong>de</strong> <strong>la</strong>s <strong>Cuenca</strong>s Huancané y Suches 2010<br />
Mapa Nº 3.1 Ubicación geográfica <strong>de</strong> <strong>la</strong>s cuencas Huancané y Suches<br />
MINAG-ANA-DCPRH-AGUAS SUPERFICIALES Pág.19
<strong>Estudio</strong> <strong>Hidrológico</strong> <strong>de</strong> <strong>la</strong>s <strong>Cuenca</strong>s Huancané y Suches 2010<br />
Mapa Nº 3.2 Ubicación hidrográfica <strong>de</strong> <strong>la</strong>s cuencas Huancané y Suches en <strong>la</strong> vertiente <strong>de</strong>l Titicaca<br />
MINAG-ANA-DCPRH-AGUAS SUPERFICIALES Pág.20<br />
Río<br />
Suches
<strong>Estudio</strong> <strong>Hidrológico</strong> <strong>de</strong> <strong>la</strong>s <strong>Cuenca</strong>s Huancané y Suches 2010<br />
Mapa Nº 3.3 Ubicación hidrográfica <strong>de</strong> <strong>la</strong>s cuencas Huancané y Suches en el Sistema Hídrico TDPS<br />
MINAG-ANA-DCPRH-AGUAS SUPERFICIALES Pág.21
<strong>Estudio</strong> <strong>Hidrológico</strong> <strong>de</strong> <strong>la</strong>s <strong>Cuenca</strong>s Huancané y Suches 2010<br />
Mapa Nº 3.4 Ubicación política <strong>de</strong> <strong>la</strong>s cuencas Huancané y Suches<br />
MINAG-ANA-DCPRH-AGUAS SUPERFICIALES Pág.22
<strong>Estudio</strong> <strong>Hidrológico</strong> <strong>de</strong> <strong>la</strong>s <strong>Cuenca</strong>s Huancané y Suches 2010<br />
Mapa Nº 3.5 Distribución Distrital <strong>de</strong> <strong>la</strong>s cuencas Huancané y Suches<br />
MINAG-ANA-DCPRH-AGUAS SUPERFICIALES Pág.23
<strong>Estudio</strong> <strong>Hidrológico</strong> <strong>de</strong> <strong>la</strong>s <strong>Cuenca</strong>s Huancané y Suches 2010<br />
Mapa Nº 3.6 Distribución Distrital <strong>de</strong> <strong>la</strong>s cuencas Huancané y Suches (UH nivel 5)<br />
MINAG-ANA-DCPRH-AGUAS SUPERFICIALES Pág.24
<strong>Estudio</strong> <strong>Hidrológico</strong> <strong>de</strong> <strong>la</strong>s <strong>Cuenca</strong>s Huancané y Suches 2010<br />
Cuadro Nº 3.3 Distancia <strong>de</strong> <strong>la</strong>s vías <strong>de</strong> acceso en <strong>la</strong> cuenca <strong>de</strong>l <strong>río</strong> Huancané<br />
Primera Ruta Segunda Ruta Tercera Ruta<br />
Cuarta Ruta<br />
Tramo Dist.(km) Tipo Vía Tramo Dist.(km) Tipo Vía Tramo Dist.(km) Tipo Vía Tramo Dist.(km) Tipo Vía<br />
Puno-Paucarcol<strong>la</strong> 13.82 Asfaltada Puno-Paucarcol<strong>la</strong> 13.82 Asfaltada Puno-Paucarcol<strong>la</strong> 13.82 Asfaltada Puno-Paucarcol<strong>la</strong> 13.82 Asfaltada<br />
Paucarcol<strong>la</strong>-Caracoto 20.45 Asfaltada Paucarcol<strong>la</strong>-Caracoto 20.45 Asfaltada Paucarcol<strong>la</strong>-Caracoto 20.45 Asfaltada Paucarcol<strong>la</strong>-Caracoto 20.45 Asfaltada<br />
Caracoto-Juliaca 9.10 Asfaltada Caracoto-Juliaca 9.10 Asfaltada Caracoto-Juliaca 9.10 Asfaltada Caracoto-Juliaca 9.10 Asfaltada<br />
Juliaca- Caminaca 20.92 Asfaltada Juliaca- Caminaca 20.92 Asfaltada Juliaca- Caminaca 20.92 Asfaltada Juliaca- Caminaca 20.92 Asfaltada<br />
Caminaca-Saman 10.26 Asfaltada Caminaca-Saman 10.26 Asfaltada Caminaca-Saman 10.26 Asfaltada Caminaca-Saman 10.26 Asfaltada<br />
Saman-Taraco 5.16 Asfaltada Saman-Taraco 5.16 Asfaltada Saman-Taraco 5.16 Asfaltada Saman-Taraco 5.16 Asfaltada<br />
Taraco-Huancane 26.85 Asfaltada Taraco-Huancane 26.85 Asfaltada Taraco-Huancane 26.85 Asfaltada Taraco-Huancane 26.85 Asfaltada<br />
Huancane-Vilquechico 11.34 Asfaltada Huancane-Ayrumpuni 23.92 Trocha Huancane-Huatasani 17.91 Asfaltada Huancane-Huatasani 17.91 Asfaltada<br />
Vilquechico-Rosaspata 27.20 Trocha - - - Huatasani-Inchupal<strong>la</strong> 21.86 Trocha Huatasani-Putina 19.21 Asfaltada<br />
- - - - - - Inchupal<strong>la</strong>-Quilcapunco 24.26 Trocha Putina-Muñani 22.88 Trocha<br />
Total 145.10 Total 130.48 Total 170.59 Total 166.56<br />
Cuadro Nº 3.4 Distancia <strong>de</strong> <strong>la</strong>s vías <strong>de</strong> acceso en <strong>la</strong> cuenca <strong>de</strong>l <strong>río</strong> Suches (Perú)<br />
Tramo Dist.(km) Tipo Vía Tramo Dist.(km) Tipo Vía<br />
Puno-Paucarcol<strong>la</strong> 13.82 Asfaltada Puno-Paucarcol<strong>la</strong> 13.82 Asfaltada<br />
Paucarcol<strong>la</strong>-Caracoto 20.45 Asfaltada Paucarcol<strong>la</strong>-Caracoto 20.45 Asfaltada<br />
Caracoto-Juliaca 9.10 Asfaltada Caracoto-Juliaca 9.10 Asfaltada<br />
Juliaca- Caminaca 20.92 Asfaltada Juliaca- Ca<strong>la</strong>puja 24.33 Asfaltada<br />
Caminaca-Saman 10.26 Asfaltada Ca<strong>la</strong>puja-Azangaro 46.8 Asfaltada<br />
Saman-Taraco 5.16 Asfaltada Azangaro-Progreso 35.96 Asfaltada<br />
Taraco-Huancane 26.85 Asfaltada Progreso-San anton 16.35 Trocha<br />
Huancane-Vilquechico 11.34 Asfaltada San anron-Crucero 62.75 Trocha<br />
Vilquechico-Cojata 52.15 Trocha Crucero-Ananea 73.93 Trocha<br />
Cojata-Trapiche 36.41 Trocha Ananea-Trapiche 19.90 Trocha<br />
- - - Trapiche-Cojata 36.41 Trocha<br />
Total 206.46 Total 359.80<br />
3.3 ASPECTO SOCIO-ECONÓMICO<br />
3.3.1 Pob<strong>la</strong>ción - Demografía<br />
Primera Ruta Segunda Ruta<br />
En el Cuadro Nº 3.5, se presenta <strong>la</strong> pob<strong>la</strong>ción total <strong>de</strong> los distritos involucrados en el<br />
ámbito <strong>de</strong>l área <strong>de</strong> <strong>la</strong>s cuencas Huancané y Suches, según los resultados <strong>de</strong>l XI Censo<br />
Nacional <strong>de</strong> Pob<strong>la</strong>ción efectuada en el año 2007.<br />
La pob<strong>la</strong>ción total involucrada en <strong>la</strong>s cuencas Huancané y Suches es <strong>de</strong> 132,737 habitantes<br />
(66,904 hombres y 65,833 mujeres). En el Cuadro Nº 3.5 se muestra <strong>la</strong> pob<strong>la</strong>ción, área y<br />
<strong>de</strong>nsidad <strong>de</strong> <strong>la</strong> pob<strong>la</strong>ción por distritos.<br />
3.3.2 Caracterización socio-económica<br />
A) Actividad agríco<strong>la</strong><br />
Una <strong>de</strong> <strong>la</strong>s activida<strong>de</strong>s más importantes en <strong>la</strong> cuenca <strong>de</strong>l <strong>río</strong> Huancané es <strong>la</strong> agricultura; en<br />
<strong>la</strong> parte baja, media y alta <strong>de</strong> <strong>la</strong> cuenca, <strong>la</strong> campaña agríco<strong>la</strong> son <strong>de</strong> riego y régimen secano<br />
que generalmente <strong>de</strong>pen<strong>de</strong> por <strong>la</strong>s precipitaciones pluviales. En cambio, en <strong>la</strong> cuenca <strong>de</strong>l<br />
<strong>río</strong> Suches, el uso <strong>de</strong> agua en riego <strong>de</strong> pastos naturales se focalizan en <strong>la</strong> parte baja, media<br />
y alta <strong>de</strong> <strong>la</strong> cuenca. Los factores que afectan generalmente a los cultivos en <strong>la</strong>s cuencas <strong>de</strong><br />
estudio, son <strong>la</strong>s ocurrencias <strong>de</strong> <strong>la</strong>s inclemencias <strong>de</strong>l clima (he<strong>la</strong>das y sequías).<br />
MINAG-ANA-DCPRH-AGUAS SUPERFICIALES Pág.25
<strong>Estudio</strong> <strong>Hidrológico</strong> <strong>de</strong> <strong>la</strong>s <strong>Cuenca</strong>s Huancané y Suches 2010<br />
Nº<br />
Distrito<br />
Cuadro Nº 3.5 Pob<strong>la</strong>ción total en <strong>la</strong>s cuencas Huancané y Suches<br />
Pob<strong>la</strong>ción<br />
Hombres Mujeres Total<br />
Densidad<br />
pob<strong>la</strong>cional<br />
(hab/km 2 )<br />
1 Huancané 10,179 10,923 21,102 381.62 55.3<br />
2 Moho 8,369 8,673 17,042 494.36 34.5<br />
3 Huayrapata 2,092 2,062 4,154 388.35 10.7<br />
4 Rosaspata 2,808 2,829 5,637 301.47 18.7<br />
5 Vilque Chico 4,463 5,051 9,514 499.38 19.1<br />
6 Cojata 2,150 2,204 4,354 881.18 4.9<br />
7 Inchupal<strong>la</strong> 1,736 1,850 3,586 289.03 12.4<br />
8 Huatasani 2,052 2,104 4,156 106.73 38.9<br />
9 Pedro Vilca Apaza 1,252 1,271 2,523 565.81 4.5<br />
10 Quilcapuncu 2,585 2,546 5,131 516.66 9.9<br />
11 Putina 10,447 10,345 20,792 1,021.92 20.3<br />
12 Muñani 3,714 3,868 7,582 764.49 9.9<br />
13 Ananea 11,769 8,803 20,572 939.56 21.9<br />
14 Potoni 3,288 3,304 6,592 602.95 10.9<br />
Total<br />
66,904 65,833 132,737 - -<br />
Fuente: Instituto Nacional <strong>de</strong> Estadística e Informática (INEI) - Censo Nacional: XI <strong>de</strong> Pob<strong>la</strong>ción y VI <strong>de</strong> Vivienda, 2007.<br />
MINAG-ANA-DCPRH-AGUAS SUPERFICIALES Pág.26<br />
Área<br />
(km 2 )<br />
Los cultivos principales, son: Papa, Cebada (grano y forrajera), Avena (grano y forrajera),<br />
Habas, Quinua, Cañihua, Trigo, Olluco, Oca, Alfalfa, Pastos Cultivados y otros. La mayor<br />
parte <strong>de</strong> los cultivos son para consumo humano y subsistencia <strong>de</strong> los mismos y un mínimo<br />
porcentaje lo llevan al mercado para <strong>la</strong> venta o intercambio <strong>de</strong> alimentos.<br />
B) Actividad Pecuaria<br />
La gana<strong>de</strong>ría es otra actividad principal en <strong>la</strong>s cuencas Huancané y Suches, porque<br />
constituye fuente <strong>de</strong> ocupación e ingreso para el productor rural, representado por varias<br />
especies en menor cantidad en ganado ovino, porcino y otros, y en mayor cantidad ganado<br />
vacuno y los camélidos sudamericanos.<br />
En cuanto se refiere a camélidos, <strong>de</strong>ntro <strong>de</strong> <strong>la</strong> cuenca Huancané, en <strong>la</strong> subcuenca L<strong>la</strong>che<br />
parte alta existe <strong>la</strong> crianza y domesticación <strong>de</strong> vicuñas, que está encargado por el Centro<br />
Multicomunal Ca<strong>la</strong> Ca<strong>la</strong>, que es el patrimonio cultural <strong>de</strong>l Perú.<br />
La existencia <strong>de</strong> pastos naturales, cultivos <strong>de</strong> forrajes y pastos cultivados favorecen <strong>la</strong><br />
crianza <strong>de</strong>l ganado, siendo los vacunos <strong>de</strong> doble propósito (carne y leche), los ovinos para<br />
carne, porcinos (carne) y en cuanto a los camélidos (fibra).<br />
En <strong>la</strong>s cuencas Huancané y Suches, <strong>la</strong> problemática <strong>de</strong>l productor andino es <strong>la</strong> escases <strong>de</strong><br />
alimentos para los ganados en épocas <strong>de</strong> estiaje, (abril a noviembre), esto hace que los<br />
productores se <strong>de</strong>diquen a <strong>la</strong> siembra <strong>de</strong> forraje en <strong>la</strong> época <strong>de</strong> lluvia, para almacenar y<br />
alimentarlos en <strong>la</strong> época <strong>de</strong> estiaje.
<strong>Estudio</strong> <strong>Hidrológico</strong> <strong>de</strong> <strong>la</strong>s <strong>Cuenca</strong>s Huancané y Suches 2010<br />
3.4 DELIMITACIÓN HIDROGRÁFICA DE LA CUENCA<br />
Para <strong>la</strong> <strong>de</strong>limitación <strong>de</strong> <strong>la</strong>s unida<strong>de</strong>s hidrográficas <strong>de</strong> <strong>la</strong>s cuencas Huancané y Suches, se ha<br />
empleado <strong>la</strong> metodología <strong>de</strong> Pfafstetter.<br />
El Sistema <strong>de</strong> Codificación Pfafstetter fue <strong>de</strong>sarrol<strong>la</strong>do por Otto Pfafstetter en 1989,<br />
difundido a partir <strong>de</strong> 1997 por Verdin y adoptado a partir <strong>de</strong> entonces por <strong>la</strong> United State<br />
Geological Survey (USGS - Servicio Geológico <strong>de</strong> los Estados Unidos), como estándar<br />
internacional.<br />
Es una metodología para asignar I<strong>de</strong>ntificadores Ids a unida<strong>de</strong>s <strong>de</strong> drenaje basado en <strong>la</strong><br />
topología <strong>de</strong> <strong>la</strong> superficie <strong>de</strong>l terreno; dicho <strong>de</strong> otro modo asigna Ids a una cuenca para<br />
re<strong>la</strong>cionar<strong>la</strong> con sus cuencas vecinas, locales o internas.<br />
El proceso <strong>de</strong> codificación consiste en subdividir una cuenca hidrográfica, cualquiera que<br />
sea su tamaño, i<strong>de</strong>ntificando y <strong>de</strong>limitando los cuatro mayores afluentes <strong>de</strong>l <strong>río</strong> principal,<br />
en función <strong>de</strong>l área que compren<strong>de</strong>n sus respectivas unida<strong>de</strong>s hidrográficas. Las cuencas<br />
correspondientes a esos tributarios son enumeradas o codificadas con los dígitos pares 2, 4,<br />
6 y 8, en el sentido <strong>de</strong> aguas abajo hacia aguas arriba es <strong>de</strong>cir <strong>de</strong>s<strong>de</strong> <strong>la</strong> <strong>de</strong>sembocadura<br />
hacia <strong>la</strong> naciente <strong>de</strong>l <strong>río</strong> principal. Los otros tributarios <strong>de</strong>l <strong>río</strong> principal son agrupados en<br />
<strong>la</strong>s áreas restantes, <strong>de</strong>nominadas intercuencas, que se codifican, en el mismo sentido, con<br />
los dígitos impares 1, 3, 5, 7 y 9.<br />
Tab<strong>la</strong> 3.1 Unida<strong>de</strong>s hidrográficas y rangos<br />
Unidad hidrográfica<br />
MINAG-ANA-DCPRH-AGUAS SUPERFICIALES Pág.27<br />
Área<br />
(km 2 )<br />
Nº <strong>de</strong> or<strong>de</strong>n <strong>de</strong>l <strong>río</strong><br />
Microcuenca (pequeña) 10 - 100 1º, 2º ó 3º<br />
Subcuenca (mediana) 100 - 700 4º ó 5º<br />
<strong>Cuenca</strong> (gran<strong>de</strong>) 700 - 6000 6º a más<br />
Fuente: DSMC-DGASI / Lima, 1983 – Metodología <strong>de</strong> Priorización <strong>de</strong> <strong>Cuenca</strong>s.<br />
3.4.1 Descripción <strong>de</strong> <strong>la</strong> cuenca<br />
MEJIA M. A. (2001), Las características físicas y funcionales <strong>de</strong> una cuenca hidrográfica<br />
pue<strong>de</strong>n ser <strong>de</strong>finidas como los diversos factores que <strong>de</strong>terminan <strong>la</strong> naturaleza <strong>de</strong> <strong>la</strong><br />
<strong>de</strong>scarga <strong>de</strong> un curso <strong>de</strong> agua. Según VIESSMAN, HARBAUGH, KNAPP (1977), <strong>la</strong><br />
cuenca hidrográfica es toda el área drenada por un curso <strong>de</strong> agua o por un sistema <strong>de</strong><br />
cursos <strong>de</strong> agua, cuyas aguas concurren a un punto <strong>de</strong> salida, en otras pa<strong>la</strong>bras se pue<strong>de</strong><br />
<strong>de</strong>cir que cuenca <strong>de</strong> drenaje, es el área que contribuye a <strong>la</strong> escorrentía y que proporciona<br />
todo o parte <strong>de</strong>l flujo <strong>de</strong>l cauce principal y sus tributarios.<br />
La <strong>de</strong>nominación <strong>de</strong> <strong>la</strong>s unida<strong>de</strong>s hidrográficas circunscritas en el área <strong>de</strong> <strong>la</strong>s cuencas<br />
Huancané y Suches se ha realizado en función <strong>de</strong> su extensión y nombre <strong>de</strong> sus cursos <strong>de</strong><br />
agua finales o <strong>río</strong>s; estableciéndose en base a una re<strong>la</strong>ción entre unida<strong>de</strong>s hidrográficas y<br />
rangos (ver Tab<strong>la</strong> Nº 3.1) aplicando <strong>la</strong> metodología <strong>de</strong> Pfafstetter. La cuenca Huancané<br />
está conformado por nueve (9) unida<strong>de</strong>s hidrográficas y <strong>la</strong> cuenca Suches (Perú) por cuatro<br />
(4) subcuencas. Para <strong>la</strong> <strong>de</strong>limitación <strong>de</strong> unida<strong>de</strong>s hidrográficas en <strong>la</strong> cuenca Suches, no se<br />
ha aplicado <strong>la</strong> metodología <strong>de</strong> Pfafstetter, <strong>de</strong>bido a <strong>la</strong> falta <strong>de</strong> información cartográfica <strong>de</strong>
<strong>Estudio</strong> <strong>Hidrológico</strong> <strong>de</strong> <strong>la</strong>s <strong>Cuenca</strong>s Huancané y Suches 2010<br />
<strong>la</strong> cuenca correspondiente a <strong>la</strong> república <strong>de</strong> Bolivia. Ver Cuadro N° 3.6 y 3.7. En el Mapa<br />
Nº 3.8 y 3.10 se presenta <strong>la</strong> <strong>de</strong>limitación <strong>de</strong> <strong>la</strong>s subcuencas.<br />
A. <strong>Cuenca</strong> <strong>de</strong>l <strong>río</strong> Huancané<br />
La superficie total <strong>de</strong> <strong>la</strong> cuenca <strong>de</strong>l <strong>río</strong> Huancané es <strong>de</strong> 3631.19 km 2 . Sus características<br />
físicas principales que son materia <strong>de</strong> estudio, es <strong>la</strong> siguiente.<br />
Perímetro <strong>de</strong> <strong>la</strong> cuenca : 421.97 km<br />
Longitud <strong>de</strong>l <strong>río</strong> principal : 142.05 km<br />
Cota máxima <strong>de</strong> <strong>la</strong> cuenca : 5100.00 msnm<br />
Cota mínima <strong>de</strong> <strong>la</strong> cuenca : 3806.00 msnm<br />
Pendiente media <strong>de</strong> <strong>la</strong> cuenca : 0.0067 m/m<br />
Pendiente media <strong>de</strong>l <strong>río</strong> principal : 0.0070 m/m<br />
La <strong>de</strong>limitación <strong>de</strong> <strong>la</strong> cuenca <strong>de</strong>l <strong>río</strong> Huancané, toma como referencia <strong>la</strong> <strong>de</strong>sembocadura<br />
don<strong>de</strong> entrega sus aguas al <strong>la</strong>go Titicaca. Ver Mapa Nº 3.7.<br />
El curso principal <strong>de</strong> <strong>la</strong> cuenca <strong>de</strong>l <strong>río</strong> Huancané, nace <strong>de</strong>s<strong>de</strong> el <strong>río</strong> Toco Toco-<strong>río</strong> Ticani<strong>río</strong><br />
Puncune-<strong>río</strong> Pongongoni-<strong>río</strong> Putina-<strong>río</strong> Huancané, hasta <strong>la</strong> <strong>de</strong>sembocadura al <strong>la</strong>go<br />
Titicaca. Cuya longitud <strong>de</strong>l cauce principal es <strong>de</strong> 142.05 km y tiene una pendiente media<br />
<strong>de</strong> 0.70%.<br />
La cuenca <strong>de</strong>l <strong>río</strong> Huancané está conformado por nueve (9) subcuencas <strong>de</strong> nivel cinco (5):<br />
Alto Huancané (<strong>río</strong> Puncune), Pistune (<strong>río</strong> Pistune), Muñani (<strong>río</strong> Muñani), Tuyto (<strong>río</strong><br />
Tuyto), L<strong>la</strong>che (<strong>río</strong> L<strong>la</strong>che), Medio Alto Huancané (<strong>río</strong> Pongongoni), Medio Huancané (<strong>río</strong><br />
Putina), Medio Bajo Huancané (tramo <strong>río</strong> Huancané) y Bajo Huancané (tramo <strong>río</strong><br />
Huancané). Las cinco (5) primeras subcuencas tienen un aporte efectivo <strong>de</strong> caudal, <strong>la</strong>s<br />
cuatro (4) últimas están <strong>de</strong>finidas como intercuencas al recibir el aporte <strong>de</strong> agua <strong>de</strong> <strong>la</strong>s<br />
subcuencas anteriores. Ver Mapa Nº 3.8.<br />
A continuación se <strong>de</strong>scribe cada una <strong>de</strong> <strong>la</strong>s subcuencas <strong>de</strong> nivel cinco (5) correspondientes<br />
a <strong>la</strong> cuenca <strong>de</strong>l <strong>río</strong> Huancané.<br />
a.1 Subcuenca Bajo Huancané (UH 01781)<br />
Políticamente <strong>la</strong> subcuenca se encuentra ubicada en los distritos <strong>de</strong> Huancané y Vilque<br />
Chico, provincia <strong>de</strong> Huancané, en el <strong>de</strong>partamento <strong>de</strong> Puno. Hidrográficamente se localiza<br />
en <strong>la</strong> parte baja <strong>de</strong> <strong>la</strong> cuenca <strong>de</strong>l <strong>río</strong> Huancané; por sus características hidrográficas es una<br />
intercuenca, que recibe el aporte <strong>de</strong> agua <strong>de</strong> los <strong>río</strong>s afluentes. La subcuenca Bajo<br />
Huancané abarca una superficie <strong>de</strong> 246.41 km² y representa el 6.79% <strong>de</strong> <strong>la</strong> cuenca <strong>de</strong>l <strong>río</strong><br />
Huancané (3631.19 km²). El curso principal es el tramo <strong>río</strong> Huancané y cuya longitud es <strong>de</strong><br />
29.99 km, <strong>de</strong>s<strong>de</strong> <strong>la</strong> confluencia con el <strong>río</strong> L<strong>la</strong>che hasta su <strong>de</strong>sembocadura al <strong>la</strong>go Titicaca.<br />
El cauce <strong>de</strong>l tramo <strong>río</strong> Huancané presenta una pendiente media <strong>de</strong> 0.01%. El cauce en su<br />
recorrido presenta formas meándricas a consecuencia <strong>de</strong> <strong>la</strong> baja pendiente <strong>de</strong>l <strong>río</strong>. Las vías<br />
<strong>de</strong> acceso en esta subcuenca son ejes viales principales y secundarios que comunica el<br />
distrito <strong>de</strong> Huatasani y centros pob<strong>la</strong>dos <strong>de</strong>l entorno con <strong>la</strong> ciudad <strong>de</strong> Huancané.<br />
MINAG-ANA-DCPRH-AGUAS SUPERFICIALES Pág.28
<strong>Estudio</strong> <strong>Hidrológico</strong> <strong>de</strong> <strong>la</strong>s <strong>Cuenca</strong>s Huancané y Suches 2010<br />
Mapa Nº 3.7 <strong>Cuenca</strong> hidrográfica <strong>de</strong>l <strong>río</strong> Huancané<br />
MINAG-ANA-DCPRH-AGUAS SUPERFICIALES Pág.29
<strong>Estudio</strong> <strong>Hidrológico</strong> <strong>de</strong> <strong>la</strong>s <strong>Cuenca</strong>s Huancané y Suches 2010<br />
a.2 Subcuenca L<strong>la</strong>che (UH 01782)<br />
Políticamente <strong>la</strong> subcuenca se encuentra ubicada en los distritos <strong>de</strong> Pedro Vilca Apaza y<br />
Huatasani, provincias <strong>de</strong> San Antonio <strong>de</strong> Putina y Huancané, en el <strong>de</strong>partamento <strong>de</strong> Puno.<br />
Hidrográficamente se localiza en <strong>la</strong> parte media baja <strong>de</strong> <strong>la</strong> cuenca <strong>de</strong>l <strong>río</strong> Huancané; por<br />
sus características hidrográficas es uno <strong>de</strong> los tributarios que aporta sus aguas en forma<br />
directa a <strong>la</strong> cuenca Huancané; teniendo el principal afluente el <strong>río</strong> Pichacane por <strong>la</strong> margen<br />
izquierda. La subcuenca L<strong>la</strong>che abarca una superficie <strong>de</strong> 161.93 km² y representa el 4.46%<br />
<strong>de</strong> <strong>la</strong> cuenca <strong>de</strong>l <strong>río</strong> Huancané (3631.19 km²). El curso principal nace <strong>de</strong> <strong>la</strong> quebrada Juti<br />
Jutini - <strong>río</strong> Ca<strong>la</strong>ca<strong>la</strong>rio L<strong>la</strong>cho - <strong>río</strong> Ca<strong>la</strong> Ca<strong>la</strong> - <strong>río</strong> L<strong>la</strong>che y cuya longitud es <strong>de</strong> 40.42 km,<br />
<strong>de</strong>s<strong>de</strong> <strong>la</strong> naciente <strong>de</strong>l cauce principal quebrada Juti Jutini hasta <strong>la</strong> <strong>de</strong>sembocadura al <strong>río</strong><br />
Huancané.<br />
El cauce <strong>de</strong>l <strong>río</strong> L<strong>la</strong>che presenta una pendiente media <strong>de</strong> 2.04%. El cauce en <strong>la</strong> parte media<br />
y baja <strong>de</strong> su recorrido presenta formas meándricas a consecuencia <strong>de</strong> <strong>la</strong> baja pendiente <strong>de</strong>l<br />
<strong>río</strong>. Las vías <strong>de</strong> acceso en esta subcuenca son ejes viales principales y secundarios que<br />
comunica los distritos <strong>de</strong> Huatasani y Pedro Vilca Apaza, y centros pob<strong>la</strong>dos <strong>de</strong>l entorno<br />
con <strong>la</strong> ciudad <strong>de</strong> Huancané.<br />
a.3 Subcuenca Medio Bajo Huancané (UH 01783)<br />
Políticamente <strong>la</strong> subcuenca se encuentra ubicada en los distritos <strong>de</strong> Huatasani y Huancané,<br />
provincia <strong>de</strong> Huancané, en el <strong>de</strong>partamento <strong>de</strong> Puno. Hidrográficamente se localiza en <strong>la</strong><br />
parte media baja <strong>de</strong> <strong>la</strong> cuenca <strong>de</strong>l <strong>río</strong> Huancané; por sus características hidrográficas es una<br />
intercuenca, que recibe el aporte <strong>de</strong> agua <strong>de</strong> los <strong>río</strong>s afluentes. La subcuenca Medio Bajo<br />
Huancané abarca una superficie <strong>de</strong> 47.94 km² y representa el 1.32% <strong>de</strong> <strong>la</strong> cuenca <strong>de</strong>l <strong>río</strong><br />
Huancané (3631.19 km²). El curso principal es el tramo <strong>río</strong> Huancané y cuya longitud es <strong>de</strong><br />
11.09 km, <strong>de</strong>s<strong>de</strong> <strong>la</strong> confluencia <strong>de</strong> los <strong>río</strong>s Putina y Tuyto hasta <strong>la</strong> confluencia con el <strong>río</strong><br />
L<strong>la</strong>che.<br />
El cauce <strong>de</strong>l tramo <strong>río</strong> Huancané presenta una pendiente media <strong>de</strong> 0.07%. El cauce en su<br />
recorrido presenta formas meándricas a consecuencia <strong>de</strong> <strong>la</strong> baja pendiente <strong>de</strong>l <strong>río</strong>. Las vías<br />
<strong>de</strong> acceso en esta subcuenca son ejes viales principales y secundarios que comunica el<br />
distrito <strong>de</strong> Huatasani y centros pob<strong>la</strong>dos <strong>de</strong>l entorno con <strong>la</strong> ciudad <strong>de</strong> Huancané.<br />
a.4 Subcuenca Tuyto (UH 01784)<br />
Políticamente <strong>la</strong> subcuenca se encuentra ubicada en los distritos <strong>de</strong> Huancané, Inchupal<strong>la</strong>,<br />
Vilque Chico, Rosaspata, Moho, Huayrapata y Cojata; provincias <strong>de</strong> Huancané y Moho, en<br />
el <strong>de</strong>partamento <strong>de</strong> Puno. Hidrográficamente se localiza en <strong>la</strong> parte media baja <strong>de</strong> <strong>la</strong><br />
cuenca <strong>de</strong>l <strong>río</strong> Huancané; por sus características hidrográficas es uno <strong>de</strong> los tributarios<br />
principales que aporta sus aguas en forma directa a <strong>la</strong> cuenca Huancané; teniendo los<br />
principales afluentes los <strong>río</strong>s Hal<strong>la</strong> y Huayl<strong>la</strong>cuyo por <strong>la</strong> margen izquierda, los <strong>río</strong>s<br />
Camsane, Despensane y Pacchacuyo por <strong>la</strong> margen <strong>de</strong>recha. La subcuenca Tuyto abarca<br />
una superficie <strong>de</strong> 1107.11 km² y representa el 30.49% <strong>de</strong> <strong>la</strong> cuenca <strong>de</strong>l <strong>río</strong> Huancané<br />
(3631.19 km²). El curso principal nace <strong>de</strong>l <strong>río</strong> Chilluparje - <strong>río</strong> Achucachi - <strong>río</strong> Yaputira -<br />
<strong>río</strong> Guitarrane - <strong>río</strong> Quellocarca - <strong>río</strong> Osoca - <strong>río</strong> Tuyto y cuya longitud es <strong>de</strong> 94.17 km,<br />
<strong>de</strong>s<strong>de</strong> <strong>la</strong> naciente <strong>de</strong>l cauce principal hasta <strong>la</strong> confluencia con el <strong>río</strong> Putina.<br />
MINAG-ANA-DCPRH-AGUAS SUPERFICIALES Pág.30
<strong>Estudio</strong> <strong>Hidrológico</strong> <strong>de</strong> <strong>la</strong>s <strong>Cuenca</strong>s Huancané y Suches 2010<br />
El cauce <strong>de</strong>l <strong>río</strong> Tuyto presenta una pendiente media <strong>de</strong> 0.49%. El cauce en <strong>la</strong> parte media<br />
y baja <strong>de</strong> su recorrido presenta formas meándricas a consecuencia <strong>de</strong> <strong>la</strong> baja pendiente <strong>de</strong>l<br />
<strong>río</strong>. Las vías <strong>de</strong> acceso en esta subcuenca son ejes viales principales y secundarios que<br />
comunica los distritos <strong>de</strong> Huatasani, Vilque Chico, Rosaspata, Moho y Cojata, y centros<br />
pob<strong>la</strong>dos <strong>de</strong>l entorno con <strong>la</strong> ciudad <strong>de</strong> Huancané.<br />
a.5 Subcuenca Medio Huancané (UH 01785)<br />
Políticamente <strong>la</strong> subcuenca se encuentra ubicada en los distritos <strong>de</strong> Huatasani, Inchupal<strong>la</strong>,<br />
Putina y Quilcapuncu, provincias <strong>de</strong> Huancané y San Antonio <strong>de</strong> Putina, en el<br />
<strong>de</strong>partamento <strong>de</strong> Puno. Hidrográficamente se localiza en <strong>la</strong> parte media <strong>de</strong> <strong>la</strong> cuenca <strong>de</strong>l <strong>río</strong><br />
Huancané; por sus características hidrográficas es una intercuenca, que recibe el aporte <strong>de</strong><br />
agua <strong>de</strong> los <strong>río</strong>s afluentes. La subcuenca Medio Huancané abarca una superficie <strong>de</strong> 231.07<br />
km² y representa el 6.36% <strong>de</strong> <strong>la</strong> cuenca <strong>de</strong>l <strong>río</strong> Huancané (3631.19 km²). El curso principal<br />
es el <strong>río</strong> Putina y cuya longitud es <strong>de</strong> 36.46 km, <strong>de</strong>s<strong>de</strong> <strong>la</strong> confluencia <strong>de</strong> los <strong>río</strong>s<br />
Pongongoni y Muñani hasta <strong>la</strong> confluencia con el <strong>río</strong> Tuyto.<br />
El cauce <strong>de</strong>l <strong>río</strong> Putina presenta una pendiente media <strong>de</strong> 0.04%. El cauce en su recorrido<br />
presenta formas meándricas a consecuencia <strong>de</strong> <strong>la</strong> baja pendiente <strong>de</strong>l <strong>río</strong>. Las vías <strong>de</strong> acceso<br />
en esta subcuenca son ejes viales principales y secundarios que comunica los distritos <strong>de</strong><br />
Huatasani y Putina, y centros pob<strong>la</strong>dos <strong>de</strong>l entorno con <strong>la</strong> ciudad <strong>de</strong> Huancané.<br />
a.6 Subcuenca Muñani (UH 01786)<br />
Políticamente <strong>la</strong> subcuenca se encuentra ubicada en los distritos <strong>de</strong> Putina, Muñani y<br />
Potoni; provincias <strong>de</strong> San Antonio <strong>de</strong> Putina y Azángaro, en el <strong>de</strong>partamento <strong>de</strong> Puno.<br />
Hidrográficamente se localiza en <strong>la</strong> parte alta <strong>de</strong> <strong>la</strong> cuenca <strong>de</strong>l <strong>río</strong> Huancané; por sus<br />
características hidrográficas es uno <strong>de</strong> los tributarios principales que aporta sus aguas en<br />
forma directa a <strong>la</strong> cuenca Huancané; teniendo los principales afluentes los <strong>río</strong>s Palca y<br />
Tarucani por <strong>la</strong> margen izquierda. La subcuenca Muñani abarca una superficie <strong>de</strong> 889.44<br />
km² y representa el 24.49% <strong>de</strong> <strong>la</strong> cuenca <strong>de</strong>l <strong>río</strong> Huancané (3631.19 km²). El curso<br />
principal nace <strong>de</strong>l <strong>río</strong> Huancollo - <strong>río</strong> Guanaco - <strong>río</strong> Mallquini - <strong>río</strong> Muñani y cuya longitud<br />
es <strong>de</strong> 71.58 km, <strong>de</strong>s<strong>de</strong> <strong>la</strong> naciente <strong>de</strong>l cauce principal hasta <strong>la</strong> confluencia con el <strong>río</strong><br />
Pongongoni.<br />
El cauce <strong>de</strong>l <strong>río</strong> Muñani presenta una pendiente media <strong>de</strong> 1.26%. El cauce en <strong>la</strong> parte baja<br />
<strong>de</strong> su recorrido presenta formas meándricas a consecuencia <strong>de</strong> <strong>la</strong> baja pendiente <strong>de</strong>l <strong>río</strong>.<br />
Las vías <strong>de</strong> acceso en esta subcuenca son ejes viales principales y secundarios que<br />
comunica los distritos <strong>de</strong> Huatasani, Putina y Muñani, y centros pob<strong>la</strong>dos <strong>de</strong>l entorno con<br />
<strong>la</strong> ciudad <strong>de</strong> Huancané.<br />
a.7 Subcuenca Medio Alto Huancané (UH 01787)<br />
Políticamente <strong>la</strong> subcuenca se encuentra ubicada en el distrito <strong>de</strong> Putina, provincia <strong>de</strong> San<br />
Antonio <strong>de</strong> Putina, en el <strong>de</strong>partamento <strong>de</strong> Puno. Hidrográficamente se localiza en <strong>la</strong> parte<br />
media alta <strong>de</strong> <strong>la</strong> cuenca <strong>de</strong>l <strong>río</strong> Huancané; por sus características hidrográficas es una<br />
intercuenca, que recibe el aporte <strong>de</strong> agua <strong>de</strong> los <strong>río</strong>s afluentes. La subcuenca Medio Alto<br />
Huancané abarca una superficie <strong>de</strong> 42.09 km² y representa el 1.16% <strong>de</strong> <strong>la</strong> cuenca <strong>de</strong>l <strong>río</strong><br />
MINAG-ANA-DCPRH-AGUAS SUPERFICIALES Pág.31
<strong>Estudio</strong> <strong>Hidrológico</strong> <strong>de</strong> <strong>la</strong>s <strong>Cuenca</strong>s Huancané y Suches 2010<br />
Huancané (3631.19 km²). El curso principal es el <strong>río</strong> Pongongoni y cuya longitud es <strong>de</strong><br />
16.17 km, <strong>de</strong>s<strong>de</strong> <strong>la</strong> confluencia <strong>de</strong> los <strong>río</strong>s Pistune y Puncune hasta <strong>la</strong> confluencia con el<br />
<strong>río</strong> Muñani.<br />
El cauce <strong>de</strong>l <strong>río</strong> Pongongoni presenta una pendiente media <strong>de</strong> 0.08%. El cauce en su<br />
recorrido presenta formas meándricas a consecuencia <strong>de</strong> <strong>la</strong> baja pendiente <strong>de</strong>l <strong>río</strong>. Las vías<br />
<strong>de</strong> acceso en esta subcuenca son ejes viales principales y secundarios que comunica los<br />
distritos <strong>de</strong> Huatasani y Putina, y centros pob<strong>la</strong>dos <strong>de</strong>l entorno con <strong>la</strong> ciudad <strong>de</strong> Huancané.<br />
a.8 Subcuenca Pistune (UH 01788)<br />
Políticamente <strong>la</strong> subcuenca se encuentra ubicada en los distritos <strong>de</strong> Putina, Quilcapuncu e<br />
Inchupal<strong>la</strong>; provincias <strong>de</strong> San Antonio <strong>de</strong> Putina y Huancané, en el <strong>de</strong>partamento <strong>de</strong> Puno.<br />
Hidrográficamente se localiza en <strong>la</strong> parte media <strong>de</strong> <strong>la</strong> cuenca <strong>de</strong>l <strong>río</strong> Huancané; por sus<br />
características hidrográficas es uno <strong>de</strong> los tributarios principales que aporta sus aguas en<br />
forma directa a <strong>la</strong> cuenca Huancané; teniendo los principales afluentes los <strong>río</strong>s Humajalso,<br />
Chejol<strong>la</strong> Jahuira, Chaul<strong>la</strong>netira y Combuco por <strong>la</strong> margen <strong>de</strong>recha. La subcuenca Pistune<br />
abarca una superficie <strong>de</strong> 380.43 km² y representa el 10.48% <strong>de</strong> <strong>la</strong> cuenca <strong>de</strong>l <strong>río</strong> Huancané<br />
(3631.19 km²). El curso principal nace <strong>de</strong>l <strong>río</strong> Machaypunco - <strong>río</strong> Humullo - <strong>río</strong><br />
Achajahuira - <strong>río</strong> Pistune y cuya longitud es <strong>de</strong> 52.53 km, <strong>de</strong>s<strong>de</strong> <strong>la</strong> naciente <strong>de</strong>l cauce<br />
principal hasta <strong>la</strong> confluencia con el <strong>río</strong> Puncune.<br />
El cauce <strong>de</strong>l <strong>río</strong> Pistune presenta una pendiente media <strong>de</strong> 1.68%. El cauce en <strong>la</strong> parte media<br />
y baja <strong>de</strong> su recorrido presenta formas meándricas a consecuencia <strong>de</strong> <strong>la</strong> baja pendiente <strong>de</strong>l<br />
<strong>río</strong>. Las vías <strong>de</strong> acceso en esta subcuenca son ejes viales principales y secundarios que<br />
comunica los distritos <strong>de</strong> Huatasani, Putina, Inchupal<strong>la</strong> y Vilque Chico, y centros pob<strong>la</strong>dos<br />
<strong>de</strong>l entorno con <strong>la</strong> ciudad <strong>de</strong> Huancané.<br />
a.9 Subcuenca Alto Huancané (UH 01789)<br />
Políticamente <strong>la</strong> subcuenca se encuentra ubicada en los distritos <strong>de</strong> Putina, Quilcapuncu y<br />
Ananea, provincia <strong>de</strong> San Antonio <strong>de</strong> Putina, en el <strong>de</strong>partamento <strong>de</strong> Puno.<br />
Hidrográficamente se localiza en <strong>la</strong> parte alta <strong>de</strong> <strong>la</strong> cuenca <strong>de</strong>l <strong>río</strong> Huancané; por sus<br />
características hidrográficas es uno <strong>de</strong> los tributarios principales que aporta sus aguas en<br />
forma directa a <strong>la</strong> cuenca Huancané; teniendo los principales afluentes los <strong>río</strong>s Jarcapunco,<br />
Acuyo y Alvarizani por <strong>la</strong> margen izquierda, los <strong>río</strong>s Choquene, Furcapunco y Larcamayo<br />
por <strong>la</strong> margen <strong>de</strong>recha. La subcuenca Alto Huancané abarca una superficie <strong>de</strong> 524.77 km²<br />
y representa el 14.45% <strong>de</strong> <strong>la</strong> cuenca <strong>de</strong>l <strong>río</strong> Huancané (3631.19 km²). El curso principal<br />
nace <strong>de</strong>l <strong>río</strong> Toco Toco - <strong>río</strong> Ticani - <strong>río</strong> Puncune y cuya longitud es <strong>de</strong> 49.34 km, <strong>de</strong>s<strong>de</strong> <strong>la</strong><br />
naciente <strong>de</strong>l cauce principal hasta <strong>la</strong> confluencia con el <strong>río</strong> Pistune.<br />
El cauce <strong>de</strong>l <strong>río</strong> Puncune presenta una pendiente media <strong>de</strong> 1.89%. El cauce en <strong>la</strong> parte baja<br />
<strong>de</strong> su recorrido presenta formas meándricas a consecuencia <strong>de</strong> <strong>la</strong> baja pendiente <strong>de</strong>l <strong>río</strong>.<br />
Las vías <strong>de</strong> acceso en esta subcuenca son ejes viales principales y secundarios que<br />
comunica los distritos <strong>de</strong> Huatasani, Putina, Quilcapuncu, Ananea, Cojata y Vilque Chico,<br />
y centros pob<strong>la</strong>dos <strong>de</strong>l entorno con <strong>la</strong> ciudad <strong>de</strong> Huancané.<br />
MINAG-ANA-DCPRH-AGUAS SUPERFICIALES Pág.32
<strong>Estudio</strong> <strong>Hidrológico</strong> <strong>de</strong> <strong>la</strong>s <strong>Cuenca</strong>s Huancané y Suches 2010<br />
Mapa Nº 3.8 Unida<strong>de</strong>s hidrográficas <strong>de</strong> nivel cinco (subcuencas) - <strong>Cuenca</strong> Huancané<br />
MINAG-ANA-DCPRH-AGUAS SUPERFICIALES Pág.33
<strong>Estudio</strong> <strong>Hidrológico</strong> <strong>de</strong> <strong>la</strong>s <strong>Cuenca</strong>s Huancané y Suches 2010<br />
Río Río Guanaco Guanaco<br />
Muñani<br />
Embalse<br />
Cal<strong>la</strong>tomaza<br />
(proyectado)<br />
Río Río Mallquini Mallquini<br />
Putina<br />
Huatasani<br />
Río Muñani<br />
Figura Nº 3.1 Esquema fluvial <strong>de</strong> <strong>la</strong> cuenca <strong>de</strong>l <strong>río</strong> Huancané<br />
Río Río Palca Palca<br />
Río Río Río Río Putina Putina Putina Putina<br />
Río<br />
Pongongoni<br />
Río Tuyto<br />
Larcamayo<br />
Río<br />
Río<br />
Puncune<br />
Río Pistune<br />
Río Ticani<br />
Río Combuco<br />
Río Ticani<br />
Quilcapuncu<br />
Río Río Chejol<strong>la</strong> Chejol<strong>la</strong> Jahuira Jahuira<br />
Inchupal<strong>la</strong><br />
Río Achajahuira Río<br />
MINAG-ANA-DCPRH-AGUAS SUPERFICIALES Pág.34<br />
Río Río Toco Toco Toco Toco<br />
Río Alvarizani<br />
Humullo Humullo<br />
Río Río Pachaccucho<br />
Pachaccucho<br />
Río Yaputira<br />
Río Embalse Yaputira<br />
Ca<strong>la</strong> Ca<strong>la</strong> Río L<strong>la</strong>che<br />
(proyectado)<br />
Río Río Huancané Huancané<br />
Lago Titicaca<br />
Huancané<br />
Río Osoca<br />
Río Quellocarca<br />
Río<br />
Guitarrane<br />
Achul<strong>la</strong>ni<br />
Río<br />
Rosaspata<br />
Río Napa<br />
Río Río Cochococho Cochococho<br />
Río<br />
Achucachi<br />
Río<br />
Embalse<br />
Pob<strong>la</strong>ción
<strong>Estudio</strong> <strong>Hidrológico</strong> <strong>de</strong> <strong>la</strong>s <strong>Cuenca</strong>s Huancané y Suches 2010<br />
Nº<br />
Código<br />
Pfafstetter<br />
Cuadro Nº 3.6 Unida<strong>de</strong>s hidrográficas <strong>de</strong> <strong>la</strong> cuenca <strong>de</strong>l <strong>río</strong> Huancané (nivel 5)<br />
Nivel Unidad hidrográfica<br />
Río principal<br />
1 01781 5 Subcuenca Bajo Huancané Tramo <strong>río</strong> Huancané 246.41<br />
2 01782 5 Subcuenca L<strong>la</strong>che Río L<strong>la</strong>che 161.93<br />
3 01783 5 Subcuenca Medio Bajo Huancané Tramo <strong>río</strong> Huancané 47.94<br />
4 01784 5 Subcuenca Tuyto Río Tuyto 1,107.11<br />
5 01785 5 Subcuenca Medio Huancané Río Putina 231.07<br />
6 01786 5 Subcuenca Muñani Río Muñani 889.44<br />
7 01787 5 Subcuenca Medio Alto Huancané Río Pongongoni 42.09<br />
8 01788 5 Subcuenca Pistune Río Pistune 380.43<br />
9 01789 5 Subcuenca Alto Huancané Río Puncune 524.77<br />
0178 4 <strong>Cuenca</strong> Huancané Río Huancané 3,631.19<br />
B. <strong>Cuenca</strong> <strong>de</strong>l <strong>río</strong> Suches<br />
Área <strong>de</strong> <strong>la</strong> cuenca<br />
(km²) (%)<br />
MINAG-ANA-DCPRH-AGUAS SUPERFICIALES Pág.35<br />
6.79<br />
4.46<br />
1.32<br />
30.49<br />
6.36<br />
24.49<br />
1.16<br />
10.48<br />
14.45<br />
100.00<br />
Nº <strong>de</strong> or<strong>de</strong>n<br />
<strong>de</strong>l <strong>río</strong><br />
El <strong>río</strong> Suches es una cuenca transfronteriza (Perú-Bolivia), que <strong>de</strong>semboca sus aguas al<br />
<strong>la</strong>go Titicaca, cuya superficie total <strong>de</strong>limitado hasta <strong>la</strong> estación hidrométrica Puente<br />
Escoma es <strong>de</strong> 2930.73 km 2 ; <strong>de</strong> ésta los 1160.75 km 2 pertenece a Perú y 1769.98 km 2 a<br />
Bolivia. Sus características físicas principales que son materia <strong>de</strong> estudio, es <strong>la</strong> siguiente.<br />
Perímetro <strong>de</strong> <strong>la</strong> cuenca : 384.57 km<br />
Longitud <strong>de</strong>l <strong>río</strong> principal : 188.00 km<br />
Cota máxima <strong>de</strong>l <strong>río</strong> principal : 5031.00 msnm<br />
Cota mínima <strong>de</strong>l <strong>río</strong> principal : 3817.00 msnm<br />
Pendiente media <strong>de</strong>l <strong>río</strong> principal : 0.0065 m/m<br />
El curso principal <strong>de</strong> <strong>la</strong> cuenca <strong>de</strong>l <strong>río</strong> Suches (Perú-Bolivia), nace <strong>de</strong>s<strong>de</strong> <strong>la</strong> <strong>la</strong>guna<br />
Cullumachayo - <strong>la</strong>guna Huayl<strong>la</strong>tane - <strong>la</strong>guna Pararani - <strong>río</strong> Trapiche - <strong>la</strong>guna Lacayaqui -<br />
<strong>río</strong> Trapiche - <strong>río</strong> Suches, hasta <strong>la</strong> <strong>de</strong>sembocadura al <strong>la</strong>go Titicaca, cuya longitud total es<br />
<strong>de</strong> 188.0 km y tiene una pendiente media <strong>de</strong> 0.65%. La parte peruana <strong>de</strong> <strong>la</strong> cuenca es hasta<br />
el cruce <strong>de</strong>l <strong>río</strong> Suches con el límite internacional Perú-Bolivia (lugar Cuchaul<strong>la</strong>), cuya<br />
longitud <strong>de</strong>l <strong>río</strong> es <strong>de</strong> 118.96 km y una pendiente media <strong>de</strong> 0.66%. Ver Mapa Nº 3.9.<br />
En <strong>la</strong> cuenca <strong>de</strong>l <strong>río</strong> Suches (Perú) se ha <strong>de</strong>limitado tres (3) subcuencas y una intercuenca,<br />
en este caso no se ha aplicado <strong>la</strong> metodología <strong>de</strong> Pfafstetter, <strong>de</strong>bido por falta <strong>de</strong> <strong>la</strong><br />
información cartográfica parte Boliviana <strong>de</strong> <strong>la</strong> cuenca, <strong>la</strong>s unida<strong>de</strong>s hidrográficas<br />
correspondientes son: Chueña Huata Jahuira, Caylloma, Trapiche y Suches (Perú). Las tres<br />
(3) primeras subcuencas tienen un aporte efectivo <strong>de</strong> caudal y <strong>la</strong> última está <strong>de</strong>finida como<br />
intercuenca al recibir el aporte <strong>de</strong> agua <strong>de</strong> <strong>la</strong>s subcuencas anteriores. Ver Mapa Nº 3.10.<br />
A continuación se <strong>de</strong>scribe cada una <strong>de</strong> <strong>la</strong>s subcuencas correspondientes a <strong>la</strong> cuenca <strong>de</strong>l <strong>río</strong><br />
Suches (Perú).<br />
6<br />
4<br />
6<br />
5<br />
6<br />
5<br />
6<br />
5<br />
5<br />
6
<strong>Estudio</strong> <strong>Hidrológico</strong> <strong>de</strong> <strong>la</strong>s <strong>Cuenca</strong>s Huancané y Suches 2010<br />
Mapa Nº 3.9 <strong>Cuenca</strong> hidrográfica <strong>de</strong>l <strong>río</strong> Suches<br />
MINAG-ANA-DCPRH-AGUAS SUPERFICIALES Pág.36
<strong>Estudio</strong> <strong>Hidrológico</strong> <strong>de</strong> <strong>la</strong>s <strong>Cuenca</strong>s Huancané y Suches 2010<br />
b.1 Subcuenca <strong>río</strong> Chueña Huata Jahuira<br />
Políticamente <strong>la</strong> subcuenca se encuentra ubicada en el distrito <strong>de</strong> Cojata, provincia <strong>de</strong><br />
Huancané, en el <strong>de</strong>partamento <strong>de</strong> Puno. Hidrográficamente se localiza en <strong>la</strong> parte media<br />
baja <strong>de</strong> <strong>la</strong> cuenca <strong>de</strong>l <strong>río</strong> Suches; por sus características hidrográficas es uno <strong>de</strong> los<br />
tributarios que aporta sus aguas en forma directa a <strong>la</strong> cuenca Suches; teniendo los afluentes<br />
<strong>de</strong> varias quebradas en ambas márgenes. La subcuenca Chueña Huata Jahuira abarca una<br />
superficie <strong>de</strong> 162.18 km² y representa el 5.53% <strong>de</strong> <strong>la</strong> cuenca <strong>de</strong>l <strong>río</strong> Suches (2930.73 km²).<br />
El curso principal nace <strong>de</strong> <strong>la</strong> <strong>la</strong>guna Sal<strong>la</strong>pata - quebrada Parucane - <strong>río</strong> Carascol<strong>la</strong>ne - <strong>río</strong><br />
Hui<strong>la</strong>carca - <strong>río</strong> Astupunco - <strong>río</strong> Chueña Huata Jahuira y cuya longitud es <strong>de</strong> 36.76 km,<br />
<strong>de</strong>s<strong>de</strong> <strong>la</strong> naciente <strong>de</strong>l cauce principal hasta <strong>la</strong> <strong>de</strong>sembocadura al <strong>río</strong> Suches.<br />
El cauce <strong>de</strong>l <strong>río</strong> Chueña Huata Jahuira presenta una pendiente media <strong>de</strong> 1.03%. El cauce en<br />
<strong>la</strong> parte media y baja <strong>de</strong> su recorrido presenta formas meándricas a consecuencia <strong>de</strong> <strong>la</strong> baja<br />
pendiente <strong>de</strong>l <strong>río</strong>. Las vías <strong>de</strong> acceso en esta subcuenca son ejes viales principales y<br />
secundarios que comunica los distritos <strong>de</strong> Vilque Chico y Cojata, y centros pob<strong>la</strong>dos <strong>de</strong>l<br />
entorno con <strong>la</strong> ciudad <strong>de</strong> Huancané.<br />
b.2 Subcuenca <strong>río</strong> Caylloma<br />
Políticamente <strong>la</strong> subcuenca se encuentra ubicada en los distritos <strong>de</strong> Cojata, Inchupal<strong>la</strong> y<br />
Quilcapuncu, provincias <strong>de</strong> Huancané y San Antonio <strong>de</strong> Putina, en el <strong>de</strong>partamento <strong>de</strong><br />
Puno. Hidrográficamente se localiza en <strong>la</strong> parte media alta <strong>de</strong> <strong>la</strong> cuenca <strong>de</strong>l <strong>río</strong> Suches; por<br />
sus características hidrográficas es uno <strong>de</strong> los tributarios principales que aporta sus aguas<br />
en forma directa a <strong>la</strong> cuenca Suches; teniendo los principales afluentes los <strong>río</strong>s Charpucho,<br />
Quellutacuni y Pacahuacho por <strong>la</strong> margen <strong>de</strong>recha, y <strong>río</strong> Mosoni por <strong>la</strong> margen izquierda.<br />
La subcuenca Caylloma abarca una superficie <strong>de</strong> 289.22 km² y representa el 9.87% <strong>de</strong> <strong>la</strong><br />
cuenca <strong>de</strong>l <strong>río</strong> Suches (2930.73 km²). El curso principal nace <strong>de</strong> <strong>la</strong> quebrada Chullpapampa<br />
- <strong>río</strong> Huichacunca - <strong>río</strong> Caylloma y cuya longitud es <strong>de</strong> 40.24 km, <strong>de</strong>s<strong>de</strong> <strong>la</strong> naciente <strong>de</strong>l<br />
cauce principal hasta <strong>la</strong> confluencia con el <strong>río</strong> Suches.<br />
El cauce <strong>de</strong>l <strong>río</strong> Caylloma presenta una pendiente media <strong>de</strong> 1.26%. El cauce en <strong>la</strong> parte<br />
media y baja <strong>de</strong> su recorrido presenta formas meándricas a consecuencia <strong>de</strong> <strong>la</strong> baja<br />
pendiente <strong>de</strong>l <strong>río</strong>. Las vías <strong>de</strong> acceso en esta subcuenca son ejes viales principales y<br />
secundarios que comunica los distritos <strong>de</strong> Vilque Chico y Cojata, y centros pob<strong>la</strong>dos <strong>de</strong>l<br />
entorno con <strong>la</strong> ciudad <strong>de</strong> Huancané.<br />
b.3 Subcuenca <strong>río</strong> Trapiche<br />
Políticamente <strong>la</strong> subcuenca se encuentra ubicada en los distritos <strong>de</strong> Cojata y Ananea,<br />
provincias <strong>de</strong> Huancané y San Antonio <strong>de</strong> Putina, en el <strong>de</strong>partamento <strong>de</strong> Puno.<br />
Hidrográficamente se localiza en <strong>la</strong> parte alta <strong>de</strong> <strong>la</strong> cuenca <strong>de</strong>l <strong>río</strong> Suches; por sus<br />
características hidrográficas es uno <strong>de</strong> los tributarios principales que aporta sus aguas en<br />
forma directa a <strong>la</strong> cuenca Suches; teniendo los principales afluentes los <strong>río</strong>s Cuybas y<br />
Ojonica por <strong>la</strong> margen izquierda. La subcuenca Alto Suches abarca una superficie <strong>de</strong><br />
405.45 km² y representa el 13.83% <strong>de</strong> <strong>la</strong> cuenca <strong>de</strong>l <strong>río</strong> Suches (2930.73 km²). El curso<br />
principal nace <strong>de</strong> <strong>la</strong> <strong>la</strong>guna Cullumachayo - <strong>la</strong>guna Huayl<strong>la</strong>tane - <strong>la</strong>guna Pararani - <strong>río</strong><br />
MINAG-ANA-DCPRH-AGUAS SUPERFICIALES Pág.37
<strong>Estudio</strong> <strong>Hidrológico</strong> <strong>de</strong> <strong>la</strong>s <strong>Cuenca</strong>s Huancané y Suches 2010<br />
Trapiche - <strong>la</strong>guna Lacayaqui - <strong>río</strong> Trapiche y cuya longitud es <strong>de</strong> 38.63 km, <strong>de</strong>s<strong>de</strong> <strong>la</strong><br />
naciente <strong>de</strong>l cauce principal hasta <strong>la</strong> confluencia con el <strong>río</strong> Suches.<br />
El cauce <strong>de</strong>l <strong>río</strong> Trapiche presenta una pendiente media <strong>de</strong> 1.64%. El cauce en su recorrido<br />
no presenta formas meándricas a consecuencia <strong>de</strong> <strong>la</strong> alta pendiente <strong>de</strong>l <strong>río</strong>. Las vías <strong>de</strong><br />
acceso en esta subcuenca son ejes viales principales y secundarios que comunica los<br />
distritos <strong>de</strong> Vilque Chico, Cojata y Ananea, y centros pob<strong>la</strong>dos <strong>de</strong>l entorno con <strong>la</strong> ciudad<br />
<strong>de</strong> Huancané.<br />
b.4 Subcuenca <strong>río</strong> Suches (Perú)<br />
Políticamente <strong>la</strong> subcuenca se encuentra ubicada en el distrito <strong>de</strong> Ananea y Cojata,<br />
provincias <strong>de</strong> San Antonio <strong>de</strong> Putina y Huancané, en el <strong>de</strong>partamento <strong>de</strong> Puno.<br />
Hidrográficamente se localiza en <strong>la</strong> parte media, baja y alta <strong>de</strong> <strong>la</strong> cuenca <strong>de</strong>l <strong>río</strong> Suches;<br />
por sus características hidrográficas es una intercuenca, que recibe el aporte <strong>de</strong> agua <strong>de</strong> los<br />
<strong>río</strong>s afluentes. Los principales afluentes por <strong>la</strong> margen izquierda son los <strong>río</strong>s <strong>de</strong> <strong>la</strong> <strong>la</strong>guna<br />
Suches, Japojollo y Raya; por <strong>la</strong> margen <strong>de</strong>recha son los <strong>río</strong>s Caylloma y Chueña Huata<br />
Jahuira; y el <strong>río</strong> Trapiche como naciente <strong>de</strong> su cauce principal. La subcuenca Suches (Perú)<br />
abarca una superficie <strong>de</strong> 303.90 km² y representa el 10.37% <strong>de</strong> <strong>la</strong> cuenca <strong>de</strong>l <strong>río</strong> Suches<br />
(2930.73 km²). El curso principal nace <strong>de</strong>s<strong>de</strong> el <strong>río</strong> Trapiche y cuya longitud <strong>de</strong>l tramo <strong>río</strong><br />
Suches es <strong>de</strong> 80.33 km, <strong>de</strong>s<strong>de</strong> <strong>la</strong> naciente <strong>de</strong> <strong>la</strong> subcuenca hasta el lugar Cuchaul<strong>la</strong> (límite<br />
internacional Perú-Bolivia).<br />
El cauce <strong>de</strong>l tramo <strong>río</strong> Suches presenta una pendiente media <strong>de</strong> 0.19%. El cauce en su<br />
recorrido presenta formas meándricas a consecuencia <strong>de</strong> <strong>la</strong> baja pendiente <strong>de</strong>l <strong>río</strong>. Las vías<br />
<strong>de</strong> acceso en esta subcuenca son ejes viales principales y secundarios que comunica los<br />
distritos <strong>de</strong> Vilque Chico, Cojata y Ananea, y centros pob<strong>la</strong>dos <strong>de</strong>l entorno con <strong>la</strong> ciudad<br />
<strong>de</strong> Huancané.<br />
Nº<br />
Cuadro Nº 3.7 Unida<strong>de</strong>s hidrográficas <strong>de</strong> <strong>la</strong> cuenca <strong>de</strong>l <strong>río</strong> Suches (Perú)<br />
Unidad hidrográfica<br />
1 Subcuenca <strong>río</strong> Chueña Huata Jahuira 162.18<br />
2 Subcuenca <strong>río</strong> Caylloma 289.22<br />
3 Subcuenca <strong>río</strong> Trapiche 405.45<br />
4 Subcuenca Suches 303.90<br />
5 <strong>Cuenca</strong> <strong>río</strong> Suches (Pte Ramón Castil<strong>la</strong>) 846.80<br />
6 <strong>Cuenca</strong> <strong>río</strong> Suches (lugar Cuchaul<strong>la</strong>) 1,160.75<br />
<strong>Cuenca</strong> <strong>río</strong> Suches (Pte Escoma) 1,160.75<br />
Área <strong>de</strong> <strong>la</strong> cuenca (km 2 )<br />
Perú Bolivia Total (%)<br />
MINAG-ANA-DCPRH-AGUAS SUPERFICIALES Pág.38<br />
-<br />
-<br />
-<br />
-<br />
209.69<br />
1,061.32<br />
1,769.98<br />
162.18<br />
289.22<br />
405.45<br />
303.90<br />
1,056.49<br />
2,222.07<br />
2,930.73<br />
5.53<br />
9.87<br />
13.83<br />
10.37<br />
36.05<br />
75.82<br />
Nº <strong>de</strong> or<strong>de</strong>n<br />
<strong>de</strong>l <strong>río</strong><br />
4<br />
4<br />
4<br />
5<br />
5<br />
5<br />
5
<strong>Estudio</strong> <strong>Hidrológico</strong> <strong>de</strong> <strong>la</strong>s <strong>Cuenca</strong>s Huancané y Suches 2010<br />
Mapa Nº 3.10 Unida<strong>de</strong>s hidrográficas (subcuencas) - <strong>Cuenca</strong> Suches<br />
MINAG-ANA-DCPRH-AGUAS SUPERFICIALES Pág.39
<strong>Estudio</strong> <strong>Hidrológico</strong> <strong>de</strong> <strong>la</strong>s <strong>Cuenca</strong>s Huancané y Suches 2010<br />
Figura Nº 3.2 Esquema fluvial <strong>de</strong> <strong>la</strong> cuenca <strong>de</strong>l <strong>río</strong> Suches<br />
Trapiche<br />
Río Caylloma<br />
Río Chueña Huata Jahuira<br />
Cojata<br />
Lugar Cuchaul<strong>la</strong><br />
Lago Titicaca<br />
Río Suches Río Trapiche<br />
Río Suches<br />
Río Suches<br />
Río Suches<br />
Río Japollo<br />
Río Raya<br />
Escoma<br />
Río Suches<br />
Río<br />
Pob<strong>la</strong>ción<br />
MINAG-ANA-DCPRH-AGUAS SUPERFICIALES Pág.40<br />
Laguna<br />
Suches
<strong>Estudio</strong> <strong>Hidrológico</strong> <strong>de</strong> <strong>la</strong>s <strong>Cuenca</strong>s Huancané y Suches 2010<br />
3.5 GEOMORFOLOGÍA<br />
3.5.1 Generalida<strong>de</strong>s<br />
La geomorfología es <strong>la</strong> rama <strong>de</strong> <strong>la</strong> geografía física que estudia <strong>de</strong> manera <strong>de</strong>scriptiva y<br />
explicativa el relieve <strong>de</strong> <strong>la</strong> Tierra, el cual es el resultado <strong>de</strong> un ba<strong>la</strong>nce dinámico - que<br />
evoluciona en el tiempo - entre procesos constructivos y <strong>de</strong>structivos, dinámica que se<br />
conoce <strong>de</strong> manera genérica como ciclo geomorfológico.<br />
Morfología <strong>de</strong> <strong>la</strong> cuenca.- La morfología <strong>de</strong> una cuenca queda <strong>de</strong>finida por su forma,<br />
relieve y drenaje, para lo cual se han establecido una serie <strong>de</strong> parámetros, que a través <strong>de</strong><br />
ecuaciones matemáticas, sirven <strong>de</strong> referencia para <strong>la</strong> c<strong>la</strong>sificación y comparación <strong>de</strong> <strong>la</strong>s<br />
cuencas. Para un mejor enfoque sobre el estudio <strong>de</strong> <strong>la</strong>s cuencas se establece los parámetros<br />
<strong>de</strong> forma, parámetros <strong>de</strong> relieve y parámetros <strong>de</strong> <strong>la</strong> red hidrográfica, generalmente.<br />
Las características físicas <strong>de</strong>sempeñan un papel esencial en <strong>la</strong> respuesta hidrológica <strong>de</strong> una<br />
cuenca hidrográfica. Recíprocamente, el carácter hidrológico <strong>de</strong> <strong>la</strong> misma contribuye<br />
consi<strong>de</strong>rablemente a formar sus características físicas. Entonces, esta interre<strong>la</strong>ción <strong>de</strong>bería<br />
suministrar <strong>la</strong> base para pre<strong>de</strong>cir cuantitativamente <strong>la</strong> respuesta hidrológica, a partir <strong>de</strong><br />
aquellos parámetros físicos que son fáciles <strong>de</strong> medir.<br />
3.5.2 Descripción geomorfológica <strong>de</strong> <strong>la</strong> cuenca<br />
<strong>Cuenca</strong> Huancané<br />
La geomorfología <strong>de</strong> <strong>la</strong> cuenca <strong>de</strong>l <strong>río</strong> Huancané, son cinco (5) características diferentes<br />
(Cuadro Nº 3.8), que a continuación se <strong>de</strong>scribe en forma breve cada una <strong>de</strong> el<strong>la</strong>s:<br />
P<strong>la</strong>nicie–Altip<strong>la</strong>nicie (A-a).- es <strong>la</strong> región <strong>de</strong> <strong>la</strong> sierra altoandina, y se localiza en<br />
diferentes zonas <strong>de</strong> <strong>la</strong> parte baja y media <strong>de</strong> <strong>la</strong> cuenca <strong>de</strong>l <strong>río</strong> Huancané, abarca un<br />
superficie total <strong>de</strong> 313.40 km 2 (8.63%). En esta zona <strong>la</strong> pendiente <strong>de</strong> <strong>la</strong> cuenca es<br />
baja.<br />
P<strong>la</strong>nicie Ondu<strong>la</strong>da a Disectada–Altip<strong>la</strong>nicie Disectada (Ad-c).- se localiza en <strong>la</strong><br />
parte alta <strong>de</strong> <strong>la</strong> subcuenca Muñani, abarcando un área <strong>de</strong> 24.41 km 2 (0.67%). En<br />
esta zona <strong>la</strong> pendiente <strong>de</strong> <strong>la</strong> cuenca es alta.<br />
P<strong>la</strong>nicie Ondu<strong>la</strong>da a Disectada–Altip<strong>la</strong>nicie Ondu<strong>la</strong>da (Ao-b).- esta característica<br />
geomorfológica se localiza en <strong>la</strong> parte baja <strong>de</strong> <strong>la</strong> cuenca, abarca una superficie <strong>de</strong><br />
24.0 km 2 (0.66%). La pendiente <strong>de</strong> <strong>la</strong> cuenca en esta zona es mo<strong>de</strong>rada.<br />
Colina y Montaña–Vertiente Montañosa y Colina Mo<strong>de</strong>radamente Empinada<br />
(Vs1-d).- es <strong>la</strong> segunda característica geomorfológica que ocupa mayor área <strong>de</strong><br />
drenaje, localizada en toda parte <strong>de</strong> <strong>la</strong> cuenca y abarca una superficie <strong>de</strong> 795.13<br />
km 2 (21.90%). En esta zona <strong>la</strong> pendiente <strong>de</strong> <strong>la</strong> cuenca es variable <strong>de</strong> baja a alta.<br />
Colina y Montaña–Vertiente Montañosa y Colina Empinada a Escarpada (Vs1-e).-<br />
es <strong>la</strong> primera característica geomorfológica <strong>de</strong> <strong>la</strong> cuenca que ocupa mayor área y<br />
abarca una superficie <strong>de</strong> 2451.49 km 2 (67.51%) y localizada en toda <strong>la</strong> cuenca<br />
Huancané. En esta zona <strong>la</strong> pendiente <strong>de</strong> <strong>la</strong> cuenca es alta.<br />
Lagunas.- en <strong>la</strong> cuenca existen áreas pequeñas ocupadas por <strong>la</strong>gunas naturales, que<br />
abarca una superficie <strong>de</strong> 22.76 km 2 y representa 0.63% <strong>de</strong>l total <strong>de</strong> <strong>la</strong> cuenca<br />
Huancané.<br />
MINAG-ANA-DCPRH-AGUAS SUPERFICIALES Pág.41
<strong>Estudio</strong> <strong>Hidrológico</strong> <strong>de</strong> <strong>la</strong>s <strong>Cuenca</strong>s Huancané y Suches 2010<br />
Mapa Nº 3.11 Mapa geomorfológico <strong>de</strong> <strong>la</strong> cuenca <strong>de</strong>l <strong>río</strong> Huancané<br />
MINAG-ANA-DCPRH-AGUAS SUPERFICIALES Pág.42
<strong>Estudio</strong> <strong>Hidrológico</strong> <strong>de</strong> <strong>la</strong>s <strong>Cuenca</strong>s Huancané y Suches 2010<br />
Cuadro Nº 3.8 Características geomorfológicas <strong>de</strong> <strong>la</strong> cuenca <strong>de</strong>l <strong>río</strong> Huancané<br />
Símbolo Región Descripción<br />
(km2) (%)<br />
Lagunas - Lagunas 22.76 0.63<br />
A-a Sierra - Zona Altoandina P<strong>la</strong>nicie - Altip<strong>la</strong>nicie 313.40 8.63<br />
Ad-c Sierra - Zona Altoandina P<strong>la</strong>nicie Ondu<strong>la</strong>da a Disectada - Altip<strong>la</strong>nicie disectada. 24.41 0.67<br />
Ao-b Sierra - Zona Altoandina P<strong>la</strong>nicie Ondu<strong>la</strong>da a Disectada - Altip<strong>la</strong>nicie ondu<strong>la</strong>da. 24.00 0.66<br />
Vs1-d Sierra - Zona Altoandina Colina y Montaña - Vertiente montaÑosa y colina mo<strong>de</strong>radamente empinada. 795.13 21.90<br />
Vs1-e Sierra - Zona Altoandina Colina y Montaña - Vertiente montaÑosa y colina empinada a escarpada. 2451.49 67.51<br />
Total<br />
3631.19 100.00<br />
<strong>Cuenca</strong> Suches (Perú)<br />
La geomorfología <strong>de</strong> <strong>la</strong> cuenca <strong>de</strong>l <strong>río</strong> Suches, son cinco (5) características diferentes<br />
(Cuadro Nº 3.9), que a continuación se <strong>de</strong>scribe en forma breve cada una <strong>de</strong> el<strong>la</strong>s:<br />
P<strong>la</strong>nicie–Altip<strong>la</strong>nicie (A-a).- es <strong>la</strong> región <strong>de</strong> <strong>la</strong> sierra altoandina, y se localiza en <strong>la</strong><br />
parte media <strong>de</strong> <strong>la</strong> cuenca <strong>de</strong>l <strong>río</strong> Suches, abarca una superficie total <strong>de</strong> 146.17 km 2<br />
(12.59%). En esta zona <strong>la</strong> pendiente <strong>de</strong> <strong>la</strong> cuenca es baja.<br />
P<strong>la</strong>nicie Ondu<strong>la</strong>da a Disectada-Altip<strong>la</strong>nicie Disectada (Ad-c).- se localiza en <strong>la</strong><br />
parte media alta <strong>de</strong> <strong>la</strong> subcuenca Trapiche y zona baja <strong>de</strong> <strong>la</strong> subcuenca Chueña Huata<br />
Jahuira, abarcando un área <strong>de</strong> 58.50 km 2 (5.04%). La pendiente <strong>de</strong> <strong>la</strong> cuenca es baja<br />
y alta.<br />
P<strong>la</strong>nicie Ondu<strong>la</strong>da a Disectada–Altip<strong>la</strong>nicie Ondu<strong>la</strong>da (Ao-b).- esta característica<br />
geomorfológica se localiza en <strong>la</strong> parte media y media alta <strong>de</strong> <strong>la</strong> cuenca <strong>de</strong>l <strong>río</strong> Suches,<br />
abarca una superficie <strong>de</strong> 100.98 km 2 (8.70%). La pendiente <strong>de</strong> <strong>la</strong> cuenca en esta zona<br />
es mo<strong>de</strong>rada.<br />
Colina y Montaña–Vertiente Montañosa y Colina Mo<strong>de</strong>radamente Empinada (Vs1d).-<br />
es <strong>la</strong> primera característica geomorfológica que ocupa mayor área <strong>de</strong> drenaje,<br />
localizada en <strong>la</strong> zona baja, media y alta <strong>de</strong> <strong>la</strong> cuenca, y abarca una superficie <strong>de</strong><br />
422.86 km 2 (36.43%). En esta zona <strong>la</strong> pendiente es variable <strong>de</strong> baja a alta.<br />
Colina y Montaña–Vertiente Montañosa y Colina Empinada a Escarpada (Vs1-e).-<br />
es <strong>la</strong> segunda característica geomorfológica <strong>de</strong> <strong>la</strong> cuenca que ocupa mayor área y<br />
abarca una superficie <strong>de</strong> 390.51 km 2 (33.64%), ésta característica geomorfológica se<br />
localiza en <strong>la</strong> zona alta en toda <strong>la</strong> cuenca Suches. La pendiente <strong>de</strong> <strong>la</strong> cuenca en esta<br />
zona es mayor.<br />
Lagunas.- en <strong>la</strong> cuenca existen áreas ocupadas por <strong>la</strong>gunas naturales, que abarca una<br />
superficie <strong>de</strong> 18.34 km 2 y representa 1.58% <strong>de</strong>l total <strong>de</strong> <strong>la</strong> cuenca Suches.<br />
Nevados.- en <strong>la</strong> cuenca existen áreas ocupadas por nevados, que abarca una<br />
superficie <strong>de</strong> 23.39 km 2 y representa 2.02% <strong>de</strong>l total <strong>de</strong> <strong>la</strong> cuenca Suches.<br />
Cuadro Nº 3.9 Características geomorfológicas <strong>de</strong> <strong>la</strong> cuenca <strong>de</strong>l <strong>río</strong> Huancané<br />
Símbolo Región Descripción<br />
MINAG-ANA-DCPRH-AGUAS SUPERFICIALES Pág.43<br />
Área<br />
(km2) (%)<br />
A-a Sierra - Zona Altoandina P<strong>la</strong>nicie - Altip<strong>la</strong>nicie 146.17 12.59<br />
Ad-c Sierra - Zona Altoandina P<strong>la</strong>nicie Ondu<strong>la</strong>da a Disectada - Altip<strong>la</strong>nicie disectada. 58.50 5.04<br />
Ao-b Sierra - Zona Altoandina P<strong>la</strong>nicie Ondu<strong>la</strong>da a Disectada - Altip<strong>la</strong>nicie ondu<strong>la</strong>da. 100.98 8.70<br />
Lagunas - Lagunas 18.34 1.58<br />
Nv - Nevados 23.39 2.02<br />
Vs1-d Sierra - Zona Altoandina Colina y Montaña - Vertiente montaÑosa y colina mo<strong>de</strong>radamente empinada. 422.86 36.43<br />
Vs1-e Sierra - Zona Altoandina Colina y Montaña - Vertiente montaÑosa y colina empinada a escarpada. 390.51 33.64<br />
Total<br />
Área<br />
1160.75 100.00
<strong>Estudio</strong> <strong>Hidrológico</strong> <strong>de</strong> <strong>la</strong>s <strong>Cuenca</strong>s Huancané y Suches 2010<br />
Mapa Nº 3.12 Mapa geomorfológico <strong>de</strong> <strong>la</strong> cuenca <strong>de</strong>l <strong>río</strong> Suches (Perú)<br />
MINAG-ANA-DCPRH-AGUAS SUPERFICIALES Pág.44
<strong>Estudio</strong> <strong>Hidrológico</strong> <strong>de</strong> <strong>la</strong>s <strong>Cuenca</strong>s Huancané y Suches 2010<br />
3.5.3 Caracterización geomorfológica <strong>de</strong> <strong>la</strong> cuenca<br />
Los parámetros generales para <strong>la</strong> caracterización geomorfológica <strong>de</strong> una cuenca<br />
hidrográfica, son los parámetros <strong>de</strong> forma, relieve y <strong>de</strong> <strong>la</strong> red hidrográfica.<br />
3.5.3.1 Parámetros <strong>de</strong> forma <strong>de</strong> <strong>la</strong> cuenca<br />
Dada <strong>la</strong> importancia <strong>de</strong> <strong>la</strong> configuración <strong>de</strong> <strong>la</strong>s cuencas, se trata <strong>de</strong> cuantificar estas<br />
características por medio <strong>de</strong> índices o coeficientes, los cuales re<strong>la</strong>cionan el movimiento <strong>de</strong>l<br />
agua y <strong>la</strong>s respuestas <strong>de</strong> <strong>la</strong> cuenca a tal movimiento (hidrograma).<br />
Existen varios índices para <strong>la</strong> <strong>de</strong>terminación <strong>de</strong> <strong>la</strong> forma <strong>de</strong> una cuenca, re<strong>la</strong>cionando sus<br />
parámetros y <strong>la</strong>s características <strong>de</strong> <strong>la</strong> red <strong>de</strong> drenaje <strong>de</strong> <strong>la</strong> misma.<br />
Los principales factores <strong>de</strong> forma <strong>de</strong> <strong>la</strong> cuenca son:<br />
- Área <strong>de</strong> <strong>la</strong> cuenca (A).<br />
- Perímetro <strong>de</strong> <strong>la</strong> cuenca (P).<br />
- Longitud <strong>de</strong>l <strong>río</strong> principal (L).<br />
- Ancho promedio <strong>de</strong> <strong>la</strong> cuenca (Ap).<br />
- Coeficiente <strong>de</strong> compacidad o índice <strong>de</strong> Gravelius (Kc).<br />
- Factor <strong>de</strong> forma (Ff).<br />
- Rectángulo equivalente (RE).<br />
- Radio <strong>de</strong> circu<strong>la</strong>ridad (Rc).<br />
A.- Área <strong>de</strong> <strong>la</strong> cuenca (A)<br />
Es <strong>la</strong> superficie <strong>de</strong> <strong>la</strong> cuenca comprendida <strong>de</strong>ntro <strong>de</strong> <strong>la</strong> curva cerrada <strong>de</strong> divortium aquarum.<br />
La magnitud <strong>de</strong>l área se obtiene mediante el p<strong>la</strong>nimetrazo <strong>de</strong> <strong>la</strong> proyección <strong>de</strong>l área <strong>de</strong> <strong>la</strong><br />
cuenca sobre un p<strong>la</strong>no horizontal.<br />
Dependiendo <strong>de</strong> <strong>la</strong> ubicación <strong>de</strong> <strong>la</strong> cuenca, su tamaño influye en mayor o menor grado en<br />
el aporte <strong>de</strong> escorrentía, tanto directa como <strong>de</strong> flujo <strong>de</strong> base o flujo sostenido.<br />
Su importancia radica en <strong>la</strong>s siguientes razones:<br />
- Es un valor que se utilizará para muchos cálculos en varios mo<strong>de</strong>los<br />
hidrológicos.<br />
- Para una misma región hidrológica o regiones simi<strong>la</strong>res, se pue<strong>de</strong> <strong>de</strong>cir que a<br />
mayor área mayor caudal o viceversa.<br />
- Bajo <strong>la</strong>s mismas condiciones hidrológicas, cuencas con áreas mayores producen<br />
hidrógrafas con variaciones en el tiempo más suaves y más l<strong>la</strong>nas. Sin embargo,<br />
en cuencas gran<strong>de</strong>s, se pue<strong>de</strong>n dar hidrógrafas picudas cuando <strong>la</strong> precipitación<br />
fue intensa y en <strong>la</strong>s cercanías, aguas arriba, <strong>de</strong> <strong>la</strong> estación <strong>de</strong> aforo.<br />
- El crecimiento <strong>de</strong>l área actúa como un factor <strong>de</strong> compensación <strong>de</strong> modo que es<br />
más común <strong>de</strong>tectar crecientes instantáneas y <strong>de</strong> respuesta inmediata en cuencas<br />
pequeñas que en <strong>la</strong>s gran<strong>de</strong>s cuencas.<br />
MINAG-ANA-DCPRH-AGUAS SUPERFICIALES Pág.45
<strong>Estudio</strong> <strong>Hidrológico</strong> <strong>de</strong> <strong>la</strong>s <strong>Cuenca</strong>s Huancané y Suches 2010<br />
La superficie total <strong>de</strong> <strong>la</strong>s cuencas <strong>de</strong> los <strong>río</strong>s Huancané y Suches (Perú-Bolivia) son<br />
3631.19 km 2 y 2930.73 km 2 . El área <strong>de</strong> <strong>la</strong>s unida<strong>de</strong>s hidrográficas <strong>de</strong> nivel cinco<br />
(subcuencas) se presentan en los Cuadros Nº 3.10 y 3.11.<br />
B.- Perímetro <strong>de</strong> <strong>la</strong> cuenca (P)<br />
Es <strong>la</strong> longitud <strong>de</strong> <strong>la</strong> línea <strong>de</strong> divortium aquarum. Se mi<strong>de</strong> mediante el curvímetro o<br />
directamente se obtiene <strong>de</strong>l Software en sistemas digitalizados.<br />
El perímetro <strong>de</strong> <strong>la</strong>s cuencas <strong>de</strong> los <strong>río</strong>s Huancané y Suches son 421.97 km y 384.57 km. El<br />
perímetro <strong>de</strong> <strong>la</strong>s unida<strong>de</strong>s hidrográficas <strong>de</strong> nivel cinco (subcuencas) se presentan en los<br />
Cuadros Nº 3.10 y 3.11.<br />
C.- Longitud <strong>de</strong>l <strong>río</strong> principal (L)<br />
Es <strong>la</strong> longitud mayor <strong>de</strong> recorrido que realiza el <strong>río</strong>, <strong>de</strong>s<strong>de</strong> <strong>la</strong> cabecera <strong>de</strong> <strong>la</strong> cuenca,<br />
siguiendo todos los cambios <strong>de</strong> dirección o sinuosida<strong>de</strong>s, hasta un punto fijo <strong>de</strong> interés,<br />
pue<strong>de</strong> ser una estación <strong>de</strong> aforo o <strong>de</strong>sembocadura, expresado en unida<strong>de</strong>s <strong>de</strong> longitud.<br />
La longitud <strong>de</strong>l <strong>río</strong> principal <strong>de</strong> <strong>la</strong>s cuencas <strong>de</strong> los <strong>río</strong>s Huancané y Suches son 142.05 km y<br />
188.00 km. La longitud <strong>de</strong>l <strong>río</strong> principal <strong>de</strong> <strong>la</strong>s subunida<strong>de</strong>s hidrográficas <strong>de</strong> nivel cinco<br />
(subcuencas) se presentan en los Cuadros Nº 3.10 y 3.11.<br />
D.- Ancho promedio <strong>de</strong> <strong>la</strong> cuenca (Ap)<br />
Re<strong>la</strong>ción entre el área <strong>de</strong> <strong>la</strong> cuenca y <strong>la</strong> longitud <strong>de</strong>l cauce principal, cuya expresión es <strong>la</strong><br />
siguiente:<br />
A<br />
AP <br />
L<br />
Don<strong>de</strong>:<br />
A P = Ancho promedio <strong>de</strong> <strong>la</strong> cuenca (km).<br />
A = Área <strong>de</strong> <strong>la</strong> cuenca (km 2 ).<br />
L = Longitud <strong>de</strong>l cauce principal (km).<br />
El ancho promedio <strong>de</strong> <strong>la</strong>s cuencas <strong>de</strong> los <strong>río</strong>s Huancané y Suches son 25.56 km y 15.59 km.<br />
El ancho promedio <strong>de</strong> <strong>la</strong>s unida<strong>de</strong>s hidrográficas <strong>de</strong> nivel cinco (subcuencas) se presentan<br />
en los Cuadros Nº 3.10 y 3.11.<br />
E.- Coeficiente <strong>de</strong> compacidad o índice <strong>de</strong> Gravelius (Kc)<br />
Parámetro adimensional que re<strong>la</strong>ciona el perímetro <strong>de</strong> <strong>la</strong> cuenca y el perímetro <strong>de</strong> un<br />
círculo <strong>de</strong> igual área que el <strong>de</strong> <strong>la</strong> cuenca. Este parámetro, al igual que el anterior, <strong>de</strong>scribe<br />
<strong>la</strong> geometría <strong>de</strong> <strong>la</strong> cuenca y está estrechamente re<strong>la</strong>cionado con el tiempo <strong>de</strong> concentración<br />
<strong>de</strong> <strong>de</strong>l sistema hidrológico.<br />
Las cuencas redon<strong>de</strong>adas tienen tiempos <strong>de</strong> concentración cortos con gastos pico muy<br />
fuerte y recesiones rápidas, mientras que <strong>la</strong>s a<strong>la</strong>rgadas tienen gastos pico más atenuado y<br />
recesiones más prolongadas.<br />
MINAG-ANA-DCPRH-AGUAS SUPERFICIALES Pág.46
<strong>Estudio</strong> <strong>Hidrológico</strong> <strong>de</strong> <strong>la</strong>s <strong>Cuenca</strong>s Huancané y Suches 2010<br />
<br />
Kc 0 . 282<br />
<br />
Don<strong>de</strong>:<br />
P = Perímetro <strong>de</strong> <strong>la</strong> cuenca (km).<br />
A = Área <strong>de</strong> <strong>la</strong> cuenca (km 2 ).<br />
P<br />
A<br />
<br />
<br />
<br />
De <strong>la</strong> expresión se <strong>de</strong>spren<strong>de</strong> que Kc siempre es mayor o igual a 1, y se incrementa con <strong>la</strong><br />
irregu<strong>la</strong>ridad <strong>de</strong> <strong>la</strong> forma <strong>de</strong> <strong>la</strong> cuenca. Este factor adimensional constituye un índice<br />
indicativo <strong>de</strong> <strong>la</strong> ten<strong>de</strong>ncia <strong>de</strong> avenida en una cuenca.<br />
Una cuenca <strong>de</strong> forma circu<strong>la</strong>r posee el coeficiente mínimo igual a 1 y tiene mayor<br />
ten<strong>de</strong>ncia a <strong>la</strong>s crecientes en <strong>la</strong> medida que el valor <strong>de</strong> K C se aproxima a <strong>la</strong> unidad;<br />
cuando se aleja <strong>de</strong> <strong>la</strong> unidad, presenta una forma más irregu<strong>la</strong>r con re<strong>la</strong>ción al círculo.<br />
Cuando el Kc = 1: tiempo <strong>de</strong> concentración menor, cuenca circu<strong>la</strong>r, mayor ten<strong>de</strong>ncia a<br />
crecientes y Kc = 2: tiempo <strong>de</strong> concentración mayor, cuenca <strong>de</strong> forma a<strong>la</strong>rgada, menor<br />
ten<strong>de</strong>ncia a crecientes.<br />
El coeficiente <strong>de</strong> compacidad <strong>de</strong> <strong>la</strong>s cuencas <strong>de</strong> los <strong>río</strong>s Huancané y Suches son 1.97 y 2.00,<br />
estos valores son más cercano a 2 que a 1, indica que <strong>la</strong>s cuencas son <strong>de</strong> forma a<strong>la</strong>rgada<br />
<strong>de</strong>biéndose estar menos expuesta a <strong>la</strong>s crecientes que una cuenca <strong>de</strong> forma redon<strong>de</strong>ada.<br />
Las unida<strong>de</strong>s hidrográficas <strong>de</strong> nivel cinco <strong>de</strong> <strong>la</strong>s cuencas Huancané y Suches, que<br />
presentan valores <strong>de</strong>l coeficiente <strong>de</strong> compacidad entre 1.20-1.49, están más cercanos a <strong>la</strong><br />
unidad, lo que indica que <strong>la</strong>s subcuencas son <strong>de</strong> forma circu<strong>la</strong>r <strong>de</strong>biéndose estar más<br />
expuesta a <strong>la</strong>s crecientes que una cuenca <strong>de</strong> forma a<strong>la</strong>rgada. Simi<strong>la</strong>rmente <strong>la</strong>s unida<strong>de</strong>s<br />
hidrográficas <strong>de</strong> nivel cinco con coeficientes <strong>de</strong> compacidad entre 1.52-1.90, que están más<br />
cercanos a 2, indica que <strong>la</strong>s subcuencas son <strong>de</strong> forma irregu<strong>la</strong>r y a<strong>la</strong>rgada, <strong>de</strong>biéndose estar<br />
mo<strong>de</strong>radamente y menos expuesta a <strong>la</strong>s crecientes. Ver Cuadros Nº 3.10 y 3.11.<br />
F.- Factor <strong>de</strong> forma (Ff)<br />
Es <strong>la</strong> re<strong>la</strong>ción entre el área (A) <strong>de</strong> <strong>la</strong> cuenca y el cuadrado <strong>de</strong> <strong>la</strong> longitud máximo recorrido<br />
<strong>de</strong>l cauce (L). Este parámetro mi<strong>de</strong> <strong>la</strong> ten<strong>de</strong>ncia <strong>de</strong> <strong>la</strong> cuenca hacia <strong>la</strong>s crecidas, rápidas y<br />
muy intensas a lentas y sostenidas, según que su factor <strong>de</strong> forma tienda hacia valores<br />
extremos gran<strong>de</strong>s o pequeños, respectivamente. Es un parámetro adimensional que <strong>de</strong>nota<br />
<strong>la</strong> forma redon<strong>de</strong>ada o a<strong>la</strong>rgada <strong>de</strong> <strong>la</strong> cuenca.<br />
A<br />
Ff 2<br />
L<br />
Don<strong>de</strong>:<br />
A = Área <strong>de</strong> <strong>la</strong> cuenca (km 2 ).<br />
L = Longitud <strong>de</strong>l cauce principal (km).<br />
MINAG-ANA-DCPRH-AGUAS SUPERFICIALES Pág.47
<strong>Estudio</strong> <strong>Hidrológico</strong> <strong>de</strong> <strong>la</strong>s <strong>Cuenca</strong>s Huancané y Suches 2010<br />
Para un círculo Ff = 0.79, para un cuadrado con <strong>la</strong> salida en el punto medio <strong>de</strong> uno <strong>de</strong> los<br />
<strong>la</strong>dos Ff = 1 y con <strong>la</strong> salida en una esquina Ff = 0.5 (Mintegui et al, 1993).<br />
El Factor <strong>de</strong> Forma <strong>de</strong>terminado para <strong>la</strong>s cuencas <strong>de</strong> los <strong>río</strong>s Huancané y Suches son 0.18 y<br />
0.08, lo cual explica que <strong>la</strong>s cuencas son <strong>de</strong> forma a<strong>la</strong>rgada, y estaría menos sujeta a<br />
crecientes continuas. Sin embargo en <strong>la</strong>s subunida<strong>de</strong>s hidrográficas <strong>de</strong> nivel cinco varían<br />
<strong>de</strong> 0.10-0.47, igualmente <strong>la</strong>s subcuencas estarían menos expuesta a crecientes continuas.<br />
Ver Cuadros Nº 3.10 y 3.11.<br />
G.- Rectángulo equivalente (RE)<br />
Es <strong>la</strong> representación geométrica <strong>de</strong> una cuenca <strong>de</strong>finida como un rectángulo que tenga <strong>la</strong><br />
misma área <strong>de</strong> <strong>la</strong> cuenca. La longitud <strong>de</strong> sus <strong>la</strong>dos esta dado por:<br />
R E<br />
<br />
0 . 25<br />
P <br />
2<br />
P <br />
<br />
4 <br />
MINAG-ANA-DCPRH-AGUAS SUPERFICIALES Pág.48<br />
A<br />
Don<strong>de</strong>:<br />
L L = Longitud <strong>de</strong> sus <strong>la</strong>dos <strong>de</strong>l rectángulo (mayor y menor) en km.<br />
P = Perímetro <strong>de</strong> <strong>la</strong> cuenca (km).<br />
A = Área <strong>de</strong> <strong>la</strong> cuenca (km 2 ).<br />
La longitud mayor y menor <strong>de</strong> <strong>la</strong> cuenca <strong>de</strong>l <strong>río</strong> Huancané son 192.080 km y 18.905 km,<br />
para <strong>la</strong> cuenca <strong>de</strong>l <strong>río</strong> Suches son 175.595 km y 16.690 km. La longitud <strong>de</strong>l rectángulo<br />
equivalente <strong>de</strong> <strong>la</strong>s unida<strong>de</strong>s hidrográficas <strong>de</strong> nivel cinco se muestran en los Cuadros N°<br />
3.10 y 3.11.<br />
H.- Radio <strong>de</strong> circu<strong>la</strong>ridad (Rc)<br />
Re<strong>la</strong>ciona el área <strong>de</strong> <strong>la</strong> cuenca y <strong>la</strong> <strong>de</strong>l círculo que posee una circunferencia <strong>de</strong> longitud<br />
igual al perímetro <strong>de</strong> <strong>la</strong> cuenca. Su valor es uno (1) para una cuenca circu<strong>la</strong>r y 0.785 para<br />
una cuenca cuadrada.<br />
R C<br />
4A<br />
2<br />
P<br />
Don<strong>de</strong>:<br />
P = Perímetro <strong>de</strong> <strong>la</strong> cuenca (km).<br />
A = Área <strong>de</strong> <strong>la</strong> cuenca (km 2 ).<br />
Los valores <strong>de</strong>l radio <strong>de</strong> circu<strong>la</strong>ridad <strong>de</strong> <strong>la</strong>s cuencas Huancané y Suches son 0.26 y 0.25<br />
<strong>de</strong>notan que <strong>la</strong>s formas son a<strong>la</strong>rgadas, ya que los valores están por <strong>de</strong>bajo <strong>de</strong> 0.785. En<br />
forma simi<strong>la</strong>r <strong>la</strong>s unida<strong>de</strong>s hidrográficas <strong>de</strong> nivel cinco (subcuencas) tienen <strong>de</strong> forma<br />
a<strong>la</strong>rgada, que sus radios <strong>de</strong> circu<strong>la</strong>ridad varían <strong>de</strong> 0.28-0.70 y son menores a 0.785. Ver los<br />
Cuadros Nº 3.10 y 3.11.
<strong>Estudio</strong> <strong>Hidrológico</strong> <strong>de</strong> <strong>la</strong>s <strong>Cuenca</strong>s Huancané y Suches 2010<br />
3.5.3.2 Parámetros <strong>de</strong> relieve <strong>de</strong> <strong>la</strong> cuenca<br />
El relieve posee una inci<strong>de</strong>ncia más fuerte sobre <strong>la</strong> escorrentía que <strong>la</strong> forma, dado que a<br />
una mayor pendiente correspon<strong>de</strong>rá un menor tiempo <strong>de</strong> concentración <strong>de</strong> <strong>la</strong>s aguas en <strong>la</strong><br />
red <strong>de</strong> drenaje y afluentes al curso principal. Es así como a una mayor pendiente<br />
correspon<strong>de</strong>rá una menor duración <strong>de</strong> concentración <strong>de</strong> <strong>la</strong>s aguas <strong>de</strong> escorrentía en <strong>la</strong> red<br />
<strong>de</strong> drenaje y afluentes al curso principal.<br />
Para <strong>de</strong>scribir el relieve <strong>de</strong> una cuenca existen numerosos parámetros que han sido<br />
<strong>de</strong>sarrol<strong>la</strong>dos por varios autores; entre los más utilizados <strong>de</strong>stacan:<br />
- Curva hipsométrica.<br />
- Polígono <strong>de</strong> frecuencias <strong>de</strong> áreas parciales.<br />
- Altitud media <strong>de</strong> <strong>la</strong> cuenca (Hm).<br />
- Altitud <strong>de</strong> frecuencia media.<br />
- Altitud más frecuente.<br />
- Pendiente media <strong>de</strong> <strong>la</strong> cuenca.<br />
- Índice <strong>de</strong> pendiente <strong>de</strong> <strong>la</strong> cuenca (Ip).<br />
- Coeficiente <strong>de</strong> masividad (Cm).<br />
- Coeficiente orográfico (Co).<br />
- Coeficiente <strong>de</strong> torrencialidad (Ct).<br />
- Perfil altimétrico <strong>de</strong>l cauce principal y su pendiente promedio.<br />
A.- Curva hipsométrica<br />
Es utilizada para representar gráficamente cotas <strong>de</strong> terreno en función <strong>de</strong> <strong>la</strong>s superficies<br />
que encierran. Para su trazado se <strong>de</strong>be tener en cuenta que sobre <strong>la</strong> sección <strong>de</strong> control<br />
(altitud mínima <strong>de</strong> <strong>la</strong> cuenca), se tiene el cien por ciento <strong>de</strong> su superficie. Si se ubica en el<br />
punto más alto <strong>de</strong> <strong>la</strong> cuenca y se calcu<strong>la</strong> a partir <strong>de</strong> cada curva <strong>de</strong> nivel, <strong>la</strong>s áreas<br />
acumu<strong>la</strong>das por encima <strong>de</strong> el<strong>la</strong>s, se pue<strong>de</strong> construir <strong>la</strong> curva hipsométrica (Martínez et al,<br />
1996). En general, tanto <strong>la</strong>s alturas como <strong>la</strong>s superficies son <strong>de</strong>finidas en términos<br />
porcentuales.<br />
L<strong>la</strong>mada también Curva <strong>de</strong> Área – Elevación, representa gráficamente <strong>la</strong>s elevaciones <strong>de</strong>l<br />
terreno en función <strong>de</strong> <strong>la</strong>s superficies correspondientes.<br />
Se <strong>de</strong>fine como curva hipsométrica a <strong>la</strong> representación gráfica <strong>de</strong>l relieve medio <strong>de</strong> <strong>la</strong><br />
cuenca, construida llevando en el eje <strong>de</strong> <strong>la</strong>s abscisas, longitu<strong>de</strong>s proporcionales a <strong>la</strong>s<br />
superficies proyectadas en <strong>la</strong> cuenca, en km 2 o en porcentaje, comprendidas entre curvas<br />
<strong>de</strong> nivel consecutivas hasta alcanzar <strong>la</strong> superficie total, llevando al eje <strong>de</strong> <strong>la</strong>s or<strong>de</strong>nadas <strong>la</strong><br />
cota <strong>de</strong> <strong>la</strong>s curvas <strong>de</strong> nivel consi<strong>de</strong>radas.<br />
Las curvas hipsométricas también son asociadas con <strong>la</strong>s eda<strong>de</strong>s <strong>de</strong> los <strong>río</strong>s <strong>de</strong> <strong>la</strong>s<br />
respectivas cuencas.<br />
Las curvas hipsométricas para <strong>la</strong>s cuencas <strong>de</strong> los <strong>río</strong>s Huancané y Suches, se muestran en<br />
<strong>la</strong>s Figuras Nº 3.3 y 3.4.<br />
MINAG-ANA-DCPRH-AGUAS SUPERFICIALES Pág.49
<strong>Estudio</strong> <strong>Hidrológico</strong> <strong>de</strong> <strong>la</strong>s <strong>Cuenca</strong>s Huancané y Suches 2010<br />
B.- Polígono <strong>de</strong> frecuencias <strong>de</strong> áreas parciales<br />
El polígono <strong>de</strong> frecuencias es un gráfico <strong>de</strong> barras <strong>de</strong> <strong>la</strong>s áreas parciales (%) con respecto<br />
al intervalo <strong>de</strong> altitu<strong>de</strong>s (msnm) que <strong>la</strong>s encierran. Representa <strong>la</strong> variación <strong>de</strong> <strong>la</strong>s áreas<br />
parciales comprendidas entre <strong>de</strong>terminadas curvas <strong>de</strong> nivel consecutivas.<br />
Del polígono <strong>de</strong> frecuencias se pue<strong>de</strong> obtener valores representativos como: <strong>la</strong> altitud más<br />
frecuente, que es el polígono <strong>de</strong> mayor porcentaje o frecuencia <strong>de</strong> áreas parciales.<br />
La distribución gráfica <strong>de</strong>l porcentaje <strong>de</strong> áreas parciales ocupadas por diferentes rangos <strong>de</strong><br />
altitud para <strong>la</strong>s cuencas <strong>de</strong> los <strong>río</strong>s Huancané y Suches, se distingue en <strong>la</strong>s Figuras Nº 3.3 y<br />
3.4.<br />
La cuenca <strong>de</strong>l <strong>río</strong> Huancané presenta una ten<strong>de</strong>ncia <strong>de</strong> concentración <strong>de</strong> superficie en <strong>la</strong><br />
parte baja y media <strong>de</strong> <strong>la</strong> cuenca. En forma simi<strong>la</strong>r <strong>la</strong> cuenca <strong>de</strong>l <strong>río</strong> Suches.<br />
Altitud (msnm)<br />
Altitud (msnm)<br />
5250<br />
5100<br />
4950<br />
4800<br />
4650<br />
4500<br />
4350<br />
4200<br />
4050<br />
3900<br />
3750<br />
4600<br />
4450<br />
4300<br />
4150<br />
4000<br />
3850<br />
3700<br />
Figura Nº 3.3 Curva hipsométrica y polígono <strong>de</strong> frecuencias – <strong>Cuenca</strong> Huancané<br />
Curva hipsométrica - <strong>Cuenca</strong> <strong>río</strong> Huancané<br />
Altitud <strong>de</strong> frecuencia media:<br />
4147.0 msnm<br />
-10 0 10 20 30 40 50 60 70 80 90 100 110<br />
Porcentaje <strong>de</strong> áreas que queda sobre <strong>la</strong> altitud (%)<br />
Curva hipsométrica - Subcuenca Bajo Huancané<br />
Altitud <strong>de</strong> frecuencia media:<br />
3879.0 msnm<br />
-10 0 10 20 30 40 50 60 70 80 90 100 110<br />
Porcentaje <strong>de</strong> áreas que queda sobre <strong>la</strong> altitud (%)<br />
3.10<br />
3.00<br />
3.04<br />
3.32<br />
3.61<br />
3.99<br />
4.57<br />
4.82<br />
5.17<br />
5.57<br />
6.22<br />
6.66<br />
7.03<br />
3.46<br />
0.00<br />
0.01<br />
0.07<br />
0.23<br />
0.66<br />
1.61<br />
2.52<br />
3.10<br />
3.37<br />
MINAG-ANA-DCPRH-AGUAS SUPERFICIALES Pág.50<br />
Altitud (msnm)<br />
Altitud (msnm)<br />
5000-5050<br />
4900-4950<br />
4800-4850<br />
4700-4750<br />
4600-4650<br />
4500-4550<br />
4400-4450<br />
4300-4350<br />
4200-4250<br />
4100-4150<br />
4000-4050<br />
3900-3950<br />
3806-3850<br />
4500-4550<br />
4450-4500<br />
4400-4450<br />
4350-4400<br />
4300-4350<br />
4250-4300<br />
4200-4250<br />
4150-4200<br />
4100-4150<br />
4050-4100<br />
4000-4050<br />
3950-4000<br />
3900-3950<br />
3850-3900<br />
3806-3850<br />
Polígono <strong>de</strong> frecuencias <strong>de</strong> áreas parciales - <strong>Cuenca</strong> <strong>río</strong><br />
Huancané<br />
4.55<br />
8.85<br />
11.48<br />
0 2 4 6 8 10 12 14<br />
0.11<br />
0.34<br />
0.69<br />
0.99<br />
1.13<br />
1.29<br />
2.05<br />
3.50<br />
5.32<br />
6.36<br />
6.64<br />
7.80<br />
8.27<br />
Porcentaje <strong>de</strong> áreas parciales (%)<br />
Polígono <strong>de</strong> frecuencias <strong>de</strong> áreas parciales - Subcuenca Bajo<br />
Huancané<br />
13.00<br />
42.49<br />
0 10 20 30 40 50<br />
Porcentaje <strong>de</strong> áreas parciales (%)
Altitud (msnm)<br />
Altitud (msnm)<br />
Altitud (msnm)<br />
Altitud (msnm)<br />
<strong>Estudio</strong> <strong>Hidrológico</strong> <strong>de</strong> <strong>la</strong>s <strong>Cuenca</strong>s Huancané y Suches 2010<br />
4900<br />
4750<br />
4600<br />
4450<br />
4300<br />
4150<br />
4000<br />
3850<br />
3700<br />
4400<br />
4300<br />
4200<br />
4100<br />
4000<br />
3900<br />
3800<br />
3700<br />
5100<br />
4900<br />
4700<br />
4500<br />
4300<br />
4100<br />
3900<br />
3700<br />
4600<br />
4500<br />
4400<br />
4300<br />
4200<br />
4100<br />
4000<br />
3900<br />
3800<br />
3700<br />
Curva hipsométrica - Subcuenca <strong>río</strong> L<strong>la</strong>che<br />
Altitud <strong>de</strong> frecuencia media:<br />
4014.0 msnm<br />
-10 0 10 20 30 40 50 60 70 80 90 100 110<br />
Porcentaje <strong>de</strong> áreas que queda sobre <strong>la</strong> altitud (%)<br />
Curva hipsométrica - Subcuenca Medio Bajo Huancané<br />
Altitud <strong>de</strong> frecuencia media:<br />
3970.0 msnm<br />
-10 0 10 20 30 40 50 60 70 80 90 100 110<br />
Porcentaje <strong>de</strong> áreas que queda sobre <strong>la</strong> altitud (%)<br />
Curva hipsométrica - Subcuenca <strong>río</strong> Tuyto<br />
Altitud <strong>de</strong> frecuencia media:<br />
4087.0 msnm<br />
-10 0 10 20 30 40 50 60 70 80 90 100 110<br />
Porcentaje <strong>de</strong> áreas que queda sobre <strong>la</strong> altitud (%)<br />
Curva hipsométrica - Subcuenca Medio Huancané<br />
Altitud <strong>de</strong> frecuencia media:<br />
4003.0 msnm<br />
-10 0 10 20 30 40 50 60 70 80 90 100 110<br />
Porcentaje <strong>de</strong> áreas que queda sobre <strong>la</strong> altitud (%)<br />
4700-4750<br />
4650-4700<br />
4600-4650<br />
4550-4600<br />
4500-4550<br />
4450-4500<br />
4400-4450<br />
4350-4400<br />
4300-4350<br />
4250-4300<br />
4200-4250<br />
4150-4200<br />
4100-4150<br />
4050-4100<br />
4000-4050<br />
3950-4000<br />
3900-3950<br />
3850-3900<br />
3835-3850<br />
0.85<br />
1.01<br />
0.90<br />
1.01<br />
1.36<br />
1.54<br />
1.76<br />
2.66<br />
3.59<br />
4.20<br />
5.24<br />
6.10<br />
6.25<br />
7.23<br />
MINAG-ANA-DCPRH-AGUAS SUPERFICIALES Pág.51<br />
Altitud (msnm)<br />
Altitud (msnm)<br />
Altitud (msnm)<br />
Altitud (msnm)<br />
4300-4350<br />
4250-4300<br />
4200-4250<br />
4150-4200<br />
4100-4150<br />
4050-4100<br />
4000-4050<br />
3950-4000<br />
3900-3950<br />
3850-3900<br />
3835-3850<br />
4900-4950<br />
4800-4850<br />
4700-4750<br />
4600-4650<br />
4500-4550<br />
4400-4450<br />
4300-4350<br />
4200-4250<br />
4100-4150<br />
4000-4050<br />
3900-3950<br />
3842-3850<br />
4500-4550<br />
4450-4500<br />
4400-4450<br />
4350-4400<br />
4300-4350<br />
4250-4300<br />
4200-4250<br />
4150-4200<br />
4100-4150<br />
4050-4100<br />
4000-4050<br />
3950-4000<br />
3900-3950<br />
3850-3900<br />
3842-3850<br />
Polígono <strong>de</strong> frecuencias <strong>de</strong> áreas parciales - Subcuenca <strong>río</strong><br />
L<strong>la</strong>che<br />
7.06<br />
8.75<br />
11.42<br />
11.83<br />
17.23<br />
0 4 8 12 16 20<br />
0.50<br />
1.69<br />
3.17<br />
Porcentaje <strong>de</strong> áreas parciales (%)<br />
Polígono <strong>de</strong> frecuencias <strong>de</strong> áreas parciales - Subcuenca<br />
Medio Bajo Huancané<br />
5.49<br />
7.97<br />
8.95<br />
10.28<br />
12.12<br />
12.89<br />
18.42<br />
18.52<br />
0 4 8 12 16 20 24<br />
0.02<br />
0.11<br />
0.34<br />
0.51<br />
0.45<br />
0.58<br />
0.76<br />
1.19<br />
1.56<br />
1.74<br />
2.57<br />
3.30<br />
1.32<br />
Porcentaje <strong>de</strong> áreas parciales (%)<br />
Polígono <strong>de</strong> frecuencias <strong>de</strong> áreas parciales - Subcuenca <strong>río</strong><br />
Tuyto<br />
4.86<br />
6.90<br />
7.16<br />
7.68<br />
7.91<br />
8.80<br />
9.40<br />
8.94<br />
11.03<br />
12.87<br />
0 4 8 12 16<br />
0.30<br />
1.74<br />
2.14<br />
3.35<br />
3.70<br />
4.25<br />
Porcentaje <strong>de</strong> áreas parciales (%)<br />
Polígono <strong>de</strong> frecuencias <strong>de</strong> áreas parciales - Subcuenca<br />
Medio Huancané<br />
5.47<br />
6.00<br />
7.36<br />
7.83<br />
7.47<br />
8.32<br />
7.85<br />
11.12<br />
23.09<br />
0 4 8 12 16 20 24 28<br />
Porcentaje <strong>de</strong> áreas parciales (%)
Altitud (msnm)<br />
Altitud (msnm)<br />
Altitud (msnm)<br />
Altitud (msnm)<br />
<strong>Estudio</strong> <strong>Hidrológico</strong> <strong>de</strong> <strong>la</strong>s <strong>Cuenca</strong>s Huancané y Suches 2010<br />
5300<br />
5100<br />
4900<br />
4700<br />
4500<br />
4300<br />
4100<br />
3900<br />
3700<br />
4400<br />
4300<br />
4200<br />
4100<br />
4000<br />
3900<br />
3800<br />
3700<br />
5100<br />
4900<br />
4700<br />
4500<br />
4300<br />
4100<br />
3900<br />
3700<br />
5300<br />
5100<br />
4900<br />
4700<br />
4500<br />
4300<br />
4100<br />
3900<br />
3700<br />
Curva hipsométrica - Subcuenca <strong>río</strong> Muñani<br />
Altitud <strong>de</strong> frecuencia media:<br />
4462.0 msnm<br />
-10 0 10 20 30 40 50 60 70 80 90 100 110<br />
Porcentaje <strong>de</strong> áreas que queda sobre <strong>la</strong> altitud (%)<br />
Curva hipsométrica - Subcuenca Medio Alto Huancané<br />
Altitud <strong>de</strong> frecuencia media:<br />
3937.0 msnm<br />
-10 0 10 20 30 40 50 60 70 80 90 100 110<br />
Porcentaje <strong>de</strong> áreas que queda sobre <strong>la</strong> altitud (%)<br />
Curva hipsométrica - Subcuenca <strong>río</strong> Pistune<br />
Altitud <strong>de</strong> frecuencia media:<br />
4117.0 msnm<br />
-10 0 10 20 30 40 50 60 70 80 90 100 110<br />
Porcentaje <strong>de</strong> áreas que queda sobre <strong>la</strong> altitud (%)<br />
Curva hipsométrica - Subcuenca Alto Huancané<br />
Altitud <strong>de</strong> frecuencia media:<br />
4439.0 msnm<br />
-10 0 10 20 30 40 50 60 70 80 90 100 110<br />
Porcentaje <strong>de</strong> áreas que queda sobre <strong>la</strong> altitud (%)<br />
5.22<br />
4.45<br />
4.09<br />
3.84<br />
3.35<br />
2.97<br />
2.66<br />
2.55<br />
2.95<br />
3.10<br />
3.44<br />
4.75<br />
MINAG-ANA-DCPRH-AGUAS SUPERFICIALES Pág.52<br />
Altitud (msnm)<br />
Altitud (msnm)<br />
Altitud (msnm)<br />
Altitud (msnm)<br />
4950-5000<br />
4850-4900<br />
4750-4800<br />
4650-4700<br />
4550-4600<br />
4450-4500<br />
4350-4400<br />
4250-4300<br />
4150-4200<br />
4050-4100<br />
3950-4000<br />
3855-3900<br />
4250-4300<br />
4200-4250<br />
4150-4200<br />
4100-4150<br />
4050-4100<br />
4000-4050<br />
3950-4000<br />
3900-3950<br />
3855-3900<br />
4850-4900<br />
4800-4850<br />
4750-4800<br />
4700-4750<br />
4650-4700<br />
4600-4650<br />
4550-4600<br />
4500-4550<br />
4450-4500<br />
4400-4450<br />
4350-4400<br />
4300-4350<br />
4250-4300<br />
4200-4250<br />
4150-4200<br />
4100-4150<br />
4050-4100<br />
4000-4050<br />
3950-4000<br />
3900-3950<br />
3868-3900<br />
5050-5100<br />
4950-5000<br />
4850-4900<br />
4750-4800<br />
4650-4700<br />
4550-4600<br />
4450-4500<br />
4350-4400<br />
4250-4300<br />
4150-4200<br />
4050-4100<br />
3950-4000<br />
3868-3900<br />
Polígono <strong>de</strong> frecuencias <strong>de</strong> áreas parciales - Subcuenca <strong>río</strong><br />
Muñani<br />
0.01<br />
0.11<br />
0.40<br />
1.19<br />
3.46<br />
5.89<br />
6.28<br />
7.48<br />
7.58<br />
7.61<br />
8.27<br />
8.33<br />
0 2 4 6 8 10<br />
0.55<br />
2.16<br />
3.09<br />
4.63<br />
8.01<br />
Porcentaje <strong>de</strong> áreas parciales (%)<br />
Polígono <strong>de</strong> frecuencias <strong>de</strong> áreas parciales - Subcuenca<br />
Medio Alto Huancané<br />
12.07<br />
15.44<br />
16.13<br />
37.92<br />
0 10 20 30 40 50<br />
Porcentaje <strong>de</strong> áreas parciales (%)<br />
Polígono <strong>de</strong> frecuencias <strong>de</strong> áreas parciales - Subcuenca <strong>río</strong><br />
Pistune<br />
0.29<br />
1.13<br />
1.70<br />
2.07<br />
2.40<br />
2.73<br />
2.44<br />
2.34<br />
3.46<br />
3.78<br />
3.64<br />
4.09<br />
4.56<br />
5.55<br />
5.69<br />
6.35<br />
7.34<br />
8.43<br />
8.60<br />
9.86<br />
13.56<br />
0 4 8 12 16<br />
0.01<br />
0.06<br />
0.28<br />
0.88<br />
Porcentaje <strong>de</strong> áreas parciales (%)<br />
Polígono <strong>de</strong> frecuencias <strong>de</strong> áreas parciales - Subcuenca Alto<br />
Huancané<br />
2.07<br />
2.91<br />
2.87<br />
3.243.49<br />
3.26<br />
5.92<br />
6.06<br />
6.08<br />
5.37<br />
4.77<br />
4.29<br />
4.17<br />
6.29<br />
3.74<br />
5.15<br />
6.06<br />
5.99<br />
5.95<br />
6.22<br />
0 2 4 6 8<br />
4.89<br />
Porcentaje <strong>de</strong> áreas parciales (%)
Altitud (msnm)<br />
Altitud (msnm)<br />
Altitud (msnm)<br />
<strong>Estudio</strong> <strong>Hidrológico</strong> <strong>de</strong> <strong>la</strong>s <strong>Cuenca</strong>s Huancané y Suches 2010<br />
4900<br />
4800<br />
4700<br />
4600<br />
4500<br />
4400<br />
4300<br />
4200<br />
5100<br />
5000<br />
4900<br />
4800<br />
4700<br />
4600<br />
4500<br />
4400<br />
4300<br />
4200<br />
6000<br />
5800<br />
5600<br />
5400<br />
5200<br />
5000<br />
4800<br />
4600<br />
4400<br />
4200<br />
Figura Nº 3.4 Curva hipsométrica y polígono <strong>de</strong> frecuencias – <strong>Cuenca</strong> Suches<br />
Curva hipsométrica - <strong>Cuenca</strong> <strong>río</strong> Chueña Huata Jahuira<br />
Altitud <strong>de</strong> frecuencia media:<br />
4412.0 msnm<br />
-10 0 10 20 30 40 50 60 70 80 90 100 110<br />
Porcentaje <strong>de</strong> áreas que queda sobre <strong>la</strong> altitud (%)<br />
Curva hipsométrica - Subcuenca <strong>río</strong> Caylloma<br />
Altitud <strong>de</strong> frecuencia media:<br />
4563.0 msnm<br />
-10 0 10 20 30 40 50 60 70 80 90 100 110<br />
Porcentaje <strong>de</strong> áreas que queda sobre <strong>la</strong> altitud (%)<br />
Curva hipsométrica - Subcuenca <strong>río</strong> Trapiche<br />
Altitud <strong>de</strong> frecuencia media:<br />
4760.0 msnm<br />
-10 0 10 20 30 40 50 60 70 80 90 100 110<br />
Porcentaje <strong>de</strong> áreas que queda sobre <strong>la</strong> altitud (%)<br />
MINAG-ANA-DCPRH-AGUAS SUPERFICIALES Pág.53<br />
Altitud (msnm)<br />
Altitud (msnm)<br />
Altitud (msnm)<br />
4750-4800<br />
4700-4750<br />
4650-4700<br />
4600-4650<br />
4550-4600<br />
4500-4550<br />
4450-4500<br />
4400-4450<br />
4350-4400<br />
4325-4350<br />
5000-5050<br />
4950-5000<br />
4900-4950<br />
4850-4900<br />
4800-4850<br />
4750-4800<br />
4700-4750<br />
4650-4700<br />
4600-4650<br />
4550-4600<br />
4500-4550<br />
4450-4500<br />
4400-4450<br />
4350-4400<br />
4344-4350<br />
5750-5829<br />
5650-5700<br />
5550-5600<br />
5450-5500<br />
5350-5400<br />
5250-5300<br />
5150-5200<br />
5050-5100<br />
4950-5000<br />
4850-4900<br />
4750-4800<br />
4650-4700<br />
4550-4600<br />
4450-4500<br />
4399-4400<br />
Polígono <strong>de</strong> frecuencias <strong>de</strong> áreas parciales - <strong>Cuenca</strong> <strong>río</strong><br />
Chueña Huata Jahuira<br />
0.65<br />
1.90<br />
4.54<br />
6.19<br />
9.09<br />
8.96<br />
10.19<br />
9.08<br />
11.03<br />
38.38<br />
0 5 10 15 20 25 30 35 40 45<br />
0.31<br />
1.18<br />
2.35<br />
3.57<br />
3.37<br />
Porcentaje <strong>de</strong> áreas parciales (%)<br />
Polígono <strong>de</strong> frecuencias <strong>de</strong> áreas parciales - Subcuenca <strong>río</strong><br />
Caylloma<br />
5.94<br />
7.20<br />
7.62<br />
7.23<br />
7.63<br />
9.40<br />
9.19<br />
9.37<br />
9.05<br />
16.59<br />
0 4 8 12 16 20<br />
0.02<br />
0.02<br />
0.05<br />
0.08<br />
0.12<br />
0.21<br />
0.38<br />
0.48<br />
0.60<br />
0.70<br />
0.89<br />
0.93<br />
1.17<br />
1.62<br />
2.39<br />
2.87<br />
0.22<br />
Porcentaje <strong>de</strong> áreas parciales (%)<br />
Polígono <strong>de</strong> frecuencias <strong>de</strong> áreas parciales - Subcuenca <strong>río</strong><br />
Trapiche<br />
4.12<br />
2.85 3.99<br />
3.80<br />
6.41<br />
9.82<br />
10.55<br />
8.19<br />
8.80<br />
9.77<br />
10.94<br />
8.01<br />
0 3 6 9 12 15<br />
Porcentaje <strong>de</strong> áreas parciales (%)<br />
Los cuadros <strong>de</strong> distribución <strong>de</strong> altitu<strong>de</strong>s para <strong>la</strong> e<strong>la</strong>boración <strong>de</strong> <strong>la</strong>s curvas hipsométricas,<br />
polígono <strong>de</strong> frecuencias <strong>de</strong> áreas parciales, cálculo <strong>de</strong> <strong>la</strong> altitud media, altitud <strong>de</strong> frecuencia<br />
media e índice <strong>de</strong> pendiente <strong>de</strong> <strong>la</strong>s cuencas Huancané y Suches, se muestran en el anexo.
<strong>Estudio</strong> <strong>Hidrológico</strong> <strong>de</strong> <strong>la</strong>s <strong>Cuenca</strong>s Huancané y Suches 2010<br />
C.- Altitud media <strong>de</strong> <strong>la</strong> cuenca<br />
Correspon<strong>de</strong> a <strong>la</strong> or<strong>de</strong>nada media <strong>de</strong> <strong>la</strong> curva hipsométrica, y su cálculo obe<strong>de</strong>ce a un<br />
promedio pon<strong>de</strong>rado: elevación – área <strong>de</strong> <strong>la</strong> cuenca.<br />
La altura o elevación media tiene importancia principalmente en zonas montañosas don<strong>de</strong><br />
influye en el escurrimiento y en otros elementos que también afectan el régimen<br />
hidrológico, como el tipo <strong>de</strong> precipitación, <strong>la</strong> temperatura, etc. Para obtener <strong>la</strong> elevación<br />
media se aplica un método basado en <strong>la</strong> siguiente fórmu<strong>la</strong>:<br />
Hm<br />
n<br />
<br />
i<br />
1<br />
C . a <br />
i<br />
A<br />
i<br />
Don<strong>de</strong>:<br />
Hm = Elevación media <strong>de</strong> <strong>la</strong> cuenca (msnm).<br />
Ci = Cota media <strong>de</strong>l área i, <strong>de</strong>limitada por 2 curvas <strong>de</strong> nivel (msnm).<br />
ai = Área i entre curvas <strong>de</strong> nivel (km 2 ).<br />
A = Área total <strong>de</strong> <strong>la</strong> cuenca (km 2 ).<br />
La altitud media <strong>de</strong> <strong>la</strong> cuenca <strong>de</strong>l <strong>río</strong> Huancané es <strong>de</strong> 4212.0 msnm. Para <strong>la</strong>s subunida<strong>de</strong>s<br />
hidrográficas <strong>de</strong> nivel cinco (subcuencas) <strong>de</strong> <strong>la</strong>s cuencas Huancané y Suches se presentan<br />
en los Cuadros Nº 3.10 y 3.11.<br />
D.- Altitud <strong>de</strong> frecuencia media<br />
Es <strong>la</strong> altitud correspondiente al punto <strong>de</strong> abscisa media <strong>de</strong> <strong>la</strong> curva <strong>de</strong> frecuencia <strong>de</strong><br />
altitu<strong>de</strong>s, en el<strong>la</strong>, el 50% <strong>de</strong>l área <strong>de</strong> <strong>la</strong> cuenca, está situado por encima <strong>de</strong> esa altitud y el<br />
50% por <strong>de</strong>bajo <strong>de</strong> el<strong>la</strong>.<br />
La altitud <strong>de</strong> frecuencia media <strong>de</strong> <strong>la</strong> cuenca <strong>de</strong>l <strong>río</strong> Huancané es <strong>de</strong> 4147.0 msnm, y el área<br />
por encima <strong>de</strong> esta cota es <strong>de</strong> 1815.60 km 2 que representa el 50% <strong>de</strong>l total <strong>de</strong> <strong>la</strong> superficie<br />
<strong>de</strong> <strong>la</strong> cuenca. Para <strong>la</strong>s unida<strong>de</strong>s hidrográficas <strong>de</strong> nivel cinco (subcuencas) <strong>de</strong> <strong>la</strong>s cuencas<br />
Huancané y Suches se muestran en los Cuadros Nº 3.10 y 3.11.<br />
E.- Altitud más frecuente<br />
Es <strong>la</strong> altitud predominante con mayor porcentaje <strong>de</strong> área <strong>de</strong> <strong>la</strong> cuenca. En <strong>la</strong> Figura Nº 3.3<br />
para <strong>la</strong> cuenca <strong>de</strong>l <strong>río</strong> Huancané, <strong>la</strong> altitud predominante se encuentra entre el intervalo <strong>de</strong><br />
<strong>la</strong>s cotas <strong>de</strong> 3850 a 3950 msnm, es don<strong>de</strong> se tiene mayor porcentaje <strong>de</strong> área <strong>de</strong> <strong>la</strong> cuenca.<br />
Para <strong>la</strong>s unida<strong>de</strong>s hidrográficas <strong>de</strong> nivel cinco (subcuencas) <strong>de</strong> <strong>la</strong>s cuencas Huancané y<br />
Suches se presentan en los Cuadros Nº 3.10 y 3.11.<br />
F.- Pendiente media <strong>de</strong> <strong>la</strong> cuenca<br />
Este parámetro <strong>de</strong> relieve es importante <strong>de</strong>bido a su re<strong>la</strong>ción con el comportamiento<br />
hidráulico <strong>de</strong> drenaje <strong>de</strong> <strong>la</strong> cuenca, y tiene una importancia directa en re<strong>la</strong>ción a <strong>la</strong><br />
MINAG-ANA-DCPRH-AGUAS SUPERFICIALES Pág.54
<strong>Estudio</strong> <strong>Hidrológico</strong> <strong>de</strong> <strong>la</strong>s <strong>Cuenca</strong>s Huancané y Suches 2010<br />
magnitud <strong>de</strong> <strong>la</strong>s crecidas. Para su estimación se emplea el sistema <strong>de</strong>l “Rectángulo<br />
Equivalente”.<br />
Sm <br />
H<br />
Lm<br />
Don<strong>de</strong>:<br />
Sm = Pendiente media <strong>de</strong> <strong>la</strong> cuenca.<br />
H = Desnivel total (cota en <strong>la</strong> parte más alta - cota en <strong>la</strong> parte más baja),<br />
en km.<br />
Lm = Lado mayor <strong>de</strong>l rectángulo equivalente (km).<br />
La cuenca <strong>de</strong>l <strong>río</strong> Huancané tiene una pendiente media <strong>de</strong> 0.0067 m/m. Para <strong>la</strong>s unida<strong>de</strong>s<br />
hidrográficas <strong>de</strong> nivel cinco (subcuencas) <strong>de</strong> <strong>la</strong>s cuencas Huancané y Suches se muestran<br />
en los Cuadros Nº 3.10 y 3.11.<br />
G.- Índice <strong>de</strong> pendiente <strong>de</strong> <strong>la</strong> cuenca (Ip)<br />
El índice <strong>de</strong> pendiente representa <strong>la</strong> pendiente promedio <strong>de</strong> todas <strong>la</strong>s áreas elementales <strong>de</strong><br />
<strong>la</strong> cuenca y es importante para el estudio <strong>de</strong> <strong>la</strong> infiltración, recarga <strong>de</strong> acuíferos y<br />
c<strong>la</strong>sificación <strong>de</strong> cuencas.<br />
n<br />
1<br />
Ip a a<br />
<br />
i1<br />
i<br />
i i1<br />
<br />
L<br />
Don<strong>de</strong>:<br />
Ip = Índice <strong>de</strong> pendiente.<br />
n = Número <strong>de</strong> curvas <strong>de</strong> nivel existente en el rectángulo equivalente,<br />
incluido los extremos.<br />
a1, a2, a3,….., an = Cotas <strong>de</strong> <strong>la</strong>s n curvas <strong>de</strong> nivel consi<strong>de</strong>radas (km).<br />
= Fracción <strong>de</strong> <strong>la</strong> superficie total <strong>de</strong> <strong>la</strong> cuenca comprendida entre <strong>la</strong>s<br />
i<br />
cotas ai - ai-1. A A <br />
i<br />
i<br />
L = Longitud <strong>de</strong>l <strong>la</strong>do mayor <strong>de</strong>l rectángulo equivalente (km).<br />
El índice <strong>de</strong> pendiente <strong>de</strong> <strong>la</strong> cuenca <strong>de</strong>l <strong>río</strong> Huancané es <strong>de</strong> 0.0742. Para <strong>la</strong>s unida<strong>de</strong>s<br />
hidrográficas <strong>de</strong> nivel cinco (subcuencas) <strong>de</strong> <strong>la</strong>s cuencas Huancané y Suches se presentan<br />
en los Cuadros Nº 3.10 y 3.11.<br />
H.- Coeficiente <strong>de</strong> masividad (Cm)<br />
Es <strong>la</strong> re<strong>la</strong>ción entre <strong>la</strong> elevación media y el área <strong>de</strong> <strong>la</strong> cuenca.<br />
E<br />
Cm <br />
A<br />
Don<strong>de</strong>:<br />
E = Extensión media <strong>de</strong>l escurrimiento superficial (km).<br />
A = Área <strong>de</strong> <strong>la</strong> cuenca (km 2 ).<br />
MINAG-ANA-DCPRH-AGUAS SUPERFICIALES Pág.55<br />
T
<strong>Estudio</strong> <strong>Hidrológico</strong> <strong>de</strong> <strong>la</strong>s <strong>Cuenca</strong>s Huancané y Suches 2010<br />
El coeficiente <strong>de</strong> masividad <strong>de</strong> <strong>la</strong> cuenca <strong>de</strong>l <strong>río</strong> Huancané es 0.0004. Para <strong>la</strong>s unida<strong>de</strong>s<br />
hidrográficas <strong>de</strong> nivel cinco (subcuencas) <strong>de</strong> <strong>la</strong>s cuencas Huancané y Suches se muestran<br />
en los Cuadros Nº 3.10 y 3.11.<br />
I.- Coeficiente orográfico (Co)<br />
Es el producto <strong>de</strong>l coeficiente <strong>de</strong> masividad y <strong>la</strong> elevación media <strong>de</strong> <strong>la</strong> cuenca, este valor<br />
permite <strong>de</strong>terminar el relieve en distintos puntos <strong>de</strong> <strong>la</strong> cuenca.<br />
Co CmE<br />
Don<strong>de</strong>:<br />
Cm = Coeficiente <strong>de</strong> masividad <strong>de</strong> <strong>la</strong> cuenca.<br />
E = Extensión media <strong>de</strong>l escurrimiento superficial (km).<br />
El coeficiente orográfico para <strong>la</strong> cuenca <strong>de</strong>l <strong>río</strong> Huancané es <strong>de</strong> 0.0006. Para <strong>la</strong>s unida<strong>de</strong>s<br />
hidrográficas <strong>de</strong> nivel cinco (subcuencas) <strong>de</strong> <strong>la</strong>s cuencas Huancané y Suches se presentan<br />
en los Cuadros Nº 3.10 y 3.11.<br />
J.- Coeficiente <strong>de</strong> torrencialidad (Ct)<br />
Este parámetro indica <strong>la</strong> re<strong>la</strong>ción entre el número <strong>de</strong> cursos <strong>de</strong> primer or<strong>de</strong>n con el área <strong>de</strong><br />
<strong>la</strong> cuenca.<br />
Nº<br />
R1<br />
Ct <br />
A<br />
Don<strong>de</strong>:<br />
Nº R1 = Número <strong>de</strong> <strong>río</strong>s <strong>de</strong> primer or<strong>de</strong>n.<br />
A = Área <strong>de</strong> <strong>la</strong> cuenca (km 2 ).<br />
La cuenca <strong>de</strong>l <strong>río</strong> Huancané tiene un coeficiente <strong>de</strong> torrencialidad <strong>de</strong> 0.19. Para <strong>la</strong>s<br />
unida<strong>de</strong>s hidrográficas <strong>de</strong> nivel cinco (subcuencas) <strong>de</strong> <strong>la</strong>s cuencas Huancané y Suches se<br />
muestran en los Cuadros Nº 3.10 y 3.11.<br />
3.5.3.3 Parámetros <strong>de</strong> <strong>la</strong> red hidrográfica <strong>de</strong> <strong>la</strong> cuenca<br />
La red hidrográfica correspon<strong>de</strong> al drenaje natural, permanente o temporal, por el que<br />
fluyen <strong>la</strong>s aguas <strong>de</strong> los escurrimientos superficiales, hipodérmicos y subterráneos <strong>de</strong> <strong>la</strong><br />
cuenca. La red <strong>de</strong> drenaje es, probablemente, uno <strong>de</strong> los factores más importantes a <strong>la</strong> hora<br />
<strong>de</strong> <strong>de</strong>finir un territorio. De el<strong>la</strong> se pue<strong>de</strong> obtener información en lo que concierne a <strong>la</strong> roca<br />
madre y a los materiales <strong>de</strong>l suelo, a <strong>la</strong> morfología y a <strong>la</strong> cantidad <strong>de</strong> agua que circu<strong>la</strong>,<br />
entre otros.<br />
Diversos autores coinci<strong>de</strong>n en afirmar que mientras mayor sea el grado <strong>de</strong> bifurcación <strong>de</strong>l<br />
sistema <strong>de</strong> drenaje <strong>de</strong> una cuenca, es <strong>de</strong>cir, entre más corrientes tributarias presente, más<br />
rápida será <strong>la</strong> respuesta <strong>de</strong> <strong>la</strong> cuenca frente a una tormenta, evacuando el agua en menos<br />
MINAG-ANA-DCPRH-AGUAS SUPERFICIALES Pág.56
<strong>Estudio</strong> <strong>Hidrológico</strong> <strong>de</strong> <strong>la</strong>s <strong>Cuenca</strong>s Huancané y Suches 2010<br />
tiempo. En efecto, al presentar una <strong>de</strong>nsa red <strong>de</strong> drenaje, una gota <strong>de</strong> lluvia <strong>de</strong>berá recorrer<br />
una longitud <strong>de</strong> <strong>la</strong><strong>de</strong>ra pequeña, realizando <strong>la</strong> mayor parte <strong>de</strong>l recorrido a lo <strong>la</strong>rgo <strong>de</strong> los<br />
cauces, don<strong>de</strong> <strong>la</strong> velocidad <strong>de</strong>l escurrimiento es mayor.<br />
En virtud <strong>de</strong> lo anterior, se han propuesto una serie <strong>de</strong> indicadores <strong>de</strong> dicho grado <strong>de</strong><br />
bifurcación, como <strong>la</strong> <strong>de</strong>nsidad <strong>de</strong> corrientes y <strong>la</strong> <strong>de</strong>nsidad <strong>de</strong> drenaje. Para analizar <strong>la</strong> red<br />
hidrográfica superficial <strong>de</strong> una cuenca, se han utilizado los siguientes parámetros:<br />
- Tipo <strong>de</strong> corriente.<br />
- Número <strong>de</strong> or<strong>de</strong>n <strong>de</strong> los <strong>río</strong>s.<br />
- Frecuencia <strong>de</strong> <strong>de</strong>nsidad <strong>de</strong> <strong>río</strong>s (Fr).<br />
- Densidad <strong>de</strong> drenaje (Dd).<br />
- Extensión media <strong>de</strong>l escurrimiento superficial (E).<br />
- Pendiente media <strong>de</strong>l <strong>río</strong> principal (Sm).<br />
- Altura media <strong>de</strong>l <strong>río</strong> principal (Hmed).<br />
- Tiempo <strong>de</strong> concentración (Tc).<br />
A.- Tipo <strong>de</strong> corriente<br />
Una manera comúnmente usada para c<strong>la</strong>sificar el tipo <strong>de</strong> corriente es tomar como base <strong>la</strong><br />
permanencia <strong>de</strong>l flujo en el cauce <strong>de</strong>l <strong>río</strong>. Los tipos <strong>de</strong> corriente en una cuenca es <strong>la</strong><br />
siguiente:<br />
Ríos Perennes.- son <strong>río</strong>s que contienen el agua permanentemente todo el año.<br />
Ríos Intermitentes.- son <strong>río</strong>s que en general contienen el agua sólo durante épocas <strong>de</strong> lluvia<br />
y se secan en épocas <strong>de</strong> estiaje.<br />
Ríos Efímeros.- son <strong>río</strong>s que contienen el agua, sólo cuando llueve, <strong>de</strong>spués se secan<br />
(quebradas).<br />
Los <strong>río</strong>s Huancané y Suches son <strong>de</strong> tipo Perenne, igualmente los <strong>río</strong>s <strong>de</strong> <strong>la</strong>s unida<strong>de</strong>s<br />
hidrográficas <strong>de</strong> nivel cinco (subcuencas), por que los <strong>río</strong>s contienen el agua durante todo<br />
el año.<br />
B.- Número <strong>de</strong> or<strong>de</strong>n <strong>de</strong> los <strong>río</strong>s<br />
Es el grado <strong>de</strong> ramificación <strong>de</strong> <strong>la</strong>s corrientes <strong>de</strong> agua, para su <strong>de</strong>terminación se consi<strong>de</strong>ra el<br />
número <strong>de</strong> bifurcaciones que tienen los tributarios, asignándoles un or<strong>de</strong>n a cada uno <strong>de</strong><br />
ellos en forma creciente <strong>de</strong>s<strong>de</strong> su naciente hasta su <strong>de</strong>sembocadura. De manera que el<br />
or<strong>de</strong>n atribuido al curso nos indique el grado <strong>de</strong> ramificación <strong>de</strong>l sistema <strong>de</strong> drenaje. Es<br />
<strong>de</strong>cir, los <strong>río</strong>s <strong>de</strong>l primer or<strong>de</strong>n son <strong>la</strong>s corrientes que no tienen tributarios, dos <strong>río</strong>s <strong>de</strong>l<br />
primer or<strong>de</strong>n forman un <strong>río</strong> <strong>de</strong> segundo or<strong>de</strong>n, dos <strong>río</strong>s <strong>de</strong> segundo or<strong>de</strong>n forman un <strong>río</strong> <strong>de</strong><br />
tercer or<strong>de</strong>n y así sucesivamente hasta llegar al curso principal y finalmente se obtiene el<br />
grado <strong>de</strong> ramificación <strong>de</strong>l sistema <strong>de</strong> drenaje <strong>de</strong> una cuenca.<br />
Los <strong>río</strong>s Huancané y Suches son <strong>de</strong> or<strong>de</strong>n 6 y 5, y <strong>la</strong>s unida<strong>de</strong>s hidrográficas <strong>de</strong> nivel cinco<br />
(subcuencas) varían <strong>de</strong> or<strong>de</strong>n 4 - 6, respectivamente. Ver los Cuadros Nº 3.10 y 3.11.<br />
MINAG-ANA-DCPRH-AGUAS SUPERFICIALES Pág.57
<strong>Estudio</strong> <strong>Hidrológico</strong> <strong>de</strong> <strong>la</strong>s <strong>Cuenca</strong>s Huancané y Suches 2010<br />
C.- Frecuencia <strong>de</strong> <strong>de</strong>nsidad <strong>de</strong> <strong>río</strong>s (Fr)<br />
Es el número <strong>de</strong> <strong>río</strong>s por unidad <strong>de</strong> superficie <strong>de</strong> <strong>la</strong> cuenca. Se encuentra al dividir el<br />
número total <strong>de</strong>l curso <strong>de</strong> agua (Nº <strong>río</strong>s) entre el área total <strong>de</strong> <strong>la</strong> cuenca (A), es <strong>de</strong>cir, que:<br />
Nº<br />
<strong>río</strong>s<br />
Dr <br />
A<br />
Don<strong>de</strong>:<br />
Nº <strong>río</strong>s = Número <strong>de</strong> <strong>río</strong>s <strong>de</strong> <strong>la</strong> cuenca.<br />
A = Área <strong>de</strong> <strong>la</strong> cuenca (km 2 ).<br />
La <strong>de</strong>nsidad <strong>de</strong> <strong>río</strong>s en <strong>la</strong> cuenca <strong>de</strong>l <strong>río</strong> Huancané es <strong>de</strong> 0.25 <strong>río</strong>s/km 2 . Para <strong>la</strong>s unida<strong>de</strong>s<br />
hidrográficas <strong>de</strong> nivel cinco (subcuencas) <strong>de</strong> <strong>la</strong>s cuencas Huancané y Suches se presentan<br />
en los Cuadros Nº 3.10 y 3.11.<br />
D.- Densidad <strong>de</strong> drenaje (Dd)<br />
Es <strong>la</strong> re<strong>la</strong>ción entre <strong>la</strong> longitud total <strong>de</strong> los cursos <strong>de</strong> agua: perennes, intermitentes o<br />
efímeros <strong>de</strong> <strong>la</strong> cuenca y el área total <strong>de</strong> <strong>la</strong> misma. Representa <strong>la</strong> cantidad <strong>de</strong> kilómetros <strong>de</strong><br />
curso que existe por cada unidad <strong>de</strong> superficie.<br />
LT<br />
Dd <br />
A<br />
Don<strong>de</strong>:<br />
Dd = Densidad <strong>de</strong> drenaje (km/km 2 ).<br />
LT = Longitud total <strong>de</strong> <strong>río</strong>s <strong>de</strong> <strong>la</strong> cuenca (km).<br />
A = Área <strong>de</strong> <strong>la</strong> cuenca (km 2 ).<br />
Según Monsalve S, G. [1999], <strong>la</strong> <strong>de</strong>nsidad <strong>de</strong> drenaje usualmente toma los valores<br />
siguientes:<br />
- Entre 0. 5 km/km 2 , para hoyas con drenaje pobre.<br />
- Hasta 3. 5 km/km 2 , para hoyas excepcionalmente bien drenadas.<br />
La <strong>de</strong>nsidad <strong>de</strong> drenaje <strong>de</strong> <strong>la</strong> cuenca <strong>de</strong>l <strong>río</strong> Huancané es <strong>de</strong> 0.71 km/km 2 , el cual es mayor<br />
2<br />
2<br />
que 0. 5km<br />
km y menor que 3. 5km<br />
km , lo que indica que <strong>la</strong> cuenca <strong>de</strong>l <strong>río</strong> Huancané<br />
tendría drenaje regu<strong>la</strong>r y mo<strong>de</strong>radamente propenso a <strong>la</strong>s crecientes. Para <strong>la</strong>s unida<strong>de</strong>s<br />
hidrográficas <strong>de</strong> nivel cinco (subcuencas) <strong>de</strong> <strong>la</strong>s cuencas Huancané y Suches se muestran<br />
en los Cuadros Nº 3.10 y 3.11.<br />
E.- Extensión media <strong>de</strong>l escurrimiento superficial (E)<br />
Es <strong>la</strong> re<strong>la</strong>ción entre el área <strong>de</strong> <strong>la</strong> cuenca y <strong>la</strong> longitud total <strong>de</strong> <strong>la</strong> red hídrica <strong>de</strong> <strong>la</strong> misma<br />
cuenca.<br />
MINAG-ANA-DCPRH-AGUAS SUPERFICIALES Pág.58
<strong>Estudio</strong> <strong>Hidrológico</strong> <strong>de</strong> <strong>la</strong>s <strong>Cuenca</strong>s Huancané y Suches 2010<br />
También se pue<strong>de</strong> <strong>de</strong>finir como <strong>la</strong> distancia promedio en línea recta que el agua precipitada<br />
tendría que recorrer para llegar al lecho <strong>de</strong> un curso <strong>de</strong> agua. Su valor se calcu<strong>la</strong> con <strong>la</strong><br />
siguiente fórmu<strong>la</strong>:<br />
A<br />
E <br />
LT<br />
Don<strong>de</strong>:<br />
A = área <strong>de</strong> <strong>la</strong> cuenca (km 2 ).<br />
LT = longitud total <strong>de</strong> <strong>río</strong>s <strong>de</strong> <strong>la</strong> cuenca (km).<br />
Para <strong>la</strong> cuenca <strong>de</strong>l <strong>río</strong> Huancané, <strong>la</strong> extensión media <strong>de</strong>l escurrimiento superficial es <strong>de</strong><br />
1.42 km 2 /km. Para <strong>la</strong>s unida<strong>de</strong>s hidrográficas <strong>de</strong> nivel cinco (subcuencas) <strong>de</strong> <strong>la</strong>s cuencas<br />
Huancané y Suches se presentan en los Cuadros Nº 3.10 y 3.11.<br />
F.- Pendiente media <strong>de</strong>l <strong>río</strong> principal (Sm)<br />
La velocidad <strong>de</strong> <strong>la</strong> escorrentía superficial <strong>de</strong> los cursos <strong>de</strong> agua <strong>de</strong>pen<strong>de</strong> <strong>de</strong> <strong>la</strong> pendiente <strong>de</strong><br />
sus cauces fluviales; así a mayor pendiente habrá mayor velocidad <strong>de</strong> escurrimiento. La<br />
pendiente media <strong>de</strong>l <strong>río</strong> es un parámetro empleado para <strong>de</strong>terminar <strong>la</strong> <strong>de</strong>clividad <strong>de</strong> una<br />
corriente <strong>de</strong> agua entre dos puntos extremos.<br />
La pendiente media <strong>de</strong>l cauce principal, según Taylor y Schwarz es <strong>la</strong> re<strong>la</strong>ción entre <strong>la</strong><br />
diferencia <strong>de</strong> alturas y <strong>la</strong> longitud <strong>de</strong>l curso principal.<br />
S<br />
m<br />
H H <br />
M<br />
m<br />
<br />
1000<br />
L<br />
Don<strong>de</strong>:<br />
S m = Pendiente media <strong>de</strong>l cauce principal (m/m).<br />
L = Longitud <strong>de</strong>l cauce principal (km).<br />
M m H , H = Altura máxima y mínima <strong>de</strong>l lecho <strong>de</strong>l <strong>río</strong> principal, referidos al<br />
nivel medio <strong>de</strong> <strong>la</strong>s aguas <strong>de</strong>l mar (msnm).<br />
El <strong>río</strong> principal <strong>de</strong> <strong>la</strong>s cuencas Huancané y Suches tienen una pendiente media <strong>de</strong> 0.0070 y<br />
0.0065 m/m. Para <strong>la</strong>s unida<strong>de</strong>s hidrográficas <strong>de</strong> nivel cinco (subcuencas) <strong>de</strong> <strong>la</strong>s cuencas<br />
Huancané y Suches se muestran en los Cuadro Nº 3.10 y 3.11.<br />
Los perfiles longitudinales <strong>de</strong> los <strong>río</strong>s Huancané y Suches se muestran en <strong>la</strong>s Figuras Nº<br />
3.5 y 3.6.<br />
G.- Altura media <strong>de</strong>l <strong>río</strong> principal (Hm)<br />
Es el valor medio entre <strong>la</strong>s alturas <strong>de</strong> los extremos <strong>de</strong>l <strong>río</strong> principal.<br />
Hmáx<br />
Hmín<br />
H <br />
2<br />
MINAG-ANA-DCPRH-AGUAS SUPERFICIALES Pág.59
<strong>Estudio</strong> <strong>Hidrológico</strong> <strong>de</strong> <strong>la</strong>s <strong>Cuenca</strong>s Huancané y Suches 2010<br />
Don<strong>de</strong>:<br />
Hmáx. = Altura máxima <strong>de</strong>l lecho <strong>de</strong>l <strong>río</strong> principal (msnm).<br />
Hmín. = Altura mínima <strong>de</strong>l lecho <strong>de</strong>l <strong>río</strong> principal (msnm).<br />
La altura media <strong>de</strong>l cauce principal <strong>de</strong> los <strong>río</strong>s Huancané y Suches son 4303.0 y 4424.0<br />
msnm. Para <strong>la</strong>s unida<strong>de</strong>s hidrográficas <strong>de</strong> nivel cinco (subcuencas) <strong>de</strong> <strong>la</strong>s cuencas<br />
Huancané y Suches se presentan en los Cuadros Nº 3.10 y 3.11.<br />
Altitud (msnm)<br />
Altitud (msnm)<br />
Altitud (msnm)<br />
4900<br />
4700<br />
4500<br />
4300<br />
4100<br />
3900<br />
3700<br />
4750<br />
4600<br />
4450<br />
4300<br />
4150<br />
4000<br />
3850<br />
3700<br />
4400<br />
4300<br />
4200<br />
4100<br />
4000<br />
3900<br />
3800<br />
Figura Nº 3.5 Perfil longitudinal <strong>de</strong>l cauce principal - <strong>Cuenca</strong> <strong>de</strong>l <strong>río</strong> Huancané<br />
<strong>Cuenca</strong> <strong>de</strong>l <strong>río</strong> Huancané<br />
0 10 20 30 40 50 60 70 80 90 100 110 120 130 140 150<br />
Longitud (km)<br />
Subcuenca <strong>de</strong>l <strong>río</strong> L<strong>la</strong>che<br />
Sm= 0.0070 m/m<br />
0 2 4 6 8 10 12 14 16 18 20 22 24 26 28 30 32 34 36 38 40 42<br />
Longitud (km)<br />
Subcuenca <strong>de</strong>l <strong>río</strong> Tuyto<br />
Sm= 0.0204 m/m<br />
0 5 10 15 20 25 30 35 40 45 50 55 60 65 70 75 80 85 90 95<br />
Longitud (km)<br />
Sm= 0.0049 m/m<br />
MINAG-ANA-DCPRH-AGUAS SUPERFICIALES Pág.60
<strong>Estudio</strong> <strong>Hidrológico</strong> <strong>de</strong> <strong>la</strong>s <strong>Cuenca</strong>s Huancané y Suches 2010<br />
Altitud (msnm)<br />
Altitud (msnm)<br />
Altitud (msnm)<br />
Altitud (msnm)<br />
4900<br />
4750<br />
4600<br />
4450<br />
4300<br />
4150<br />
4000<br />
3850<br />
3700<br />
4900<br />
4750<br />
4600<br />
4450<br />
4300<br />
4150<br />
4000<br />
3850<br />
5000<br />
4800<br />
4600<br />
4400<br />
4200<br />
4000<br />
3800<br />
4800<br />
4700<br />
4600<br />
4500<br />
4400<br />
4300<br />
Subcuenca <strong>de</strong>l <strong>río</strong> Muñani<br />
0 5 10 15 20 25 30 35 40 45 50 55 60 65 70 75<br />
Longitud (km)<br />
Subcuenca <strong>de</strong>l <strong>río</strong> Pistune<br />
Sm= 0.0126 m/m<br />
Sm= 0.0168 m/m<br />
0 3 6 9 12 15 18 21 24 27 30 33 36 39 42 45 48 51 54<br />
Longitud (km)<br />
Subcuenca Alto Huancané (<strong>río</strong> Puncune)<br />
Sm= 0.0189 m/m<br />
0 3 6 9 12 15 18 21 24 27 30 33 36 39 42 45 48 51<br />
Longitud (km)<br />
Figura Nº 3.6 Perfil longitudinal <strong>de</strong>l cauce principal - <strong>Cuenca</strong> <strong>de</strong>l <strong>río</strong> Suches (Perú)<br />
Subcuenca <strong>de</strong>l <strong>río</strong> Chueña Huata Jahuira<br />
0 2 4 6 8 10 12 14 16 18 20 22 24 26 28 30 32 34 36 38<br />
Longitud (km)<br />
Sm= 0.0103 m/m<br />
MINAG-ANA-DCPRH-AGUAS SUPERFICIALES Pág.61
<strong>Estudio</strong> <strong>Hidrológico</strong> <strong>de</strong> <strong>la</strong>s <strong>Cuenca</strong>s Huancané y Suches 2010<br />
Altitud (msnm)<br />
Altitud (msnm)<br />
5000<br />
4900<br />
4800<br />
4700<br />
4600<br />
4500<br />
4400<br />
4300<br />
5100<br />
5000<br />
4900<br />
4800<br />
4700<br />
4600<br />
4500<br />
4400<br />
4300<br />
Subcuenca <strong>de</strong>l <strong>río</strong> Caylloma<br />
0 2 4 6 8 10 12 14 16 18 20 22 24 26 28 30 32 34 36 38 40 42<br />
Longitud (km)<br />
Subcuenca <strong>de</strong>l <strong>río</strong> Trapiche<br />
Sm= 0.0126 m/m<br />
0 2 4 6 8 10 12 14 16 18 20 22 24 26 28 30 32 34 36 38 40<br />
H.- Tiempo <strong>de</strong> concentración (Tc)<br />
Longitud (km)<br />
Sm= 0.0164 m/m<br />
Este parámetro se refiere al tiempo que tarda el agua en su recorrido entre dos puntos<br />
<strong>de</strong>terminados, los cuales son: en extremo superior <strong>de</strong> <strong>la</strong> cuenca y el punto don<strong>de</strong> se mi<strong>de</strong> el<br />
flujo.<br />
Para el cálculo <strong>de</strong>l tiempo <strong>de</strong> concentración existen numerosas fórmu<strong>la</strong>s empíricas, para el<br />
presente se ha utilizado <strong>la</strong> formu<strong>la</strong> <strong>de</strong> Kirpich, cuya ecuación es <strong>la</strong> siguiente:<br />
L<br />
TC 0.<br />
0195<br />
S<br />
0.<br />
77<br />
0.<br />
385<br />
Don<strong>de</strong>:<br />
T C = Tiempo <strong>de</strong> concentración (min).<br />
L = Longitud <strong>de</strong>l curso principal (m).<br />
S = Pendiente media <strong>de</strong>l curso principal (m/m).<br />
El tiempo <strong>de</strong> concentración <strong>de</strong> <strong>la</strong>s cuencas <strong>de</strong> los <strong>río</strong>s Huancané y Suches son <strong>de</strong> 20.4 y<br />
26.0 horas. Para <strong>la</strong>s unida<strong>de</strong>s hidrográficas <strong>de</strong> nivel cinco (subcuencas) <strong>de</strong> <strong>la</strong>s cuencas<br />
Huancané y Suches se muestran en los Cuadros Nº 3.10 y 3.11.<br />
En los Cuadros Nº 3.10 y 3.11 se presenta el resumen <strong>de</strong> los parámetros geomorfológicos<br />
<strong>de</strong> <strong>la</strong>s cuencas <strong>de</strong> los <strong>río</strong>s Huancané y Suches.<br />
MINAG-ANA-DCPRH-AGUAS SUPERFICIALES Pág.62
PARÁMETROS DE FORMA DE LA CUENCA<br />
PARÁMETROS DE LA RED HIDROGRÁFICA DE LA CUENCA PARÁMETROS DE RELIEVE DE LA CUENCA<br />
<strong>Estudio</strong> <strong>Hidrológico</strong> <strong>de</strong> <strong>la</strong>s <strong>Cuenca</strong>s Huancané y Suches 2010<br />
Área total <strong>de</strong> <strong>la</strong> <strong>Cuenca</strong><br />
Perímetro <strong>de</strong> <strong>la</strong> cuenca<br />
Frecuencia <strong>de</strong> <strong>de</strong>nsidad <strong>de</strong> los <strong>río</strong>s<br />
Densidad <strong>de</strong> drenaje<br />
Cuadro N° 3.10 Parámetros geomorfológicos <strong>de</strong> <strong>la</strong> cuenca Huancané<br />
CUENCA<br />
Huancané<br />
Bajo<br />
Huancané<br />
Tramo Río Huancané<br />
MINAG-ANA-DCPRH-AGUAS SUPERFICIALES Pág.63<br />
L<strong>la</strong>che<br />
Río L<strong>la</strong>che<br />
Medio Bajo<br />
Huancané<br />
Tramo Río Huancane<br />
Tuyto<br />
Río Tuyto<br />
Medio<br />
Huancané<br />
Río Putina<br />
Muñani<br />
Río Muñani<br />
Medio Alto<br />
Huancané<br />
Río Pongongoni<br />
Pistune<br />
Río Pistune<br />
Alto<br />
Huancané<br />
O178 O1781 O1782 O1783 O1784 O1785 O1786 O1787 O1788 O1789<br />
km2 3631.19 246.41 161.93 47.94 1107.11 231.07 889.44 42.09 380.43 524.77<br />
km 421.97 82.84 68.63 40.09 207.25 89.12 180.65 27.58 99.54 116.55<br />
km 142.05 29.99 40.42 10.09 94.17 36.46 71.58 16.17 52.53 49.34<br />
Or<strong>de</strong>n 1 km 1393.90 53.68 73.28 22.49 475.68 80.25 352.97 15.69 125.64 194.22<br />
Or<strong>de</strong>n 2 km 508.31 27.12 19.27 5.55 180.71 31.54 125.42 4.90 39.61 74.19<br />
Or<strong>de</strong>n 3 km 297.65 14.28 13.09 2.03 67.31 9.07 82.48 0.00 71.99 37.40<br />
Or<strong>de</strong>n 4 km 166.45 0.00 28.21 0.00 77.27 0.00 40.57 0.00 4.67 15.73<br />
Or<strong>de</strong>n 5 km 104.77 0.00 0.00 0.00 48.59 0.00 18.96 0.00 9.07 28.15<br />
Or<strong>de</strong>n 6 km 92.71 29.99 0.00 10.09 0.00 36.46 0.00 16.17 0.00 0.00<br />
Longitud total km 2563.79 125.07 133.85 40.16 849.56 157.32 620.40 36.76 250.98 349.69<br />
km 25.56 8.22 4.01 4.75 11.76 6.34 12.43 2.60 7.24 10.64<br />
- 1.97 1.49 1.52 1.63 1.76 1.65 1.71 1.20 1.44 1.43<br />
- 0.18 0.27 0.10 0.47 0.12 0.17 0.17 0.16 0.14 0.22<br />
Lado mayor km 192.080 34.219 28.666 17.269 91.529 38.569 79.077 9.230 40.339 47.144<br />
Lado menor km 18.905 7.201 5.649 2.776 12.096 5.991 11.248 4.560 9.431 11.131<br />
km 0.26 0.45 0.43 0.37 0.32 0.37 0.34 0.70 0.48 0.49<br />
- <br />
- <br />
msnm 4212.00 3942.00 4073.00 3984.00 4121.00 4042.00 4388.00 3964.00 4184.00 4414.00<br />
msnm 4147.00 3879.00 4014.00 3970.00 4087.00 4003.00 4462.00 3937.00 4117.00 4439.00<br />
km2 1815.60 123.21 80.97 23.97 553.56 115.54 444.72 21.05 190.22 262.39<br />
msnm 3850-3950 3806-3850 3850-3900 3835-3900 3850-3950 3850-3900<br />
3855-3950<br />
3855-3900<br />
4600-4750<br />
3868-3900 4400-4750<br />
Altitud máxima msnm 5100.00 4550.00 4750.00 4350.00 4950.00 4550.00 5050.00 4300.00 4900.00 5100.00<br />
Altutud mínima msnm 3806.00 3806.00 3835.00 3835.00 3842.00 3842.00 3855.00 3855.00 3868.00 3868.00<br />
Pendiente media m/m 0.0067 0.0217 0.0319 0.0298 0.0121 0.0184 0.0151 0.0482 0.0256 0.0261<br />
Número <strong>de</strong> <strong>río</strong>s<br />
Extensión media <strong>de</strong>l escurrimiento superficial<br />
Cotas <strong>de</strong>l <strong>río</strong> principal<br />
PARÁMETROS<br />
Longitud total <strong>de</strong> los <strong>río</strong>s <strong>de</strong><br />
diferentes grados<br />
Ancho promedio <strong>de</strong> <strong>la</strong> cuenca<br />
Coeficiente <strong>de</strong> compacidad<br />
Fartor <strong>de</strong> forma<br />
Rectángulo equivalente<br />
Radio <strong>de</strong> Circu<strong>la</strong>ridad<br />
Tiempo <strong>de</strong> concentración<br />
Código Pfafstetter<br />
Longitud <strong>de</strong>l <strong>río</strong> principal<br />
Curva hipsométrica<br />
Polígonos <strong>de</strong> frecuencia <strong>de</strong> altitu<strong>de</strong>s<br />
Altitud media <strong>de</strong> <strong>la</strong> cuenca<br />
Altitud <strong>de</strong> frecuencia media<br />
Área por encima <strong>de</strong> frecuencia media<br />
Altitud más frecuente<br />
Pendiente media <strong>de</strong> <strong>la</strong> cuenca<br />
Índice <strong>de</strong> pendiente <strong>de</strong> <strong>la</strong> cuenca<br />
Coeficiente <strong>de</strong> masividad<br />
Coeficiente orográfico<br />
Coeficiente <strong>de</strong> torrencialidad<br />
Tipo <strong>de</strong> corriente<br />
Número <strong>de</strong> or<strong>de</strong>n <strong>de</strong> los <strong>río</strong>s<br />
Pendiente media <strong>de</strong>l <strong>río</strong> principal<br />
Altura media <strong>de</strong>l <strong>río</strong> principal<br />
UNIDAD<br />
DE<br />
MEDIDA<br />
SUBCUENCAS<br />
Rio Principal<br />
- 0.0742 0.1186 0.1609 0.1554 0.0950 0.1224 0.1144 0.1929 0.1493 0.1513<br />
- 0.0004 0.0080 0.0075 0.0249 0.0012 0.0064 0.0016 0.0272 0.0040 0.0029<br />
- 0.0006 0.0158 0.0091 0.0297 0.0016 0.0094 0.0023 0.0311 0.0061 0.0044<br />
- 0.19 0.09 0.23 0.15 0.23 0.16 0.19 0.19 0.16 0.18<br />
- Perenne Perenne Perenne Perenne Perenne Perenne Perenne Perenne Perenne Perenne<br />
Or<strong>de</strong>n 1 - 692 23 37 7 259 36 168 8 60 94<br />
Or<strong>de</strong>n 2 - 173 6 10 2 65 9 41 3 14 23<br />
Or<strong>de</strong>n 3 - 39 2 3 1 12 2 8 0 4 7<br />
Or<strong>de</strong>n 4 - 12 0 1 0 3 0 4 0 2 2<br />
Or<strong>de</strong>n 5 - 4 0 0 0 1 0 1 0 1 1<br />
Or<strong>de</strong>n 6 - 1 1 0 1 0 1 0 1 0 0<br />
Nº total <strong>de</strong> <strong>río</strong>s - 921 32 51 11 340 48 222 12 81 127<br />
Grado <strong>de</strong> ramificación - 6 6 4 6 5 6 5 6 5 5<br />
<strong>río</strong>s/km2 0.25 0.13 0.31 0.23 0.31 0.21 0.25 0.29 0.21 0.24<br />
km/km2 0.71 0.51 0.83 0.84 0.77 0.68 0.70 0.87 0.66 0.67<br />
km2/km 1.42 1.97 1.21 1.19 1.30 1.47 1.43 1.14 1.52 1.50<br />
Altitud máxima msnm 4800.00 3835.00 4660.00 3842.00 4300.00 3855.00 4760.00 3868.00 4750.00 4800.00<br />
Altitud mínima msnm 3806.00 3806.00 3835.00 3835.00 3842.00 3842.00 3855.00 3855.00 3868.00 3868.00<br />
m/m 0.0070 0.0010 0.0204 0.0007 0.0049 0.0004 0.0126 0.0008 0.0168 0.0189<br />
msnm 4303.00 3820.50 4247.50 3838.50 4071.00 3848.50 4307.50 3861.50 4309.00 4334.00<br />
horas 20.40 13.00 5.10 6.40 17.00 21.50 9.60 8.80 6.80 6.20<br />
Río Puncune
PARÁMETROS DE FORMA DE LA CUENCA<br />
PARÁMETROS DE LA RED HIDROGRÁFICA DE LA CUENCAPARÁMETROS DE RELIEVE DE LA CUENCA<br />
<strong>Estudio</strong> <strong>Hidrológico</strong> <strong>de</strong> <strong>la</strong>s <strong>Cuenca</strong>s Huancané y Suches 2010<br />
Área total <strong>de</strong> <strong>la</strong> <strong>Cuenca</strong><br />
Perímetro <strong>de</strong> <strong>la</strong> cuenca<br />
Ancho promedio <strong>de</strong> <strong>la</strong> cuenca<br />
Coeficiente <strong>de</strong> compacidad<br />
Fartor <strong>de</strong> forma<br />
Frecuencia <strong>de</strong> <strong>de</strong>nsidad <strong>de</strong> los <strong>río</strong>s<br />
Densidad <strong>de</strong> drenaje<br />
Cuadro N° 3.11 Parámetros geomorfológicos <strong>de</strong> <strong>la</strong> cuenca Suches<br />
Chueña Huata<br />
Jahuira<br />
Confluencia<br />
con <strong>río</strong><br />
Suches<br />
Caylloma Trapiche Suches (Perú) Suches Suches Suches<br />
Confluencia<br />
con <strong>río</strong><br />
Suches<br />
Confluencia<br />
con <strong>río</strong><br />
Suches<br />
Lugar<br />
Cuchaul<strong>la</strong><br />
MINAG-ANA-DCPRH-AGUAS SUPERFICIALES Pág.64<br />
Puente<br />
Ramón<br />
Castil<strong>la</strong><br />
Lugar<br />
Cuchaul<strong>la</strong><br />
Puente<br />
Escoma<br />
km2 162.18 289.22 405.45 303.90 1056.49 2222.07 2930.73<br />
km 85.69 93.76 104.23 218.71 176.60 262.24 384.57<br />
km 36.76 40.24 38.63 80.33 55.77 118.96 188.00<br />
Or<strong>de</strong>n 1 km 44.63 118.34 116.09 - - - -<br />
Or<strong>de</strong>n 2 km 21.77 53.73 47.72 - - - -<br />
Or<strong>de</strong>n 3 km 26.32 20.35 29.91 - - - -<br />
Or<strong>de</strong>n 4 km 3.65 9.95 18.66 - - - -<br />
Or<strong>de</strong>n 5 km 0.00 0.00 0.00 - - - -<br />
Longitud total km 96.37 202.37 212.38 - - - -<br />
km 4.41 7.19 10.50 3.78 18.94 18.68 15.59<br />
- 1.90 1.55 1.46 3.54 1.53 1.57 2.00<br />
- 0.12 0.18 0.27 0.05 0.34 0.16 0.08<br />
Lado mayor km 38.649 39.571 42.597 106.502 74.029 111.124 175.595<br />
Lado menor km 4.196 7.309 9.518 2.853 14.271 19.996 16.690<br />
km 0.28 0.41 0.47 0.08 0.43 0.41 0.25<br />
- - - - -<br />
- - - - -<br />
msnm 4447.00 4583.00 4780.00 - - -<br />
msnm 4412.00 4563.00 4760.00 - - -<br />
km2 81.09 144.61 202.73 151.95 528.25 1111.04 1465.37<br />
msnm 4325-4350 4350-4400 4550-4900 - - - -<br />
Altitud máxima msnm 4800.00 5050.00 5829.00 - - - -<br />
Altutud mínima msnm 4325.00 4344.00 4399.00 - - - -<br />
Pendiente media m/m 0.0123 0.0178 0.0336 - - - -<br />
Número <strong>de</strong> <strong>río</strong>s<br />
Extensión media <strong>de</strong>l escurrimiento superficial<br />
Cotas <strong>de</strong>l <strong>río</strong> principal<br />
PARÁMETROS<br />
Longitud <strong>de</strong>l <strong>río</strong> principal<br />
Longitud total <strong>de</strong> los <strong>río</strong>s <strong>de</strong><br />
diferentes grados<br />
Rectángulo equivalente<br />
Radio <strong>de</strong> Circu<strong>la</strong>ridad<br />
Curva hipsométrica<br />
Polígonos <strong>de</strong> frecuencia <strong>de</strong> altitu<strong>de</strong>s<br />
Altitud media <strong>de</strong> <strong>la</strong> cuenca<br />
Altitud <strong>de</strong> frecuencia media<br />
Área por encima <strong>de</strong> frecuencia media<br />
Altitud más frecuente<br />
Pendiente media <strong>de</strong> <strong>la</strong> cuenca<br />
Índice <strong>de</strong> pendiente <strong>de</strong> <strong>la</strong> cuenca<br />
Coeficiente <strong>de</strong> masividad<br />
Coeficiente orográfico<br />
Coeficiente <strong>de</strong> torrencialidad<br />
Tipo <strong>de</strong> corriente<br />
Número <strong>de</strong> or<strong>de</strong>n <strong>de</strong> los <strong>río</strong>s<br />
Pendiente media <strong>de</strong>l <strong>río</strong> principal<br />
Altura media <strong>de</strong>l <strong>río</strong> principal<br />
Tiempo <strong>de</strong> concentración<br />
UNIDAD<br />
DE<br />
MEDIDA<br />
SUBCUENCA CUENCA<br />
Punto <strong>de</strong> control<br />
- 0.0961 0.1254 0.1500 - - - -<br />
- 0.0104 0.0049 0.0047 - - - -<br />
- 0.0175 0.0070 0.0090 - - - -<br />
- 0.17 0.11 0.12 - - - -<br />
- Perenne Perenne Perenne Perenne Perenne Perenne Perenne<br />
Or<strong>de</strong>n 1 - 28 33 49 - - - -<br />
Or<strong>de</strong>n 2 - 6 12 12 - - - -<br />
Or<strong>de</strong>n 3 - 3 2 4 - - - -<br />
Or<strong>de</strong>n 4 - 1 1 1 - - - -<br />
Or<strong>de</strong>n 5 - 0 0 0 - - - -<br />
Nº total <strong>de</strong> <strong>río</strong>s - 38 48 66 - - - -<br />
Grado <strong>de</strong> ramificación - 4 4 4 5 5 5 5<br />
<strong>río</strong>s/km2 0.23 0.17 0.16 - - - -<br />
km/km2 0.59 0.70 0.52 - - - -<br />
km2/km 1.68 1.43 1.91 - - - -<br />
Altitud máxima msnm 4704.00 4850.00 5031.00 4399.00 5031.00 5031.00 5031.00<br />
Altitud mínima msnm 4325.00 4344.00 4399.00 4250.00 4339.00 4250.00 3817.00<br />
m/m 0.0103 0.0126 0.0164 0.0019 0.0124 0.0066 0.0065<br />
msnm 4514.50 4597.00 4715.00 4324.50 4685.00 4640.50 4424.00<br />
horas 6.20 6.10 5.40 21.70 8.00 18.20 26.00<br />
Cuadro N° 3.12 Parámetros geomorfológicos <strong>de</strong> <strong>la</strong>s subcuencas Guanaco y Yaputira<br />
Parámetros físicos <strong>de</strong> <strong>la</strong> cuenca<br />
Río Guanaco<br />
(Vaso Cal<strong>la</strong>tomaza)<br />
Subcuenca<br />
Río Yaputira<br />
(Vaso Yaputira)<br />
Área (km2) 216.75 228.24<br />
Perímetro (km) 77.52 85.50<br />
Longitud <strong>de</strong>l <strong>río</strong> principal (km) 24.34 27.86<br />
Altitud máxima <strong>de</strong>l <strong>río</strong> principal (msnm) 4760.00 4300.00<br />
Altitud mínima <strong>de</strong>l <strong>río</strong> principal (msnm) 4154.00 3980.00<br />
Pendiente media <strong>de</strong>l <strong>río</strong> principal (m/m) 0.0249 0.0115
<strong>Estudio</strong> <strong>Hidrológico</strong> <strong>de</strong> <strong>la</strong>s <strong>Cuenca</strong>s Huancané y Suches 2010<br />
3.6 ECOLOGÍA<br />
En <strong>la</strong>s cuencas <strong>de</strong> los <strong>río</strong>s Huancané y Suches se han i<strong>de</strong>ntificado cuatro (4) y tres (3)<br />
zonas <strong>de</strong> vida ecológica, con predominio <strong>de</strong>l páramo muy húmedo subalpino subtropical<br />
(pmh-SaS), que ocupa 52.41% <strong>de</strong>l total <strong>de</strong> <strong>la</strong> superficie <strong>de</strong> <strong>la</strong> cuenca Huancané y 71.18%<br />
en <strong>la</strong> cuenca Suches (ver Cuadros Nº 3.13 y 3.14). En los Mapas Nº 3.13 y 3.14 se<br />
muestran <strong>la</strong> distribución espacial <strong>de</strong> <strong>la</strong>s zonas <strong>de</strong> vida en <strong>la</strong> cuenca <strong>de</strong>l <strong>río</strong> Huancané y<br />
Suches. A continuación se <strong>de</strong>scriben en forma breve cada una <strong>de</strong> <strong>la</strong>s zonas <strong>de</strong> vida.<br />
<strong>Cuenca</strong> Huancané<br />
1) Nival Subtropical (NS)<br />
Es <strong>la</strong> zona <strong>de</strong> vida <strong>de</strong> menor representatividad en <strong>la</strong> cuenca <strong>de</strong>l <strong>río</strong> Huancané, que ocupa<br />
una extensión superficial <strong>de</strong> 34.80 km 2 y representa el 0.96% <strong>de</strong>l área total <strong>de</strong> <strong>la</strong> cuenca. Se<br />
distribuye entre los 4,800 a 4,950 msnm <strong>de</strong> altitud, posee un clima súper húmedo muy f<strong>río</strong>,<br />
con temperatura media anual entre 4.5 a 5.2°C, precipitación media anual entre 650 a 700<br />
mm, humedad re<strong>la</strong>tiva media anual entre 50 a 84% y <strong>la</strong> evapotranspiración potencial media<br />
anual entre 960 a 1440 mm. La cubierta vegetal es escasa, observándose en forma muy<br />
esparcida matas <strong>de</strong> gramíneas altoandinas, tayas y algunas cactáceas. Las condiciones<br />
topográficas y ecológicas son factores que limitan toda actividad antrópica <strong>de</strong>ntro <strong>de</strong> esta<br />
zona <strong>de</strong> vida.<br />
2) Bosque húmedo montano bajo subtropical (bh-MBS)<br />
Es <strong>la</strong> segunda zona <strong>de</strong> vida representativa <strong>de</strong> <strong>la</strong> cuenca <strong>de</strong>l <strong>río</strong> Huancané, ocupa una<br />
superficie <strong>de</strong> 1,517.37 km 2 , representa el 41.79% <strong>de</strong>l área total <strong>de</strong> <strong>la</strong> cuenca. Se distribuye<br />
entre <strong>la</strong>s cotas 3,806 a 4,100 msnm, posee un clima semiárido- f<strong>río</strong>, con temperatura media<br />
anual entre 6 a 8.5°C, precipitación media anual entre 625 a 900 mm, humedad re<strong>la</strong>tiva<br />
media anual entre 52% a 78% y <strong>la</strong> evapotranspiración potencial media anual entre 1000 a<br />
1440 mm. La cubierta vegetal está constituida por pastos naturales conformada por<br />
especies graminales altoandinas con una distribución regu<strong>la</strong>r, asociada con cactáceas. Las<br />
tierras <strong>de</strong> esta zona <strong>de</strong> vida son utilizadas para <strong>la</strong> actividad agríco<strong>la</strong> y el pastoreo <strong>de</strong>l<br />
ganado vacuno, ovino y camélidos sudamericanos.<br />
3) Páramo muy húmedo subalpino subtropical (pmh-SaS)<br />
Es <strong>la</strong> primera zona <strong>de</strong> vida ecológica representativa <strong>de</strong> <strong>la</strong> cuenca <strong>de</strong>l <strong>río</strong> Huancané, que<br />
ocupa una superficie <strong>de</strong> 1,903.03 km 2 y representa el 52.41% <strong>de</strong>l área total <strong>de</strong> <strong>la</strong> cuenca. Se<br />
distribuye en los valles interandinos y <strong>la</strong><strong>de</strong>ras <strong>de</strong> <strong>la</strong> cuenca entre <strong>la</strong>s altitu<strong>de</strong>s <strong>de</strong> 3,900 a<br />
5,050 msnm, posee un clima perhúmedo-f<strong>río</strong>, con temperatura media anual entre 5 a 8.5°C,<br />
precipitación media anual entre 675 a 900 mm, humedad re<strong>la</strong>tiva media anual entre 50 a<br />
82% y <strong>la</strong> evapotranspiración potencial media anual entre 1000 a 1450 mm. La cubierta<br />
vegetal está conformada por una vegetación <strong>de</strong> pra<strong>de</strong>ra altoandina constituida por pastos<br />
naturales provenientes <strong>de</strong> diversas familias pero principalmente <strong>de</strong> <strong>la</strong> familia gramíneas; en<br />
general esta zona tiene una composición florística compleja y es más <strong>de</strong>nsamente pob<strong>la</strong>da.<br />
Las tierras <strong>de</strong> esta zona <strong>de</strong> vida son utilizadas para el pastoreo <strong>de</strong>l ganado ovino, vacuno y<br />
camélidos sudamericanos.<br />
MINAG-ANA-DCPRH-AGUAS SUPERFICIALES Pág.65
<strong>Estudio</strong> <strong>Hidrológico</strong> <strong>de</strong> <strong>la</strong>s <strong>Cuenca</strong>s Huancané y Suches 2010<br />
Mapa Nº 3.13 Mapa ecológico <strong>de</strong> <strong>la</strong> cuenca <strong>de</strong>l <strong>río</strong> Huancané<br />
MINAG-ANA-DCPRH-AGUAS SUPERFICIALES Pág.66
<strong>Estudio</strong> <strong>Hidrológico</strong> <strong>de</strong> <strong>la</strong>s <strong>Cuenca</strong>s Huancané y Suches 2010<br />
4) Tundra pluvial alpino subtropical (tp-AS)<br />
Esta zona <strong>de</strong> vida ocupa una extensión superficial <strong>de</strong> 175.99 km 2 y representa el 4.85% <strong>de</strong>l<br />
área <strong>de</strong> <strong>la</strong> cuenca. Se distribuye entre <strong>la</strong>s altitu<strong>de</strong>s <strong>de</strong> 4,650 a 5,000 msnm, posee un clima<br />
súperhúmedo-muy f<strong>río</strong>, con temperatura media anual entre 5 a 8.5°C, precipitación media<br />
anual entre 650 a 710 mm, humedad re<strong>la</strong>tiva media anual entre 50 a 84% y <strong>la</strong><br />
evapotranspiración potencial media anual entre 980 a 1450 mm. La cubierta vegetal lo<br />
conforma una vegetación típica <strong>de</strong> pra<strong>de</strong>ra altoandina, constituida por pastos naturales,<br />
principalmente <strong>de</strong> <strong>la</strong> familia <strong>de</strong> gramíneas con distribución regu<strong>la</strong>r. Las tierras <strong>de</strong> esta zona<br />
<strong>de</strong> vida son utilizadas para el pastoreo <strong>de</strong> auquénidos, ovinos y camélidos sudamericanos.<br />
Símbolo<br />
Cuadro Nº 3.13 Características ecológicas <strong>de</strong> <strong>la</strong> cuenca <strong>de</strong>l <strong>río</strong> Huancané<br />
(km2) (%)<br />
NS Nival Subtropical 34.80 0.96<br />
bh-MBS bosque humedo Montano Bajo Subtropical. 1517.37 41.79<br />
pmh-SaS paramo muy humedo Subalpino Subtropical. 1903.03 52.41<br />
<strong>Cuenca</strong> Suches<br />
tp-AS tundra pluvial Alpino Subtropical. 175.99 4.85<br />
Total<br />
1) Nival Subtropical (NS)<br />
Descripción<br />
3631.19 100.00<br />
Es <strong>la</strong> zona <strong>de</strong> vida <strong>de</strong> menor representatividad en <strong>la</strong> cuenca <strong>de</strong>l <strong>río</strong> Suches, que ocupa una<br />
superficie <strong>de</strong> 75.54 km 2 y representa el 6.59% <strong>de</strong>l área total <strong>de</strong> <strong>la</strong> cuenca. Se distribuye<br />
entre los 4,600 a 5,200 msnm <strong>de</strong> altitud, posee un clima súper húmedo muy f<strong>río</strong>, con<br />
temperatura media anual entre 3 a 5°C, precipitación media anual entre 475 a 675 mm,<br />
humedad re<strong>la</strong>tiva media anual entre 80 a 84% y <strong>la</strong> evapotranspiración potencial media<br />
anual entre 860 a 970 mm. La cubierta vegetal es escasa, observándose en forma muy<br />
esparcida matas <strong>de</strong> gramíneas altoandinas, tayas y algunas cactáceas. Las condiciones<br />
topográficas y ecológicas son factores que limitan toda actividad antrópica <strong>de</strong>ntro <strong>de</strong> esta<br />
zona <strong>de</strong> vida.<br />
2) Páramo muy húmedo subalpino subtropical (pmh-SaS)<br />
Es <strong>la</strong> primera zona <strong>de</strong> vida ecológica representativa <strong>de</strong> <strong>la</strong> cuenca <strong>de</strong>l <strong>río</strong> Suches, que ocupa<br />
una superficie <strong>de</strong> 826.24 km 2 y representa el 71.18% <strong>de</strong>l área total <strong>de</strong> <strong>la</strong> cuenca. Se<br />
distribuye en los valles interandinos y <strong>la</strong><strong>de</strong>ras <strong>de</strong> <strong>la</strong> cuenca entre <strong>la</strong>s altitu<strong>de</strong>s <strong>de</strong> 4,250 a<br />
5,150 msnm, posee un clima perhúmedo-f<strong>río</strong>, con temperatura media anual entre 3.3 a<br />
9.0°C, precipitación media anual entre 500 a 925 mm, humedad re<strong>la</strong>tiva media anual entre<br />
62 a 84% y <strong>la</strong> evapotranspiración potencial media anual entre 900 a 1280 mm. La cubierta<br />
vegetal está conformada por una vegetación <strong>de</strong> pra<strong>de</strong>ra altoandina constituida por pastos<br />
naturales provenientes <strong>de</strong> diversas familias pero principalmente <strong>de</strong> <strong>la</strong> familia gramíneas; en<br />
general esta zona tiene una composición florística compleja y es más <strong>de</strong>nsamente pob<strong>la</strong>da.<br />
Las tierras <strong>de</strong> esta zona <strong>de</strong> vida son utilizadas para el pastoreo <strong>de</strong>l ganado ovino, vacuno y<br />
camélidos sudamericanos.<br />
MINAG-ANA-DCPRH-AGUAS SUPERFICIALES Pág.67<br />
Área
<strong>Estudio</strong> <strong>Hidrológico</strong> <strong>de</strong> <strong>la</strong>s <strong>Cuenca</strong>s Huancané y Suches 2010<br />
Mapa Nº 3.14 Mapa ecológico <strong>de</strong> <strong>la</strong> cuenca <strong>de</strong>l <strong>río</strong> Suches (Perú)<br />
MINAG-ANA-DCPRH-AGUAS SUPERFICIALES Pág.68
<strong>Estudio</strong> <strong>Hidrológico</strong> <strong>de</strong> <strong>la</strong>s <strong>Cuenca</strong>s Huancané y Suches 2010<br />
3) Tundra pluvial alpino subtropical (tp-AS)<br />
Es <strong>la</strong> segunda zona <strong>de</strong> vida representativa <strong>de</strong> <strong>la</strong> cuenca, que ocupa una extensión<br />
superficial <strong>de</strong> 257.97 km 2 y representa el 22.22% <strong>de</strong>l área <strong>de</strong> <strong>la</strong> cuenca. Se distribuye entre<br />
<strong>la</strong>s altitu<strong>de</strong>s <strong>de</strong> 4,600 a 5,829 msnm, posee un clima súperhúmedo-muy f<strong>río</strong>, con<br />
temperatura media anual entre 2.5 a 5°C, precipitación media anual entre 400 a 700 mm,<br />
humedad re<strong>la</strong>tiva media anual entre 80 a 84%, y <strong>la</strong> evapotranspiración potencial media<br />
anual entre 840 a 980 mm. La cubierta vegetal lo conforma una vegetación típica <strong>de</strong><br />
pra<strong>de</strong>ra altoandina, constituida por pastos naturales, principalmente <strong>de</strong> <strong>la</strong> familia <strong>de</strong><br />
gramíneas con distribución regu<strong>la</strong>r. Las tierras <strong>de</strong> esta zona <strong>de</strong> vida son utilizadas para el<br />
pastoreo <strong>de</strong> auquénidos, ovinos y camélidos sudamericanos.<br />
Cuadro Nº 3.14 Características ecológicas <strong>de</strong> <strong>la</strong> cuenca <strong>de</strong>l <strong>río</strong> Suches (Perú)<br />
Símbolo Descripción<br />
(km2) (%)<br />
NS Nival Subtropical 76.54 6.59<br />
pmh-SaS paramo muy humedo Subalpino Subtropical. 826.24 71.18<br />
tp-AS tundra pluvial Alpino Subtropical. 257.97 22.22<br />
3.7 GEOLOGÍA<br />
Total<br />
1160.75 100.00<br />
Para <strong>la</strong> <strong>de</strong>scripción geológica <strong>de</strong> <strong>la</strong>s cuencas <strong>de</strong> los <strong>río</strong>s Huancané y Suches, se ha tomado<br />
como referencia <strong>la</strong>s cartas geológicas, <strong>de</strong>l Instituto <strong>de</strong> Geología Minera <strong>de</strong> 1975 (Fuente:<br />
Dirección General <strong>de</strong> Asuntos Ambientales <strong>de</strong>l Ministerio <strong>de</strong> Agricultura), para lo cual se<br />
han encontrado 19 y 12 tipos <strong>de</strong> geología para <strong>la</strong>s cuencas Huancané y Suches, ubicadas en<br />
diferentes zonas <strong>de</strong> <strong>la</strong>s cuencas <strong>de</strong> estudio, a continuación se <strong>de</strong>scriben en forma general.<br />
En los Cuadros Nº 3.15 y 3.16 se muestran <strong>la</strong>s características geológicas, y en los Mapas<br />
Nº 3.15 y 3.16 <strong>la</strong> distribución espacial <strong>de</strong> <strong>la</strong>s formaciones geológicas en <strong>la</strong>s cuencas <strong>de</strong> los<br />
<strong>río</strong>s Huancané y Suches.<br />
<strong>Cuenca</strong> Huancané<br />
1) Formación Chupa (Ki.chu)<br />
Se extien<strong>de</strong> en una superficie <strong>de</strong> 20.79 km 2 y representa el 0.57% <strong>de</strong>l área total <strong>de</strong> <strong>la</strong><br />
cuenca <strong>de</strong>l <strong>río</strong> Huancané. Esta formación geológica se localiza en <strong>la</strong> zona alta <strong>de</strong> <strong>la</strong> cuenca<br />
Huancané, ubicados en su mayoría en <strong>la</strong> zona alta <strong>de</strong>l <strong>río</strong> Palca y Guanaco en <strong>la</strong> subcuenca<br />
Muñani y una menor parte se ubica en <strong>la</strong> zona alta <strong>de</strong>l <strong>río</strong> Toco Toco <strong>de</strong> <strong>la</strong> subcuenca Alto<br />
Huancané. La formación Chupa correspon<strong>de</strong> a <strong>la</strong> era mesozoico, sistema cretáceo y serie<br />
inferior.<br />
2) Formación Huancané (Ki-hu)<br />
El nombre <strong>de</strong> esta formación fue introducido por NEWELL (1945, 1949) dando una buena<br />
sección tipo.<br />
MINAG-ANA-DCPRH-AGUAS SUPERFICIALES Pág.69<br />
Área
<strong>Estudio</strong> <strong>Hidrológico</strong> <strong>de</strong> <strong>la</strong>s <strong>Cuenca</strong>s Huancané y Suches 2010<br />
La formación es dividida en tres unida<strong>de</strong>s litológicas principales; conglomerados con<br />
estratificación <strong>de</strong> canal que generalmente yacen en <strong>la</strong> parte media <strong>de</strong> <strong>la</strong> secuencia;<br />
areniscas cuarzosas con estratificación cruzada, con conjuntos asintóticos arreg<strong>la</strong>dos en<br />
unida<strong>de</strong>s <strong>de</strong> 2 a 5 m <strong>de</strong> grosor; y areniscas <strong>la</strong>josas con estratificación <strong>de</strong> canal con<br />
conjuntos <strong>de</strong> menos <strong>de</strong> 2 m <strong>de</strong> grosor. La presencia ubicua <strong>de</strong> capas cruzadas es usada para<br />
<strong>de</strong>terminar <strong>la</strong> po<strong>la</strong>ridad <strong>de</strong> <strong>la</strong>s capas en <strong>la</strong> mayoría <strong>de</strong> <strong>la</strong> exposiciones.<br />
Las capas <strong>de</strong> conglomerados contienen c<strong>la</strong>stos bien redon<strong>de</strong>ados <strong>de</strong> cuarcita b<strong>la</strong>nca, gris y<br />
marrón y venas <strong>de</strong> cuarzo hasta <strong>de</strong> 3 cm <strong>de</strong> diámetro. Es más probable que se <strong>de</strong>riven <strong>de</strong>l<br />
basamento paleozoico que <strong>de</strong> rocas jurásicas. Las areniscas son <strong>de</strong> grano medio a grueso,<br />
casi siempre bien sorteadas y varían <strong>de</strong> b<strong>la</strong>nquecino a marrón anaranjado-marrón rojizo y<br />
rosado <strong>de</strong>pendiendo, <strong>de</strong> <strong>la</strong> cantidad <strong>de</strong> óxido <strong>de</strong> fierro intersticial. Las rocas más<br />
ferruginosas son usualmente <strong>la</strong>s <strong>de</strong> grano más fino y ocurren en los 100 m superiores <strong>de</strong> <strong>la</strong><br />
formación. El cuarzo secundario como cemento tiene un efecto sobre <strong>la</strong>s características<br />
<strong>de</strong>bido a intemperismo: capas bien cementadas, usualmente en <strong>la</strong> parte basal <strong>de</strong> <strong>la</strong><br />
secuencia, tiene un afloramiento peñascoso, mientras que <strong>la</strong>s capas menos cementadas<br />
tienen una textura sacaroi<strong>de</strong>a y se <strong>de</strong>sgastan más fácilmente.<br />
Las secciones <strong>de</strong>lgadas <strong>de</strong> <strong>la</strong> Arenisca Huancané muestran que está constituída <strong>de</strong> cuarzo<br />
equigranu<strong>la</strong>r subredoncleado a subangu<strong>la</strong>r con menores cantida<strong>de</strong>s (menos <strong>de</strong>l 5%) <strong>de</strong><br />
microclina, fragmentos líticos <strong>de</strong> cuarzo mícrocristalino y granos <strong>de</strong> turmalina y zircón<br />
(menos <strong>de</strong> 1%). Algunas capas <strong>de</strong> carácter bimodal también contienen hasta 50% <strong>de</strong> cuarzo<br />
en granos muy bien redon<strong>de</strong>ados hasta <strong>de</strong> 0.5 mm <strong>de</strong> diámetro <strong>de</strong> un probable origen<br />
eólico. En rocas con cuarzo secundario como cemento, los granos tienen sobrecrecimientos<br />
<strong>de</strong> cuarzo en continuidad óptica.<br />
Esta formación geológica, abarca una superficie <strong>de</strong> 78.95 km 2 y representa 2.17% <strong>de</strong>l área<br />
total <strong>de</strong> <strong>la</strong> cuenca <strong>de</strong>l <strong>río</strong> Huancané. Se ubica en <strong>la</strong> zona alta y media <strong>de</strong> <strong>la</strong>s subcuencas<br />
Bajo Huancané, L<strong>la</strong>che, Medio Bajo Huancané y Medio Huancané. La formación<br />
Huancané correspon<strong>de</strong> a <strong>la</strong> era mesozoico, sistema cretáceo y serie inferior.<br />
3) Formación Muni (Ki-mun)<br />
La formación Muni ocupa una superficie <strong>de</strong> 226.42 km 2 y representa 6.24% <strong>de</strong>l área total<br />
<strong>de</strong> <strong>la</strong> cuenca <strong>de</strong>l <strong>río</strong> Huancané. Esta formación geológica se localiza en <strong>la</strong> zona baja, media<br />
y alta <strong>de</strong> <strong>la</strong> margen <strong>de</strong>recha <strong>de</strong>l cauce principal <strong>de</strong> <strong>la</strong> cuenca Huancané, ubicados en <strong>la</strong>s<br />
subcuencas Bajo Huancané, L<strong>la</strong>che, Tuyto y Muñani. La formación Muni correspon<strong>de</strong> a <strong>la</strong><br />
era mesozoico, sistema cretáceo y serie inferior.<br />
4) Formación Moho (Km-mo)<br />
Esta unidad <strong>de</strong> <strong>la</strong> sucesión fue <strong>de</strong>signada como „Grupo Moho”, por NEWELL (1945,<br />
1949). Esta formación <strong>de</strong>scansa en conformidad sobre <strong>la</strong> Arenisca Huancané con un<br />
cambio marcado en <strong>la</strong> litología en unos 4 ó 5 m pasando <strong>de</strong> dominantemente areniscosa a<br />
una secuencia limolítica y fangolítica <strong>de</strong> color rojo.<br />
La parte basal <strong>de</strong> <strong>la</strong> secuencia está dominada por sedimentos <strong>de</strong> color marrón rojizo <strong>de</strong><br />
grano fino y en <strong>la</strong> parte media es mayormente <strong>de</strong> imolita y fangolita color caqui gris y<br />
MINAG-ANA-DCPRH-AGUAS SUPERFICIALES Pág.70
<strong>Estudio</strong> <strong>Hidrológico</strong> <strong>de</strong> <strong>la</strong>s <strong>Cuenca</strong>s Huancané y Suches 2010<br />
marrón. Fangolitas calcáreas <strong>de</strong>lgadas con lignito alóctono, y capas con fósiles esparcidos<br />
se encuentran en esta parte media, aunque en muchas localida<strong>de</strong>s los sedimentos <strong>de</strong> grano<br />
fino, parecen ser cortados por una gruesa secuencia <strong>de</strong> areniscas con estratificación<br />
cruzada. Al tope <strong>de</strong> <strong>la</strong> secuencia se retorna a una litología compuesta <strong>de</strong> fangolitas y<br />
limolitas rojas.<br />
Fotogeológicamente no hay rasgos diagnósticos. Las características <strong>de</strong> <strong>la</strong>s unida<strong>de</strong>s<br />
areniscosas y fangolíticas <strong>de</strong> estratificación <strong>de</strong>lgada están marcadas por colinas <strong>de</strong> una<br />
coloración ligeramente más c<strong>la</strong>ra que son muy persistentes, algunas <strong>de</strong> el<strong>la</strong>s se pue<strong>de</strong>n<br />
trazar por varios kilómetros a lo <strong>la</strong>rgo <strong>de</strong>l rumbo.<br />
Esta formación geológica, abarca una superficie <strong>de</strong> 160.60 km 2 y representa 4.42% <strong>de</strong>l área<br />
total <strong>de</strong> <strong>la</strong> cuenca <strong>de</strong>l <strong>río</strong> Huancané. Se ubica en varias zonas en toda <strong>la</strong> cuenca, mas<br />
centradas en <strong>la</strong> zona medio bajo <strong>de</strong> <strong>la</strong> cuenca Huancané. La formación Moho correspon<strong>de</strong>n<br />
a <strong>la</strong> era mesozoico, sistema cretáceo y serie medio.<br />
5) Grupo Cotacucho (Ks-co)<br />
Pertenece a <strong>la</strong>s facies continentales sedimentarias, también a <strong>la</strong>s formaciones <strong>de</strong><br />
Vilquechico y Muñani, localmente con facies litoral. El área que abarca esta formación es<br />
<strong>de</strong> 735.67 km 2 y representa el 20.26% <strong>de</strong>l total <strong>de</strong> <strong>la</strong> cuenca. Se localiza en varias zonas <strong>de</strong><br />
<strong>la</strong> cuenca, más centrada en <strong>la</strong> subcuenca <strong>de</strong>l <strong>río</strong> Tuyto. Su existencia correspon<strong>de</strong> a <strong>la</strong> era<br />
mesozoico, sistema cretáceo y serie superior.<br />
6) Formación Muñani (Ks-mñ)<br />
Se extien<strong>de</strong> en una superficie <strong>de</strong> 145.92 km 2 y representa el 4.02% <strong>de</strong>l área total <strong>de</strong> <strong>la</strong><br />
cuenca <strong>de</strong>l <strong>río</strong> Huancané. Esta formación geológica se localiza generalmente en <strong>la</strong> zona<br />
alta <strong>de</strong> <strong>la</strong> cuenca Huancané, ubicados en su mayoría en <strong>la</strong> zona media y alta <strong>de</strong>l <strong>río</strong><br />
Guanaco en <strong>la</strong> subcuenca Muñani, una parte se ubica en <strong>la</strong> zona alta <strong>de</strong> <strong>la</strong> margen <strong>de</strong>recha<br />
<strong>de</strong>l <strong>río</strong> principal <strong>de</strong> <strong>la</strong> subcuenca Medio Huancané y otra menor parte se ubica en <strong>la</strong> zona<br />
alta <strong>de</strong>l <strong>río</strong> Achucachi <strong>de</strong> <strong>la</strong> subcuenca Tuyto. La formación Muñani correspon<strong>de</strong> a <strong>la</strong> era<br />
mesozoico, sistema cretáceo y serie superior.<br />
7) Formación Vilquechico (Ks-vq)<br />
Esta formación geológica ocupa una superficie <strong>de</strong> 727.12 km 2 y representa el 20.02% <strong>de</strong>l<br />
área total <strong>de</strong> <strong>la</strong> cuenca <strong>de</strong>l <strong>río</strong> Huancané. Se localiza en diferentes áreas <strong>de</strong> <strong>la</strong> zona baja,<br />
media y alta <strong>de</strong> <strong>la</strong> cuenca Huancané; centrada en su mayoría en <strong>la</strong> zona media y alta <strong>de</strong> <strong>la</strong><br />
subcuenca <strong>de</strong>l <strong>río</strong> Tuyto, zona alta <strong>de</strong> <strong>la</strong> margen izquierda <strong>de</strong>l <strong>río</strong> principal <strong>de</strong> <strong>la</strong> subcuenca<br />
Bajo Huancané, una parte en <strong>la</strong> subcuenca Medio Huancané, margen izquierda <strong>de</strong> <strong>la</strong><br />
subcuenca <strong>de</strong>l <strong>río</strong> Pistune, zona alta entre los <strong>río</strong>s Alvarizani y Toco Toco en <strong>la</strong> subcuenca<br />
Alto Huancané, mayor área cubierta en <strong>la</strong> subcuenca Medio Huancané (<strong>río</strong> Pongongoni) y<br />
una parte en <strong>la</strong> zona baja <strong>de</strong> <strong>la</strong> subcuenca <strong>de</strong>l <strong>río</strong> Muñani. La formación Vilquechico<br />
correspon<strong>de</strong> a <strong>la</strong> era mesozoico, sistema cretáceo y serie superior.<br />
MINAG-ANA-DCPRH-AGUAS SUPERFICIALES Pág.71
<strong>Estudio</strong> <strong>Hidrológico</strong> <strong>de</strong> <strong>la</strong>s <strong>Cuenca</strong>s Huancané y Suches 2010<br />
8) Formación Ananea (Pi-a)<br />
Abarca una superficie <strong>de</strong> 72.76 km 2 y representa el 2.0% <strong>de</strong>l área total <strong>de</strong> <strong>la</strong> cuenca <strong>de</strong>l <strong>río</strong><br />
Huancané. Esta formación geológica se localiza generalmente en <strong>la</strong> zona alta <strong>de</strong> <strong>la</strong> cuenca<br />
Huancané, ubicado en su totalidad en <strong>la</strong> zona media <strong>de</strong> <strong>la</strong> subcuenca Alto Huancané,<br />
centrada <strong>la</strong> mayor área en <strong>la</strong> margen <strong>de</strong>recha <strong>de</strong>l <strong>río</strong> Ticani. La formación Ananea<br />
correspon<strong>de</strong> a <strong>la</strong> era paleozoico y serie inferior.<br />
9) Formación Chacrapi (Pi-ch)<br />
Se extien<strong>de</strong> en una superficie <strong>de</strong> 85.85 km 2 y representa el 2.36% <strong>de</strong>l área total <strong>de</strong> <strong>la</strong><br />
cuenca <strong>de</strong>l <strong>río</strong> Huancané. La formación geológica se localiza generalmente en <strong>la</strong> zona alta<br />
<strong>de</strong> <strong>la</strong> cuenca Huancané, ubicado en su totalidad en <strong>la</strong> zona alta <strong>de</strong> <strong>la</strong> subcuenca Muñani y<br />
en ésta centradas en <strong>la</strong> parte alta <strong>de</strong>l <strong>río</strong> Hi<strong>la</strong>mayo y zona media <strong>de</strong> <strong>la</strong> margen izquierda <strong>de</strong>l<br />
<strong>río</strong> Guanaco. La formación Chacrapi correspon<strong>de</strong> a <strong>la</strong> era paleozoico y serie inferior.<br />
10) Grupo Ambo (Ps-a)<br />
Perteneciente a <strong>la</strong> facie continentales sedimentarias, que correspon<strong>de</strong> a <strong>la</strong> era paleozoico,<br />
sistema carbonífero y serie superior. Cuya extensión abarca 137.96 km 2 y representa 3.80<br />
% <strong>de</strong>l área total <strong>de</strong> <strong>la</strong> cuenca. Se localiza en <strong>la</strong> zona alta <strong>de</strong> <strong>la</strong> cuenca Huancané, ubicadas<br />
en <strong>la</strong>s subcuencas Muñani (zona Alta) y Alto Huancané (zona Ananea).<br />
11) Grupo Copacabana (Ps-co)<br />
En <strong>la</strong> cuenca Huancané ocupa una superficie <strong>de</strong> 315.10 km 2 y representa el 8.68% <strong>de</strong>l área<br />
total <strong>de</strong> <strong>la</strong> cuenca. La formación geológica se localiza generalmente en <strong>la</strong> zona alta <strong>de</strong> <strong>la</strong><br />
cuenca Huancané; centradas en <strong>la</strong> zona alta <strong>de</strong>l <strong>río</strong> Achul<strong>la</strong>ni en <strong>la</strong> subcuenca Tuyto, zona<br />
alta <strong>de</strong>l <strong>río</strong> Humullo en <strong>la</strong> subcuenca Pistune, margen izquierda <strong>de</strong>l <strong>río</strong> Alvarizani y zona<br />
media alta <strong>de</strong>l <strong>río</strong> Toco Toco en <strong>la</strong> subcuenca Alto Huancané, y <strong>la</strong> mayor parte en <strong>la</strong> zona<br />
media alta entre los <strong>río</strong>s Tarucani y Palca en <strong>la</strong> subcuenca Muñani. El grupo Copacabana<br />
correspon<strong>de</strong> a <strong>la</strong> era paleozoico, sistema pérmico y serie superior.<br />
12) Diorita (Ps-di)<br />
Abarca una pequeña área <strong>de</strong> 1.93 km 2 y representa el 0.05% <strong>de</strong>l área total <strong>de</strong> <strong>la</strong> cuenca <strong>de</strong>l<br />
<strong>río</strong> Huancané. Esta formación geológica se localiza en su totalidad en <strong>la</strong> zona alta <strong>de</strong> <strong>la</strong><br />
margen <strong>de</strong>recha <strong>de</strong>l <strong>río</strong> Ca<strong>la</strong> Ca<strong>la</strong> en <strong>la</strong> subcuenca L<strong>la</strong>che <strong>de</strong> <strong>la</strong> cuenca Huancané. La<br />
Diorita correspon<strong>de</strong> a <strong>la</strong> era paleozoico y serie superior.<br />
13) Formación Lampa (Ps-<strong>la</strong>)<br />
Esta formación <strong>de</strong>riva su nombre <strong>de</strong>l pueblo <strong>de</strong> Lampa en el cuadrángulo <strong>de</strong> Juliaca. Esta<br />
formación presenta una expansión fotogeológica muy distintiva, siendo reconocida por dos<br />
criterios: soporta una cobertura constituida por vegetación <strong>de</strong> maleza y arbustos bajos<br />
l<strong>la</strong>mados Queñuas.<br />
MINAG-ANA-DCPRH-AGUAS SUPERFICIALES Pág.72
<strong>Estudio</strong> <strong>Hidrológico</strong> <strong>de</strong> <strong>la</strong>s <strong>Cuenca</strong>s Huancané y Suches 2010<br />
Laubacher (1978) recolectó una fauna <strong>de</strong> scaphiocoelia sp. Crytonel<strong>la</strong> y Australocoel<strong>la</strong><br />
tourteloti, indicativa <strong>de</strong> una edad Devoniano inferior para <strong>la</strong> formación <strong>la</strong>mpa <strong>de</strong> aguas<br />
distintivamente frías con afinida<strong>de</strong>s Malvino Caffré.<br />
Esta formación geológica se extien<strong>de</strong> en una superficie <strong>de</strong> 7.99 km2 y que representa<br />
0.22% <strong>de</strong>l área total <strong>de</strong> <strong>la</strong> cuenca <strong>de</strong>l <strong>río</strong> Huancané. Se localiza en <strong>la</strong> zona alta <strong>de</strong> <strong>la</strong> margen<br />
<strong>de</strong>recha <strong>de</strong>l cauce principal <strong>de</strong> <strong>la</strong> subcuenca Bajo Huancané. La formación Lampa<br />
correspon<strong>de</strong> a <strong>la</strong> era paleozoico y serie superior.<br />
14) Grupo Tarma (Ps-t)<br />
Se extien<strong>de</strong> en una superficie <strong>de</strong> 230.09 km 2 y representa el 6.34% <strong>de</strong>l área total <strong>de</strong> <strong>la</strong><br />
cuenca <strong>de</strong>l <strong>río</strong> Huancané. La formación geológica se localiza generalmente en <strong>la</strong> zona alta<br />
<strong>de</strong> <strong>la</strong> cuenca Huancané; centradas en <strong>la</strong> zona alta <strong>de</strong> los <strong>río</strong>s Humullo, Tisñahuyo y<br />
Combuco en <strong>la</strong> subcuenca Pistune; zona alta <strong>de</strong> los <strong>río</strong>s Lacramayo, Alvarizani y Toco<br />
Toco en <strong>la</strong> subcuenca Alto Huancané y zona alta <strong>de</strong> los <strong>río</strong>s Palca y Tarucani en <strong>la</strong><br />
subcuenca Muñani. El grupo Tarma correspon<strong>de</strong> a <strong>la</strong> era paleozoico y serie superior.<br />
15) Depósitos G<strong>la</strong>ciares (Qp-g)<br />
Los <strong>de</strong>pósitos g<strong>la</strong>ciares, abarcan una superficie <strong>de</strong> 14.35 km 2 y representa el 0.40% <strong>de</strong>l<br />
área total <strong>de</strong> <strong>la</strong> cuenca Huancané. Consisten en gran parte <strong>de</strong> <strong>de</strong>rrubios estratificados,<br />
compuestos <strong>de</strong> gravas y arenas <strong>de</strong>positadas por agua <strong>de</strong> <strong>de</strong>rretimiento, forman l<strong>la</strong>nuras <strong>de</strong><br />
<strong>de</strong>pósitos G<strong>la</strong>ciares a altitu<strong>de</strong>s media a alta <strong>la</strong>s cuales, han sido alcanzados por hielos<br />
g<strong>la</strong>ciales estas gravas tardías <strong>de</strong>scansan en una superficie <strong>de</strong> erosión muy uniforme,<br />
suavemente inclinada <strong>de</strong>sarrol<strong>la</strong>da en <strong>la</strong> parte alta <strong>de</strong> <strong>la</strong> cuenca Huancané, generalmente<br />
localizados en <strong>la</strong> zona alta <strong>de</strong> Ananea <strong>de</strong> <strong>la</strong>s subcuencas Muñani y Alto Huancané.<br />
Los tamaños <strong>de</strong> los granos gruesos <strong>de</strong> los sedimentos aluviales preservados como terrazas<br />
en alguno <strong>de</strong> los valles principales, sugieren que estos fueron <strong>de</strong>pósitos por <strong>de</strong>rretimiento<br />
<strong>de</strong> aguas acompañado al retroceso <strong>de</strong> g<strong>la</strong>ciares, pero como han sido bien diferenciados, en<br />
los mapas geológicos han sido relevados como aluviales. Los <strong>de</strong>pósitos g<strong>la</strong>ciares<br />
correspon<strong>de</strong>n a <strong>la</strong> era cenozoico, sistema cuaternario y serie pleistoceno.<br />
16) Depósito Aluvial Reciente (Qr-al)<br />
Se extien<strong>de</strong> en una superficie <strong>de</strong> 565.65 km 2 y presenta 15.58% <strong>de</strong>l área total <strong>de</strong> <strong>la</strong> cuenca<br />
Huancané. Se presentan esparcidas sobre el altip<strong>la</strong>no cerrando al <strong>la</strong>go Titicaca.<br />
Compren<strong>de</strong>n por arcil<strong>la</strong>s y limos, arena, y gravas no consolidadas <strong>de</strong>positadas por <strong>la</strong><br />
corriente <strong>de</strong> <strong>río</strong>s, flujos <strong>de</strong> agua y corrientes <strong>la</strong>minares todas el<strong>la</strong>s incluyen sedimentos<br />
fluviales y coluviales. En los valles principales, los sedimentos coluviales y los <strong>de</strong>pósitos<br />
fluviales jóvenes como los más antiguos, pue<strong>de</strong>n distinguirse perfectamente.<br />
Esta formación geológica, generalmente se localiza en <strong>la</strong> zona baja, media y media alta <strong>de</strong><br />
<strong>la</strong> cuenca Huancané, generalmente ubicadas en zona baja y media en todas sus subcuencas.<br />
Los <strong>de</strong>pósitos aluviales recientes correspon<strong>de</strong>n a <strong>la</strong> era cenozoico, sistema cuaternario y<br />
serie reciente.<br />
MINAG-ANA-DCPRH-AGUAS SUPERFICIALES Pág.73
<strong>Estudio</strong> <strong>Hidrológico</strong> <strong>de</strong> <strong>la</strong>s <strong>Cuenca</strong>s Huancané y Suches 2010<br />
Mapa Nº 3.15 Mapa geológico <strong>de</strong> <strong>la</strong> cuenca <strong>de</strong>l <strong>río</strong> Huancané<br />
MINAG-ANA-DCPRH-AGUAS SUPERFICIALES Pág.74
<strong>Estudio</strong> <strong>Hidrológico</strong> <strong>de</strong> <strong>la</strong>s <strong>Cuenca</strong>s Huancané y Suches 2010<br />
17) Depósito Fluvial (Qr-fl)<br />
Esta formación geológica abarca una superficie <strong>de</strong> 11.68 km 2 y representa el 0.32% <strong>de</strong>l<br />
área total <strong>de</strong> <strong>la</strong> cuenca <strong>de</strong>l <strong>río</strong> Huancané. Compren<strong>de</strong> suelos arenosos y limos arenosos, que<br />
se <strong>de</strong>sp<strong>la</strong>zan en <strong>la</strong> zona <strong>de</strong> p<strong>la</strong>yas <strong>de</strong> los <strong>río</strong>s. La formación geológica se localiza en su<br />
totalidad en <strong>la</strong> zona media baja <strong>de</strong>l <strong>río</strong> Humullo en <strong>la</strong> subcuenca Pistune <strong>de</strong> <strong>la</strong> cuenca<br />
Huancané. El Depósito Fluvial correspon<strong>de</strong> a <strong>la</strong> era cenozoico, sistema cuaternario y serie<br />
reciente.<br />
18) Formación Azángaro (Ts-az)<br />
Abarca una superficie <strong>de</strong> 91.11 km 2 y representa 2.51% <strong>de</strong>l área total <strong>de</strong> <strong>la</strong> cuenca<br />
Huancané. La formación Azángaro fue <strong>de</strong>scrita por Newell (1949) como <strong>de</strong>pósitos <strong>la</strong>custre<br />
<strong>de</strong>l <strong>río</strong> Azángaro. La formación aflora en muchos lugares <strong>de</strong>l altip<strong>la</strong>no en el cuadrángulo<br />
<strong>de</strong> Juliaca a lo <strong>la</strong>rgo <strong>de</strong>l valle <strong>de</strong> Cabanil<strong>la</strong>s, en los cuadrángulos <strong>de</strong> Puno y Juli.<br />
Formación Azángaro consiste en canteras conglomeradas, unida<strong>de</strong>s <strong>de</strong> arena con<br />
estratificación cruzada se interca<strong>la</strong>n se interca<strong>la</strong>n con conglomerados <strong>de</strong> poca matriz, los<br />
cantos exce<strong>de</strong>n 10 cm <strong>de</strong> diámetro y se observan cóncavas. La formación Azángaro<br />
correspon<strong>de</strong>n a <strong>la</strong> era mesozoico, sistema terciario y serie superior.<br />
Se localizan en <strong>la</strong> zona baja <strong>de</strong> <strong>la</strong> cuenca <strong>de</strong>l <strong>río</strong> Huancané, generalmente ubicadas en <strong>la</strong><br />
zona baja <strong>de</strong> <strong>la</strong>s subcuencas Bajo Huancané, Tuyto y Medio Huancané. La erosión a través<br />
<strong>de</strong> <strong>la</strong>rgos <strong>río</strong>s a cortado a <strong>la</strong> formación re-<strong>de</strong>positando los materiales como aluviales<br />
resientes, <strong>la</strong> erosión en el bor<strong>de</strong> <strong>de</strong>l afloramiento es acelerada.<br />
19) Formación Arca, Picotani (Ts-pic)<br />
Ocupa una pequeña superficie <strong>de</strong> 1.26 km 2 y representa el 0.03% <strong>de</strong>l área total <strong>de</strong> <strong>la</strong><br />
cuenca <strong>de</strong>l <strong>río</strong> Huancané. Esta formación geológica se localiza en su totalidad en <strong>la</strong> zona<br />
alta <strong>de</strong>l <strong>río</strong> Palca en <strong>la</strong> subcuenca Muñani <strong>de</strong> <strong>la</strong> cuenca Huancané. La formación Arca,<br />
Picotani correspon<strong>de</strong> a <strong>la</strong> era mesozoico, sistema terciario y serie superior.<br />
Cuadro Nº 3.15 Características geológicas <strong>de</strong> <strong>la</strong> cuenca <strong>de</strong>l <strong>río</strong> Huancané<br />
Era Sistema Serie Simbología Descripción<br />
Mesozoico Cretáceo<br />
Paleozoico<br />
Cenozoico Cuaternario<br />
Mesozoico Terciario<br />
(km2) (%)<br />
Inferior Ki-chu Formación Chupa 20.79 0.57<br />
Inferior Ki-hu Formación Huancané 78.95 2.17<br />
Inferior Ki-mun Formación Muni 226.42 6.24<br />
Medio Km-mo Formación Moho 160.60 4.42<br />
Superior Ks-co Grupo Cotacucho 735.67 20.26<br />
Superior Ks-mñ Formación Muñani 145.92 4.02<br />
Superior Ks-vq Formación Vilquechico 727.12 20.02<br />
- Inferior Pi-a Formación Ananea 72.76 2.00<br />
- Inferior Pi-ch Formación Chacrapi 85.85 2.36<br />
Carbonífero Superior Ps-a Grupo Ambo 137.96 3.80<br />
Pérmico Superior Ps-co Grupo Copacabana 315.10 8.68<br />
- Superior Ps-di Diorita 1.93 0.05<br />
- Superior Ps-<strong>la</strong> Formación Lampa 7.99 0.22<br />
- Superior Ps-t Grupo Tarma 230.09 6.34<br />
Pleistoceno Qp-g Depósitos g<strong>la</strong>ciares 14.35 0.40<br />
Reciente Qr-al Depósito aluvial reciente 565.65 15.58<br />
Reciente Qr-fl Depósito fluvial 11.68 0.32<br />
Superior Ts-az Formación Azángaro 91.11 2.51<br />
Superior Ts-pic Formación Arca, Picotani 1.26 0.03<br />
Total<br />
3631.19 100.00<br />
MINAG-ANA-DCPRH-AGUAS SUPERFICIALES Pág.75<br />
Área
<strong>Estudio</strong> <strong>Hidrológico</strong> <strong>de</strong> <strong>la</strong>s <strong>Cuenca</strong>s Huancané y Suches 2010<br />
<strong>Cuenca</strong> Suches (Perú)<br />
1) Formación Moho (Km-mo)<br />
Esta unidad <strong>de</strong> <strong>la</strong> sucesión fue <strong>de</strong>signada como „Grupo Moho”, por NEWELL (1945,<br />
1949). Esta formación generalmente <strong>de</strong>scansa en conformidad sobre <strong>la</strong> Arenisca Huancané<br />
con un cambio marcado en <strong>la</strong> litología en unos 4 ó 5 m pasando <strong>de</strong> dominantemente<br />
areniscosa a una secuencia limolítica y fangolítica <strong>de</strong> color rojo.<br />
La parte basal <strong>de</strong> <strong>la</strong> secuencia está dominada por sedimentos <strong>de</strong> color marrón rojizo <strong>de</strong><br />
grano fino y en <strong>la</strong> parte media es mayormente <strong>de</strong> imolita y fangolita color caqui gris y<br />
marrón. Fangolitas calcáreas <strong>de</strong>lgadas con lignito alóctono, y capas con fósiles esparcidos<br />
se encuentran en esta parte media, aunque en muchas localida<strong>de</strong>s los sedimentos <strong>de</strong> grano<br />
fino, parecen ser cortados por una gruesa secuencia <strong>de</strong> areniscas con estratificación<br />
cruzada. Al tope <strong>de</strong> <strong>la</strong> secuencia se retorna a una litología compuesta <strong>de</strong> fangolitas y<br />
limolitas rojas.<br />
Fotogeológicamente no hay rasgos diagnósticos. Las características <strong>de</strong> <strong>la</strong>s unida<strong>de</strong>s<br />
areniscosas y fangolíticas <strong>de</strong> estratificación <strong>de</strong>lgada están marcadas por colinas <strong>de</strong> una<br />
coloración ligeramente más c<strong>la</strong>ra que son muy persistentes, algunas <strong>de</strong> el<strong>la</strong>s se pue<strong>de</strong>n<br />
trazar por varios kilómetros a lo <strong>la</strong>rgo <strong>de</strong>l rumbo.<br />
Esta formación geológica, abarca una superficie <strong>de</strong> 8.56 km 2 y representa 0.74% <strong>de</strong>l área<br />
total <strong>de</strong> <strong>la</strong> cuenca <strong>de</strong>l <strong>río</strong> Suches (Perú). Se localiza en pequeñas áreas <strong>de</strong> <strong>la</strong> cuenca Suches,<br />
centradas en <strong>la</strong> parte baja <strong>de</strong>l <strong>río</strong> Suches, zona alta entre <strong>la</strong>s subcuencas Chueña Huata<br />
Jahuira y Caylloma, y otra parte se localiza en <strong>la</strong> zona alta <strong>de</strong> <strong>la</strong> subcuenca Caylloma. La<br />
formación Moho correspon<strong>de</strong>n a <strong>la</strong> era mesozoico, sistema cretáceo y serie medio.<br />
2) Grupo Cotacucho (Ks-co)<br />
Pertenece a <strong>la</strong>s facies continentales sedimentarias, también a <strong>la</strong>s formaciones <strong>de</strong><br />
Vilquechico y Muñani, localmente con facies litoral. El área que abarca esta formación es<br />
<strong>de</strong> 92.34 km 2 y representa el 7.96% <strong>de</strong>l total <strong>de</strong> <strong>la</strong> cuenca. Se localiza en <strong>la</strong> zona baja y<br />
media <strong>de</strong> <strong>la</strong> cuenca Suches, centradas en <strong>la</strong> zona baja <strong>de</strong>l <strong>río</strong> Suches y zona alta <strong>de</strong> <strong>la</strong><br />
margen <strong>de</strong>recha <strong>de</strong>l <strong>río</strong> principal <strong>de</strong> <strong>la</strong> subcuenca Caylloma. Su existencia correspon<strong>de</strong> a <strong>la</strong><br />
era mesozoico, sistema cretáceo y serie superior.<br />
3) Formación Muñani (Ks-mñ)<br />
Se extien<strong>de</strong> en una superficie <strong>de</strong> 65.74 km 2 y representa el 5.66% <strong>de</strong>l área total <strong>de</strong> <strong>la</strong><br />
cuenca <strong>de</strong>l <strong>río</strong> Suches (Perú). Esta formación geológica se localiza en <strong>la</strong> zona media baja<br />
<strong>de</strong> <strong>la</strong> cuenca Suches, centrada en su mayoría en <strong>la</strong> zona alta <strong>de</strong> <strong>la</strong> margen <strong>de</strong>recha <strong>de</strong> <strong>la</strong><br />
subcuenca Chueña Huata Jahuira y una parte en <strong>la</strong> zona alta <strong>de</strong> <strong>la</strong> subcuenca Caylloma<br />
centrada en el límite con <strong>la</strong> subcuenca anteriormente citada. La formación Muñani<br />
correspon<strong>de</strong> a <strong>la</strong> era mesozoico, sistema cretáceo y serie superior.<br />
MINAG-ANA-DCPRH-AGUAS SUPERFICIALES Pág.76
<strong>Estudio</strong> <strong>Hidrológico</strong> <strong>de</strong> <strong>la</strong>s <strong>Cuenca</strong>s Huancané y Suches 2010<br />
4) Formación Vilquechico (Ks-vq)<br />
Esta formación geológica ocupa una superficie <strong>de</strong> 80.63 km 2 y representa el 6.95% <strong>de</strong>l área<br />
total <strong>de</strong> <strong>la</strong> cuenca <strong>de</strong>l <strong>río</strong> Suches (Perú). Se localiza en <strong>la</strong> zona baja <strong>de</strong> <strong>la</strong> margen <strong>de</strong>recha<br />
<strong>de</strong>l <strong>río</strong> Suches y una parte en <strong>la</strong> zona sur <strong>de</strong> <strong>la</strong> subcuenca Chueña Huata Jahuira. La<br />
formación Vilquechico correspon<strong>de</strong> a <strong>la</strong> era mesozoico, sistema cretáceo y serie superior.<br />
5) Formación Ananea (Pi-a)<br />
Abarca una superficie <strong>de</strong> 143.56 km 2 y representa el 12.37% <strong>de</strong>l área total <strong>de</strong> <strong>la</strong> cuenca <strong>de</strong>l<br />
<strong>río</strong> Suches (Perú). Esta formación geológica se localiza en su mayoría en <strong>la</strong> zona alta <strong>de</strong> <strong>la</strong><br />
cuenca Suches, centrada en <strong>la</strong> zona alta <strong>de</strong> <strong>la</strong> subcuenca Trapiche y Laguna Suches. La<br />
formación Ananea correspon<strong>de</strong> a <strong>la</strong> era paleozoico y serie inferior.<br />
6) Volcánico Sandia (Pi-sa)<br />
Se extien<strong>de</strong> en una superficie <strong>de</strong> 22.42 km 2 y representa el 1.93% <strong>de</strong>l área total <strong>de</strong> <strong>la</strong><br />
cuenca <strong>de</strong>l <strong>río</strong> Suches (Perú). La formación geológica se localiza en <strong>la</strong> zona alta <strong>de</strong> <strong>la</strong><br />
cuenca Suches, centrada en su totalidad en <strong>la</strong> zona alta <strong>de</strong> <strong>la</strong> subcuenca Trapiche. El<br />
Volcánico Sandia correspon<strong>de</strong> a <strong>la</strong> era paleozoico, sistema ordovisico y serie inferior.<br />
7) Grupo Ambo (Ps-a)<br />
Perteneciente a <strong>la</strong> facie continentales sedimentarias, que correspon<strong>de</strong> a <strong>la</strong> era paleozoico,<br />
sistema carbonífero y serie superior. Cuya extensión abarca 111.42 km 2 y representa 9.6 %<br />
<strong>de</strong>l área total <strong>de</strong> <strong>la</strong> cuenca. Se localiza en <strong>la</strong> zona media alta <strong>de</strong> <strong>la</strong> cuenca Suches (Perú);<br />
centrada en <strong>la</strong> zona media <strong>de</strong> <strong>la</strong> margen izquierda y zona alta <strong>de</strong> <strong>la</strong> subcuenca Caylloma, y<br />
otra parte se ubica en <strong>la</strong> zona media alta <strong>de</strong> <strong>la</strong> margen <strong>de</strong>recha <strong>de</strong> <strong>la</strong> subcuenca Trapiche.<br />
8) Grupo Copacabana (Ps-co)<br />
En <strong>la</strong> cuenca Suches (Perú) ocupa una superficie <strong>de</strong> 3.75 km 2 y representa el 0.32% <strong>de</strong>l<br />
área total <strong>de</strong> <strong>la</strong> cuenca. La formación geológica se localiza en su totalidad, en <strong>la</strong> zona alta<br />
<strong>de</strong> <strong>la</strong> subcuenca Chueña Huata Jahuira en el límite con <strong>la</strong> subcuenca Caylloma. El grupo<br />
Copacabana correspon<strong>de</strong> a <strong>la</strong> era paleozoico, sistema pérmico y serie superior.<br />
9) Grupo Tarma (Ps-t)<br />
Se extien<strong>de</strong> en una superficie <strong>de</strong> 60.79 km 2 y representa el 5.24% <strong>de</strong>l área total <strong>de</strong> <strong>la</strong><br />
cuenca <strong>de</strong>l <strong>río</strong> Suches. La formación geológica se localiza en <strong>la</strong> zona alta <strong>de</strong> <strong>la</strong> cuenca<br />
Suches; centrada en <strong>la</strong> zona alta <strong>de</strong> <strong>la</strong> subcuenca Caylloma y zona alta <strong>de</strong> <strong>la</strong> margen<br />
<strong>de</strong>recha <strong>de</strong> <strong>la</strong> subcuenca Trapiche. El grupo Tarma correspon<strong>de</strong> a <strong>la</strong> era paleozoico y serie<br />
superior.<br />
10) Depósitos G<strong>la</strong>ciares (Qp-g)<br />
Los <strong>de</strong>pósitos g<strong>la</strong>ciares, abarcan una superficie <strong>de</strong> 119.92 km 2 y representa el 10.33% <strong>de</strong>l<br />
área total <strong>de</strong> <strong>la</strong> cuenca Suches (Perú). Consisten en gran parte <strong>de</strong> <strong>de</strong>rrubios estratificados,<br />
MINAG-ANA-DCPRH-AGUAS SUPERFICIALES Pág.77
<strong>Estudio</strong> <strong>Hidrológico</strong> <strong>de</strong> <strong>la</strong>s <strong>Cuenca</strong>s Huancané y Suches 2010<br />
compuestos <strong>de</strong> gravas y arenas <strong>de</strong>positadas por agua <strong>de</strong> <strong>de</strong>rretimiento, forman l<strong>la</strong>nuras <strong>de</strong><br />
<strong>de</strong>pósitos G<strong>la</strong>ciares a altitu<strong>de</strong>s media a alta <strong>la</strong>s cuales, han sido alcanzados por hielos<br />
g<strong>la</strong>ciales estas gravas tardías <strong>de</strong>scansan en una superficie <strong>de</strong> erosión muy uniforme,<br />
suavemente inclinada <strong>de</strong>sarrol<strong>la</strong>da en <strong>la</strong> zona alta <strong>de</strong> <strong>la</strong> cuenca Suches, localizadas en <strong>la</strong><br />
zona baja, media y alta <strong>de</strong> <strong>la</strong> subcuenca Trapiche y otra parte en <strong>la</strong> zona alta <strong>de</strong> <strong>la</strong> margen<br />
<strong>de</strong>recha <strong>de</strong> <strong>la</strong> <strong>la</strong>guna Suches.<br />
Los tamaños <strong>de</strong> los granos gruesos <strong>de</strong> los sedimentos aluviales preservados como terrazas<br />
en alguno <strong>de</strong> los valles principales, sugieren que estos fueron <strong>de</strong>pósitos por <strong>de</strong>rretimiento<br />
<strong>de</strong> aguas acompañado al retroceso <strong>de</strong> g<strong>la</strong>ciares, pero como han sido bien diferenciados, en<br />
los mapas geológicos han sido relevados como aluviales. Los <strong>de</strong>pósitos g<strong>la</strong>ciares<br />
correspon<strong>de</strong>n a <strong>la</strong> era cenozoico, sistema cuaternario y serie pleistoceno.<br />
11) Depósito Aluvial Reciente (Qr-al)<br />
Se extien<strong>de</strong> en una superficie <strong>de</strong> 449.29 km 2 y presenta 38.71% <strong>de</strong>l área total <strong>de</strong> <strong>la</strong> cuenca<br />
Suches (Perú). Se presentan esparcidas sobre el altip<strong>la</strong>no cerrando al <strong>la</strong>go Titicaca.<br />
Compren<strong>de</strong>n por arcil<strong>la</strong>s y limos, arena, y gravas no consolidadas <strong>de</strong>positadas por <strong>la</strong><br />
corriente <strong>de</strong> <strong>río</strong>s, flujos <strong>de</strong> agua y corrientes <strong>la</strong>minares todas el<strong>la</strong>s incluyen sedimentos<br />
fluviales y coluviales. En los valles principales, los sedimentos coluviales y los <strong>de</strong>pósitos<br />
fluviales jóvenes como los más antiguos, pue<strong>de</strong>n distinguirse perfectamente.<br />
Esta formación geológica, generalmente se localiza en <strong>la</strong> zona baja, media y alta <strong>de</strong> <strong>la</strong><br />
cuenca Suches, centradas en los márgenes <strong>de</strong> los cauces principales <strong>de</strong> <strong>la</strong>s subcuencas<br />
Chueña Huata Jahuira, Caylloma, Trapiche y Suches. Los <strong>de</strong>pósitos aluviales recientes<br />
correspon<strong>de</strong>n a <strong>la</strong> era cenozoico, sistema cuaternario y serie reciente.<br />
12) Formación Arca, Picotani (Ts-pic)<br />
Ocupa una pequeña superficie <strong>de</strong> 2.33 km 2 y representa el 0.20% <strong>de</strong>l área total <strong>de</strong> <strong>la</strong><br />
cuenca <strong>de</strong>l <strong>río</strong> Suches (Perú). Esta formación geológica se localiza en su totalidad en <strong>la</strong><br />
parte alta <strong>de</strong> <strong>la</strong> subcuenca Trapiche (zona <strong>la</strong> Rinconada). La formación Arca, Picotani<br />
correspon<strong>de</strong> a <strong>la</strong> era mesozoico, sistema terciario y serie superior.<br />
Cuadro Nº 3.16 Características geológicas <strong>de</strong> <strong>la</strong> cuenca <strong>de</strong>l <strong>río</strong> Suches (Perú)<br />
Era Sistema Serie Simbología<br />
Mesozoico<br />
Paleozoico<br />
Cenozoico<br />
Cretáceo<br />
Descripción<br />
(km2) (%)<br />
Medio Km-mo Formación Moho 8.56 0.74<br />
Superior Ks-co Grupo Cotacucho 92.34 7.96<br />
Superior Ks-mñ Formación Muñani 65.74 5.66<br />
Superior Ks-vq Formación Vilquechico 80.63 6.95<br />
- Inferior Pi-a Formación Ananea 143.56 12.37<br />
Ordovisico Inferior Pi-sa Volcánico Sandia 22.42 1.93<br />
Carbonífero Superior Ps-a Grupo Ambo 111.42 9.60<br />
Pérmico Superior Ps-co Grupo Copacabana 3.75 0.32<br />
- Superior Ps-t Grupo Tarma 60.79 5.24<br />
Cuaternario<br />
Pleistoceno Qp-g Depósitos g<strong>la</strong>ciares 119.92 10.33<br />
Reciente Qr-al Deposito aluvial reciente 449.29 38.71<br />
Mesozoico Terciario Superior Ts-pic Formación Arca, Picotani 2.33 0.20<br />
Total<br />
1160.75 100.00<br />
MINAG-ANA-DCPRH-AGUAS SUPERFICIALES Pág.78<br />
Área
<strong>Estudio</strong> <strong>Hidrológico</strong> <strong>de</strong> <strong>la</strong>s <strong>Cuenca</strong>s Huancané y Suches 2010<br />
Mapa Nº 3.16 Mapa geológico <strong>de</strong> <strong>la</strong> cuenca <strong>de</strong>l <strong>río</strong> Suches (Perú)<br />
MINAG-ANA-DCPRH-AGUAS SUPERFICIALES Pág.79
<strong>Estudio</strong> <strong>Hidrológico</strong> <strong>de</strong> <strong>la</strong>s <strong>Cuenca</strong>s Huancané y Suches 2010<br />
3.8 SUELOS<br />
3.8.1 Uso mayor <strong>de</strong> tierras<br />
Para <strong>la</strong> c<strong>la</strong>sificación <strong>de</strong> uso mayor <strong>de</strong> tierras en <strong>la</strong>s cuencas Huancané y Suches, se ha<br />
utilizado el mapa e<strong>la</strong>borado por <strong>la</strong> ONERN, don<strong>de</strong> muestra <strong>la</strong> calidad y sus características<br />
principales <strong>de</strong> suelos significativos.<br />
En los Cuadros Nº 3.17 y 3.18, y en los Mapas Nº 3.17 y 3.18 se muestran <strong>la</strong>s<br />
características <strong>de</strong> <strong>la</strong> capacidad <strong>de</strong> uso mayor <strong>de</strong> tierras en <strong>la</strong>s cuencas Huancané y Suches.<br />
A continuación se <strong>de</strong>scribe en forma general, cada una <strong>de</strong> <strong>la</strong>s características <strong>de</strong> uso mayor<br />
<strong>de</strong> tierras en <strong>la</strong>s cuencas Huancané y Suches.<br />
<strong>Cuenca</strong> Huancané<br />
1) Cultivos en Limpio (A3c - Plc)<br />
Representa <strong>la</strong> máxima expresión <strong>de</strong> <strong>la</strong> agricultura, arable e intensiva y aptas para <strong>la</strong> fijación<br />
<strong>de</strong> cultivos diversificados, constituyendo <strong>la</strong>s tierras <strong>de</strong> baja calidad agrologica para su<br />
capacidad productiva, se localiza en <strong>la</strong> zona baja <strong>de</strong> <strong>la</strong> cuenca Huancané, distribuida en <strong>la</strong>s<br />
subcuencas Bajo Huancané, L<strong>la</strong>che, Tuyto y Pistune. Este tipo <strong>de</strong> suelo es <strong>de</strong> calidad<br />
agrologica baja y son aptos para cultivos permanentes, aptos para pastos con factores<br />
limitantes a <strong>la</strong> salinidad y al clima.<br />
Esta c<strong>la</strong>sificación <strong>de</strong> uso mayor <strong>de</strong> tierra ocupa una extensión <strong>de</strong> 414.04 km 2 , que<br />
representa el 11.40% <strong>de</strong>l área total <strong>de</strong> <strong>la</strong> cuenca, área que sirve para cultivo en limpio.<br />
2) Aptas para Pastos (Plc)<br />
Son tierras aptas para pastos <strong>de</strong> calidad agrologica alta, con factor limitante a <strong>la</strong> salinidad y<br />
al clima. Abarca una superficie <strong>de</strong> 568.93 km 2 y representa el 15.67% <strong>de</strong>l área <strong>de</strong> <strong>la</strong> cuenca<br />
Huancané. Este tipo <strong>de</strong> suelo se localiza generalmente en <strong>la</strong> zona media <strong>de</strong> <strong>la</strong> cuenca<br />
Huancané, específicamente ubicadas en <strong>la</strong> zona baja <strong>de</strong> <strong>la</strong>s subcuencas Medio Bajo<br />
Huancané, Tuyto, Medio Bajo Huancané, Tuyto, Medio Huancané, Muñani, Medio Alto<br />
Huancané, Pistune y Alto Huancané.<br />
El uso <strong>de</strong> estas tierras requiere <strong>de</strong> prácticas intensas <strong>de</strong> conservación y manejo <strong>de</strong> suelos,<br />
para lo cual <strong>de</strong>be hacerse un uso racional <strong>de</strong> los pastos, evitando el sobre pastoreo,<br />
mediante <strong>la</strong>s siguientes prácticas: insta<strong>la</strong>ción <strong>de</strong> cercos, poca carga animal, pastoreo<br />
distanciado para que se recuperen los pastos, etc.<br />
3) Aptas para Pastos (P2e)<br />
Este tipo <strong>de</strong> suelos son aptas para pastos <strong>de</strong> calidad agrologica media con factor limitante a<br />
<strong>la</strong> erosión, abarca un área <strong>de</strong> 30.94 km 2 y representa el 0.85% <strong>de</strong>l total <strong>de</strong> <strong>la</strong> cuenca. Este<br />
tipo <strong>de</strong> suelo se encuentra en <strong>la</strong> zona alta <strong>de</strong>l <strong>río</strong> Palca en <strong>la</strong> subcuenca Muñani.<br />
MINAG-ANA-DCPRH-AGUAS SUPERFICIALES Pág.80
<strong>Estudio</strong> <strong>Hidrológico</strong> <strong>de</strong> <strong>la</strong>s <strong>Cuenca</strong>s Huancané y Suches 2010<br />
Representa <strong>la</strong>s tierras no aptas para fines agríco<strong>la</strong>s, pero reúnen características ecológicas<br />
para <strong>la</strong> propagación <strong>de</strong> pasturas naturales y cultivadas, son aptas para pastoreo y<br />
recomendable para medidas <strong>de</strong> protección por <strong>la</strong> posible erosión <strong>de</strong>l suelo.<br />
4) Tierras <strong>de</strong> Protección (X)<br />
Representan <strong>la</strong>s tierras <strong>de</strong> características inapropiadas para el <strong>de</strong>sarrollo agropecuario y<br />
explotación forestal <strong>de</strong>ntro <strong>de</strong> márgenes económicos. Pue<strong>de</strong>n prestar gran valor económico<br />
para otros usos como el <strong>de</strong>sarrollo <strong>de</strong> <strong>la</strong> actividad minera, este tipo <strong>de</strong> suelo se encuentra<br />
localizada en <strong>la</strong> zona alta <strong>de</strong> los <strong>río</strong>s Alvarizani y Toco Toco en <strong>la</strong> subcuenca Alto<br />
Huancané, en <strong>la</strong> zona alta <strong>de</strong> los <strong>río</strong>s Tarucani y Guanaco en <strong>la</strong> subcuenca Muñani.<br />
Hay que notar que estos suelos tienen una cobertura vegetal muy pobre (zonas <strong>de</strong>snudas),<br />
por lo que se <strong>de</strong>bería <strong>de</strong> conservar con el fin <strong>de</strong> proteger <strong>la</strong> cuenca y <strong>la</strong> biodiversidad <strong>de</strong><br />
esta zona está <strong>de</strong>scrita como tierras <strong>de</strong> protección. Abarca un área <strong>de</strong> 187.79 km 2 y<br />
representa el 5.17% <strong>de</strong>l área <strong>de</strong> <strong>la</strong> cuenca.<br />
5) Tierras <strong>de</strong> Protección (X-P2e)<br />
Descrita como tierras aptas para pastos <strong>de</strong> calidad agrologica media con factor limitante a<br />
<strong>la</strong> erosión. Este tipo <strong>de</strong> suelo es <strong>la</strong> que abunda en toda <strong>la</strong> cuenca y abarca un área <strong>de</strong><br />
2406.80 km 2 , que representa el 66.28% <strong>de</strong>l área total <strong>de</strong> <strong>la</strong> cuenca Huancané. Se localiza<br />
en gran parte <strong>de</strong> <strong>la</strong> zona baja, media y alta <strong>de</strong> <strong>la</strong> cuenca Huancané, distribuidas en mayor<br />
área <strong>de</strong> sus subcuencas.<br />
Cuadro Nº 3.17 Características <strong>de</strong> <strong>la</strong> capacidad <strong>de</strong> uso mayor <strong>de</strong> tierra en <strong>la</strong> cuenca <strong>de</strong>l <strong>río</strong> Huancané<br />
Símbolo Descripción<br />
(km2) (%)<br />
Lagunas Lagunas 22.69 0.62<br />
A3c - P1c<br />
Tierras aptas para cultivos en limpio <strong>de</strong> calidad agrológica baja - Tierras aptas para pastos,<br />
calidad agrológica alta, ambos con factor limitante al clima.<br />
414.04 11.40<br />
P1c Tierras aptas para pastos, calidad agrológica alta con factor limitante al clima. 568.93 15.67<br />
P2e Tierras aptas para pastos <strong>de</strong> calidad agrológica media con factor limitante a <strong>la</strong> erosión. 30.94 0.85<br />
X Tierras <strong>de</strong> protección. 187.79 5.17<br />
X - P2e<br />
Tierras <strong>de</strong> protección - Tierras aptas para pastos <strong>de</strong> calidad agrológica media con factor<br />
limitante a <strong>la</strong> erosión.<br />
<strong>Cuenca</strong> Suches (Perú)<br />
1) Aptas para Pastos (Plc)<br />
Total<br />
2406.80 66.28<br />
3631.19 100.00<br />
Son tierras aptas para pastos <strong>de</strong> calidad agrologica alta, con factor limitante a <strong>la</strong> salinidad y<br />
al clima. Abarca una superficie <strong>de</strong> 458.44 km 2 y representa el 39.50% <strong>de</strong>l área <strong>de</strong> <strong>la</strong> cuenca<br />
Suches. Este tipo <strong>de</strong> suelo se localiza generalmente en <strong>la</strong> zona media baja, media y alta <strong>de</strong><br />
MINAG-ANA-DCPRH-AGUAS SUPERFICIALES Pág.81<br />
Área
<strong>Estudio</strong> <strong>Hidrológico</strong> <strong>de</strong> <strong>la</strong>s <strong>Cuenca</strong>s Huancané y Suches 2010<br />
<strong>la</strong> cuenca Suches, distribuidas en <strong>la</strong>s subcuencas Chueña Huata Jahuira, Caylloma,<br />
Trapiche e intercuenca Suches.<br />
El uso <strong>de</strong> estas tierras requiere <strong>de</strong> prácticas intensas <strong>de</strong> conservación y manejo <strong>de</strong> suelos,<br />
para lo cual <strong>de</strong>be hacerse un uso racional <strong>de</strong> los pastos, evitando el sobre pastoreo,<br />
mediante <strong>la</strong>s siguientes prácticas: insta<strong>la</strong>ción <strong>de</strong> cercos, poca carga animal, pastoreo<br />
distanciado para que se recuperen los pastos, etc.<br />
2) Tierras <strong>de</strong> Protección (X)<br />
Representan <strong>la</strong>s tierras <strong>de</strong> características inapropiadas para el <strong>de</strong>sarrollo agropecuario y<br />
explotación forestal <strong>de</strong>ntro <strong>de</strong> márgenes económicos. Pue<strong>de</strong>n prestar gran valor económico<br />
para otros usos como el <strong>de</strong>sarrollo <strong>de</strong> <strong>la</strong> actividad minera, este tipo <strong>de</strong> suelo se encuentra<br />
localizada en <strong>la</strong> zona alta <strong>de</strong> <strong>la</strong>s subcuencas Caylloma y Trapiche.<br />
Hay que notar que estos suelos tienen una cobertura vegetal muy pobre (zonas <strong>de</strong>snudas),<br />
por lo que se <strong>de</strong>bería <strong>de</strong> conservar con el fin <strong>de</strong> proteger <strong>la</strong> cuenca y <strong>la</strong> biodiversidad <strong>de</strong><br />
esta zona está <strong>de</strong>scrita como tierras <strong>de</strong> protección. Abarca un área <strong>de</strong> 255.13 km 2 y<br />
representa el 21.98% <strong>de</strong>l área <strong>de</strong> <strong>la</strong> cuenca.<br />
3) Tierras <strong>de</strong> Protección (X-P2e)<br />
Descrita como tierras aptas para pastos <strong>de</strong> calidad agrologica media con factor limitante a<br />
<strong>la</strong> erosión. Este tipo <strong>de</strong> suelo abarca un área <strong>de</strong> 428.83 km 2 y representa el 36.94% <strong>de</strong>l área<br />
total <strong>de</strong> <strong>la</strong> cuenca Suches. Se localiza en <strong>la</strong> zona baja, media y alta <strong>de</strong> <strong>la</strong> cuenca Suches, y<br />
distribuidas en todas <strong>la</strong>s subcuencas.<br />
Cuadro Nº 3.18 Características <strong>de</strong> <strong>la</strong> capacidad <strong>de</strong> uso mayor <strong>de</strong> tierra en <strong>la</strong> cuenca <strong>de</strong>l <strong>río</strong> Suches (Perú)<br />
Símbolo Descripción<br />
Área<br />
(km2) (%)<br />
Lagunas Lagunas 18.35 1.58<br />
P1c Tierras aptas para pastos, calidad agrológica alta con factor limitante al clima. 458.44 39.50<br />
X Tierras <strong>de</strong> protección. 255.13 21.98<br />
X - P2e<br />
Tierras <strong>de</strong> protección - Tierras aptas para pastos <strong>de</strong> calidad agrológica media con factor<br />
limitante a <strong>la</strong> erosión.<br />
Total<br />
428.83 36.94<br />
1160.75 100.00<br />
MINAG-ANA-DCPRH-AGUAS SUPERFICIALES Pág.82
<strong>Estudio</strong> <strong>Hidrológico</strong> <strong>de</strong> <strong>la</strong>s <strong>Cuenca</strong>s Huancané y Suches 2010<br />
Mapa Nº 3.17 Mapa <strong>de</strong> uso mayor <strong>de</strong> tierras en <strong>la</strong> cuenca <strong>de</strong>l <strong>río</strong> Huancané<br />
MINAG-ANA-DCPRH-AGUAS SUPERFICIALES Pág.83
<strong>Estudio</strong> <strong>Hidrológico</strong> <strong>de</strong> <strong>la</strong>s <strong>Cuenca</strong>s Huancané y Suches 2010<br />
Mapa Nº 3.18 Mapa <strong>de</strong> uso mayor <strong>de</strong> tierras en <strong>la</strong> cuenca <strong>de</strong>l <strong>río</strong> Suches (Perú)<br />
MINAG-ANA-DCPRH-AGUAS SUPERFICIALES Pág.84
<strong>Estudio</strong> <strong>Hidrológico</strong> <strong>de</strong> <strong>la</strong>s <strong>Cuenca</strong>s Huancané y Suches 2010<br />
3.9 RECURSOS HÍDRICOS SUPERFICIALES<br />
La i<strong>de</strong>ntificación <strong>de</strong> <strong>la</strong>s distintas fuentes hídricas superficiales en <strong>la</strong>s cuencas Huancané y<br />
Suches, se ha obtenido a través <strong>de</strong> los trabajos <strong>de</strong>l inventario <strong>de</strong> fuentes <strong>de</strong> agua superficial<br />
<strong>de</strong>sarrol<strong>la</strong>dos parale<strong>la</strong>mente al presente estudio.<br />
Según el resumen <strong>de</strong>l inventario <strong>de</strong> fuentes <strong>de</strong> agua superficial, existen 1695 fuentes<br />
hídricas en <strong>la</strong> cuenca <strong>de</strong>l <strong>río</strong> Huancané y 482 fuentes hídricas en <strong>la</strong> cuenca <strong>de</strong>l <strong>río</strong> Suches,<br />
distribuidas en <strong>río</strong>s, quebradas, manantiales, <strong>la</strong>gunas, bofedales y nevados, tal como se<br />
<strong>de</strong>tal<strong>la</strong> a continuación.<br />
3.9.1 <strong>Cuenca</strong> Huancané<br />
En <strong>la</strong> cuenca <strong>de</strong>l <strong>río</strong> Huancané según el inventario realizado, existen un total <strong>de</strong> 1695<br />
fuentes <strong>de</strong>l recurso hídrico superficial, distribuidas en 49 <strong>río</strong>s, 727 quebradas, 833<br />
manantiales y 86 <strong>la</strong>gunas.<br />
La distribución <strong>de</strong> <strong>la</strong>s fuentes hídricas en unida<strong>de</strong>s hidrográficas <strong>de</strong> nivel cinco<br />
(subcuencas) <strong>de</strong>l total <strong>de</strong> <strong>la</strong> cuenca, es <strong>la</strong> siguiente: subcuenca Bajo Huancané 128 fuentes<br />
(7.55%), subcuenca L<strong>la</strong>che 105 fuentes (6.19%), subcuenca Medio Bajo Huancané 18<br />
fuentes (1.06%), subcuenca Tuyto 487 fuentes (28.73%), subcuenca Medio Huancané 98<br />
fuentes (5.78%), subcuenca Muñani 354 fuentes (20.88%), subcuenca Medio Alto<br />
Huancané 20 fuentes (1.18%), subcuenca Pistune 162 fuentes (9.56%) y subcuenca Alto<br />
Huancané 323fuentes (19.06%). La mayor concentración <strong>de</strong> fuentes hídricas (<strong>la</strong>gunas) se<br />
dan en <strong>la</strong>s subcuencas Tuyto, Muñani y Alto Huancané, lo que significa que <strong>la</strong>s 66 <strong>la</strong>gunas<br />
existentes naturalmente almacenadas, tienen una importante contribución en <strong>la</strong> retención<br />
<strong>de</strong> <strong>la</strong> cuenca.<br />
En el Cuadro Nº 3.19 se muestra <strong>la</strong> cantidad <strong>de</strong> fuentes hídricas por subcuencas y en el<br />
Cuadro Nº 3.20 se presenta cantidad <strong>de</strong> fuentes hídricas por el tipo <strong>de</strong> uso. En <strong>la</strong>s Figuras<br />
Nº 3.7 y 3.8 se aprecia <strong>la</strong> distribución <strong>de</strong> <strong>la</strong>s fuentes <strong>de</strong> agua superficial en <strong>la</strong> cuenca<br />
Huancané y subcuencas.<br />
Nº Unidad hidrográfica<br />
Cuadro Nº 3.19 Fuentes <strong>de</strong> agua superficial - <strong>Cuenca</strong> <strong>de</strong>l <strong>río</strong> Huancané<br />
Río Quebrada Manantial Laguna<br />
1 Bajo Huancané 01781 246.41 4 26 89 9 128<br />
2 L<strong>la</strong>che 01782 161.93 3 39 63 105<br />
3 Medio Bajo Huancané 01783 47.94 1 7 9 1 18<br />
4 Tuyto 01784 1107.11 17 272 161 37 487<br />
5 Medio Huancané 01785 231.07 1 39 51 7 98<br />
6 Muñani 01786 889.44 10 176 152 16 354<br />
7 Medio Alto Huancané 01787 42.09 1 8 10 1 20<br />
8 Pistune 01788 380.43 6 64 90 2 162<br />
9 Alto Huancané 01789 524.77 6 96 208 13 323<br />
Total<br />
Código<br />
Pfafstetter<br />
Área<br />
(km 2 )<br />
Número <strong>de</strong> fuentes <strong>de</strong> agua superficial<br />
3631.19 49 727 833 86 1695<br />
MINAG-ANA-DCPRH-AGUAS SUPERFICIALES Pág.85<br />
Total
<strong>Estudio</strong> <strong>Hidrológico</strong> <strong>de</strong> <strong>la</strong>s <strong>Cuenca</strong>s Huancané y Suches 2010<br />
Figura Nº 3.7 Fuentes <strong>de</strong> agua superficial en <strong>la</strong> cuenca <strong>de</strong>l <strong>río</strong> Huancané<br />
Manantial<br />
833 unida<strong>de</strong>s<br />
49.14%<br />
Quebrada<br />
727 unida<strong>de</strong>s<br />
42.89%<br />
Laguna<br />
86 unida<strong>de</strong>s<br />
5.07%<br />
Río<br />
49 unida<strong>de</strong>s<br />
2.89%<br />
Figura Nº 3.8 Fuentes <strong>de</strong> agua superficial por subcuencas en <strong>la</strong> cuenca <strong>de</strong>l <strong>río</strong> Huancané<br />
Pistune<br />
162 fuentes<br />
hídricas<br />
9.56%<br />
Medio Alto<br />
Huancané<br />
20 fuentes<br />
hídricas<br />
1.18%<br />
Alto Huancané<br />
323 fuentes<br />
hídricas<br />
19.06%<br />
Muñani<br />
354 fuentes<br />
hídricas<br />
20.88%<br />
Bajo Huancané<br />
128 fuentes<br />
hídricas<br />
7.55%<br />
L<strong>la</strong>che<br />
105 fuentes<br />
hídricas<br />
6.19%<br />
Medio<br />
Huancané<br />
98 fuentes<br />
hídricas<br />
5.78%<br />
Medio Bajo<br />
Huancané<br />
18 fuentes<br />
hídricas<br />
1.06%<br />
Tuyto<br />
487 fuentes<br />
hídricas<br />
28.73%<br />
MINAG-ANA-DCPRH-AGUAS SUPERFICIALES Pág.86
<strong>Estudio</strong> <strong>Hidrológico</strong> <strong>de</strong> <strong>la</strong>s <strong>Cuenca</strong>s Huancané y Suches 2010<br />
Cuadro Nº 3.20 Fuentes <strong>de</strong> agua superficial por tipo <strong>de</strong> uso - <strong>Cuenca</strong> <strong>de</strong>l <strong>río</strong> Huancané<br />
Nº Unidad hidrográfica<br />
S/U PO PE PI AG MIN AG/PE PO/PE AG/PO PE/PI AG/PE/PO<br />
1 Bajo Huancané 01781 26 38 25 20 15 1 3 128<br />
2 L<strong>la</strong>che 01782 17 6 18 1 34 24 1 2 1 1 105<br />
3 Medio Bajo Huancané 01783 7 5 6 18<br />
4 Tuyto 01784 217 19 90 1 145 13 2 487<br />
5 Medio Huancané 01785 26 15 51 4 1 1 98<br />
6 Muñani 01786 83 15 138 107 10 1 354<br />
7 Medio Alto Huancané 01787 9 1 10 20<br />
8 Pistune 01788 34 22 40 61 2 3 162<br />
9 Alto Huancané 01789 62 3 159 89 1 7 1 1 323<br />
Total<br />
481 124 537 2 460 1 72 5 11 1 1 1695<br />
Leyenda: S/U=Sin Uso, PO=Pob<strong>la</strong>cional, PE=Pecuario, PI=Piscíco<strong>la</strong>, AG=Agríco<strong>la</strong>, MI=Minero, AG/PE=Agríco<strong>la</strong>/Pecuario, PO/PE=Pob<strong>la</strong>cional/<br />
Pecuario, PE/MI=Pecuario/Minero, AG/PO=Agríco<strong>la</strong>/Pob<strong>la</strong>cional PE/PI=Pecuario/Piscíco<strong>la</strong>, AG/PE/PO=Agríco<strong>la</strong>/Pecuario/Piscíco<strong>la</strong>.<br />
3.9.1.1 Río<br />
Código<br />
Pfafstetter<br />
Número <strong>de</strong> fuentes <strong>de</strong> agua superficial por tipo <strong>de</strong> uso<br />
El inventario <strong>de</strong> los <strong>río</strong>s en <strong>la</strong> cuenca Huancané, se ha realizado consi<strong>de</strong>rando el concepto<br />
<strong>de</strong> que un <strong>río</strong> es un cauce natural don<strong>de</strong> el agua fluye con continuidad durante el todo el<br />
año hidrológico, los otros cauces endorreicos tienen <strong>la</strong> <strong>de</strong>nominación <strong>de</strong> “quebradas”, que<br />
son una parte importante <strong>de</strong>l sistema <strong>de</strong> drenaje <strong>de</strong> <strong>la</strong> cuenca durante <strong>la</strong> época <strong>de</strong><br />
precipitaciones pluviales. Una primera <strong>de</strong>scripción <strong>de</strong>l sistema <strong>de</strong> drenaje <strong>de</strong> <strong>la</strong> cuenca, en<br />
<strong>la</strong> que se distingue los principales <strong>río</strong>s, se ha realizado en el ítem 3.4 <strong>de</strong>l presente capítulo.<br />
La cuenca <strong>de</strong>l <strong>río</strong> Huancané tiene cinco <strong>río</strong>s afluentes principales, que aportan sus aguas en<br />
forma directa a <strong>la</strong> cuenca. Según el resumen <strong>de</strong>l inventario <strong>de</strong> fuentes <strong>de</strong> agua, se han<br />
i<strong>de</strong>ntificado 49 <strong>río</strong>s, los cuales son <strong>de</strong> régimen continuo, distribuidas en <strong>la</strong>s subcuencas<br />
Bajo Huancané 4 <strong>río</strong>s, L<strong>la</strong>che 3, Medio Bajo Huancané 1, Tuyto 17, Medio Huancané 1,<br />
Muñani 10, Medio Alto Huancané 1, Pistune 6 y Alto Huancané 6 <strong>río</strong>s. A<strong>de</strong>más, <strong>la</strong> cuenca<br />
<strong>de</strong>l <strong>río</strong> Huancané siendo <strong>de</strong> or<strong>de</strong>n seis tiene 775 afluentes entre <strong>río</strong>s y quebradas <strong>de</strong><br />
diferentes grados <strong>de</strong> ramificación. En el Cuadro Nº 3.19 se presenta <strong>la</strong> distribución <strong>de</strong> los<br />
<strong>río</strong>s por subcuencas.<br />
Río Huancané<br />
MINAG-ANA-DCPRH-AGUAS SUPERFICIALES Pág.87<br />
Total
<strong>Estudio</strong> <strong>Hidrológico</strong> <strong>de</strong> <strong>la</strong>s <strong>Cuenca</strong>s Huancané y Suches 2010<br />
3.9.1.2 Quebrada<br />
Una quebrada es un área <strong>de</strong> drenaje <strong>de</strong> abertura estrecha y continua entre dos vertientes,<br />
que sirve <strong>de</strong> medio <strong>de</strong> escurrimiento hídrico y posee altas pendientes que causa <strong>la</strong> erosión<br />
<strong>de</strong> los suelos en sus márgenes. Los cauces <strong>de</strong> <strong>la</strong>s quebradas en su mayor parte presentan<br />
altas pendientes, generalmente son cauces erosivos, el material producido en el lecho <strong>de</strong><br />
estos cauces es transportado en forma <strong>de</strong> ava<strong>la</strong>ncha hacia <strong>la</strong> parte baja <strong>de</strong> <strong>la</strong> cuenca,<br />
quedando <strong>de</strong>positados en los cauces <strong>de</strong> pendiente baja. A consecuencia <strong>de</strong> este fenómeno,<br />
los terrenos <strong>de</strong> <strong>la</strong> cuenca media y baja son lechos aluviales.<br />
Los cauces <strong>de</strong> <strong>la</strong> mayoría <strong>de</strong> <strong>la</strong>s quebradas existentes en <strong>la</strong> cuenca <strong>de</strong>l <strong>río</strong> Huancané, son<br />
cauces <strong>de</strong> drenaje <strong>de</strong> carácter endorreico y <strong>de</strong> régimen estacional.<br />
Según el inventario realizado en el presente estudio, existen 727 quebradas en <strong>la</strong> cuenca<br />
Huancané y distribuidas en <strong>la</strong>s subcuencas Bajo Huancané 26 quebradas, L<strong>la</strong>che 39, Medio<br />
Bajo Huancané 7, Tuyto 272, Medio Huancané 39, Muñani 176, Medio Alto Huancané 8,<br />
Pistune 64 y Alto Huancané 96 quebradas. En el Cuadro Nº 3.19 se presenta <strong>la</strong> cantidad <strong>de</strong><br />
quebradas por subcuencas.<br />
3.9.1.3 Manantial<br />
Quebradas <strong>de</strong> <strong>la</strong> cuenca Huancané<br />
Es una fuente natural <strong>de</strong> agua que aflora <strong>de</strong> <strong>la</strong> tierra o entre <strong>la</strong>s rocas, pue<strong>de</strong> ser permanente<br />
o temporal. Denominado también manante y en nuestro medio andino como puquio. Se<br />
origina <strong>de</strong> <strong>la</strong> filtración <strong>de</strong> agua, <strong>de</strong> lluvia o <strong>de</strong> nieve, que penetra en un área <strong>de</strong>terminada y<br />
emerge en otra, <strong>de</strong> menor altitud, don<strong>de</strong> el agua no está confinada en un conducto<br />
impermeable.<br />
Los manantiales recubren singu<strong>la</strong>r importancia en todo el ámbito <strong>de</strong> <strong>la</strong> cuenca, pues sus<br />
aguas, que generalmente son <strong>de</strong> buena calidad, son utilizadas para el consumo pob<strong>la</strong>cional,<br />
pecuario, piscicultura y <strong>de</strong> riego. Esta fuente en mayor cantidad existe en <strong>la</strong>s subcuencas<br />
Tuyto, Muñani y Alto Huancané. Esta fuente es vital para <strong>la</strong> subsistencia <strong>de</strong>l medio<br />
biológico, ya que en muchos sectores es <strong>la</strong> única fuente que suministra el recurso hídrico<br />
en forma permanente.<br />
MINAG-ANA-DCPRH-AGUAS SUPERFICIALES Pág.88
<strong>Estudio</strong> <strong>Hidrológico</strong> <strong>de</strong> <strong>la</strong>s <strong>Cuenca</strong>s Huancané y Suches 2010<br />
De acuerdo al inventario realizado en el presente estudio, existen 833 manantiales en <strong>la</strong><br />
cuenca Huancané y distribuidas en <strong>la</strong>s subcuencas Bajo Huancané 89 manantiales, L<strong>la</strong>che<br />
63, Medio Bajo Huancané 9, Tuyto 161, Medio Huancané 51, Muñani 152, Medio Alto<br />
Huancané 10, Pistune 90 y Alto Huancané 208 manantiales. En el Cuadro Nº 3.19 se<br />
presenta <strong>la</strong> cantidad <strong>de</strong> manantiales por subcuencas.<br />
3.9.1.4 Laguna<br />
Manantiales <strong>de</strong> <strong>la</strong> cuenca Huancané<br />
Depósito natural <strong>de</strong> agua <strong>de</strong> régimen temporal y permanente, se caracteriza por ser <strong>de</strong><br />
dimensión menor que un <strong>la</strong>go.<br />
En <strong>la</strong> cuenca <strong>de</strong>l <strong>río</strong> Huancané, en <strong>de</strong>presiones <strong>de</strong> terreno se formaron los almacenamientos<br />
<strong>de</strong> agua o <strong>la</strong>gunas, ubicadas en <strong>la</strong> zona baja, media y alta <strong>de</strong> <strong>la</strong> cuenca.<br />
Mediante el inventario <strong>de</strong> fuente hídricas realizado en el presente estudio, existen 86<br />
<strong>la</strong>gunas en <strong>la</strong> cuenca Huancané y distribuidas en <strong>la</strong>s subcuencas Bajo Huancané 9 <strong>la</strong>gunas,<br />
Medio Bajo Huancané 1, Tuyto 37, Medio Huancané 7, Muñani 16, Medio Alto Huancané<br />
1, Pistune 2 y Alto Huancané 13 <strong>la</strong>gunas. En el Cuadro Nº 3.18 se presenta <strong>la</strong> cantidad <strong>de</strong><br />
<strong>la</strong>gunas por subcuencas.<br />
Lagunas <strong>de</strong> <strong>la</strong> cuenca Huancané<br />
MINAG-ANA-DCPRH-AGUAS SUPERFICIALES Pág.89
<strong>Estudio</strong> <strong>Hidrológico</strong> <strong>de</strong> <strong>la</strong>s <strong>Cuenca</strong>s Huancané y Suches 2010<br />
3.9.2 <strong>Cuenca</strong> Suches (Perú)<br />
En <strong>la</strong> cuenca <strong>de</strong>l <strong>río</strong> Suches según el inventario realizado, existen un total <strong>de</strong> 482 fuentes<br />
<strong>de</strong>l recurso hídrico superficial, distribuidas en 8 <strong>río</strong>s, 157 quebradas, 207 manantiales, 65<br />
<strong>la</strong>gunas, 38 bofedales y 7 nevados.<br />
La distribución <strong>de</strong> <strong>la</strong>s fuentes hídricas en <strong>la</strong>s subcuencas <strong>de</strong>l total <strong>de</strong> <strong>la</strong> cuenca, es <strong>la</strong><br />
siguiente: subcuenca Suches 84 fuentes (17.43%), subcuenca Chueña Huata Jahuira 58<br />
fuentes (12.03%), subcuenca Caylloma 182 fuentes (37.76%) y subcuenca Trapiche 158<br />
fuentes (32.78%). La mayor concentración <strong>de</strong> fuentes hídricas (<strong>la</strong>gunas) se dan en <strong>la</strong>s<br />
subcuencas Suches, Chueña Huata Jahuira y Trapiche, lo que significa que <strong>la</strong>s 61 <strong>la</strong>gunas<br />
existentes naturalmente almacenadas, tienen una importante contribución en <strong>la</strong> retención<br />
<strong>de</strong> <strong>la</strong> cuenca.<br />
En el Cuadro Nº 3.21 se muestra <strong>la</strong> cantidad <strong>de</strong> fuentes hídricas por subcuencas y en el<br />
Cuadro Nº 3.22 se presenta cantidad <strong>de</strong> fuentes hídricas por el tipo <strong>de</strong> uso. En <strong>la</strong>s Figuras<br />
Nº 3.9 y 3.10 se aprecia <strong>la</strong> distribución <strong>de</strong> <strong>la</strong>s fuentes <strong>de</strong> agua superficial en <strong>la</strong> cuenca<br />
Suches y subcuencas.<br />
Nº Unidad hidrográfica<br />
Cuadro Nº 3.21 Fuentes <strong>de</strong> agua superficial - <strong>Cuenca</strong> <strong>de</strong>l <strong>río</strong> Suches (Perú)<br />
Río Quebrada Manantial Laguna Bofedal Nevado<br />
1 Suches 303.90 5 31 22 14 11 1 84<br />
2 Chueña Huata Jahuira 162.18 1 31 10 16 0 0 58<br />
3 Caylloma 289.22 1 37 136 4 4 0 182<br />
4 Trapiche 405.45 1 58 39 31 23 6 158<br />
Total<br />
Área<br />
(km 2 )<br />
Número <strong>de</strong> fuentes <strong>de</strong> agua superficial<br />
1160.75 8 157 207 65 38 7 482<br />
Figura Nº 3.9 Fuentes <strong>de</strong> agua superficial en <strong>la</strong> cuenca <strong>de</strong>l <strong>río</strong> Suches (Perú)<br />
Bofedal<br />
38 unida<strong>de</strong>s<br />
7.88%<br />
Laguna<br />
65 unida<strong>de</strong>s<br />
13.49%<br />
Manantial<br />
207 unida<strong>de</strong>s<br />
42.95%<br />
Nevado<br />
7 unida<strong>de</strong>s<br />
1.45%<br />
Río<br />
8 unida<strong>de</strong>s<br />
1.66%<br />
Quebrada<br />
157unida<strong>de</strong>s<br />
32.57%<br />
MINAG-ANA-DCPRH-AGUAS SUPERFICIALES Pág.90<br />
Total
<strong>Estudio</strong> <strong>Hidrológico</strong> <strong>de</strong> <strong>la</strong>s <strong>Cuenca</strong>s Huancané y Suches 2010<br />
Figura Nº 3.10 Fuentes <strong>de</strong> agua superficial por subcuencas en <strong>la</strong> cuenca <strong>de</strong>l <strong>río</strong> Suches (Perú)<br />
Trapiche<br />
158 fuentes<br />
hídricas<br />
32.78%<br />
Caylloma<br />
182 fuentes<br />
hídricas<br />
37.76%<br />
Suches<br />
84 fuentes<br />
hídricas<br />
17.43%<br />
Chueña Huata<br />
Jahuira<br />
58 fuentes<br />
hídricas<br />
12.03%<br />
Cuadro Nº 3.22 Fuentes <strong>de</strong> agua superficial por tipo <strong>de</strong> uso - <strong>Cuenca</strong> <strong>de</strong>l <strong>río</strong> Suches (Perú)<br />
Nº Unidad hidrográfica<br />
Número <strong>de</strong> fuentes <strong>de</strong> agua superficial por tipo <strong>de</strong> uso<br />
S/U PO PE PI AG MIN AG/PE AG/PO PO/PE PE/MIN<br />
1 Suches 44 - 22 - 16 - 1 - - 1 84<br />
2 Chueña Huata Jahuira 34 1 12 - 11 - - - - - 58<br />
3 Caylloma 29 - 65 1 47 - 40 - - - 182<br />
4 Trapiche 72 - 41 - 34 1 9 1 - - 158<br />
Total<br />
179 1 140 1 108 1 50 1 - 1 482<br />
Leyenda: S/U=Sin Uso, PO=Pob<strong>la</strong>cional, PE=Pecuario, PI=Piscíco<strong>la</strong>, AG=Agríco<strong>la</strong>, MI=Minero, AG/PE=Agríco<strong>la</strong>/Pecuario,<br />
AG/PO=Agríco<strong>la</strong>/Pob<strong>la</strong>cional, PO/PE=Pob<strong>la</strong>cional/Pecuario, PE/MI=Pecuario/Minero.<br />
A continuación se <strong>de</strong>scribe, en forma breve, cada una <strong>de</strong> <strong>la</strong>s fuentes <strong>de</strong>l recurso hídrico <strong>de</strong><br />
<strong>la</strong> cuenca Suches (Perú).<br />
3.9.2.1 Río<br />
Según el inventario <strong>de</strong> fuentes <strong>de</strong> agua, se han i<strong>de</strong>ntificado 8 <strong>río</strong>s, los cuales son <strong>de</strong><br />
régimen continuo. A<strong>de</strong>más, <strong>la</strong> cuenca <strong>de</strong>l <strong>río</strong> Suches siendo <strong>de</strong> or<strong>de</strong>n cinco tiene 164<br />
afluentes entre <strong>río</strong>s y quebradas <strong>de</strong> diferentes grados <strong>de</strong> ramificación. En el Cuadro Nº 3.21<br />
se presenta <strong>la</strong> distribución <strong>de</strong> los <strong>río</strong>s por subcuencas.<br />
MINAG-ANA-DCPRH-AGUAS SUPERFICIALES Pág.91<br />
Total
<strong>Estudio</strong> <strong>Hidrológico</strong> <strong>de</strong> <strong>la</strong>s <strong>Cuenca</strong>s Huancané y Suches 2010<br />
3.9.1.2 Quebrada<br />
Río Suches<br />
Los cauces <strong>de</strong> <strong>la</strong> mayoría <strong>de</strong> <strong>la</strong>s quebradas existentes en <strong>la</strong> cuenca <strong>de</strong>l <strong>río</strong> Suches (Perú),<br />
son cauces <strong>de</strong> drenaje <strong>de</strong> carácter endorreico y <strong>de</strong> régimen estacional.<br />
En <strong>la</strong> cuenca Suches, según el inventario <strong>de</strong> fuentes hídricas existen 157 quebradas. En el<br />
Cuadro Nº 3.21 se presenta <strong>la</strong> cantidad <strong>de</strong> quebradas por subcuencas.<br />
3.9.1.3 Manantial<br />
Quebradas <strong>de</strong> <strong>la</strong> cuenca Suches (Perú)<br />
Los manantiales recubren singu<strong>la</strong>r importancia en todo el ámbito <strong>de</strong> <strong>la</strong> cuenca, pues sus<br />
aguas, que generalmente son <strong>de</strong> buena calidad, son utilizadas para el consumo pob<strong>la</strong>cional,<br />
pecuario, piscicultura y <strong>de</strong> riego. Esta fuente en mayor cantidad existe en <strong>la</strong> subcuenca<br />
Caylloma. Esta fuente es vital para <strong>la</strong> subsistencia <strong>de</strong>l medio biológico, ya que en muchos<br />
sectores son <strong>la</strong> única fuente que suministra el recurso hídrico en forma permanente.<br />
De acuerdo al inventario <strong>de</strong> fuentes hídricas, existen 207 manantiales en <strong>la</strong> cuenca Suches.<br />
En el Cuadro Nº 3.21 se presenta <strong>la</strong> cantidad <strong>de</strong> quebradas por subcuencas.<br />
MINAG-ANA-DCPRH-AGUAS SUPERFICIALES Pág.92
<strong>Estudio</strong> <strong>Hidrológico</strong> <strong>de</strong> <strong>la</strong>s <strong>Cuenca</strong>s Huancané y Suches 2010<br />
3.9.1.4 Laguna<br />
Manantiales <strong>de</strong> <strong>la</strong> cuenca Suches (Perú)<br />
En <strong>la</strong> cuenca <strong>de</strong>l <strong>río</strong> Huancané, en <strong>de</strong>presiones <strong>de</strong> terreno se formaron los almacenamientos<br />
<strong>de</strong> agua o <strong>la</strong>gunas, ubicadas en <strong>la</strong> mayoría en <strong>la</strong> zona alta <strong>de</strong> <strong>la</strong> cuenca.<br />
Mediante el inventario <strong>de</strong> fuente hídricas realizado en el presente estudio, existen 65<br />
<strong>la</strong>gunas en <strong>la</strong> cuenca Suches. En el Cuadro Nº 3.21 se presenta <strong>la</strong> cantidad <strong>de</strong> <strong>la</strong>gunas por<br />
subcuencas.<br />
3.9.1.5 Bofedal<br />
Lagunas <strong>de</strong> <strong>la</strong> cuenca Suches (Perú)<br />
Zona húmeda con presencia <strong>de</strong> pastizales, generalmente se encuentra en zonas alto<br />
andinas. En <strong>la</strong>s p<strong>la</strong>nicies almacenan aguas provenientes <strong>de</strong> precipitaciones pluviales,<br />
<strong>de</strong>shielo <strong>de</strong> g<strong>la</strong>ciares y afloramientos superficiales <strong>de</strong> aguas subterráneas.<br />
En <strong>la</strong> cuenca Suches existen 38 áreas cubiertas por bofedales, según el inventario <strong>de</strong><br />
fuentes hídricas realizadas en el presente estudio. En el Cuadro Nº 3.21 se muestran <strong>la</strong><br />
cantidad <strong>de</strong> bofedales por subcuencas.<br />
MINAG-ANA-DCPRH-AGUAS SUPERFICIALES Pág.93
<strong>Estudio</strong> <strong>Hidrológico</strong> <strong>de</strong> <strong>la</strong>s <strong>Cuenca</strong>s Huancané y Suches 2010<br />
3.9.1.6 Nevado<br />
Bofedales <strong>de</strong> <strong>la</strong> cuenca Suches (Perú)<br />
El nevado es una masa gruesa <strong>de</strong> hielo, que se origina en <strong>la</strong> superficie terrestre por<br />
acumu<strong>la</strong>ción, compactación y recristalización <strong>de</strong> <strong>la</strong> nieve, mostrando evi<strong>de</strong>ncias <strong>de</strong> flujo en<br />
el pasado o en <strong>la</strong> actualidad. Su existencia es posible cuando <strong>la</strong> precipitación anual <strong>de</strong><br />
nieve supera <strong>la</strong> evaporada en verano, por lo cual <strong>la</strong> mayoría se encuentra en zonas cercanas<br />
a los polos, aunque existen en zonas montañosas.<br />
Existen 7 áreas cubiertas por nevado en <strong>la</strong> cuenca Suches, localizada en <strong>la</strong> zona norte <strong>de</strong> <strong>la</strong><br />
cuenca. En el Cuadro Nº 3.21 se muestran <strong>la</strong> cantidad <strong>de</strong> nevados por subcuencas.<br />
Nevado Palomani<br />
(aguas <strong>de</strong> <strong>de</strong>shielo fluye hacia <strong>la</strong><br />
<strong>la</strong>guna Suches).<br />
Nevado Ananea Gran<strong>de</strong><br />
(pico más alto <strong>de</strong> <strong>la</strong> cuenca 5820<br />
msnm, aguas <strong>de</strong> <strong>de</strong>shielo fluye<br />
hacia el <strong>río</strong> Trapiche).<br />
MINAG-ANA-DCPRH-AGUAS SUPERFICIALES Pág.94
<strong>Estudio</strong> <strong>Hidrológico</strong> <strong>de</strong> <strong>la</strong>s <strong>Cuenca</strong>s Huancané y Suches 2010<br />
CAPÍTULO IV<br />
CLIMATOLOGÍA DE LA CUENCA<br />
El año se divi<strong>de</strong> en cuatro estaciones astronómicas en función <strong>de</strong> <strong>la</strong> actividad atmosférica y<br />
<strong>de</strong> <strong>la</strong> circu<strong>la</strong>ción <strong>de</strong> masas <strong>de</strong> aire, no obstante <strong>de</strong>s<strong>de</strong> el punto <strong>de</strong> vista climatológico, <strong>la</strong><br />
región <strong>de</strong> <strong>la</strong>s cuencas Huancané y Suches tienen una estación húmeda (diciembre a marzo),<br />
otra seca (mayo a agosto) y dos periodos <strong>de</strong> transición (abril y septiembre a noviembre).<br />
En <strong>la</strong> estación primavera (setiembre-noviembre), verano (diciembre-febrero), otoño<br />
(marzo-mayo) e invierno (junio-agosto); el viento dominante viene <strong>de</strong>l norte-este<br />
generalmente.<br />
Otro aspecto localizado sobre <strong>la</strong> región es <strong>la</strong> anomalía <strong>de</strong>presionaria provocada por el<br />
fuerte calentamiento <strong>de</strong>l suelo árido. En efecto, <strong>la</strong> altitud media <strong>de</strong> <strong>la</strong> cuenca Huancané es<br />
entorno a 4212 msnm, y cuya presión atmosférica media es <strong>de</strong> 604 mb. Esta situación<br />
provoca fuertes movimientos convectivos, a <strong>la</strong> que se aña<strong>de</strong> <strong>la</strong> humedad producida por <strong>la</strong><br />
evaporación <strong>de</strong>l <strong>la</strong>go Titicaca, da como resultado <strong>la</strong> formación <strong>de</strong> gran<strong>de</strong>s nubes cúmulos y<br />
cumulonimbos sobre <strong>la</strong> región.<br />
Los principales parámetros climáticos que <strong>de</strong>finen o caracterizan el clima en una cuenca<br />
hidrográfica es <strong>la</strong> siguiente: precipitación, temperatura, humedad re<strong>la</strong>tiva y evaporación;<br />
son los <strong>de</strong> mayor importancia en cuanto a <strong>la</strong> tipificación o caracterización <strong>de</strong> <strong>la</strong><br />
climatología <strong>de</strong> <strong>la</strong>s cuencas Huancané y Suches. Estos parámetros provienen <strong>de</strong> los<br />
registros históricos <strong>de</strong> <strong>la</strong>s distintas estaciones meteorológicas insta<strong>la</strong>das en <strong>la</strong>s cuencas y<br />
zonas aledañas (<strong>de</strong>scritas en el Cuadro Nº 2.2 en el Capítulo 2) y administradas por el<br />
Servicio Nacional <strong>de</strong> Meteorología e Hidrología (SENAMHI). En el Anexo 1 (Volumen II)<br />
se presenta <strong>la</strong> información meteorológica histórica <strong>de</strong> <strong>la</strong>s variables arriba indicadas.<br />
La información utilizada en el presente estudio, para caracterizar el clima en el área <strong>de</strong>l<br />
proyecto, correspon<strong>de</strong> a <strong>la</strong>s estaciones <strong>de</strong> Huancané, Putina, Muñani, Huaraya Moho,<br />
Cojata, Suches, Ananea, Crucero, Progreso, Azángaro, Arapa, Taraco, Conima, Puerto<br />
Acosta, Escoma y Chahuaya. Los parámetros analizados son precipitación, temperatura,<br />
humedad re<strong>la</strong>tiva, evaporación, horas <strong>de</strong> sol y viento, correspondiente a <strong>la</strong> información<br />
histórica generalmente, y evapotranspiración potencial generada en cada una <strong>de</strong> <strong>la</strong>s<br />
estaciones meteorológicas consi<strong>de</strong>radas en el presente estudio.<br />
De acuerdo a <strong>la</strong> evaluación climatológica, los factores más importantes <strong>de</strong>l clima son<br />
generalmente <strong>la</strong> altitud y <strong>la</strong> <strong>la</strong>titud, ellos <strong>de</strong>finen <strong>la</strong>s características particu<strong>la</strong>res <strong>de</strong>l clima,<br />
el efecto orográfico y <strong>la</strong>s amplias osci<strong>la</strong>ciones <strong>de</strong> temperatura y los fuertes vientos.<br />
MINAG-ANA-DCPRH-AGUAS SUPERFICIALES Pág.95
<strong>Estudio</strong> <strong>Hidrológico</strong> <strong>de</strong> <strong>la</strong>s <strong>Cuenca</strong>s Huancané y Suches 2010<br />
4.1 PARÁMETROS CLIMATOLÓGICOS<br />
4.1.1 Precipitación<br />
La precipitación es <strong>la</strong> fase <strong>de</strong>l ciclo hidrológico que da origen a todas <strong>la</strong>s corrientes<br />
superficiales y profundas, <strong>de</strong>bido a lo cual su evaluación y el conocimiento <strong>de</strong> su<br />
distribución, tanto en el tiempo como en el espacio, son problemas básicos en hidrología.<br />
Se le pue<strong>de</strong> l<strong>la</strong>mar precipitación a cualquier tipo <strong>de</strong> agua que cae <strong>de</strong> <strong>la</strong>s nubes sobre <strong>la</strong><br />
superficie <strong>de</strong> <strong>la</strong> tierra, ya sea en estado sólido o en estado líquido, esto incluye lluvia,<br />
llovizna, nieve, granizo, generalmente, menos <strong>la</strong> neblina y rocío.<br />
La precipitación se consi<strong>de</strong>ra como <strong>la</strong> primera variable hidrológica y es <strong>la</strong> entrada natural<br />
<strong>de</strong> agua <strong>de</strong>ntro <strong>de</strong>l ba<strong>la</strong>nce hídrico <strong>de</strong> los agro-ecosistemas y <strong>de</strong> <strong>la</strong>s cuencas hidrográficas.<br />
Las pequeñas gotas <strong>de</strong> agua que forman <strong>la</strong>s nubes son <strong>de</strong> dimensiones tan diminutas que se<br />
necesita reunir unos cuantos <strong>de</strong> cientos <strong>de</strong> miles <strong>de</strong> estas gotitas para formar una gota <strong>de</strong><br />
llovizna, y varios millones para formar una gota gran<strong>de</strong> <strong>de</strong> lluvia, [Fuentes, 1989].<br />
A.- Régimen <strong>de</strong> <strong>la</strong> precipitación mensual<br />
Las características estacionales <strong>de</strong>l clima en <strong>la</strong> región <strong>de</strong> <strong>la</strong>s cuencas <strong>de</strong> los <strong>río</strong>s Huancané<br />
y Suches, se manifiestan principalmente en <strong>la</strong> variación <strong>de</strong>l régimen <strong>de</strong> <strong>la</strong>s precipitaciones.<br />
Se sabe que los cultivos no sólo son afectados por <strong>la</strong> poca precipitación anual, sino también<br />
por su irregu<strong>la</strong>r distribución a lo <strong>la</strong>rgo <strong>de</strong> todo el año.<br />
En el Cuadro Nº 4.1 se presenta el promedio multimensual <strong>de</strong> <strong>la</strong> precipitación total<br />
mensual correspondiente al pe<strong>río</strong>do 1956-2009 <strong>de</strong> cada una <strong>de</strong> <strong>la</strong>s estaciones<br />
meteorológicas, asimismo en <strong>la</strong>s Figuras Nº 4.1 y 4.2 se aprecian <strong>la</strong> uniformidad <strong>de</strong> <strong>la</strong><br />
variación mensual <strong>de</strong> <strong>la</strong> precipitación en todas <strong>la</strong>s estaciones, lo que <strong>de</strong>muestra el carácter<br />
estacional <strong>de</strong> <strong>la</strong> precipitación en toda <strong>la</strong> región.<br />
El comportamiento estacional <strong>de</strong> <strong>la</strong> precipitación <strong>de</strong> <strong>la</strong>s estaciones meteorológicas<br />
consi<strong>de</strong>radas en el presente estudio, <strong>de</strong> acuerdo a los pe<strong>río</strong>dos <strong>de</strong> lluvia, invierno y meses<br />
<strong>de</strong> transición, se <strong>de</strong>tal<strong>la</strong>n a continuación al respecto <strong>de</strong> su totalidad, <strong>de</strong> <strong>la</strong> siguiente forma:<br />
El pe<strong>río</strong>do <strong>de</strong> lluvias <strong>de</strong> mayor magnitud comienza a partir <strong>de</strong>l mes <strong>de</strong> diciembre y se<br />
prolonga hasta marzo, correspon<strong>de</strong> el 66.92% en promedio <strong>de</strong> <strong>la</strong> estaciones, <strong>de</strong> <strong>la</strong>s<br />
precipitaciones totales anuales. El porcentaje <strong>de</strong> precipitación en pe<strong>río</strong>dos <strong>de</strong> avenida en<br />
<strong>la</strong>s estaciones meteorológicas osci<strong>la</strong>n entre 62.15 a 70.87%.<br />
El pe<strong>río</strong>do seco (invierno), compren<strong>de</strong> los meses <strong>de</strong> mayo a setiembre, <strong>la</strong>s precipitaciones<br />
con sus mínimos valores llegan a ser <strong>de</strong>l 10.15% en promedio <strong>de</strong> <strong>la</strong> estaciones, <strong>de</strong> <strong>la</strong>s<br />
precipitaciones totales anuales. El porcentaje <strong>de</strong> precipitación en pe<strong>río</strong>dos <strong>de</strong> estiaje en <strong>la</strong>s<br />
estaciones varían <strong>de</strong> 6.45 a 14.95%.<br />
MINAG-ANA-DCPRH-AGUAS SUPERFICIALES Pág.96
<strong>Estudio</strong> <strong>Hidrológico</strong> <strong>de</strong> <strong>la</strong>s <strong>Cuenca</strong>s Huancané y Suches 2010<br />
Los meses transitorios correspon<strong>de</strong>n a abril, octubre y noviembre, presentan el 22.93% en<br />
promedio <strong>de</strong> <strong>la</strong>s estaciones, <strong>de</strong> <strong>la</strong>s precipitaciones totales anuales. El porcentaje <strong>de</strong><br />
precipitación en pe<strong>río</strong>dos <strong>de</strong> transición en <strong>la</strong>s estaciones meteorológicas osci<strong>la</strong>n entre 18.73<br />
a 25.65%, respectivamente.<br />
En el Cuadro Nº 4.2 se muestra <strong>la</strong> variación porcentual <strong>de</strong> <strong>la</strong>s precipitaciones totales<br />
mensuales <strong>de</strong> cada estación meteorológica.<br />
Estación<br />
Cuadro N° 4.1 Precipitación total mensual (mm) – Promedio multimensual (1956-2009)<br />
Estaciones <strong>de</strong> <strong>la</strong>s cuencas Huancané, Suches y cuencas vecinas<br />
Ene Feb Mar Abr May Jun Jul Ago Sep Oct Nov Dic<br />
Huancané 3840.0 140.4 109.6 102.1 42.6 12.0 4.4 3.6 10.6 30.7 46.9 63.4 111.4 677.7<br />
Putina 3856.0 147.8 105.3 101.5 52.5 13.4 4.9 3.9 8.7 30.6 48.3 73.5 102.8 693.2<br />
Muñani 3948.0 142.3 109.5 90.4 43.8 9.8 3.7 2.4 6.2 25.9 43.1 63.0 104.3 644.4<br />
Huaraya Moho 3832.0 200.2 141.7 120.5 57.8 21.8 8.1 7.0 16.5 46.3 57.8 73.0 134.4 885.1<br />
Cojata 4327.0 145.7 118.2 107.3 57.1 17.3 8.8 6.5 16.9 37.1 57.3 67.8 103.6 743.6<br />
Suches 4655.0 104.2 85.0 89.8 39.9 12.0 3.6 4.3 8.6 28.6 41.3 53.3 70.2 540.8<br />
Ananea 4640.0 122.3 100.0 87.5 44.6 18.5 6.4 11.8 14.9 24.7 45.8 56.5 88.7 621.7<br />
Crucero 4130.0 152.5 135.9 114.4 56.6 18.1 6.7 4.7 11.7 32.6 52.7 78.6 119.0 783.5<br />
Progreso 3940.0 129.3 98.4 99.8 42.5 8.8 1.8 2.6 6.2 20.2 43.2 67.3 94.4 614.5<br />
Azángaro 3848.0 126.2 95.8 90.9 41.8 8.1 3.0 1.9 8.1 25.3 42.1 72.4 93.8 609.4<br />
Arapa 3830.0 146.8 109.8 114.5 52.0 12.7 5.9 3.2 12.2 30.2 49.0 61.3 98.2 695.8<br />
Taraco 3820.0 134.6 99.8 89.5 39.7 6.6 4.7 1.9 8.8 26.1 36.9 51.3 91.4 591.3<br />
Conima 3860.0 207.8 143.6 133.2 70.6 11.2 6.6 8.6 10.8 33.9 50.3 57.4 122.4 856.4<br />
Puerto Acosta 3835.0 146.1 122.9 84.7 52.8 23.2 11.7 8.9 20.4 44.6 50.4 63.1 97.9 726.7<br />
Escoma 3828.0 94.9 80.2 82.5 41.8 23.8 4.0 4.7 9.6 31.5 24.6 30.4 65.6 493.6<br />
Chahuaya 4500.0 163.0 91.2 89.2 37.5 19.0 8.0 10.0 12.4 31.0 34.4 50.2 105.8 651.6<br />
Estación<br />
Altitud<br />
(msnm)<br />
Altitud<br />
(msnm)<br />
Cuadro Nº 4.2 Porcentaje <strong>de</strong> variación <strong>de</strong> <strong>la</strong> precipitación total mensual (%)<br />
Estaciones <strong>de</strong> <strong>la</strong>s cuencas Huancané, Suches y cuencas vecinas<br />
MINAG-ANA-DCPRH-AGUAS SUPERFICIALES Pág.97<br />
Mes<br />
Ene Feb Mar Abr May Jun Jul Ago Sep Oct Nov Dic<br />
Huancané 3840.0 20.72 16.17 15.07 6.29 1.77 0.65 0.53 1.56 4.53 6.92 9.35 16.44 100.00<br />
Putina 3856.0 21.32 15.19 14.64 7.57 1.93 0.71 0.56 1.26 4.42 6.97 10.60 14.83 100.00<br />
Muñani 3948.0 22.08 16.99 14.03 6.80 1.52 0.57 0.37 0.96 4.02 6.69 9.78 16.19 100.00<br />
Huaraya Moho 3832.0 22.62 16.01 13.61 6.53 2.46 0.92 0.79 1.86 5.23 6.53 8.25 15.19 100.00<br />
Cojata 4327.0 19.59 15.90 14.43 7.68 2.33 1.18 0.87 2.27 4.99 7.71 9.12 13.93 100.00<br />
Suches 4655.0 19.260 15.720 16.60 7.38 2.22 0.66 0.80 1.59 5.29 7.64 9.86 12.98 100.00<br />
Ananea 4640.0 19.67 16.08 14.07 7.17 2.98 1.03 1.90 2.40 3.97 7.37 9.09 14.27 100.00<br />
Crucero 4130.0 19.46 17.35 14.60 7.22 2.31 0.86 0.60 1.49 4.16 6.73 10.03 15.19 100.00<br />
Progreso 3940.0 21.04 16.01 16.24 6.92 1.43 0.29 0.43 1.01 3.29 7.03 10.95 15.36 100.00<br />
Azángaro 3848.0 20.71 15.72 14.92 6.86 1.33 0.49 0.31 1.33 4.15 6.91 11.88 15.39 100.00<br />
Arapa 3830.0 21.10 15.78 16.46 7.47 1.83 0.85 0.46 1.75 4.34 7.04 8.81 14.11 100.00<br />
Taraco 3820.0 22.76 16.88 15.14 6.71 1.12 0.79 0.32 1.49 4.41 6.24 8.68 15.46 100.00<br />
Conima 3860.0 24.26 16.77 15.55 8.24 1.31 0.77 1.01 1.26 3.96 5.88 6.70 14.29 100.00<br />
Puerto Acosta 3835.0 20.10 16.91 11.66 7.27 3.19 1.61 1.22 2.80 6.13 6.94 8.69 13.48 100.00<br />
Escoma 3828.0 19.22 16.25 16.72 8.48 4.82 0.80 0.96 1.94 6.38 4.98 6.16 13.29 100.00<br />
Chahuaya 4500.0 25.01 14.00 13.70 5.75 2.91 1.23 1.53 1.90 4.76 5.28 7.70 16.23 100.00<br />
Mes<br />
Total<br />
Anual<br />
Total<br />
Anual
<strong>Estudio</strong> <strong>Hidrológico</strong> <strong>de</strong> <strong>la</strong>s <strong>Cuenca</strong>s Huancané y Suches 2010<br />
Precipitación (mm)<br />
Figura Nº 4.1 Variación mensual <strong>de</strong> <strong>la</strong> precipitación (mm) – Promedio multimensual (1956-2009)<br />
Estaciones <strong>de</strong> <strong>la</strong>s cuencas Huancané, Suches y cuencas vecinas<br />
225.0<br />
200.0<br />
175.0<br />
150.0<br />
125.0<br />
100.0<br />
75.0<br />
50.0<br />
25.0<br />
0.0<br />
Ene Feb Mar Abr May Jun Jul Ago Sep Oct Nov Dic<br />
Tiempo (mes)<br />
Huancané<br />
MINAG-ANA-DCPRH-AGUAS SUPERFICIALES Pág.98<br />
Putina<br />
Muñani<br />
Huaraya Moho<br />
Cojata<br />
Suches<br />
Ananea<br />
Crucero<br />
Progreso<br />
Azángaro<br />
Arapa<br />
Taraco<br />
Conima<br />
Puerto Acosta<br />
Escoma<br />
Chahuaya<br />
En <strong>la</strong> Figura Nº 4.2 se muestra <strong>la</strong> variación mensual <strong>de</strong> <strong>la</strong>s precipitaciones, <strong>de</strong> <strong>la</strong>s<br />
estaciones meteorológicas consi<strong>de</strong>radas en el presente estudio, don<strong>de</strong> se aprecia <strong>la</strong><br />
ten<strong>de</strong>ncia <strong>de</strong> <strong>la</strong> época <strong>de</strong> lluvias, seco y transición.<br />
Según los gráficos <strong>de</strong> <strong>la</strong>s precipitaciones promedios multimensuales, se podría resaltar que,<br />
en todas <strong>la</strong>s estaciones meteorológicas <strong>la</strong> precipitación tiene el mismo comportamiento.<br />
Precipitación (mm)<br />
Figura Nº 4.2 Variación mensual <strong>de</strong> <strong>la</strong> precipitación (mm) – Promedio multimensual (1956-2009)<br />
Estaciones <strong>de</strong> <strong>la</strong>s cuencas Huancané, Suches y cuencas vecinas<br />
240<br />
200<br />
160<br />
120<br />
80<br />
40<br />
0<br />
140.4<br />
109.6 102.1<br />
Estación Huancané<br />
42.6<br />
12.0<br />
4.4 3.6<br />
10.6<br />
30.7<br />
46.9<br />
63.4<br />
111.4<br />
Ene Feb Mar Abr May Jun Jul Ago Sep Oct Nov Dic<br />
Tiempo (mes)<br />
Precipitación (mm)<br />
240<br />
200<br />
160<br />
120<br />
80<br />
40<br />
0<br />
147.8<br />
105.3 101.5<br />
Estación Putina<br />
52.5<br />
13.4<br />
4.9 3.9<br />
8.7<br />
30.6<br />
48.3<br />
73.5<br />
102.8<br />
Ene Feb Mar Abr May Jun Jul Ago Sep Oct Nov Dic<br />
Tiempo (mes)
<strong>Estudio</strong> <strong>Hidrológico</strong> <strong>de</strong> <strong>la</strong>s <strong>Cuenca</strong>s Huancané y Suches 2010<br />
Precipitación (mm)<br />
Precipitación (mm)<br />
Precipitación (mm)<br />
Precipitación (mm)<br />
240<br />
200<br />
160<br />
120<br />
80<br />
40<br />
0<br />
240<br />
200<br />
160<br />
120<br />
80<br />
40<br />
0<br />
240<br />
200<br />
160<br />
120<br />
80<br />
40<br />
0<br />
240<br />
200<br />
160<br />
120<br />
80<br />
40<br />
0<br />
142.3<br />
109.5<br />
90.4<br />
Estación Muñani<br />
43.8<br />
9.8<br />
3.7 2.4 6.2<br />
25.9<br />
43.1<br />
63.0<br />
104.3<br />
Ene Feb Mar Abr May Jun Jul Ago Sep Oct Nov Dic<br />
145.7<br />
118.2 107.3<br />
57.1<br />
17.3<br />
Tiempo (mes)<br />
8.8 6.5<br />
16.9<br />
37.1<br />
57.3 67.8<br />
103.6<br />
Ene Feb Mar Abr May Jun Jul Ago Sep Oct Nov Dic<br />
122.3<br />
100.0<br />
87.5<br />
Estación Cojata<br />
44.6<br />
18.5<br />
Tiempo (mes)<br />
6.4<br />
11.8<br />
14.9 24.7<br />
45.8 56.5<br />
88.7<br />
Ene Feb Mar Abr May Jun Jul Ago Sep Oct Nov Dic<br />
129.3<br />
98.4 99.8<br />
Estación Ananea<br />
Tiempo (mes)<br />
Estación Progreso<br />
42.5<br />
8.8<br />
1.8 2.6 6.2<br />
20.2<br />
43.2<br />
67.3<br />
94.4<br />
Ene Feb Mar Abr May Jun Jul Ago Sep Oct Nov Dic<br />
Tiempo (mes)<br />
MINAG-ANA-DCPRH-AGUAS SUPERFICIALES Pág.99<br />
Precipitación (mm)<br />
Precipitación (mm)<br />
Precipitación (mm)<br />
Precipitación (mm)<br />
240<br />
200<br />
160<br />
120<br />
80<br />
40<br />
0<br />
240<br />
200<br />
160<br />
120<br />
80<br />
40<br />
0<br />
240<br />
200<br />
160<br />
120<br />
80<br />
40<br />
0<br />
240<br />
200<br />
160<br />
120<br />
80<br />
40<br />
0<br />
200.2<br />
141.7<br />
120.5<br />
Estación Huaraya Moho<br />
57.8<br />
21.8<br />
8.1 7.0<br />
16.5<br />
46.3<br />
57.8<br />
73.0<br />
134.4<br />
Ene Feb Mar Abr May Jun Jul Ago Sep Oct Nov Dic<br />
104.2<br />
85.0 89.8<br />
39.9<br />
12.0<br />
Tiempo (mes)<br />
Estación Suches<br />
3.6 4.3 8.6<br />
28.6<br />
41.3<br />
53.3<br />
70.2<br />
Ene Feb Mar Abr May Jun Jul Ago Sep Oct Nov Dic<br />
152.5<br />
135.9<br />
114.4<br />
56.6<br />
18.1<br />
Tiempo (mes)<br />
Estación Crucero<br />
6.7 4.7<br />
11.7<br />
32.6<br />
52.7<br />
78.6<br />
119.0<br />
Ene Feb Mar Abr May Jun Jul Ago Sep Oct Nov Dic<br />
126.2<br />
95.8 90.9<br />
41.8<br />
8.1<br />
Tiempo (mes)<br />
Estación Azángaro<br />
3.0 1.9<br />
8.1<br />
25.3<br />
42.1<br />
72.4<br />
93.8<br />
Ene Feb Mar Abr May Jun Jul Ago Sep Oct Nov Dic<br />
Tiempo (mes)<br />
Continuación
<strong>Estudio</strong> <strong>Hidrológico</strong> <strong>de</strong> <strong>la</strong>s <strong>Cuenca</strong>s Huancané y Suches 2010<br />
Precipitación (mm)<br />
Precipitación (mm)<br />
Precipitación (mm)<br />
240<br />
200<br />
160<br />
120<br />
80<br />
40<br />
0<br />
240<br />
200<br />
160<br />
120<br />
80<br />
40<br />
0<br />
240<br />
200<br />
160<br />
120<br />
80<br />
40<br />
0<br />
146.8<br />
109.8 114.5<br />
Estación Arapa<br />
52.0<br />
12.7<br />
5.9 3.2<br />
12.2<br />
30.2<br />
49.0<br />
61.3<br />
98.2<br />
Ene Feb Mar Abr May Jun Jul Ago Sep Oct Nov Dic<br />
207.8<br />
143.6 133.2<br />
70.6<br />
Tiempo (mes)<br />
11.2 6.6 8.6 10.8<br />
33.9<br />
50.3 57.4<br />
122.4<br />
Ene Feb Mar Abr May Jun Jul Ago Sep Oct Nov Dic<br />
94.9<br />
80.2 82.5<br />
Estación Conima<br />
Tiempo (mes)<br />
Estación Escoma<br />
41.8<br />
23.8<br />
4.0 4.7<br />
9.6<br />
31.5 24.6 30.4<br />
65.6<br />
Ene Feb Mar Abr May Jun Jul Ago Sep Oct Nov Dic<br />
Tiempo (mes)<br />
Continuación<br />
MINAG-ANA-DCPRH-AGUAS SUPERFICIALES Pág.100<br />
Precipitación (mm)<br />
Precipitación (mm)<br />
Precipitación (mm)<br />
240<br />
200<br />
160<br />
120<br />
80<br />
40<br />
0<br />
240<br />
200<br />
160<br />
120<br />
80<br />
40<br />
0<br />
240<br />
200<br />
160<br />
120<br />
80<br />
40<br />
0<br />
134.6<br />
99.8 89.5<br />
Estación Taraco<br />
39.7<br />
6.6 4.7 1.9<br />
8.8<br />
26.1 36.9<br />
51.3<br />
91.4<br />
Ene Feb Mar Abr May Jun Jul Ago Sep Oct Nov Dic<br />
146.1<br />
122.9<br />
84.7<br />
52.8<br />
23.2<br />
Tiempo (mes)<br />
Estación Puerto Acosta<br />
11.7 8.9<br />
20.4<br />
44.6 50.4<br />
63.1<br />
97.9<br />
Ene Feb Mar Abr May Jun Jul Ago Sep Oct Nov Dic<br />
163.0<br />
91.2 89.2<br />
37.5<br />
19.0<br />
Tiempo (mes)<br />
Estación Chahuaya<br />
8.0 10.0 12.4<br />
31.0 34.4<br />
50.2<br />
105.8<br />
Ene Feb Mar Abr May Jun Jul Ago Sep Oct Nov Dic<br />
Tiempo (mes)<br />
En el Mapa Nº 4.1 se muestra <strong>la</strong> variación mensual <strong>de</strong> <strong>la</strong> precipitación, <strong>de</strong> <strong>la</strong>s estaciones<br />
meteorológicas ubicadas espacialmente en <strong>la</strong>s cuencas Huancané, Suches y cuencas<br />
vecinas.
<strong>Estudio</strong> <strong>Hidrológico</strong> <strong>de</strong> <strong>la</strong>s <strong>Cuenca</strong>s Huancané y Suches 2010<br />
Mapa Nº 4.1 Distribución <strong>de</strong> <strong>la</strong>s precipitaciones mensuales en <strong>la</strong>s cuencas Huancané y Suches<br />
MINAG-ANA-DCPRH-AGUAS SUPERFICIALES Pág.101
<strong>Estudio</strong> <strong>Hidrológico</strong> <strong>de</strong> <strong>la</strong>s <strong>Cuenca</strong>s Huancané y Suches 2010<br />
B.- Régimen <strong>de</strong> <strong>la</strong> precipitación anual<br />
La precipitación es una <strong>de</strong> <strong>la</strong>s variables climáticas más importantes que influyen en <strong>la</strong><br />
producción agríco<strong>la</strong>, puesto que <strong>la</strong> precipitación pluvial es normalmente <strong>la</strong> única fuente <strong>de</strong><br />
humedad proporcionada al suelo.<br />
En el entorno <strong>de</strong> <strong>la</strong>s cuencas <strong>de</strong> los <strong>río</strong>s Huancané y Suches, <strong>la</strong> altitud tiene su influencia en<br />
<strong>la</strong> precipitación, asimismo <strong>la</strong> influencia <strong>de</strong> <strong>la</strong> proximidad al <strong>la</strong>go Titicaca (el <strong>la</strong>go<br />
constituye el elemento termorregu<strong>la</strong>dor <strong>de</strong>l sistema y tiene un espejo <strong>de</strong> agua <strong>de</strong> 8400 km 2<br />
<strong>de</strong> superficie en promedio y un volumen <strong>de</strong> 930 km 3 a una altitud media <strong>de</strong> 3810 msnm y<br />
es consi<strong>de</strong>rado como el <strong>la</strong>go navegable más alto <strong>de</strong>l mundo, a<strong>de</strong>más es una fuente <strong>de</strong><br />
humedad extraordinaria a alturas en que <strong>la</strong>s masas <strong>de</strong> aire no reciben normalmente ningún<br />
nuevo aporte).<br />
La información pluviométrica utilizada en el presente estudio proviene <strong>de</strong> los registros <strong>de</strong><br />
doce (16) estaciones meteorológicas (ver Capítulo 2, ítem 2.6.2.2), <strong>de</strong> los cuales tres (3)<br />
están ubicadas <strong>de</strong>ntro <strong>de</strong> <strong>la</strong> cuenca Huancané, tres (3) en <strong>la</strong> cuenca Suches (Perú-Bolivia) y<br />
diez (10) fuera <strong>de</strong>l ámbito <strong>de</strong> <strong>la</strong>s cuencas en estudio.<br />
En <strong>la</strong> Figura Nº 4.3 se presenta en forma gráfica <strong>la</strong> distribución <strong>de</strong> precipitación total anual<br />
en <strong>la</strong> región <strong>de</strong> <strong>la</strong>s cuencas <strong>de</strong> los <strong>río</strong>s Huancané y Suches. Se observa que <strong>la</strong> precipitación<br />
total anual en <strong>la</strong> cuenca Huancané varía <strong>de</strong> 644.4 mm (Muñani) a 693.2 mm (Putina) y en<br />
<strong>la</strong> cuenca Suches varía <strong>de</strong> 493.6 mm (Escoma) a 743.6 mm (Cojata). Los valores más altos<br />
se registran en <strong>la</strong>s zonas <strong>de</strong> Huaraya-Moho y Conima, don<strong>de</strong> muestra <strong>la</strong> influencia <strong>de</strong>l<br />
efecto termorregu<strong>la</strong>dor <strong>de</strong>l <strong>la</strong>go Titicaca.<br />
Precipitación (mm)<br />
1200<br />
1000<br />
800<br />
600<br />
400<br />
200<br />
0<br />
Figura Nº 4.3 Precipitación total anual (mm) – Promedio multianual (1956-2009)<br />
Estaciones <strong>de</strong> <strong>la</strong>s cuencas Huancané, Suches y cuencas vecinas<br />
677.7<br />
Huancané<br />
693.2<br />
Putina<br />
644.4<br />
Muñani<br />
885.1<br />
Huaraya<br />
Moho<br />
743.6<br />
Cojata<br />
540.8<br />
Suches<br />
621.7<br />
Ananea<br />
MINAG-ANA-DCPRH-AGUAS SUPERFICIALES Pág.102<br />
783.5<br />
Crucero<br />
614.5 609.4<br />
Estación Meteorológica<br />
Progreso<br />
Azángaro<br />
695.8<br />
Arapa<br />
591.3<br />
Taraco<br />
856.4<br />
Conima<br />
726.7<br />
Puerto<br />
Acosta<br />
493.6<br />
Escoma<br />
651.6<br />
Chahuaya
<strong>Estudio</strong> <strong>Hidrológico</strong> <strong>de</strong> <strong>la</strong>s <strong>Cuenca</strong>s Huancané y Suches 2010<br />
En el Mapa Nº 4.2 se presenta <strong>la</strong> distribución espacial <strong>de</strong> <strong>la</strong> precipitación media anual<br />
(isoyetas) a nivel <strong>de</strong> <strong>la</strong>s cuencas <strong>de</strong> los <strong>río</strong>s Huancané y Suches. En <strong>la</strong> cuenca Huancané se<br />
observa que los valores <strong>de</strong> <strong>la</strong> precipitación varía <strong>de</strong> 650 a 900 mm, mientras en <strong>la</strong> cuenca<br />
Suches varía <strong>de</strong> 400 a 925 mm.<br />
En <strong>la</strong> cuenca Huancané, los valores altos se registran en el entorno <strong>de</strong>l <strong>la</strong>go Titicaca,<br />
localizada en <strong>la</strong> zona alta <strong>de</strong> <strong>la</strong> subcuenca <strong>de</strong>l <strong>río</strong> Tuyto (zona Huaraya-Moho y Conima), y<br />
los menores se registran en <strong>la</strong> zona norte (subcuenca Muñani y Alto Huancané) y sur<br />
(subcuenca Bajo Huancané y L<strong>la</strong>che) <strong>de</strong> <strong>la</strong> cuenca.<br />
En <strong>la</strong> cuenca Suches, los valores altos se registran en <strong>la</strong> zona fronteriza Perú-Bolivia lugar<br />
Cuchaul<strong>la</strong>, y los menores se registran en <strong>la</strong> zona norte (subcuenca Trapiche) y sur (entorno<br />
<strong>de</strong> <strong>la</strong>go Titicaca) <strong>de</strong> <strong>la</strong> cuenca.<br />
Según el mapa <strong>de</strong> distribución espacial <strong>de</strong> <strong>la</strong> precipitación anual en <strong>la</strong>s cuencas Huancané y<br />
Suches, muestra que <strong>la</strong> precipitación en <strong>la</strong> cuenca hidrográfica <strong>de</strong>l Titicaca, proviene <strong>de</strong>l<br />
Océano Atlántico, a<strong>de</strong>más se aprecia <strong>la</strong> influencia <strong>de</strong>l efecto termorregu<strong>la</strong>dor <strong>de</strong>l <strong>la</strong>go en <strong>la</strong><br />
parte baja <strong>de</strong> <strong>la</strong>s cuencas (zona Huaraya-Moho y Conima).<br />
Por otro <strong>la</strong>do, <strong>la</strong> variación <strong>de</strong> <strong>la</strong> precipitación en <strong>la</strong> cuenca, no es siempre <strong>de</strong>pendiente <strong>de</strong> <strong>la</strong><br />
ten<strong>de</strong>ncia positiva <strong>de</strong> <strong>la</strong> altitud, como en otras cuencas, sino que también varía <strong>de</strong> acuerdo<br />
a <strong>la</strong>s coor<strong>de</strong>nadas <strong>de</strong> <strong>la</strong>titud sur y longitud oeste.<br />
Si bien los volúmenes totales <strong>de</strong>l promedio anual, dan una buena visión <strong>de</strong> <strong>la</strong> distribución<br />
areal <strong>de</strong> <strong>la</strong> precipitación, hay que tener en cuenta que para <strong>la</strong>s activida<strong>de</strong>s agríco<strong>la</strong>s se hace<br />
necesario conocer <strong>la</strong> variación <strong>de</strong> <strong>la</strong> precipitación en forma estacional.<br />
Cabe recalcar, que el número <strong>de</strong> <strong>la</strong>s estaciones meteorológicas ubicadas <strong>de</strong>ntro <strong>de</strong> <strong>la</strong>s<br />
cuencas Huancané y Suches, es muy poco, <strong>de</strong>be insta<strong>la</strong>rse más estaciones generalmente en<br />
<strong>la</strong> zona media <strong>de</strong> ambas cuencas, para que <strong>de</strong> esta manera obtener una distribución más<br />
a<strong>de</strong>cuada.<br />
MINAG-ANA-DCPRH-AGUAS SUPERFICIALES Pág.103
<strong>Estudio</strong> <strong>Hidrológico</strong> <strong>de</strong> <strong>la</strong>s <strong>Cuenca</strong>s Huancané y Suches 2010<br />
Mapa Nº 4.2 Distribución espacial <strong>de</strong> <strong>la</strong> precipitación media anual (isoyetas) en <strong>la</strong>s cuencas Huancané y<br />
Suches<br />
MINAG-ANA-DCPRH-AGUAS SUPERFICIALES Pág.104
<strong>Estudio</strong> <strong>Hidrológico</strong> <strong>de</strong> <strong>la</strong>s <strong>Cuenca</strong>s Huancané y Suches 2010<br />
4.1.2 Temperatura <strong>de</strong>l aire<br />
La temperatura <strong>de</strong>l aire en <strong>la</strong> superficie <strong>de</strong> <strong>la</strong> tierra, es <strong>la</strong> temperatura comprendida entre<br />
1.25 y 2 m sobre el nivel <strong>de</strong>l suelo y es diferente a <strong>la</strong> temperatura <strong>de</strong>l suelo. Generalmente<br />
se admite que esta temperatura es representativa <strong>de</strong> <strong>la</strong>s condiciones a que están sometidos<br />
los seres vivos en <strong>la</strong> superficie <strong>de</strong> <strong>la</strong> tierra.<br />
La temperatura expresa numéricamente el efecto que en los cuerpos produce el calor<br />
originado por el ba<strong>la</strong>nce entre <strong>la</strong> radiación emitida y recibida. El aire se calienta o enfría a<br />
partir <strong>de</strong>l suelo por distintos métodos <strong>de</strong> transmisión y por los cambios <strong>de</strong> estado físico <strong>de</strong>l<br />
agua atmosférica.<br />
Es necesario subrayar que, <strong>la</strong> temperatura constituye un factor limitativo para el <strong>de</strong>sarrollo<br />
<strong>de</strong> <strong>la</strong>s p<strong>la</strong>ntas y en consecuencia <strong>de</strong> <strong>la</strong> agricultura, por lo que el estudio <strong>de</strong> esta variable<br />
merece una atención especial.<br />
Los registros <strong>de</strong> temperatura utilizados en el presente estudio, es <strong>la</strong> información recopi<strong>la</strong>da<br />
<strong>de</strong> instituciones <strong>de</strong> <strong>la</strong> región como el PELT y SENAMHI-Lima. La longitud <strong>de</strong>l registro<br />
histórico <strong>de</strong> temperaturas es variable, los datos faltantes se ha completado mediante una<br />
corre<strong>la</strong>ción múltiple con estaciones cercanas, aplicando el software hidrológico Hec-4.<br />
La temperatura <strong>de</strong>l aire <strong>de</strong> <strong>la</strong>s estaciones meteorológicas consi<strong>de</strong>radas en el presente<br />
estudio, se manifiestan <strong>de</strong> tres niveles: temperatura media, temperatura media <strong>de</strong> <strong>la</strong>s<br />
máximas diarias y temperatura media <strong>de</strong> <strong>la</strong>s mínimas diarias.<br />
A.- Régimen <strong>de</strong> temperatura media<br />
Debido a <strong>la</strong>s diferencias <strong>de</strong> altitud, exposición a los vientos y al sol e influencia <strong>de</strong>l <strong>la</strong>go<br />
Titicaca, existen algunas variaciones en <strong>la</strong> distribución <strong>de</strong> <strong>la</strong> temperatura media <strong>de</strong>l aire en<br />
<strong>la</strong>s cuencas. En toda <strong>la</strong> región <strong>la</strong>s temperaturas medias más bajas se producen en el mes <strong>de</strong><br />
Julio, mientras que <strong>la</strong>s más elevadas se registran en los meses <strong>de</strong> octubre a marzo, por lo<br />
general centradas en diciembre.<br />
Debido a <strong>la</strong> carencia <strong>de</strong> estadísticas <strong>de</strong> temperatura media en <strong>la</strong>s estaciones Suches,<br />
Conima, Escoma y Chahuaya, se ha estimado mediante el análisis <strong>de</strong> regresión lineal,<br />
corre<strong>la</strong>cionando los datos <strong>de</strong> <strong>la</strong> altitud y temperatura <strong>de</strong> <strong>la</strong>s estaciones con registros<br />
existentes.<br />
Ecuación <strong>de</strong> re<strong>la</strong>ción: Tmed = a + bH, don<strong>de</strong> H es <strong>la</strong> altitud en msnm.<br />
En <strong>la</strong> Figura Nº 4.4 se muestra los resultados <strong>de</strong>l análisis <strong>de</strong> regresión lineal, don<strong>de</strong> se ha<br />
corre<strong>la</strong>cionado <strong>la</strong> temperatura media mensual con <strong>la</strong> altitud. Los resultados <strong>de</strong>l análisis<br />
entre <strong>la</strong>s variables analizadas, dan una buena corre<strong>la</strong>ción.<br />
En el Cuadro Nº 4.3 se presenta los parámetros <strong>de</strong> <strong>la</strong> ecuación <strong>de</strong> regresión lineal, <strong>de</strong> <strong>la</strong><br />
re<strong>la</strong>ción <strong>de</strong> temperatura media versus altitud y los coeficientes <strong>de</strong> corre<strong>la</strong>ción<br />
correspondiente.<br />
MINAG-ANA-DCPRH-AGUAS SUPERFICIALES Pág.105
Temperatura (ºC)<br />
Temperatura (ºC)<br />
Temperatura (ºC)<br />
Temperatura (ºC)<br />
<strong>Estudio</strong> <strong>Hidrológico</strong> <strong>de</strong> <strong>la</strong>s <strong>Cuenca</strong>s Huancané y Suches 2010<br />
15<br />
12<br />
9<br />
6<br />
3<br />
0<br />
15<br />
12<br />
9<br />
6<br />
3<br />
0<br />
10<br />
8<br />
6<br />
4<br />
2<br />
0<br />
15<br />
12<br />
9<br />
6<br />
3<br />
0<br />
Figura Nº 4.4 Gráfico <strong>de</strong> análisis <strong>de</strong> regresión lineal <strong>de</strong> temperatura media versus altitud<br />
Enero<br />
y = -0.00701x + 37.00963<br />
R² = 0.96501<br />
3500 4000 4500 5000<br />
Altitud (msnm)<br />
Abril<br />
y = -0.00592x + 31.63543<br />
R² = 0.81744<br />
3500 4000 4500 5000<br />
Altitud (msnm)<br />
Julio<br />
y = -0.00498x + 24.60725<br />
R² = 0.46217<br />
3500 4000 4500 5000<br />
Altitud (msnm)<br />
y = -0.00740x + 38.08120<br />
R² = 0.89537<br />
3500 4000 4500 5000<br />
Coeficiente<br />
Octubre<br />
Altitud (msnm)<br />
Temperatura (ºC)<br />
Temperatura (ºC)<br />
Temperatura (ºC)<br />
Temperatura (ºC)<br />
15<br />
12<br />
9<br />
6<br />
3<br />
0<br />
12<br />
9<br />
6<br />
3<br />
0<br />
12<br />
9<br />
6<br />
3<br />
0<br />
15<br />
12<br />
9<br />
6<br />
3<br />
0<br />
Febrero<br />
y = -0.00667x + 35.64006<br />
R² = 0.96659<br />
3500 4000 4500 5000<br />
Altitud (msnm)<br />
Mayo<br />
y = -0.00479x + 25.45035<br />
R² = 0.56595<br />
3500 4000 4500 5000<br />
Altitud (msnm)<br />
Agosto<br />
y = -0.00599x + 29.71350<br />
R² = 0.54761<br />
3500 4000 4500 5000<br />
Altitud (msnm)<br />
Noviembre<br />
y = -0.00738x + 38.58416<br />
R² = 0.95499<br />
3500 4000 4500 5000<br />
Altitud (msnm)<br />
y = -0.00651x + 34.75504<br />
R² = 0.95066<br />
MINAG-ANA-DCPRH-AGUAS SUPERFICIALES Pág.106<br />
Temperatura (ºC)<br />
Temperatura (ºC)<br />
Temperatura (ºC)<br />
Temperatura (ºC)<br />
15<br />
12<br />
9<br />
6<br />
3<br />
0<br />
10<br />
8<br />
6<br />
4<br />
2<br />
0<br />
12<br />
10<br />
8<br />
6<br />
4<br />
2<br />
0<br />
15<br />
12<br />
9<br />
6<br />
3<br />
0<br />
Marzo<br />
3500 4000 4500 5000<br />
Altitud (msnm)<br />
Junio<br />
y = -0.00478x + 24.09423<br />
R² = 0.42006<br />
3500 4000 4500 5000<br />
Altitud (msnm)<br />
Setiembre<br />
y = -0.00705x + 35.40282<br />
R² = 0.76326<br />
3500 4000 4500 5000<br />
Altitud (msnm)<br />
Diciembre<br />
y = -0.00738x + 38.60266<br />
R² = 0.96935<br />
3500 4000 4500 5000<br />
Altitud (msnm)<br />
Cuadro Nº 4.3 Parámetros <strong>de</strong> <strong>la</strong> ecuación <strong>de</strong> regresión lineal (temperatura media-altitud)<br />
Ene Feb Mar Abr May Jun Jul Ago Sep Oct Nov Dic<br />
a 37.00963 35.64006 34.75504 31.63543 25.45035 24.09423 24.60725 29.71350 35.40282 38.08120 38.58416 38.60266<br />
b -0.00701 -0.00667 -0.00651 -0.00592 -0.00479 -0.00478 -0.00498 -0.00599 -0.00705 -0.00740 -0.00738 -0.00738<br />
R (%) 98.23 98.32 97.50 90.41 75.23 64.81 67.98 74.00 87.36 94.62 97.72 98.46<br />
Mes
<strong>Estudio</strong> <strong>Hidrológico</strong> <strong>de</strong> <strong>la</strong>s <strong>Cuenca</strong>s Huancané y Suches 2010<br />
En el Cuadro N° 4.4 y en <strong>la</strong> Figura N° 4.5, se presenta <strong>la</strong> temperatura media mensual <strong>de</strong> <strong>la</strong>s<br />
dieciséis (16) estaciones meteorológicas consi<strong>de</strong>radas en el presente estudio.<br />
Estación<br />
Altitud<br />
(msnm)<br />
Cuadro Nº 4.4 Temperatura media mensual (ºC) – Promedio multimensual<br />
Estaciones <strong>de</strong> <strong>la</strong>s cuencas Huancané, Suches y cuencas vecinas<br />
Ene Feb Mar Abr May Jun Jul Ago Sep Oct Nov Dic<br />
Huancané 3840.0 9.3 9.3 9.0 8.1 6.3 4.9 4.5 5.7 7.5 8.9 9.5 9.5 7.7<br />
Putina 3856.0 9.8 9.9 9.5 8.9 7.0 5.5 5.4 6.8 8.4 9.7 10.3 10.3 8.5<br />
Muñani 3948.0 9.4 9.6 9.4 9.0 7.8 6.6 6.3 7.5 8.7 9.4 9.8 9.7 8.6<br />
Huaraya Moho 3832.0 9.8 9.8 9.5 8.9 7.7 6.4 6.3 7.3 8.7 9.7 10.1 10.0 8.7<br />
Cojata 4327.0 6.5 6.6 6.5 5.2 3.3 1.3 0.8 1.6 3.6 5.2 6.2 6.5 4.4<br />
Suches 4655.0 4.4 4.6 4.5 4.1 3.2 1.8 1.4 1.8 2.6 3.6 4.2 4.2 3.4<br />
Ananea 4640.0 4.4 4.6 4.5 4.5 4.1 3.3 3.1 3.4 3.4 4.2 4.5 4.4 4.0<br />
Crucero 4130.0 8.4 8.5 7.9 6.9 4.8 3.1 2.6 3.6 5.6 7.2 8.0 8.0 6.2<br />
Progreso 3940.0 9.7 9.7 9.6 9.1 7.5 6.3 6.0 7.3 8.8 9.9 10.2 10.0 8.7<br />
Azángaro 3848.0 10.2 10.2 9.9 9.3 7.3 5.6 5.5 6.8 8.7 10.1 10.5 10.5 8.7<br />
Arapa 3830.0 10.2 10.3 10.1 9.6 8.1 6.7 6.5 7.6 9.0 10.2 10.5 10.6 9.1<br />
Taraco 3820.0 10.3 10.2 9.5 7.5 5.0 3.2 3.5 4.5 6.4 8.7 9.9 10.2 7.4<br />
Conima 3860.0 10.0 9.9 9.6 8.8 7.0 5.6 5.4 6.6 8.2 9.5 10.1 10.1 8.4<br />
Puerto Acosta 3835.0 10.6 10.0 10.3 9.2 7.4 7.5 6.7 8.0 8.8 9.9 10.4 10.4 9.1<br />
Escoma 3828.0 10.2 10.1 9.8 9.0 7.1 5.8 5.5 6.8 8.4 9.8 10.3 10.4 8.6<br />
Chahuaya 4500.0 5.5 5.6 5.5 5.0 3.9 2.6 2.2 2.8 3.7 4.8 5.4 5.4 4.4<br />
En el Cuadro Nº 4.4 y en <strong>la</strong> Figura Nº 4.6, se aprecia <strong>la</strong> variación <strong>de</strong> <strong>la</strong> temperatura media<br />
anual, don<strong>de</strong> <strong>la</strong> zona más fría en <strong>la</strong> cuenca Huancané es <strong>la</strong> zona <strong>de</strong> <strong>la</strong> estación Ananea que<br />
registra una temperatura media anual <strong>de</strong> 4.0ºC, mientras en <strong>la</strong> cuenca Suches es <strong>la</strong> zona <strong>de</strong><br />
<strong>la</strong> estación Suches con 3.4ºC.<br />
Por el contrario <strong>la</strong>s regiones más cálidas en <strong>la</strong> cuenca Huancané se encuentra en <strong>la</strong>s zona<br />
<strong>de</strong> <strong>la</strong>s estaciones Huaraya Moho 8.7ºC, Muñani 8.6ºC y Putina 8.5ºC; mientras en <strong>la</strong><br />
cuenca Suches es <strong>la</strong> zona <strong>de</strong> <strong>la</strong>s estaciones Puerto Acosta 9.1ºC y Escoma 8.6°C; lo que<br />
<strong>de</strong>muestra <strong>la</strong> gran capacidad <strong>de</strong> almacenamiento <strong>de</strong> energía y posterior efecto <strong>de</strong><br />
regu<strong>la</strong>ción termal.<br />
El gradiente térmico <strong>de</strong> <strong>la</strong> temperatura media en <strong>la</strong> cuenca Huancané es <strong>de</strong> 0.58ºC por cada<br />
100 m <strong>de</strong> altitud, mientras en <strong>la</strong> cuenca Suches es <strong>de</strong> 0.70ºC por cada 100 m <strong>de</strong> altitud.<br />
La variación espacial <strong>de</strong> <strong>la</strong> temperatura media anual (isotermas) en <strong>la</strong>s cuencas Huancané y<br />
Suches, se muestra en el Mapa Nº 4.3, don<strong>de</strong> se aprecia que en <strong>la</strong> cuenca Huancané <strong>la</strong><br />
temperatura media anual varía <strong>de</strong> 5 a 8.5ºC, mientras en <strong>la</strong> cuenca Suches varía <strong>de</strong> 3 a 9ºC,<br />
respectivamente.<br />
MINAG-ANA-DCPRH-AGUAS SUPERFICIALES Pág.107<br />
Mes<br />
Prom<br />
Anual
<strong>Estudio</strong> <strong>Hidrológico</strong> <strong>de</strong> <strong>la</strong>s <strong>Cuenca</strong>s Huancané y Suches 2010<br />
Temperatura (ºC)<br />
Temperatura (ºC)<br />
14.0<br />
12.0<br />
10.0<br />
8.0<br />
6.0<br />
4.0<br />
2.0<br />
0.0<br />
12.0<br />
10.0<br />
8.0<br />
6.0<br />
4.0<br />
2.0<br />
0.0<br />
Figura Nº 4.5 Variación mensual <strong>de</strong> <strong>la</strong> temperatura media (ºC) – Promedio multimensual<br />
Estaciones <strong>de</strong> <strong>la</strong>s cuencas Huancané, Suches y cuencas vecinas<br />
Ene Feb Mar Abr May Jun Jul Ago Sep Oct Nov Dic<br />
Tiempo (mes)<br />
Figura Nº 4.6 Variación anual <strong>de</strong> <strong>la</strong> temperatura media (ºC) – Promedio multianual<br />
Estaciones <strong>de</strong> <strong>la</strong>s cuencas Huancané, Suches y cuencas vecinas<br />
Huancané<br />
7.7<br />
Putina<br />
8.5 8.6 8.7<br />
Muñani<br />
Huaraya<br />
Moho<br />
Cojata<br />
4.4<br />
Suches<br />
3.4<br />
Ananea<br />
4.0<br />
Huancané<br />
MINAG-ANA-DCPRH-AGUAS SUPERFICIALES Pág.108<br />
Crucero<br />
6.2<br />
8.7 8.7<br />
Estación Meteorológica<br />
Progreso<br />
Azángaro<br />
Arapa<br />
9.1<br />
Taraco<br />
7.4<br />
Conima<br />
8.4<br />
9.1<br />
Puerto<br />
Acosta<br />
Escoma<br />
8.6<br />
Putina<br />
Muñani<br />
Huaraya Moho<br />
Cojata<br />
Suches<br />
Ananea<br />
Crucero<br />
Progreso<br />
Azángaro<br />
Arapa<br />
Taraco<br />
Conima<br />
Puerto Acosta<br />
Escoma<br />
Chahuaya<br />
Chahuaya<br />
4.4
<strong>Estudio</strong> <strong>Hidrológico</strong> <strong>de</strong> <strong>la</strong>s <strong>Cuenca</strong>s Huancané y Suches 2010<br />
Mapa Nº 4.3 Distribución espacial <strong>de</strong> <strong>la</strong> temperatura media anual (isotermas) en <strong>la</strong>s cuencas Huancané y<br />
Suches<br />
MINAG-ANA-DCPRH-AGUAS SUPERFICIALES Pág.109
<strong>Estudio</strong> <strong>Hidrológico</strong> <strong>de</strong> <strong>la</strong>s <strong>Cuenca</strong>s Huancané y Suches 2010<br />
B.- Régimen <strong>de</strong> temperatura máxima<br />
La temperatura máxima, vendría ser en este caso, <strong>la</strong> temperatura media <strong>de</strong> <strong>la</strong>s máximas<br />
diarias a nivel mensual.<br />
Al igual que <strong>la</strong>s temperaturas medias, <strong>de</strong>bido a <strong>la</strong> carencia <strong>de</strong> estadísticas <strong>de</strong> temperaturas<br />
máximas, para <strong>la</strong>s estaciones Suches, Conima, Escoma y Chahuaya, se han estimado<br />
mediante el análisis <strong>de</strong> regresión lineal con los datos <strong>de</strong> <strong>la</strong>s estaciones con registros<br />
existentes, corre<strong>la</strong>cionando <strong>la</strong> altitud y <strong>la</strong> temperatura máxima.<br />
Ecuación <strong>de</strong> re<strong>la</strong>ción: Tmáx = a + bH, don<strong>de</strong> H es <strong>la</strong> altitud en msnm.<br />
En <strong>la</strong> Figura Nº 4.7 se muestra los resultados <strong>de</strong>l análisis <strong>de</strong> regresión lineal, don<strong>de</strong> se ha<br />
corre<strong>la</strong>cionado <strong>la</strong> temperatura máxima mensual con <strong>la</strong> altitud. Los resultados <strong>de</strong>l análisis<br />
entre <strong>la</strong>s variables analizadas, dan una buena corre<strong>la</strong>ción.<br />
En el Cuadro Nº 4.5 se presenta los parámetros <strong>de</strong> <strong>la</strong> ecuación <strong>de</strong> regresión lineal, <strong>de</strong> <strong>la</strong><br />
re<strong>la</strong>ción <strong>de</strong> temperatura máxima versus altitud y los coeficientes <strong>de</strong> corre<strong>la</strong>ción<br />
correspondiente.<br />
Temperatura (ºC)<br />
Temperatura (ºC)<br />
Temperatura (ºC)<br />
25<br />
20<br />
15<br />
10<br />
5<br />
0<br />
25<br />
20<br />
15<br />
10<br />
5<br />
0<br />
25<br />
20<br />
15<br />
10<br />
5<br />
0<br />
Figura Nº 4.7 Gráfico <strong>de</strong> análisis <strong>de</strong> regresión lineal <strong>de</strong> temperatura máxima versus altitud<br />
Enero<br />
y = -0.00647x + 40.18398<br />
R² = 0.88143<br />
3500 4000 4500 5000<br />
Altitud (msnm)<br />
Abril<br />
y = -0.00616x + 39.53256<br />
R² = 0.76969<br />
3500 4000 4500 5000<br />
Altitud (msnm)<br />
Julio<br />
y = -0.00639x + 39.77027<br />
R² = 0.76128<br />
3500 4000 4500 5000<br />
Altitud (msnm)<br />
Temperatura (ºC)<br />
Temperatura (ºC)<br />
Temperatura (ºC)<br />
25<br />
20<br />
15<br />
10<br />
5<br />
0<br />
25<br />
20<br />
15<br />
10<br />
5<br />
0<br />
25<br />
20<br />
15<br />
10<br />
5<br />
0<br />
Febrero<br />
y = -0.00630x + 39.59388<br />
R² = 0.85023<br />
3500 4000 4500 5000<br />
Altitud (msnm)<br />
Mayo<br />
y = -0.00587x + 38.28252<br />
R² = 0.72954<br />
3500 4000 4500 5000<br />
Altitud (msnm)<br />
Agosto<br />
y = -0.00646x + 40.82489<br />
R² = 0.72892<br />
3500 4000 4500 5000<br />
Altitud (msnm)<br />
y = -0.00625x + 39.46891<br />
R² = 0.83784<br />
MINAG-ANA-DCPRH-AGUAS SUPERFICIALES Pág.110<br />
Temperatura (ºC)<br />
Temperatura (ºC)<br />
Temperatura (ºC)<br />
25<br />
20<br />
15<br />
10<br />
5<br />
0<br />
25<br />
20<br />
15<br />
10<br />
5<br />
0<br />
25<br />
20<br />
15<br />
10<br />
5<br />
0<br />
Marzo<br />
3500 4000 4500 5000<br />
Altitud (msnm)<br />
Junio<br />
y = -0.00587x + 37.77410<br />
R² = 0.72264<br />
3500 4000 4500 5000<br />
Altitud (msnm)<br />
Setiembre<br />
y = -0.00748x + 45.31859<br />
R² = 0.81837<br />
3500 4000 4500 5000<br />
Altitud (msnm)
Temperatura (ºC)<br />
<strong>Estudio</strong> <strong>Hidrológico</strong> <strong>de</strong> <strong>la</strong>s <strong>Cuenca</strong>s Huancané y Suches 2010<br />
25<br />
20<br />
15<br />
10<br />
5<br />
0<br />
y = -0.00772x + 46.72635<br />
R² = 0.84880<br />
3500 4000 4500 5000<br />
Coeficiente<br />
Octubre<br />
Altitud (msnm)<br />
Temperatura (ºC)<br />
25<br />
20<br />
15<br />
10<br />
5<br />
0<br />
Noviembre<br />
y = -0.00756x + 46.20037<br />
R² = 0.85987<br />
3500 4000 4500 5000<br />
Altitud (msnm)<br />
y = -0.00750x + 45.12262<br />
R² = 0.88582<br />
MINAG-ANA-DCPRH-AGUAS SUPERFICIALES Pág.111<br />
Temperatura (ºC)<br />
25<br />
20<br />
15<br />
10<br />
5<br />
0<br />
Diciembre<br />
3500 4000 4500 5000<br />
Altitud (msnm)<br />
Cuadro Nº 4.5 Parámetros <strong>de</strong> <strong>la</strong> ecuación <strong>de</strong> regresión lineal (temperatura máxima-altitud)<br />
Ene Feb Mar Abr May Jun Jul Ago Sep Oct Nov Dic<br />
a 40.18398 39.59388 39.46891 39.53256 38.28252 37.77410 39.77027 40.82489 45.31859 46.72635 46.20037 45.12262<br />
b -0.00647 -0.00630 -0.00625 -0.00616 -0.00587 -0.00587 -0.00639 -0.00646 -0.00748 -0.00772 -0.00756 -0.00750<br />
R (%) 93.88 92.21 91.53 87.73 85.41 85.01 87.25 85.38 90.46 92.13 92.73 94.12<br />
En <strong>la</strong> Figura Nº 4.8 se verifica que durante el año <strong>la</strong> mayor temperatura máxima se registra<br />
en el mes <strong>de</strong> noviembre, esto en forma general en todas <strong>la</strong>s estaciones <strong>de</strong> <strong>la</strong>s cuencas<br />
Huancané y Suches.<br />
En <strong>la</strong> cuenca Huancané, <strong>la</strong> mayor temperatura máxima se presenta en <strong>la</strong> zona <strong>de</strong> <strong>la</strong> estación<br />
Putina con 17.0ºC y <strong>la</strong> menor en <strong>la</strong> zona <strong>de</strong> <strong>la</strong> estación Ananea <strong>de</strong> 10.2ºC. Mientras en <strong>la</strong><br />
cuenca Suches, <strong>la</strong> mayor temperatura máxima se presenta en <strong>la</strong> zona <strong>de</strong> <strong>la</strong> estación Escoma<br />
con 16.0ºC y <strong>la</strong> menor en <strong>la</strong> zona <strong>de</strong> <strong>la</strong> estación Suches <strong>de</strong> 10.5ºC. Ver Cuadro Nº 4.6 y <strong>la</strong><br />
Figura Nº 4.9.<br />
El gradiente térmico <strong>de</strong> <strong>la</strong> temperatura máxima, en <strong>la</strong>s cuencas Huancané y Suches es <strong>de</strong><br />
0.87ºC y 0.67ºC por cada 100 m <strong>de</strong> altitud.<br />
Estación<br />
Altitud<br />
(msnm)<br />
Cuadro Nº 4.6 Temperatura máxima mensual (ºC) – Promedio multimensual<br />
Estaciones <strong>de</strong> <strong>la</strong>s cuencas Huancané, Suches y cuencas vecinas<br />
Mes<br />
Ene Feb Mar Abr May Jun Jul Ago Sep Oct Nov Dic<br />
Huancané 3840.0 14.5 14.6 14.5 14.8 14.7 14.1 13.9 14.5 15.2 15.8 16.0 15.4 14.8<br />
Putina 3856.0 15.9 16.3 16.5 17.1 17.0 16.5 16.5 17.6 17.7 18.2 18.1 17.1 17.0<br />
Muñani 3948.0 15.2 15.4 15.6 16.3 16.3 15.8 15.7 16.6 16.9 17.2 17.1 16.3 16.2<br />
Huaraya Moho 3832.0 14.3 14.3 14.3 14.5 14.2 13.5 13.6 14.4 15.3 15.7 15.9 15.0 14.6<br />
Cojata 4327.0 12.2 12.3 12.3 12.7 12.3 11.9 11.7 12.7 12.9 13.2 13.5 12.9 12.6<br />
Suches 4655.0 10.1 10.3 10.4 10.9 11.0 10.4 10.0 10.8 10.5 10.8 11.0 10.2 10.5<br />
Ananea 4640.0 9.7 9.9 10.1 10.5 10.8 10.2 9.8 10.4 10.1 10.6 10.6 9.9 10.2<br />
Crucero 4130.0 14.3 14.5 14.3 14.8 15.0 14.5 14.1 14.9 15.2 15.2 15.7 14.5 14.8<br />
Progreso 3940.0 15.1 15.2 15.3 15.8 15.6 15.2 15.1 16.0 16.6 17.1 17.0 16.0 15.8<br />
Azángaro 3848.0 15.7 15.6 15.6 16.2 16.0 15.5 15.6 16.4 17.1 17.6 17.5 16.6 16.3<br />
Arapa 3830.0 15.5 15.6 15.7 16.1 15.9 15.2 15.2 16.0 16.7 17.3 17.3 16.6 16.1<br />
Taraco 3820.0 15.1 15.2 15.1 15.7 15.9 15.1 15.3 15.7 16.6 16.9 17.4 16.7 15.9<br />
Conima 3860.0 15.2 15.3 15.3 15.8 15.6 15.1 15.1 15.9 16.4 16.9 17.0 16.2 15.8<br />
Puerto Acosta 3835.0 15.2 15.0 15.3 15.0 14.9 15.0 14.8 15.8 15.8 16.7 16.4 15.8 15.5<br />
Escoma 3828.0 15.4 15.5 15.5 16.0 15.8 15.3 15.3 16.1 16.7 17.2 17.3 16.4 16.0<br />
Chahuaya 4500.0 11.1 11.2 11.3 11.8 11.9 11.4 11.0 11.8 11.7 12.0 12.2 11.4 11.6<br />
Mes<br />
Prom<br />
Anual
<strong>Estudio</strong> <strong>Hidrológico</strong> <strong>de</strong> <strong>la</strong>s <strong>Cuenca</strong>s Huancané y Suches 2010<br />
Temperatura (ºC)<br />
Temperatura (ºC)<br />
25.0<br />
22.5<br />
20.0<br />
17.5<br />
15.0<br />
12.5<br />
10.0<br />
Figura Nº 4.8 Variación mensual <strong>de</strong> <strong>la</strong> temperatura máxima (ºC) – Promedio multimensual<br />
Estaciones <strong>de</strong> <strong>la</strong>s cuencas Huancané, Suches y cuencas vecinas<br />
7.5<br />
5.0<br />
2.5<br />
0.0<br />
24.0<br />
20.0<br />
16.0<br />
12.0<br />
8.0<br />
4.0<br />
0.0<br />
Ene Feb Mar Abr May Jun Jul Ago Sep Oct Nov Dic<br />
Tiempo (mes)<br />
Figura Nº 4.9 Variación anual <strong>de</strong> <strong>la</strong> temperatura máxima (ºC) – Promedio multianual<br />
Estaciones <strong>de</strong> <strong>la</strong>s cuencas Huancané, Suches y cuencas vecinas<br />
14.8<br />
Huancané<br />
17.0<br />
Putina<br />
16.2<br />
Muñani<br />
14.6<br />
Huaraya<br />
Moho<br />
12.6<br />
Cojata<br />
10.5<br />
Suches<br />
10.2<br />
Ananea<br />
Huancané<br />
MINAG-ANA-DCPRH-AGUAS SUPERFICIALES Pág.112<br />
14.8<br />
Crucero<br />
15.8<br />
Estación Meteorológica<br />
Progreso<br />
16.3 16.1 15.9 15.8<br />
Azángaro<br />
Arapa<br />
Taraco<br />
Conima<br />
15.5<br />
Puerto<br />
Acosta<br />
Putina<br />
Muñani<br />
Huaraya Moho<br />
Cojata<br />
Suches<br />
Ananea<br />
Crucero<br />
Progreso<br />
Azángaro<br />
Arapa<br />
Taraco<br />
Conima<br />
Puerto Acosta<br />
Escoma<br />
Chahuaya<br />
La variación espacial <strong>de</strong> <strong>la</strong> temperatura máxima (isotermas) en <strong>la</strong>s cuencas Huancané y<br />
Suches, se muestra en el Mapa Nº 4.4, don<strong>de</strong> se aprecia que en <strong>la</strong> cuenca Huancané <strong>la</strong><br />
temperatura máxima anual varía <strong>de</strong> 11.9 a 16.8ºC, mientras en <strong>la</strong> cuenca Suches varía <strong>de</strong><br />
8.4 a 15.4ºC, respectivamente.<br />
16.0<br />
Escoma<br />
11.6<br />
Chahuaya
<strong>Estudio</strong> <strong>Hidrológico</strong> <strong>de</strong> <strong>la</strong>s <strong>Cuenca</strong>s Huancané y Suches 2010<br />
Mapa Nº 4.4 Distribución espacial <strong>de</strong> <strong>la</strong> temperatura máxima (isotermas) en <strong>la</strong>s cuencas Huancané y Suches<br />
MINAG-ANA-DCPRH-AGUAS SUPERFICIALES Pág.113
<strong>Estudio</strong> <strong>Hidrológico</strong> <strong>de</strong> <strong>la</strong>s <strong>Cuenca</strong>s Huancané y Suches 2010<br />
C.- Régimen <strong>de</strong> temperatura mínima<br />
La temperatura máxima, vendría ser en este caso, <strong>la</strong> temperatura media <strong>de</strong> <strong>la</strong>s mínimas<br />
diarias a nivel mensual.<br />
Al igual que <strong>la</strong>s temperaturas medias, <strong>de</strong>bido a <strong>la</strong> carencia <strong>de</strong> estadísticas <strong>de</strong> temperaturas<br />
mínimas, para <strong>la</strong>s estaciones Suches, Conima, Escoma y Chahuaya, se han estimado<br />
mediante el análisis <strong>de</strong> regresión lineal con los datos <strong>de</strong> <strong>la</strong>s estaciones con registros<br />
existentes, corre<strong>la</strong>cionando <strong>la</strong> altitud y <strong>la</strong> temperatura mínima.<br />
Ecuación <strong>de</strong> re<strong>la</strong>ción: Tmín = a + bH, don<strong>de</strong> H es <strong>la</strong> altitud en msnm.<br />
En <strong>la</strong> Figura Nº 4.10 se muestra los resultados <strong>de</strong>l análisis <strong>de</strong> regresión lineal, don<strong>de</strong> se ha<br />
corre<strong>la</strong>cionado <strong>la</strong> temperatura mínima mensual con <strong>la</strong> altitud. Los resultados <strong>de</strong>l análisis<br />
entre <strong>la</strong>s variables analizadas, dan una buena corre<strong>la</strong>ción.<br />
En el Cuadro Nº 4.7 se presenta los parámetros <strong>de</strong> <strong>la</strong> ecuación <strong>de</strong> regresión lineal, <strong>de</strong> <strong>la</strong><br />
re<strong>la</strong>ción <strong>de</strong> temperatura mínima versus altitud y los coeficientes <strong>de</strong> corre<strong>la</strong>ción<br />
correspondiente.<br />
Temperatura (ºC)<br />
Temperatura (ºC)<br />
Temperatura (ºC)<br />
10<br />
5<br />
0<br />
-5<br />
-10<br />
10<br />
5<br />
0<br />
-5<br />
-10<br />
10<br />
5<br />
0<br />
-5<br />
-10<br />
-15<br />
Figura Nº 4.10 Gráfico <strong>de</strong> análisis <strong>de</strong> regresión lineal <strong>de</strong> temperatura mínima versus altitud<br />
Enero<br />
y = -0.00743x + 33.33172<br />
R² = 0.92130<br />
3500 4000 4500 5000<br />
Altitud (msnm)<br />
Abril<br />
y = -0.00579x + 24.16215<br />
R² = 0.55024<br />
3500 4000 4500 5000<br />
Altitud (msnm)<br />
Julio<br />
y = -0.00360x + 9.60802<br />
R² = 0.09594<br />
3500 4000 4500 5000<br />
Altitud (msnm)<br />
Temperatura (ºC)<br />
Temperatura (ºC)<br />
Temperatura (ºC)<br />
10<br />
5<br />
0<br />
-5<br />
-10<br />
10<br />
5<br />
0<br />
-5<br />
-10<br />
-15<br />
10<br />
5<br />
0<br />
-5<br />
-10<br />
-15<br />
Febrero<br />
y = -0.00691x + 31.18159<br />
R² = 0.94496<br />
3500 4000 4500 5000<br />
Altitud (msnm)<br />
Mayo<br />
y = -0.00373x + 12.68377<br />
R² = 0.15807<br />
3500 4000 4500 5000<br />
Altitud (msnm)<br />
Agosto<br />
y = -0.00548x + 18.40781<br />
R² = 0.21207<br />
3500 4000 4500 5000<br />
Altitud (msnm)<br />
y = -0.00677x + 30.04085<br />
R² = 0.88302<br />
MINAG-ANA-DCPRH-AGUAS SUPERFICIALES Pág.114<br />
Temperatura (ºC)<br />
Temperatura (ºC)<br />
Temperatura (ºC)<br />
10<br />
5<br />
0<br />
-5<br />
-10<br />
10<br />
5<br />
0<br />
-5<br />
-10<br />
-15<br />
10<br />
5<br />
0<br />
-5<br />
-10<br />
Marzo<br />
3500 4000 4500 5000<br />
Altitud (msnm)<br />
Junio<br />
y = -0.00375x + 10.62001<br />
R² = 0.09748<br />
3500 4000 4500 5000<br />
Altitud (msnm)<br />
Setiembre<br />
y = -0.00677x + 26.19289<br />
R² = 0.49165<br />
3500 4000 4500 5000<br />
Altitud (msnm)
Temperatura (ºC)<br />
<strong>Estudio</strong> <strong>Hidrológico</strong> <strong>de</strong> <strong>la</strong>s <strong>Cuenca</strong>s Huancané y Suches 2010<br />
10<br />
5<br />
0<br />
-5<br />
-10<br />
Coeficiente<br />
Octubre<br />
y = -0.00715x + 29.78825<br />
R² = 0.77716<br />
3500 4000 4500 5000<br />
Altitud (msnm)<br />
Temperatura (ºC)<br />
10<br />
5<br />
0<br />
-5<br />
-10<br />
Noviembre<br />
y = -0.00729x + 31.30343<br />
R² = 0.87025<br />
3500 4000 4500 5000<br />
Altitud (msnm)<br />
y = -0.00732x + 32.31474<br />
R² = 0.93041<br />
MINAG-ANA-DCPRH-AGUAS SUPERFICIALES Pág.115<br />
Temperatura (ºC)<br />
10<br />
5<br />
0<br />
-5<br />
-10<br />
Diciembre<br />
3500 4000 4500 5000<br />
Altitud (msnm)<br />
Cuadro Nº 4.7 Parámetros <strong>de</strong> <strong>la</strong> ecuación <strong>de</strong> regresión lineal (temperatura mínima-altitud)<br />
Ene Feb Mar Abr May Jun Jul Ago Sep Oct Nov Dic<br />
a 33.33172 31.18159 30.04085 24.16215 12.68377 10.62001 9.60802 18.40781 26.19289 29.78825 31.30343 32.31474<br />
b -0.00743 -0.00691 -0.00677 -0.00579 -0.00373 -0.00375 -0.00360 -0.00548 -0.00677 -0.00715 -0.00729 -0.00732<br />
R (%) 95.98 97.21 93.97 74.18 39.76 31.22 30.97 46.05 70.12 88.16 93.29 96.46<br />
En <strong>la</strong> Figura Nº 4.11 se verifica que durante el año <strong>la</strong> menor temperatura mínima se<br />
registra en el mes <strong>de</strong> julio, esto en forma general en todas <strong>la</strong>s estaciones <strong>de</strong> <strong>la</strong>s cuencas<br />
Huancané y Suches.<br />
En <strong>la</strong> cuenca Huancané, <strong>la</strong> mayor temperatura mínima se presenta en <strong>la</strong> zona <strong>de</strong> <strong>la</strong> estación<br />
Huaraya-Moho con 2.7ºC y <strong>la</strong> menor en <strong>la</strong> zona <strong>de</strong> <strong>la</strong> estación Ananea <strong>de</strong> -2.2ºC. Mientras<br />
en <strong>la</strong> cuenca Suches, <strong>la</strong> mayor temperatura mínima se presenta en <strong>la</strong> zona <strong>de</strong> <strong>la</strong> estación<br />
Puerto Acosta con 2.7ºC y <strong>la</strong> menor en <strong>la</strong> zona <strong>de</strong> <strong>la</strong> estación Suches <strong>de</strong> -3.8ºC. Ver Cuadro<br />
Nº 4.8 y <strong>la</strong> Figura Nº 4.12.<br />
El gradiente térmico <strong>de</strong> <strong>la</strong> temperatura mínima, en <strong>la</strong>s cuencas Huancané y Suches es <strong>de</strong><br />
0.61ºC y 0.79ºC por cada 100 m <strong>de</strong> altitud.<br />
Estación<br />
Altitud<br />
(msnm)<br />
Cuadro Nº 4.8 Temperatura mínima mensual (ºC) – Promedio multimensual<br />
Estaciones <strong>de</strong> <strong>la</strong>s cuencas Huancané, Suches y cuencas vecinas<br />
Mes<br />
Ene Feb Mar Abr May Jun Jul Ago Sep Oct Nov Dic<br />
Huancané 3840.0 4.1 4.0 3.4 1.6 -2.1 -4.3 -4.9 -3.1 -0.2 1.9 2.9 3.6 0.6<br />
Putina 3856.0 3.6 3.6 2.8 0.9 -2.7 -5.5 -5.4 -4.0 -0.8 1.3 2.5 3.5 0.0<br />
Muñani 3948.0 3.7 3.7 3.2 1.8 -0.8 -2.7 -3.2 -1.7 0.4 1.7 2.4 3.3 1.0<br />
Huaraya Moho 3832.0 5.3 5.1 4.6 3.3 1.0 -0.7 -1.0 0.1 2.0 3.5 4.2 4.9 2.7<br />
Cojata 4327.0 0.9 1.0 0.7 -2.3 -5.8 -9.3 -10.2 -9.4 -5.7 -2.8 -1.1 0.1 -3.7<br />
Suches 4655.0 -1.3 -1.0 -1.5 -2.8 -4.7 -6.8 -7.1 -7.1 -5.3 -3.5 -2.6 -1.8 -3.8<br />
Ananea 4640.0 -0.9 -0.7 -1.1 -1.6 -2.6 -3.7 -3.6 -3.7 -3.2 -2.2 -1.7 -1.1 -2.2<br />
Crucero 4130.0 2.5 2.6 1.4 -0.9 -5.4 -8.3 -8.9 -7.7 -3.9 -0.7 0.3 1.4 -2.3<br />
Progreso 3940.0 4.4 4.2 3.8 2.3 -0.7 -2.4 -3.2 -1.6 0.9 2.6 3.3 3.9 1.5<br />
Azángaro 3848.0 4.8 4.9 4.2 2.4 -1.4 -4.3 -4.6 -2.9 0.3 2.5 3.3 4.3 1.1<br />
Arapa 3830.0 4.9 4.9 4.4 3.1 0.2 -1.8 -2.2 -1.0 1.3 3.0 3.7 4.5 2.1<br />
Taraco 3820.0 5.2 5.0 3.9 -0.8 -6.0 -8.7 -8.4 -6.6 -2.6 1.3 2.8 4.2 -0.9<br />
Conima 3860.0 4.7 4.5 3.9 1.8 -1.7 -3.9 -4.3 -2.7 0.1 2.2 3.2 4.1 1.0<br />
Puerto Acosta 3835.0 5.9 5.1 5.3 3.3 0.0 -0.2 -1.5 0.2 1.8 3.1 4.4 4.9 2.7<br />
Escoma 3828.0 4.9 4.7 4.1 2.0 -1.6 -3.7 -4.2 -2.6 0.3 2.4 3.4 4.3 1.2<br />
Chahuaya 4500.0 -0.1 0.1 -0.4 -1.9 -4.1 -6.3 -6.6 -6.3 -4.3 -2.4 -1.5 -0.6 -2.9<br />
Mes<br />
Prom<br />
Anual
<strong>Estudio</strong> <strong>Hidrológico</strong> <strong>de</strong> <strong>la</strong>s <strong>Cuenca</strong>s Huancané y Suches 2010<br />
Temperatura (ºC)<br />
Temperatura (ºC)<br />
Figura Nº 4.11 Variación mensual <strong>de</strong> <strong>la</strong> temperatura mínima (ºC) – Promedio multimensual<br />
Estaciones <strong>de</strong> <strong>la</strong>s cuencas Huancané, Suches y cuencas vecinas<br />
12.0<br />
9.0<br />
6.0<br />
3.0<br />
0.0<br />
-3.0<br />
-6.0<br />
-9.0<br />
-12.0<br />
5.0<br />
4.0<br />
3.0<br />
2.0<br />
1.0<br />
0.0<br />
-1.0<br />
-2.0<br />
-3.0<br />
-4.0<br />
-5.0<br />
Ene Feb Mar Abr May Jun Jul Ago Sep Oct Nov Dic<br />
Tiempo (mes)<br />
Figura Nº 4.12 Variación anual <strong>de</strong> <strong>la</strong> temperatura mínima (ºC) – Promedio multianual<br />
Estaciones <strong>de</strong> <strong>la</strong>s cuencas Huancané, Suches y cuencas vecinas<br />
Huancané<br />
0.6<br />
Putina<br />
0.0<br />
Muñani<br />
1.0<br />
Huaraya Moho<br />
2.7<br />
Cojata<br />
-3.7 -3.8<br />
Suches<br />
Ananea<br />
-2.2 -2.3<br />
Huancané<br />
MINAG-ANA-DCPRH-AGUAS SUPERFICIALES Pág.116<br />
Crucero<br />
1.5<br />
1.1<br />
Estación Meteorológica<br />
Progreso<br />
Azángaro<br />
Arapa<br />
2.1<br />
Taraco<br />
-0.9<br />
Conima<br />
1.0<br />
Puerto Acosta<br />
2.7<br />
Escoma<br />
Putina<br />
Muñani<br />
Huaraya Moho<br />
Cojata<br />
Suches<br />
Ananea<br />
Crucero<br />
Progreso<br />
Azángaro<br />
Arapa<br />
Taraco<br />
Conima<br />
Puerto Acosta<br />
Escoma<br />
Chahuaya<br />
La variación espacial <strong>de</strong> <strong>la</strong> temperatura mínima (isotermas) en <strong>la</strong>s cuencas Huancané y<br />
Suches, se muestra en el Mapa Nº 4.5, don<strong>de</strong> se aprecia que en <strong>la</strong> cuenca Huancané <strong>la</strong><br />
temperatura mínima anual varía <strong>de</strong> -2.5 a 3.5ºC, mientras en <strong>la</strong> cuenca Suches varía <strong>de</strong> -4.0<br />
a 4.0ºC, respectivamente.<br />
1.2<br />
Chahuaya<br />
-2.9
<strong>Estudio</strong> <strong>Hidrológico</strong> <strong>de</strong> <strong>la</strong>s <strong>Cuenca</strong>s Huancané y Suches 2010<br />
Mapa Nº 4.5 Distribución espacial <strong>de</strong> <strong>la</strong> temperatura mínima (isotermas) en <strong>la</strong>s cuencas Huancané y Suches<br />
MINAG-ANA-DCPRH-AGUAS SUPERFICIALES Pág.117
<strong>Estudio</strong> <strong>Hidrológico</strong> <strong>de</strong> <strong>la</strong>s <strong>Cuenca</strong>s Huancané y Suches 2010<br />
4.1.3 Humedad re<strong>la</strong>tiva<br />
Es <strong>la</strong> humedad que contiene <strong>la</strong> masa <strong>de</strong> aire, en re<strong>la</strong>ción con <strong>la</strong> máxima humedad absoluta<br />
que podría admitir sin producirse <strong>la</strong> con<strong>de</strong>nsación, conservando <strong>la</strong>s mismas condiciones <strong>de</strong><br />
temperatura y presión atmosférica. También se <strong>de</strong>fine como el porcentaje <strong>de</strong> saturación <strong>de</strong>l<br />
aire con vapor <strong>de</strong> agua. El factor <strong>de</strong>terminante <strong>de</strong> <strong>la</strong> humedad re<strong>la</strong>tiva es <strong>la</strong> temperatura, el<br />
cual permite saber cuánto <strong>de</strong> vapor <strong>de</strong> agua hay en <strong>la</strong> atmósfera. Se expresa en porcentaje.<br />
La fórmu<strong>la</strong> psicrométrica para el cálculo <strong>de</strong> <strong>la</strong> humedad re<strong>la</strong>tiva, está dada por <strong>la</strong> siguiente<br />
ecuación:<br />
' es<br />
Δe<br />
HR <br />
<br />
100<br />
e <br />
s <br />
1 0.00115 T<br />
P<br />
T T <br />
Δe 0.00066 <br />
<br />
e<br />
e<br />
s<br />
'<br />
s<br />
6.1110<br />
6.1110<br />
7.5T<br />
<br />
s <br />
<br />
Ts<br />
237.3<br />
<br />
7.5T<br />
h <br />
<br />
<br />
<br />
<br />
Th<br />
237.3<br />
<br />
Don<strong>de</strong>:<br />
HR = Humedad re<strong>la</strong>tiva (%).<br />
Th = Temperatura bulbo húmedo (ºC).<br />
Ts = Temperatura bulbo seco (ºC).<br />
P = Presión atmosférica <strong>de</strong> <strong>la</strong> estación (mb).<br />
H = Altitud <strong>de</strong> <strong>la</strong> estación (msnm).<br />
293 0.00652 H <br />
P 101.3<br />
<br />
<br />
293 <br />
MINAG-ANA-DCPRH-AGUAS SUPERFICIALES Pág.118<br />
h<br />
5.26<br />
10<br />
En nuestro país, el SENAMHI realiza tres mediciones por día (a <strong>la</strong>s 07, 13 y 19 horas), <strong>la</strong>s<br />
temperaturas bulbo húmedo y seco. Con <strong>la</strong> ecuación <strong>de</strong> <strong>la</strong> humedad re<strong>la</strong>tiva se calcu<strong>la</strong> para<br />
cada hora y con el promedio <strong>de</strong> <strong>la</strong>s tres mediciones se obtiene <strong>la</strong> humedad re<strong>la</strong>tiva media<br />
diaria, <strong>de</strong> igual forma el promedio mensual se obtiene <strong>de</strong> <strong>la</strong>s humeda<strong>de</strong>s re<strong>la</strong>tivas diarias<br />
correspondientes.<br />
De <strong>la</strong>s dieciséis estaciones meteorológicas, once (11) estaciones disponen el registro<br />
histórico <strong>de</strong> humedad re<strong>la</strong>tiva. Por lo tanto, <strong>de</strong>bido a <strong>la</strong> carencia <strong>de</strong> estadísticas <strong>de</strong> humedad<br />
re<strong>la</strong>tiva, para <strong>la</strong>s estaciones Suches, Conima, Puerto Acosta, Escoma y Chahuaya, se han<br />
estimado mediante el análisis <strong>de</strong> regresión lineal con los datos <strong>de</strong> <strong>la</strong>s estaciones con<br />
registros existentes, corre<strong>la</strong>cionando <strong>la</strong> altitud y <strong>la</strong> humedad re<strong>la</strong>tiva.<br />
Ecuación <strong>de</strong> re<strong>la</strong>ción: HR = a + bH, don<strong>de</strong> H es <strong>la</strong> altitud en msnm.<br />
s<br />
h
<strong>Estudio</strong> <strong>Hidrológico</strong> <strong>de</strong> <strong>la</strong>s <strong>Cuenca</strong>s Huancané y Suches 2010<br />
En <strong>la</strong> Figura Nº 4.13 se muestra los resultados <strong>de</strong>l análisis <strong>de</strong> regresión lineal, don<strong>de</strong> se ha<br />
corre<strong>la</strong>cionado <strong>la</strong> humedad re<strong>la</strong>tiva con <strong>la</strong> altitud. Los resultados <strong>de</strong>l análisis entre <strong>la</strong>s<br />
variables analizadas, dan una corre<strong>la</strong>ción buena.<br />
En el Cuadro Nº 4.9 se presenta los parámetros <strong>de</strong> <strong>la</strong> ecuación <strong>de</strong> regresión lineal, <strong>de</strong> <strong>la</strong><br />
re<strong>la</strong>ción <strong>de</strong> humedad re<strong>la</strong>tiva versus altitud y los coeficientes <strong>de</strong> corre<strong>la</strong>ción<br />
correspondiente.<br />
Humedad Re<strong>la</strong>tiva (%)<br />
Humedad Re<strong>la</strong>tiva (%)<br />
Humedad Re<strong>la</strong>tiva (%)<br />
Humedad Re<strong>la</strong>tiva (%)<br />
150<br />
125<br />
100<br />
75<br />
50<br />
25<br />
0<br />
150<br />
125<br />
100<br />
75<br />
50<br />
25<br />
0<br />
150<br />
125<br />
100<br />
75<br />
50<br />
25<br />
0<br />
150<br />
125<br />
100<br />
75<br />
50<br />
25<br />
0<br />
Figura Nº 4.13 Gráfico <strong>de</strong> análisis <strong>de</strong> regresión lineal <strong>de</strong> humedad re<strong>la</strong>tiva versus altitud<br />
Enero<br />
y = 0.02085x - 8.44030<br />
R² = 0.49653<br />
3500 4000 4500 5000<br />
Altitud (msnm)<br />
Abril<br />
y = 0.02484x - 29.55314<br />
R² = 0.62860<br />
3500 4000 4500 5000<br />
Altitud (msnm)<br />
Julio<br />
y = 0.03086x - 62.82619<br />
R² = 0.51313<br />
3500 4000 4500 5000<br />
Altitud (msnm)<br />
Octubre<br />
y = 0.03557x - 79.05853<br />
R² = 0.72583<br />
3500 4000 4500 5000<br />
Altitud (msnm)<br />
Humedad Re<strong>la</strong>tiva (%)<br />
Humedad Re<strong>la</strong>tiva (%)<br />
Humedad Re<strong>la</strong>tiva (%)<br />
Humedad Re<strong>la</strong>tiva (%)<br />
150<br />
125<br />
100<br />
75<br />
50<br />
25<br />
0<br />
150<br />
125<br />
100<br />
75<br />
50<br />
25<br />
0<br />
150<br />
125<br />
100<br />
75<br />
50<br />
25<br />
0<br />
150<br />
125<br />
100<br />
75<br />
50<br />
25<br />
0<br />
Febrero<br />
y = 0.02060x - 7.24490<br />
R² = 0.49289<br />
3500 4000 4500 5000<br />
Altitud (msnm)<br />
Mayo<br />
y = 0.02493x - 36.20954<br />
R² = 0.50460<br />
3500 4000 4500 5000<br />
Altitud (msnm)<br />
Agosto<br />
y = 0.03320x - 72.54687<br />
R² = 0.61392<br />
3500 4000 4500 5000<br />
Altitud (msnm)<br />
Noviembre<br />
y = 0.03442x - 72.43727<br />
R² = 0.68622<br />
3500 4000 4500 5000<br />
Altitud (msnm)<br />
y = 0.02148x - 11.65859<br />
R² = 0.55359<br />
MINAG-ANA-DCPRH-AGUAS SUPERFICIALES Pág.119<br />
Humedad Re<strong>la</strong>tiva (%)<br />
Humedad Re<strong>la</strong>tiva (%)<br />
Humedad Re<strong>la</strong>tiva (%)<br />
Humedad Re<strong>la</strong>tiva (%)<br />
150<br />
125<br />
100<br />
75<br />
50<br />
25<br />
0<br />
150<br />
125<br />
100<br />
75<br />
50<br />
25<br />
0<br />
150<br />
125<br />
100<br />
75<br />
50<br />
25<br />
0<br />
150<br />
125<br />
100<br />
75<br />
50<br />
25<br />
0<br />
Marzo<br />
3500 4000 4500 5000<br />
Altitud (msnm)<br />
Junio<br />
y = 0.03035x - 60.24784<br />
R² = 0.54742<br />
3500 4000 4500 5000<br />
Altitud (msnm)<br />
Setiembre<br />
y = 0.03453x - 76.32130<br />
R² = 0.66226<br />
3500 4000 4500 5000<br />
Altitud (msnm)<br />
Diciembre<br />
y = 0.02908x - 46.36174<br />
R² = 0.61947<br />
3500 4000 4500 5000<br />
Altitud (msnm)
<strong>Estudio</strong> <strong>Hidrológico</strong> <strong>de</strong> <strong>la</strong>s <strong>Cuenca</strong>s Huancané y Suches 2010<br />
Coeficiente<br />
Cuadro Nº 4.9 Parámetros <strong>de</strong> <strong>la</strong> ecuación <strong>de</strong> regresión lineal (humedad re<strong>la</strong>tiva-altitud)<br />
Ene Feb Mar Abr May Jun Jul Ago Sep Oct Nov Dic<br />
a -8.44030 -7.24290 -11.65859 -29.55314 -36.20954 -60.24784 -62.82619 -72.54687 -76.32130 -79.05853 -72.43727 -46.36174<br />
b 0.02085 0.02060 0.02148 0.02484 0.02493 0.03035 0.03086 0.03320 0.03453 0.03557 0.03442 0.02908<br />
R (%) 70.46 70.21 74.40 79.28 71.04 73.99 71.63 78.35 81.38 85.20 82.84 78.71<br />
En <strong>la</strong> Figura Nº 4.14 se verifica que durante el año <strong>la</strong> menor humedad re<strong>la</strong>tiva se registra<br />
en el mes <strong>de</strong> julio, esto en forma general en todas <strong>la</strong>s estaciones <strong>de</strong> <strong>la</strong>s cuencas Huancané y<br />
Suches. A<strong>de</strong>más, se aprecia que <strong>la</strong> humedad re<strong>la</strong>tiva tiene <strong>la</strong> misma ten<strong>de</strong>ncia en todas <strong>la</strong>s<br />
estaciones meteorológicas.<br />
En <strong>la</strong> cuenca Huancané, <strong>la</strong> mayor humedad re<strong>la</strong>tiva se presenta en <strong>la</strong> zona <strong>de</strong> <strong>la</strong> estación<br />
Ananea con 81% y <strong>la</strong> menor en <strong>la</strong> zona <strong>de</strong> <strong>la</strong> estación Muñani <strong>de</strong> 55%. Mientras en <strong>la</strong><br />
cuenca Suches, <strong>la</strong> mayor humedad re<strong>la</strong>tiva se presenta en <strong>la</strong> zona <strong>de</strong> <strong>la</strong> estación Suches con<br />
85% y <strong>la</strong> menor en <strong>la</strong> zona <strong>de</strong> <strong>la</strong>s estaciones Puerto Acosta y Escoma con 62%. Ver Cuadro<br />
Nº 4.10 y <strong>la</strong> Figura Nº 4.15.<br />
Estación<br />
Cuadro Nº 4.10 Humedad re<strong>la</strong>tiva media mensual (%) – Promedio multimensual<br />
Estaciones <strong>de</strong> <strong>la</strong>s cuencas Huancané, Suches y cuencas vecinas<br />
Altitud<br />
(msnm)<br />
MINAG-ANA-DCPRH-AGUAS SUPERFICIALES Pág.120<br />
Mes<br />
Ene Feb Mar Abr May Jun Jul Ago Sep Oct Nov Dic<br />
Huancané 3840.0 70.0 70.0 71.0 66.0 58.0 57.0 57.0 54.0 56.0 56.0 58.0 64.0 61.0<br />
Putina 3856.0 82.0 81.0 78.0 73.0 71.0 71.0 74.0 69.0 67.0 68.0 73.0 78.0 74.0<br />
Muñani 3948.0 66.0 65.0 65.0 60.0 51.0 47.0 47.0 47.0 49.0 52.0 55.0 60.0 55.0<br />
Huaraya Moho 3832.0 71.0 70.0 69.0 66.0 62.0 60.0 57.0 56.0 57.0 58.0 60.0 65.0 63.0<br />
Cojata 4327.0 88.0 87.0 87.0 85.0 79.0 78.0 77.0 79.0 81.0 81.0 84.0 86.0 83.0<br />
Suches 4655.0 89.0 89.0 88.0 86.0 80.0 81.0 81.0 82.0 84.0 87.0 88.0 89.0 85.0<br />
Ananea 4640.0 86.0 87.0 86.0 82.0 75.0 77.0 77.0 77.0 79.0 82.0 83.0 85.0 81.0<br />
Crucero 4130.0 78.0 78.0 78.0 76.0 72.0 69.0 69.0 69.0 72.0 73.0 73.0 77.0 74.0<br />
Progreso 3940.0 69.0 69.0 67.0 63.0 57.0 54.0 52.0 53.0 54.0 57.0 58.0 63.0 60.0<br />
Azángaro 3848.0 71.0 72.0 71.0 67.0 61.0 55.0 53.0 54.0 56.0 58.0 60.0 65.0 62.0<br />
Arapa 3830.0 66.0 68.0 67.0 61.0 53.0 49.0 49.0 49.0 50.0 51.0 54.0 59.0 56.0<br />
Taraco 3820.0 78.0 80.0 78.0 69.0 60.0 56.0 55.0 56.0 59.0 60.0 60.0 68.0 65.0<br />
Conima 3860.0 72.0 72.0 71.0 66.0 60.0 57.0 56.0 56.0 57.0 58.0 60.0 66.0 63.0<br />
Puerto Acosta 3835.0 72.0 72.0 71.0 66.0 59.0 56.0 56.0 55.0 56.0 57.0 60.0 65.0 62.0<br />
Escoma 3828.0 71.0 72.0 71.0 66.0 59.0 56.0 55.0 55.0 56.0 57.0 59.0 65.0 62.0<br />
Chahuaya 4500.0 85.0 85.0 85.0 82.0 76.0 76.0 76.0 77.0 79.0 81.0 82.0 84.0 81.0<br />
La variación espacial <strong>de</strong> <strong>la</strong> humedad re<strong>la</strong>tiva (isolíneas) en <strong>la</strong>s cuencas Huancané y Suches,<br />
se muestra en el Mapa Nº 4.6, don<strong>de</strong> se aprecia que en <strong>la</strong> cuenca Huancané <strong>la</strong> humedad<br />
re<strong>la</strong>tiva media anual varía <strong>de</strong> 50 a 82%, mientras en <strong>la</strong> cuenca Suches varía <strong>de</strong> 62 a 98%,<br />
respectivamente.<br />
Mes<br />
Prom<br />
Anual
<strong>Estudio</strong> <strong>Hidrológico</strong> <strong>de</strong> <strong>la</strong>s <strong>Cuenca</strong>s Huancané y Suches 2010<br />
Humedad re<strong>la</strong>tiva (%)<br />
Humedad re<strong>la</strong>tiva (%)<br />
150.0<br />
125.0<br />
100.0<br />
75.0<br />
50.0<br />
25.0<br />
0.0<br />
120.0<br />
100.0<br />
80.0<br />
60.0<br />
40.0<br />
20.0<br />
0.0<br />
Figura Nº 4.14 Variación mensual <strong>de</strong> <strong>la</strong> humedad re<strong>la</strong>tiva (%) – Promedio multimensual<br />
Estaciones <strong>de</strong> <strong>la</strong>s cuencas Huancané, Suches y cuencas vecinas<br />
Ene Feb Mar Abr May Jun Jul Ago Sep Oct Nov Dic<br />
Tiempo (mes)<br />
Figura Nº 4.15 Variación anual <strong>de</strong> <strong>la</strong> humedad re<strong>la</strong>tiva (%) – Promedio multianual<br />
Estaciones <strong>de</strong> <strong>la</strong>s cuencas Huancané, Suches y cuencas vecinas<br />
61.0<br />
Huancané<br />
74.0<br />
Putina<br />
55.0<br />
Muñani<br />
63.0<br />
Huaraya<br />
Moho<br />
83.0<br />
Cojata<br />
85.0<br />
Suches<br />
81.0<br />
Ananea<br />
Huancané<br />
MINAG-ANA-DCPRH-AGUAS SUPERFICIALES Pág.121<br />
74.0<br />
Crucero<br />
60.0<br />
62.0<br />
Estación Meteorológica<br />
Progreso<br />
Azángaro<br />
56.0<br />
Arapa<br />
65.0<br />
Taraco<br />
63.0 62.0 62.0<br />
Conima<br />
Puerto<br />
Acosta<br />
Escoma<br />
Putina<br />
Muñani<br />
Huaraya Moho<br />
Cojata<br />
Suches<br />
Ananea<br />
Crucero<br />
Progreso<br />
Azángaro<br />
Arapa<br />
Taraco<br />
Conima<br />
Puerto Acosta<br />
Escoma<br />
Chahuaya<br />
81.0<br />
Chahuaya
<strong>Estudio</strong> <strong>Hidrológico</strong> <strong>de</strong> <strong>la</strong>s <strong>Cuenca</strong>s Huancané y Suches 2010<br />
Mapa Nº 4.6 Distribución espacial <strong>de</strong> <strong>la</strong> humedad re<strong>la</strong>tiva (isolíneas) en <strong>la</strong>s cuencas Huancané y Suches<br />
MINAG-ANA-DCPRH-AGUAS SUPERFICIALES Pág.122
<strong>Estudio</strong> <strong>Hidrológico</strong> <strong>de</strong> <strong>la</strong>s <strong>Cuenca</strong>s Huancané y Suches 2010<br />
4.1.4 Evaporación<br />
La evaporación es el proceso físico mediante el cual el agua se convierte a su forma<br />
gaseosa. La evaporación <strong>de</strong>l agua a <strong>la</strong> atmósfera ocurre en <strong>la</strong> superficie <strong>de</strong> <strong>río</strong>s, <strong>la</strong>gos,<br />
suelos y vegetación. La evaporación es otro <strong>de</strong> los elementos principales <strong>de</strong> <strong>la</strong> fase <strong>de</strong>l<br />
ciclo hidrológico.<br />
Factores que influyen en <strong>la</strong> evaporación:<br />
a. Humedad re<strong>la</strong>tiva.- La re<strong>la</strong>ción es inversa, entre mayor sea el contenido <strong>de</strong> vapor<br />
en <strong>la</strong> atmósfera menor será <strong>la</strong> evaporación.<br />
b. Temperatura <strong>de</strong>l aire.- Al aumentar <strong>la</strong> temperatura aumenta <strong>la</strong> evaporación, <strong>de</strong>bido<br />
a que se aumenta <strong>la</strong> capacidad <strong>de</strong> <strong>la</strong> masa <strong>de</strong> aire <strong>de</strong> almacenar vapor <strong>de</strong> agua.<br />
c. Viento.- El viento lo que hace es remover <strong>la</strong>s masas <strong>de</strong> vapor <strong>de</strong> agua, aumentando<br />
el déficit <strong>de</strong> vapor <strong>de</strong>l aire o <strong>la</strong> <strong>de</strong>manda evaporativa.<br />
d. Radiación so<strong>la</strong>r.- Es <strong>la</strong> fuente <strong>de</strong> energía <strong>de</strong>l proceso, ya que él <strong>la</strong> que calienta el<br />
agua provocando el paso <strong>de</strong>l estado líquido al estado <strong>de</strong> vapor.<br />
e. Presión atmosférica.- Su efecto sólo es apreciable cuando hay gran<strong>de</strong>s diferencias<br />
en altitud, tanto menor sea <strong>la</strong> presión atmosférica mayor será <strong>la</strong> evaporación.<br />
f. Salinidad <strong>de</strong>l agua.- La evaporación es inversamente proporcional a <strong>la</strong> salinidad <strong>de</strong>l<br />
agua.<br />
Metodología <strong>de</strong> cálculo <strong>de</strong> <strong>la</strong> evaporación: Métodos directos.<br />
1) Tanque <strong>de</strong> Evaporación C<strong>la</strong>se A<br />
Dentro <strong>de</strong> los métodos directos más empleados en el mundo, está el tanque <strong>de</strong> evaporación<br />
c<strong>la</strong>se A, que consiste en <strong>la</strong> medida <strong>de</strong> <strong>la</strong> evaporación partiendo <strong>de</strong> una superficie <strong>de</strong> agua,<br />
ésta se hace estableciendo <strong>la</strong> medida <strong>de</strong> <strong>la</strong> disminución <strong>de</strong> una superficie <strong>de</strong> agua a partir<br />
<strong>de</strong> una superficie evaporante en milímetros (mm). El agua evaporada en un pe<strong>río</strong>do, está<br />
dada <strong>de</strong>terminada mediante <strong>la</strong> siguiente expresión:<br />
Ev Li Lf P A R<br />
Don<strong>de</strong>:<br />
Ev = Evaporación en el pe<strong>río</strong>do.<br />
Li = Lectura al inicio <strong>de</strong>l pe<strong>río</strong>do en el micrómetro.<br />
Lf = Lectura al final <strong>de</strong>l pe<strong>río</strong>do en el micrómetro.<br />
P = Precipitación en el pe<strong>río</strong>do.<br />
A = Abastecimiento <strong>de</strong> agua en el pe<strong>río</strong>do.<br />
R = Retiro <strong>de</strong> agua en el pe<strong>río</strong>do.<br />
2) Lisímetros<br />
También se pue<strong>de</strong> conocer a partir <strong>de</strong> lisímetros insta<strong>la</strong>dos en suelo <strong>de</strong>snudo (libre <strong>de</strong><br />
vegetación), el Lisímetro es una caja <strong>de</strong> fibra <strong>de</strong> vidrio o lámina galvanizada <strong>la</strong> cuál<br />
contiene el suelo “in situ”. La muestra <strong>de</strong> suelo recibe <strong>la</strong>s precipitaciones, <strong>la</strong>s aguas<br />
MINAG-ANA-DCPRH-AGUAS SUPERFICIALES Pág.123
<strong>Estudio</strong> <strong>Hidrológico</strong> <strong>de</strong> <strong>la</strong>s <strong>Cuenca</strong>s Huancané y Suches 2010<br />
exce<strong>de</strong>ntes o <strong>de</strong> drenaje son medidas en su salida, por lo tanto <strong>la</strong>s pérdidas por evaporación<br />
pue<strong>de</strong>n ser conocidas a través <strong>de</strong>l ba<strong>la</strong>nce hídrico <strong>de</strong>l sistema.<br />
Para el presente estudio, los registros disponibles <strong>de</strong> evaporación, <strong>de</strong> <strong>la</strong>s estaciones<br />
meteorológicas provienen <strong>de</strong> observaciones <strong>de</strong> Tanque <strong>de</strong> Evaporación C<strong>la</strong>se A.<br />
De <strong>la</strong>s dieciséis (16) estaciones meteorológicas, ocho (8) estaciones disponen el registro<br />
histórico <strong>de</strong> evaporación total mensual y otras ocho (8) estaciones tienen escasa<br />
información. Por lo tanto, <strong>de</strong>bido a <strong>la</strong> carencia <strong>de</strong> estadísticas <strong>de</strong> <strong>la</strong> evaporación, para <strong>la</strong>s<br />
estaciones Putina, Muñani, Cojata, Suches, Azángaro, Puerto Acosta, Escoma y Chahuaya,<br />
se han estimado mediante el análisis <strong>de</strong> regresión lineal con los datos <strong>de</strong> <strong>la</strong>s estaciones con<br />
registros existentes, corre<strong>la</strong>cionando <strong>la</strong> altitud y <strong>la</strong> evaporación.<br />
Ecuación <strong>de</strong> re<strong>la</strong>ción: Ev = a + bH, don<strong>de</strong> H es <strong>la</strong> altitud en msnm.<br />
En <strong>la</strong> Figura Nº 4.16 se muestra los resultados <strong>de</strong>l análisis <strong>de</strong> regresión lineal, don<strong>de</strong> se ha<br />
corre<strong>la</strong>cionado <strong>la</strong> evaporación con <strong>la</strong> altitud. Los resultados <strong>de</strong>l análisis entre <strong>la</strong>s variables<br />
analizadas, dan una corre<strong>la</strong>ción buena.<br />
En el Cuadro Nº 4.11 se presenta los parámetros <strong>de</strong> <strong>la</strong> ecuación <strong>de</strong> regresión lineal, <strong>de</strong> <strong>la</strong><br />
re<strong>la</strong>ción <strong>de</strong> evaporación versus altitud y los coeficientes <strong>de</strong> corre<strong>la</strong>ción correspondiente.<br />
Evaporación (mm)<br />
Evaporación (mm)<br />
Evaporación (mm)<br />
250<br />
200<br />
150<br />
100<br />
50<br />
0<br />
250<br />
200<br />
150<br />
100<br />
50<br />
0<br />
250<br />
200<br />
150<br />
100<br />
50<br />
0<br />
Figura Nº 4.16 Gráfico <strong>de</strong> análisis <strong>de</strong> regresión lineal <strong>de</strong> evaporación versus altitud<br />
Enero<br />
y = -0.08575x + 456.58081<br />
R² = 0.62028<br />
3500 4000 4500 5000<br />
Altitud (msnm)<br />
Abril<br />
y = -0.07638x + 415.73254<br />
R² = 0.57636<br />
3500 4000 4500 5000<br />
Altitud (msnm)<br />
Julio<br />
y = -0.06605x + 376.42042<br />
R² = 0.41196<br />
3500 4000 4500 5000<br />
Altitud (msnm)<br />
Evaporación (mm)<br />
Evaporación (mm)<br />
Evaporación (mm)<br />
250<br />
200<br />
150<br />
100<br />
50<br />
0<br />
250<br />
200<br />
150<br />
100<br />
50<br />
0<br />
250<br />
200<br />
150<br />
100<br />
50<br />
0<br />
Febrero<br />
y = -0.06524x + 362.55062<br />
R² = 0.61134<br />
3500 4000 4500 5000<br />
Altitud (msnm)<br />
Mayo<br />
y = -0.06130x + 359.01300<br />
R² = 0.35849<br />
3500 4000 4500 5000<br />
Altitud (msnm)<br />
Agosto<br />
y = -0.07728x + 434.31994<br />
R² = 0.53661<br />
3500 4000 4500 5000<br />
Altitud (msnm)<br />
y = -0.07099x + 391.83216<br />
R² = 0.52674<br />
MINAG-ANA-DCPRH-AGUAS SUPERFICIALES Pág.124<br />
Evaporación (mm)<br />
Evaporación (mm)<br />
Evaporación (mm)<br />
250<br />
200<br />
150<br />
100<br />
50<br />
0<br />
250<br />
200<br />
150<br />
100<br />
50<br />
0<br />
250<br />
200<br />
150<br />
100<br />
50<br />
0<br />
Marzo<br />
3500 4000 4500 5000<br />
Altitud (msnm)<br />
Junio<br />
y = -0.05939x + 343.35335<br />
R² = 0.32789<br />
3500 4000 4500 5000<br />
Altitud (msnm)<br />
Setiembre<br />
y = -0.08758x + 482.58075<br />
R² = 0.51387<br />
3500 4000 4500 5000<br />
Altitud (msnm)
Evaporación (mm)<br />
<strong>Estudio</strong> <strong>Hidrológico</strong> <strong>de</strong> <strong>la</strong>s <strong>Cuenca</strong>s Huancané y Suches 2010<br />
250<br />
200<br />
150<br />
100<br />
50<br />
0<br />
Coeficiente<br />
Octubre<br />
y = -0.09560x + 515.51077<br />
R² = 0.50209<br />
3500 4000 4500 5000<br />
Altitud (msnm)<br />
Evaporación (mm)<br />
250<br />
200<br />
150<br />
100<br />
50<br />
0<br />
Noviembre<br />
y = -0.10868x + 569.62994<br />
R² = 0.51010<br />
3500 4000 4500 5000<br />
Altitud (msnm)<br />
y = -0.10673x + 552.76721<br />
R² = 0.60557<br />
MINAG-ANA-DCPRH-AGUAS SUPERFICIALES Pág.125<br />
Evaporación (mm)<br />
250<br />
200<br />
150<br />
100<br />
50<br />
0<br />
Diciembre<br />
3500 4000 4500 5000<br />
Altitud (msnm)<br />
Cuadro Nº 4.11 Parámetros <strong>de</strong> <strong>la</strong> ecuación <strong>de</strong> regresión lineal (evaporación-altitud)<br />
Ene Feb Mar Abr May Jun Jul Ago Sep Oct Nov Dic<br />
a 456.58081 362.55062 391.83216 415.73254 359.01300 343.35335 376.42042 434.31994 482.58075 515.51077 569.62994 552.76721<br />
b -0.08575 -0.06524 -0.07099 -0.07638 -0.06130 -0.05939 -0.06605 -0.07728 -0.08758 -0.09560 -0.10868 -0.10673<br />
R (%) 78.76 78.19 72.58 75.92 59.87 57.26 64.18 73.25 71.68 70.86 71.42 77.82<br />
En <strong>la</strong> Figura Nº 4.17 se verifica que durante el año <strong>la</strong> menor evaporación se registra en el<br />
mes <strong>de</strong> febrero, en mayoría <strong>de</strong> <strong>la</strong>s estaciones <strong>de</strong> <strong>la</strong>s cuencas Huancané y Suches. A<strong>de</strong>más,<br />
se aprecia que <strong>la</strong> evaporación tiene <strong>la</strong> misma ten<strong>de</strong>ncia en todas <strong>la</strong>s estaciones<br />
meteorológicas.<br />
En <strong>la</strong> cuenca Huancané, <strong>la</strong> mayor evaporación se presenta en <strong>la</strong> zona <strong>de</strong> <strong>la</strong> estación Putina<br />
con 1555 mm y <strong>la</strong> menor en <strong>la</strong> zona <strong>de</strong> <strong>la</strong> estación Ananea <strong>de</strong> 900 mm. Mientras en <strong>la</strong><br />
cuenca Suches, <strong>la</strong> mayor evaporación se presenta en <strong>la</strong> zona <strong>de</strong> <strong>la</strong> estación Escoma con<br />
1581 mm y <strong>la</strong> menor en <strong>la</strong> zona <strong>de</strong> <strong>la</strong> estación Suches con 787 mm. Ver Cuadro Nº 4.12 y<br />
<strong>la</strong> Figura Nº 4.18.<br />
Estación<br />
Cuadro Nº 4.12 Evaporación total media mensual (mm) – Promedio multimensual<br />
Estaciones <strong>de</strong> <strong>la</strong>s cuencas Huancané, Suches y cuencas vecinas<br />
Altitud<br />
(msnm)<br />
Mes<br />
Ene Feb Mar Abr May Jun Jul Ago Sep Oct Nov Dic<br />
Huancané 3840.0 125.8 109.9 112.8 106.9 111.7 99.3 111.8 137.0 156.0 171.7 164.1 144.1 1551.1<br />
Putina 3856.0 126.0 111.0 118.0 121.0 123.0 114.0 122.0 136.0 145.0 147.0 151.0 141.0 1555.0<br />
Muñani 3948.0 118.0 105.0 112.0 114.0 117.0 109.0 116.0 129.0 137.0 138.0 141.0 131.0 1467.0<br />
Huaraya Moho 3832.0 123.0 109.9 116.8 115.5 115.9 102.5 113.0 131.1 144.1 153.2 149.5 135.7 1510.2<br />
Cojata 4327.0 86.0 80.0 85.0 85.0 94.0 86.0 91.0 100.0 104.0 102.0 99.0 91.0 1103.0<br />
Suches 4655.0 57.0 59.0 61.0 60.0 74.0 67.0 69.0 75.0 75.0 70.0 64.0 56.0 787.0<br />
Ananea 4640.0 67.0 64.3 70.1 66.0 84.9 76.8 78.1 83.1 82.8 82.5 76.2 68.2 900.0<br />
Crucero 4130.0 72.7 71.5 66.4 79.5 67.9 62.5 69.9 86.2 94.0 82.5 85.0 75.8 913.9<br />
Progreso 3940.0 142.3 133.7 147.4 145.1 152.7 147.8 155.2 162.3 169.7 169.9 168.4 159.6 1854.1<br />
Azángaro 3848.0 127.0 112.0 119.0 122.0 123.0 115.0 122.0 137.0 146.0 148.0 151.0 142.0 1564.0<br />
Arapa 3830.0 155.1 122.5 127.4 137.5 130.1 122.9 130.7 151.9 176.2 171.9 199.7 178.4 1804.3<br />
Taraco 3820.0 121.0 106.7 122.1 137.5 147.4 140.6 140.3 147.7 134.3 129.9 140.0 143.1 1610.6<br />
Conima 3860.0 111.1 101.2 107.8 102.0 106.6 100.5 106.0 110.5 110.6 113.5 108.2 113.3 1291.3<br />
Puerto Acosta 3835.0 128.0 112.0 120.0 123.0 124.0 116.0 123.0 138.0 147.0 149.0 153.0 143.0 1576.0<br />
Escoma 3828.0 128.0 113.0 120.0 123.0 124.0 116.0 124.0 138.0 147.0 150.0 154.0 144.0 1581.0<br />
Chahuaya 4500.0 71.0 69.0 72.0 72.0 83.0 76.0 79.0 87.0 88.0 85.0 81.0 72.0 935.0<br />
Mes<br />
Total<br />
Anual
Evaporación (mm)<br />
<strong>Estudio</strong> <strong>Hidrológico</strong> <strong>de</strong> <strong>la</strong>s <strong>Cuenca</strong>s Huancané y Suches 2010<br />
Evaporación (mm)<br />
250.0<br />
225.0<br />
200.0<br />
175.0<br />
150.0<br />
125.0<br />
100.0<br />
75.0<br />
50.0<br />
25.0<br />
0.0<br />
2500.0<br />
2000.0<br />
1500.0<br />
1000.0<br />
500.0<br />
0.0<br />
Figura Nº 4.17 Variación mensual <strong>de</strong> <strong>la</strong> evaporación (mm) – Promedio multimensual<br />
Estaciones <strong>de</strong> <strong>la</strong>s cuencas Huancané, Suches y cuencas vecinas<br />
Ene Feb Mar Abr May Jun Jul Ago Sep Oct Nov Dic<br />
Tiempo (mes)<br />
Figura Nº 4.18 Variación anual <strong>de</strong> <strong>la</strong> evaporación (mm) – Promedio multianual<br />
Estaciones <strong>de</strong> <strong>la</strong>s cuencas Huancané, Suches y cuencas vecinas<br />
1551.1 1555.0<br />
Huancané<br />
Putina<br />
1467.0 1510.2<br />
Muñani<br />
Huaraya<br />
Moho<br />
1103.0<br />
Cojata<br />
787.0<br />
Suches<br />
900.0<br />
Ananea<br />
Huancané<br />
MINAG-ANA-DCPRH-AGUAS SUPERFICIALES Pág.126<br />
913.9<br />
Crucero<br />
1854.1<br />
1564.0<br />
Estación Meteorológica<br />
Progreso<br />
Azángaro<br />
1804.3<br />
Arapa<br />
1610.6<br />
Taraco<br />
1291.3<br />
Conima<br />
Putina<br />
Muñani<br />
Huaraya Moho<br />
Cojata<br />
Suches<br />
Ananea<br />
Crucero<br />
Progreso<br />
Azángaro<br />
Arapa<br />
1576.0 1581.0<br />
Puerto<br />
Acosta<br />
Escoma<br />
Taraco<br />
Conima<br />
Puerto Acosta<br />
Escoma<br />
Chahuaya<br />
La variación espacial <strong>de</strong> <strong>la</strong> evaporación (isolíneas) en <strong>la</strong>s cuencas Huancané y Suches, se<br />
muestra en el Mapa Nº 4.7, don<strong>de</strong> se aprecia que en <strong>la</strong> cuenca Huancané <strong>la</strong> evaporación<br />
total media anual varía <strong>de</strong> 1020 a 1680 mm, mientras en <strong>la</strong> cuenca Suches varía <strong>de</strong> 540 a<br />
1740 mm, respectivamente.<br />
935.0<br />
Chahuaya
<strong>Estudio</strong> <strong>Hidrológico</strong> <strong>de</strong> <strong>la</strong>s <strong>Cuenca</strong>s Huancané y Suches 2010<br />
Mapa Nº 4.7 Distribución espacial <strong>de</strong> <strong>la</strong> evaporación (isolíneas) en <strong>la</strong>s cuencas Huancané y Suches<br />
MINAG-ANA-DCPRH-AGUAS SUPERFICIALES Pág.127
<strong>Estudio</strong> <strong>Hidrológico</strong> <strong>de</strong> <strong>la</strong>s <strong>Cuenca</strong>s Huancané y Suches 2010<br />
4.1.5 Horas <strong>de</strong> sol<br />
Número <strong>de</strong> horas por día <strong>de</strong> luz so<strong>la</strong>r bril<strong>la</strong>nte, también <strong>de</strong>finida como <strong>la</strong> duración <strong>de</strong> trazas<br />
o quemaduras hechas en una carta hidrográfica por el registro <strong>de</strong> "Campbell Stokes".<br />
El Servicio Nacional <strong>de</strong> Meteorología e Hidrología – SENAMHI, mi<strong>de</strong> <strong>la</strong> duración <strong>de</strong><br />
inso<strong>la</strong>ción diaria con el aparato meteorológico l<strong>la</strong>mado “Heliógrafo”.<br />
De <strong>la</strong>s dieciséis (16) estaciones meteorológicas, cuatro (4) estaciones disponen el registro<br />
histórico <strong>de</strong> <strong>la</strong>s horas <strong>de</strong> sol y otras doce (12) estaciones tienen escasa información. Por lo<br />
tanto, <strong>de</strong>bido a <strong>la</strong> carencia <strong>de</strong> estadísticas <strong>de</strong> <strong>la</strong>s horas <strong>de</strong> sol, para <strong>la</strong>s estaciones Muñani,<br />
Cojata, Suches, Crucero, Progreso, Azángaro, Arapa, Taraco, Conima, Puerto Acosta,<br />
Escoma y Chahuaya, se han estimado mediante el análisis <strong>de</strong> regresión lineal con los datos<br />
<strong>de</strong> <strong>la</strong>s estaciones con registros existentes, corre<strong>la</strong>cionando <strong>la</strong> altitud y <strong>la</strong>s horas <strong>de</strong> sol.<br />
Ecuación <strong>de</strong> re<strong>la</strong>ción: HS = a + bH, don<strong>de</strong> H es <strong>la</strong> altitud en msnm.<br />
En <strong>la</strong> Figura Nº 4.19 se muestra los resultados <strong>de</strong>l análisis <strong>de</strong> regresión lineal, don<strong>de</strong> se ha<br />
corre<strong>la</strong>cionado <strong>la</strong>s horas <strong>de</strong> sol con <strong>la</strong> altitud. Los resultados <strong>de</strong>l análisis entre <strong>la</strong>s variables<br />
analizadas, dan una corre<strong>la</strong>ción buena.<br />
Horas <strong>de</strong> sol<br />
Horas <strong>de</strong> sol<br />
Horas <strong>de</strong> sol<br />
10<br />
8<br />
6<br />
4<br />
2<br />
0<br />
12<br />
9<br />
6<br />
3<br />
0<br />
12<br />
9<br />
6<br />
3<br />
0<br />
Figura Nº 4.19 Gráfico <strong>de</strong> análisis <strong>de</strong> regresión lineal <strong>de</strong> horas <strong>de</strong> sol versus altitud<br />
Enero<br />
y = -0.00173x + 11.91017<br />
R² = 0.62566<br />
3500 4000 4500 5000<br />
Altitud (msnm)<br />
Abril<br />
y = -0.00165x + 14.17742<br />
R² = 0.87357<br />
3500 4000 4500 5000<br />
Altitud (msnm)<br />
Julio<br />
y = -0.00095x + 12.93241<br />
R² = 0.74682<br />
3500 4000 4500 5000<br />
Altitud (msnm)<br />
Horas <strong>de</strong> sol<br />
Horas <strong>de</strong> sol<br />
Horas <strong>de</strong> sol<br />
10<br />
8<br />
6<br />
4<br />
2<br />
0<br />
12<br />
9<br />
6<br />
3<br />
0<br />
12<br />
9<br />
6<br />
3<br />
0<br />
Febrero<br />
y = -0.00115x + 9.92259<br />
R² = 0.47136<br />
3500 4000 4500 5000<br />
Altitud (msnm)<br />
Mayo<br />
y = -0.00064x + 11.51305<br />
R² = 0.71401<br />
3500 4000 4500 5000<br />
Altitud (msnm)<br />
Agosto<br />
y = -0.00081x + 12.09013<br />
R² = 0.50546<br />
3500 4000 4500 5000<br />
Altitud (msnm)<br />
y = -0.00147x + 11.91603<br />
R² = 0.65336<br />
MINAG-ANA-DCPRH-AGUAS SUPERFICIALES Pág.128<br />
Horas <strong>de</strong> sol<br />
Horas <strong>de</strong> sol<br />
Horas <strong>de</strong> sol<br />
10<br />
8<br />
6<br />
4<br />
2<br />
0<br />
12<br />
9<br />
6<br />
3<br />
0<br />
12<br />
9<br />
6<br />
3<br />
0<br />
Marzo<br />
3500 4000 4500 5000<br />
Altitud (msnm)<br />
Junio<br />
y = -0.00075x + 12.11177<br />
R² = 0.45228<br />
3500 4000 4500 5000<br />
Altitud (msnm)<br />
Setiembre<br />
y = -0.00119x + 13.01897<br />
R² = 0.55017<br />
3500 4000 4500 5000<br />
Altitud (msnm)
Horas <strong>de</strong> sol<br />
<strong>Estudio</strong> <strong>Hidrológico</strong> <strong>de</strong> <strong>la</strong>s <strong>Cuenca</strong>s Huancané y Suches 2010<br />
12<br />
9<br />
6<br />
3<br />
0<br />
Octubre<br />
y = -0.00258x + 17.98062<br />
R² = 0.60983<br />
3500 4000 4500 5000<br />
Altitud (msnm)<br />
Horas <strong>de</strong> sol<br />
12<br />
9<br />
6<br />
3<br />
0<br />
Noviembre<br />
y = -0.00213x + 15.43932<br />
R² = 0.62483<br />
3500 4000 4500 5000<br />
Altitud (msnm)<br />
y = -0.00242x + 15.57531<br />
R² = 0.98166<br />
MINAG-ANA-DCPRH-AGUAS SUPERFICIALES Pág.129<br />
Horas <strong>de</strong> sol<br />
12<br />
9<br />
6<br />
3<br />
0<br />
Diciembre<br />
3500 4000 4500 5000<br />
Altitud (msnm)<br />
En el Cuadro Nº 4.13 se presenta los parámetros <strong>de</strong> <strong>la</strong> ecuación <strong>de</strong> regresión lineal, <strong>de</strong> <strong>la</strong><br />
re<strong>la</strong>ción <strong>de</strong> <strong>la</strong>s horas <strong>de</strong> sol versus altitud y los coeficientes <strong>de</strong> corre<strong>la</strong>ción correspondiente.<br />
Coeficiente<br />
Cuadro Nº 4.13 Parámetros <strong>de</strong> <strong>la</strong> ecuación <strong>de</strong> regresión lineal (horas <strong>de</strong> sol-altitud)<br />
Ene Feb Mar Abr May Jun Jul Ago Sep Oct Nov Dic<br />
a 11.91017 9.92259 11.91603 14.17742 11.51305 12.11177 12.93241 12.09013 13.01897 17.98062 15.43932 15.57531<br />
b -0.00173 -0.00115 -0.00147 -0.00165 -0.00064 -0.00075 -0.00095 -0.00081 -0.00119 -0.00258 -0.00213 -0.00242<br />
R (%) 79.10 68.66 80.83 93.46 84.50 67.25 86.42 71.10 74.17 78.09 79.05 99.08<br />
En <strong>la</strong> Figura Nº 4.20 se verifica que durante el año <strong>la</strong> menor horas <strong>de</strong> sol se registra en el<br />
mes <strong>de</strong> enero, en mayoría <strong>de</strong> <strong>la</strong>s estaciones <strong>de</strong> <strong>la</strong>s cuencas Huancané y Suches. A<strong>de</strong>más, se<br />
aprecia que <strong>la</strong>s horas <strong>de</strong> sol tienen <strong>la</strong> misma ten<strong>de</strong>ncia en todas <strong>la</strong>s estaciones<br />
meteorológicas.<br />
En <strong>la</strong> cuenca Huancané, <strong>la</strong> mayor horas <strong>de</strong> sol se presenta en <strong>la</strong> zona <strong>de</strong> <strong>la</strong> estación<br />
Huancané con 7.85 horas y <strong>la</strong> menor en <strong>la</strong> zona <strong>de</strong> <strong>la</strong> estación Ananea <strong>de</strong> 6.47 horas.<br />
Mientras en <strong>la</strong> cuenca Suches, <strong>la</strong> mayor horas <strong>de</strong> sol se presenta en <strong>la</strong> zona <strong>de</strong> <strong>la</strong> estación<br />
Escoma con 7.64 horas y <strong>la</strong> menor en <strong>la</strong> zona <strong>de</strong> <strong>la</strong> estación Suches con 6.44 horas. Ver<br />
Cuadro Nº 4.14 y <strong>la</strong> Figura Nº 4.21.<br />
Estación<br />
Altitud<br />
(msnm)<br />
Cuadro Nº 4.14 Horas <strong>de</strong> sol media mensual – Promedio multimensual<br />
Estaciones <strong>de</strong> <strong>la</strong>s cuencas Huancané, Suches y cuencas vecinas<br />
Mes<br />
Ene Feb Mar Abr May Jun Jul Ago Sep Oct Nov Dic<br />
Huancané 3840.0 5.51 6.04 6.53 7.92 9.28 9.02 9.00 8.88 8.93 8.50 8.18 6.46 7.85<br />
Putina 3856.0 4.51 4.85 5.63 7.45 8.94 8.94 9.25 8.64 7.86 6.87 6.62 6.22 7.15<br />
Muñani 3948.0 5.08 5.38 6.11 7.66 8.99 9.15 9.18 8.89 8.32 7.79 7.03 6.02 7.47<br />
Huaraya Moho 3832.0 5.79 5.63 6.60 8.08 8.93 9.69 9.55 9.42 8.49 8.80 6.99 6.16 7.84<br />
Cojata 4327.0 4.42 4.95 5.56 7.04 8.74 8.87 8.82 8.59 7.87 6.82 6.22 5.10 6.92<br />
Suches 4655.0 3.86 4.57 5.07 6.50 8.53 8.62 8.51 8.32 7.48 5.97 5.52 4.31 6.44<br />
Ananea 4640.0 3.92 4.61 5.10 6.51 8.54 8.63 8.51 8.35 7.49 6.04 5.58 4.35 6.47<br />
Crucero 4130.0 4.77 5.17 5.84 7.36 8.87 9.01 9.01 8.74 8.10 7.33 6.64 5.58 7.20<br />
Progreso 3940.0 5.09 5.39 6.12 7.68 8.99 9.16 9.19 8.90 8.33 7.82 7.05 6.04 7.48<br />
Azángaro 3848.0 5.25 5.50 6.26 7.83 9.05 9.23 9.28 8.97 8.44 8.05 7.24 6.26 7.61<br />
Arapa 3830.0 5.28 5.52 6.29 7.86 9.06 9.24 9.29 8.99 8.46 8.10 7.28 6.31 7.64<br />
Taraco 3820.0 5.30 5.53 6.30 7.87 9.07 9.25 9.30 9.00 8.47 8.13 7.30 6.33 7.65<br />
Conima 3860.0 5.23 5.48 6.24 7.81 9.04 9.22 9.27 8.96 8.43 8.02 7.22 6.23 7.60<br />
Puerto Acosta 3835.0 5.28 5.51 6.28 7.85 9.06 9.24 9.29 8.98 8.46 8.09 7.27 6.29 7.63<br />
Escoma 3828.0 5.29 5.52 6.29 7.86 9.06 9.24 9.30 8.99 8.46 8.10 7.29 6.31 7.64<br />
Chahuaya 4500.0 4.13 4.75 5.30 6.75 8.63 8.74 8.66 8.45 7.66 6.37 5.85 4.69 6.67<br />
Mes<br />
Prom<br />
Anual
<strong>Estudio</strong> <strong>Hidrológico</strong> <strong>de</strong> <strong>la</strong>s <strong>Cuenca</strong>s Huancané y Suches 2010<br />
Horas <strong>de</strong> sol<br />
Horas <strong>de</strong> sol<br />
14.00<br />
12.00<br />
10.00<br />
8.00<br />
6.00<br />
4.00<br />
2.00<br />
0.00<br />
12.0<br />
10.0<br />
8.0<br />
6.0<br />
4.0<br />
2.0<br />
0.0<br />
Figura Nº 4.20 Variación mensual <strong>de</strong> <strong>la</strong>s horas <strong>de</strong> sol – Promedio multimensual<br />
Estaciones <strong>de</strong> <strong>la</strong>s cuencas Huancané, Suches y cuencas vecinas<br />
Ene Feb Mar Abr May Jun Jul Ago Sep Oct Nov Dic<br />
7.85<br />
Huancané<br />
Tiempo (mes)<br />
Figura Nº 4.21 Variación anual <strong>de</strong> <strong>la</strong>s horas <strong>de</strong> sol – Promedio multianual<br />
Estaciones <strong>de</strong> <strong>la</strong>s cuencas Huancané, Suches y cuencas vecinas<br />
7.15<br />
Putina<br />
7.47<br />
Muñani<br />
7.84<br />
Huaraya<br />
Moho<br />
6.92<br />
Cojata<br />
6.44 6.47<br />
Suches<br />
Ananea<br />
Huancané<br />
MINAG-ANA-DCPRH-AGUAS SUPERFICIALES Pág.130<br />
7.20<br />
Crucero<br />
Estación Meteorológica<br />
7.48 7.61 7.64 7.65 7.60 7.63 7.64<br />
Progreso<br />
Azángaro<br />
Arapa<br />
Taraco<br />
Conima<br />
Puerto<br />
Acosta<br />
Escoma<br />
Putina<br />
Muñani<br />
Huaraya Moho<br />
Cojata<br />
Suches<br />
Ananea<br />
Crucero<br />
Progreso<br />
Azángaro<br />
Arapa<br />
Taraco<br />
Conima<br />
Puerto Acosta<br />
Escoma<br />
Chahuaya<br />
6.67<br />
Chahuaya
<strong>Estudio</strong> <strong>Hidrológico</strong> <strong>de</strong> <strong>la</strong>s <strong>Cuenca</strong>s Huancané y Suches 2010<br />
4.1.6 Viento<br />
El viento es el movimiento <strong>de</strong> aire en <strong>la</strong> superficie terrestre. Es generado por <strong>la</strong> acción <strong>de</strong><br />
gradientes <strong>de</strong> presión atmosférica producida por el calentamiento diferencial <strong>de</strong> <strong>la</strong>s<br />
superficies y masas <strong>de</strong> aire.<br />
La superficie <strong>de</strong> <strong>la</strong> tierra se calienta por <strong>la</strong> radiación so<strong>la</strong>r, esta radiación so<strong>la</strong>r no se recibe<br />
con <strong>la</strong> misma intensidad en todas <strong>la</strong>s zonas <strong>de</strong>l p<strong>la</strong>neta como lo observamos en el capítulo<br />
<strong>de</strong> radiación, lo que origina un calentamiento <strong>de</strong>sigual <strong>de</strong> <strong>la</strong>s masas <strong>de</strong> aire. El aire <strong>de</strong> <strong>la</strong>s<br />
capas atmosféricas más bajas se calienta bajo <strong>la</strong> influencia <strong>de</strong> <strong>la</strong> superficie terrestre, siendo<br />
su calentamiento más o menos intenso según <strong>la</strong> temperatura que alcanza <strong>la</strong>s diferentes<br />
zonas <strong>de</strong> <strong>la</strong> superficie terrestre con <strong>la</strong>s que se mantiene en contacto.<br />
En general existe <strong>la</strong> ten<strong>de</strong>ncia a que cualquier <strong>de</strong>sequilibrio que exista a nivel <strong>de</strong> <strong>la</strong><br />
atmósfera tien<strong>de</strong> a equilibrarse <strong>de</strong> manera natural. El <strong>de</strong>sequilibrio creado por <strong>la</strong> diferencia<br />
<strong>de</strong> presión tien<strong>de</strong> a equilibrarse <strong>de</strong> una forma natural mediante el <strong>de</strong>sp<strong>la</strong>zamiento <strong>de</strong> aire <strong>de</strong><br />
<strong>la</strong> zona <strong>de</strong> mayor presión a <strong>la</strong> <strong>de</strong> menor presión, este <strong>de</strong>sp<strong>la</strong>zamiento <strong>de</strong> aire horizontal<br />
recibe el nombre <strong>de</strong> viento.<br />
Des<strong>de</strong> el punto <strong>de</strong> vista ecológico, un buen conocimiento <strong>de</strong>l viento tiene implicaciones<br />
amplias en <strong>la</strong> agricultura y en el manejo <strong>de</strong> los suelos. Los vientos influyen en:<br />
1. La remoción <strong>de</strong> CO2.<br />
2. Transferencia y/o remoción <strong>de</strong> vapor <strong>de</strong> agua.<br />
3. Transporte <strong>de</strong> insectos, polen y esporas <strong>de</strong> enfermeda<strong>de</strong>s.<br />
4. Desgarre <strong>de</strong> hojas.<br />
5. Cambios en <strong>la</strong> humedad atmosférica local.<br />
6. Aumento en <strong>la</strong>s tasas <strong>de</strong> evapotranspiración.<br />
7. Pérdidas en <strong>la</strong>s aplicaciones <strong>de</strong> agroquímicos y en los sistemas <strong>de</strong> riego por<br />
aspersión.<br />
8. Cambios térmicos en <strong>la</strong>s primeras capas <strong>de</strong>l suelo.<br />
9. Pérdidas <strong>de</strong> suelos por erosión eólica.<br />
10. Causa sequías.<br />
Las dos características fundamentales <strong>de</strong>l viento son <strong>la</strong> Velocidad y <strong>la</strong> Dirección.<br />
Velocidad: espacio recorrido por unidad <strong>de</strong> tiempo (m/s; km/h).<br />
Dirección: es el punto <strong>de</strong>l horizonte <strong>de</strong> don<strong>de</strong> viene el viento.<br />
Tab<strong>la</strong> Nº 4.1 Valores generales <strong>de</strong> <strong>la</strong> velocidad <strong>de</strong>l viento en términos mensuales<br />
Descripción<br />
Velocidad media mensual <strong>de</strong>l viento<br />
a 2 m <strong>de</strong> altura<br />
Vientos suaves = 5.0 m/s<br />
MINAG-ANA-DCPRH-AGUAS SUPERFICIALES Pág.131
<strong>Estudio</strong> <strong>Hidrológico</strong> <strong>de</strong> <strong>la</strong>s <strong>Cuenca</strong>s Huancané y Suches 2010<br />
El Servicio Nacional <strong>de</strong> Meteorología e Hidrología – SENAMHI, mi<strong>de</strong> <strong>la</strong> velocidad <strong>de</strong>l<br />
viento con el aparato meteorológico “Anemómetro” y <strong>la</strong> dirección <strong>de</strong>l viento con <strong>la</strong><br />
“Veleta”.<br />
A.- Velocidad <strong>de</strong>l viento<br />
Para <strong>la</strong>s cuencas en estudio, once (11) estaciones meteorológicas disponen <strong>de</strong>l registro<br />
histórico <strong>de</strong> <strong>la</strong> velocidad <strong>de</strong>l viento y <strong>la</strong>s cinco (5) estaciones carecen <strong>de</strong> ésta información.<br />
Debido a <strong>la</strong> carencia <strong>de</strong> estadísticas <strong>de</strong> <strong>la</strong> velocidad <strong>de</strong>l viento, para <strong>la</strong>s estaciones Suches,<br />
Conima, Puerto Acosta, Escoma y Chahuaya, se han estimado mediante el análisis <strong>de</strong><br />
regresión lineal con los datos <strong>de</strong> <strong>la</strong>s estaciones con registros existentes, corre<strong>la</strong>cionando <strong>la</strong><br />
altitud y <strong>la</strong> velocidad <strong>de</strong>l viento.<br />
Ecuación <strong>de</strong> re<strong>la</strong>ción: Vv = a + bH, don<strong>de</strong> H es <strong>la</strong> altitud en msnm.<br />
En <strong>la</strong> Figura Nº 4.22 se muestra los resultados <strong>de</strong>l análisis <strong>de</strong> regresión lineal, don<strong>de</strong> se ha<br />
corre<strong>la</strong>cionado <strong>la</strong> velocidad <strong>de</strong>l viento con <strong>la</strong> altitud. Los resultados <strong>de</strong>l análisis entre <strong>la</strong>s<br />
variables analizadas, dan una corre<strong>la</strong>ción regu<strong>la</strong>r.<br />
Velocidad <strong>de</strong>l viento (m/s)<br />
Velocidad <strong>de</strong>l viento (m/s)<br />
Velocidad <strong>de</strong>l viento (m/s)<br />
8<br />
6<br />
4<br />
2<br />
0<br />
8<br />
6<br />
4<br />
2<br />
0<br />
8<br />
6<br />
4<br />
2<br />
0<br />
Figura Nº 4.22 Gráfico <strong>de</strong> análisis <strong>de</strong> regresión lineal <strong>de</strong> velocidad <strong>de</strong>l viento versus altitud<br />
Enero<br />
y = -0.00067x + 5.28521<br />
R² = 0.05945<br />
3500 4000 4500 5000<br />
Altitud (msnm)<br />
Abril<br />
y = -0.00022x + 3.34322<br />
R² = 0.00897<br />
3500 4000 4500 5000<br />
Altitud (msnm)<br />
Julio<br />
y = -0.00098x + 6.54532<br />
R² = 0.06542<br />
3500 4000 4500 5000<br />
Altitud (msnm)<br />
Velocidad <strong>de</strong>l viento (m/s)<br />
Velocidad <strong>de</strong>l viento (m/s)<br />
Velocidad <strong>de</strong>l viento (m/s)<br />
8<br />
6<br />
4<br />
2<br />
0<br />
8<br />
6<br />
4<br />
2<br />
0<br />
8<br />
6<br />
4<br />
2<br />
0<br />
Febrero<br />
y = -0.00020x + 3.45783<br />
R² = 0.00378<br />
3500 4000 4500 5000<br />
Altitud (msnm)<br />
Mayo<br />
y = -0.00046x + 4.33125<br />
R² = 0.02213<br />
3500 4000 4500 5000<br />
Altitud (msnm)<br />
Agosto<br />
y = -0.00038x + 4.58967<br />
R² = 0.00928<br />
3500 4000 4500 5000<br />
Altitud (msnm)<br />
y = -0.00053x + 4.83311<br />
R² = 0.04004<br />
MINAG-ANA-DCPRH-AGUAS SUPERFICIALES Pág.132<br />
Velocidad <strong>de</strong>l viento (m/s)<br />
Velocidad <strong>de</strong>l viento (m/s)<br />
Velocidad <strong>de</strong>l viento (m/s)<br />
8<br />
6<br />
4<br />
2<br />
0<br />
8<br />
6<br />
4<br />
2<br />
0<br />
8<br />
6<br />
4<br />
2<br />
0<br />
Marzo<br />
3500 4000 4500 5000<br />
Altitud (msnm)<br />
Junio<br />
y = -0.00078x + 5.61183<br />
R² = 0.07499<br />
3500 4000 4500 5000<br />
Altitud (msnm)<br />
Setiembre<br />
y = -0.00051x + 5.17627<br />
R² = 0.01648<br />
3500 4000 4500 5000<br />
Altitud (msnm)
Velocidad <strong>de</strong>l viento (m/s)<br />
<strong>Estudio</strong> <strong>Hidrológico</strong> <strong>de</strong> <strong>la</strong>s <strong>Cuenca</strong>s Huancané y Suches 2010<br />
8<br />
6<br />
4<br />
2<br />
0<br />
Octubre<br />
y = -0.00118x + 7.76521<br />
R² = 0.14283<br />
3500 4000 4500 5000<br />
Altitud (msnm)<br />
Velocidad <strong>de</strong>l viento (m/s)<br />
8<br />
6<br />
4<br />
2<br />
0<br />
Noviembre<br />
y = -0.00103x + 7.06285<br />
R² = 0.10731<br />
3500 4000 4500 5000<br />
Altitud (msnm)<br />
y = -0.00114x + 7.37194<br />
R² = 0.16435<br />
MINAG-ANA-DCPRH-AGUAS SUPERFICIALES Pág.133<br />
Velocidad <strong>de</strong>l viento (m/s)<br />
8<br />
6<br />
4<br />
2<br />
0<br />
Diciembre<br />
3500 4000 4500 5000<br />
Altitud (msnm)<br />
En el Cuadro Nº 4.15 se presenta los parámetros <strong>de</strong> <strong>la</strong> ecuación <strong>de</strong> regresión lineal, <strong>de</strong> <strong>la</strong><br />
re<strong>la</strong>ción <strong>de</strong> <strong>la</strong> velocidad <strong>de</strong>l viento versus altitud y los coeficientes <strong>de</strong> corre<strong>la</strong>ción<br />
correspondiente.<br />
Coeficiente<br />
Cuadro Nº 4.15 Parámetros <strong>de</strong> <strong>la</strong> ecuación <strong>de</strong> regresión lineal (velocidad <strong>de</strong>l viento-altitud)<br />
Ene Feb Mar Abr May Jun Jul Ago Sep Oct Nov Dic<br />
a 5.28521 3.45783 4.83311 3.34322 4.33125 5.61183 6.54532 4.58967 5.17627 7.76521 7.06285 7.37194<br />
b -0.00067 -0.00020 -0.00053 -0.00022 -0.00046 -0.00078 -0.00098 -0.00038 -0.00051 -0.00118 -0.00103 -0.00114<br />
R (%) 24.38 6.15 20.01 9.47 14.88 27.38 25.58 9.63 12.84 37.79 32.76 40.54<br />
En <strong>la</strong> Figura Nº 4.23 se aprecia que <strong>la</strong>s velocida<strong>de</strong>s <strong>de</strong>l viento, tienen simi<strong>la</strong>r ten<strong>de</strong>ncia en<br />
todas <strong>la</strong>s estaciones meteorológicas.<br />
En <strong>la</strong> cuenca Huancané, <strong>la</strong> mayor velocidad <strong>de</strong>l viento se presenta en <strong>la</strong> zona <strong>de</strong> <strong>la</strong> estación<br />
Muñani con 3.8 m/s (viento mo<strong>de</strong>rado a fuerte) y <strong>la</strong> menor en <strong>la</strong> zona <strong>de</strong> <strong>la</strong> estación<br />
Huaraya-Moho <strong>de</strong> 1.8 m/s (viento suave a mo<strong>de</strong>rado). Mientras en <strong>la</strong> cuenca Suches, <strong>la</strong><br />
mayor velocidad <strong>de</strong>l viento se presenta en <strong>la</strong> zona <strong>de</strong> <strong>la</strong> estación Cojata con 3.3 m/s (viento<br />
mo<strong>de</strong>rado a fuerte) y <strong>la</strong> menor en <strong>la</strong> zona <strong>de</strong> <strong>la</strong> estación Suches con 2.3 m/s (viento suave a<br />
mo<strong>de</strong>rado). Ver Cuadro Nº 4.16 y <strong>la</strong> Figura Nº 4.24.<br />
Estación<br />
Cuadro Nº 4.16 Velocidad <strong>de</strong>l viento media mensual (m/s) – Promedio multimensual<br />
Estaciones <strong>de</strong> <strong>la</strong>s cuencas Huancané, Suches y cuencas vecinas<br />
Altitud<br />
(msnm)<br />
Mes<br />
Ene Feb Mar Abr May Jun Jul Ago Sep Oct Nov Dic<br />
Huancané 3840.0 3.0 3.0 2.8 2.6 2.4 2.2 2.6 3.1 3.7 3.8 3.6 3.4 3.0<br />
Putina 3856.0 2.6 3.0 3.3 2.4 2.3 3.2 1.5 2.7 1.8 3.2 2.6 3.3 2.7<br />
Muñani 3948.0 3.4 3.3 3.3 3.1 3.6 3.4 4.3 4.6 4.6 4.0 4.2 3.5 3.8<br />
Huaraya Moho 3832.0 1.7 1.7 1.8 1.7 1.5 1.4 1.6 1.9 2.1 2.1 2.0 1.8 1.8<br />
Cojata 4327.0 3.2 4.3 3.4 3.3 3.0 2.4 1.9 4.5 4.1 2.9 3.1 3.1 3.3<br />
Suches 4655.0 2.2 2.5 2.4 2.3 2.2 2.0 2.0 2.8 2.8 2.3 2.3 2.1 2.3<br />
Ananea 4640.0 2.0 1.9 2.0 2.0 2.0 2.1 2.3 2.1 2.2 2.3 2.1 1.9 2.1<br />
Crucero 4130.0 1.3 1.3 1.6 1.4 1.2 1.2 1.4 1.5 1.8 1.7 1.7 1.6 1.5<br />
Progreso 3940.0 2.6 2.8 3.6 3.0 3.7 3.3 4.0 4.2 4.5 4.3 3.9 3.4 3.6<br />
Azángaro 3848.0 2.3 2.3 2.2 2.1 2.1 2.3 2.6 2.7 2.8 2.7 2.6 2.5 2.4<br />
Arapa 3830.0 3.7 3.2 3.1 3.0 3.2 3.2 3.5 3.4 3.7 3.6 3.7 3.6 3.4<br />
Taraco 3820.0 2.7 2.6 2.6 2.5 2.6 2.7 3.2 3.1 3.0 2.9 2.8 2.8 2.8<br />
Conima 3860.0 2.7 2.7 2.8 2.5 2.6 2.6 2.8 3.1 3.2 3.2 3.1 3.0 2.9<br />
Puerto Acosta 3835.0 2.7 2.7 2.8 2.5 2.6 2.6 2.8 3.1 3.2 3.2 3.1 3.0 2.9<br />
Escoma 3828.0 2.7 2.7 2.8 2.5 2.6 2.6 2.8 3.1 3.2 3.2 3.1 3.0 2.9<br />
Chahuaya 4500.0 2.3 2.6 2.4 2.4 2.3 2.1 2.1 2.9 2.9 2.5 2.4 2.2 2.4<br />
Mes<br />
Prom<br />
Anual
<strong>Estudio</strong> <strong>Hidrológico</strong> <strong>de</strong> <strong>la</strong>s <strong>Cuenca</strong>s Huancané y Suches 2010<br />
Velocidad <strong>de</strong>l viento (m/s)<br />
Velocidad <strong>de</strong>l viento (m/s)<br />
Figura Nº 4.23 Variación mensual <strong>de</strong> <strong>la</strong> velocidad <strong>de</strong>l viento (m/s) – Promedio multimensual<br />
Estaciones <strong>de</strong> <strong>la</strong>s cuencas Huancané, Suches y cuencas vecinas<br />
6.0<br />
5.0<br />
4.0<br />
3.0<br />
2.0<br />
1.0<br />
0.0<br />
6.0<br />
5.0<br />
4.0<br />
3.0<br />
2.0<br />
1.0<br />
0.0<br />
Ene Feb Mar Abr May Jun Jul Ago Sep Oct Nov Dic<br />
Tiempo (mes)<br />
Figura Nº 4.24 Variación anual <strong>de</strong> <strong>la</strong> velocidad <strong>de</strong>l viento (m/s) – Promedio multianual<br />
Estaciones <strong>de</strong> <strong>la</strong>s cuencas Huancané, Suches y cuencas vecinas<br />
Huancané<br />
3.0<br />
Putina<br />
2.7<br />
Muñani<br />
3.8<br />
1.8<br />
Huaraya<br />
Moho<br />
Cojata<br />
3.3<br />
Suches<br />
2.3<br />
Ananea<br />
2.1<br />
Huancané<br />
MINAG-ANA-DCPRH-AGUAS SUPERFICIALES Pág.134<br />
Crucero<br />
1.5<br />
3.6<br />
2.4<br />
Estación Meteorológica<br />
Progreso<br />
Azángaro<br />
Arapa<br />
3.4<br />
Taraco<br />
2.8<br />
Conima<br />
2.9 2.9 2.9<br />
Puerto<br />
Acosta<br />
Escoma<br />
Putina<br />
Muñani<br />
Huaraya Moho<br />
Cojata<br />
Suches<br />
Ananea<br />
Crucero<br />
Progreso<br />
Azángaro<br />
Arapa<br />
Taraco<br />
Conima<br />
Puerto Acosta<br />
Escoma<br />
Chahuaya<br />
Chahuaya<br />
2.4
<strong>Estudio</strong> <strong>Hidrológico</strong> <strong>de</strong> <strong>la</strong>s <strong>Cuenca</strong>s Huancané y Suches 2010<br />
B.- Dirección <strong>de</strong>l viento<br />
El registro <strong>de</strong> <strong>la</strong> información <strong>de</strong> <strong>la</strong> dirección <strong>de</strong>l viento, en <strong>la</strong>s cuencas <strong>de</strong> estudio, sólo<br />
existen en seis (6) estaciones meteorológicas, tales como son Huancané, Muñani, Ananea,<br />
Azángaro, Arapa y Taraco.<br />
Del registro mensual <strong>de</strong> <strong>la</strong> dirección <strong>de</strong>l viento, <strong>de</strong> <strong>la</strong>s estaciones meteorológicas ubicadas<br />
<strong>de</strong>ntro y alre<strong>de</strong>dor <strong>de</strong> <strong>la</strong>s cuencas Huancané y Suches, se han obtenido <strong>la</strong> dirección <strong>de</strong>l<br />
viento predominante a nivel mensual y anual, ver el Cuadro Nº 4.17.<br />
La dirección predominante <strong>de</strong>l viento en <strong>la</strong>s estaciones Huancané es <strong>de</strong> su<strong>de</strong>ste (SE),<br />
Muñani es <strong>de</strong> su<strong>de</strong>ste (SE) y sudoeste (SW), Ananea por el norte (N), Azángaro es por el<br />
noroeste (NW) y su<strong>de</strong>ste (SE), Arapa es por el noreste (NE ), y en <strong>la</strong> estación Taraco <strong>la</strong><br />
dirección <strong>de</strong>l viento es por el este (E). Ver Figura Nº 4.25.<br />
Las rosas <strong>de</strong>l viento se muestran en <strong>la</strong> Figura Nº 4.25, don<strong>de</strong> se aprecia <strong>la</strong> dirección<br />
predominante <strong>de</strong>l viento <strong>de</strong> <strong>la</strong>s estaciones consi<strong>de</strong>radas en el presente estudio.<br />
Cuadro Nº 4.17 Dirección <strong>de</strong>l viento predominante mensual y anual - Estaciones <strong>de</strong> <strong>la</strong> cuenca Huancané y<br />
cuencas vecinas<br />
Mes<br />
Altitud<br />
Estación Anual<br />
(msnm)<br />
Ene Feb Mar Abr May Jun Jul Ago Sep Oct Nov Dic<br />
Huancané 3840 SE SE SE SE SE SE W E E SE SE SE SE<br />
Muñani 3948 NW SE SE SW SW SE SW SW SW SW SE NW SW<br />
Ananea 4640 N N N N N NW NW N NW N N N N<br />
Azángaro 3848 S S SE SE NW NW NW NW NW NW SE SE NW<br />
Arapa 3830 NE NE NE NE NE NE NE NE NE NE NE NE NE<br />
Taraco 3820 E E E E E W W E E E E E E<br />
Cuadro Nº 4.18 Registro anual <strong>de</strong> <strong>la</strong> dirección <strong>de</strong>l viento predominante - <strong>Cuenca</strong> Huancané y cuencas<br />
vecinas<br />
Dirección Huancané Muñani<br />
Estación Meteorológica<br />
Ananea Azángaro Arapa Taraco<br />
n (%) n (%) n (%) n (%) n (%) n (%)<br />
N 0 0.0 16 14.8 40 51.9 3 2.8 1 0.9 0 0.0<br />
NNE 0 0.0 0 0.0 1 1.3 0 0.0 0 0.0 0 0.0<br />
NE 0 0.0 8 7.4 11 14.3 7 6.5 97 89.8 0 0.0<br />
ENE 0 0.0 0 0.0 0 0.0 0 0.0 2 1.9 0 0.0<br />
E 32 29.6 0 0.0 0 0.0 2 1.9 1 0.9 76 70.4<br />
ESE 0 0.0 0 0.0 0 0.0 1 0.9 0 0.0 0 0.0<br />
SE 65 60.2 31 28.7 0 0.0 35 32.4 0 0.0 0 0.0<br />
SSE 1 0.9 0 0.0 0 0.0 3 2.8 0 0.0 0 0.0<br />
S 0 0.0 2 1.9 0 0.0 15 13.9 0 0.0 3 2.8<br />
SSW 0 0.0 0 0.0 0 0.0 0 0.0 0 0.0 0 0.0<br />
SW 0 0.0 33 30.6 0 0.0 3 2.8 0 0.0 0 0.0<br />
WSW 0 0.0 0 0.0 0 0.0 0 0.0 0 0.0 0 0.0<br />
W 10 9.3 2 1.9 0 0.0 0 0.0 0 0.0 29 26.9<br />
WNW 0 0.0 0 0.0 0 0.0 0 0.0 0 0.0 0 0.0<br />
NW 0 0.0 16 14.8 22 28.6 39 36.1 6 5.6 0 0.0<br />
NNW 0 0.0 0 0.0 3 3.9 0 0.0 1 0.9 0 0.0<br />
C 0 0.0 0 0.0 0 0.0 0 0.0 0 0.0 0 0.0<br />
Total 108 100.0 108 100.0 77 100.0 108 100.0 108 100.0 108 100.0<br />
MINAG-ANA-DCPRH-AGUAS SUPERFICIALES Pág.135
<strong>Estudio</strong> <strong>Hidrológico</strong> <strong>de</strong> <strong>la</strong>s <strong>Cuenca</strong>s Huancané y Suches 2010<br />
Figura Nº 4.25 Rosas <strong>de</strong> <strong>la</strong> dirección <strong>de</strong>l viento predominante (%) - <strong>Cuenca</strong> Huancané y cuencas vecinas<br />
WNW<br />
W<br />
WSW<br />
WNW<br />
W<br />
WSW<br />
WNW<br />
W<br />
WSW<br />
NW<br />
SW<br />
NW<br />
SW<br />
NW<br />
SW<br />
NNW<br />
SSW<br />
NNW<br />
28.6%<br />
SSW<br />
NNW<br />
SSW<br />
Estación Huancané<br />
60<br />
45<br />
30<br />
15<br />
9.3% 0<br />
N<br />
75<br />
S<br />
Estación Ananea<br />
N<br />
60<br />
45<br />
30<br />
15<br />
0<br />
S<br />
51.9%<br />
Estación Arapa<br />
N<br />
90<br />
75<br />
60<br />
45<br />
30<br />
15<br />
0<br />
S<br />
14.3%<br />
NNE<br />
29.6%<br />
SSE<br />
NNE<br />
SSE<br />
NNE<br />
SSE<br />
60.2%<br />
NE<br />
SE<br />
NE<br />
SE<br />
NE<br />
89.8%<br />
SE<br />
ENE<br />
E<br />
ESE<br />
ENE<br />
E<br />
ESE<br />
ENE<br />
E<br />
ESE<br />
14.8%<br />
15<br />
14.8%<br />
7.4%<br />
MINAG-ANA-DCPRH-AGUAS SUPERFICIALES Pág.136<br />
WNW<br />
W<br />
WSW<br />
WNW<br />
W<br />
WSW<br />
WNW<br />
W<br />
WSW<br />
NW<br />
SW<br />
NW<br />
SW<br />
NW<br />
SW<br />
36.1%<br />
NNW<br />
30.6%<br />
SSW<br />
NNW<br />
SSW<br />
NNW<br />
26.9%<br />
SSW<br />
Estación Muñani<br />
N<br />
45<br />
30<br />
0<br />
30<br />
15<br />
0<br />
S<br />
Estación Azángaro<br />
N<br />
45<br />
13.9%<br />
S<br />
6.5%<br />
Estación Taraco<br />
N<br />
75<br />
60<br />
45<br />
30<br />
15<br />
0<br />
S<br />
NNE<br />
SSE<br />
NNE<br />
SSE<br />
NNE<br />
SSE<br />
28.7%<br />
32.4%<br />
NE<br />
SE<br />
NE<br />
SE<br />
NE<br />
ENE<br />
E<br />
ESE<br />
ENE<br />
E<br />
ESE<br />
ENE<br />
E<br />
70.4%<br />
Los registros históricos completados <strong>de</strong> <strong>la</strong> información climatológica <strong>de</strong> <strong>la</strong>s estaciones<br />
meteorológicas consi<strong>de</strong>radas en el presente estudio, se muestran en el Anexo 1.<br />
SE<br />
ESE
<strong>Estudio</strong> <strong>Hidrológico</strong> <strong>de</strong> <strong>la</strong>s <strong>Cuenca</strong>s Huancané y Suches 2010<br />
4.1.7 Evapotranspiración potencial<br />
4.1.7.1 Definición<br />
La evapotranspiración (ET) es <strong>la</strong> combinación <strong>de</strong> dos procesos: evaporación y<br />
transpiración. El término <strong>de</strong> evapotranspiración se utiliza para englobar tanto el proceso<br />
físico <strong>de</strong> pérdida <strong>de</strong> agua por evaporación como el proceso <strong>de</strong> evaporación <strong>de</strong>l agua<br />
absorbida por <strong>la</strong>s p<strong>la</strong>ntas (transpiración).<br />
La evaporación, es el proceso físico mediante el cual el agua se convierte a su forma<br />
gaseosa. La evaporación <strong>de</strong>l agua hacia <strong>la</strong> atmósfera ocurre <strong>de</strong>s<strong>de</strong> <strong>la</strong> superficie <strong>de</strong> <strong>río</strong>s,<br />
<strong>la</strong>gos, suelos y vegetación.<br />
La transpiración, es el proceso mediante el cual el agua fluye <strong>de</strong>s<strong>de</strong> el suelo hacia <strong>la</strong><br />
atmósfera a través <strong>de</strong>l tejido <strong>de</strong> <strong>la</strong> p<strong>la</strong>nta. La transpiración es básicamente un proceso <strong>de</strong><br />
evaporación. El agua se evapora <strong>de</strong>ntro <strong>de</strong> <strong>la</strong>s hojas y el vapor resultante se difun<strong>de</strong> hacia<br />
el exterior a través <strong>de</strong> <strong>la</strong>s estomas.<br />
La evaporación, <strong>la</strong> transpiración y <strong>la</strong> evapotranspiración son importantes tanto para estimar<br />
los requisitos <strong>de</strong> riego y al programar éste. Para <strong>de</strong>terminar los requisitos <strong>de</strong> riego es<br />
necesario estimar <strong>la</strong> ET por medidas directamente en el campo o utilizando datos<br />
meteorológicos. Las medidas directamente en el campo son muy costosas y se utilizan<br />
mayormente para calibrar los métodos que estiman <strong>la</strong> ET utilizando datos <strong>de</strong> clima.<br />
La evapotranspiración potencial (ETP), es <strong>la</strong> pérdida <strong>de</strong> agua <strong>de</strong> una superficie cubierta<br />
completamente <strong>de</strong> vegetación. La evapotranspiración (ET) <strong>de</strong> un cultivo es <strong>de</strong>terminada<br />
por los procesos meteorológicos. El cierre <strong>de</strong> <strong>la</strong>s estomas y <strong>la</strong> reducción en transpiración<br />
usualmente son importantes sólo bajo condiciones <strong>de</strong> escasez <strong>de</strong> agua o condiciones <strong>de</strong><br />
estrés <strong>de</strong> <strong>la</strong> p<strong>la</strong>nta. La evapotranspiración <strong>de</strong>pen<strong>de</strong>rá <strong>de</strong> tres factores: 1) vegetación, 2)<br />
disponibilidad <strong>de</strong> agua en el suelo y 3) comportamiento <strong>de</strong> <strong>la</strong>s estomas.<br />
4.1.7.2 Métodos <strong>de</strong> cálculo <strong>de</strong> evapotranspiración potencial<br />
En <strong>la</strong> actualidad existen numerosos métodos indirectos para <strong>la</strong> estimación <strong>de</strong> <strong>la</strong> ETP, se<br />
basan principalmente en <strong>la</strong> aplicación <strong>de</strong> ecuaciones matemáticas, <strong>la</strong>s cuales emplean datos<br />
<strong>de</strong> entrada como <strong>la</strong> temperatura, <strong>la</strong> radiación, <strong>la</strong> humedad re<strong>la</strong>tiva, y otros elementos<br />
climáticos que le permiten a <strong>la</strong>s ecuaciones ciertos grados <strong>de</strong> ajuste y exactitud. ¿Cuál<br />
emplear?, Se recomienda emplear <strong>la</strong> que mayor número <strong>de</strong> elementos climáticos incluya<br />
para su cálculo, pero existe zonas don<strong>de</strong> no se cuenta con dicha información, entonces se<br />
trabaja con <strong>la</strong> que se ajusta a <strong>la</strong>s condiciones, o <strong>la</strong> cantidad <strong>de</strong> información disponible.<br />
La precisión y confiabilidad <strong>de</strong> los métodos <strong>de</strong> estimación <strong>de</strong> evapotranspiración potencial,<br />
varía <strong>de</strong> unos a otros, muchos sólo provee una aproximación. Cada técnica se ha<br />
<strong>de</strong>sarrol<strong>la</strong>do con los datos <strong>de</strong> clima disponibles para estimar<strong>la</strong>s.<br />
Muchas <strong>de</strong> <strong>la</strong>s investigaciones han dado lugar a modificaciones <strong>de</strong> <strong>la</strong>s ecuaciones ya<br />
establecidas. Así encontramos modificaciones en <strong>la</strong>s fórmu<strong>la</strong>s <strong>de</strong> B<strong>la</strong>ney-Criddle,<br />
Hargreaves, Ban<strong>de</strong>ja <strong>de</strong> evaporación, etc. Allen [1986] trabajó en <strong>la</strong> evaluación <strong>de</strong> trece<br />
MINAG-ANA-DCPRH-AGUAS SUPERFICIALES Pág.137
<strong>Estudio</strong> <strong>Hidrológico</strong> <strong>de</strong> <strong>la</strong>s <strong>Cuenca</strong>s Huancané y Suches 2010<br />
variaciones <strong>de</strong> <strong>la</strong> ecuación <strong>de</strong> Penman, encontrando como más precisa <strong>la</strong> fórmu<strong>la</strong> <strong>de</strong><br />
Penman-Monteith. Actualmente se recomiendan <strong>la</strong>s ecuaciones modificadas por <strong>la</strong> FAO y<br />
el SCS como <strong>la</strong>s más confiables.<br />
Todas <strong>la</strong>s investigaciones coinci<strong>de</strong>n al seña<strong>la</strong>r <strong>la</strong>s ecuaciones <strong>de</strong> Penman, Ban<strong>de</strong>ja ó<br />
Tanque <strong>de</strong> Evaporación C<strong>la</strong>se A, B<strong>la</strong>ney-Criddle y Hargreaves-Samani, como <strong>la</strong>s fórmu<strong>la</strong>s<br />
más confiables. En éstas, con una calibración local, se logra bastante precisión.<br />
Cada investigador tiene su fórmu<strong>la</strong> preferida que le ha dado buenos resultados. Así<br />
Hargreaves y Samani [1974] presentan su fórmu<strong>la</strong> como el método más simple y práctico y<br />
llegan a <strong>de</strong>cir que “no existe evi<strong>de</strong>ncia <strong>de</strong> que haya otro método superior”.<br />
Cada investigador tiene un or<strong>de</strong>n <strong>de</strong> preferencia que pue<strong>de</strong> ser semejante o diferente a otro,<br />
pero todas <strong>la</strong>s fórmu<strong>la</strong>s, <strong>de</strong>pendiendo <strong>de</strong>l lugar en que se evalúen pue<strong>de</strong> resultar en el<br />
primer o último lugar.<br />
En el presente estudio, para el cálculo <strong>de</strong> <strong>la</strong> evapotranspiración potencial (ETP) en función<br />
<strong>de</strong> <strong>la</strong> información climatológica disponible, se ha empleado <strong>la</strong>s siguientes fórmu<strong>la</strong>s.<br />
A.- Método <strong>de</strong> Hargreaves<br />
- Hargreaves<br />
. Por Temperatura<br />
. Por Radiación<br />
- Hargreaves Modificado<br />
- Thornthwaite<br />
- Serruto<br />
- Penman Monteith - FAO<br />
- Tanque <strong>de</strong> Evaporación C<strong>la</strong>se A<br />
a) Por Temperatura<br />
Don<strong>de</strong>:<br />
ETP = Evapotranspiración potencial (mm/mes).<br />
MF = Factor mensual <strong>de</strong> <strong>la</strong>titud (Tab<strong>la</strong> Nº 4.2).<br />
TMF = Temperatura media mensual (ºF).<br />
CH = Factor <strong>de</strong> corrección por <strong>la</strong> humedad re<strong>la</strong>tiva.<br />
CH = , para HR>64%<br />
CH = 1, para HR
<strong>Estudio</strong> <strong>Hidrológico</strong> <strong>de</strong> <strong>la</strong>s <strong>Cuenca</strong>s Huancané y Suches 2010<br />
Latitud<br />
Sur<br />
b) Por Radiación<br />
Don<strong>de</strong>:<br />
ETP = Evapotranspiración potencial (mm/mes).<br />
0.0075 = Constante <strong>de</strong> interre<strong>la</strong>ción entre ETP y radiación.<br />
RSM = Radiación so<strong>la</strong>r equivalente en mm <strong>de</strong> evaporación mensual<br />
(mm/mes).<br />
RMM = Radiación extraterrestre equivalente en mm <strong>de</strong> evaporación<br />
mensual (mm/mes).<br />
Ra = Radiación extraterrestre equivalente en mm <strong>de</strong> evaporación<br />
diaria (mm/día). Se obtiene <strong>de</strong> acuerdo a <strong>la</strong> <strong>la</strong>titud <strong>de</strong> <strong>la</strong> zona<br />
(Tab<strong>la</strong> Nº 4.3).<br />
DM = Número <strong>de</strong> días <strong>de</strong>l mes.<br />
S = Porcentaje <strong>de</strong> horas <strong>de</strong> inso<strong>la</strong>ción (%):<br />
n = Horas <strong>de</strong> sol media diaria <strong>de</strong> <strong>la</strong> zona.<br />
N = Horas <strong>de</strong> sol máxima media diaria probable según <strong>la</strong> <strong>la</strong>titud<br />
(Tab<strong>la</strong> Nº 4.4).<br />
TMF = Temperatura media mensual (ºF).<br />
FA = Factor <strong>de</strong> corrección por altura.<br />
H = Altitud <strong>de</strong> <strong>la</strong> zona en estudio (msnm).<br />
Tab<strong>la</strong> Nº 4.2 Factor <strong>de</strong> Evapotranspiración Potencial (MF) en mm por mes<br />
MESES<br />
ENE FEB MAR ABR MAY JUN JUL AGO SET OCT NOV DIC<br />
14 2.680 2.317 2.340 1.959 1.733 1.536 1.648 1.895 2.144 2.490 2.566 2.706<br />
15 2.707 2.328 2.334 1.937 1.700 1.500 1.612 1.867 2.131 2.496 2.588 2.738<br />
16 2.734 2.339 2.317 1.914 1.666 1.464 1.576 1.838 2.117 2.500 2.610 2.769<br />
17 2.760 2.348 2.319 1.891 1.632 1.427 1.540 1.809 2.103 2.504 2.631 2.799<br />
18 2.785 2.359 2.311 1.867 1.598 1.391 1.504 1.780 2.088 2.508 2.651 2.830<br />
Fuente: Absalón Vásquez Vil<strong>la</strong>nueva "Manejo <strong>de</strong> <strong>Cuenca</strong>s Altoandinas" Tomo 1, Lima - Péru, 2000<br />
Tab<strong>la</strong> Nº 4.3 La Radiación Extraterrestre Ra, expresada en equivalentes <strong>de</strong> evaporación en mm/día<br />
Latitud<br />
Sur<br />
MESES<br />
ENE FEB MAR ABR MAY JUN JUL AGO SET OCT NOV DIC<br />
14 16.70 16.40 15.30 13.70 12.10 11.20 11.60 12.90 14.50 15.80 16.50 16.60<br />
16 16.90 16.40 15.20 13.50 11.70 10.80 11.20 12.60 14.30 15.80 16.70 16.80<br />
18 17.10 16.50 15.10 13.20 11.40 10.40 10.80 12.30 14.10 15.80 16.80 17.10<br />
20 17.30 16.50 15.00 13.00 11.00 10.00 10.40 12.00 13.90 15.80 17.00 17.40<br />
Fuente: ESTUDIO FAO: RIEGO Y DRENAJE N° 24 "Las necesida<strong>de</strong>s <strong>de</strong> agua <strong>de</strong> los cultivos" Pág. 24.<br />
MINAG-ANA-DCPRH-AGUAS SUPERFICIALES Pág.139
<strong>Estudio</strong> <strong>Hidrológico</strong> <strong>de</strong> <strong>la</strong>s <strong>Cuenca</strong>s Huancané y Suches 2010<br />
Tab<strong>la</strong> Nº 4.4 Número <strong>de</strong> horas <strong>de</strong> sol máxima media diaria probable para diferentes meses y <strong>la</strong>titud Sur (N)<br />
Latitud<br />
Sur<br />
MESES<br />
ENE FEB MAR ABR MAY JUN JUL AGO SET OCT NOV DIC<br />
10 12.60 12.40 12.10 11.80 11.60 11.50 11.60 11.80 12.00 12.30 12.60 12.70<br />
15 12.90 12.60 12.20 11.80 11.40 11.20 11.30 11.60 12.00 12.50 12.80 13.00<br />
20 13.20 12.80 12.30 11.70 11.20 10.90 11.00 11.50 12.00 12.60 13.10 13.30<br />
25 13.50 13.00 12.30 11.60 10.90 10.60 10.70 11.30 12.00 12.70 13.30 13.70<br />
Fuente: ESTUDIO FAO: RIEGO Y DRENAJE N° 24 "Las necesida<strong>de</strong>s <strong>de</strong> agua <strong>de</strong> los cultivos" Pág. 25.<br />
B.- Método <strong>de</strong> Hargreaves Modificado (Linacre, E.T., 1977).<br />
Don<strong>de</strong>:<br />
ETP = Evapotranspiración potencial (mm/día).<br />
Ra = Radiación extraterrestre equivalente en mm <strong>de</strong> evaporación diaria<br />
(mm/día). Se obtiene <strong>de</strong> acuerdo a <strong>la</strong> <strong>la</strong>titud <strong>de</strong> <strong>la</strong> zona (Tab<strong>la</strong> Nº 4.3).<br />
T = Temperatura media mensual (ºC).<br />
TD = Temperatura máxima menos temperatura mínima (ºC).<br />
Esta ecuación sólo requiere datos <strong>de</strong> temperatura media, máxima y mínima, los<br />
cuales suelen estar generalmente disponibles. A<strong>de</strong>más, esta fórmu<strong>la</strong> ha probado ser<br />
precisa y confiable.<br />
C.- Método <strong>de</strong> Thornthwaite<br />
Fue <strong>de</strong>sarrol<strong>la</strong>do en los Estados Unidos, en experimentos realizados entre <strong>la</strong>s <strong>la</strong>titu<strong>de</strong>s 29º<br />
a 43º Norte, en tanques <strong>de</strong> 4 m 2 y nivel freático constante a medio metro <strong>de</strong> profundidad.<br />
Se pue<strong>de</strong> aplicar con re<strong>la</strong>tiva confianza en regiones <strong>de</strong> clima simi<strong>la</strong>r, es <strong>de</strong>cir regiones<br />
húmedas. Para su cálculo se requieren datos <strong>de</strong> temperaturas medias mensuales.<br />
El procedimiento <strong>de</strong> cálculo <strong>de</strong> <strong>la</strong> evapotranspiración mensual, por este método es <strong>la</strong><br />
siguiente:<br />
1) Calcu<strong>la</strong>r <strong>la</strong> evapotranspiración potencial mensual ETP‟, en mm por mes <strong>de</strong> 30 días<br />
y 12 horas <strong>de</strong> duración.<br />
Don<strong>de</strong>:<br />
ETP‟ = Evapotranspiración potencial mensual (mm), por mes <strong>de</strong> 30 días y 12<br />
horas <strong>de</strong> duración.<br />
T = Temperatura media mensual (ºC).<br />
I = Índice térmico anual.<br />
i = Índice térmico mensual.<br />
a = Exponente que varía con el índice anual <strong>de</strong> calor <strong>de</strong> <strong>la</strong> localidad.<br />
MINAG-ANA-DCPRH-AGUAS SUPERFICIALES Pág.140
<strong>Estudio</strong> <strong>Hidrológico</strong> <strong>de</strong> <strong>la</strong>s <strong>Cuenca</strong>s Huancané y Suches 2010<br />
2) Corregir el valor calcu<strong>la</strong>do <strong>de</strong> ETP‟, <strong>de</strong> acuerdo el número real <strong>de</strong> días <strong>de</strong>l mes<br />
consi<strong>de</strong>rado y a <strong>la</strong> <strong>la</strong>titud <strong>de</strong> <strong>la</strong> localidad que <strong>de</strong>termina <strong>la</strong>s horas <strong>de</strong> sol, cuyos<br />
valores se obtienen <strong>de</strong> <strong>la</strong> Tab<strong>la</strong> Nº 4.5.<br />
Latitud<br />
Sur<br />
Don<strong>de</strong>:<br />
ETP = Evapotranspiración potencial mensual corregida (mm).<br />
f = Factor <strong>de</strong> corrección.<br />
ETP‟ = Evapotranspiración potencial mensual sin corregir (mm).<br />
Tab<strong>la</strong> Nº 4.5 Factor <strong>de</strong> corrección f, por duración media <strong>de</strong> <strong>la</strong>s horas <strong>de</strong> sol expresada<br />
en unida<strong>de</strong>s <strong>de</strong> 30 días, con 12 horas <strong>de</strong> sol cada una.<br />
ENE FEB MAR ABR MAY JUN JUL AGO SET OCT NOV DIC<br />
5 1.04 0.95 1.04 1.00 1.02 0.99 1.02 1.03 1.00 1.05 1.03 1.06<br />
10 1.08 0.97 1.05 0.99 1.01 0.96 1.00 1.01 1.00 1.06 1.05 1.10<br />
15 1.12 0.98 1.05 0.98 0.98 0.94 0.97 1.00 1.00 1.07 1.07 1.12<br />
20 1.14 1.00 1.05 0.97 0.96 0.91 0.95 0.99 1.00 1.08 1.09 1.15<br />
Fuente: Máximo Villón Bejar "Hidrología" Lima - Perú 2002, Pgá. 308<br />
D.- Método <strong>de</strong> Serruto<br />
MESES<br />
Don<strong>de</strong>:<br />
ETP = Evapotranspiración potencial (mm/día).<br />
RS = Radiación so<strong>la</strong>r extraterrestre, expresada en equivalentes <strong>de</strong><br />
evaporación (mm/día). Se obtiene <strong>de</strong> acuerdo a <strong>la</strong> <strong>la</strong>titud <strong>de</strong> <strong>la</strong> zona<br />
(Tab<strong>la</strong> Nº 4.3).<br />
T = temperatura media mensual (ºC).<br />
E.- Método <strong>de</strong> Penman Monteith - FAO<br />
Un panel <strong>de</strong> expertos e investigadores en riego fue organizado por <strong>la</strong> FAO en mayo <strong>de</strong><br />
1990, en co<strong>la</strong>boración con <strong>la</strong> Comisión Internacional para el Riego y Drenaje y con <strong>la</strong><br />
Organización Meteorológica Mundial, con el fin <strong>de</strong> revisar <strong>la</strong>s metodologías previamente<br />
propuestas por <strong>la</strong> FAO para el cálculo <strong>de</strong> los requerimientos <strong>de</strong> agua <strong>de</strong> los cultivos y para<br />
e<strong>la</strong>borar recomendaciones sobre <strong>la</strong> revisión y <strong>la</strong> actualización <strong>de</strong> procedimientos a este<br />
respecto.<br />
Como resultado <strong>de</strong> una consulta <strong>de</strong> expertos realizada en mayo <strong>de</strong> 1990, el método <strong>de</strong> FAO<br />
Penman-Monteith ahora se recomienda como el único método estándar para <strong>la</strong> <strong>de</strong>finición y<br />
el cálculo <strong>de</strong> <strong>la</strong> evapotranspiración <strong>de</strong> referencia ETo. El método <strong>de</strong> FAO Penman-<br />
Monteith requiere datos meteorológicos, como <strong>la</strong> radiación, temperatura <strong>de</strong>l aire, humedad<br />
atmosférica y velocidad <strong>de</strong>l viento; datos <strong>de</strong> ubicación geográfica <strong>de</strong> <strong>la</strong> estación, como <strong>la</strong><br />
<strong>la</strong>titud, longitud y altitud.<br />
MINAG-ANA-DCPRH-AGUAS SUPERFICIALES Pág.141
<strong>Estudio</strong> <strong>Hidrológico</strong> <strong>de</strong> <strong>la</strong>s <strong>Cuenca</strong>s Huancané y Suches 2010<br />
La ecuación Penman-Monteith FAO, fue <strong>de</strong>rivada a partir <strong>de</strong> <strong>la</strong> ecuación original <strong>de</strong><br />
Penman-Monteith y <strong>de</strong> <strong>la</strong>s ecuaciones <strong>de</strong> resistencia aerodinámica y <strong>de</strong>l cultivo, <strong>la</strong><br />
ecuación es <strong>la</strong> siguiente:<br />
Don<strong>de</strong>:<br />
ETo = Evapotranspiración <strong>de</strong> referencia (mm/día).<br />
Rn = Radiación neta en <strong>la</strong> superficie <strong>de</strong>l cultivo (MJ/m 2 /día).<br />
Ra = Radiación extraterrestre (mm/día).<br />
G = Flujo <strong>de</strong>l calor <strong>de</strong> suelo (MJ/m 2 /día).<br />
T = Temperatura media <strong>de</strong>l aire a 2 m <strong>de</strong> altura (°C).<br />
u2 = Velocidad <strong>de</strong>l viento a 2 m <strong>de</strong> altura (m/s).<br />
es = Presión <strong>de</strong> vapor <strong>de</strong> saturación (kPa).<br />
ea = Presión real <strong>de</strong> vapor (kPa).<br />
es - ea = Déficit <strong>de</strong> presión <strong>de</strong> vapor (kPa).<br />
= Pendiente <strong>de</strong> <strong>la</strong> curva <strong>de</strong> presión <strong>de</strong> vapor (kPa/°C).<br />
= Constante psicrométrica (kPa/°C).<br />
En el presente estudio, para el cálculo <strong>de</strong> evapotranspiración <strong>de</strong> referencia ETo, mediante<br />
este método, se ha empleado el Software CropWat 4.3.<br />
F.- Tanque <strong>de</strong> Evaporación C<strong>la</strong>se A<br />
La ban<strong>de</strong>ja o tanque <strong>de</strong> evaporación c<strong>la</strong>se A, es uno <strong>de</strong> los instrumentos que más se<br />
utilizan en todo el mundo. La re<strong>la</strong>ción entre <strong>la</strong> ETP y <strong>la</strong> evaporación <strong>de</strong>l tanque pue<strong>de</strong>n ser<br />
expresadas como:<br />
Don<strong>de</strong>:<br />
ETP = Evapotranspiración potencial (mm/mes).<br />
k = Coeficiente <strong>de</strong> tanque. (Tab<strong>la</strong> Nº 4.6).<br />
Ev = Evaporación <strong>de</strong> tanque c<strong>la</strong>se A.<br />
El tanque <strong>de</strong> evaporación integra los factores <strong>de</strong> clima y provee un buen estimado <strong>de</strong> <strong>la</strong><br />
ETP si se le da buen servicio <strong>de</strong> mantenimiento y manejo. Los coeficientes <strong>de</strong> tanque <strong>de</strong><br />
evaporación c<strong>la</strong>se A dados por Doorenbos y Pruitt [1977], para diferentes condiciones<br />
alre<strong>de</strong>dor <strong>de</strong>l tanque, aparecen en <strong>la</strong> Tab<strong>la</strong> Nº 4.6.<br />
MINAG-ANA-DCPRH-AGUAS SUPERFICIALES Pág.142
<strong>Estudio</strong> <strong>Hidrológico</strong> <strong>de</strong> <strong>la</strong>s <strong>Cuenca</strong>s Huancané y Suches 2010<br />
Tab<strong>la</strong> Nº 4.6 Coeficientes <strong>de</strong>l Tanque <strong>de</strong> Evaporación C<strong>la</strong>se A (k) para diferentes cubiertas,<br />
niveles <strong>de</strong> humedad re<strong>la</strong>tiva media y velocidad media <strong>de</strong>l viento<br />
Tanque C<strong>la</strong>se A<br />
HR media (%)<br />
Velocidad <strong>de</strong>l<br />
viento<br />
(Km/día)<br />
Suave<br />
< 175<br />
Mo<strong>de</strong>rada<br />
175-425<br />
Fuerte<br />
425-700<br />
Muy Fuerte<br />
> 700<br />
Condición A<br />
Tanque situado en cubierta ver<strong>de</strong> baja<br />
Distancia <strong>de</strong><br />
cubierta<br />
ver<strong>de</strong> a<br />
barlovento<br />
(m)<br />
Baja<br />
< 40<br />
Media<br />
40 - 70<br />
Alta<br />
> 70<br />
Condición B<br />
Tanque situado en un suelo <strong>de</strong>snudo<br />
Distancia <strong>de</strong>l<br />
barbecho a<br />
barlovento<br />
(m)<br />
Baja<br />
< 40<br />
Media<br />
40 - 70<br />
Alta<br />
> 70<br />
0 0.55 0.55 0.75 0 0.70 0.80 0.85<br />
10 0.65 0.75 0.85 10 0.60 0.70 0.80<br />
100 0.70 0.80 0.85 100 0.55 0.65 0.75<br />
1000 0.75 0.85 0.85 1000 0.50 0.60 0.70<br />
0 0.50 0.60 0.65 0 0.65 0.75 0.80<br />
10 0.60 0.70 0.75 10 0.55 0.65 0.70<br />
100 0.65 0.75 0.80 100 0.50 0.60 0.65<br />
1000 0.70 0.80 0.80 1000 0.45 0.55 0.60<br />
0 0.45 0.50 0.60 0 0.60 0.65 0.70<br />
10 0.55 0.60 0.65 10 0.50 0.55 0.65<br />
100 0.60 0.65 0.70 100 0.45 0.45 0.60<br />
1000 0.65 0.70 0.75 1000 0.40 0.45 0.55<br />
0 0.40 0.45 0.50 0 0.50 0.60 0.65<br />
10 0.45 0.55 0.60 10 0.45 0.50 0.55<br />
100 0.50 0.60 0.65 100 0.40 0.45 0.50<br />
1000 0.55 0.60 0.65 1000 0.35 0.40 0.45<br />
Fuente: <strong>Estudio</strong> FAO – Riego y Drenaje Nº 24 “Las necesida<strong>de</strong>s <strong>de</strong> agua <strong>de</strong> los cultivos” pág. 57.<br />
4.1.7.3 Selección <strong>de</strong>l método <strong>de</strong> cálculo <strong>de</strong> evapotranspiración potencial<br />
Para seleccionar el método apropiado para el cálculo <strong>de</strong> <strong>la</strong> evapotranspiración potencial <strong>de</strong><br />
<strong>la</strong>s cuencas Huancané y Suches, se ha calcu<strong>la</strong>do con todo los métodos anteriormente<br />
<strong>de</strong>scritos para <strong>la</strong>s estaciones Huancané y Progreso, con el fin <strong>de</strong> seleccionar el método<br />
apropiado mediante una comparación <strong>de</strong> los resultados con <strong>la</strong> ETP obtenida a partir <strong>de</strong>l<br />
Tanque <strong>de</strong> Evaporación.<br />
A.- Información básica<br />
La información climatológica para el cálculo <strong>de</strong> <strong>la</strong> evapotranspiración potencial, <strong>de</strong>pen<strong>de</strong><br />
<strong>de</strong> <strong>la</strong> necesidad <strong>de</strong> cada método. Para <strong>la</strong> aplicación <strong>de</strong> los métodos <strong>de</strong>scritos en el ítem<br />
4.1.7.2, <strong>la</strong>s variables climatológicas necesarias a nivel mensual son <strong>la</strong> temperatura media<br />
mensual, temperatura media <strong>de</strong> <strong>la</strong>s máximas diarias, temperatura media <strong>de</strong> <strong>la</strong>s mínimas<br />
diarias, humedad re<strong>la</strong>tiva media mensual, velocidad <strong>de</strong> viento, horas <strong>de</strong> sol media diaria y<br />
evaporación <strong>de</strong> Tanque C<strong>la</strong>se A.<br />
La información <strong>de</strong> <strong>la</strong>s variables climatológicas para <strong>la</strong>s estaciones Huancané y Progreso, se<br />
muestran en los Cuadros N° 4.19 y 4.20.<br />
MINAG-ANA-DCPRH-AGUAS SUPERFICIALES Pág.143
<strong>Estudio</strong> <strong>Hidrológico</strong> <strong>de</strong> <strong>la</strong>s <strong>Cuenca</strong>s Huancané y Suches 2010<br />
Variable climatológica<br />
Cuadro Nº 4.19 Información climatológica <strong>de</strong> <strong>la</strong> estación Huancané<br />
Altitud: 3840 ms nm Latitud S: 15.21° Lo ngitud W: 69.76°<br />
Ene Feb Mar Abr May Jun Jul Ago Sep Oct Nov Dic<br />
Temperatura media mensual (ºC) 9.3 9.3 9.0 8.1 6.3 4.9 4.5 5.7 7.5 8.9 9.5 9.5<br />
Temperatura media <strong>de</strong> <strong>la</strong>s máximas (ºC) 14.5 14.6 14.5 14.8 14.7 14.1 13.9 14.5 15.2 15.8 16.0 15.4<br />
Temperatura media <strong>de</strong> <strong>la</strong>s mínimas (ºC) 4.1 4.0 3.4 1.6 -2.1 -4.3 -4.9 -3.1 -0.2 1.9 2.9 3.6<br />
Humedad re<strong>la</strong>tiva media mensual (%) 70.0 70.0 71.0 66.0 58.0 57.0 57.0 54.0 56.0 56.0 58.0 64.0<br />
Velocidad media <strong>de</strong>l viento (m/s) 3.0 3.0 2.8 2.6 2.4 2.2 2.6 3.1 3.7 3.8 3.6 3.4<br />
Horas <strong>de</strong> sol media diaria 5.51 6.04 6.53 7.92 9.28 9.02 9.00 8.88 8.93 8.50 8.18 6.46<br />
Evaporación <strong>de</strong> Tanque C<strong>la</strong>se A (mm) 125.8 109.9 112.8 106.9 111.7 99.3 111.8 137.0 156.0 171.7 164.1 144.1<br />
Variable climatológica<br />
Cuadro Nº 4.20 Información climatológica <strong>de</strong> <strong>la</strong> estación Progreso<br />
MINAG-ANA-DCPRH-AGUAS SUPERFICIALES Pág.144<br />
Mes<br />
Altitud: 3940 ms nm Latitud S: 14.68° Lo ngitud W: 70.37°<br />
Ene Feb Mar Abr May Jun Jul Ago Sep Oct Nov Dic<br />
Temperatura media mensual (ºC) 9.7 9.7 9.6 9.1 7.5 6.3 6.0 7.3 8.8 9.9 10.2 10.0<br />
Temperatura media <strong>de</strong> <strong>la</strong>s máximas (ºC) 15.1 15.2 15.3 15.8 15.6 15.2 15.1 16.0 16.6 17.1 17.0 16.0<br />
Temperatura media <strong>de</strong> <strong>la</strong>s mínimas (ºC) 4.4 4.2 3.8 2.3 -0.7 -2.4 -3.2 -1.6 0.9 2.6 3.3 3.9<br />
Humedad re<strong>la</strong>tiva media mensual (%) 69.0 69.0 67.0 63.0 57.0 54.0 52.0 53.0 54.0 57.0 58.0 63.0<br />
Velocidad media <strong>de</strong>l viento (m/s) 2.6 2.8 3.6 3.0 3.7 3.3 4.0 4.2 4.5 4.3 3.9 3.4<br />
Horas <strong>de</strong> sol media diaria 5.09 5.39 6.12 7.68 8.99 9.16 9.19 8.90 8.33 7.82 7.05 6.04<br />
Evaporación <strong>de</strong> Tanque C<strong>la</strong>se A (mm) 142.3 133.7 147.4 145.1 152.7 147.8 155.2 162.3 169.7 169.9 168.4 159.6<br />
B.- Resultados <strong>de</strong> cálculo <strong>de</strong> evapotranspiración potencial<br />
Con <strong>la</strong> información climatológica disponible en <strong>la</strong>s estaciones Huancané y Progreso, se ha<br />
calcu<strong>la</strong>do <strong>la</strong> evapotranspiración potencial empleando <strong>la</strong>s fórmu<strong>la</strong>s <strong>de</strong> Hargreaves<br />
(Temperatura y Radiación), Hargreaves Modificado, Thornthwaite, Serruto y Penman<br />
Monteith – FAO.<br />
Por otro <strong>la</strong>do también, se ha calcu<strong>la</strong>do <strong>la</strong> ETP utilizando <strong>la</strong> evaporación <strong>de</strong>l Tanque C<strong>la</strong>se<br />
A. Para <strong>la</strong> estación Huancané se ha utilizado el coeficiente <strong>de</strong> tanque (k) igual a 0.75 para<br />
los meses <strong>de</strong> abril a febrero y 0.80 para el mes <strong>de</strong> marzo (ver Tab<strong>la</strong> Nº 4.6) para una<br />
velocidad <strong>de</strong>l viento variable <strong>de</strong> 190.1-328.3 km/día y humedad re<strong>la</strong>tiva <strong>de</strong> 54-71%. Para<br />
<strong>la</strong> estación Progreso, el coeficiente <strong>de</strong> tanque es igual a 0.75 para todo los meses, velocidad<br />
<strong>de</strong>l viento <strong>de</strong> 224.6-388.8 km/día y humedad re<strong>la</strong>tiva varía <strong>de</strong> 52-69%. En <strong>la</strong> mayoría <strong>de</strong><br />
<strong>la</strong>s estaciones meteorológicas existentes se ha observado <strong>de</strong> que el terreno que ro<strong>de</strong>a a los<br />
instrumentos <strong>de</strong> medición esta <strong>de</strong>scubierta, mayormente en el área <strong>de</strong> ubicación <strong>de</strong> los<br />
instrumentos el suelo está compuesto <strong>de</strong> una capa <strong>de</strong> grava gruesa. En <strong>la</strong> parte externa<br />
existen gramas y pastos <strong>de</strong> poca <strong>de</strong>nsidad y tamaño.<br />
Los resultados <strong>de</strong> <strong>la</strong> evapotranspiración potencial calcu<strong>la</strong>das para <strong>la</strong>s estaciones Huancané<br />
y Progreso, se muestran a continuación.<br />
Mes
<strong>Estudio</strong> <strong>Hidrológico</strong> <strong>de</strong> <strong>la</strong>s <strong>Cuenca</strong>s Huancané y Suches 2010<br />
MÉTODO<br />
Cuadro Nº 4.21 Evapotranspiración potencial (mm/mes) – Estación Huancané<br />
Ene Feb Mar Abr May Jun Jul Ago Sep Oct Nov Dic<br />
Hargreaves-Por Temperatura 129.70 111.52 108.43 93.98 79.10 65.69 69.29 84.89 104.67 129.65 137.34 144.72<br />
Hargreaves-Por Radiación 114.87 107.17 115.26 107.57 99.51 83.38 87.24 100.87 117.16 134.19 135.35 124.07<br />
Hargreaves Modificado 104.78 93.24 97.03 88.20 83.39 73.50 78.43 89.28 98.40 112.22 113.40 111.91<br />
Thornthwaite 60.00 52.50 54.64 46.47 37.24 28.62 27.40 34.79 44.31 55.14 58.40 61.13<br />
Serruto 143.22 123.48 118.73 91.50 70.06 55.20 59.21 76.57 98.70 126.17 136.20 142.29<br />
Penman Monteith - FAO 105.09 95.76 101.37 96.60 94.55 82.20 90.83 107.57 119.70 132.99 129.00 118.73<br />
Tanque <strong>de</strong> Evaporación C<strong>la</strong>se A 94.35 82.43 90.24 80.18 83.78 74.48 83.85 102.75 117.00 128.78 123.08 108.08<br />
MÉTODO<br />
Cuadro Nº 4.22 Evapotranspiración potencial (mm/mes) – Estación Progreso<br />
MINAG-ANA-DCPRH-AGUAS SUPERFICIALES Pág.145<br />
MES<br />
Ene Feb Mar Abr May Jun Jul Ago Sep Oct Nov Dic<br />
Hargreaves-Por Temperatura 133.30 114.54 118.76 101.37 84.03 70.68 74.88 91.65 110.57 133.98 140.32 147.42<br />
Hargreaves-Por Radiación 112.75 103.65 115.30 111.31 104.45 90.63 95.56 109.39 120.35 134.67 129.64 122.94<br />
Hargreaves Modificado 107.57 96.32 101.06 93.00 87.11 77.10 83.08 96.10 105.00 118.73 118.50 115.01<br />
Thornthwaite 58.28 51.00 54.11 48.01 39.96 32.50 32.02 39.75 47.45 56.77 58.40 60.00<br />
Serruto 143.84 124.60 120.90 95.10 75.33 60.90 65.41 83.08 103.80 129.58 137.70 143.22<br />
Penman Monteith - FAO 104.47 95.20 108.81 103.50 108.50 97.50 110.36 123.07 130.20 138.26 130.20 119.66<br />
Tanque <strong>de</strong> Evaporación C<strong>la</strong>se A 106.73 100.28 110.55 108.83 114.53 110.85 116.40 121.73 127.28 127.43 126.30 119.70<br />
Evapotranspiración potencial (mm)<br />
180.0<br />
150.0<br />
120.0<br />
90.0<br />
60.0<br />
30.0<br />
0.0<br />
Figura Nº 4.26 Evapotranspiración potencial (mm/mes) – Estación Huancané<br />
Ene Feb Mar Abr May Jun Jul Ago Sep Oct Nov Dic<br />
Tiempo (mes)<br />
MES<br />
Hargreaves-Por Temperatura<br />
Hargreaves-Por Radiación<br />
Hargreaves Modificado<br />
Thornthwaite<br />
Serruto<br />
Penman Monteith - FAO<br />
Tanque <strong>de</strong> Evaporación C<strong>la</strong>se A
<strong>Estudio</strong> <strong>Hidrológico</strong> <strong>de</strong> <strong>la</strong>s <strong>Cuenca</strong>s Huancané y Suches 2010<br />
Evapotranspiración potencial (mm)<br />
180.0<br />
150.0<br />
120.0<br />
90.0<br />
60.0<br />
30.0<br />
0.0<br />
Figura Nº 4.27 Evapotranspiración potencial (mm/mes) – Estación Progreso<br />
Ene Feb Mar Abr May Jun Jul Ago Sep Oct Nov Dic<br />
Tiempo (mes)<br />
Hargreaves-Por Temperatura<br />
Hargreaves-Por Radiación<br />
Hargreaves Modificado<br />
Thornthwaite<br />
Serruto<br />
Penman Monteith - FAO<br />
Tanque <strong>de</strong> Evaporación C<strong>la</strong>se A<br />
En <strong>la</strong>s Figuras Nº 4.26 y 4.27 se observa <strong>la</strong> variación <strong>de</strong> <strong>la</strong> evapotranspiración potencial<br />
calcu<strong>la</strong>da para <strong>la</strong> estación <strong>de</strong> Huancané y Progreso, con los métodos <strong>de</strong> Hargreaves (por<br />
temperatura y radiación), Hargreaves Modificado, Thornthwaite, Serruto, Penman<br />
Monteith – FAO y Tanque <strong>de</strong> Evaporación C<strong>la</strong>se A.<br />
En comparación, el método <strong>de</strong>l Tanque <strong>de</strong> Evaporación C<strong>la</strong>se A, nos da una i<strong>de</strong>a <strong>de</strong> <strong>la</strong><br />
variación <strong>de</strong>l fenómeno <strong>de</strong> <strong>la</strong> evapotranspiración; respecto a ello, se pue<strong>de</strong> seleccionar un<br />
método a<strong>de</strong>cuado para calcu<strong>la</strong>r <strong>la</strong> evapotranspiración potencial, para <strong>la</strong>s otras estaciones<br />
meteorológicas <strong>de</strong> <strong>la</strong>s cuencas Huancané y Suches. En conclusión, el método <strong>de</strong> Penman<br />
Monteith-FAO es el seleccionado, cuyos resultados se asemejan a <strong>la</strong> evapotranspiración<br />
potencial calcu<strong>la</strong>da a partir <strong>de</strong>l Tanque <strong>de</strong> Evaporación C<strong>la</strong>se A, en ambas estaciones<br />
analizadas.<br />
4.1.7.4 Evapotranspiración potencial <strong>de</strong> <strong>la</strong> cuenca<br />
Con <strong>la</strong> aplicación <strong>de</strong>l método seleccionado <strong>de</strong> Penman Monteith-FAO, se ha calcu<strong>la</strong>do <strong>la</strong><br />
evapotranspiración potencial para cada una <strong>de</strong> <strong>la</strong>s estaciones meteorológicas <strong>de</strong> <strong>la</strong>s cuencas<br />
Huancané y Suches.<br />
En el Cuadro Nº 4.23 se muestra <strong>la</strong> información climatológica <strong>de</strong> <strong>la</strong>s estaciones<br />
meteorológicas <strong>de</strong> <strong>la</strong>s cuencas Huancané, Suches y cuencas vecinas.<br />
En los Cuadros N° 4.24 y 4.25 se presenta los valores <strong>de</strong> <strong>la</strong> evapotranspiración potencial<br />
diaria y mensual <strong>de</strong> <strong>la</strong>s estaciones <strong>de</strong> <strong>la</strong>s cuencas Huancané, Suches y cuencas vecinas.<br />
Los resultados <strong>de</strong> cálculo <strong>de</strong> evapotranspiración potencial con el software CropWat 4.3 se<br />
muestran en el Anexo 1.<br />
MINAG-ANA-DCPRH-AGUAS SUPERFICIALES Pág.146
<strong>Estudio</strong> <strong>Hidrológico</strong> <strong>de</strong> <strong>la</strong>s <strong>Cuenca</strong>s Huancané y Suches 2010<br />
Cuadro Nº 4.23 Información climatológica <strong>de</strong> <strong>la</strong>s estaciones meteorológicas <strong>de</strong> <strong>la</strong>s<br />
cuencas Huancané, Suches y cuencas vecinas<br />
Variable climatológica<br />
Estación Putina<br />
Ene Feb Mar Abr May Jun Jul Ago Sep Oct Nov Dic<br />
Altitud: 3856 msnm Latitud S: 14.92° Longitud W: 69.87°<br />
Temperatura media <strong>de</strong> <strong>la</strong>s máximas (ºC) 15.9 16.3 16.5 17.1 17.0 16.5 16.5 17.6 17.7 18.2 18.1 17.1<br />
Temperatura media <strong>de</strong> <strong>la</strong>s mínimas (ºC) 3.6 3.6 2.8 0.9 -2.7 -5.5 -5.4 -4.0 -0.8 1.3 2.5 3.5<br />
Humedad re<strong>la</strong>tiva media mensual (%) 82.0 81.0 78.0 73.0 71.0 71.0 74.0 69.0 67.0 68.0 73.0 78.0<br />
Velocidad media <strong>de</strong>l viento (m/s) 2.6 3.0 3.3 2.4 2.3 3.2 1.5 2.7 1.8 3.2 2.6 3.3<br />
Horas <strong>de</strong> sol media diaria 4.51 4.85 5.63 7.45 8.94 8.94 9.25 8.64 7.86 6.87 6.62 6.22<br />
Estación Muñani<br />
Altitud: 3948 msnm Latitud S: 14.76° Longitud W: 69.95°<br />
Temperatura media <strong>de</strong> <strong>la</strong>s máximas (ºC) 15.2 15.4 15.6 16.3 16.3 15.8 15.7 16.6 16.9 17.2 17.1 16.3<br />
Temperatura media <strong>de</strong> <strong>la</strong>s mínimas (ºC) 3.7 3.7 3.2 1.8 -0.8 -2.7 -3.2 -1.7 0.4 1.7 2.4 3.3<br />
Humedad re<strong>la</strong>tiva media mensual (%) 66.0 65.0 65.0 60.0 51.0 47.0 47.0 47.0 49.0 52.0 55.0 60.0<br />
Velocidad media <strong>de</strong>l viento (m/s) 3.4 3.3 3.3 3.1 3.6 3.4 4.3 4.6 4.6 4.0 4.2 3.5<br />
Horas <strong>de</strong> sol media diaria 5.08 5.38 6.11 7.66 8.99 9.15 9.18 8.89 8.32 7.79 7.03 6.02<br />
Estación Huaraya-Moho<br />
Altitud: 3832 msnm Latitud S: 15.39° Longitud W: 69.48°<br />
Temperatura media <strong>de</strong> <strong>la</strong>s máximas (ºC) 14.3 14.3 14.3 14.5 14.2 13.5 13.6 14.4 15.3 15.7 15.9 15.0<br />
Temperatura media <strong>de</strong> <strong>la</strong>s mínimas (ºC) 5.3 5.1 4.6 3.3 1.0 -0.7 -1.0 0.1 2.0 3.5 4.2 4.9<br />
Humedad re<strong>la</strong>tiva media mensual (%) 71.0 70.0 69.0 66.0 62.0 60.0 57.0 56.0 57.0 58.0 60.0 65.0<br />
Velocidad media <strong>de</strong>l viento (m/s) 1.7 1.7 1.8 1.7 1.5 1.4 1.6 1.9 2.1 2.1 2.0 1.8<br />
Horas <strong>de</strong> sol media diaria 5.79 5.63 6.60 8.08 8.93 9.69 9.55 9.42 8.49 8.80 6.99 6.16<br />
Estación Cojata<br />
Altitud: 4327 msnm Latitud S: 15.01° Longitud W: 69.36°<br />
Temperatura media <strong>de</strong> <strong>la</strong>s máximas (ºC) 12.2 12.3 12.3 12.7 12.3 11.9 11.7 12.7 12.9 13.2 13.5 12.9<br />
Temperatura media <strong>de</strong> <strong>la</strong>s mínimas (ºC) 0.9 1.0 0.7 -2.3 -5.8 -9.3 -10.2 -9.4 -5.7 -2.8 -1.1 0.1<br />
Humedad re<strong>la</strong>tiva media mensual (%) 88.0 87.0 87.0 85.0 79.0 78.0 77.0 79.0 81.0 81.0 84.0 86.0<br />
Velocidad media <strong>de</strong>l viento (m/s) 3.2 4.3 3.4 3.3 3.0 2.4 1.9 4.5 4.1 2.9 3.1 3.1<br />
Horas <strong>de</strong> sol media diaria 4.42 4.95 5.56 7.04 8.74 8.87 8.82 8.59 7.87 6.82 6.22 5.10<br />
Estación Suches<br />
Altitud: 4655 msnm Latitud S: 14.79° Longitud W: 69.32°<br />
Temperatura media <strong>de</strong> <strong>la</strong>s máximas (ºC) 10.1 10.3 10.4 10.9 11.0 10.4 10.0 10.8 10.5 10.8 11.0 10.2<br />
Temperatura media <strong>de</strong> <strong>la</strong>s mínimas (ºC) -1.3 -1.0 -1.5 -2.8 -4.7 -6.8 -7.1 -7.1 -5.3 -3.5 -2.6 -1.8<br />
Humedad re<strong>la</strong>tiva media mensual (%) 89.0 89.0 88.0 86.0 80.0 81.0 81.0 82.0 84.0 87.0 88.0 89.0<br />
Velocidad media <strong>de</strong>l viento (m/s) 2.2 2.5 2.4 2.3 2.2 2.0 2.0 2.8 2.8 2.3 2.3 2.1<br />
Horas <strong>de</strong> sol media diaria 3.86 4.57 5.07 6.50 8.53 8.62 8.51 8.32 7.48 5.97 5.52 4.31<br />
Estación Ananea<br />
Altitud: 4640 msnm Latitud S: 14.68° Longitud W: 69.53°<br />
Temperatura media <strong>de</strong> <strong>la</strong>s máximas (ºC) 9.7 9.9 10.1 10.5 10.8 10.2 9.8 10.4 10.1 10.6 10.6 9.9<br />
Temperatura media <strong>de</strong> <strong>la</strong>s mínimas (ºC) -0.9 -0.7 -1.1 -1.6 -2.6 -3.7 -3.6 -3.7 -3.2 -2.2 -1.7 -1.1<br />
Humedad re<strong>la</strong>tiva media mensual (%) 86.0 87.0 86.0 82.0 75.0 77.0 77.0 77.0 79.0 82.0 83.0 85.0<br />
Velocidad media <strong>de</strong>l viento (m/s) 2.0 1.9 2.0 2.0 2.0 2.1 2.3 2.1 2.2 2.3 2.1 1.9<br />
Horas <strong>de</strong> sol media diaria 3.92 4.61 5.10 6.51 8.54 8.63 8.51 8.35 7.49 6.04 5.58 4.35<br />
Estación Crucero<br />
Altitud: 4130 msnm Latitud S: 14.36° Longitud W: 70.02°<br />
Temperatura media <strong>de</strong> <strong>la</strong>s máximas (ºC) 14.3 14.5 14.3 14.8 15.0 14.5 14.1 14.9 15.2 15.2 15.7 14.5<br />
Temperatura media <strong>de</strong> <strong>la</strong>s mínimas (ºC) 2.5 2.6 1.4 -0.9 -5.4 -8.3 -8.9 -7.7 -3.9 -0.7 0.3 1.4<br />
Humedad re<strong>la</strong>tiva media mensual (%) 78.0 78.0 78.0 76.0 72.0 69.0 69.0 69.0 72.0 73.0 73.0 77.0<br />
Velocidad media <strong>de</strong>l viento (m/s) 1.3 1.3 1.6 1.4 1.2 1.2 1.4 1.5 1.8 1.7 1.7 1.6<br />
Horas <strong>de</strong> sol media diaria 4.77 5.17 5.84 7.36 8.87 9.01 9.01 8.74 8.10 7.33 6.64 5.58<br />
Estación Azángaro<br />
Altitud: 3848 msnm Latitud S: 14.91° Longitud W: 70.19°<br />
Temperatura media <strong>de</strong> <strong>la</strong>s máximas (ºC) 15.7 15.6 15.6 16.2 16.0 15.5 15.6 16.4 17.1 17.6 17.5 16.6<br />
Temperatura media <strong>de</strong> <strong>la</strong>s mínimas (ºC) 4.8 4.9 4.2 2.4 -1.4 -4.3 -4.6 -2.9 0.3 2.5 3.3 4.3<br />
Humedad re<strong>la</strong>tiva media mensual (%) 71.0 72.0 71.0 67.0 61.0 55.0 53.0 54.0 56.0 58.0 60.0 65.0<br />
Velocidad media <strong>de</strong>l viento (m/s) 2.3 2.3 2.2 2.1 2.1 2.3 2.6 2.7 2.8 2.7 2.6 2.5<br />
Horas <strong>de</strong> sol media diaria 5.25 5.50 6.26 7.83 9.05 9.23 9.28 8.97 8.44 8.05 7.24 6.26<br />
Estación Arapa<br />
Altitud: 3830 msnm Latitud S: 15.15° Longitud W: 70.12°<br />
Temperatura media <strong>de</strong> <strong>la</strong>s máximas (ºC) 15.5 15.6 15.7 16.1 15.9 15.2 15.2 16.0 16.7 17.3 17.3 16.6<br />
Temperatura media <strong>de</strong> <strong>la</strong>s mínimas (ºC) 4.9 4.9 4.4 3.1 0.2 -1.8 -2.2 -1.0 1.3 3.0 3.7 4.5<br />
Humedad re<strong>la</strong>tiva media mensual (%) 66.0 68.0 67.0 61.0 53.0 49.0 49.0 49.0 50.0 51.0 54.0 59.0<br />
Velocidad media <strong>de</strong>l viento (m/s) 3.7 3.2 3.1 3.0 3.2 3.2 3.5 3.4 3.7 3.6 3.7 3.6<br />
Horas <strong>de</strong> sol media diaria 5.28 5.52 6.29 7.86 9.06 9.24 9.29 8.99 8.46 8.10 7.28 6.31<br />
Estación Taraco<br />
Altitud: 3820 msnm Latitud S: 15.31° Longitud W: 69.97°<br />
Temperatura media <strong>de</strong> <strong>la</strong>s máximas (ºC) 15.1 15.2 15.1 15.7 15.9 15.1 15.3 15.7 16.6 16.9 17.4 16.7<br />
Temperatura media <strong>de</strong> <strong>la</strong>s mínimas (ºC) 5.2 5.0 3.9 -0.8 -6.0 -8.7 -8.4 -6.6 -2.6 1.3 2.8 4.2<br />
Humedad re<strong>la</strong>tiva media mensual (%) 78.0 80.0 78.0 69.0 60.0 56.0 55.0 56.0 59.0 60.0 60.0 68.0<br />
Velocidad media <strong>de</strong>l viento (m/s) 2.7 2.6 2.6 2.5 2.6 2.7 3.2 3.1 3.0 2.9 2.8 2.8<br />
Horas <strong>de</strong> sol media diaria 5.30 5.53 6.30 7.87 9.07 9.25 9.30 9.00 8.47 8.13 7.30 6.33<br />
Estación Conima<br />
Altitud: 3860 msnm Latitud S: 15.45° Longitud W: 69.43°<br />
Temperatura media <strong>de</strong> <strong>la</strong>s máximas (ºC) 15.2 15.3 15.3 15.8 15.6 15.1 15.1 15.9 16.4 16.9 17.0 16.2<br />
Temperatura media <strong>de</strong> <strong>la</strong>s mínimas (ºC) 4.7 4.5 3.9 1.8 -1.7 -3.9 -4.3 -2.7 0.1 2.2 3.2 4.1<br />
Humedad re<strong>la</strong>tiva media mensual (%) 72.0 72.0 71.0 66.0 60.0 57.0 56.0 56.0 57.0 58.0 60.0 66.0<br />
Velocidad media <strong>de</strong>l viento (m/s) 2.7 2.7 2.8 2.5 2.6 2.6 2.8 3.1 3.2 3.2 3.1 3.0<br />
Horas <strong>de</strong> sol media diaria 5.23 5.48 6.24 7.81 9.04 9.22 9.27 8.96 8.43 8.02 7.22 6.23<br />
Estación Puerto Acosta<br />
Altitud: 3835 msnm Latitud S: 15.54° Longitud W: 69.25°<br />
Temperatura media <strong>de</strong> <strong>la</strong>s máximas (ºC) 15.2 15.0 15.3 15.0 14.9 15.0 14.8 15.8 15.8 16.7 16.4 15.8<br />
Temperatura media <strong>de</strong> <strong>la</strong>s mínimas (ºC) 5.9 5.1 5.3 3.3 0.0 -0.2 -1.5 0.2 1.8 3.1 4.4 4.9<br />
Humedad re<strong>la</strong>tiva media mensual (%) 72.0 72.0 71.0 66.0 59.0 56.0 56.0 55.0 56.0 57.0 60.0 65.0<br />
Velocidad media <strong>de</strong>l viento (m/s) 2.7 2.7 2.8 2.5 2.6 2.6 2.8 3.1 3.2 3.2 3.1 3.0<br />
Horas <strong>de</strong> sol media diaria 5.28 5.51 6.28 7.85 9.06 9.24 9.29 8.98 8.46 8.09 7.27 6.29<br />
Estación Escoma<br />
Altitud: 3828 msnm Latitud S: 15.67° Longitud W: 69.13°<br />
Temperatura media <strong>de</strong> <strong>la</strong>s máximas (ºC) 15.4 15.5 15.5 16.0 15.8 15.3 15.3 16.1 16.7 17.2 17.3 16.4<br />
Temperatura media <strong>de</strong> <strong>la</strong>s mínimas (ºC) 4.9 4.7 4.1 2.0 -1.6 -3.7 -4.2 -2.6 0.3 2.4 3.4 4.3<br />
Humedad re<strong>la</strong>tiva media mensual (%) 71.0 72.0 71.0 66.0 59.0 56.0 55.0 55.0 56.0 57.0 59.0 65.0<br />
Velocidad media <strong>de</strong>l viento (m/s) 2.7 2.7 2.8 2.5 2.6 2.6 2.8 3.1 3.2 3.2 3.1 3.0<br />
Horas <strong>de</strong> sol media diaria 5.29 5.52 6.29 7.86 9.06 9.24 9.30 8.99 8.46 8.10 7.29 6.31<br />
Estación Chahuaya<br />
Altitud: 4500 msnm Latitud S: 15.75° Longitud W: 68.98°<br />
Temperatura media <strong>de</strong> <strong>la</strong>s máximas (ºC) 11.1 11.2 11.3 11.8 11.9 11.4 11.0 11.8 11.7 12.0 12.2 11.4<br />
Temperatura media <strong>de</strong> <strong>la</strong>s mínimas (ºC) -0.1 0.1 -0.4 -1.9 -4.1 -6.3 -6.6 -6.3 -4.3 -2.4 -1.5 -0.6<br />
Humedad re<strong>la</strong>tiva media mensual (%) 85.0 85.0 85.0 82.0 76.0 76.0 76.0 77.0 79.0 81.0 82.0 84.0<br />
Velocidad media <strong>de</strong>l viento (m/s) 2.3 2.6 2.4 2.4 2.3 2.1 2.1 2.9 2.9 2.5 2.4 2.2<br />
Horas <strong>de</strong> sol media diaria 4.13 4.75 5.30 6.75 8.63 8.74 8.66 8.45 7.66 6.37 5.85 4.69<br />
MINAG-ANA-DCPRH-AGUAS SUPERFICIALES Pág.147<br />
Mes
<strong>Estudio</strong> <strong>Hidrológico</strong> <strong>de</strong> <strong>la</strong>s <strong>Cuenca</strong>s Huancané y Suches 2010<br />
En <strong>la</strong> Figura N° 4.28, <strong>la</strong> variación mensual <strong>de</strong> <strong>la</strong> evapotranspiración potencial muestra una<br />
ten<strong>de</strong>ncia simi<strong>la</strong>r en todas <strong>la</strong>s estaciones meteorológicas <strong>de</strong> <strong>la</strong>s cuencas Huancané, Suches<br />
y cuencas vecinas. Don<strong>de</strong> <strong>la</strong> mayor evapotranspiración potencial se presenta en el mes <strong>de</strong><br />
octubre y <strong>la</strong> menor en el mes <strong>de</strong> junio.<br />
En <strong>la</strong> cuenca Huancané, <strong>la</strong> mayor evapotranspiración potencial se presenta en <strong>la</strong> zona <strong>de</strong> <strong>la</strong><br />
estación Muñani con 1435.4 mm y <strong>la</strong> menor en <strong>la</strong> zona <strong>de</strong> <strong>la</strong> estación Ananea <strong>de</strong> 917.2<br />
mm. Mientras en <strong>la</strong> cuenca Suches, <strong>la</strong> mayor evapotranspiración se presenta en <strong>la</strong> zona <strong>de</strong><br />
<strong>la</strong> estación Escoma con 1301.5 mm y <strong>la</strong> menor en <strong>la</strong> zona <strong>de</strong> <strong>la</strong> estación Suches con 915.7<br />
mm. Ver Cuadro Nº 4.25 y <strong>la</strong> Figura Nº 4.29.<br />
Cuadro Nº 4.24 Evapotranspiración potencial (mm/día) - Estaciones <strong>de</strong> <strong>la</strong>s cuencas Huancané, Suches y<br />
cuencas vecinas<br />
Estación<br />
Altitud<br />
(msnm)<br />
Ene Feb Mar Abr May Jun Jul Ago Sep Oct Nov Dic<br />
Huancané 3840.0 3.39 3.42 3.27 3.22 3.05 2.74 2.93 3.47 3.99 4.29 4.30 3.83 3.49<br />
Putina 3856.0 3.09 3.18 3.29 3.27 3.09 3.16 2.70 3.52 3.55 4.03 3.85 3.64 3.36<br />
Muñani 3948.0 3.56 3.59 3.56 3.60 3.69 3.47 3.82 4.30 4.55 4.55 4.49 3.99 3.93<br />
Huaraya Moho 3832.0 3.29 3.21 3.20 3.05 2.67 2.43 2.61 3.13 3.58 3.96 3.79 3.51 3.20<br />
Cojata 4327.0 2.65 2.69 2.66 2.71 2.67 2.46 2.42 3.23 3.25 3.20 3.16 2.89 2.83<br />
Suches 4655.0 2.44 2.51 2.47 2.45 2.41 2.17 2.21 2.64 2.77 2.75 2.77 2.52 2.51<br />
Ananea 4640.0 2.45 2.52 2.48 2.45 2.41 2.17 2.22 2.56 2.75 2.79 2.81 2.55 2.51<br />
Crucero 4130.0 2.99 3.03 2.96 2.88 2.64 2.41 2.55 2.96 3.33 3.44 3.48 3.17 2.99<br />
Progreso 3940.0 3.37 3.40 3.51 3.45 3.50 3.25 3.56 3.97 4.34 4.46 4.34 3.86 3.75<br />
Azángaro 3848.0 3.38 3.34 3.29 3.24 3.04 2.96 3.19 3.60 3.97 4.20 4.11 3.78 3.51<br />
Arapa 3830.0 3.65 3.53 3.50 3.53 3.46 3.28 3.46 3.82 4.28 4.53 4.48 4.12 3.80<br />
Taraco 3820.0 3.21 3.15 3.14 3.27 3.25 3.11 3.39 3.65 3.95 4.12 4.16 3.78 3.52<br />
Conima 3860.0 3.35 3.35 3.31 3.29 3.14 2.97 3.13 3.61 3.96 4.21 4.16 3.79 3.52<br />
Puerto Acosta 3835.0 3.36 3.32 3.32 3.20 3.07 2.92 3.06 3.58 3.90 4.22 4.10 3.78 3.49<br />
Escoma 3828.0 3.41 3.37 3.34 3.31 3.17 2.99 3.16 3.64 4.02 4.28 4.24 3.85 3.57<br />
Chahuaya 4500.0 2.61 2.66 2.59 2.58 2.50 2.27 2.32 2.79 2.97 2.99 3.01 2.75 2.67<br />
Cuadro Nº 4.25 Evapotranspiración potencial (mm/mes) - Estaciones <strong>de</strong> <strong>la</strong>s cuencas Huancané, Suches y<br />
cuencas vecinas<br />
Estación<br />
Altitud<br />
(msnm)<br />
MINAG-ANA-DCPRH-AGUAS SUPERFICIALES Pág.148<br />
Mes<br />
Ene Feb Mar Abr May Jun Jul Ago Sep Oct Nov Dic<br />
Prom<br />
Anual<br />
Huancané 3840.0 105.1 95.8 101.4 96.6 94.6 82.2 90.8 107.6 119.7 133.0 129.0 118.7 1274.4<br />
Putina 3856.0 95.8 89.0 102.0 98.1 95.8 94.8 83.7 109.1 106.5 124.9 115.5 112.8 1228.1<br />
Muñani 3948.0 110.4 100.5 110.4 108.0 114.4 104.1 118.4 133.3 136.5 141.1 134.7 123.7 1435.4<br />
Huaraya Moho 3832.0 102.0 89.9 99.2 91.5 82.8 72.9 80.9 97.0 107.4 122.8 113.7 108.8 1168.9<br />
Cojata 4327.0 82.2 75.3 82.5 81.3 82.8 73.8 75.0 100.1 97.5 99.2 94.8 89.6 1034.0<br />
Suches 4655.0 75.6 70.3 76.6 73.5 74.7 65.1 68.5 81.8 83.1 85.3 83.1 78.1 915.7<br />
Ananea 4640.0 76.0 70.6 76.9 73.5 74.7 65.1 68.8 79.4 82.5 86.5 84.3 79.1 917.2<br />
Crucero 4130.0 92.7 84.8 91.8 86.4 81.8 72.3 79.1 91.8 99.9 106.6 104.4 98.3 1089.9<br />
Progreso 3940.0 104.5 95.2 108.8 103.5 108.5 97.5 110.4 123.1 130.2 138.3 130.2 119.7 1369.7<br />
Azángaro 3848.0 104.8 93.5 102.0 97.2 94.2 88.8 98.9 111.6 119.1 130.2 123.3 117.2 1280.8<br />
Arapa 3830.0 113.2 98.8 108.5 105.9 107.3 98.4 107.3 118.4 128.4 140.4 134.4 127.7 1388.7<br />
Taraco 3820.0 99.5 88.2 97.3 98.1 100.8 93.3 105.1 113.2 118.5 127.7 124.8 117.2 1283.6<br />
Conima 3860.0 103.9 93.8 102.6 98.7 97.3 89.1 97.0 111.9 118.8 130.5 124.8 117.5 1285.9<br />
Puerto Acosta 3835.0 104.2 93.0 102.9 96.0 95.2 87.6 94.9 111.0 117.0 130.8 123.0 117.2 1272.7<br />
Escoma 3828.0 105.7 94.4 103.5 99.3 98.3 89.7 98.0 112.8 120.6 132.7 127.2 119.4 1301.5<br />
Chahuaya 4500.0 80.9 74.5 80.3 77.4 77.5 68.1 71.9 86.5 89.1 92.7 90.3 85.3 974.4<br />
Mes<br />
Total<br />
Anual
Evapotranspiración potencial (mm)<br />
<strong>Estudio</strong> <strong>Hidrológico</strong> <strong>de</strong> <strong>la</strong>s <strong>Cuenca</strong>s Huancané y Suches 2010<br />
Evapotranspiración potencial (mm)<br />
200.0<br />
175.0<br />
150.0<br />
125.0<br />
100.0<br />
75.0<br />
50.0<br />
25.0<br />
0.0<br />
Figura Nº 4.28 Variación mensual <strong>de</strong> <strong>la</strong> evapotranspiración potencial (mm/mes)<br />
Estaciones <strong>de</strong> <strong>la</strong> cuenca Huancané, Suches y cuencas vecinas<br />
Ene Feb Mar Abr May Jun Jul Ago Sep Oct Nov Dic<br />
Tiempo (mes)<br />
Huancané<br />
MINAG-ANA-DCPRH-AGUAS SUPERFICIALES Pág.149<br />
Putina<br />
Muñani<br />
Huaraya Moho<br />
Cojata<br />
Suches<br />
Ananea<br />
Crucero<br />
Progreso<br />
Azángaro<br />
Arapa<br />
Taraco<br />
Conima<br />
Puerto Acosta<br />
Escoma<br />
Chahuaya<br />
Figura Nº 4.29 Variación anual <strong>de</strong> <strong>la</strong> evapotranspiración potencial (mm/año) Estaciones <strong>de</strong> <strong>la</strong>s cuencas<br />
Huancané, Suches y cuencas vecinas<br />
2000.0<br />
1600.0<br />
1200.0<br />
800.0<br />
400.0<br />
0.0<br />
1274.4 1228.1<br />
Huancané<br />
Putina<br />
1435.4<br />
Muñani<br />
1168.9<br />
Huaraya<br />
Moho<br />
1034.0<br />
Cojata<br />
915.7 917.2<br />
Suches<br />
Ananea<br />
1089.9<br />
Crucero<br />
1369.7<br />
1280.8<br />
Estación Meteorológica<br />
Progreso<br />
Azángaro<br />
1388.7<br />
Arapa<br />
1283.6 1285.9 1272.7 1301.5<br />
La distribución espacial <strong>de</strong> <strong>la</strong> evapotranspiración potencial (isolíneas) en <strong>la</strong>s cuencas<br />
Huancané y Suches, se muestra en el Mapa Nº 4.8, don<strong>de</strong> se aprecia que en <strong>la</strong> cuenca<br />
Huancané <strong>la</strong> evapotranspiración potencial media anual varía <strong>de</strong> 960 a 1440 mm, mientras<br />
en <strong>la</strong> cuenca Suches varía <strong>de</strong> 680 a 1280 mm, respectivamente.<br />
Taraco<br />
Conima<br />
Puerto<br />
Acosta<br />
Escoma<br />
974.4<br />
Chahuaya
<strong>Estudio</strong> <strong>Hidrológico</strong> <strong>de</strong> <strong>la</strong>s <strong>Cuenca</strong>s Huancané y Suches 2010<br />
Mapa Nº 4.8 Distribución espacial <strong>de</strong> <strong>la</strong> evapotranspiración potencial total anual (isolíneas) en <strong>la</strong>s cuencas<br />
Huancané y Suches<br />
MINAG-ANA-DCPRH-AGUAS SUPERFICIALES Pág.150
<strong>Estudio</strong> <strong>Hidrológico</strong> <strong>de</strong> <strong>la</strong>s <strong>Cuenca</strong>s Huancané y Suches 2010<br />
4.2 CLASIFICACIÓN CLIMÁTICA<br />
Para <strong>la</strong> c<strong>la</strong>sificación climática <strong>de</strong> <strong>la</strong>s cuencas Huancané y Suches, se ha basado en el<br />
sistema <strong>de</strong> Thornthwaite. El sistema consi<strong>de</strong>ra como variables <strong>de</strong> c<strong>la</strong>sificación el índice <strong>de</strong><br />
<strong>la</strong> precipitación efectiva (PE) y el índice <strong>de</strong> <strong>la</strong> temperatura efectiva (TE). Los índices<br />
correspondientes se obtienen a partir <strong>de</strong> <strong>la</strong> sumatoria <strong>de</strong> <strong>la</strong> re<strong>la</strong>ción entre <strong>la</strong> precipitación<br />
media mensual y <strong>la</strong> temperatura media mensual, cuyas ecuaciones con <strong>la</strong>s siguientes:<br />
PE <br />
TE <br />
<br />
10<br />
12<br />
9<br />
Pi <br />
1.<br />
64<br />
<br />
i1<br />
Ti<br />
12.2<br />
<br />
12<br />
<br />
i1<br />
<br />
<br />
9<br />
<br />
<br />
<br />
Ti<br />
<br />
20 <br />
Don<strong>de</strong>:<br />
P = Precipitación media mensual (mm).<br />
T = Temperatura media mensual (ºC).<br />
<br />
<br />
<br />
En el presente estudio para <strong>la</strong> c<strong>la</strong>sificación climática, se ha consi<strong>de</strong>rado ocho (8) estaciones<br />
meteorológicas que influyen directamente al área <strong>de</strong> <strong>la</strong>s cuencas Huancané y Suches. Los<br />
resultados se muestran en el Cuadro Nº 4.26. Las cuencas Huancané y Suches<br />
correspon<strong>de</strong>n a <strong>la</strong> región <strong>de</strong> humedad <strong>de</strong> sub-húmedo a húmedo y <strong>la</strong> región <strong>de</strong> temperatura<br />
<strong>de</strong> microtérmico a taiga.<br />
Sector<br />
Huancané<br />
Putina<br />
Muñani<br />
Altitud<br />
(msnm)<br />
3840.0<br />
3856.0<br />
3948.0<br />
Huaraya Moho 3832.0<br />
Cojata 4327.0<br />
Suches 4655.0<br />
Ananea 4640.0<br />
Crucero<br />
4130.0<br />
Cuadro Nº 4.26 C<strong>la</strong>sificación climática <strong>de</strong> <strong>la</strong>s cuencas Huancané y Suches<br />
Parámetro<br />
Mes<br />
Ene Feb Mar Abr May Jun Jul Ago Sep Oct Nov Dic<br />
P (mm) 140.4 109.6 102.1 42.6 12.0 4.4 3.6 10.6 30.7 46.9 63.4 111.4 Índice PE<br />
PE 13.2 10.0 9.4 3.7 1.0 0.4 0.3 0.9 2.7 4.0 5.4 10.1 61.1 Sub húmedo C<br />
T (ºC) 9.3 9.3 9.0 8.1 6.3 4.9 4.5 5.7 7.5 8.9 9.5 9.5 Índice TE<br />
TE 4.2 4.2 4.1 3.6 2.8 2.2 2.0 2.6 3.4 4.0 4.3 4.3 41.7 Microtérmico C'<br />
P (mm) 147.8 105.3 101.5 52.5 13.4 4.9 3.9 8.7 30.6 48.3 73.5 102.8 Índice PE<br />
PE 13.6 9.3 9.1 4.5 1.1 0.4 0.3 0.7 2.5 3.9 6.1 8.9 60.4 Sub húmedo C<br />
T (ºC) 9.8 9.9 9.5 8.9 7.0 5.5 5.4 6.8 8.4 9.7 10.3 10.3 Índice TE<br />
TE 4.4 4.5 4.3 4.0 3.2 2.5 2.4 3.1 3.8 4.4 4.6 4.6 45.8 Microtérmico C'<br />
P (mm) 142.3 109.5 90.4 43.8 9.8 3.7 2.4 6.2 25.9 43.1 63.0 104.3 Índice PE<br />
PE 13.3 9.9 8.0 3.7 0.7 0.3 0.2 0.5 2.1 3.5 5.3 9.3 56.8 Sub húmedo C<br />
T (ºC) 9.4 9.6 9.4 9.0 7.8 6.6 6.3 7.5 8.7 9.4 9.8 9.7 Índice TE<br />
TE 4.2 4.3 4.2 4.1 3.5 3.0 2.8 3.4 3.9 4.2 4.4 4.4 46.4 Microtérmico C'<br />
P (mm) 200.2 141.7 120.5 57.8 21.8 8.1 7.0 16.5 46.3 57.8 73.0 134.4 Índice PE<br />
PE 19.1 13.0 11.0 5.0 1.8 0.7 0.6 1.4 4.0 4.8 6.1 12.1 79.6 Húmedo B<br />
T (ºC) 9.8 9.8 9.5 8.9 7.7 6.4 6.3 7.3 8.7 9.7 10.1 10.0 Índice TE<br />
TE 4.4 4.4 4.3 4.0 3.5 2.9 2.8 3.3 3.9 4.4 4.5 4.5 46.9 Microtérmico C'<br />
P (mm) 145.7 118.2 107.3 57.1 17.3 8.8 6.5 16.9 37.1 57.3 67.8 103.6 Índice PE<br />
PE 16.1 12.6 11.4 6.1 1.9 1.0 0.8 2.1 4.2 6.2 7.0 11.0 80.4 Húmedo B<br />
T (ºC) 6.5 6.6 6.5 5.2 3.3 1.3 0.8 1.6 3.6 5.2 6.2 6.5 Índice TE<br />
TE 2.9 3.0 2.9 2.3 1.5 0.6 0.4 0.7 1.6 2.3 2.8 2.9 23.9 Taiga D'<br />
P (mm) 104.2 85.0 89.8 39.9 12.0 3.6 4.3 8.6 28.6 41.3 53.3 70.2 Índice PE<br />
PE 12.6 9.9 10.6 4.4 1.2 0.4 0.5 1.0 3.4 4.8 6.1 8.3 63.2 Sub húmedo C<br />
T (ºC) 4.4 4.6 4.5 4.1 3.2 1.8 1.4 1.8 2.6 3.6 4.2 4.2 Índice TE<br />
TE 2.0 2.1 2.0 1.8 1.4 0.8 0.6 0.8 1.2 1.6 1.9 1.9 18.1 Taiga D'<br />
P (mm) 122.3 100.0 87.5 44.6 18.5 6.4 11.8 14.9 24.7 45.8 56.5 88.7 Índice PE<br />
PE 15.1 11.9 10.3 4.9 1.9 0.6 1.2 1.6 2.7 5.1 6.4 10.6 72.3 Húmedo B<br />
T (ºC) 4.4 4.6 4.5 4.5 4.1 3.3 3.1 3.4 3.4 4.2 4.5 4.4 Índice TE<br />
TE 2.0 2.1 2.0 2.0 1.8 1.5 1.4 1.5 1.5 1.9 2.0 2.0 21.7 Taiga D'<br />
P (mm) 152.5 135.9 114.4 56.6 18.1 6.7 4.7 11.7 32.6 52.7 78.6 119.0 Índice PE<br />
PE 15.2 13.3 11.3 5.5 1.8 0.7 0.5 1.2 3.2 5.0 7.4 11.8 76.9 Húmedo B<br />
T (ºC) 8.4 8.5 7.9 6.9 4.8 3.1 2.6 3.6 5.6 7.2 8.0 8.0 Índice TE<br />
Característica <strong>de</strong>l clima<br />
Región <strong>de</strong> humedad<br />
Región <strong>de</strong> temperatura<br />
Región <strong>de</strong> humedad<br />
Región <strong>de</strong> temperatura<br />
Región <strong>de</strong> humedad<br />
Región <strong>de</strong> temperatura<br />
Región <strong>de</strong> humedad<br />
Región <strong>de</strong> temperatura<br />
Región <strong>de</strong> humedad<br />
Región <strong>de</strong> temperatura<br />
Región <strong>de</strong> humedad<br />
Región <strong>de</strong> temperatura<br />
Región <strong>de</strong> humedad<br />
Región <strong>de</strong> temperatura<br />
Región <strong>de</strong> humedad<br />
Región <strong>de</strong> temperatura<br />
TE 3.8 3.8 3.6 3.1 2.2 1.4 1.2 1.6 2.5 3.2 3.6 3.6 33.6 Microtérmico C'<br />
MINAG-ANA-DCPRH-AGUAS SUPERFICIALES Pág.151
<strong>Estudio</strong> <strong>Hidrológico</strong> <strong>de</strong> <strong>la</strong>s <strong>Cuenca</strong>s Huancané y Suches 2010<br />
5.1 GENERALIDADES<br />
CAPÍTULO V<br />
PLUVIOMETRÍA<br />
Des<strong>de</strong> el punto <strong>de</strong> vista <strong>de</strong> <strong>la</strong> ingeniería hidrológica, <strong>la</strong> precipitación es <strong>la</strong> fuente primaria<br />
<strong>de</strong>l agua <strong>de</strong> <strong>la</strong> superficie terrestre, y sus mediciones y análisis, forman el punto <strong>de</strong> partida<br />
<strong>de</strong> los estudios concernientes al uso y control <strong>de</strong>l agua.<br />
Para po<strong>de</strong>r explicar <strong>de</strong> mejor forma el suceso <strong>de</strong> <strong>la</strong> escorrentía superficial en <strong>la</strong>s cuencas <strong>de</strong><br />
los <strong>río</strong>s Huancané y Suches, es necesario re<strong>la</strong>cionar<strong>la</strong> con <strong>la</strong> precipitación y <strong>de</strong> esta forma,<br />
no sólo validar <strong>la</strong> información histórica disponible, sino también practicar una mo<strong>de</strong><strong>la</strong>ción<br />
matemática que reproduzca el proceso precipitación – escorrentía, para lo cual se requiere<br />
previamente cuantificar <strong>la</strong> inci<strong>de</strong>ncia simultánea <strong>de</strong> <strong>la</strong> precipitación sobre <strong>la</strong> cuenca, a lo<br />
que <strong>de</strong>nominamos cálculo <strong>de</strong> <strong>la</strong> precipitación areal utilizando métodos convencionales <strong>de</strong><br />
cálculo.<br />
5.2 RED DE ESTACIONES METEOROLÓGICAS<br />
La información pluviométrica disponible correspon<strong>de</strong> a una red <strong>de</strong> dieciséis (16)<br />
estaciones meteorológicas para el estudio <strong>de</strong> <strong>la</strong> precipitación, <strong>de</strong> los cuales tres (3)<br />
estaciones están ubicadas <strong>de</strong>ntro <strong>de</strong> <strong>la</strong> cuenca Huancané, tres (3) estaciones en <strong>la</strong> cuenca<br />
Suches y diez (10) estaciones meteorológicas en el entorno externo <strong>de</strong> estas. La<br />
información histórica disponible <strong>de</strong> <strong>la</strong> precipitación total mensual se muestra en el Cuadro<br />
N° 5.1.<br />
La ubicación <strong>de</strong> <strong>la</strong> red <strong>de</strong> estaciones meteorológicas en <strong>la</strong>s cuencas Huancané y Suches, se<br />
muestran en el Mapa Nº 5.1.<br />
Las estaciones meteorológicas ubicadas en el ámbito <strong>de</strong> <strong>la</strong>s cuencas Huancané, Suches y<br />
cuencas vecinas, es <strong>la</strong> siguiente:<br />
<strong>Cuenca</strong> Huancané:<br />
- Estación Huancané<br />
- Estación Putina<br />
- Estación Muñani<br />
<strong>Cuenca</strong> Suches:<br />
- Estación Cojata<br />
- Estación Suches<br />
- Estación Escoma<br />
MINAG-ANA-DCPRH-AGUAS SUPERFICIALES Pág.152
<strong>Estudio</strong> <strong>Hidrológico</strong> <strong>de</strong> <strong>la</strong>s <strong>Cuenca</strong>s Huancané y Suches 2010<br />
Mapa Nº 5.1 Ubicación <strong>de</strong> <strong>la</strong>s estaciones meteorológicas en <strong>la</strong>s cuencas Huancané y Suches<br />
MINAG-ANA-DCPRH-AGUAS SUPERFICIALES Pág.153
<strong>Estudio</strong> <strong>Hidrológico</strong> <strong>de</strong> <strong>la</strong>s <strong>Cuenca</strong>s Huancané y Suches 2010<br />
<strong>Cuenca</strong>s vecinas:<br />
- Estación Huaraya-Moho - Estación Arapa<br />
- Estación Ananea - Estación Taraco<br />
- Estación Crucero - Estación Conima<br />
- Estación Progreso - Estación Puerto Acosta<br />
- Estación Azángaro - Estación Chahuaya<br />
Cuadro Nº 5.1 Longitud <strong>de</strong>l registro histórico <strong>de</strong> <strong>la</strong> información pluviométrica <strong>de</strong> <strong>la</strong>s cuencas Huancané,<br />
Suches y cuencas vecinas<br />
5.3 ANÁLISIS DE CONSISTENCIA DE LA INFORMACIÓN PLUVIOMÉTRICA<br />
El análisis <strong>de</strong> consistencia <strong>de</strong> <strong>la</strong> información hidrometeorológica es una técnica que<br />
permite <strong>de</strong>tectar, i<strong>de</strong>ntificar, cuantificar, corregir y eliminar los errores sistemáticos <strong>de</strong> <strong>la</strong><br />
no homogeneidad e inconsistencia <strong>de</strong> una serie hidrometeorológica. Antes <strong>de</strong> proce<strong>de</strong>r a<br />
efectuar el Mo<strong>de</strong><strong>la</strong>miento Matemático <strong>de</strong> cualquier serie hidrometeorológica es necesario<br />
efectuar el análisis <strong>de</strong> consistencia respectivo a fin <strong>de</strong> obtener una serie homogénea,<br />
consistente y confiable; porque <strong>la</strong> inconsistencia <strong>de</strong> datos pue<strong>de</strong> producir un sobre y<br />
subdiseño <strong>de</strong> estructuras hidráulicas. El análisis <strong>de</strong> consistencia se realiza con tres<br />
métodos, tales como son:<br />
- Análisis visual <strong>de</strong> hidrogramas.<br />
- Análisis <strong>de</strong> doble masa.<br />
- Análisis estadístico.<br />
A.- Análisis visual <strong>de</strong> hidrogramas<br />
Este análisis se realiza para <strong>de</strong>tectar y i<strong>de</strong>ntificar <strong>la</strong> inconsistencia <strong>de</strong> <strong>la</strong> información<br />
pluviométrica en forma visual, e indicar el pe<strong>río</strong>do o los pe<strong>río</strong>dos en los cuales los datos<br />
son dudosos, lo cual se pue<strong>de</strong> reflejar como “picos“ muy altos o valores muy bajos,<br />
MINAG-ANA-DCPRH-AGUAS SUPERFICIALES Pág.154
<strong>Estudio</strong> <strong>Hidrológico</strong> <strong>de</strong> <strong>la</strong>s <strong>Cuenca</strong>s Huancané y Suches 2010<br />
“saltos” y/o “ten<strong>de</strong>ncias”, los cuales se <strong>de</strong>ben comprobarse si son fenómenos naturales que<br />
efectivamente han ocurrido o son producidos por errores sistemáticos, mediante un gráfico<br />
o hidrograma <strong>de</strong> <strong>la</strong>s series <strong>de</strong> análisis, en coor<strong>de</strong>nadas cartesianas ploteando <strong>la</strong> información<br />
histórica <strong>de</strong> <strong>la</strong> variable pluviométrica a nivel anual y mensual; en <strong>la</strong>s or<strong>de</strong>nadas se ubica<br />
los valores anuales o mensuales <strong>de</strong> <strong>la</strong> serie pluviométrica en unida<strong>de</strong>s respectivas y en <strong>la</strong>s<br />
abscisas el tiempo en años y meses.<br />
Para el presente estudio se ha formado en cuatro (4) grupos <strong>de</strong> estaciones pluviométricas<br />
para su análisis.<br />
De <strong>la</strong>s estaciones consi<strong>de</strong>radas en el presente estudio, mediante este análisis resulta que no<br />
existe un pe<strong>río</strong>do dudoso significativo en <strong>la</strong> serie <strong>de</strong> <strong>la</strong>s precipitaciones mensuales y<br />
anuales, tal como se muestra en los hidrogramas correspondientes.<br />
Precipitación (mm)<br />
Precipitación (mm)<br />
Precipitación (mm)<br />
Precipitación (mm)<br />
350<br />
300<br />
250<br />
200<br />
150<br />
100<br />
50<br />
0<br />
350<br />
300<br />
250<br />
200<br />
150<br />
100<br />
50<br />
0<br />
450<br />
400<br />
350<br />
300<br />
250<br />
200<br />
150<br />
100<br />
50<br />
0<br />
300<br />
250<br />
200<br />
150<br />
100<br />
50<br />
0<br />
1956<br />
1958<br />
1956<br />
1958<br />
1956<br />
1958<br />
1956<br />
1958<br />
1960<br />
1962<br />
1960<br />
1962<br />
1960<br />
1962<br />
1960<br />
1962<br />
Figura Nº 5.1 Hidrograma <strong>de</strong> precipitación total mensual y anual histórica - Grupo Nº 1<br />
1964<br />
1966<br />
1964<br />
1966<br />
1964<br />
1966<br />
1964<br />
1966<br />
Precipitacón total mensual - Serie histórica<br />
Estación Arapa<br />
1968<br />
1970<br />
1972<br />
1974<br />
1976<br />
1978<br />
1980<br />
1982<br />
1984<br />
1986<br />
Tiempo (mes)<br />
1988<br />
1990<br />
1992<br />
1994<br />
Precipitacón total mensual - Serie histórica<br />
Estación Huancané<br />
1968<br />
1970<br />
1972<br />
1974<br />
1976<br />
1978<br />
1980<br />
1982<br />
1984<br />
1986<br />
TIiempo (mes)<br />
1988<br />
1990<br />
1992<br />
1994<br />
Precipitacón total mensual - Serie histórica<br />
Estación Huaraya Moho<br />
1968<br />
1970<br />
1972<br />
1974<br />
1976<br />
1978<br />
1980<br />
1982<br />
1984<br />
1986<br />
TIiempo (mes)<br />
1988<br />
1990<br />
1992<br />
1994<br />
Precipitacón total mensual - Serie histórica<br />
Estación Taraco<br />
1968<br />
1970<br />
1972<br />
1974<br />
1976<br />
1978<br />
1980<br />
1982<br />
1984<br />
1986<br />
TIiempo (mes)<br />
1988<br />
1990<br />
1992<br />
1994<br />
1996<br />
1998<br />
1996<br />
1998<br />
1996<br />
1998<br />
1996<br />
1998<br />
2000<br />
2002<br />
2000<br />
2002<br />
2000<br />
2002<br />
2000<br />
2002<br />
2004<br />
2006<br />
2004<br />
2006<br />
2004<br />
2006<br />
2004<br />
2006<br />
<strong>2008</strong><br />
<strong>2008</strong><br />
<strong>2008</strong><br />
<strong>2008</strong><br />
MINAG-ANA-DCPRH-AGUAS SUPERFICIALES Pág.155<br />
Precipitación (mm)<br />
Precipitación (mm)<br />
Precipitación (mm)<br />
Precipitación (mm)<br />
1400<br />
1200<br />
1000<br />
800<br />
600<br />
400<br />
200<br />
1400<br />
1200<br />
1000<br />
800<br />
600<br />
400<br />
200<br />
0<br />
1600<br />
1400<br />
1200<br />
1000<br />
800<br />
600<br />
400<br />
200<br />
0<br />
1600<br />
1400<br />
1200<br />
1000<br />
800<br />
600<br />
400<br />
200<br />
0<br />
0<br />
Precipitación total anual - Serie histórica<br />
Estación Arapa<br />
1955 1960 1965 1970 1975 1980 1985 1990 1995 2000 2005 2010<br />
Tiempo (año)<br />
Precipitación total anual - Serie histórica<br />
Estación Huancané<br />
1955 1960 1965 1970 1975 1980 1985 1990 1995 2000 2005 2010<br />
Tiempo (año)<br />
Precipitación total anual - Serie histórica<br />
Estación Huaraya Moho<br />
1955 1960 1965 1970 1975 1980 1985 1990 1995 2000 2005 2010<br />
Tiempo (año)<br />
Precipitación total anual - Serie histórica<br />
Estación Taraco<br />
1955 1960 1965 1970 1975 1980 1985 1990 1995 2000 2005 2010<br />
Tiempo (año)
Precipitación (mm)<br />
Precipitación (mm)<br />
Precipitación (mm)<br />
Precipitación (mm)<br />
Precipitación (mm)<br />
<strong>Estudio</strong> <strong>Hidrológico</strong> <strong>de</strong> <strong>la</strong>s <strong>Cuenca</strong>s Huancané y Suches 2010<br />
350<br />
300<br />
250<br />
200<br />
150<br />
100<br />
50<br />
0<br />
400<br />
350<br />
300<br />
250<br />
200<br />
150<br />
100<br />
50<br />
0<br />
300<br />
250<br />
200<br />
150<br />
100<br />
50<br />
0<br />
350<br />
300<br />
250<br />
200<br />
150<br />
100<br />
50<br />
0<br />
300<br />
250<br />
200<br />
150<br />
100<br />
50<br />
0<br />
1956<br />
1958<br />
1956<br />
1958<br />
1956<br />
1958<br />
1956<br />
1958<br />
1956<br />
1958<br />
1960<br />
1962<br />
1960<br />
1962<br />
1960<br />
1962<br />
1960<br />
1962<br />
1960<br />
1962<br />
Figura Nº 5.2 Hidrograma <strong>de</strong> precipitación total mensual y anual histórica - Grupo Nº 2<br />
1964<br />
1966<br />
1964<br />
1966<br />
1964<br />
1966<br />
1964<br />
1966<br />
Precipitacón total mensual - Serie histórica<br />
Estación Azángaro<br />
1968<br />
1970<br />
1968<br />
1970<br />
1972<br />
1974<br />
1972<br />
1974<br />
1976<br />
1978<br />
1976<br />
1978<br />
1980<br />
1982<br />
1984<br />
1986<br />
Tiempo (mes)<br />
1980<br />
1982<br />
1984<br />
1986<br />
1988<br />
1990<br />
1988<br />
1990<br />
1992<br />
1994<br />
Precipitacón total mensual - Serie histórica<br />
Estación Muñani<br />
TIiempo (mes)<br />
1992<br />
1994<br />
Precipitacón total mensual - Serie histórica<br />
Estación Progreso<br />
1968<br />
1970<br />
1972<br />
1974<br />
1976<br />
1978<br />
1980<br />
1982<br />
1984<br />
1986<br />
TIiempo (mes)<br />
1988<br />
1990<br />
1992<br />
1994<br />
Precipitacón total mensual - Serie histórica<br />
Estación Putina<br />
1968<br />
1970<br />
1972<br />
1974<br />
1976<br />
1978<br />
1980<br />
1982<br />
1984<br />
1986<br />
TIiempo (mes)<br />
1988<br />
1990<br />
1992<br />
1994<br />
1996<br />
1998<br />
1996<br />
1998<br />
1996<br />
1998<br />
1996<br />
1998<br />
2000<br />
2002<br />
2000<br />
2002<br />
2000<br />
2002<br />
2000<br />
2002<br />
2004<br />
2006<br />
2004<br />
2006<br />
2004<br />
2006<br />
2004<br />
2006<br />
<strong>2008</strong><br />
<strong>2008</strong><br />
<strong>2008</strong><br />
<strong>2008</strong><br />
MINAG-ANA-DCPRH-AGUAS SUPERFICIALES Pág.156<br />
Precipitación (mm)<br />
Precipitación (mm)<br />
Precipitación (mm)<br />
Precipitación (mm)<br />
1400<br />
1200<br />
1000<br />
800<br />
600<br />
400<br />
200<br />
1400<br />
1200<br />
1000<br />
800<br />
600<br />
400<br />
200<br />
0<br />
1400<br />
1200<br />
1000<br />
800<br />
600<br />
400<br />
200<br />
0<br />
1400<br />
1200<br />
1000<br />
800<br />
600<br />
400<br />
200<br />
0<br />
0<br />
Precipitación total anual - Serie histórica<br />
Estación Azángaro<br />
1955 1960 1965 1970 1975 1980 1985 1990 1995 2000 2005 2010<br />
Tiempo (año)<br />
Precipitación total anual - Serie histórica<br />
Estación Muñani<br />
1955 1960 1965 1970 1975 1980 1985 1990 1995 2000 2005 2010<br />
Tiempo (año)<br />
Precipitación total anual - Serie histórica<br />
Estación Progreso<br />
1955 1960 1965 1970 1975 1980 1985 1990 1995 2000 2005 2010<br />
Tiempo (año)<br />
Precipitación total anual - Serie histórica<br />
Estación Putina<br />
1955 1960 1965 1970 1975 1980 1985 1990 1995 2000 2005 2010<br />
Tiempo (año)<br />
Figura Nº 5.3 Hidrograma <strong>de</strong> precipitación total mensual y anual histórica - Grupo Nº 3<br />
1964<br />
1966<br />
Precipitacón total mensual - Serie histórica<br />
Estación Ananea<br />
1968<br />
1970<br />
1972<br />
1974<br />
1976<br />
1978<br />
1980<br />
1982<br />
1984<br />
1986<br />
Tiempo (mes)<br />
1988<br />
1990<br />
1992<br />
1994<br />
1996<br />
1998<br />
2000<br />
2002<br />
2004<br />
2006<br />
<strong>2008</strong><br />
Precipitación (mm)<br />
1400<br />
1200<br />
1000<br />
800<br />
600<br />
400<br />
200<br />
0<br />
Precipitación total anual - Serie histórica<br />
Estación Ananea<br />
1955 1960 1965 1970 1975 1980 1985 1990 1995 2000 2005 2010<br />
Tiempo (año)
Precipitación (mm)<br />
Precipitación (mm)<br />
Precipitación (mm)<br />
Precipitación (mm)<br />
Precipitación (mm)<br />
<strong>Estudio</strong> <strong>Hidrológico</strong> <strong>de</strong> <strong>la</strong>s <strong>Cuenca</strong>s Huancané y Suches 2010<br />
400<br />
350<br />
300<br />
250<br />
200<br />
150<br />
100<br />
50<br />
0<br />
450<br />
400<br />
350<br />
300<br />
250<br />
200<br />
150<br />
100<br />
50<br />
0<br />
250<br />
200<br />
150<br />
100<br />
50<br />
0<br />
500<br />
450<br />
400<br />
350<br />
300<br />
250<br />
200<br />
150<br />
100<br />
50<br />
0<br />
450<br />
400<br />
350<br />
300<br />
250<br />
200<br />
150<br />
100<br />
50<br />
0<br />
1956<br />
1958<br />
1956<br />
1958<br />
1956<br />
1958<br />
1956<br />
1958<br />
1956<br />
1958<br />
1960<br />
1962<br />
1960<br />
1962<br />
1960<br />
1962<br />
1960<br />
1962<br />
1960<br />
1962<br />
1964<br />
1966<br />
1964<br />
1966<br />
1964<br />
1966<br />
Precipitacón total mensual - Serie histórica<br />
Estación Cojata<br />
1968<br />
1970<br />
1968<br />
1970<br />
1972<br />
1974<br />
1972<br />
1974<br />
1976<br />
1978<br />
1976<br />
1978<br />
1980<br />
1982<br />
1984<br />
1986<br />
TIiempo (mes)<br />
1980<br />
1982<br />
1984<br />
1986<br />
TIiempo (mes)<br />
1988<br />
1990<br />
1988<br />
1990<br />
1992<br />
1994<br />
Precipitacón total mensual - Serie histórica<br />
Estación Crucero<br />
1992<br />
1994<br />
Precipitacón total mensual - Serie histórica<br />
Estación Suches<br />
1968<br />
1970<br />
1972<br />
1974<br />
1976<br />
1978<br />
1980<br />
1982<br />
1984<br />
1986<br />
TIiempo (mes)<br />
1988<br />
1990<br />
1992<br />
1994<br />
1996<br />
1998<br />
1996<br />
1998<br />
1996<br />
1998<br />
2000<br />
2002<br />
2000<br />
2002<br />
2000<br />
2002<br />
2004<br />
2006<br />
2004<br />
2006<br />
2004<br />
2006<br />
<strong>2008</strong><br />
<strong>2008</strong><br />
<strong>2008</strong><br />
MINAG-ANA-DCPRH-AGUAS SUPERFICIALES Pág.157<br />
Precipitación (mm)<br />
Precipitación (mm)<br />
Precipitación (mm)<br />
1600<br />
1400<br />
1200<br />
1000<br />
800<br />
600<br />
400<br />
200<br />
0<br />
2000<br />
1750<br />
1500<br />
1250<br />
1000<br />
750<br />
500<br />
250<br />
0<br />
1400<br />
1200<br />
1000<br />
800<br />
600<br />
400<br />
200<br />
0<br />
Precipitación total anual - Serie histórica<br />
Estación Cojata<br />
1955 1960 1965 1970 1975 1980 1985 1990 1995 2000 2005 2010<br />
Tiempo (año)<br />
Precipitación total anual - Serie histórica<br />
Estación Crucero<br />
1955 1960 1965 1970 1975 1980 1985 1990 1995 2000 2005 2010<br />
Tiempo (año)<br />
Precipitación total anual - Serie histórica<br />
Estación Suches<br />
1955 1960 1965 1970 1975 1980 1985 1990 1995 2000 2005 2010<br />
Tiempo (año)<br />
Figura Nº 5.4 Hidrograma <strong>de</strong> precipitación total mensual y anual histórica - Grupo Nº 4<br />
1964<br />
1966<br />
1964<br />
1966<br />
Precipitacón total mensual - Serie histórica<br />
Estación Conima<br />
1968<br />
1970<br />
1972<br />
1974<br />
1976<br />
1978<br />
1980<br />
1982<br />
1984<br />
1986<br />
Tiempo (mes)<br />
1988<br />
1990<br />
1992<br />
1994<br />
Precipitacón total mensual - Serie histórica<br />
Estación Puerto Acosta<br />
1968<br />
1970<br />
1972<br />
1974<br />
1976<br />
1978<br />
1980<br />
1982<br />
1984<br />
1986<br />
TIiempo (mes)<br />
1988<br />
1990<br />
1992<br />
1994<br />
1996<br />
1998<br />
1996<br />
1998<br />
2000<br />
2002<br />
2000<br />
2002<br />
2004<br />
2006<br />
2004<br />
2006<br />
<strong>2008</strong><br />
<strong>2008</strong><br />
Precipitación (mm)<br />
Precipitación (mm)<br />
1800<br />
1600<br />
1400<br />
1200<br />
1000<br />
800<br />
600<br />
400<br />
200<br />
1600<br />
1400<br />
1200<br />
1000<br />
800<br />
600<br />
400<br />
200<br />
0<br />
0<br />
Precipitación total anual - Serie histórica<br />
Estación Conima<br />
1955 1960 1965 1970 1975 1980 1985 1990 1995 2000 2005 2010<br />
Tiempo (año)<br />
Precipitación total anual - Serie histórica<br />
Estación Puerto Acosta<br />
1955 1960 1965 1970 1975 1980 1985 1990 1995 2000 2005 2010<br />
Tiempo (año)
Precipitación (mm)<br />
Precipitación (mm)<br />
<strong>Estudio</strong> <strong>Hidrológico</strong> <strong>de</strong> <strong>la</strong>s <strong>Cuenca</strong>s Huancané y Suches 2010<br />
400<br />
350<br />
300<br />
250<br />
200<br />
150<br />
100<br />
50<br />
0<br />
600<br />
500<br />
400<br />
300<br />
200<br />
100<br />
0<br />
1956<br />
1958<br />
1956<br />
1958<br />
1960<br />
1962<br />
1960<br />
1962<br />
1964<br />
1966<br />
1964<br />
1966<br />
Precipitacón total mensual - Serie histórica<br />
Estación Escoma<br />
1968<br />
1970<br />
1972<br />
1974<br />
1976<br />
1978<br />
1980<br />
1982<br />
1984<br />
1986<br />
TIiempo (mes)<br />
1988<br />
1990<br />
1992<br />
1994<br />
Precipitacón total mensual - Serie histórica<br />
Estación Chahuaya<br />
1968<br />
1970<br />
1972<br />
1974<br />
1976<br />
1978<br />
1980<br />
1982<br />
1984<br />
1986<br />
TIiempo (mes)<br />
1988<br />
1990<br />
B.- Análisis <strong>de</strong> doble masa<br />
1992<br />
1994<br />
1996<br />
1998<br />
1996<br />
1998<br />
2000<br />
2002<br />
2000<br />
2002<br />
2004<br />
2006<br />
2004<br />
2006<br />
<strong>2008</strong><br />
<strong>2008</strong><br />
MINAG-ANA-DCPRH-AGUAS SUPERFICIALES Pág.158<br />
Precipitación (mm)<br />
Precipitación (mm)<br />
2000<br />
1750<br />
1500<br />
1250<br />
1000<br />
750<br />
500<br />
250<br />
0<br />
1400<br />
1200<br />
1000<br />
800<br />
600<br />
400<br />
200<br />
0<br />
Precipitación total anual - Serie histórica<br />
Estación Escoma<br />
1955 1960 1965 1970 1975 1980 1985 1990 1995 2000 2005 2010<br />
Tiempo (año)<br />
Precipitación total anual - Serie histórica<br />
Estación Chahuaya<br />
1955 1960 1965 1970 1975 1980 1985 1990 1995 2000 2005 2010<br />
Tiempo (año)<br />
Después <strong>de</strong> haber analizado los hidrogramas <strong>de</strong> <strong>la</strong>s series respectivas se realiza el análisis<br />
<strong>de</strong> doble masa. El diagrama <strong>de</strong> doble masa se obtiene ploteando en el eje <strong>de</strong> <strong>la</strong>s abscisas el<br />
volumen anual promedio acumu<strong>la</strong>do <strong>de</strong> <strong>la</strong> variable pluviométrica <strong>de</strong> <strong>la</strong>s estaciones en<br />
unida<strong>de</strong>s respectivas y en el eje <strong>de</strong> <strong>la</strong>s or<strong>de</strong>nadas los volúmenes anuales acumu<strong>la</strong>dos <strong>de</strong> <strong>la</strong><br />
variable pluviométrica en unida<strong>de</strong>s correspondientes <strong>de</strong> cada una <strong>de</strong> <strong>la</strong>s estaciones<br />
consi<strong>de</strong>radas en el estudio. De los gráficos <strong>de</strong> doble masa se selecciona una estación más<br />
confiable, <strong>la</strong> que presenta el menor número <strong>de</strong> quiebres, <strong>la</strong> cual se usará como estación<br />
base para el análisis <strong>de</strong> otras estaciones. En este análisis, los errores producidos por los<br />
fenómenos naturales y sistemáticos son <strong>de</strong>tectados mediante los “quiebres” que se<br />
presentan en los diagramas y permite <strong>de</strong>terminar el rango <strong>de</strong> los pe<strong>río</strong>dos dudosos y<br />
confiables para cada estación en estudio, <strong>la</strong> cual se <strong>de</strong>be corregirse utilizando ciertos<br />
criterios estadísticos.<br />
En este caso, para el análisis <strong>de</strong> doble masa se ha formado cuatro (4) grupos <strong>de</strong> estaciones<br />
meteorológicas, con el fin obtener una comparación a<strong>de</strong>cuada <strong>de</strong> <strong>la</strong>s series <strong>de</strong><br />
precipitaciones anuales, los cuadros y gráficos <strong>de</strong> análisis se muestran a continuación.<br />
Grupo Nº 1: Mediante el análisis <strong>de</strong> doble masa (ver Figura Nº 5.5-a), <strong>la</strong> estación<br />
Huaraya-Moho es seleccionada como <strong>la</strong> estación base. La comparación <strong>de</strong> <strong>la</strong> serie <strong>de</strong><br />
precipitaciones anuales <strong>de</strong> <strong>la</strong>s estaciones Huancané, Arapa y Taraco con <strong>la</strong> estación base,<br />
no muestran quiebres significativos, <strong>la</strong>s curvas <strong>de</strong> doble masa tien<strong>de</strong>n mantenerse <strong>la</strong><br />
pendiente que muestra cada curva (ver Figura Nº 5.5-b). Aunque muestran pequeños<br />
quiebres en el análisis <strong>de</strong> doble masa, dichos quiebres serán evaluadas en el análisis<br />
estadístico.<br />
Los posibles pe<strong>río</strong>dos como dudosos y confiables <strong>de</strong> cada serie meteorológica <strong>de</strong> <strong>la</strong>s<br />
estaciones en estudio, se muestran posteriormente en el análisis estadístico <strong>de</strong> saltos.
<strong>Estudio</strong> <strong>Hidrológico</strong> <strong>de</strong> <strong>la</strong>s <strong>Cuenca</strong>s Huancané y Suches 2010<br />
Cuadro Nº 5.2 Análisis <strong>de</strong> doble masa <strong>de</strong> <strong>la</strong>s precipitaciones anuales (mm) - Grupo Nº 1<br />
m Año<br />
Estaciones<br />
Arapa Huancané Huaraya Moho<br />
Taraco<br />
P Pacumul P Pacumul P Pacumul P Pacumul P Pacumul<br />
1 1964 585.2 585.2 546.2 546.2 836.1 836.1 392.3 392.3 590.0 590.0<br />
2 1965 590.2 1175.4 719.8 1266.0 868.7 1704.8 612.7 1005.0 697.9 1287.9<br />
3 1966 464.9 1640.3 643.2 1909.2 726.7 2431.5 416.1 1421.1 562.7 1850.6<br />
4 1967 637.5 2277.8 545.3 2454.5 895.9 3327.4 496.4 1917.5 643.8 2494.4<br />
5 1968 614.0 2891.8 821.2 3275.7 947.2 4274.6 525.5 2443.0 727.0 3221.4<br />
6 1969 440.5 3332.3 544.5 3820.2 681.7 4956.3 347.4 2790.4 503.5 3724.9<br />
7 1970 734.0 4066.3 702.3 4522.5 901.8 5858.1 527.8 3318.2 716.5 4441.4<br />
8 1971 530.1 4596.4 477.4 4999.9 842.3 6700.4 402.9 3721.1 563.2 5004.6<br />
9 1972 757.0 5353.4 625.1 5625.0 708.9 7409.3 567.9 4289.0 664.7 5669.3<br />
10 1973 777.9 6131.3 645.9 6270.9 926.2 8335.5 563.7 4852.7 728.4 6397.7<br />
11 1974 744.6 6875.9 593.5 6864.4 926.3 9261.8 630.1 5482.8 723.6 7121.3<br />
12 1975 546.4 7422.3 717.7 7582.1 1030.9 10292.7 577.7 6060.5 718.2 7839.5<br />
13 1976 524.4 7946.7 358.6 7940.7 820.1 11112.8 406.2 6466.7 527.3 8366.8<br />
14 1977 711.0 8657.7 550.3 8491.0 881.7 11994.5 647.5 7114.2 697.6 9064.4<br />
15 1978 778.2 9435.9 950.7 9441.7 1041.1 13035.6 684.7 7798.9 863.7 9928.1<br />
16 1979 813.1 10249.0 665.3 10107.0 1094.3 14129.9 609.5 8408.4 795.6 10723.7<br />
17 1980 898.4 11147.4 714.8 10821.8 860.7 14990.6 466.3 8874.7 735.1 11458.8<br />
18 1981 1029.4 12176.8 956.0 11777.8 1064.4 16055.0 748.3 9623.0 949.5 12408.3<br />
19 1982 766.2 12943.0 602.8 12380.6 870.7 16925.7 578.6 10201.6 704.6 13112.9<br />
20 1983 434.0 13377.0 392.9 12773.5 607.3 17533.0 355.9 10557.5 447.5 13560.4<br />
21 1984 1001.3 14378.3 660.5 13434.0 1274.3 18807.3 1049.8 11607.3 996.5 14556.9<br />
22 1985 1069.7 15448.0 952.3 14386.3 1383.4 20190.7 1269.8 12877.1 1168.8 15725.7<br />
23 1986 1132.4 16580.4 879.4 15265.7 1104.4 21295.1 1098.5 13975.6 1053.7 16779.4<br />
24 1987 723.1 17303.5 596.1 15861.8 767.2 22062.3 659.6 14635.2 686.5 17465.9<br />
25 1988 780.6 18084.1 902.0 16763.8 939.9 23002.2 662.7 15297.9 821.3 18287.2<br />
26 1989 514.1 18598.2 660.2 17424.0 556.5 23558.7 465.2 15763.1 549.0 18836.2<br />
27 1990 606.5 19204.7 616.1 18040.1 831.9 24390.6 717.4 16480.5 693.0 19529.2<br />
28 1991 645.7 19850.4 719.0 18759.1 857.8 25248.4 655.3 17135.8 719.5 20248.7<br />
29 1992 514.0 20364.4 616.8 19375.9 720.1 25968.5 542.3 17678.1 598.3 20847.0<br />
30 1993 748.6 21113.0 678.8 20054.7 870.8 26839.3 616.7 18294.8 728.7 21575.7<br />
31 1994 720.4 21833.4 669.0 20723.7 839.0 27678.3 622.4 18917.2 712.7 22288.4<br />
32 1995 585.8 22419.2 522.6 21246.3 698.5 28376.8 653.1 19570.3 615.0 22903.4<br />
33 1996 506.1 22925.3 654.1 21900.4 787.0 29163.8 432.1 20002.4 594.8 23498.2<br />
34 1997 796.0 23721.3 799.1 22699.5 1098.9 30262.7 710.9 20713.3 851.2 24349.4<br />
35 1998 532.0 24253.3 572.1 23271.6 548.1 30810.8 531.1 21244.4 545.8 24895.2<br />
36 1999 565.3 24818.6 592.7 23864.3 731.2 31542.0 544.6 21789.0 608.5 25503.7<br />
37 2000 640.8 25459.4 539.8 24404.1 698.3 32240.3 459.7 22248.7 584.7 26088.4<br />
38 2001 917.3 26376.7 851.1 25255.2 1159.0 33399.3 546.2 22794.9 868.4 26956.8<br />
39 2002 847.8 27224.5 955.7 26210.9 1142.3 34541.6 571.7 23366.6 879.4 27836.2<br />
40 2003 641.0 27865.5 756.7 26967.6 988.8 35530.4 590.0 23956.6 744.1 28580.3<br />
41 2004 740.9 28606.4 697.2 27664.8 671.5 36201.9 593.6 24550.2 675.8 29256.1<br />
42 2005 633.1 29239.5 606.1 28270.9 822.2 37024.1 597.6 25147.8 664.8 29920.9<br />
43 2006 496.4 29735.9 620.7 28891.6 711.4 37735.5 578.4 25726.2 601.7 30522.6<br />
44 2007 630.3 30366.2 698.4 29590.0 770.5 38506.0 534.9 26261.1 658.5 31181.1<br />
45 <strong>2008</strong> 535.8 30902.0 585.4 30175.4 810.4 39316.4 456.8 26717.9 597.1 31778.2<br />
46 2009 583.5 31485.5 433.3 30608.7 587.8 39904.2 460.6 27178.5 516.3 32294.5<br />
(Datos faltantes se completó por corre<strong>la</strong>ción con <strong>la</strong> información <strong>de</strong> <strong>la</strong>s estaciones vecinas, sólo para el análisis <strong>de</strong> doble masa).<br />
Promedio<br />
MINAG-ANA-DCPRH-AGUAS SUPERFICIALES Pág.159
<strong>Estudio</strong> <strong>Hidrológico</strong> <strong>de</strong> <strong>la</strong>s <strong>Cuenca</strong>s Huancané y Suches 2010<br />
Precipitaciones Acumu<strong>la</strong>das <strong>de</strong> <strong>la</strong>s Estaciones (mm)<br />
Precipitaciones Acumu<strong>la</strong>das <strong>de</strong> <strong>la</strong>s Estaciones (mm)<br />
Figura Nº 5.5 Diagrama <strong>de</strong> doble masa <strong>de</strong> <strong>la</strong>s precipitaciones anuales - Grupo Nº 1<br />
a)<br />
40000<br />
35000<br />
30000<br />
25000<br />
20000<br />
15000<br />
10000<br />
5000<br />
0<br />
40000<br />
35000<br />
30000<br />
25000<br />
20000<br />
15000<br />
10000<br />
5000<br />
0<br />
0 5000 10000 15000 20000 25000 30000 35000 40000<br />
Precipitaciones Acumu<strong>la</strong>das <strong>de</strong>l Promedio <strong>de</strong> <strong>la</strong>s Estaciones (mm)<br />
b)<br />
MINAG-ANA-DCPRH-AGUAS SUPERFICIALES Pág.160<br />
Arapa<br />
Huancané<br />
Huaraya Moho<br />
0 5000 10000 15000 20000 25000 30000 35000 40000 45000<br />
Precipitaciones Acumu<strong>la</strong>das <strong>de</strong> <strong>la</strong> Estación Huaraya Moho (mm)<br />
Taraco<br />
Arapa<br />
Huancané<br />
Taraco
<strong>Estudio</strong> <strong>Hidrológico</strong> <strong>de</strong> <strong>la</strong>s <strong>Cuenca</strong>s Huancané y Suches 2010<br />
Grupo Nº 2: Mediante el análisis <strong>de</strong> doble masa (ver Figura Nº 5.6-a), <strong>la</strong> estación<br />
Azángaro es seleccionada como <strong>la</strong> estación base. La comparación <strong>de</strong> <strong>la</strong> serie <strong>de</strong><br />
precipitaciones anuales <strong>de</strong> <strong>la</strong>s estaciones Putina, Muñani y Progreso con <strong>la</strong> estación base,<br />
no muestran quiebres significativos, <strong>la</strong>s curvas <strong>de</strong> doble masa tien<strong>de</strong>n mantenerse <strong>la</strong><br />
pendiente que muestra cada curva (ver Figura Nº 5.6-b). Aunque muestran pequeños<br />
quiebres en el análisis <strong>de</strong> doble masa, dichos quiebres serán evaluadas en el análisis<br />
estadístico. Los posibles pe<strong>río</strong>dos como dudosos y confiables <strong>de</strong> cada serie meteorológica<br />
<strong>de</strong> <strong>la</strong>s estaciones en estudio, se muestran posteriormente en el análisis estadístico <strong>de</strong> saltos.<br />
m Año<br />
Cuadro Nº 5.3 Análisis <strong>de</strong> doble masa <strong>de</strong> <strong>la</strong>s precipitaciones anuales (mm) - Grupo Nº 2<br />
Estaciones<br />
Azángaro Muñani Progreso<br />
Putina<br />
P Pacumul P Pacumul P Pacumul P Pacumul P Pacumul<br />
1 1964 568.4 568.4 520.8 520.8 586.0 586.0 574.0 574.0 562.3 562.3<br />
2 1965 610.9 1179.3 463.4 984.2 687.1 1273.1 797.1 1371.1 639.6 1201.9<br />
3 1966 469.4 1648.7 370.3 1354.5 445.2 1718.3 571.2 1942.3 464.0 1665.9<br />
4 1967 565.0 2213.7 629.5 1984.0 541.0 2259.3 688.0 2630.3 605.9 2271.8<br />
5 1968 492.8 2706.5 585.5 2569.5 555.9 2815.2 659.2 3289.5 573.4 2845.2<br />
6 1969 377.8 3084.3 540.9 3110.4 468.2 3283.4 690.2 3979.7 519.3 3364.5<br />
7 1970 641.5 3725.8 744.4 3854.8 727.3 4010.7 843.6 4823.3 739.2 4103.7<br />
8 1971 510.9 4236.7 596.7 4451.5 537.8 4548.5 586.6 5409.9 558.0 4661.7<br />
9 1972 599.7 4836.4 415.2 4866.7 639.9 5188.4 675.1 6085.0 582.5 5244.2<br />
10 1973 716.8 5553.2 420.8 5287.5 784.2 5972.6 795.3 6880.3 679.3 5923.5<br />
11 1974 569.7 6122.9 321.2 5608.7 552.4 6525.0 704.0 7584.3 536.8 6460.3<br />
12 1975 607.9 6730.8 464.3 6073.0 553.3 7078.3 610.8 8195.1 559.1 7019.4<br />
13 1976 512.2 7243.0 1452.1 7525.1 626.7 7705.0 573.4 8768.5 791.1 7810.5<br />
14 1977 565.4 7808.4 640.9 8166.0 598.9 8303.9 645.5 9414.0 612.7 8423.2<br />
15 1978 812.8 8621.2 973.4 9139.4 823.8 9127.7 723.4 10137.4 833.4 9256.6<br />
16 1979 497.9 9119.1 709.4 9848.8 583.6 9711.3 772.5 10909.9 640.9 9897.5<br />
17 1980 473.7 9592.8 512.2 10361.0 498.9 10210.2 577.1 11487.0 515.5 10413.0<br />
18 1981 623.8 10216.6 731.8 11092.8 698.7 10908.9 794.5 12281.5 712.2 11125.2<br />
19 1982 665.9 10882.5 581.8 11674.6 588.7 11497.6 824.2 13105.7 665.2 11790.4<br />
20 1983 431.5 11314.0 399.9 12074.5 355.1 11852.7 466.7 13572.4 413.3 12203.7<br />
21 1984 821.7 12135.7 973.3 13047.8 676.4 12529.1 967.1 14539.5 859.6 13063.3<br />
22 1985 846.2 12981.9 880.2 13928.0 641.9 13171.0 866.5 15406.0 808.7 13872.0<br />
23 1986 669.5 13651.4 768.9 14696.9 796.9 13967.9 804.4 16210.4 759.9 14631.9<br />
24 1987 620.8 14272.2 621.5 15318.4 677.9 14645.8 489.2 16699.6 602.4 15234.3<br />
25 1988 569.9 14842.1 589.4 15907.8 569.5 15215.3 699.4 17399.0 607.1 15841.4<br />
26 1989 612.4 15454.5 643.5 16551.3 687.1 15902.4 658.8 18057.8 650.5 16491.9<br />
27 1990 537.2 15991.7 522.9 17074.2 493.1 16395.5 723.3 18781.1 569.1 17061.0<br />
28 1991 581.7 16573.4 710.0 17784.2 565.8 16961.3 731.2 19512.3 647.2 17708.2<br />
29 1992 617.9 17191.3 583.6 18367.8 473.3 17434.6 610.8 20123.1 571.4 18279.6<br />
30 1993 742.2 17933.5 632.2 19000.0 912.2 18346.8 777.0 20900.1 765.9 19045.5<br />
31 1994 640.6 18574.1 591.9 19591.9 658.8 19005.6 985.9 21886.0 719.3 19764.8<br />
32 1995 460.1 19034.2 587.6 20179.5 469.9 19475.5 556.4 22442.4 518.5 20283.3<br />
33 1996 538.3 19572.5 558.5 20738.0 555.6 20031.1 641.6 23084.0 573.5 20856.8<br />
34 1997 795.9 20368.4 728.3 21466.3 812.6 20843.7 869.1 23953.1 801.5 21658.3<br />
35 1998 441.6 20810.0 467.6 21933.9 475.4 21319.1 552.0 24505.1 484.2 22142.5<br />
36 1999 514.3 21324.3 520.3 22454.2 581.2 21900.3 585.6 25090.7 550.4 22692.9<br />
37 2000 527.6 21851.9 614.5 23068.7 615.3 22515.6 693.0 25783.7 612.6 23305.5<br />
38 2001 777.0 22628.9 737.3 23806.0 636.9 23152.5 887.2 26670.9 759.6 24065.1<br />
39 2002 970.3 23599.2 686.3 24492.3 885.8 24038.3 760.4 27431.3 825.7 24890.8<br />
40 2003 630.5 24229.7 794.8 25287.1 640.5 24678.8 728.1 28159.4 698.5 25589.3<br />
41 2004 611.7 24841.4 913.6 26200.7 774.2 25453.0 660.6 28820.0 740.0 26329.3<br />
42 2005 524.9 25366.3 721.3 26922.0 576.2 26029.2 473.9 29293.9 574.1 26903.4<br />
43 2006 525.3 25891.6 714.4 27636.4 537.4 26566.6 541.6 29835.5 579.7 27483.1<br />
44 2007 634.7 26526.3 461.1 28097.5 584.9 27151.5 586.4 30421.9 566.8 28049.9<br />
45 <strong>2008</strong> 538.0 27064.3 515.3 28612.8 505.8 27657.3 549.1 30971.0 527.1 28577.0<br />
46 2009 551.0 27615.3 445.2 29058.0 533.4 28190.7 486.9 31457.9 504.1 29081.1<br />
(Datos faltantes se completó por corre<strong>la</strong>ción con <strong>la</strong> información <strong>de</strong> <strong>la</strong>s estaciones vecinas, sólo para el análisis <strong>de</strong> doble masa).<br />
Promedio<br />
MINAG-ANA-DCPRH-AGUAS SUPERFICIALES Pág.161
<strong>Estudio</strong> <strong>Hidrológico</strong> <strong>de</strong> <strong>la</strong>s <strong>Cuenca</strong>s Huancané y Suches 2010<br />
Precipitaciones Acumu<strong>la</strong>das <strong>de</strong> <strong>la</strong>s Estaciones (mm)<br />
Precipitaciones Acumu<strong>la</strong>das <strong>de</strong> <strong>la</strong>s Estaciones (mm)<br />
Figura Nº 5.6 Diagrama <strong>de</strong> doble masa <strong>de</strong> <strong>la</strong>s precipitaciones anuales - Grupo Nº 2<br />
a)<br />
35000<br />
30000<br />
25000<br />
20000<br />
15000<br />
10000<br />
5000<br />
0<br />
35000<br />
30000<br />
25000<br />
20000<br />
15000<br />
10000<br />
5000<br />
0<br />
0 5000 10000 15000 20000 25000 30000 35000<br />
Precipitaciones Acumu<strong>la</strong>das <strong>de</strong>l Promedio <strong>de</strong> <strong>la</strong>s Estaciones (mm)<br />
b)<br />
MINAG-ANA-DCPRH-AGUAS SUPERFICIALES Pág.162<br />
Azángaro<br />
Muñani<br />
Progreso<br />
Putina<br />
0 5000 10000 15000 20000 25000 30000 35000<br />
Precipitaciones Acumu<strong>la</strong>das <strong>de</strong> <strong>la</strong> Estación Azángaro (mm)<br />
Muñani<br />
Progreso<br />
Putina
<strong>Estudio</strong> <strong>Hidrológico</strong> <strong>de</strong> <strong>la</strong>s <strong>Cuenca</strong>s Huancané y Suches 2010<br />
Grupo Nº 3: Mediante el análisis <strong>de</strong> doble masa (ver Figura Nº 5.7-a), <strong>la</strong> estación Ananea<br />
es seleccionada como <strong>la</strong> estación base. La comparación <strong>de</strong> <strong>la</strong> serie <strong>de</strong> precipitaciones<br />
anuales <strong>de</strong> <strong>la</strong>s estaciones Cojata, Suches y Crucero con <strong>la</strong> estación base, no muestran<br />
quiebres significativos, <strong>la</strong>s curvas <strong>de</strong> doble masa tien<strong>de</strong>n mantenerse <strong>la</strong> pendiente que<br />
muestra cada curva (ver Figura Nº 5.7-b). Aunque muestran pequeños quiebres en el<br />
análisis <strong>de</strong> doble masa, dichos quiebres serán evaluadas en el análisis estadístico. Los<br />
posibles pe<strong>río</strong>dos como dudosos y confiables <strong>de</strong> cada serie meteorológica <strong>de</strong> <strong>la</strong>s estaciones<br />
en estudio, se muestran posteriormente en el análisis estadístico <strong>de</strong> saltos.<br />
m Año<br />
Cuadro Nº 5.4 Análisis <strong>de</strong> doble masa <strong>de</strong> <strong>la</strong>s precipitaciones anuales (mm) - Grupo Nº 3<br />
Estaciones<br />
Ananea Cojata Crucero<br />
Suches<br />
P Pacumul P Pacumul P Pacumul P Pacumul P Pacumul<br />
1 1964 547.5 547.5 983.6 983.6 527.9 527.9 574.7 574.7 658.4 658.4<br />
2 1965 533.4 1080.9 1064.6 2048.2 604.3 1132.2 541.4 1116.1 685.9 1344.3<br />
3 1966 536.1 1617.0 552.8 2601.0 557.0 1689.2 381.4 1497.5 506.8 1851.1<br />
4 1967 558.0 2175.0 591.8 3192.8 621.4 2310.6 523.0 2020.5 573.6 2424.7<br />
5 1968 538.2 2713.2 500.8 3693.6 593.9 2904.5 343.0 2363.5 494.0 2918.7<br />
6 1969 576.0 3289.2 471.8 4165.4 649.5 3554.0 347.5 2711.0 511.2 3429.9<br />
7 1970 583.7 3872.9 643.7 4809.1 880.8 4434.8 632.2 3343.2 685.1 4115.0<br />
8 1971 641.6 4514.5 588.0 5397.1 987.0 5421.8 465.9 3809.1 670.6 4785.6<br />
9 1972 628.4 5142.9 647.7 6044.8 896.1 6317.9 479.3 4288.4 662.9 5448.5<br />
10 1973 573.0 5715.9 765.6 6810.4 976.0 7293.9 544.3 4832.7 714.7 6163.2<br />
11 1974 622.2 6338.1 684.5 7494.9 1010.0 8303.9 610.7 5443.4 731.9 6895.1<br />
12 1975 673.2 7011.3 684.7 8179.6 881.9 9185.8 531.7 5975.1 692.9 7588.0<br />
13 1976 596.2 7607.5 673.0 8852.6 802.8 9988.6 515.9 6491.0 647.0 8235.0<br />
14 1977 603.0 8210.5 787.3 9639.9 852.6 10841.2 592.2 7083.2 708.8 8943.8<br />
15 1978 672.2 8882.7 909.9 10549.8 1031.0 11872.2 750.8 7834.0 841.0 9784.8<br />
16 1979 693.0 9575.7 622.1 11171.9 1082.7 12954.9 809.4 8643.4 801.8 10586.6<br />
17 1980 605.9 10181.6 756.5 11928.4 790.8 13745.7 468.0 9111.4 655.3 11241.9<br />
18 1981 869.2 11050.8 919.8 12848.2 1149.2 14894.9 694.9 9806.3 908.3 12150.2<br />
19 1982 758.6 11809.4 808.1 13656.3 682.9 15577.8 532.4 10338.7 695.5 12845.7<br />
20 1983 487.3 12296.7 576.2 14232.5 615.9 16193.7 395.5 10734.2 518.7 13364.4<br />
21 1984 861.4 13158.1 1035.7 15268.2 1265.2 17458.9 638.3 11372.5 950.2 14314.6<br />
22 1985 869.0 14027.1 1111.7 16379.9 1215.6 18674.5 730.8 12103.3 981.8 15296.4<br />
23 1986 817.6 14844.7 902.1 17282.0 1422.6 20097.1 732.6 12835.9 968.7 16265.1<br />
24 1987 729.1 15573.8 735.9 18017.9 975.7 21072.8 406.4 13242.3 711.8 16976.9<br />
25 1988 570.0 16143.8 665.0 18682.9 845.0 21917.8 597.0 13839.3 669.3 17646.2<br />
26 1989 623.7 16767.5 508.9 19191.8 794.1 22711.9 404.7 14244.0 582.9 18229.1<br />
27 1990 683.6 17451.1 631.8 19823.6 865.6 23577.5 462.9 14706.9 661.0 18890.1<br />
28 1991 536.7 17987.8 601.7 20425.3 910.3 24487.8 456.7 15163.6 626.4 19516.5<br />
29 1992 532.3 18520.1 683.5 21108.8 1270.7 25758.5 449.2 15612.8 733.9 20250.4<br />
30 1993 662.5 19182.6 634.4 21743.2 821.5 26580.0 587.9 16200.7 676.6 20927.0<br />
31 1994 703.8 19886.4 937.1 22680.3 1389.1 27969.1 656.9 16857.6 921.7 21848.7<br />
32 1995 527.6 20414.0 711.8 23392.1 753.7 28722.8 541.6 17399.2 633.7 22482.4<br />
33 1996 462.7 20876.7 752.5 24144.6 652.0 29374.8 482.4 17881.6 587.4 23069.8<br />
34 1997 610.2 21486.9 825.3 24969.9 990.3 30365.1 601.8 18483.4 756.9 23826.7<br />
35 1998 551.3 22038.2 715.8 25685.7 619.0 30984.1 494.2 18977.6 595.1 24421.8<br />
36 1999 614.1 22652.3 732.5 26418.2 733.7 31717.8 558.8 19536.4 659.8 25081.6<br />
37 2000 586.1 23238.4 719.6 27137.8 500.8 32218.6 523.5 20059.9 582.5 25664.1<br />
38 2001 590.9 23829.3 882.8 28020.6 678.8 32897.4 622.1 20682.0 693.7 26357.8<br />
39 2002 677.3 24506.6 880.7 28901.3 698.2 33595.6 678.4 21360.4 733.7 27091.5<br />
40 2003 675.1 25181.7 809.4 29710.7 650.0 34245.6 590.3 21950.7 681.2 27772.7<br />
41 2004 753.8 25935.5 637.4 30348.1 462.2 34707.8 365.4 22316.1 554.7 28327.4<br />
42 2005 592.4 26527.9 674.0 31022.1 479.7 35187.5 508.0 22824.1 563.5 28890.9<br />
43 2006 668.8 27196.7 617.2 31639.3 560.7 35748.2 491.2 23315.3 584.5 29475.4<br />
44 2007 558.9 27755.6 767.0 32406.3 445.8 36194.0 525.3 23840.6 574.3 30049.7<br />
45 <strong>2008</strong> 613.9 28369.5 527.5 32933.8 513.8 36707.8 515.9 24356.5 542.8 30592.5<br />
46 2009 616.1 28985.6 507.4 33441.2 416.6 37124.4 422.9 24779.4 490.8 31083.3<br />
(Datos faltantes se completó por corre<strong>la</strong>ción con <strong>la</strong> información <strong>de</strong> <strong>la</strong>s estaciones vecinas, sólo para el análisis <strong>de</strong> doble masa).<br />
Promedio<br />
MINAG-ANA-DCPRH-AGUAS SUPERFICIALES Pág.163
<strong>Estudio</strong> <strong>Hidrológico</strong> <strong>de</strong> <strong>la</strong>s <strong>Cuenca</strong>s Huancané y Suches 2010<br />
Precipitaciones Acumu<strong>la</strong>das <strong>de</strong> <strong>la</strong>s Estaciones (mm)<br />
Precipitaciones Acumu<strong>la</strong>das <strong>de</strong> <strong>la</strong>s Estaciones (mm)<br />
Figura Nº 5.7 Diagrama <strong>de</strong> doble masa <strong>de</strong> <strong>la</strong>s precipitaciones anuales - Grupo Nº 3<br />
a)<br />
40000<br />
35000<br />
30000<br />
25000<br />
20000<br />
15000<br />
10000<br />
5000<br />
0<br />
40000<br />
35000<br />
30000<br />
25000<br />
20000<br />
15000<br />
10000<br />
5000<br />
0<br />
0 5000 10000 15000 20000 25000 30000 35000 40000<br />
Precipitaciones Acumu<strong>la</strong>das <strong>de</strong>l Promedio <strong>de</strong> <strong>la</strong>s Estaciones (mm)<br />
b)<br />
MINAG-ANA-DCPRH-AGUAS SUPERFICIALES Pág.164<br />
Ananea<br />
Cojata<br />
Crucero<br />
Suches<br />
0 5000 10000 15000 20000 25000 30000 35000 40000<br />
Precipitaciones Acumu<strong>la</strong>das <strong>de</strong> <strong>la</strong> Estación Ananea (mm)<br />
Cojata<br />
Crucero<br />
Suches
<strong>Estudio</strong> <strong>Hidrológico</strong> <strong>de</strong> <strong>la</strong>s <strong>Cuenca</strong>s Huancané y Suches 2010<br />
Grupo Nº 4: Mediante el análisis <strong>de</strong> doble masa (ver Figura Nº 5.8-a), <strong>la</strong> estación<br />
Huaraya-Moho es seleccionada como <strong>la</strong> estación base. La comparación <strong>de</strong> <strong>la</strong> serie <strong>de</strong><br />
precipitaciones anuales <strong>de</strong> <strong>la</strong>s estaciones Conima, Puerto Acosta, Escoma y Chahuaya con<br />
<strong>la</strong> estación base, no muestran quiebres significativos, <strong>la</strong>s curvas <strong>de</strong> doble masa tien<strong>de</strong>n<br />
mantenerse <strong>la</strong> pendiente que muestra cada curva (ver Figura Nº 5.8-b). Aunque muestran<br />
pequeños quiebres en el análisis <strong>de</strong> doble masa, dichos quiebres serán evaluadas en el<br />
análisis estadístico.<br />
Los posibles pe<strong>río</strong>dos como dudosos y confiables <strong>de</strong> cada serie meteorológica <strong>de</strong> <strong>la</strong>s<br />
estaciones en estudio, se muestran posteriormente en el análisis estadístico <strong>de</strong> saltos.<br />
m Año<br />
Cuadro Nº 5.5 Análisis <strong>de</strong> doble masa <strong>de</strong> <strong>la</strong>s precipitaciones anuales (mm) - Grupo Nº 4<br />
Conima Puerto Acosta<br />
Estaciones<br />
Escoma Chahuaya Huaraya Moho<br />
P Pacumul P Pacumul P Pacumul P Pacumul P Pacumul P Pacumul<br />
1 1959 739.5 739.5 794.1 794.1 309.6 309.6 666.2 666.2 993.0 993.0 700.5 700.5<br />
2 1960 630.0 1369.5 664.2 1458.3 418.6 728.2 563.4 1229.6 896.5 1889.5 634.5 1335.0<br />
3 1961 863.4 2232.9 764.2 2222.5 643.8 1372.0 479.2 1708.8 1120.2 3009.7 774.2 2109.2<br />
4 1962 1027.3 3260.2 614.5 2837.0 893.0 2265.0 523.9 2232.7 1140.0 4149.7 839.7 2948.9<br />
5 1963 985.4 4245.6 732.3 3569.3 636.0 2901.0 662.4 2895.1 1119.7 5269.4 827.2 3776.1<br />
6 1964 923.2 5168.8 606.0 4175.3 511.0 3412.0 596.5 3491.6 836.1 6105.5 694.6 4470.7<br />
7 1965 857.0 6025.8 766.7 4942.0 432.0 3844.0 465.6 3957.2 868.7 6974.2 678.0 5148.7<br />
8 1966 940.1 6965.9 813.0 5755.0 162.0 4006.0 781.5 4738.7 726.7 7700.9 684.7 5833.4<br />
9 1967 795.3 7761.2 610.2 6365.2 520.0 4526.0 715.1 5453.8 895.9 8596.8 707.3 6540.7<br />
10 1968 999.4 8760.6 956.4 7321.6 584.1 5110.1 793.6 6247.4 947.2 9544.0 856.1 7396.8<br />
11 1969 707.0 9467.6 500.2 7821.8 705.3 5815.4 422.0 6669.4 681.7 10225.7 603.2 8000.0<br />
12 1970 1059.6 10527.2 920.2 8742.0 522.1 6337.5 802.7 7472.1 901.8 11127.5 841.3 8841.3<br />
13 1971 800.0 11327.2 553.9 9295.9 620.4 6957.9 798.1 8270.2 842.3 11969.8 722.9 9564.2<br />
14 1972 962.0 12289.2 935.5 10231.4 456.2 7414.1 452.8 8723.0 708.9 12678.7 703.1 10267.3<br />
15 1973 942.9 13232.1 1185.6 11417.0 387.6 7801.7 673.9 9396.9 926.2 13604.9 823.2 11090.5<br />
16 1974 1072.8 14304.9 1291.5 12708.5 412.9 8214.6 827.5 10224.4 926.3 14531.2 906.2 11996.7<br />
17 1975 1118.9 15423.8 842.2 13550.7 476.9 8691.5 752.2 10976.6 1030.9 15562.1 844.2 12840.9<br />
18 1976 702.0 16125.8 576.8 14127.5 504.0 9195.5 480.6 11457.2 820.1 16382.2 616.7 13457.6<br />
19 1977 1069.9 17195.7 842.9 14970.4 476.1 9671.6 805.8 12263.0 881.7 17263.9 815.3 14272.9<br />
20 1978 1115.0 18310.7 953.6 15924.0 447.1 10118.7 814.8 13077.8 1041.1 18305.0 874.3 15147.2<br />
21 1979 847.0 19157.7 919.0 16843.0 698.3 10817.0 563.1 13640.9 1094.3 19399.3 824.3 15971.5<br />
22 1980 589.2 19746.9 541.9 17384.9 397.1 11214.1 815.7 14456.6 860.7 20260.0 640.9 16612.4<br />
23 1981 885.4 20632.3 761.5 18146.4 451.4 11665.5 887.4 15344.0 1064.4 21324.4 810.0 17422.4<br />
24 1982 719.7 21352.0 637.6 18784.0 622.4 12287.9 502.6 15846.6 870.7 22195.1 670.6 18093.0<br />
25 1983 391.0 21743.0 563.6 19347.6 582.0 12869.9 341.6 16188.2 607.3 22802.4 497.1 18590.1<br />
26 1984 1712.9 23455.9 1077.8 20425.4 909.1 13779.0 455.9 16644.1 1274.3 24076.7 1086.0 19676.1<br />
27 1985 1409.3 24865.2 969.8 21395.2 595.1 14374.1 1113.0 17757.1 1383.4 25460.1 1094.1 20770.2<br />
28 1986 971.1 25836.3 705.0 22100.2 499.4 14873.5 1664.0 19421.1 1104.4 26564.5 988.8 21759.0<br />
29 1987 808.9 26645.2 542.2 22642.4 516.5 15390.0 536.2 19957.3 767.2 27331.7 634.2 22393.2<br />
30 1988 1044.5 27689.7 844.5 23486.9 497.3 15887.3 690.1 20647.4 939.9 28271.6 803.3 23196.5<br />
31 1989 646.0 28335.7 566.9 24053.8 477.4 16364.7 497.1 21144.5 556.5 28828.1 548.8 23745.3<br />
32 1990 742.1 29077.8 576.4 24630.2 605.5 16970.2 599.4 21743.9 831.9 29660.0 671.1 24416.4<br />
33 1991 484.2 29562.0 537.8 25168.0 348.6 17318.8 518.8 22262.7 857.8 30517.8 549.4 24965.8<br />
34 1992 730.0 30292.0 826.4 25994.4 513.0 17831.8 518.5 22781.2 720.1 31237.9 661.6 25627.4<br />
35 1993 808.3 31100.3 685.2 26679.6 372.9 18204.7 587.0 23368.2 870.8 32108.7 664.8 26292.2<br />
36 1994 717.7 31818.0 478.5 27158.1 426.7 18631.4 393.3 23761.5 839.0 32947.7 571.0 26863.2<br />
37 1995 575.7 32393.7 540.9 27699.0 269.5 18900.9 579.1 24340.6 698.5 33646.2 532.7 27395.9<br />
38 1996 780.7 33174.4 803.5 28502.5 448.6 19349.5 525.7 24866.3 787.0 34433.2 669.1 28065.0<br />
39 1997 976.8 34151.2 683.1 29185.6 618.2 19967.7 732.1 25598.4 1098.9 35532.1 821.8 28886.8<br />
(Datos faltantes se completó por corre<strong>la</strong>ción con <strong>la</strong> información <strong>de</strong> <strong>la</strong>s estaciones vecinas, sólo para el análisis <strong>de</strong> doble masa).<br />
Promedio<br />
MINAG-ANA-DCPRH-AGUAS SUPERFICIALES Pág.165
<strong>Estudio</strong> <strong>Hidrológico</strong> <strong>de</strong> <strong>la</strong>s <strong>Cuenca</strong>s Huancané y Suches 2010<br />
Precipitaciones Acumu<strong>la</strong>das <strong>de</strong> <strong>la</strong>s Estaciones (mm)<br />
Precipitaciones Acumu<strong>la</strong>das <strong>de</strong> <strong>la</strong>s Estaciones (mm)<br />
Figura Nº 5.8 Diagrama <strong>de</strong> doble masa <strong>de</strong> <strong>la</strong>s precipitaciones anuales - Grupo Nº 4<br />
a)<br />
40000<br />
35000<br />
30000<br />
25000<br />
20000<br />
15000<br />
10000<br />
5000<br />
0<br />
40000<br />
35000<br />
30000<br />
25000<br />
20000<br />
15000<br />
10000<br />
5000<br />
0<br />
0 5000 10000 15000 20000 25000 30000 35000 40000<br />
Precipitaciones Acumu<strong>la</strong>das <strong>de</strong>l Promedio <strong>de</strong> <strong>la</strong>s Estaciones (mm)<br />
b)<br />
MINAG-ANA-DCPRH-AGUAS SUPERFICIALES Pág.166<br />
Conima<br />
Puerto Acosta<br />
Escoma<br />
Chahuaya<br />
Huaraya Moho<br />
0 5000 10000 15000 20000 25000 30000 35000 40000<br />
Precipitaciones Acumu<strong>la</strong>das <strong>de</strong> <strong>la</strong> Estación Huaraya Moho (mm)<br />
Conima<br />
Puerto Acosta<br />
Escoma<br />
Chahuaya
<strong>Estudio</strong> <strong>Hidrológico</strong> <strong>de</strong> <strong>la</strong>s <strong>Cuenca</strong>s Huancané y Suches 2010<br />
C.- Análisis estadístico<br />
Análisis <strong>de</strong> Saltos<br />
Después <strong>de</strong> haber analizado los hidrogramas originales y los diagramas <strong>de</strong> doble masa se<br />
obtiene los pe<strong>río</strong>dos <strong>de</strong> posible corrección y los pe<strong>río</strong>dos <strong>de</strong> datos que se mantendrán con<br />
sus valores originales, se proce<strong>de</strong> al análisis estadístico <strong>de</strong> Saltos, en los parámetros como<br />
<strong>la</strong> media y <strong>la</strong> <strong>de</strong>sviación estándar.<br />
La consistencia en <strong>la</strong> media se realiza mediante <strong>la</strong> prueba estadística "T" <strong>de</strong> Stu<strong>de</strong>nts y para<br />
<strong>la</strong> <strong>de</strong>sviación estándar el análisis estadístico consiste en probar, mediante <strong>la</strong> prueba<br />
estadística <strong>de</strong> "F" <strong>de</strong> Fisher. Si los parámetros <strong>la</strong> media y <strong>la</strong> <strong>de</strong>sviación estándar <strong>de</strong> los<br />
pe<strong>río</strong>dos consi<strong>de</strong>rados en el análisis son iguales estadísticamente, entonces no se corrige <strong>la</strong><br />
información <strong>de</strong> lo contrario se <strong>de</strong>be corregirse. Después <strong>de</strong> todo el análisis respectivo <strong>la</strong><br />
información es una serie homogénea, confiable y consistente al 95% <strong>de</strong> probabilidad.<br />
En este caso, según el análisis realizado en forma mensual se obtiene que <strong>la</strong> serie mensual<br />
<strong>de</strong> precipitaciones <strong>de</strong> <strong>la</strong>s estaciones consi<strong>de</strong>radas en el presente estudio no muestran<br />
“Saltos” significativos en los parámetros analizados (media y <strong>de</strong>sviación estándar) en todas<br />
<strong>la</strong>s estaciones consi<strong>de</strong>radas, para su posible corrección, sin embargo no se corrige dichas<br />
informaciones.<br />
A continuación se muestran los cuadros <strong>de</strong>l análisis respectivo.<br />
Arapa<br />
ESTACIÓN<br />
Huancané<br />
Huaraya Moho<br />
Taraco<br />
Progreso<br />
Putina<br />
ESTACIÓN<br />
Azángaro<br />
Muñani<br />
Cuadro Nº 5.6 Análisis <strong>de</strong> saltos <strong>de</strong> <strong>la</strong>s precipitaciones mensuales - Grupo Nº 1<br />
PERÍODO DE<br />
ANÁLISIS<br />
NÚMERO DE DATOS, PROMEDIO<br />
Y DESVIACIÓN ESTÁNDAR<br />
N°<br />
Datos<br />
n1 , PD 1964-1984 251 57.28 58.13 0.3295 1.9643 |Tc| < Tt NO 1.0306 1.2206 Fc < Ft NO<br />
n2 , PC 1985-2009 296 55.65 57.26<br />
n 1 , PD 1964-1983 236 53.29 58.20 -0.7768 1.9643 |Tc| < Tt NO 1.0281 1.2211 Fc < Ft NO<br />
n2 , PC 1984-2009 312 57.16 57.40<br />
n1 , PC 1956-1984 302 77.07 78.56 1.1234 1.9639 |Tc| < Tt NO 1.1709 1.2100 Fc < Ft NO<br />
n2 , PD 1985-2009 298 70.13 72.60<br />
n1 , PD 1963-1984 256 45.95 51.13 -1.3313 1.9643 |Tc| < Tt NO 1.2198 1.2210 Fc < Ft NO<br />
n2 , PC 1985-2009 299 52.08 56.47<br />
CONSISTENCIA EN LA MEDIA<br />
CONSISTENCIA EN LA DESVIACIÓN ESTÁNDAR<br />
T calcu<strong>la</strong>da T tab<strong>la</strong> (95%)<br />
Diferencia F calcu<strong>la</strong>da F tab<strong>la</strong> (95%)<br />
Promedio Desv.Est.<br />
Comparación<br />
Comparación<br />
Tc<br />
Tt<br />
Significativa Fc<br />
Ft<br />
Cuadro Nº 5.7 Análisis <strong>de</strong> saltos <strong>de</strong> <strong>la</strong>s precipitaciones mensuales - Grupo Nº 2<br />
PERÍODO DE<br />
ANÁLISIS<br />
NÚMERO DE DATOS, PROMEDIO<br />
Y DESVIACIÓN ESTÁNDAR<br />
N°<br />
Datos<br />
n1 , PC 1956-1987 301 49.57 50.63 -0.1961 1.9646 |Tc| < Tt NO 1.0740 1.2293 Fc < Ft NO<br />
n2 , PD 1989-2009 215 50.47 52.47<br />
n 1 , PD 1965-1999 409 53.01 60.24 -0.3272 1.9645 |Tc| < Tt NO 1.1284 1.2872 Fc < Ft NO<br />
n2 , PC 2000-2009 120 55.03 56.71<br />
n1 , PC 1964-1984 242 49.58 48.78 -0.6485 1.9645 |Tc| < Tt NO 1.1961 1.2269 Fc < Ft NO<br />
n2 , PD 1985-2009 289 52.48 53.35<br />
n1 , PD 1956-1983 320 56.37 55.66 -0.2162 1.9637 |Tc| < Tt NO 1.0112 1.2038 Fc < Ft NO<br />
n2 , PC 1984-2009 312 57.33 55.97<br />
CONSISTENCIA EN LA MEDIA<br />
T calcu<strong>la</strong>da T tab<strong>la</strong> (95%)<br />
Diferencia F calcu<strong>la</strong>da F tab<strong>la</strong> (95%)<br />
Promedio Desv.Est.<br />
Comparación<br />
Comparación<br />
Tc<br />
Tt<br />
Significativa Fc<br />
Ft<br />
Diferencia<br />
Significativa<br />
CONSISTENCIA EN LA DESVIACIÓN ESTÁNDAR<br />
Diferencia<br />
Significativa<br />
MINAG-ANA-DCPRH-AGUAS SUPERFICIALES Pág.167
<strong>Estudio</strong> <strong>Hidrológico</strong> <strong>de</strong> <strong>la</strong>s <strong>Cuenca</strong>s Huancané y Suches 2010<br />
Ananea<br />
Cojata<br />
Crucero<br />
Suches<br />
ESTACIÓN<br />
ESTACIÓN<br />
Conima<br />
Puerto Acosta<br />
Escoma<br />
Chahuaya<br />
Cuadro Nº 5.8 Análisis <strong>de</strong> saltos <strong>de</strong> <strong>la</strong>s precipitaciones mensuales - Grupo Nº 3<br />
PERÍODO DE<br />
ANÁLISIS<br />
NÚMERO DE DATOS, PROMEDIO<br />
Y DESVIACIÓN ESTÁNDAR<br />
N°<br />
Datos<br />
n1 , PC 1963-1991 315 53.85 47.62 0.6769 1.9645 |Tc| < Tt NO 1.0574 1.2324 Fc < Ft NO<br />
n2 , PD 1992-2009 215 51.03 46.31<br />
n 1 , PC 1956-1983 314 61.59 58.00 0.0066 1.9638 |Tc| < Tt NO 1.0816 1.2057 Fc < Ft NO<br />
n2 , PD 1984-2009 309 61.56 55.77<br />
n1 , PC 1956-1991 425 67.68 67.13 1.6059 1.9637 |Tc| < Tt NO 1.0383 1.2207 Fc < Ft NO<br />
n2 , PD 1992-2009 214 58.70 65.88<br />
n1 , PD 1975-1981 79 51.46 50.12 1.1471 1.9711 |Tc| < Tt NO 1.3190 1.3811 Fc < Ft NO<br />
n2 , PC 1982-1993 138 44.00 43.64<br />
CONSISTENCIA EN LA MEDIA<br />
CONSISTENCIA EN LA DESVIACIÓN ESTÁNDAR<br />
T calcu<strong>la</strong>da T tab<strong>la</strong> (95%)<br />
Diferencia F calcu<strong>la</strong>da F tab<strong>la</strong> (95%)<br />
Promedio Desv.Est.<br />
Comparación<br />
Comparación<br />
Tc<br />
Tt<br />
Significativa Fc<br />
Ft<br />
Cuadro Nº 5.9 Análisis <strong>de</strong> saltos <strong>de</strong> <strong>la</strong>s precipitaciones mensuales - Grupo Nº 4<br />
PERÍODO DE<br />
ANÁLISIS<br />
NÚMERO DE DATOS, PROMEDIO<br />
Y DESVIACIÓN ESTÁNDAR<br />
N°<br />
Datos<br />
n1 , PD 1967-1979 156 78.15 81.00 0.6111 1.9676 |Tc| < Tt NO 1.0665 1.3026 Fc < Ft NO<br />
n2 , PC 1980-1993 158 72.47 83.65<br />
n 1 , PD 1973-1979 126 65.43 64.12 1.3709 1.9690 |Tc| < Tt NO 1.2879 1.3310 Fc < Ft NO<br />
n2 , PC 1980-1997 141 55.31 56.50<br />
n1 , PD 1959-1967 94 31.07 40.66 -1.8896 1.9697 |Tc| < Tt NO 1.0453 1.3506 Fc < Ft NO<br />
n2 , PC 1970-1987 154 40.99 39.77<br />
n1 , PD 1979-1985 67 56.88 71.04 0.0299 1.9772 |Tc| < Tt NO 1.1280 1.4920 Fc < Ft NO<br />
n2 , PC 1986-1992 74 56.51 75.45<br />
Análisis <strong>de</strong> Ten<strong>de</strong>ncias<br />
CONSISTENCIA EN LA MEDIA<br />
T calcu<strong>la</strong>da T tab<strong>la</strong> (95%)<br />
Diferencia F calcu<strong>la</strong>da F tab<strong>la</strong> (95%)<br />
Promedio Desv.Est.<br />
Comparación<br />
Comparación<br />
Tc<br />
Tt<br />
Significativa Fc<br />
Ft<br />
Diferencia<br />
Significativa<br />
CONSISTENCIA EN LA DESVIACIÓN ESTÁNDAR<br />
Diferencia<br />
Significativa<br />
Una vez analizado los Saltos tanto en <strong>la</strong> media y <strong>de</strong>sviación estándar <strong>de</strong> <strong>la</strong> información<br />
pluviométrica se procedió a evaluar <strong>la</strong>s Ten<strong>de</strong>ncias en los dos parámetros <strong>de</strong>terminísticos.<br />
Para saber si <strong>la</strong> ten<strong>de</strong>ncia es significativa o no, se analiza el coeficiente <strong>de</strong> corre<strong>la</strong>ción "R"<br />
mediante <strong>la</strong> prueba estadística <strong>de</strong> T <strong>de</strong> Stu<strong>de</strong>nts. Generalmente <strong>la</strong> ten<strong>de</strong>ncia en <strong>la</strong><br />
<strong>de</strong>sviación se presenta en los datos semanales o mensuales pero no en datos anuales.<br />
En este caso, según el análisis realizado en forma mensual se obtiene que <strong>la</strong> serie mensual<br />
<strong>de</strong> precipitaciones <strong>de</strong> <strong>la</strong>s estaciones consi<strong>de</strong>radas en el presente estudio no muestran<br />
“Ten<strong>de</strong>ncias” significativas en los parámetros analizados (media y <strong>de</strong>sviación estándar) en<br />
todas <strong>la</strong>s estaciones consi<strong>de</strong>radas, para su posible corrección, sin embargo no se corrige<br />
dichas informaciones.<br />
Arapa<br />
Huaraya Moho<br />
Taraco<br />
ESTACIÓN<br />
Huancané<br />
Cuadro Nº 5.10 Análisis <strong>de</strong> ten<strong>de</strong>ncias <strong>de</strong> <strong>la</strong>s precipitaciones mensuales - Grupo Nº 1<br />
MEDIA, DESVEST, COEFICIENTES DE REGRESIÓN Y NÚMERO DE DATOS DE LAS TENDENCIAS EN<br />
LA MEDIA Y EN LA DESVIACIÓN ESTÁNDAR<br />
TENDENCIA EN<br />
LA:<br />
Parámetros<br />
Coeficientes <strong>de</strong> Regresión<br />
Coeficiente <strong>de</strong> Número <strong>de</strong><br />
Corre<strong>la</strong>ción Datos<br />
Media Desv.Est. Am Bm Cm<br />
R<br />
N<br />
ANÁLISIS ESTADÍSTICO DE LA TENDENCIA EN LA<br />
MEDIA Y EN LA DESVIACIÓN ESTÁNDAR<br />
T calcu<strong>la</strong>da<br />
Tc<br />
Estadístico T<br />
T tab<strong>la</strong> (95%)<br />
Tt<br />
Comparación<br />
Media (Tm) 56.40 57.62 57.2768 -0.0032 - -0.0088 547 -0.2054 1.9643 |Tc| < Tt NO<br />
Desv.Est (Ts) 55.45 14.69 54.6822 0.0349 - 0.0298 43 0.1909 2.0181 |Tc| < Tt NO<br />
Media (Tm) 55.49 57.72 54.8312 0.0024 - 0.0067 548 0.1566 1.9643 |Tc| < Tt NO<br />
Desv.Est (Ts) 58.17 12.21 60.1005 -0.0858 - -0.0903 44 -0.5876 2.0167 |Tc| < Tt NO<br />
Media (Tm) 73.62 75.68 81.3729 -0.0258 - -0.0590 600 -1.4453 1.9639 |Tc| < Tt NO<br />
Desv.Est (Ts) 73.84 19.31 76.4524 -0.1244 - -0.0772 41 -0.4836 2.0211 |Tc| < Tt NO<br />
Media (Tm) 49.25 54.11 47.6654 0.0057 - 0.0170 555 0.3998 1.9643 |Tc| < Tt NO<br />
Desv.Est (Ts) 52.38 14.32 50.8643 0.0659 - 0.0604 45 0.3968 2.0154 |Tc| < Tt NO<br />
Ten<strong>de</strong>ncia<br />
Significativa<br />
MINAG-ANA-DCPRH-AGUAS SUPERFICIALES Pág.168
<strong>Estudio</strong> <strong>Hidrológico</strong> <strong>de</strong> <strong>la</strong>s <strong>Cuenca</strong>s Huancané y Suches 2010<br />
Azángaro<br />
Muñani<br />
Progreso<br />
Putina<br />
Ananea<br />
Cojata<br />
Crucero<br />
Suches<br />
Conima<br />
Escoma<br />
ESTACIÓN<br />
ESTACIÓN<br />
ESTACIÓN<br />
Puerto Acosta<br />
Chahuaya<br />
Cuadro Nº 5.11 Análisis <strong>de</strong> ten<strong>de</strong>ncias <strong>de</strong> <strong>la</strong>s precipitaciones mensuales - Grupo Nº 2<br />
MEDIA, DESVEST, COEFICIENTES DE REGRESIÓN Y NÚMERO DE DATOS DE LAS TENDENCIAS EN<br />
LA MEDIA Y EN LA DESVIACIÓN ESTÁNDAR<br />
TENDENCIA EN<br />
LA:<br />
Parámetros<br />
Coeficientes <strong>de</strong> Regresión<br />
Coeficiente <strong>de</strong> Número <strong>de</strong><br />
Corre<strong>la</strong>ción Datos<br />
Media Desv.Est. Am Bm Cm<br />
R<br />
N<br />
ANÁLISIS ESTADÍSTICO DE LA TENDENCIA EN LA<br />
MEDIA Y EN LA DESVIACIÓN ESTÁNDAR<br />
T calcu<strong>la</strong>da<br />
Tc<br />
Estadístico T<br />
T tab<strong>la</strong> (95%)<br />
Tt<br />
Comparación<br />
Media (Tm) 49.95 51.36 49.6657 0.0011 - 0.0032 516 0.0725 1.9646 |Tc| < Tt NO<br />
Desv.Est (Ts) 51.30 11.23 50.1588 0.0634 - 0.0579 35 0.3332 2.0322 |Tc| < Tt NO<br />
Media (Tm) 53.47 59.41 52.6750 0.0030 - 0.0078 529 0.1791 1.9645 |Tc| < Tt NO<br />
Desv.Est (Ts) 53.64 14.39 51.8442 0.0876 - 0.0712 40 0.4400 2.0227 |Tc| < Tt NO<br />
Media (Tm) 51.16 51.29 50.3620 0.0030 - 0.0089 531 0.2047 1.9644 |Tc| < Tt NO<br />
Desv.Est (Ts) 51.43 9.64 47.8390 0.1710 - 0.2125 41 1.3581 2.0211 |Tc| < Tt NO<br />
Media (Tm) 56.84 55.77 59.2454 -0.0076 - -0.0249 632 -0.6252 1.9637 |Tc| < Tt NO<br />
Desv.Est (Ts) 55.91 11.81 59.2604 -0.1396 - -0.1621 47 -1.1020 2.0129 |Tc| < Tt NO<br />
Cuadro Nº 5.12 Análisis <strong>de</strong> ten<strong>de</strong>ncias <strong>de</strong> <strong>la</strong>s precipitaciones mensuales - Grupo Nº 3<br />
MEDIA, DESVEST, COEFICIENTES DE REGRESIÓN Y NÚMERO DE DATOS DE LAS TENDENCIAS EN<br />
LA MEDIA Y EN LA DESVIACIÓN ESTÁNDAR<br />
TENDENCIA EN<br />
LA:<br />
Parámetros<br />
Coeficientes <strong>de</strong> Regresión<br />
Coeficiente <strong>de</strong> Número <strong>de</strong><br />
Corre<strong>la</strong>ción Datos<br />
Media Desv.Est. Am Bm Cm<br />
R<br />
N<br />
T calcu<strong>la</strong>da<br />
Tc<br />
T tab<strong>la</strong> (95%)<br />
Tt<br />
Media (Tm) 52.71 47.07 52.3649 0.0013 - 0.0043 530 0.0988 1.9645 |Tc| < Tt NO<br />
Desv.Est (Ts) 47.77 9.81 47.6948 0.0035 - 0.0044 42 0.0278 2.0195 |Tc| < Tt NO<br />
Media (Tm) 61.57 56.86 64.6276 -0.0098 - -0.0311 623 -0.7754 1.9638 |Tc| < Tt NO<br />
Desv.Est (Ts) 55.34 14.12 53.8406 0.0612 - 0.0607 48 0.4124 2.0117 |Tc| < Tt NO<br />
Media (Tm) 64.67 66.80 64.3820 0.0009 - 0.0026 639 0.0656 1.9637 |Tc| < Tt NO<br />
Desv.Est (Ts) 63.09 22.51 64.0300 -0.0376 - -0.0239 49 -0.1639 2.0106 |Tc| < Tt NO<br />
Media (Tm) 46.71 46.13 54.0130 -0.0670 - -0.0912 217 -1.3429 1.9710 |Tc| < Tt NO<br />
Desv.Est (Ts) 45.69 12.23 51.6630 -0.7964 - -0.2722 14 -0.9799 2.1604 |Tc| < Tt NO<br />
Ten<strong>de</strong>ncia<br />
Significativa<br />
ANÁLISIS ESTADÍSTICO DE LA TENDENCIA EN LA<br />
MEDIA Y EN LA DESVIACIÓN ESTÁNDAR<br />
Estadístico T<br />
Cuadro Nº 5.13 Análisis <strong>de</strong> ten<strong>de</strong>ncias <strong>de</strong> <strong>la</strong>s precipitaciones mensuales - Grupo Nº 4<br />
MEDIA, DESVEST, COEFICIENTES DE REGRESIÓN Y NÚMERO DE DATOS DE LAS TENDENCIAS EN<br />
LA MEDIA Y EN LA DESVIACIÓN ESTÁNDAR<br />
TENDENCIA EN<br />
LA:<br />
Parámetros<br />
Coeficientes <strong>de</strong> Regresión<br />
Coeficiente <strong>de</strong> Número <strong>de</strong><br />
Corre<strong>la</strong>ción Datos<br />
Media Desv.Est. Am Bm Cm<br />
R<br />
N<br />
T calcu<strong>la</strong>da<br />
Tc<br />
Estadístico T<br />
T tab<strong>la</strong> (95%)<br />
Tt<br />
Comparación<br />
Comparación<br />
Media (Tm) 75.29 82.26 80.7553 -0.0347 - -0.0383 314 -0.6770 1.9676 |Tc| < Tt NO<br />
Desv.Est (Ts) 77.82 26.77 84.3700 -0.5240 - -0.1384 24 -0.6555 2.0687 |Tc| < Tt NO<br />
Media (Tm) 58.60 57.96 69.3996 -0.0812 - -0.1074 265 -1.7519 1.9690 |Tc| < Tt NO<br />
Desv.Est (Ts) 67.32 31.79 92.1986 -2.6188 - -0.4399 18 -1.9594 2.1098 |Tc| < Tt NO<br />
Media (Tm) 41.27 51.59 42.7501 -0.0117 - -0.0165 252 -0.2609 1.9695 |Tc| < Tt NO<br />
Desv.Est (Ts) 43.19 12.47 49.7448 -0.9364 - -0.2921 13 -1.0130 2.1788 |Tc| < Tt NO<br />
Media (Tm) 59.97 82.72 72.6756 -0.1777 - -0.0884 142 -1.0501 1.9769 |Tc| < Tt NO<br />
Desv.Est (Ts) 49.36 20.57 62.2725 -2.5825 - -0.3440 9 -0.9693 2.3060 |Tc| < Tt NO<br />
Ten<strong>de</strong>ncia<br />
Significativa<br />
ANÁLISIS ESTADÍSTICO DE LA TENDENCIA EN LA<br />
MEDIA Y EN LA DESVIACIÓN ESTÁNDAR<br />
Ten<strong>de</strong>ncia<br />
Significativa<br />
En general, <strong>de</strong>spués <strong>de</strong> haber evaluado con los tres métodos <strong>de</strong> análisis, <strong>la</strong> información<br />
pluviométrica <strong>de</strong> precipitaciones mensuales históricas consi<strong>de</strong>radas en el presente estudio,<br />
es libre <strong>de</strong> saltos y ten<strong>de</strong>ncias, es serie homogénea, consistente y confiable al 95% <strong>de</strong><br />
probabilidad. Por lo tanto, se pue<strong>de</strong> utilizar para su completación y extensión <strong>de</strong> registros,<br />
y su uso para propósitos múltiples.<br />
MINAG-ANA-DCPRH-AGUAS SUPERFICIALES Pág.169
<strong>Estudio</strong> <strong>Hidrológico</strong> <strong>de</strong> <strong>la</strong>s <strong>Cuenca</strong>s Huancané y Suches 2010<br />
5.4 COMPLETACIÓN Y EXTENSIÓN DE LA INFORMACIÓN PLUVIOMÉTRICA<br />
La completación y extensión <strong>de</strong> <strong>la</strong> información pluviométrica, se realiza con el fin <strong>de</strong><br />
obtener una serie completa y <strong>de</strong> un pe<strong>río</strong>do uniforme.<br />
Para <strong>la</strong> completación y extensión <strong>de</strong> <strong>la</strong> información pluviométrica, se ha utilizado el<br />
software hidrológico <strong>de</strong>nominado Hec-4 Monthly Streamflow Simu<strong>la</strong>tion, <strong>de</strong>sarrol<strong>la</strong>do por<br />
el Hydrologic Engineering Center <strong>de</strong> los Estados Unidos <strong>de</strong> América.<br />
La completación y extensión <strong>de</strong> registros <strong>de</strong> <strong>la</strong> información pluviométrica, se ha<br />
<strong>de</strong>sarrol<strong>la</strong>do utilizando <strong>la</strong> información consistente y confiable obtenida en el análisis<br />
anterior. Los registros <strong>de</strong> precipitaciones mensuales <strong>de</strong> <strong>la</strong>s estaciones consi<strong>de</strong>radas en el<br />
presente estudio, se han completado y extendido <strong>de</strong>l pe<strong>río</strong>do 1956-2009. En los Cuadros<br />
N° 5.14 y 5.15, se muestran <strong>la</strong> información <strong>de</strong>l promedio multimensual y serie anual <strong>de</strong> <strong>la</strong>s<br />
precipitaciones completadas y extendidas.<br />
Cuadro Nº 5.14 Precipitación total mensual (mm) – Promedio multimensual (1956-2009)<br />
Estaciones <strong>de</strong> <strong>la</strong>s cuencas Huancané, Suches y cuencas vecinas<br />
Estación<br />
Altitud<br />
(msnm)<br />
Ene Feb Mar Abr May Jun Jul Ago Sep Oct Nov Dic<br />
Huancané 3840.0 140.4 109.6 102.1 42.6 12.0 4.4 3.6 10.6 30.7 46.9 63.4 111.4 677.7<br />
Putina 3856.0 147.8 105.3 101.5 52.5 13.4 4.9 3.9 8.7 30.6 48.3 73.5 102.8 693.2<br />
Muñani 3948.0 142.3 109.5 90.4 43.8 9.8 3.7 2.4 6.2 25.9 43.1 63.0 104.3 644.4<br />
Huaraya Moho 3832.0 200.2 141.7 120.5 57.8 21.8 8.1 7.0 16.5 46.3 57.8 73.0 134.4 885.1<br />
Cojata 4327.0 145.7 118.2 107.3 57.1 17.3 8.8 6.5 16.9 37.1 57.3 67.8 103.6 743.6<br />
Suches 4655.0 104.2 85.0 89.8 39.9 12.0 3.6 4.3 8.6 28.6 41.3 53.3 70.2 540.8<br />
Ananea 4640.0 122.3 100.0 87.5 44.6 18.5 6.4 11.8 14.9 24.7 45.8 56.5 88.7 621.7<br />
Crucero 4130.0 152.5 135.9 114.4 56.6 18.1 6.7 4.7 11.7 32.6 52.7 78.6 119.0 783.5<br />
Progreso 3940.0 129.3 98.4 99.8 42.5 8.8 1.8 2.6 6.2 20.2 43.2 67.3 94.4 614.5<br />
Azángaro 3848.0 126.2 95.8 90.9 41.8 8.1 3.0 1.9 8.1 25.3 42.1 72.4 93.8 609.4<br />
Arapa 3830.0 146.8 109.8 114.5 52.0 12.7 5.9 3.2 12.2 30.2 49.0 61.3 98.2 695.8<br />
Taraco 3820.0 134.6 99.8 89.5 39.7 6.6 4.7 1.9 8.8 26.1 36.9 51.3 91.4 591.3<br />
Conima 3860.0 207.8 143.6 133.2 70.6 11.2 6.6 8.6 10.8 33.9 50.3 57.4 122.4 856.4<br />
Puerto Acosta 3835.0 146.1 122.9 84.7 52.8 23.2 11.7 8.9 20.4 44.6 50.4 63.1 97.9 726.7<br />
Escoma 3828.0 94.9 80.2 82.5 41.8 23.8 4.0 4.7 9.6 31.5 24.6 30.4 65.6 493.6<br />
Chahuaya 4500.0 163.0 91.2 89.2 37.5 19.0 8.0 10.0 12.4 31.0 34.4 50.2 105.8 651.6<br />
MINAG-ANA-DCPRH-AGUAS SUPERFICIALES Pág.170<br />
Mes<br />
Total<br />
Anual<br />
Figura Nº 5.9 Variación mensual <strong>de</strong> <strong>la</strong> precipitación (mm) – Promedio multimensual (1956-2009)<br />
Estaciones <strong>de</strong> <strong>la</strong>s cuencas Huancané, Suches y cuencas vecinas<br />
Precipitación (mm)<br />
225.0<br />
200.0<br />
175.0<br />
150.0<br />
125.0<br />
100.0<br />
75.0<br />
50.0<br />
25.0<br />
0.0<br />
Ene Feb Mar Abr May Jun Jul Ago Sep Oct Nov Dic<br />
Tiempo (mes)<br />
Huancané<br />
Putina<br />
Muñani<br />
Huaraya Moho<br />
Cojata<br />
Suches<br />
Ananea<br />
Crucero<br />
Progreso<br />
Azángaro<br />
Arapa<br />
Taraco<br />
Conima<br />
Puerto Acosta<br />
Escoma<br />
Chahuaya
<strong>Estudio</strong> <strong>Hidrológico</strong> <strong>de</strong> <strong>la</strong>s <strong>Cuenca</strong>s Huancané y Suches 2010<br />
Cuadro N° 5.15 Serie anual <strong>de</strong> precipitaciones (mm) - Estaciones meteorológicas <strong>de</strong> <strong>la</strong>s cuencas Huancané,<br />
Suches y cuencas vecinas<br />
Año<br />
Huancané<br />
Putina<br />
Muñani<br />
Huaraya Moho<br />
Cojata<br />
Suches<br />
Ananea<br />
Estación Meteorológica<br />
Crucero<br />
1956 652.9 603.0 566.5 893.6 817.4 574.1 544.0 821.8 552.1 575.8 749.5 552.0 944.3 830.8 606.0 722.3<br />
1957 726.2 857.0 569.9 840.5 715.6 551.9 537.9 814.5 622.0 594.7 801.6 612.0 907.2 655.6 510.7 503.6<br />
1958 715.6 745.0 995.4 891.4 660.3 611.7 495.8 659.3 630.3 791.8 681.1 488.8 981.7 672.6 387.9 860.4<br />
1959 636.6 851.0 749.5 993.0 710.2 439.6 565.0 618.0 684.1 796.8 645.0 693.9 739.5 794.1 309.6 666.2<br />
1960 675.5 774.0 918.1 896.5 752.3 374.4 702.8 571.1 603.3 803.1 879.6 501.3 630.0 664.2 418.6 563.4<br />
1961 745.5 670.0 645.6 1120.2 893.1 569.1 795.1 562.4 633.2 548.2 879.6 527.5 863.4 764.2 643.8 479.2<br />
1962 938.8 832.5 754.1 1140.0 967.7 676.2 525.2 622.1 630.0 612.5 760.1 748.2 1027.3 614.5 893.0 523.9<br />
1963 883.5 639.6 533.4 1119.7 1199.1 633.1 428.9 517.7 635.0 565.2 690.5 622.7 985.4 732.3 636.0 662.4<br />
1964 546.2 574.0 520.8 836.1 983.6 574.7 547.5 527.9 586.0 568.4 585.2 392.3 923.2 606.0 511.0 596.5<br />
1965 719.8 797.1 463.4 868.7 1064.6 541.4 533.4 604.3 687.1 610.9 590.2 612.7 857.0 766.7 432.0 465.6<br />
1966 643.2 571.2 370.3 726.7 552.8 381.4 536.1 557.0 445.2 469.4 464.9 416.1 940.1 813.0 162.0 781.5<br />
1967 545.3 688.0 629.5 895.9 591.8 523.0 558.0 621.4 541.0 565.0 637.5 496.4 795.3 610.2 520.0 715.1<br />
1968 821.2 659.2 585.5 947.2 500.8 343.0 538.2 593.9 555.9 492.8 614.0 525.5 999.4 956.4 584.1 793.6<br />
1969 544.5 690.2 540.9 681.7 471.8 347.5 576.0 649.5 468.2 377.8 440.5 347.4 707.0 500.2 705.3 422.0<br />
1970 702.3 843.6 744.4 901.8 643.7 632.2 583.7 880.8 727.3 641.5 734.0 527.8 1059.6 920.2 522.1 802.7<br />
1971 477.4 586.6 596.7 842.3 588.0 465.9 641.6 987.0 537.8 510.9 530.1 402.9 800.0 553.9 620.4 798.1<br />
1972 625.1 675.1 415.2 708.9 647.7 479.3 628.4 896.1 639.9 599.7 757.0 567.9 962.0 935.5 456.2 452.8<br />
1973 645.9 795.3 420.8 926.2 765.6 544.3 573.0 976.0 784.2 716.8 777.9 563.7 942.9 1185.6 387.6 673.9<br />
1974 593.5 704.0 321.2 926.3 684.5 610.7 622.2 1010.0 552.4 569.7 744.6 630.1 1072.8 1291.5 412.9 827.5<br />
1975 717.7 610.8 464.3 1030.9 684.7 531.7 673.2 881.9 553.3 607.9 546.4 577.7 1118.9 842.2 476.9 752.2<br />
1976 358.6 573.4 1452.1 820.1 673.0 515.9 596.2 802.8 626.7 512.2 524.4 406.2 702.0 576.8 504.0 480.6<br />
1977 550.3 645.5 640.9 881.7 787.3 592.2 603.0 852.6 598.9 565.4 711.0 647.5 1069.9 842.9 476.1 805.8<br />
1978 950.7 723.4 973.4 1041.1 909.9 750.8 672.2 1031.0 823.8 812.8 778.2 684.7 1115.0 953.6 447.1 814.8<br />
1979 665.3 772.5 709.4 1094.3 622.1 809.4 693.0 1082.7 583.6 497.9 813.1 609.5 847.0 919.0 698.3 563.1<br />
1980 714.8 577.1 512.2 860.7 756.5 468.0 605.9 790.8 498.9 473.7 898.4 466.3 589.2 541.9 397.1 815.7<br />
1981 956.0 794.5 731.8 1064.4 919.8 694.9 869.2 1149.2 698.7 623.8 1029.4 748.3 885.4 761.5 451.4 887.4<br />
1982 602.8 824.2 581.8 870.7 808.1 532.4 758.6 682.9 588.7 665.9 766.2 578.6 719.7 637.6 622.4 502.6<br />
1983 392.9 466.7 399.9 607.3 576.2 395.5 487.3 615.9 355.1 431.5 434.0 355.9 391.0 563.6 582.0 341.6<br />
1984 660.5 967.1 973.3 1274.3 1035.7 638.3 861.4 1265.2 676.4 821.7 1001.3 1049.8 1712.9 1077.8 909.1 455.9<br />
1985 952.3 866.5 880.2 1383.4 1111.7 730.8 869.0 1215.6 641.9 846.2 1069.7 1269.8 1409.3 969.8 595.1 1113.0<br />
1986 879.4 804.4 768.9 1104.4 902.1 732.6 817.6 1422.6 796.9 669.5 1132.4 1098.5 971.1 705.0 499.4 1664.0<br />
1987 596.1 489.2 621.5 767.2 735.9 406.4 729.1 975.7 677.9 620.8 723.1 659.6 808.9 542.2 516.5 536.2<br />
1988 902.0 699.4 589.4 939.9 665.0 597.0 570.0 845.0 569.5 569.9 780.6 662.7 1044.5 844.5 497.3 690.1<br />
1989 660.2 658.8 643.5 556.5 508.9 404.7 623.7 794.1 687.1 612.4 514.1 465.2 646.0 566.9 477.4 497.1<br />
1990 616.1 723.3 522.9 831.9 631.8 462.9 683.6 865.6 493.1 537.2 606.5 717.4 742.1 576.4 605.5 599.4<br />
1991 719.0 731.2 710.0 857.8 601.7 456.7 536.7 910.3 565.8 581.7 645.7 655.3 484.2 537.8 348.6 518.8<br />
1992 616.8 610.8 583.6 720.1 683.5 449.2 532.3 1270.7 473.3 617.9 514.0 542.3 730.0 826.4 513.0 518.5<br />
1993 678.8 777.0 632.2 870.8 634.4 587.9 662.5 821.5 912.2 742.2 748.6 616.7 808.3 685.2 372.9 587.0<br />
1994 669.0 985.9 591.9 839.0 937.1 656.9 703.8 1389.1 658.8 640.6 720.4 622.4 717.7 478.5 426.7 393.3<br />
1995 522.6 556.4 587.6 698.5 711.8 541.6 527.6 753.7 469.9 460.1 585.8 653.1 575.7 540.9 269.5 579.1<br />
1996 654.1 641.6 558.5 787.0 752.5 482.4 462.7 652.0 555.6 538.3 506.1 432.1 780.7 803.5 448.6 525.7<br />
1997 799.1 869.1 728.3 1098.9 825.3 601.8 610.2 990.3 812.6 795.9 796.0 710.9 976.8 683.1 618.2 732.1<br />
1998 572.1 552.0 467.6 548.1 715.8 494.2 551.3 619.0 475.4 441.6 532.0 531.1 738.2 469.8 299.4 490.1<br />
1999 592.7 585.6 520.3 731.2 732.5 558.8 614.1 733.7 581.2 514.3 565.3 544.6 684.0 511.6 351.0 554.1<br />
2000 539.8 693.0 614.5 698.3 719.6 523.5 586.1 500.8 615.3 527.6 640.8 459.7 599.0 464.5 499.0 488.1<br />
2001 851.1 887.2 737.3 1159.0 882.8 622.1 590.9 678.8 636.9 777.0 917.3 546.2 1085.1 831.0 323.6 983.6<br />
2002 955.7 760.4 686.3 1142.3 880.7 678.4 677.3 698.2 885.8 970.3 847.8 571.7 1304.7 900.2 590.8 1049.7<br />
2003 756.7 728.1 794.8 988.8 809.4 590.3 675.1 650.0 640.5 630.5 641.0 590.0 1099.9 839.0 781.2 631.1<br />
2004 697.2 660.6 913.6 671.5 637.4 365.4 753.8 462.2 774.2 611.7 740.9 593.6 583.8 665.9 406.6 595.9<br />
2005 606.1 473.9 721.3 822.2 674.0 508.0 592.4 479.7 576.2 524.9 633.1 597.6 695.7 581.7 334.3 485.7<br />
2006 620.7 541.6 714.4 711.4 617.2 491.2 668.8 560.7 537.4 525.3 496.4 578.4 571.6 870.8 293.2 527.5<br />
2007 698.4 586.4 461.1 770.5 767.0 525.3 558.9 445.8 584.9 634.7 630.3 534.9 708.1 609.8 662.0 484.7<br />
<strong>2008</strong> 585.4 549.1 515.3 810.4 527.5 515.9 613.9 513.8 505.8 538.0 535.8 456.8 709.8 684.5 286.7 639.6<br />
2009 433.3 486.9 445.2 587.8 507.4 422.9 616.1 416.6 533.4 551.0 583.5 460.6 482.2 470.6 353.2 571.2<br />
Nº datos 54 54 54 54 54 54 54 54 54 54 54 54 54 54 54 54<br />
Prom 677.5 693.1 644.3 885.2 743.6 540.9 621.9 783.5 614.5 609.3 695.8 591.2 856.4 726.7 493.6 651.6<br />
Desvest 141.4 125.7 192.7 179.6 162.0 107.6 100.3 246.6 110.9 120.2 160.2 166.8 239.0 185.4 150.3 218.6<br />
Máx 956.0 985.9 1452.1 1383.4 1199.1 809.4 869.2 1422.6 912.2 970.3 1132.4 1269.8 1712.9 1291.5 909.1 1664.0<br />
Mín 358.6 466.7 321.2 548.1 471.8 343.0 428.9 416.6 355.1 377.8 434.0 347.4 391.0 464.5 162.0 341.6<br />
MINAG-ANA-DCPRH-AGUAS SUPERFICIALES Pág.171<br />
Progreso<br />
Azángaro<br />
Arapa<br />
Taraco<br />
Conima<br />
Puerto Acosta<br />
Escoma<br />
Chahuaya
<strong>Estudio</strong> <strong>Hidrológico</strong> <strong>de</strong> <strong>la</strong>s <strong>Cuenca</strong>s Huancané y Suches 2010<br />
Figura N° 5.10 Serie anual <strong>de</strong> precipitaciones - Estaciones meteorológicas <strong>de</strong> <strong>la</strong>s cuencas Huancané-Suches<br />
y cuencas vecinas<br />
Precipitación (mm)<br />
Precipitación (mm)<br />
Precipitación (mm)<br />
Precipitación (mm)<br />
Precipitación (mm)<br />
1200.0<br />
1000.0<br />
800.0<br />
600.0<br />
400.0<br />
200.0<br />
0.0<br />
1600.0<br />
1400.0<br />
1200.0<br />
1000.0<br />
800.0<br />
600.0<br />
400.0<br />
200.0<br />
0.0<br />
1400.0<br />
1200.0<br />
1000.0<br />
800.0<br />
600.0<br />
400.0<br />
200.0<br />
0.0<br />
1200.0<br />
1000.0<br />
800.0<br />
600.0<br />
400.0<br />
200.0<br />
0.0<br />
1200.0<br />
1000.0<br />
800.0<br />
600.0<br />
400.0<br />
200.0<br />
0.0<br />
Estación Huancané<br />
1955 1960 1965 1970 1975 1980 1985 1990 1995 2000 2005 2010<br />
Tiempo (año)<br />
Estación Muñani<br />
1955 1960 1965 1970 1975 1980 1985 1990 1995 2000 2005 2010<br />
Tiempo (año)<br />
Estación Cojata<br />
1955 1960 1965 1970 1975 1980 1985 1990 1995 2000 2005 2010<br />
Tiempo (año)<br />
Estación Ananea<br />
1955 1960 1965 1970 1975 1980 1985 1990 1995 2000 2005 2010<br />
Tiempo (año)<br />
Estación Progreso<br />
1955 1960 1965 1970 1975 1980 1985 1990 1995 2000 2005 2010<br />
Tiempo (año)<br />
MINAG-ANA-DCPRH-AGUAS SUPERFICIALES Pág.172<br />
Precipitación (mm)<br />
Precipitación (mm)<br />
Precipitación (mm)<br />
Precipitación (mm)<br />
Precipitación (mm)<br />
1200.0<br />
1000.0<br />
800.0<br />
600.0<br />
400.0<br />
200.0<br />
0.0<br />
1600.0<br />
1400.0<br />
1200.0<br />
1000.0<br />
800.0<br />
600.0<br />
400.0<br />
200.0<br />
0.0<br />
1000.0<br />
800.0<br />
600.0<br />
400.0<br />
200.0<br />
0.0<br />
1800.0<br />
1500.0<br />
1200.0<br />
900.0<br />
600.0<br />
300.0<br />
0.0<br />
1200.0<br />
1000.0<br />
800.0<br />
600.0<br />
400.0<br />
200.0<br />
0.0<br />
Estación Putina<br />
1955 1960 1965 1970 1975 1980 1985 1990 1995 2000 2005 2010<br />
Tiempo (año)<br />
Estación Huaraya Moho<br />
1955 1960 1965 1970 1975 1980 1985 1990 1995 2000 2005 2010<br />
Tiempo (año)<br />
Estación Suches<br />
1955 1960 1965 1970 1975 1980 1985 1990 1995 2000 2005 2010<br />
Tiempo (año)<br />
Estación Crucero<br />
1955 1960 1965 1970 1975 1980 1985 1990 1995 2000 2005 2010<br />
Tiempo (año)<br />
Estación Azángaro<br />
1955 1960 1965 1970 1975 1980 1985 1990 1995 2000 2005 2010<br />
Tiempo (año)
Precipitación (mm)<br />
Precipitación (mm)<br />
Precipitación (mm)<br />
<strong>Estudio</strong> <strong>Hidrológico</strong> <strong>de</strong> <strong>la</strong>s <strong>Cuenca</strong>s Huancané y Suches 2010<br />
1400.0<br />
1200.0<br />
1000.0<br />
800.0<br />
600.0<br />
400.0<br />
200.0<br />
0.0<br />
1800.0<br />
1600.0<br />
1400.0<br />
1200.0<br />
1000.0<br />
800.0<br />
600.0<br />
400.0<br />
200.0<br />
0.0<br />
1200.0<br />
1000.0<br />
800.0<br />
600.0<br />
400.0<br />
200.0<br />
0.0<br />
Estación Arapa<br />
1955 1960 1965 1970 1975 1980 1985 1990 1995 2000 2005 2010<br />
Tiempo (año)<br />
Estación Conima<br />
1955 1960 1965 1970 1975 1980 1985 1990 1995 2000 2005 2010<br />
Tiempo (año)<br />
Estación Escoma<br />
1955 1960 1965 1970 1975 1980 1985 1990 1995 2000 2005 2010<br />
Tiempo (año)<br />
MINAG-ANA-DCPRH-AGUAS SUPERFICIALES Pág.173<br />
Precipitación (mm)<br />
Precipitación (mm)<br />
Precipitación (mm)<br />
1400.0<br />
1200.0<br />
1000.0<br />
800.0<br />
600.0<br />
400.0<br />
200.0<br />
0.0<br />
1400.0<br />
1200.0<br />
1000.0<br />
800.0<br />
600.0<br />
400.0<br />
200.0<br />
0.0<br />
1800.0<br />
1500.0<br />
1200.0<br />
900.0<br />
600.0<br />
300.0<br />
0.0<br />
Estación Taraco<br />
1955 1960 1965 1970 1975 1980 1985 1990 1995 2000 2005 2010<br />
Tiempo (año)<br />
Estación Puerto Acosta<br />
1955 1960 1965 1970 1975 1980 1985 1990 1995 2000 2005 2010<br />
Tiempo (año)<br />
Estación Chahuaya<br />
1955 1960 1965 1970 1975 1980 1985 1990 1995 2000 2005 2010<br />
Tiempo (año)<br />
Los registros completados y extendidos <strong>de</strong> <strong>la</strong>s precipitaciones mensuales <strong>de</strong> <strong>la</strong>s estaciones<br />
meteorológicas consi<strong>de</strong>radas en el presente estudio, se muestran en el Anexo 1.<br />
5.5 PRECIPITACIÓN AREAL DE LA CUENCA<br />
Es aquel<strong>la</strong> precipitación hidrológica que cae sobre una cuenca <strong>de</strong>terminada. Esta<br />
precipitación se pue<strong>de</strong> calcu<strong>la</strong>r mediante los métodos <strong>de</strong> media aritmética, polígonos <strong>de</strong><br />
Thiessen, <strong>la</strong>s Isoyetas, polígonos <strong>de</strong> Thiessen modificado y el inverso <strong>de</strong> <strong>la</strong> distancia al<br />
cuadrado, los más usados en hidrología. A continuación se <strong>de</strong>scribe los métodos <strong>de</strong><br />
Polígonos <strong>de</strong> Thiessen y Polígonos <strong>de</strong> Thiessen Modificado.<br />
Método <strong>de</strong> Polígonos <strong>de</strong> Thiessen<br />
Este método establece que en cualquier punto <strong>de</strong> <strong>la</strong> cuenca <strong>la</strong> precipitación es igual a <strong>la</strong> que<br />
se registra en el pluviómetro más cercano; luego <strong>la</strong> profundidad registrada en un<br />
pluviómetro dado se aplica hasta <strong>la</strong> mitad <strong>de</strong> <strong>la</strong> distancia a <strong>la</strong> siguiente estación<br />
pluviométrica en cualquier dirección. Los pesos re<strong>la</strong>tivos <strong>de</strong> cada pluviómetro se<br />
<strong>de</strong>terminan <strong>de</strong> <strong>la</strong>s correspondientes áreas <strong>de</strong> influencia en una red <strong>de</strong> polígonos <strong>de</strong> Thiessen,<br />
cuyas fronteras están formadas por los bisectores perpendicu<strong>la</strong>res a <strong>la</strong>s líneas que unen<br />
pluviómetros adyacentes.
<strong>Estudio</strong> <strong>Hidrológico</strong> <strong>de</strong> <strong>la</strong>s <strong>Cuenca</strong>s Huancané y Suches 2010<br />
Pm <br />
1<br />
A<br />
n<br />
<br />
T i1<br />
A P<br />
i<br />
i<br />
Don<strong>de</strong>:<br />
Pm = Precipitación areal <strong>de</strong> <strong>la</strong> cuenca.<br />
Pi = Precipitación registrada en <strong>la</strong> estación i.<br />
Ai = Área <strong>de</strong> influencia <strong>de</strong> <strong>la</strong> estación i.<br />
AT = Área total <strong>de</strong> <strong>la</strong> cuenca.<br />
n = Número <strong>de</strong> estaciones <strong>de</strong> análisis.<br />
El método <strong>de</strong> Thiessen generalmente es más exacto que el método <strong>de</strong> <strong>la</strong> media aritmética,<br />
pero es inflexible, <strong>de</strong>bido a que se tiene que construir una nueva red <strong>de</strong> Thiessen cada vez<br />
que haya un cambio en <strong>la</strong> red <strong>de</strong> pluviómetros, tal como ocurre cuando falta información<br />
en alguno <strong>de</strong> ellos. A<strong>de</strong>más, el método <strong>de</strong> Thiessen no tiene en cuenta en forma directa <strong>la</strong>s<br />
influencias <strong>de</strong> <strong>la</strong> orografía en <strong>la</strong> lluvia.<br />
Método <strong>de</strong> Polígonos <strong>de</strong> Thiessen Modificado<br />
Está basado en una composición <strong>de</strong>l método <strong>de</strong> <strong>la</strong>s Isoyetas y los Polígonos <strong>de</strong> Thiessen.<br />
Cabe recalcar, que <strong>la</strong> precipitación <strong>de</strong> un área <strong>de</strong> influencia <strong>de</strong>finida por los Polígonos <strong>de</strong><br />
Thiessen, no guarda re<strong>la</strong>ción estricta con <strong>la</strong> precipitación <strong>de</strong> <strong>la</strong> estación involucrada; sin<br />
embargo, es posible asumir que <strong>la</strong> variación temporal que presenta <strong>la</strong> precipitación <strong>de</strong>l área<br />
y <strong>la</strong> precipitación <strong>de</strong> <strong>la</strong> estación pluviométrica, posee cierto grado <strong>de</strong> uniformidad, por lo<br />
cual, <strong>la</strong> re<strong>la</strong>ción entre estos valores <strong>de</strong> precipitación tien<strong>de</strong> a mantenerse constante.<br />
La información necesaria para el método <strong>de</strong> Polígonos <strong>de</strong> Thiessen Modificado, es <strong>la</strong><br />
existencia previa <strong>de</strong> isoyetas. Esta información condiciona bastante a este método, <strong>de</strong>bido a<br />
que su exactitud <strong>de</strong>pen<strong>de</strong>rá fuertemente <strong>de</strong> <strong>la</strong> calidad <strong>de</strong> esta información pluvial, ya sea en<br />
el grado <strong>de</strong> semejanza a <strong>la</strong> realidad que posean o en <strong>la</strong> cantidad <strong>de</strong> datos utilizada en su<br />
construcción, entre otros aspectos.<br />
Pm <br />
n<br />
<br />
i1<br />
<br />
Pmai Si <br />
<br />
<br />
Peaij <br />
<br />
<br />
Pmei St <br />
Don<strong>de</strong>:<br />
Pm = Precipitación media <strong>de</strong>l área <strong>de</strong> estudio (mm).<br />
Pmai = Precipitación media <strong>de</strong>l área <strong>de</strong> influencia <strong>de</strong> <strong>la</strong> estación i.<br />
Pmei = Precipitación media <strong>de</strong> <strong>la</strong> estación i.<br />
Peaij = Precipitación <strong>de</strong> <strong>la</strong> estación <strong>de</strong>l área <strong>de</strong> influencia i, en el pe<strong>río</strong>do j.<br />
Si = Superficie <strong>de</strong>l área <strong>de</strong> influencia <strong>de</strong> <strong>la</strong> estación i.<br />
St = Superficie total <strong>de</strong>l área <strong>de</strong> estudio.<br />
Pm<br />
<br />
n<br />
<br />
i1<br />
Ki Peaij Ri<br />
MINAG-ANA-DCPRH-AGUAS SUPERFICIALES Pág.174
<strong>Estudio</strong> <strong>Hidrológico</strong> <strong>de</strong> <strong>la</strong>s <strong>Cuenca</strong>s Huancané y Suches 2010<br />
Ki = Constante <strong>de</strong> proporcionalidad <strong>de</strong> precipitaciones <strong>de</strong> <strong>la</strong> estación i.<br />
Ri = Constante <strong>de</strong> proporcionalidad <strong>de</strong> superficies <strong>de</strong> <strong>la</strong> estación i.<br />
El valor <strong>de</strong> Pmai, se obtiene a partir <strong>de</strong> un mapa <strong>de</strong> isoyetas <strong>de</strong>l área <strong>de</strong> estudio y<br />
el valor <strong>de</strong> Pmei, se obtiene como un promedio aritmético <strong>de</strong> los datos que posee<br />
<strong>la</strong> estación pluviométrica en análisis.<br />
La constante Ki presenta valores mayor o igual a cero ( Ki 0 ), mientras <strong>la</strong><br />
constante Ri, <strong>de</strong>nota valores <strong>de</strong> 0 Ri 1.<br />
Pm <br />
n<br />
<br />
i1<br />
Cei Peaij<br />
Cei = Coeficiente <strong>de</strong> <strong>la</strong> estación i.<br />
El coeficiente <strong>de</strong> <strong>la</strong> estación i (Cpi), se obtiene multiplicando <strong>la</strong> constante <strong>de</strong><br />
proporcionalidad <strong>de</strong> <strong>la</strong> estación i (Ki) y <strong>la</strong> constante <strong>de</strong> proporcionalidad <strong>de</strong><br />
superficies <strong>de</strong> <strong>la</strong> estación i (Ri).<br />
En el p<strong>la</strong>no hidrológico <strong>de</strong> <strong>la</strong>s cuencas Huancané y Suches, con <strong>la</strong> ubicación <strong>de</strong> <strong>la</strong>s<br />
estaciones meteorológicas se ha e<strong>la</strong>borado <strong>la</strong>s isoyetas y los polígonos <strong>de</strong> Thiessen, tal<br />
como se muestra en los Mapas Nº 5.2 a 5.5.<br />
A partir <strong>de</strong> los mapas <strong>de</strong> isoyetas y polígonos <strong>de</strong> influencia <strong>de</strong> <strong>la</strong>s estaciones<br />
meteorológicas, se ha obtenido los coeficientes <strong>de</strong> los métodos <strong>de</strong> Polígonos <strong>de</strong> Thiessen y<br />
Polígonos <strong>de</strong> Thiessen Modificado, tomando en consi<strong>de</strong>ración <strong>la</strong>s subcuencas que aportan<br />
sus aguas en forma directa a <strong>la</strong>s cuencas Huancané y Suches, y para <strong>la</strong>s subcuencas <strong>de</strong><br />
interés.<br />
En los Cuadros Nº 5.16 y 5.17, se muestran los coeficientes <strong>de</strong>l método <strong>de</strong> Polígonos <strong>de</strong><br />
Thiessen y Thiessen Modificado, <strong>de</strong> <strong>la</strong>s estaciones meteorológicas <strong>de</strong> <strong>la</strong> cuenca <strong>de</strong>l <strong>río</strong><br />
Huancané y Suches.<br />
MINAG-ANA-DCPRH-AGUAS SUPERFICIALES Pág.175
<strong>Estudio</strong> <strong>Hidrológico</strong> <strong>de</strong> <strong>la</strong>s <strong>Cuenca</strong>s Huancané y Suches 2010<br />
Mapa Nº 5.2 Isoyetas y Polígonos <strong>de</strong> Thiessen – <strong>Cuenca</strong> Huancané<br />
MINAG-ANA-DCPRH-AGUAS SUPERFICIALES Pág.176
<strong>Estudio</strong> <strong>Hidrológico</strong> <strong>de</strong> <strong>la</strong>s <strong>Cuenca</strong>s Huancané y Suches 2010<br />
Mapa Nº 5.3 Isoyetas y Polígonos <strong>de</strong> Thiessen – <strong>Cuenca</strong> Huancané (subcuencas)<br />
MINAG-ANA-DCPRH-AGUAS SUPERFICIALES Pág.177
<strong>Estudio</strong> <strong>Hidrológico</strong> <strong>de</strong> <strong>la</strong>s <strong>Cuenca</strong>s Huancané y Suches 2010<br />
Mapa Nº 5.4 Isoyetas y Polígonos <strong>de</strong> Thiessen – <strong>Cuenca</strong> Suches<br />
MINAG-ANA-DCPRH-AGUAS SUPERFICIALES Pág.178
<strong>Estudio</strong> <strong>Hidrológico</strong> <strong>de</strong> <strong>la</strong>s <strong>Cuenca</strong>s Huancané y Suches 2010<br />
Mapa Nº 5.5 Isoyetas y Polígonos <strong>de</strong> Thiessen – <strong>Cuenca</strong> Suches (subcuencas)<br />
MINAG-ANA-DCPRH-AGUAS SUPERFICIALES Pág.179
<strong>Estudio</strong> <strong>Hidrológico</strong> <strong>de</strong> <strong>la</strong>s <strong>Cuenca</strong>s Huancané y Suches 2010<br />
Cuadro Nº 5.16 Coeficientes <strong>de</strong>l método <strong>de</strong> Polígonos <strong>de</strong> Thiessen y Thiessen Modificado <strong>de</strong> <strong>la</strong>s estaciones<br />
meteorológicas <strong>de</strong> <strong>la</strong> cuenca <strong>de</strong>l <strong>río</strong> Huancané<br />
Superficie total <strong>de</strong> <strong>la</strong> cuenca (St) = 3511.10 km2<br />
Estación<br />
Crucero<br />
Muñani<br />
Inferior Superior<br />
(mm) (mm) Pi Si Sj Pmai = Sj/Si Pmei Ki = Pmai/Pmei Ri = Si/St Cei = Ki*Ri<br />
650.0 675.0 662.5 37.36 24751.00<br />
675.0 700.0 687.5 48.23 33158.13<br />
700.0 725.0 712.5 1.24 883.50<br />
86.83 58792.63<br />
625.0 650.0 637.5 206.02 131337.75<br />
650.0 675.0 662.5 521.50 345493.75<br />
675.0 700.0 687.5 16.21 11144.38<br />
743.73 487975.88<br />
650.0 675.0 662.5 67.39 44645.88<br />
675.0 700.0 687.5 137.11 94263.13<br />
Ananea 694.10<br />
700.0 725.0 712.5 95.34 67929.75<br />
Putina<br />
Cojata<br />
Huancané<br />
Huaraya Moho<br />
Isoyeta<br />
Sumatoria<br />
Sumatoria<br />
725.0 750.0 737.5 29.65 21866.88<br />
Sumatoria<br />
329.49 228705.64<br />
650.0 675.0 662.5 26.05 17258.13<br />
675.0 700.0 687.5 432.79 297543.13<br />
700.0 725.0 712.5 287.38 204758.25<br />
725.0 750.0 737.5 156.86 115684.25<br />
750.0 775.0 762.5 3.33 2539.13<br />
Sumatoria<br />
906.41 637782.89<br />
725.0 750.0 737.5 46.27 34124.13<br />
750.0 775.0 762.5 101.14 77119.25<br />
775.0 800.0 787.5 81.06 63834.75<br />
800.0 825.0 812.5 124.14 100863.75<br />
825.0 850.0 837.5 117.78 98640.75<br />
850.0 875.0 862.5 68.21 58831.13<br />
875.0 900.0 887.5 13.45 11936.88<br />
Sumatoria<br />
552.05 445350.64<br />
650.0 675.0 662.5 45.11 29885.38<br />
675.0 700.0 687.5 138.38 95136.25<br />
700.0 725.0 712.5 80.70 57498.75<br />
725.0 750.0 737.5 95.94 70755.75<br />
750.0 775.0 762.5 105.87 80725.88<br />
775.0 800.0 787.5 70.61 55605.38<br />
800.0 825.0 812.5 51.88 42152.50<br />
825.0 850.0 837.5 11.50 9631.25<br />
Sumatoria<br />
599.99 441391.14<br />
800.0 825.0 812.5 0.25 203.13<br />
825.0 850.0 837.5 39.68 33232.00<br />
850.0 875.0 862.5 67.75 58434.38<br />
875.0 900.0 887.5 104.05 92344.38<br />
900.0 925.0 912.5 79.00 72087.50<br />
925.0 950.0 937.5 1.87 1753.13<br />
Sumatoria<br />
Precipitación<br />
media entre<br />
isoyetas (mm)<br />
Área total <strong>de</strong> <strong>la</strong> cuenca =<br />
Superficie total <strong>de</strong> <strong>la</strong> cuenca (St) = 161.93 km2<br />
Estación<br />
Isoyeta Precipitación<br />
media entre<br />
isoyetas (mm)<br />
Inferior Superior<br />
<strong>Cuenca</strong> <strong>de</strong>l <strong>río</strong> Huancané (Puente Huancané)<br />
Área entre<br />
isoyetas (km2)<br />
292.60 258054.52<br />
3511.10 km2<br />
Pi*Si<br />
(mm*km2)<br />
Precipitación media<br />
<strong>de</strong>l área <strong>de</strong><br />
influencia <strong>de</strong> <strong>la</strong><br />
estación (mm)<br />
Precipitación media<br />
<strong>de</strong> <strong>la</strong> estación (mm)<br />
677.10 783.50<br />
MINAG-ANA-DCPRH-AGUAS SUPERFICIALES Pág.180<br />
656.10<br />
703.60<br />
806.70<br />
735.70<br />
881.90<br />
644.40<br />
693.20<br />
743.60<br />
677.70<br />
885.10<br />
Constante <strong>de</strong><br />
proporcionalidad <strong>de</strong><br />
precipitación <strong>de</strong> <strong>la</strong><br />
estación<br />
0.8642<br />
621.70 1.11645<br />
1.01500<br />
1.08486<br />
1.08558<br />
0.99638<br />
Constante <strong>de</strong><br />
proporcionalidad <strong>de</strong><br />
superficie <strong>de</strong> <strong>la</strong><br />
estación<br />
0.02473<br />
1.01816 0.21182 0.21567<br />
0.09384<br />
0.25816<br />
0.15723<br />
0.17088<br />
0.08334<br />
Coeficiente <strong>de</strong> <strong>la</strong><br />
estación<br />
(mm) (mm) Pi Si Sj Pmai = Sj/Si Pmei Ki = Pmai/Pmei Ri = Si/St Cei = Ki*Ri<br />
650 675 662.5 0.06 39.75<br />
Putina 687.50 693.20 0.99178 0.87958 0.87235<br />
675 700 687.5 142.37 97879.38<br />
Sumatoria<br />
142.43 97919.13<br />
Huancané 675 700 687.5 19.50 13406.25 687.50 677.70 1.01446 0.12042 0.12216<br />
Sumatoria<br />
Área total <strong>de</strong> <strong>la</strong> cuenca =<br />
Área entre<br />
isoyetas (km2)<br />
19.50 13406.25<br />
161.93 km2<br />
Pi*Si<br />
(mm*km2)<br />
Subcuenca L<strong>la</strong>che<br />
Precipitación media<br />
<strong>de</strong>l área <strong>de</strong><br />
influencia <strong>de</strong> <strong>la</strong><br />
estación (mm)<br />
Precipitación media<br />
<strong>de</strong> <strong>la</strong> estación (mm)<br />
Constante <strong>de</strong><br />
proporcionalidad <strong>de</strong><br />
precipitación <strong>de</strong> <strong>la</strong><br />
estación<br />
0.02137<br />
0.10477<br />
0.26203<br />
0.17057<br />
0.18550<br />
0.08304<br />
Constante <strong>de</strong><br />
proporcionalidad <strong>de</strong> Coeficiente <strong>de</strong> <strong>la</strong><br />
superficie <strong>de</strong> <strong>la</strong> estación<br />
estación
<strong>Estudio</strong> <strong>Hidrológico</strong> <strong>de</strong> <strong>la</strong>s <strong>Cuenca</strong>s Huancané y Suches 2010<br />
Superficie total <strong>de</strong> <strong>la</strong> cuenca (St) = 1107.11 km2<br />
Estación<br />
(mm) (mm) Pi Si Sj Pmai = Sj/Si Pmei Ki = Pmai/Pmei Ri = Si/St Cei = Ki*Ri<br />
675 700 687.5 0.76 522.50<br />
Putina 700 725 712.5 3.33 2372.63 719.70 693.20 1.03823 0.00617 0.00641<br />
725 750 737.5 2.74 2020.75<br />
6.83 4915.88<br />
725 750 737.5 5.31 3916.13<br />
750 775 762.5 38.08 29036.00<br />
775 800 787.5 80.34 63267.75<br />
Cojata 800 825 812.5 124.14 100863.75 819.33 743.60 1.10184 0.40403 0.44518<br />
Huaraya -<br />
Moho<br />
Huancané<br />
Isoyeta Precipitación<br />
media entre<br />
isoyetas (mm)<br />
Inferior Superior<br />
Sumatoria<br />
825 850 837.5 117.78 98640.75<br />
850 875 862.5 68.21 58831.13<br />
875 900 887.5 13.45 11936.88<br />
Sumatoria<br />
447.31 366492.39<br />
800 825 812.5 0.25 203.13<br />
825 850 837.5 39.68 33232.00<br />
850 875 862.5 67.75 58434.38<br />
875 900 887.5 104.05 92344.38<br />
900 925 912.5 79.00 72087.50<br />
925 950 937.5 1.87 1753.13<br />
Sumatoria<br />
292.60 258054.52<br />
675 700 687.5 13.73 9439.38<br />
700 725 712.5 69.66 49632.75<br />
725 750 737.5 69.02 50902.25<br />
750 775 762.5 73.98 56409.75<br />
775 800 787.5 70.61 55605.38<br />
800 825 812.5 51.88 42152.50<br />
825 850 837.5 11.49 9622.88<br />
Sumatoria<br />
Área total <strong>de</strong> <strong>la</strong> cuenca =<br />
Superficie total <strong>de</strong> <strong>la</strong> cuenca (St) = 889.44 km2<br />
Estación<br />
Área entre<br />
isoyetas (km2)<br />
360.37 273764.89<br />
1107.11 km2<br />
Pi*Si<br />
(mm*km2)<br />
Subcuenca Tuyto<br />
Precipitación media<br />
<strong>de</strong>l área <strong>de</strong><br />
influencia <strong>de</strong> <strong>la</strong><br />
estación (mm)<br />
Precipitación media<br />
<strong>de</strong> <strong>la</strong> estación (mm)<br />
Constante <strong>de</strong><br />
proporcionalidad <strong>de</strong><br />
precipitación <strong>de</strong> <strong>la</strong><br />
estación<br />
Constante <strong>de</strong><br />
proporcionalidad <strong>de</strong><br />
superficie <strong>de</strong> <strong>la</strong><br />
estación<br />
Coeficiente <strong>de</strong> <strong>la</strong><br />
estación<br />
881.90 885.10 0.99638 0.26429 0.26333<br />
759.70 677.70 1.12100 0.32551 0.36490<br />
(mm) (mm) Pi Si Sj Pmai = Sj/Si Pmei Ki = Pmai/Pmei Ri = Si/St Cei = Ki*Ri<br />
650 675 662.5 37.36 24751.00<br />
Crucero 675 700 687.5 48.23 33158.13 677.10 783.50 0.86420 0.09762 0.08436<br />
Muñani<br />
Isoyeta Precipitación<br />
media entre<br />
isoyetas (mm)<br />
Inferior Superior<br />
700 725 712.5 1.24 883.50<br />
Sumatoria<br />
86.83 58792.63<br />
625 650 637.5 206.02 131337.75<br />
650 675 662.5 511.43 338822.38<br />
675 700 687.5 1.99 1368.13<br />
Sumatoria<br />
719.44 471528.26<br />
650 675 662.5 14.05 9308.13<br />
Putina 675 700 687.5 68.88 47355.00 683.30 693.20 0.98572 0.09351 0.09217<br />
700 725 712.5 0.24 171.00<br />
Sumatoria<br />
Área total <strong>de</strong> <strong>la</strong> cuenca =<br />
Área entre<br />
isoyetas (km2)<br />
83.17 56834.13<br />
889.44 km2<br />
Subcuenca Muñani<br />
Pi*Si<br />
(mm*km2)<br />
Precipitación media<br />
<strong>de</strong>l área <strong>de</strong><br />
influencia <strong>de</strong> <strong>la</strong><br />
estación (mm)<br />
Precipitación media<br />
<strong>de</strong> <strong>la</strong> estación (mm)<br />
Constante <strong>de</strong><br />
proporcionalidad <strong>de</strong><br />
precipitación <strong>de</strong> <strong>la</strong><br />
estación<br />
Constante <strong>de</strong><br />
proporcionalidad <strong>de</strong><br />
superficie <strong>de</strong> <strong>la</strong><br />
estación<br />
Coeficiente <strong>de</strong> <strong>la</strong><br />
estación<br />
655.40 644.40 1.01707 0.80887 0.82268<br />
MINAG-ANA-DCPRH-AGUAS SUPERFICIALES Pág.181
<strong>Estudio</strong> <strong>Hidrológico</strong> <strong>de</strong> <strong>la</strong>s <strong>Cuenca</strong>s Huancané y Suches 2010<br />
Superficie total <strong>de</strong> <strong>la</strong> cuenca (St) = 380.43 km2<br />
Estación<br />
(mm) (mm) Pi Si Sj Pmai = Sj/Si Pmei Ki = Pmai/Pmei Ri = Si/St Cei = Ki*Ri<br />
Ananea 725 750 737.5 2.69 1983.88 737.50 621.70 1.18626 0.00707 0.00839<br />
Sumatoria<br />
2.69 1983.88<br />
700 725 712.5 64.82 46184.25<br />
Putina 725 750 737.5 148.81 109747.38 730.40 693.20 1.05366 0.57030 0.60090<br />
Cojata<br />
Isoyeta Precipitación<br />
media entre<br />
isoyetas (mm)<br />
Inferior Superior<br />
750 775 762.5 3.33 2539.13<br />
Sumatoria<br />
216.96 158470.76<br />
725 750 737.5 38.19 28165.13<br />
750 775 762.5 63.06 48083.25<br />
775 800 787.5 0.72 567.00<br />
Sumatoria<br />
Área entre<br />
isoyetas (km2)<br />
101.97 76815.38<br />
725 750 737.5 26.92 19853.50<br />
Huancané 751.10 677.70 1.10831<br />
750 775 762.5 31.89 24316.13<br />
Sumatoria<br />
Área total <strong>de</strong> <strong>la</strong> cuenca =<br />
Superficie total <strong>de</strong> <strong>la</strong> cuenca (St) = 524.77 km2<br />
Estación<br />
Isoyeta Precipitación<br />
media entre<br />
isoyetas (mm)<br />
Inferior Superior<br />
58.81 44169.63<br />
380.43 km2<br />
Pi*Si<br />
(mm*km2)<br />
Subcuenca Pistune<br />
Precipitación media<br />
<strong>de</strong>l área <strong>de</strong><br />
influencia <strong>de</strong> <strong>la</strong><br />
estación (mm)<br />
Precipitación media<br />
<strong>de</strong> <strong>la</strong> estación (mm)<br />
Constante <strong>de</strong><br />
proporcionalidad <strong>de</strong><br />
precipitación <strong>de</strong> <strong>la</strong><br />
estación<br />
Constante <strong>de</strong><br />
proporcionalidad <strong>de</strong> Coeficiente <strong>de</strong> <strong>la</strong><br />
superficie <strong>de</strong> <strong>la</strong> estación<br />
estación<br />
753.30 743.60 1.01304 0.26804 0.27154<br />
0.15459 0.17133<br />
(mm) (mm) Pi Si Sj Pmai = Sj/Si Pmei Ki = Pmai/Pmei Ri = Si/St Cei = Ki*Ri<br />
650 675 662.5 8.62 5710.75<br />
Muñani 678.10 644.40 1.05230 0.04354 0.04582<br />
675 700 687.5 14.23 9783.13<br />
Sumatoria<br />
22.85 15493.88<br />
650 675 662.5 67.39 44645.88<br />
675 700 687.5 137.11 94263.13<br />
Ananea 693.80 621.70 1.11597 0.62275 0.69497<br />
700 725 712.5 95.34 67929.75<br />
725 750 737.5 26.96 19883.00<br />
Sumatoria<br />
326.80 226721.76<br />
675 700 687.5 70.88 48730.00<br />
Putina 700 725 712.5 96.16 68514.00 703.00 693.20 1.01414 0.32843 0.33307<br />
725 750 737.5 5.31 3916.13<br />
Sumatoria<br />
172.35 121160.13<br />
Cojata 725 750 737.5 2.77 2042.88 737.50 743.60 0.99180 0.00528 0.00524<br />
Sumatoria<br />
Área total <strong>de</strong> <strong>la</strong> cuenca =<br />
Superficie total <strong>de</strong> <strong>la</strong> cuenca (St) = 216.75 km2<br />
Estación<br />
Crucero<br />
Muñani<br />
Isoyeta Precipitación<br />
media entre<br />
isoyetas (mm)<br />
Inferior Superior<br />
Área entre<br />
isoyetas (km2)<br />
2.77 2042.88<br />
524.77 km2<br />
Subcuenca Alto Huancané<br />
Pi*Si<br />
(mm*km2)<br />
Precipitación media<br />
<strong>de</strong>l área <strong>de</strong><br />
influencia <strong>de</strong> <strong>la</strong><br />
estación (mm)<br />
Precipitación media<br />
<strong>de</strong> <strong>la</strong> estación (mm)<br />
Constante <strong>de</strong><br />
proporcionalidad <strong>de</strong><br />
precipitación <strong>de</strong> <strong>la</strong><br />
estación<br />
Constante <strong>de</strong><br />
proporcionalidad <strong>de</strong> Coeficiente <strong>de</strong> <strong>la</strong><br />
superficie <strong>de</strong> <strong>la</strong> estación<br />
estación<br />
(mm) (mm) Pi Si Sj Pmai = Sj/Si Pmei Ki = Pmai/Pmei Ri = Si/St Cei = Ki*Ri<br />
650 675 662.5 37.36 24751.00<br />
675 700 687.5 48.23 33158.13<br />
700 725 712.5 1.24 883.50<br />
Sumatoria<br />
86.83 58792.63<br />
625 650 637.5 49.05 31269.38<br />
650 675 662.5 80.87 53576.38<br />
Sumatoria<br />
Área total <strong>de</strong> <strong>la</strong> cuenca =<br />
Subcuenca Río Guanaco (Vaso Cal<strong>la</strong>tomaza)<br />
Área entre<br />
isoyetas (km2)<br />
129.92 84845.76<br />
216.75 km2<br />
Pi*Si<br />
(mm*km2)<br />
Precipitación media<br />
<strong>de</strong>l área <strong>de</strong><br />
influencia <strong>de</strong> <strong>la</strong><br />
estación (mm)<br />
Precipitación media<br />
<strong>de</strong> <strong>la</strong> estación (mm)<br />
Constante <strong>de</strong><br />
proporcionalidad <strong>de</strong><br />
precipitación <strong>de</strong> <strong>la</strong><br />
estación<br />
Constante <strong>de</strong><br />
proporcionalidad <strong>de</strong><br />
superficie <strong>de</strong> <strong>la</strong><br />
estación<br />
Coeficiente <strong>de</strong> <strong>la</strong><br />
estación<br />
677.10 783.50 0.86420 0.40060 0.34620<br />
653.10 644.40 1.01350 0.59940 0.60749<br />
MINAG-ANA-DCPRH-AGUAS SUPERFICIALES Pág.182
<strong>Estudio</strong> <strong>Hidrológico</strong> <strong>de</strong> <strong>la</strong>s <strong>Cuenca</strong>s Huancané y Suches 2010<br />
Superficie total <strong>de</strong> <strong>la</strong> cuenca (St) = 228.24 km2<br />
Estación<br />
Isoyeta Precipitación<br />
media entre<br />
isoyetas (mm)<br />
Inferior Superior<br />
(mm) (mm) Pi Si Sj Pmai = Sj/Si Pmei Ki = Pmai/Pmei Ri = Si/St Cei = Ki*Ri<br />
775 800 787.5 16.14 12710.25<br />
800 825 812.5 87.29 70923.13<br />
Cojata 828.80 743.60 1.11458 1.00000 1.11458<br />
825 850 837.5 85.07 71246.13<br />
850 875 862.5 39.74 34275.75<br />
Área total <strong>de</strong> <strong>la</strong> cuenca =<br />
Superficie total <strong>de</strong> <strong>la</strong> cuenca (St) = 3631.19 km2<br />
Estación<br />
Crucero<br />
Muñani<br />
Isoyeta Precipitación<br />
media entre<br />
isoyetas (mm)<br />
Inferior Superior<br />
Área entre<br />
isoyetas (km2)<br />
Subcuenca Río Yaputira (Vaso Yaputira)<br />
228.24 189155.26<br />
228.24 km2<br />
Pi*Si<br />
(mm*km2)<br />
Precipitación media<br />
<strong>de</strong>l área <strong>de</strong><br />
influencia <strong>de</strong> <strong>la</strong><br />
estación (mm)<br />
Precipitación media<br />
<strong>de</strong> <strong>la</strong> estación (mm)<br />
Constante <strong>de</strong><br />
proporcionalidad <strong>de</strong><br />
precipitación <strong>de</strong> <strong>la</strong><br />
estación<br />
Constante <strong>de</strong><br />
proporcionalidad <strong>de</strong> Coeficiente <strong>de</strong> <strong>la</strong><br />
superficie <strong>de</strong> <strong>la</strong> estación<br />
estación<br />
(mm) (mm) Pi Si Sj Pmai = Sj/Si Pmei Ki = Pmai/Pmei Ri = Si/St Cei = Ki*Ri<br />
650.0 675.0 662.5 37.36 24751.00<br />
675.0 700.0 687.5 48.23 33158.13<br />
700.0 725.0 712.5 1.24 883.50<br />
Sumatoria<br />
86.83 58792.63<br />
625.0 650.0 637.5 206.02 131337.75<br />
650.0 675.0 662.5 521.50 345493.75<br />
675.0 700.0 687.5 16.21 11144.38<br />
Sumatoria<br />
743.73 487975.88<br />
650.0 675.0 662.5 67.39 44645.88<br />
675.0 700.0 687.5 137.11 94263.13<br />
Ananea 694.10 621.70 1.11645 0.09074 0.10131<br />
700.0 725.0 712.5 95.34 67929.75<br />
725.0 750.0 737.5 29.65 21866.88<br />
Sumatoria<br />
329.49 228705.64<br />
650.0 675.0 662.5 26.05 17258.13<br />
675.0 700.0 687.5 432.79 297543.13<br />
Putina 700.0 725.0 712.5 287.38 204758.25 703.60 693.20 1.01500 0.24962 0.25336<br />
725.0 750.0 737.5 156.86 115684.25<br />
750.0 775.0 762.5 3.33 2539.13<br />
Sumatoria<br />
906.41 637782.89<br />
725.0 750.0 737.5 46.27 34124.13<br />
750.0 775.0 762.5 101.14 77119.25<br />
775.0 800.0 787.5 81.06 63834.75<br />
Cojata 800.0 825.0 812.5 124.14 100863.75 806.70 743.60 1.08486 0.15203 0.16493<br />
825.0 850.0 837.5 117.78 98640.75<br />
850.0 875.0 862.5 68.21 58831.13<br />
875.0 900.0 887.5 13.45 11936.88<br />
Sumatoria<br />
552.05 445350.64<br />
625.0 650.0 637.5 28.89 18417.38<br />
650.0 675.0 662.5 129.58 85846.75<br />
675.0 700.0 687.5 145.11 99763.13<br />
700.0 725.0 712.5 80.70 57498.75<br />
Huancané 725.0 750.0 737.5 95.94 70755.75 722.70 677.70 1.06640 0.19830<br />
750.0 775.0 762.5 105.87 80725.88<br />
775.0 800.0 787.5 70.61 55605.38<br />
800.0 825.0 812.5 51.88 42152.50<br />
825.0 850.0 837.5 11.50 9631.25<br />
Sumatoria<br />
Área entre<br />
isoyetas (km2)<br />
720.08 520396.77<br />
800.0 825.0 812.5 0.25 203.13<br />
825.0 850.0 837.5 39.68 33232.00<br />
850.0 875.0 862.5 67.75 58434.38<br />
Huaraya Moho 881.90 885.10 0.99638 0.08058 0.08029<br />
875.0 900.0 887.5 104.05 92344.38<br />
900.0 925.0 912.5 79.00 72087.50<br />
925.0 950.0 937.5 1.87 1753.13<br />
Sumatoria<br />
Área total <strong>de</strong> <strong>la</strong> cuenca =<br />
292.60 258054.52<br />
3631.19 km2<br />
<strong>Cuenca</strong> Huancané (total)<br />
Pi*Si<br />
(mm*km2)<br />
Precipitación media<br />
<strong>de</strong>l área <strong>de</strong><br />
influencia <strong>de</strong> <strong>la</strong><br />
estación (mm)<br />
Precipitación media<br />
<strong>de</strong> <strong>la</strong> estación (mm)<br />
Constante <strong>de</strong><br />
proporcionalidad <strong>de</strong><br />
precipitación <strong>de</strong> <strong>la</strong><br />
estación<br />
Constante <strong>de</strong><br />
proporcionalidad <strong>de</strong> Coeficiente <strong>de</strong> <strong>la</strong><br />
superficie <strong>de</strong> <strong>la</strong> estación<br />
estación<br />
677.10 783.50 0.8642 0.02391 0.02066<br />
656.10 644.40 1.01816 0.20482 0.20854<br />
MINAG-ANA-DCPRH-AGUAS SUPERFICIALES Pág.183<br />
0.21147
<strong>Estudio</strong> <strong>Hidrológico</strong> <strong>de</strong> <strong>la</strong>s <strong>Cuenca</strong>s Huancané y Suches 2010<br />
Cuadro Nº 5.17 Coeficientes <strong>de</strong>l método <strong>de</strong> Polígonos <strong>de</strong> Thiessen y Thiessen Modificado<br />
<strong>de</strong> <strong>la</strong>s estaciones meteorológicas <strong>de</strong> <strong>la</strong> cuenca <strong>de</strong>l <strong>río</strong> Suches<br />
Superficie total <strong>de</strong> <strong>la</strong> cuenca (St) = 2930.73 km2<br />
Estación<br />
Isoyeta Precipitación<br />
media entre<br />
isoyetas (mm)<br />
Inferior Superior<br />
(mm) (mm) Pi Si Sj Pmai = Sj/Si Pmei Ki = Pmai/Pmei Ri = Si/St Cei = Ki*Ri<br />
450.0 475.0 462.5 2.51 1160.88<br />
475.0 500.0 487.5 9.42 4592.25<br />
500.0 525.0 512.5 17.30 8866.25<br />
525.0 550.0 537.5 21.19 11389.63<br />
550.0 575.0 562.5 15.34 8628.75<br />
575.0 600.0 587.5 12.11 7114.63<br />
Ananea 618.00 621.70 0.99405 0.07127 0.07085<br />
600.0 625.0 612.5 18.05 11055.63<br />
625.0 650.0 637.5 19.14 12201.75<br />
650.0 675.0 662.5 35.60 23585.00<br />
675.0 700.0 687.5 39.24 26977.50<br />
700.0 725.0 712.5 18.92 13480.50<br />
725.0 750.0 737.5 0.04 29.50<br />
Sumatoria<br />
208.86 129082.27<br />
375.0 400.0 387.5 15.34 5944.25<br />
400.0 425.0 412.5 41.64 17176.50<br />
425.0 450.0 437.5 54.83 23988.13<br />
450.0 475.0 462.5 75.23 34793.88<br />
475.0 500.0 487.5 87.88 42841.50<br />
500.0 525.0 512.5 111.09 56933.63<br />
Suches 525.0 550.0 537.5 107.33 57689.88 536.60 540.80 0.99223 0.29423 0.29194<br />
550.0 575.0 562.5 100.19 56356.88<br />
575.0 600.0 587.5 85.94 50489.75<br />
600.0 625.0 612.5 71.64 43879.50<br />
625.0 650.0 637.5 56.40 35955.00<br />
650.0 675.0 662.5 38.91 25777.88<br />
675.0 700.0 687.5 15.88 10917.50<br />
Sumatoria<br />
862.30 462744.28<br />
525.0 550.0 537.5 8.98 4826.75<br />
550.0 575.0 562.5 33.35 18759.38<br />
575.0 600.0 587.5 50.14 29457.25<br />
600.0 625.0 612.5 65.85 40333.13<br />
625.0 650.0 637.5 79.65 50776.88<br />
650.0 675.0 662.5 94.93 62891.13<br />
675.0 700.0 687.5 122.34 84108.75<br />
Cojata 700.0 725.0 712.5 156.94 111819.75 711.80 743.60 0.95724 0.38736 0.37080<br />
725.0 750.0 737.5 160.63 118464.63<br />
750.0 775.0 762.5 127.71 97378.88<br />
775.0 800.0 787.5 119.16 93838.50<br />
800.0 825.0 812.5 68.16 55380.00<br />
825.0 850.0 837.5 35.87 30041.13<br />
850.0 875.0 862.5 11.47 9892.88<br />
875.0 900.0 887.5 0.07 62.13<br />
Sumatoria<br />
1135.25 808031.17<br />
600.0 625.0 612.5 0.93 569.63<br />
625.0 650.0 637.5 3.40 2167.50<br />
650.0 675.0 662.5 6.65 4405.63<br />
675.0 700.0 687.5 9.39 6455.63<br />
700.0 725.0 712.5 8.66 6170.25<br />
725.0 750.0 737.5 8.85 6526.88<br />
750.0 775.0 762.5 10.93 8334.13<br />
Puerto Acosta 775.0 800.0 787.5 13.64 10741.50 883.70 729.10 1.21204 0.18161 0.22012<br />
800.0 825.0 812.5 19.17 15575.63<br />
825.0 850.0 837.5 31.24 26163.50<br />
850.0 875.0 862.5 51.51 44427.38<br />
875.0 900.0 887.5 74.71 66305.13<br />
900.0 925.0 912.5 102.37 93412.63<br />
925.0 950.0 937.5 181.50 170156.25<br />
950.0 975.0 962.5 9.30 8951.25<br />
Sumatoria<br />
Área entre<br />
isoyetas (km2)<br />
532.25 470362.92<br />
475.0 500.0 487.5 0.10 48.75<br />
500.0 525.0 512.5 3.97 2034.63<br />
525.0 550.0 537.5 9.28 4988.00<br />
550.0 575.0 562.5 14.63 8229.38<br />
575.0 600.0 587.5 18.47 10851.13<br />
600.0 625.0 612.5 20.90 12801.25<br />
625.0 650.0 637.5 23.43 14936.63<br />
Escoma 657.90 493.30 1.33367 0.06554 0.08741<br />
650.0 675.0 662.5 23.50 15568.75<br />
675.0 700.0 687.5 21.11 14513.13<br />
700.0 725.0 712.5 17.54 12497.25<br />
725.0 750.0 737.5 15.17 11187.88<br />
750.0 775.0 762.5 10.93 8334.13<br />
775.0 800.0 787.5 8.90 7008.75<br />
800.0 825.0 812.5 4.14 3363.75<br />
Sumatoria<br />
Área total <strong>de</strong> <strong>la</strong> cuenca =<br />
192.07 126363.41<br />
2930.73 km2<br />
<strong>Cuenca</strong> Suches - Puente Escoma<br />
Pi*Si<br />
(mm*km2)<br />
Precipitación media<br />
<strong>de</strong>l área <strong>de</strong><br />
influencia <strong>de</strong> <strong>la</strong><br />
estación (mm)<br />
Precipitación media<br />
<strong>de</strong> <strong>la</strong> estación (mm)<br />
Constante <strong>de</strong><br />
proporcionalidad <strong>de</strong><br />
precipitación <strong>de</strong> <strong>la</strong><br />
estación<br />
Constante <strong>de</strong><br />
proporcionalidad <strong>de</strong> Coeficiente <strong>de</strong> <strong>la</strong><br />
superficie <strong>de</strong> <strong>la</strong> estación<br />
estación<br />
MINAG-ANA-DCPRH-AGUAS SUPERFICIALES Pág.184
<strong>Estudio</strong> <strong>Hidrológico</strong> <strong>de</strong> <strong>la</strong>s <strong>Cuenca</strong>s Huancané y Suches 2010<br />
Superficie total <strong>de</strong> <strong>la</strong> cuenca (St) = 162.18 km2<br />
Estación<br />
Isoyeta Precipitación<br />
media entre<br />
isoyetas (mm)<br />
Inferior Superior<br />
(mm) (mm) Pi Si Sj Pmai = Sj/Si Pmei Ki = Pmai/Pmei Ri = Si/St Cei = Ki*Ri<br />
725.0 750.0 737.5 2.92 2153.50<br />
750.0 775.0 762.5 44.03 33572.88<br />
Cojata 775.0 800.0 787.5 78.90 62133.75 786.40 743.60 1.05756 1.00000 1.05756<br />
800.0 825.0 812.5 29.91 24301.88<br />
825.0 850.0 837.5 6.42 5376.75<br />
Sumatoria<br />
Área total <strong>de</strong> <strong>la</strong> cuenca =<br />
Superficie total <strong>de</strong> <strong>la</strong> cuenca (St) = 289.22 km2<br />
Estación<br />
Área entre<br />
isoyetas (km2)<br />
Subcuenca Chueña Huata Jahuira<br />
162.18 127538.76<br />
162.18 km2<br />
Pi*Si<br />
(mm*km2)<br />
Precipitación media<br />
<strong>de</strong>l área <strong>de</strong><br />
influencia <strong>de</strong> <strong>la</strong><br />
estación (mm)<br />
Precipitación media<br />
<strong>de</strong> <strong>la</strong> estación (mm)<br />
Constante <strong>de</strong><br />
proporcionalidad <strong>de</strong><br />
precipitación <strong>de</strong> <strong>la</strong><br />
estación<br />
Constante <strong>de</strong><br />
proporcionalidad <strong>de</strong> Coeficiente <strong>de</strong> <strong>la</strong><br />
superficie <strong>de</strong> <strong>la</strong> estación<br />
estación<br />
(mm) (mm) Pi Si Sj Pmai = Sj/Si Pmei Ki = Pmai/Pmei Ri = Si/St Cei = Ki*Ri<br />
650.0 675.0 662.5 20.82 13793.25<br />
675.0 700.0 687.5 39.19 26943.13<br />
Ananea 686.90 621.70<br />
700.0 725.0 712.5 18.92 13480.50<br />
Suches<br />
Isoyeta Precipitación<br />
media entre<br />
isoyetas (mm)<br />
Inferior Superior<br />
725.0 750.0 737.5 0.04 29.50<br />
Sumatoria<br />
78.97 54246.38<br />
650.0 675.0 662.5 19.99 13243.38<br />
675.0 700.0 687.5 15.88 10917.50<br />
Sumatoria<br />
35.87 24160.88<br />
650.0 675.0 662.5 0.00 0.00<br />
675.0 700.0 687.5 22.54 15496.25<br />
Cojata 700.0 725.0 712.5 65.19 46447.88 725.00 743.60<br />
725.0 750.0 737.5 63.23 46632.13<br />
750.0 775.0 762.5 23.42 17857.75<br />
Sumatoria<br />
Área total <strong>de</strong> <strong>la</strong> cuenca =<br />
Superficie total <strong>de</strong> <strong>la</strong> cuenca (St) = 405.45 km2<br />
Estación<br />
Isoyeta Precipitación<br />
media entre<br />
isoyetas (mm)<br />
Inferior Superior<br />
Área entre<br />
isoyetas (km2)<br />
174.38 126434.01<br />
289.22 km2<br />
Subcuenca Caylloma<br />
Pi*Si<br />
(mm*km2)<br />
Precipitación media<br />
<strong>de</strong>l área <strong>de</strong><br />
influencia <strong>de</strong> <strong>la</strong><br />
estación (mm)<br />
Precipitación media<br />
<strong>de</strong> <strong>la</strong> estación (mm)<br />
673.60 540.80<br />
Constante <strong>de</strong><br />
proporcionalidad <strong>de</strong><br />
precipitación <strong>de</strong> <strong>la</strong><br />
estación<br />
1.10487 0.27304<br />
Constante <strong>de</strong><br />
proporcionalidad <strong>de</strong> Coeficiente <strong>de</strong> <strong>la</strong><br />
superficie <strong>de</strong> <strong>la</strong> estación<br />
estación<br />
MINAG-ANA-DCPRH-AGUAS SUPERFICIALES Pág.185<br />
0.30167<br />
1.24556 0.12402 0.15447<br />
0.97499 0.60293 0.58785<br />
(mm) (mm) Pi Si Sj Pmai = Sj/Si Pmei Ki = Pmai/Pmei Ri = Si/St Cei = Ki*Ri<br />
450.0 475.0 462.5 2.50 1156.25<br />
475.0 500.0 487.5 9.42 4592.25<br />
500.0 525.0 512.5 17.30 8866.25<br />
525.0 550.0 537.5 21.19 11389.63<br />
550.0 575.0 562.5 15.34 8628.75<br />
Ananea 576.20 621.70 0.92681<br />
575.0 600.0 587.5 12.11 7114.63<br />
600.0 625.0 612.5 18.05 11055.63<br />
625.0 650.0 637.5 19.14 12201.75<br />
650.0 675.0 662.5 14.78 9791.75<br />
675.0 700.0 687.5 0.06 41.25<br />
Sumatoria<br />
129.89 74838.14<br />
400.0 425.0 412.5 6.57 2710.13<br />
425.0 450.0 437.5 19.12 8365.00<br />
450.0 475.0 462.5 29.19 13500.38<br />
475.0 500.0 487.5 28.24 13767.00<br />
500.0 525.0 512.5 31.02 15897.75<br />
Suches 525.0 550.0 537.5 31.40 16877.50 544.00 540.80 1.00592<br />
550.0 575.0 562.5 29.62 16661.25<br />
575.0 600.0 587.5 28.51 16749.63<br />
600.0 625.0 612.5 29.38 17995.25<br />
625.0 650.0 637.5 31.35 19985.63<br />
650.0 675.0 662.5 11.16 7393.50<br />
Sumatoria<br />
Área total <strong>de</strong> <strong>la</strong> cuenca =<br />
Área entre<br />
isoyetas (km2)<br />
275.56 149903.02<br />
405.45 km2<br />
Subcuenca Trapiche<br />
Pi*Si<br />
(mm*km2)<br />
Precipitación media<br />
<strong>de</strong>l área <strong>de</strong><br />
influencia <strong>de</strong> <strong>la</strong><br />
estación (mm)<br />
Precipitación media<br />
<strong>de</strong> <strong>la</strong> estación (mm)<br />
Constante <strong>de</strong><br />
proporcionalidad <strong>de</strong><br />
precipitación <strong>de</strong> <strong>la</strong><br />
estación<br />
Constante <strong>de</strong><br />
proporcionalidad <strong>de</strong> Coeficiente <strong>de</strong> <strong>la</strong><br />
superficie <strong>de</strong> <strong>la</strong> estación<br />
estación<br />
0.32036 0.29691<br />
0.67964 0.68366
<strong>Estudio</strong> <strong>Hidrológico</strong> <strong>de</strong> <strong>la</strong>s <strong>Cuenca</strong>s Huancané y Suches 2010<br />
Superficie total <strong>de</strong> <strong>la</strong> cuenca (St) = 1056.49 km2<br />
Estación<br />
Isoyeta Precipitación<br />
media entre<br />
isoyetas (mm)<br />
Inferior Superior<br />
(mm) (mm) Pi Si Sj Pmai = Sj/Si Pmei Ki = Pmai/Pmei Ri = Si/St Cei = Ki*Ri<br />
450.0 475.0 462.5 2.50 1156.25<br />
475.0 500.0 487.5 9.42 4592.25<br />
500.0 525.0 512.5 17.30 8866.25<br />
525.0 550.0 537.5 21.19 11389.63<br />
550.0 575.0 562.5 15.34 8628.75<br />
575.0 600.0 587.5 12.11 7114.63<br />
Ananea 618.00 621.70 0.99405 0.19768 0.19650<br />
600.0 625.0 612.5 18.05 11055.63<br />
625.0 650.0 637.5 19.14 12201.75<br />
650.0 675.0 662.5 35.60 23585.00<br />
675.0 700.0 687.5 39.24 26977.50<br />
700.0 725.0 712.5 18.92 13480.50<br />
725.0 750.0 737.5 0.04 29.50<br />
Sumatoria<br />
208.85 129077.64<br />
375.0 400.0 387.5 15.34 5944.25<br />
400.0 425.0 412.5 41.64 17176.50<br />
425.0 450.0 437.5 52.73 23069.38<br />
450.0 475.0 462.5 63.23 29243.88<br />
475.0 500.0 487.5 60.49 29488.88<br />
500.0 525.0 512.5 59.90 30698.75<br />
Suches 525.0 550.0 537.5 59.12 31777.00 536.20 540.80 0.99149 0.60080 0.59569<br />
550.0 575.0 562.5 58.70 33018.75<br />
575.0 600.0 587.5 59.10 34721.25<br />
600.0 625.0 612.5 57.06 34949.25<br />
625.0 650.0 637.5 52.64 33558.00<br />
650.0 675.0 662.5 38.91 25777.88<br />
675.0 700.0 687.5 15.88 10917.50<br />
Sumatoria<br />
634.74 340341.27<br />
625.0 650.0 637.5 0.52 331.50<br />
650.0 675.0 662.5 13.95 9241.88<br />
675.0 700.0 687.5 38.22 26276.25<br />
Cojata 717.70 743.60 0.96517 0.20152 0.19450<br />
700.0 725.0 712.5 71.43 50893.88<br />
725.0 750.0 737.5 65.36 48203.00<br />
750.0 775.0 762.5 23.42 17857.75<br />
Sumatoria<br />
Área total <strong>de</strong> <strong>la</strong> cuenca =<br />
Área entre<br />
isoyetas (km2)<br />
<strong>Cuenca</strong> Suches - Puente Ramón Castil<strong>la</strong><br />
212.90 152804.26<br />
1056.49 km2<br />
Pi*Si<br />
(mm*km2)<br />
Precipitación media<br />
<strong>de</strong>l área <strong>de</strong><br />
influencia <strong>de</strong> <strong>la</strong><br />
estación (mm)<br />
Precipitación media<br />
<strong>de</strong> <strong>la</strong> estación (mm)<br />
Constante <strong>de</strong><br />
proporcionalidad <strong>de</strong><br />
precipitación <strong>de</strong> <strong>la</strong><br />
estación<br />
Constante <strong>de</strong><br />
proporcionalidad <strong>de</strong> Coeficiente <strong>de</strong> <strong>la</strong><br />
superficie <strong>de</strong> <strong>la</strong> estación<br />
estación<br />
MINAG-ANA-DCPRH-AGUAS SUPERFICIALES Pág.186
<strong>Estudio</strong> <strong>Hidrológico</strong> <strong>de</strong> <strong>la</strong>s <strong>Cuenca</strong>s Huancané y Suches 2010<br />
Superficie total <strong>de</strong> <strong>la</strong> cuenca (St) = 2222.07 km2<br />
Estación<br />
Isoyeta Precipitación<br />
media entre<br />
isoyetas (mm)<br />
Inferior Superior<br />
(mm) (mm) Pi Si Sj Pmai = Sj/Si Pmei Ki = Pmai/Pmei Ri = Si/St Cei = Ki*Ri<br />
450.0 475.0 462.5 2.51 1160.88<br />
475.0 500.0 487.5 9.42 4592.25<br />
500.0 525.0 512.5 17.30 8866.25<br />
525.0 550.0 537.5 21.19 11389.63<br />
550.0 575.0 562.5 15.34 8628.75<br />
575.0 600.0 587.5 12.11 7114.63<br />
Ananea 618.00 621.70 0.99405 0.09399 0.09343<br />
600.0 625.0 612.5 18.05 11055.63<br />
625.0 650.0 637.5 19.14 12201.75<br />
650.0 675.0 662.5 35.60 23585.00<br />
675.0 700.0 687.5 39.24 26977.50<br />
700.0 725.0 712.5 18.92 13480.50<br />
725.0 750.0 737.5 0.04 29.50<br />
Sumatoria<br />
208.86 129082.27<br />
375.0 400.0 387.5 15.34 5944.25<br />
400.0 425.0 412.5 41.64 17176.50<br />
425.0 450.0 437.5 54.83 23988.13<br />
450.0 475.0 462.5 75.23 34793.88<br />
475.0 500.0 487.5 87.88 42841.50<br />
500.0 525.0 512.5 111.09 56933.63<br />
Suches 525.0 550.0 537.5 107.33 57689.88 536.60 540.80 0.99223 0.38806<br />
550.0 575.0 562.5 100.19 56356.88<br />
575.0 600.0 587.5 85.94 50489.75<br />
600.0 625.0 612.5 71.64 43879.50<br />
625.0 650.0 637.5 56.40 35955.00<br />
650.0 675.0 662.5 38.91 25777.88<br />
675.0 700.0 687.5 15.88 10917.50<br />
Sumatoria<br />
862.30 462744.28<br />
525.0 550.0 537.5 8.98 4826.75<br />
550.0 575.0 562.5 33.35 18759.38<br />
575.0 600.0 587.5 50.14 29457.25<br />
600.0 625.0 612.5 65.85 40333.13<br />
625.0 650.0 637.5 79.65 50776.88<br />
650.0 675.0 662.5 94.93 62891.13<br />
675.0 700.0 687.5 122.34 84108.75<br />
Cojata 700.0 725.0 712.5 156.94 111819.75 711.70 743.60 0.95710 0.51071 0.48880<br />
725.0 750.0 737.5 160.63 118464.63<br />
750.0 775.0 762.5 127.71 97378.88<br />
775.0 800.0 787.5 119.16 93838.50<br />
800.0 825.0 812.5 67.75 55046.88<br />
825.0 850.0 837.5 35.87 30041.13<br />
850.0 875.0 862.5 11.47 9892.88<br />
875.0 900.0 887.5 0.07 62.13<br />
Sumatoria<br />
1134.84 807698.05<br />
800.0 825.0 812.5 0.05 40.63<br />
825.0 850.0 837.5 3.39 2839.13<br />
Puerto Acosta 864.40 729.10 1.18557 0.00723<br />
850.0 875.0 862.5 7.94 6848.25<br />
875.0 900.0 887.5 4.69 4162.38<br />
Sumatoria<br />
Área total <strong>de</strong> <strong>la</strong> cuenca =<br />
Área entre<br />
isoyetas (km2)<br />
<strong>Cuenca</strong> Suches - Lugar Cuchaul<strong>la</strong><br />
16.07 13890.39<br />
2222.07 km2<br />
Pi*Si<br />
(mm*km2)<br />
Precipitación media<br />
<strong>de</strong>l área <strong>de</strong><br />
influencia <strong>de</strong> <strong>la</strong><br />
estación (mm)<br />
Precipitación media<br />
<strong>de</strong> <strong>la</strong> estación (mm)<br />
Constante <strong>de</strong><br />
proporcionalidad <strong>de</strong><br />
precipitación <strong>de</strong> <strong>la</strong><br />
estación<br />
Constante <strong>de</strong><br />
proporcionalidad <strong>de</strong><br />
superficie <strong>de</strong> <strong>la</strong><br />
estación<br />
Coeficiente <strong>de</strong> <strong>la</strong><br />
estación<br />
Aplicando los métodos <strong>de</strong> Polígonos <strong>de</strong> Thiessen y Polígonos <strong>de</strong> Thiessen Modificado, con<br />
sus coeficientes <strong>de</strong> cada estación meteorológica <strong>de</strong> influencia en <strong>la</strong> cuenca y en <strong>la</strong>s<br />
subcuencas <strong>de</strong> estudio, se ha calcu<strong>la</strong>do <strong>la</strong> precipitación areal <strong>de</strong> <strong>la</strong> cuenca <strong>de</strong>l pe<strong>río</strong>do<br />
1956-2009, dicha información se muestran a continuación en los Cuadros Nº 5.18 a 5.21 y<br />
en <strong>la</strong>s Figuras Nº 5.11 a 5.14.<br />
MINAG-ANA-DCPRH-AGUAS SUPERFICIALES Pág.187<br />
0.38504<br />
0.00857
<strong>Estudio</strong> <strong>Hidrológico</strong> <strong>de</strong> <strong>la</strong>s <strong>Cuenca</strong>s Huancané y Suches 2010<br />
Precipitación (mm)<br />
Cuadro Nº 5.18 Precipitación areal <strong>de</strong> <strong>la</strong> cuenca (mm) – Promedio multimensual (1956-2009)<br />
<strong>Cuenca</strong> Huancané – Método <strong>de</strong> Polígonos <strong>de</strong> Thiessen Modificado<br />
<strong>Cuenca</strong>/subcuenca<br />
Huancané<br />
L<strong>la</strong>che<br />
Tuyto<br />
Muñani<br />
Pistune<br />
Alto Huancané<br />
Guanaco<br />
Yaputira<br />
Huancané (total)<br />
Ene Feb Mar Abr May Jun Jul Ago Sep Oct Nov Dic<br />
153.0 116.9 105.0 51.5 14.9 5.9 5.2 11.6 32.7 51.1 69.8 110.8 728.5<br />
146.0 105.3 101.0 51.0 13.1 4.8 3.8 8.9 30.5 47.9 71.8 103.3 687.4<br />
169.8 130.6 117.4 56.5 17.9 7.7 6.1 15.8 40.1 58.2 73.0 122.8 815.8<br />
143.5 111.3 93.4 45.7 10.9 4.0 2.7 6.9 26.8 44.3 65.2 105.3 660.0<br />
153.4 115.0 108.4 54.7 14.9 6.1 4.8 11.8 33.9 53.0 73.9 109.7 739.7<br />
141.5 110.2 99.3 50.8 17.8 6.3 9.7 13.6 28.8 50.2 67.0 101.2 696.5<br />
139.2 113.6 94.5 46.2 12.3 4.6 3.1 7.8 27.0 44.4 65.5 104.6 662.6<br />
162.4 131.8 119.6 63.6 19.3 9.8 7.3 18.9 41.3 63.9 75.6 115.4 828.9<br />
152.4 116.5 104.8 51.2 14.8 5.8 5.2 11.6 32.6 51.0 69.5 110.7 726.2<br />
Cuadro Nº 5.19 Precipitación areal <strong>de</strong> <strong>la</strong> cuenca (mm) – Promedio multimensual (1956-2009)<br />
<strong>Cuenca</strong> Huancané – Método <strong>de</strong> Polígonos <strong>de</strong> Thiessen<br />
<strong>Cuenca</strong>/subcuenca<br />
Huancané<br />
L<strong>la</strong>che<br />
Tuyto<br />
Muñani<br />
Pistune<br />
Alto Huancané<br />
Guanaco<br />
Yaputira<br />
Huancané (total)<br />
MINAG-ANA-DCPRH-AGUAS SUPERFICIALES Pág.188<br />
Mes<br />
Mes<br />
Ene Feb Mar Abr May Jun Jul Ago Sep Oct Nov Dic<br />
Total<br />
Anual<br />
Total<br />
Anual<br />
147.1 112.2 100.8 49.5 14.3 5.6 5.0 11.1 31.4 49.0 67.1 106.4 699.6<br />
146.9 105.8 101.6 51.3 13.2 4.8 3.8 8.9 30.6 48.1 72.3 103.9 691.2<br />
158.4 121.5 109.1 52.5 16.7 7.2 5.7 14.7 37.4 54.0 67.8 114.3 759.2<br />
143.8 111.7 93.8 45.9 11.0 4.1 2.8 6.9 27.0 44.5 65.5 105.6 662.4<br />
145.9 109.4 103.1 52.1 14.2 5.9 4.6 11.2 32.3 50.5 70.3 104.3 703.8<br />
131.7 102.2 92.3 47.2 16.4 5.8 8.8 12.5 26.8 46.6 62.4 94.1 646.9<br />
146.3 120.1 100.0 49.0 13.2 4.9 3.3 8.4 28.6 46.9 69.2 110.2 700.1<br />
145.7 118.2 107.3 57.1 17.3 8.8 6.5 16.9 37.1 57.3 67.8 103.6 743.6<br />
146.9 112.2 100.8 49.3 14.2 5.6 4.9 11.1 31.4 49.0 67.0 106.6 698.9<br />
Figura Nº 5.11 Variación mensual <strong>de</strong> <strong>la</strong> precipitación areal <strong>de</strong> <strong>la</strong> cuenca (mm) - Promedio multimensual<br />
(1956-2009) - <strong>Cuenca</strong> Huancané - Método <strong>de</strong> Polígonos <strong>de</strong> Thiessen Modificado<br />
200<br />
160<br />
120<br />
80<br />
40<br />
0<br />
<strong>Cuenca</strong> <strong>río</strong> Huancané (Pte.Huancané)<br />
153.0<br />
116.9<br />
105.0<br />
51.5<br />
14.9<br />
5.9 5.2<br />
11.6<br />
32.7<br />
51.1<br />
69.8<br />
110.8<br />
Ene Feb Mar Abr May Jun Jul Ago Sep Oct Nov Dic<br />
Tiempo (mes)<br />
Precipitación (mm)<br />
200<br />
160<br />
120<br />
80<br />
40<br />
0<br />
146.0<br />
105.3 101.0<br />
Subcuenca L<strong>la</strong>che<br />
51.0<br />
13.1<br />
4.8 3.8<br />
8.9<br />
30.5<br />
47.9<br />
71.8<br />
103.3<br />
Ene Feb Mar Abr May Jun Jul Ago Sep Oct Nov Dic<br />
Tiempo (mes)
<strong>Estudio</strong> <strong>Hidrológico</strong> <strong>de</strong> <strong>la</strong>s <strong>Cuenca</strong>s Huancané y Suches 2010<br />
Precipitación (mm)<br />
Precipitación (mm)<br />
Precipitación (mm)<br />
200<br />
160<br />
120<br />
80<br />
40<br />
0<br />
200<br />
160<br />
120<br />
80<br />
40<br />
0<br />
200<br />
160<br />
120<br />
80<br />
40<br />
0<br />
169.8<br />
130.6<br />
117.4<br />
Subcuenca Tuyto<br />
56.5<br />
17.9<br />
7.7 6.1<br />
15.8<br />
40.1<br />
58.2<br />
73.0<br />
122.8<br />
Ene Feb Mar Abr May Jun Jul Ago Sep Oct Nov Dic<br />
153.4<br />
115.0 108.4<br />
54.7<br />
14.9<br />
Tiempo (mes)<br />
6.1 4.8<br />
11.8<br />
33.9<br />
53.0<br />
73.9<br />
109.7<br />
Ene Feb Mar Abr May Jun Jul Ago Sep Oct Nov Dic<br />
139.2<br />
113.6<br />
94.5<br />
Subcuenca Pistune<br />
Tiempo (mes)<br />
Subcuenca <strong>río</strong> Guanaco<br />
46.2<br />
12.3<br />
4.6 3.1<br />
7.8<br />
27.0<br />
44.4<br />
65.5<br />
104.6<br />
Ene Feb Mar Abr May Jun Jul Ago Sep Oct Nov Dic<br />
Tiempo (mes)<br />
Precipitación (mm)<br />
200<br />
160<br />
120<br />
80<br />
40<br />
0<br />
152.4<br />
MINAG-ANA-DCPRH-AGUAS SUPERFICIALES Pág.189<br />
Precipitación (mm)<br />
Precipitación (mm)<br />
200<br />
160<br />
120<br />
80<br />
40<br />
0<br />
200<br />
160<br />
120<br />
80<br />
40<br />
0<br />
200<br />
160<br />
120<br />
80<br />
40<br />
0<br />
143.5<br />
111.3<br />
93.4<br />
Subcuenca Muñani<br />
45.7<br />
10.9<br />
4.0 2.7<br />
6.9<br />
26.8<br />
44.3<br />
65.2<br />
105.3<br />
Ene Feb Mar Abr May Jun Jul Ago Sep Oct Nov Dic<br />
141.5<br />
110.2<br />
99.3<br />
50.8<br />
17.8<br />
Tiempo (mes)<br />
Subcuenca Alto Huancané<br />
6.3<br />
9.7<br />
13.6<br />
28.8<br />
50.2<br />
67.0<br />
101.2<br />
Ene Feb Mar Abr May Jun Jul Ago Sep Oct Nov Dic<br />
162.4<br />
131.8<br />
119.6<br />
<strong>Cuenca</strong> <strong>río</strong> Huancané (cuenca total)<br />
116.5<br />
104.8<br />
51.2<br />
14.8<br />
Precipitación (mm)<br />
5.8 5.2<br />
11.6<br />
63.6<br />
19.3<br />
Tiempo (mes)<br />
Subcuenca <strong>río</strong> Yaputira<br />
9.8 7.3<br />
18.9<br />
41.3<br />
63.9<br />
75.6<br />
115.4<br />
Ene Feb Mar Abr May Jun Jul Ago Sep Oct Nov Dic<br />
32.6<br />
51.0<br />
69.5<br />
110.7<br />
Ene Feb Mar Abr May Jun Jul Ago Sep Oct Nov Dic<br />
Tiempo (mes)<br />
Tiempo (mes)
<strong>Estudio</strong> <strong>Hidrológico</strong> <strong>de</strong> <strong>la</strong>s <strong>Cuenca</strong>s Huancané y Suches 2010<br />
Precipitación (mm)<br />
Precipitación (mm)<br />
Precipitación (mm)<br />
Figura Nº 5.12 Variación mensual <strong>de</strong> <strong>la</strong> precipitación areal <strong>de</strong> <strong>la</strong> cuenca (mm) - Promedio multimensual<br />
(1956-2009) - <strong>Cuenca</strong> Huancané - Método <strong>de</strong> Polígonos <strong>de</strong> Thiessen<br />
200<br />
160<br />
120<br />
80<br />
40<br />
0<br />
200<br />
160<br />
120<br />
80<br />
40<br />
0<br />
200<br />
160<br />
120<br />
80<br />
40<br />
0<br />
<strong>Cuenca</strong> <strong>río</strong> Huancané (Pte.Huancané)<br />
147.1<br />
112.2<br />
100.8<br />
49.5<br />
14.3<br />
5.6 5.0<br />
11.1<br />
31.4<br />
49.0<br />
67.1<br />
106.4<br />
Ene Feb Mar Abr May Jun Jul Ago Sep Oct Nov Dic<br />
158.4<br />
121.5<br />
109.1<br />
52.5<br />
16.7<br />
Tiempo (mes)<br />
7.2 5.7<br />
14.7<br />
37.4<br />
54.0<br />
67.8<br />
114.3<br />
Ene Feb Mar Abr May Jun Jul Ago Sep Oct Nov Dic<br />
145.9<br />
109.4 103.1<br />
Subcuenca Tuyto<br />
Tiempo (mes)<br />
Subcuenca Pistune<br />
52.1<br />
14.2<br />
5.9 4.6<br />
11.2<br />
32.3<br />
50.5<br />
70.3<br />
104.3<br />
Ene Feb Mar Abr May Jun Jul Ago Sep Oct Nov Dic<br />
Tiempo (mes)<br />
MINAG-ANA-DCPRH-AGUAS SUPERFICIALES Pág.190<br />
Precipitación (mm)<br />
Precipitación (mm)<br />
Precipitación (mm)<br />
200<br />
160<br />
120<br />
80<br />
40<br />
0<br />
200<br />
160<br />
120<br />
80<br />
40<br />
0<br />
200<br />
160<br />
120<br />
80<br />
40<br />
0<br />
146.9<br />
105.8 101.6<br />
Subcuenca L<strong>la</strong>che<br />
51.3<br />
13.2<br />
4.8 3.8<br />
8.9<br />
30.6<br />
48.1<br />
72.3<br />
103.9<br />
Ene Feb Mar Abr May Jun Jul Ago Sep Oct Nov Dic<br />
143.8<br />
111.7<br />
93.8<br />
45.9<br />
11.0<br />
Tiempo (mes)<br />
Subcuenca Muñani<br />
4.1 2.8<br />
6.9<br />
27.0<br />
44.5<br />
65.5<br />
105.6<br />
Ene Feb Mar Abr May Jun Jul Ago Sep Oct Nov Dic<br />
131.7<br />
102.2<br />
92.3<br />
47.2<br />
16.4<br />
Tiempo (mes)<br />
Subcuenca Alto Huancané<br />
5.8 8.8 12.5<br />
26.8<br />
46.6<br />
62.4<br />
94.1<br />
Ene Feb Mar Abr May Jun Jul Ago Sep Oct Nov Dic<br />
Tiempo (mes)
<strong>Estudio</strong> <strong>Hidrológico</strong> <strong>de</strong> <strong>la</strong>s <strong>Cuenca</strong>s Huancané y Suches 2010<br />
Precipitación (mm)<br />
200<br />
160<br />
120<br />
80<br />
40<br />
0<br />
146.3<br />
120.1<br />
100.0<br />
Subcuenca <strong>río</strong> Guanaco<br />
49.0<br />
13.2<br />
4.9 3.3<br />
8.4<br />
28.6<br />
46.9<br />
69.2<br />
110.2<br />
Ene Feb Mar Abr May Jun Jul Ago Sep Oct Nov Dic<br />
Tiempo (mes)<br />
Precipitación (mm)<br />
200<br />
160<br />
120<br />
80<br />
40<br />
0<br />
146.9<br />
MINAG-ANA-DCPRH-AGUAS SUPERFICIALES Pág.191<br />
200<br />
160<br />
120<br />
80<br />
40<br />
0<br />
145.7<br />
<strong>Cuenca</strong> <strong>río</strong> Huancané (cuenca total)<br />
112.2<br />
100.8<br />
49.3<br />
14.2<br />
Precipitación (mm)<br />
5.6 4.9<br />
11.1<br />
118.2<br />
107.3<br />
Subcuenca <strong>río</strong> Yaputira<br />
57.1<br />
17.3<br />
8.8 6.5<br />
16.9<br />
37.1<br />
57.3<br />
67.8<br />
103.6<br />
Ene Feb Mar Abr May Jun Jul Ago Sep Oct Nov Dic<br />
31.4<br />
49.0<br />
67.0<br />
106.6<br />
Ene Feb Mar Abr May Jun Jul Ago Sep Oct Nov Dic<br />
Tiempo (mes)<br />
Tiempo (mes)<br />
Cuadro Nº 5.20 Precipitación areal <strong>de</strong> <strong>la</strong> cuenca (mm) – Promedio multimensual (1956-2009)<br />
<strong>Cuenca</strong> Suches – Método <strong>de</strong> Polígonos <strong>de</strong> Thiessen Modificado<br />
<strong>Cuenca</strong>/subcuenca<br />
Suches (Pte. Escoma)<br />
Chueña Huata Jahuira<br />
Caylloma<br />
Trapiche<br />
Suches (Pte.Ramón Castil<strong>la</strong>)<br />
Suches (lugar Cuchaul<strong>la</strong>)<br />
Mes<br />
Ene Feb Mar Abr May Jun Jul Ago Sep Oct Nov Dic<br />
Total<br />
Anual<br />
133.6 109.8 98.1 51.3 18.4 7.7 6.9 15.2 36.4 49.8 61.3 92.5 680.8<br />
154.1 125.0 113.5 60.3 18.3 9.3 6.9 17.9 39.2 60.6 71.7 109.5 786.4<br />
138.6 112.8 103.4 53.2 17.6 7.7 8.1 15.8 33.7 53.9 65.2 98.5 708.3<br />
107.6 87.8 87.3 40.6 13.7 4.4 6.5 10.3 26.9 41.9 53.2 74.3 554.5<br />
114.5 93.3 91.5 43.7 14.1 5.1 6.2 11.4 29.1 44.8 56.1 79.4 589.1<br />
124.0 100.9 95.9 47.9 15.0 6.4 6.0 13.2 31.8 48.6 59.5 86.8 636.1<br />
Cuadro Nº 5.21 Precipitación areal <strong>de</strong> <strong>la</strong> cuenca (mm) – Promedio multimensual (1956-2009)<br />
<strong>Cuenca</strong> Suches – Método <strong>de</strong> Polígonos <strong>de</strong> Thiessen<br />
<strong>Cuenca</strong>/subcuenca<br />
Suches (Pte. Escoma)<br />
Chueña Huata Jahuira<br />
Caylloma<br />
Trapiche<br />
Suches (Pte.Ramón Castil<strong>la</strong>)<br />
Suches (lugar Cuchaul<strong>la</strong>)<br />
Mes<br />
Ene Feb Mar Abr May Jun Jul Ago Sep Oct Nov Dic<br />
Total<br />
Anual<br />
128.6 105.5 95.0 49.4 17.3 7.3 6.6 14.5 34.7 48.4 59.5 89.2 655.9<br />
145.7 118.2 107.3 57.1 17.3 8.8 6.5 16.9 37.1 57.3 67.8 103.6 743.6<br />
134.2 109.1 99.7 51.5 17.0 7.5 7.7 15.3 32.7 52.2 62.9 95.4 685.3<br />
110.0 89.8 89.0 41.4 14.1 4.5 6.7 10.7 27.4 42.8 54.3 76.1 566.9<br />
116.2 94.6 92.9 44.3 14.4 5.2 6.3 11.6 29.6 45.4 56.9 80.6 597.8<br />
127.4 103.6 98.5 49.2 15.4 6.6 6.2 13.6 32.7 50.0 61.1 89.2 653.4
<strong>Estudio</strong> <strong>Hidrológico</strong> <strong>de</strong> <strong>la</strong>s <strong>Cuenca</strong>s Huancané y Suches 2010<br />
Precipitación (mm)<br />
Precipitación (mm)<br />
Precipitación (mm)<br />
Figura Nº 5.13 Variación mensual <strong>de</strong> <strong>la</strong> precipitación areal <strong>de</strong> <strong>la</strong> cuenca (mm) - Promedio multimensual<br />
(1956-2009) - <strong>Cuenca</strong> Suches - Método <strong>de</strong> Polígonos <strong>de</strong> Thiessen Modificado<br />
200<br />
160<br />
120<br />
80<br />
40<br />
0<br />
200<br />
160<br />
120<br />
80<br />
40<br />
0<br />
200<br />
160<br />
120<br />
80<br />
40<br />
0<br />
133.6<br />
<strong>Cuenca</strong> <strong>río</strong> Suches (Pte. Escoma)<br />
109.8<br />
98.1<br />
51.3<br />
18.4<br />
7.7 6.9<br />
15.2<br />
36.4<br />
49.8<br />
61.3<br />
92.5<br />
Ene Feb Mar Abr May Jun Jul Ago Sep Oct Nov Dic<br />
138.6<br />
112.8 103.4<br />
Tiempo (mes)<br />
Subcuenca Caylloma<br />
53.2<br />
17.6<br />
7.7 8.1<br />
15.8<br />
33.7<br />
53.9<br />
65.2<br />
98.5<br />
Ene Feb Mar Abr May Jun Jul Ago Sep Oct Nov Dic<br />
Tiempo (mes)<br />
<strong>Cuenca</strong> <strong>río</strong> Suches (Pte.Ramón Castil<strong>la</strong>)<br />
114.5<br />
93.3 91.5<br />
43.7<br />
14.1<br />
5.1<br />
6.2<br />
11.4<br />
29.1<br />
44.8<br />
56.1<br />
79.4<br />
Ene Feb Mar Abr May Jun Jul Ago Sep Oct Nov Dic<br />
Tiempo (mes)<br />
MINAG-ANA-DCPRH-AGUAS SUPERFICIALES Pág.192<br />
Precipitación (mm)<br />
Precipitación (mm)<br />
Precipitación (mm)<br />
200<br />
160<br />
120<br />
80<br />
40<br />
0<br />
200<br />
160<br />
120<br />
80<br />
40<br />
0<br />
200<br />
160<br />
120<br />
154.1<br />
Subcuenca Chueña Huata Jahuira<br />
125.0<br />
113.5<br />
60.3<br />
18.3<br />
9.3 6.9<br />
17.9<br />
39.2<br />
60.6<br />
71.7<br />
109.5<br />
Ene Feb Mar Abr May Jun Jul Ago Sep Oct Nov Dic<br />
107.6<br />
87.8 87.3<br />
40.6<br />
13.7<br />
Tiempo (mes)<br />
Subcuenca Trapiche<br />
4.4<br />
6.5<br />
10.3<br />
26.9<br />
41.9<br />
53.2<br />
74.3<br />
Ene Feb Mar Abr May Jun Jul Ago Sep Oct Nov Dic<br />
124.0<br />
100.9 95.9<br />
47.9<br />
15.0<br />
Tiempo (mes)<br />
<strong>Cuenca</strong> <strong>río</strong> Suches (lugar Cuchaul<strong>la</strong>, Perú-Bolivia)<br />
80<br />
40<br />
0<br />
6.4 6.0<br />
13.2<br />
31.8<br />
48.6<br />
59.5<br />
86.8<br />
Ene Feb Mar Abr May Jun Jul Ago Sep Oct Nov Dic<br />
Tiempo (mes)
<strong>Estudio</strong> <strong>Hidrológico</strong> <strong>de</strong> <strong>la</strong>s <strong>Cuenca</strong>s Huancané y Suches 2010<br />
Precipitación (mm)<br />
Precipitación (mm)<br />
Precipitación (mm)<br />
Figura Nº 5.14 Variación mensual <strong>de</strong> <strong>la</strong> precipitación areal <strong>de</strong> <strong>la</strong> cuenca (mm) - Promedio multimensual<br />
(1956-2009) - <strong>Cuenca</strong> Suches - Método <strong>de</strong> Polígonos <strong>de</strong> Thiessen<br />
200<br />
160<br />
120<br />
80<br />
40<br />
0<br />
200<br />
160<br />
120<br />
80<br />
40<br />
0<br />
200<br />
160<br />
120<br />
80<br />
40<br />
0<br />
128.6<br />
<strong>Cuenca</strong> <strong>río</strong> Suches (Pte. Escoma)<br />
105.5<br />
95.0<br />
49.4<br />
17.3<br />
7.3 6.6<br />
14.5<br />
34.7<br />
48.4<br />
59.5<br />
89.2<br />
Ene Feb Mar Abr May Jun Jul Ago Sep Oct Nov Dic<br />
134.2<br />
109.1 99.7<br />
Tiempo (mes)<br />
Subcuenca Caylloma<br />
51.5<br />
17.0<br />
7.5 7.7<br />
15.3<br />
32.7<br />
52.2<br />
62.9<br />
95.4<br />
Ene Feb Mar Abr May Jun Jul Ago Sep Oct Nov Dic<br />
Tiempo (mes)<br />
<strong>Cuenca</strong> <strong>río</strong> Suches (Pte.Ramón Castil<strong>la</strong>)<br />
116.2<br />
94.6 92.9<br />
44.3<br />
14.4<br />
5.2<br />
6.3<br />
11.6<br />
29.6<br />
45.4<br />
56.9<br />
80.6<br />
Ene Feb Mar Abr May Jun Jul Ago Sep Oct Nov Dic<br />
Tiempo (mes)<br />
MINAG-ANA-DCPRH-AGUAS SUPERFICIALES Pág.193<br />
Precipitación (mm)<br />
Precipitación (mm)<br />
Precipitación (mm)<br />
200<br />
160<br />
120<br />
80<br />
40<br />
0<br />
200<br />
160<br />
120<br />
80<br />
40<br />
0<br />
200<br />
160<br />
120<br />
80<br />
40<br />
0<br />
145.7<br />
Subcuenca Chueña Huata Jahuira<br />
118.2<br />
107.3<br />
57.1<br />
17.3<br />
8.8 6.5<br />
16.9<br />
37.1<br />
57.3<br />
67.8<br />
103.6<br />
Ene Feb Mar Abr May Jun Jul Ago Sep Oct Nov Dic<br />
110.0<br />
89.8 89.0<br />
41.4<br />
14.1<br />
Tiempo (mes)<br />
Subcuenca Trapiche<br />
4.5<br />
6.7<br />
10.7<br />
27.4<br />
42.8<br />
54.3<br />
76.1<br />
Ene Feb Mar Abr May Jun Jul Ago Sep Oct Nov Dic<br />
127.4<br />
103.6 98.5<br />
49.2<br />
15.4<br />
Tiempo (mes)<br />
<strong>Cuenca</strong> <strong>río</strong> Suches (lugar Cuchaul<strong>la</strong>, Perú-Bolivia)<br />
6.6 6.2<br />
13.6<br />
32.7<br />
50.0<br />
61.1<br />
89.2<br />
Ene Feb Mar Abr May Jun Jul Ago Sep Oct Nov Dic<br />
Tiempo (mes)<br />
La serie mensual <strong>de</strong> <strong>la</strong>s precipitaciones areales calcu<strong>la</strong>das para <strong>la</strong>s subcuencas <strong>de</strong> <strong>la</strong>s<br />
cuencas Huancané y Suches, se muestran en el Anexo 1.
<strong>Estudio</strong> <strong>Hidrológico</strong> <strong>de</strong> <strong>la</strong>s <strong>Cuenca</strong>s Huancané y Suches 2010<br />
6.1 GENERALIDADES<br />
CAPÍTULO VI<br />
HIDROMETRÍA<br />
La hidrometría se encarga <strong>de</strong> medir, registrar, calcu<strong>la</strong>r y analizar los volúmenes <strong>de</strong> agua<br />
que circu<strong>la</strong>n en una sección transversal <strong>de</strong> un <strong>río</strong>, canal o tubería en <strong>la</strong> unidad <strong>de</strong> tiempo.<br />
Los escurrimientos en una cuenca se divi<strong>de</strong>n en tres componentes: superficial,<br />
subsuperficial y subterráneo, en el presente se trata <strong>de</strong>l primero.<br />
El superficial es el que se manifiesta por encima <strong>de</strong>l terreno natural, primariamente <strong>la</strong>minar<br />
hasta que luego se va concentrando en cauces, y sale finalmente <strong>de</strong> <strong>la</strong> cuenca. Se lo<br />
<strong>de</strong>nomina rápido, por el tiempo es el primer escurrimiento que se manifiesta en <strong>la</strong> sección<br />
<strong>de</strong> control <strong>de</strong> <strong>la</strong> cuenca.<br />
Sistema hidrométrico.- Es el conjunto <strong>de</strong> activida<strong>de</strong>s y procedimientos que permiten<br />
conocer los caudales <strong>de</strong> agua que circu<strong>la</strong>n en los cauces <strong>de</strong> los <strong>río</strong>s y canales <strong>de</strong> un sistema<br />
<strong>de</strong> riego, con el fin <strong>de</strong> registrar, procesar y programar <strong>la</strong> distribución <strong>de</strong>l agua. El sistema<br />
hidrométrico tiene como soporte físico <strong>la</strong> red hidrométrica.<br />
Red hidrométrica.- Es el conjunto <strong>de</strong> puntos ubicados estratégicamente en el sistema<br />
hidrográfico. Los puntos <strong>de</strong> medición <strong>de</strong>ben ser a<strong>de</strong>cuadamente ubicados a fin <strong>de</strong><br />
<strong>de</strong>terminar el caudal que circu<strong>la</strong> en toda <strong>la</strong> red hidrográfica.<br />
Puntos <strong>de</strong> control.- Son los lugares don<strong>de</strong> se registran los caudales <strong>de</strong> agua que circu<strong>la</strong>n<br />
por una sección hidráulica que pue<strong>de</strong>n ser: estaciones hidrométricas, estructuras<br />
hidráulicas, compuertas, caídas, verte<strong>de</strong>ros, medidores Parshall, RBC, ASC (Aforador Sin<br />
Cuello), miras, etc.<br />
Caudal.- Es el volumen <strong>de</strong> agua por unidad <strong>de</strong> tiempo que pasa por una sección <strong>de</strong> un<br />
cauce. Sus unida<strong>de</strong>s normales son m 3 /s ó l/s.<br />
6.2 RED DE ESTACIONES HIDROMÉTRICAS<br />
Las estaciones hidrométricas en <strong>la</strong>s cuencas hidrográficas <strong>de</strong>l país, están ubicadas<br />
generalmente en <strong>la</strong> parte inferior <strong>de</strong> <strong>la</strong> cuenca húmeda, y muy pocas a nivel <strong>de</strong> subcuencas.<br />
El Servicio Nacional <strong>de</strong> Meteorología e Hidrología (SENAMHI), perteneciente al<br />
Ministerio <strong>de</strong>l Ambiente, administra <strong>la</strong> mayor parte <strong>de</strong> <strong>la</strong>s estaciones en <strong>la</strong>s tres regiones<br />
hidrográficas <strong>de</strong>l Perú.<br />
MINAG-ANA-DCPRH-AGUAS SUPERFICIALES Pág.194
<strong>Estudio</strong> <strong>Hidrológico</strong> <strong>de</strong> <strong>la</strong>s <strong>Cuenca</strong>s Huancané y Suches 2010<br />
Mapa Nº 6.1 Ubicación <strong>de</strong> <strong>la</strong>s estaciones hidrométricas – <strong>Cuenca</strong>s Huancané y Suches<br />
Estación<br />
Hidrométrica<br />
Puente Ramis<br />
MINAG-ANA-DCPRH-AGUAS SUPERFICIALES Pág.195
<strong>Estudio</strong> <strong>Hidrológico</strong> <strong>de</strong> <strong>la</strong>s <strong>Cuenca</strong>s Huancané y Suches 2010<br />
En <strong>la</strong>s cuencas <strong>de</strong> los <strong>río</strong>s Huancané y Suches existen una estación hidrométrica en cada<br />
una <strong>de</strong> el<strong>la</strong>s, con registro <strong>de</strong> caudales históricos en forma significativa en Huancané y muy<br />
poca en Suches, a<strong>de</strong>más se cuenta con <strong>la</strong> información <strong>de</strong> <strong>de</strong>scargas históricas <strong>de</strong> <strong>la</strong> cuenca<br />
<strong>de</strong>l <strong>río</strong> Ramis, esta información servirá para realizar el análisis <strong>de</strong> consistencia y<br />
completación <strong>de</strong> <strong>la</strong> información <strong>de</strong> <strong>la</strong>s cuencas <strong>de</strong> los <strong>río</strong>s Huancané y Suches. En el<br />
siguiente cuadro se muestra en forma gráfica <strong>la</strong> longitud <strong>de</strong> registro histórico <strong>de</strong> caudales.<br />
Cuadro Nº 6.1 Longitud <strong>de</strong>l registro histórico <strong>de</strong> <strong>la</strong>s <strong>de</strong>scargas <strong>de</strong> <strong>la</strong>s cuencas Huancané, Suches y Ramis<br />
Nº Río Estación<br />
Pe<strong>río</strong>do <strong>de</strong> registro<br />
1956<br />
1957<br />
1958<br />
1959<br />
1960<br />
1961<br />
1962<br />
1963<br />
1964<br />
1965<br />
1966<br />
1967<br />
1968<br />
1969<br />
1970<br />
1971<br />
1972<br />
1973<br />
1974<br />
1975<br />
1976<br />
1977<br />
1978<br />
1979<br />
1980<br />
1981<br />
1982<br />
1983<br />
1984<br />
1985<br />
1986<br />
1987<br />
1988<br />
1989<br />
1990<br />
1991<br />
1992<br />
1993<br />
1994<br />
1995<br />
1996<br />
1997<br />
1998<br />
1999<br />
2000<br />
2001<br />
2002<br />
2003<br />
2004<br />
2005<br />
2006<br />
2007<br />
<strong>2008</strong><br />
2009<br />
1 Huancané Pte.Huancané 54<br />
2 Suches Pte.Escoma 11<br />
3 Ramis Pte.Ramis 54<br />
6.2.1 Estación hidrométrica Puente Huancané - Río Huancané<br />
La estación hidrométrica Puente Huancané, geográficamente se localiza en <strong>la</strong>s coor<strong>de</strong>nadas<br />
geográficas <strong>de</strong> 15º12'57.10" <strong>de</strong> <strong>la</strong>titud sur y 69º47'33.37" <strong>de</strong> longitud oeste, y a una altitud<br />
<strong>de</strong> 3,814 msnm.<br />
La estación hidrométrica Puente Huancané <strong>de</strong> <strong>la</strong> cuenca <strong>de</strong>l <strong>río</strong> Huancané, políticamente se<br />
encuentra ubicada en:<br />
- País : Perú<br />
- Región : Puno<br />
- Provincia : Huancané<br />
- Distrito : Huancané<br />
Se ubica en <strong>la</strong> parte baja <strong>de</strong> <strong>la</strong> cuenca <strong>de</strong>l <strong>río</strong> Huancané y mi<strong>de</strong> todo el escurrimiento <strong>de</strong> <strong>la</strong><br />
cuenca, cuya área <strong>de</strong> drenaje hasta <strong>la</strong> estación hidrométrica es <strong>de</strong> 3,511.10 km 2 .<br />
Este punto <strong>de</strong> aforo se ubica al final <strong>de</strong> <strong>la</strong>s áreas don<strong>de</strong> existen <strong>la</strong>s <strong>de</strong>mandas hídricas, por<br />
lo tanto el caudal registrado en épocas <strong>de</strong> estiaje es un caudal remanente <strong>de</strong> <strong>la</strong>s <strong>de</strong>mandas<br />
hídricas. Por otro <strong>la</strong>do el sistema hidrográfico <strong>de</strong> <strong>la</strong> cuenca <strong>de</strong>l <strong>río</strong> Huancané aun no está<br />
regu<strong>la</strong>do por represamientos.<br />
El registro histórico disponible <strong>de</strong> <strong>de</strong>scargas medias mensuales en <strong>la</strong> estación hidrométrica<br />
<strong>de</strong>l Puente Huancané es continuo <strong>de</strong>l pe<strong>río</strong>do 1956-2009, con 54 años <strong>de</strong> información.<br />
La estación hidrométrica Puente Huancané es administrada por el Servicio Nacional <strong>de</strong><br />
Meteorología e Hidrología - SENAMHI - Puno.<br />
MINAG-ANA-DCPRH-AGUAS SUPERFICIALES Pág.196<br />
Total<br />
años
<strong>Estudio</strong> <strong>Hidrológico</strong> <strong>de</strong> <strong>la</strong>s <strong>Cuenca</strong>s Huancané y Suches 2010<br />
Reg<strong>la</strong><br />
Limnimétrica<br />
Reg<strong>la</strong><br />
Limnimétrica<br />
Caseta<br />
Limnigráfica<br />
Estación hidrométrica Puente Huancané.<br />
Caseta<br />
Limnigráfica<br />
MINAG-ANA-DCPRH-AGUAS SUPERFICIALES Pág.197
<strong>Estudio</strong> <strong>Hidrológico</strong> <strong>de</strong> <strong>la</strong>s <strong>Cuenca</strong>s Huancané y Suches 2010<br />
6.2.2 Estación hidrométrica Puente Escoma - Río Suches<br />
La estación hidrométrica Puente Escoma, geográficamente se localiza en <strong>la</strong>s coor<strong>de</strong>nadas<br />
geográficas <strong>de</strong> 15º39'33" <strong>de</strong> <strong>la</strong>titud sur y 69º08'00" <strong>de</strong> longitud oeste, y a una altitud <strong>de</strong><br />
3,817 msnm.<br />
La estación hidrométrica Puente Escoma <strong>de</strong> <strong>la</strong> cuenca <strong>de</strong>l <strong>río</strong> Suches, políticamente se<br />
encuentra ubicada en:<br />
- País : Bolivia<br />
- Departamento : La Paz<br />
- Provincia : Camacho<br />
Se ubica en <strong>la</strong> parte baja <strong>de</strong> <strong>la</strong> cuenca <strong>de</strong>l <strong>río</strong> Suches y mi<strong>de</strong> todo el escurrimiento <strong>de</strong> <strong>la</strong><br />
cuenca, cuya área <strong>de</strong> drenaje hasta <strong>la</strong> estación hidrométrica es <strong>de</strong> 2,930.73 km 2 .<br />
Este punto <strong>de</strong> aforo se ubica al final <strong>de</strong> <strong>la</strong>s áreas don<strong>de</strong> existen <strong>la</strong>s <strong>de</strong>mandas hídricas, por<br />
lo tanto el caudal registrado en épocas <strong>de</strong> estiaje es un caudal remanente <strong>de</strong> <strong>la</strong>s <strong>de</strong>mandas<br />
hídricas. Por otro <strong>la</strong>do el sistema hidrográfico <strong>de</strong> <strong>la</strong> cuenca <strong>de</strong>l <strong>río</strong> Suches aun no está<br />
regu<strong>la</strong>do por represamientos.<br />
El registro histórico disponible <strong>de</strong> <strong>de</strong>scargas medias mensuales en <strong>la</strong> estación hidrométrica<br />
<strong>de</strong>l Puente Escoma es continuo <strong>de</strong>l pe<strong>río</strong>do 1970/77-1982/84, con 11 años <strong>de</strong> información.<br />
La estación hidrométrica Puente Escoma es administrada por el Servicio Nacional <strong>de</strong><br />
Meteorología e Hidrología - SENAMHI - Bolivia.<br />
6.2.3 Estación hidrométrica Puente Ramis - Río Ramis<br />
La estación hidrométrica Puente Ramis, geográficamente se localiza en <strong>la</strong>s coor<strong>de</strong>nadas<br />
geográficas <strong>de</strong> 15º15'15"" <strong>de</strong> <strong>la</strong>titud sur y 69º52'52"" <strong>de</strong> longitud oeste, y a una altitud <strong>de</strong><br />
3,813 msnm.<br />
La estación hidrométrica Puente Ramis <strong>de</strong> <strong>la</strong> cuenca <strong>de</strong>l <strong>río</strong> Ramis, políticamente se<br />
encuentra ubicada en:<br />
- País : Perú<br />
- Región : Puno<br />
- Provincia : Huancané<br />
- Distrito : Taraco<br />
Se ubica en <strong>la</strong> parte baja <strong>de</strong> <strong>la</strong> cuenca <strong>de</strong>l <strong>río</strong> Suches y mi<strong>de</strong> todo el escurrimiento <strong>de</strong> <strong>la</strong><br />
cuenca, cuya área <strong>de</strong> drenaje hasta <strong>la</strong> estación hidrométrica es <strong>de</strong> 14,867.0 km 2 .<br />
Este punto <strong>de</strong> aforo se ubica al final <strong>de</strong> <strong>la</strong>s áreas don<strong>de</strong> existen <strong>la</strong>s <strong>de</strong>mandas hídricas, por<br />
lo tanto el caudal registrado en épocas <strong>de</strong> estiaje es un caudal remanente <strong>de</strong> <strong>la</strong>s <strong>de</strong>mandas<br />
hídricas.<br />
El registro histórico disponible <strong>de</strong> <strong>de</strong>scargas medias mensuales en <strong>la</strong> estación hidrométrica<br />
<strong>de</strong>l Puente Ramis es continuo <strong>de</strong>l pe<strong>río</strong>do 1956-2009, con 54 años <strong>de</strong> información. La<br />
MINAG-ANA-DCPRH-AGUAS SUPERFICIALES Pág.198
<strong>Estudio</strong> <strong>Hidrológico</strong> <strong>de</strong> <strong>la</strong>s <strong>Cuenca</strong>s Huancané y Suches 2010<br />
estación hidrométrica Puente Ramis es administrada por el Servicio Nacional <strong>de</strong><br />
Meteorología e Hidrología - SENAMHI - Puno.<br />
Reg<strong>la</strong><br />
Limnimétrica<br />
Caseta<br />
Limnigráfica<br />
Estación<br />
hidrométrica<br />
automática<br />
Caseta<br />
Limnigráfica<br />
Reg<strong>la</strong><br />
Limnimétrica<br />
Estación hidrométrica Puente Ramis<br />
MINAG-ANA-DCPRH-AGUAS SUPERFICIALES Pág.199
<strong>Estudio</strong> <strong>Hidrológico</strong> <strong>de</strong> <strong>la</strong>s <strong>Cuenca</strong>s Huancané y Suches 2010<br />
6.3 ANÁLISIS DE CONSISTENCIA DE LA INFORMACIÓN HIDROMÉTRICA<br />
El análisis <strong>de</strong> consistencia <strong>de</strong> <strong>la</strong>s <strong>de</strong>scargas medias mensuales, se ha realizado simi<strong>la</strong>rmente<br />
con <strong>la</strong> misma metodología <strong>de</strong>scrita en el análisis <strong>de</strong> <strong>la</strong> información pluviométrica. A<br />
continuación se muestran los análisis respectivos.<br />
A.- Análisis visual <strong>de</strong> hidrogramas<br />
Este análisis se realiza para <strong>de</strong>tectar y i<strong>de</strong>ntificar <strong>la</strong> inconsistencia <strong>de</strong> <strong>la</strong> información<br />
hidrométrica en forma visual, e indicar el pe<strong>río</strong>do o los pe<strong>río</strong>dos en los cuales los datos son<br />
dudosos, lo cual se pue<strong>de</strong> reflejar como “picos“ muy altos o valores muy bajos, “saltos”<br />
y/o “ten<strong>de</strong>ncias”, los cuales se <strong>de</strong>ben comprobarse si son fenómenos naturales que<br />
efectivamente han ocurrido o son producidos por errores sistemáticos, mediante un gráfico<br />
o hidrograma <strong>de</strong> <strong>la</strong>s series <strong>de</strong> análisis, en coor<strong>de</strong>nadas cartesianas ploteando <strong>la</strong> información<br />
histórica <strong>de</strong> <strong>la</strong> variable hidrométrica a nivel anual y mensual; en <strong>la</strong>s or<strong>de</strong>nadas se ubica los<br />
valores anuales o mensuales <strong>de</strong> <strong>la</strong> serie hidrométrica en unida<strong>de</strong>s respectivas y en <strong>la</strong>s<br />
abscisas el tiempo en años y meses.<br />
Para el presente estudio se ha formado un solo grupo <strong>de</strong> estaciones hidrométricas para su<br />
análisis. De <strong>la</strong>s estaciones consi<strong>de</strong>radas en el presente estudio, mediante este análisis<br />
resulta que no existe un pe<strong>río</strong>do dudoso significativo en <strong>la</strong> serie <strong>de</strong> <strong>la</strong>s <strong>de</strong>scargas medias<br />
mensuales y anuales, tal como se muestra en los hidrogramas correspondientes.<br />
Descarga (m 3 /s)<br />
Descargas (m 3 /s)<br />
Descarga (m 3 /s)<br />
Figura Nº 6.1 Hidrograma <strong>de</strong> <strong>de</strong>scargas medias mensuales y anuales - serie histórica - Ríos Huancané,<br />
Suches y Ramis<br />
250<br />
200<br />
150<br />
100<br />
50<br />
0<br />
500<br />
400<br />
300<br />
200<br />
100<br />
0<br />
60<br />
50<br />
40<br />
30<br />
20<br />
10<br />
0<br />
1956<br />
1958<br />
1956<br />
1958<br />
1956<br />
1958<br />
1960<br />
1962<br />
1960<br />
1962<br />
1960<br />
1962<br />
1964<br />
1966<br />
1964<br />
1966<br />
1964<br />
1966<br />
Descargas medias mensuales - erie histórica<br />
Río Huancané - Estación Puente Huancané<br />
1968<br />
1970<br />
1972<br />
1974<br />
1976<br />
1978<br />
1980<br />
1982<br />
1984<br />
1986<br />
Tiempo (mes)<br />
1988<br />
1990<br />
1992<br />
1994<br />
Descargas medias mensuales - Serie histórica<br />
Río Ramis - Estación Puente Ramis<br />
1968<br />
1970<br />
1972<br />
1974<br />
1976<br />
1978<br />
1980<br />
1982<br />
1984<br />
1986<br />
Tiempo (mes)<br />
1988<br />
1990<br />
1992<br />
1994<br />
Descargas medias mensuales - Serie histórica<br />
Río Suches - Estación Puente Escoma<br />
1968<br />
1970<br />
1972<br />
1974<br />
1976<br />
1978<br />
1980<br />
1982<br />
1984<br />
1986<br />
Tiempo (mes)<br />
1988<br />
1990<br />
1992<br />
1994<br />
1996<br />
1998<br />
1996<br />
1998<br />
1996<br />
1998<br />
2000<br />
2002<br />
2000<br />
2002<br />
2000<br />
2002<br />
2004<br />
2006<br />
2004<br />
2006<br />
2004<br />
2006<br />
<strong>2008</strong><br />
<strong>2008</strong><br />
<strong>2008</strong><br />
MINAG-ANA-DCPRH-AGUAS SUPERFICIALES Pág.200<br />
Descarga (m 3 /s)<br />
Descarga (m 3 /s)<br />
Descarga (m 3 /s)<br />
50<br />
40<br />
30<br />
20<br />
10<br />
0<br />
150<br />
120<br />
90<br />
60<br />
30<br />
0<br />
20<br />
15<br />
10<br />
5<br />
0<br />
Descargas medias anuales - Serie histórica<br />
Río Huancané - Estación Puente Huancané<br />
1955 1960 1965 1970 1975 1980 1985 1990 1995 2000 2005 2010<br />
Tiempo (año)<br />
Descargas medias anuales - Serie histórica<br />
Río Ramis - Estación Puente Ramis<br />
1955 1960 1965 1970 1975 1980 1985 1990 1995 2000 2005 2010<br />
Tiempo (año)<br />
Descargas medias anuales - Serie histórica<br />
Río Suches - Estación Puente Escoma<br />
1955 1960 1965 1970 1975 1980 1985 1990 1995 2000 2005 2010<br />
Tiempo (año)
<strong>Estudio</strong> <strong>Hidrológico</strong> <strong>de</strong> <strong>la</strong>s <strong>Cuenca</strong>s Huancané y Suches 2010<br />
B.- Análisis <strong>de</strong> doble masa<br />
Después <strong>de</strong> haber analizado los hidrogramas <strong>de</strong> <strong>la</strong>s series respectivas se realiza el análisis<br />
<strong>de</strong> doble masa. El diagrama <strong>de</strong> doble masa se obtiene ploteando en el eje <strong>de</strong> <strong>la</strong>s abscisas el<br />
volumen anual promedio acumu<strong>la</strong>do <strong>de</strong> <strong>la</strong> variable hidrométrica <strong>de</strong> los <strong>río</strong>s en unida<strong>de</strong>s<br />
respectivas y en el eje <strong>de</strong> <strong>la</strong>s or<strong>de</strong>nadas los volúmenes anuales acumu<strong>la</strong>dos <strong>de</strong> <strong>la</strong> variable<br />
hidrométrica en unida<strong>de</strong>s correspondientes <strong>de</strong> cada una <strong>de</strong> los <strong>río</strong>s consi<strong>de</strong>rados en el<br />
estudio. De los gráficos <strong>de</strong> doble masa se selecciona una estación más confiable, <strong>la</strong> que<br />
presenta el menor número <strong>de</strong> quiebres, <strong>la</strong> cual se usará como estación base para el análisis<br />
<strong>de</strong> otras estaciones. En este análisis, los errores producidos por los fenómenos naturales y<br />
sistemáticos son <strong>de</strong>tectados mediante los “quiebres” que se presentan en los diagramas y<br />
permite <strong>de</strong>terminar el rango <strong>de</strong> los pe<strong>río</strong>dos dudosos y confiables para cada estación en<br />
estudio, <strong>la</strong> cual se <strong>de</strong>be corregirse utilizando ciertos criterios estadísticos.<br />
En el presente estudio, para el análisis <strong>de</strong> doble masa se ha formado dos (2) grupos <strong>de</strong><br />
estaciones hidrométricas, según <strong>la</strong> longitud <strong>de</strong>l registro <strong>de</strong> información histórica, con el fin<br />
obtener una comparación a<strong>de</strong>cuada <strong>de</strong> <strong>la</strong>s series <strong>de</strong> <strong>de</strong>scargas medias mensuales, los<br />
cuadros y gráficos <strong>de</strong> análisis se muestran a continuación.<br />
Grupo Nº 1: Mediante el análisis <strong>de</strong> doble masa (ver Figura Nº 6.2-a), <strong>la</strong> estación<br />
hidrométrica Puente Ramis (<strong>río</strong> Ramis) es seleccionada como <strong>la</strong> estación base. La<br />
comparación <strong>de</strong> <strong>la</strong> serie <strong>de</strong> <strong>de</strong>scargas medias anuales <strong>de</strong> <strong>la</strong> estación Puente Huancané (<strong>río</strong><br />
Huancané) con <strong>la</strong> estación base, no muestra quiebres significativos, <strong>la</strong> curva <strong>de</strong> doble masa<br />
tien<strong>de</strong> a mantenerse <strong>la</strong> pendiente pre<strong>de</strong>terminada (ver Figura Nº 6.2-b). Aunque muestran<br />
pequeños quiebres en el análisis <strong>de</strong> doble masa, dichos quiebres serán evaluadas en el<br />
análisis estadístico.<br />
Grupo Nº 2: Mediante el análisis <strong>de</strong> doble masa (ver Figura Nº 6.3-a), <strong>la</strong> estación<br />
hidrométrica Puente Ramis (<strong>río</strong> Ramis) es seleccionada como <strong>la</strong> estación base. La<br />
comparación <strong>de</strong> <strong>la</strong> serie <strong>de</strong> <strong>de</strong>scargas medias anuales <strong>de</strong> <strong>la</strong> estación Puente Escoma (<strong>río</strong><br />
Huancané) con <strong>la</strong> estación base, no muestra quiebres significativos, <strong>la</strong> curva <strong>de</strong> doble masa<br />
tien<strong>de</strong> a mantenerse <strong>la</strong> pendiente pre<strong>de</strong>terminada (ver Figura Nº 6.3-b). Aunque muestran<br />
pequeños quiebres en el análisis <strong>de</strong> doble masa, dichos quiebres serán evaluadas en el<br />
análisis estadístico.<br />
Los posibles pe<strong>río</strong>dos como dudosos y confiables <strong>de</strong> cada serie hidrológica <strong>de</strong> <strong>la</strong>s<br />
estaciones en estudio, se muestran posteriormente en el análisis estadístico <strong>de</strong> saltos.<br />
MINAG-ANA-DCPRH-AGUAS SUPERFICIALES Pág.201
<strong>Estudio</strong> <strong>Hidrológico</strong> <strong>de</strong> <strong>la</strong>s <strong>Cuenca</strong>s Huancané y Suches 2010<br />
Cuadro Nº 6.2 Análisis <strong>de</strong> doble masa <strong>de</strong> <strong>la</strong>s <strong>de</strong>scargas medias anuales (m 3 /s) - Grupo Nº 1<br />
m Año<br />
Huancané<br />
Q Qacumul Q Qacumul Q Qacumul<br />
1 1956 6.15 6.15 33.31 33.31 19.73 19.73<br />
2 1957 11.15 17.30 45.14 78.45 28.15 47.88<br />
3 1958 17.67 34.97 92.59 171.04 55.13 103.01<br />
4 1959 15.27 50.24 88.49 259.53 51.88 154.89<br />
5 1960 21.36 71.60 102.14 361.67 61.75 216.64<br />
6 1961 16.57 88.17 80.24 441.91 48.41 265.05<br />
7 1962 26.82 114.99 107.40 549.31 67.11 332.16<br />
8 1963 27.03 142.02 113.77 663.08 70.40 402.56<br />
9 1964 16.31 158.33 56.18 719.26 36.25 438.81<br />
10 1965 21.46 179.79 80.98 800.24 51.22 490.03<br />
11 1966 15.83 195.62 53.54 853.78 34.69 524.72<br />
12 1967 7.67 203.29 41.07 894.85 24.37 549.09<br />
13 1968 12.19 215.48 57.84 952.69 35.02 584.11<br />
14 1969 11.29 226.77 37.05 989.74 24.17 608.28<br />
15 1970 21.41 248.18 82.93 1072.67 52.17 660.45<br />
16 1971 31.02 279.20 87.27 1159.94 59.15 719.60<br />
17 1972 14.16 293.36 65.53 1225.47 39.85 759.45<br />
18 1973 20.17 313.53 87.29 1312.76 53.73 813.18<br />
19 1974 23.96 337.49 100.12 1412.88 62.04 875.22<br />
20 1975 21.03 358.52 94.03 1506.91 57.53 932.75<br />
21 1976 17.39 375.91 75.22 1582.13 46.31 979.06<br />
22 1977 14.33 390.24 57.90 1640.03 36.12 1015.18<br />
23 1978 21.23 411.47 100.34 1740.37 60.79 1075.97<br />
24 1979 26.12 437.59 90.23 1830.60 58.18 1134.15<br />
25 1980 11.43 449.02 66.07 1896.67 38.75 1172.90<br />
26 1981 25.96 474.98 89.39 1986.06 57.68 1230.58<br />
27 1982 24.11 499.09 82.17 2068.23 53.14 1283.72<br />
28 1983 7.23 506.32 24.92 2093.15 16.08 1299.80<br />
29 1984 27.77 534.09 94.83 2187.98 61.30 1361.10<br />
30 1985 31.20 565.29 108.83 2296.81 70.02 1431.12<br />
31 1986 40.04 605.33 113.52 2410.33 76.78 1507.90<br />
32 1987 15.02 620.35 61.54 2471.87 38.28 1546.18<br />
33 1988 20.97 641.32 84.63 2556.50 52.80 1598.98<br />
34 1989 11.68 653.00 87.86 2644.36 49.77 1648.75<br />
35 1990 8.23 661.23 41.87 2686.23 25.05 1673.80<br />
36 1991 12.15 673.38 41.10 2727.33 26.63 1700.43<br />
37 1992 12.56 685.94 42.99 2770.32 27.78 1728.21<br />
38 1993 17.51 703.45 70.01 2840.33 43.76 1771.97<br />
39 1994 26.25 729.70 85.83 2926.16 56.04 1828.01<br />
40 1995 13.61 743.31 52.58 2978.74 33.10 1861.11<br />
41 1996 10.47 753.78 51.69 3030.43 31.08 1892.19<br />
42 1997 27.57 781.35 93.04 3123.47 60.31 1952.50<br />
43 1998 10.00 791.35 51.49 3174.96 30.75 1983.25<br />
44 1999 12.85 804.20 67.24 3242.20 40.05 2023.30<br />
45 2000 12.97 817.17 65.62 3307.82 39.30 2062.60<br />
46 2001 34.11 851.28 99.74 3407.56 66.93 2129.53<br />
47 2002 31.01 882.29 105.94 3513.50 68.48 2198.01<br />
48 2003 40.50 922.79 107.25 3620.75 73.88 2271.89<br />
49 2004 27.45 950.24 82.44 3703.19 54.95 2326.84<br />
50 2005 16.74 966.98 63.51 3766.70 40.13 2366.97<br />
51 2006 20.40 987.38 69.90 3836.60 45.15 2412.12<br />
52 2007 20.69 1008.07 83.22 3919.82 51.96 2464.08<br />
53 <strong>2008</strong> 11.47 1019.54 55.45 3975.27 33.46 2497.54<br />
54 2009 10.77 1030.31 59.07 4034.34 34.92 2532.46<br />
(Datos faltantes se completó por corre<strong>la</strong>ción con <strong>la</strong> información <strong>de</strong> <strong>la</strong>s estaciones vecinas, sólo para el análisis <strong>de</strong> doble masa).<br />
Río<br />
Ramis<br />
Promedio<br />
MINAG-ANA-DCPRH-AGUAS SUPERFICIALES Pág.202
<strong>Estudio</strong> <strong>Hidrológico</strong> <strong>de</strong> <strong>la</strong>s <strong>Cuenca</strong>s Huancané y Suches 2010<br />
Descargas Acumu<strong>la</strong>das <strong>de</strong>l Río Huancané (m 3 /s)<br />
Descargas Acumu<strong>la</strong>das <strong>de</strong> los Ríos (m 3 /s)<br />
Figura Nº 6.2 Diagrama <strong>de</strong> doble masa <strong>de</strong> <strong>la</strong>s <strong>de</strong>scargas medias anuales - Grupo Nº 1<br />
a)<br />
5000<br />
4500<br />
4000<br />
3500<br />
3000<br />
2500<br />
2000<br />
1500<br />
1000<br />
500<br />
0<br />
1200<br />
1100<br />
1000<br />
900<br />
800<br />
700<br />
600<br />
500<br />
400<br />
300<br />
200<br />
100<br />
0<br />
0 500 1000 1500 2000 2500 3000 3500<br />
Descargas Acumu<strong>la</strong>das <strong>de</strong>l Promedio <strong>de</strong> los Ríos (m 3 /s)<br />
b)<br />
Huancané<br />
0 500 1000 1500 2000 2500 3000 3500 4000 4500 5000<br />
Descargas Acumu<strong>la</strong>das <strong>de</strong>l Río Ramis (m 3 /s)<br />
MINAG-ANA-DCPRH-AGUAS SUPERFICIALES Pág.203<br />
Ramis<br />
Huancané
<strong>Estudio</strong> <strong>Hidrológico</strong> <strong>de</strong> <strong>la</strong>s <strong>Cuenca</strong>s Huancané y Suches 2010<br />
Cuadro Nº 6.3 Análisis <strong>de</strong> doble masa <strong>de</strong> <strong>la</strong>s <strong>de</strong>scargas medias anuales (m 3 /s) - Grupo Nº 2<br />
m Año<br />
Río<br />
Ramis Suches<br />
Q Qacumul Q Qacumul Q Qacumul<br />
1 1970 82.93 82.93 7.64 7.64 45.29 45.29<br />
2 1971 87.27 170.20 6.58 14.22 46.93 92.22<br />
3 1972 65.53 235.73 6.93 21.15 36.23 128.45<br />
4 1973 87.29 323.02 11.99 33.14 49.64 178.09<br />
5 1974 100.12 423.14 7.96 41.10 54.04 232.13<br />
6 1975 94.03 517.17 12.26 53.36 53.15 285.28<br />
7 1976 75.22 592.39 10.31 63.67 42.77 328.05<br />
8 1977 57.90 650.29 9.11 72.78 33.51 361.56<br />
9 1978 100.34 750.63 10.81 83.59 55.58 417.14<br />
10 1979 90.23 840.86 12.85 96.44 51.54 468.68<br />
11 1980 66.07 906.93 12.14 108.58 39.11 507.79<br />
12 1981 89.39 996.32 9.42 118.00 49.41 557.20<br />
13 1982 82.17 1078.49 8.41 126.41 45.29 602.49<br />
14 1983 24.92 1103.41 14.36 140.77 19.64 622.13<br />
15 1984 94.83 1198.24 20.29 161.06 57.56 679.69<br />
(Datos faltantes se completó por corre<strong>la</strong>ción con <strong>la</strong> información <strong>de</strong> <strong>la</strong>s estaciones vecinas, sólo para el análisis <strong>de</strong> doble masa).<br />
Descargas Acumu<strong>la</strong>das <strong>de</strong> los Ríos (m 3 /s)<br />
Promedio<br />
Figura Nº 6.3 Diagrama <strong>de</strong> doble masa <strong>de</strong> <strong>la</strong>s <strong>de</strong>scargas medias anuales - Grupo Nº 2<br />
a)<br />
1400<br />
1200<br />
1000<br />
800<br />
600<br />
400<br />
200<br />
0<br />
0 100 200 300 400 500 600 700 800<br />
Descargas Acumu<strong>la</strong>das <strong>de</strong>l Promedio <strong>de</strong> los Ríos (m 3 /s)<br />
MINAG-ANA-DCPRH-AGUAS SUPERFICIALES Pág.204<br />
Ramis<br />
Suches
<strong>Estudio</strong> <strong>Hidrológico</strong> <strong>de</strong> <strong>la</strong>s <strong>Cuenca</strong>s Huancané y Suches 2010<br />
Descargas Acumu<strong>la</strong>das <strong>de</strong>l Río Suches (m 3 /s)<br />
200<br />
175<br />
150<br />
125<br />
100<br />
75<br />
50<br />
25<br />
C.- Análisis estadístico<br />
Análisis <strong>de</strong> Saltos<br />
0<br />
b)<br />
0 200 400 600 800 1000 1200 1400<br />
Descargas Acumu<strong>la</strong>das <strong>de</strong>l Río Ramis (m 3 /s)<br />
Después <strong>de</strong> haber analizado los hidrogramas originales y los diagramas <strong>de</strong> doble masa se<br />
obtiene los pe<strong>río</strong>dos <strong>de</strong> posible corrección y los pe<strong>río</strong>dos <strong>de</strong> datos que se mantendrán con<br />
sus valores originales, se proce<strong>de</strong> al análisis estadístico <strong>de</strong> Saltos, en los parámetros como<br />
<strong>la</strong> media y <strong>la</strong> <strong>de</strong>sviación estándar.<br />
La consistencia en <strong>la</strong> media se realiza mediante <strong>la</strong> prueba estadística "T" <strong>de</strong> Stu<strong>de</strong>nts y para<br />
<strong>la</strong> <strong>de</strong>sviación estándar el análisis estadístico consiste en probar, mediante <strong>la</strong> prueba<br />
estadística <strong>de</strong> "F" <strong>de</strong> Fisher. Si los parámetros <strong>la</strong> media y <strong>la</strong> <strong>de</strong>sviación estándar <strong>de</strong> los<br />
pe<strong>río</strong>dos consi<strong>de</strong>rados en el análisis son iguales estadísticamente, entonces no se corrige <strong>la</strong><br />
información <strong>de</strong> lo contrario se <strong>de</strong>be corregirse. Después <strong>de</strong> todo el análisis respectivo <strong>la</strong><br />
información es una serie homogénea, confiable y consistente al 95% <strong>de</strong> probabilidad.<br />
En este caso, mediante el análisis realizado en forma mensual, se obtiene que <strong>la</strong> serie<br />
mensual <strong>de</strong> <strong>la</strong>s <strong>de</strong>scargas medias <strong>de</strong> los <strong>río</strong>s consi<strong>de</strong>rados en el presente estudio, no<br />
muestran “Saltos” significativos en los parámetros analizados (media y <strong>de</strong>sviación<br />
estándar) en todas <strong>la</strong>s estaciones hidrométricas consi<strong>de</strong>radas, para su posible corrección,<br />
sin embargo no se corrige dichas informaciones. Caso <strong>de</strong>l <strong>río</strong> Suches, no se ha realizado el<br />
análisis <strong>de</strong> saltos, <strong>de</strong>bido a poca información <strong>de</strong>l registro <strong>de</strong> <strong>la</strong>s <strong>de</strong>scargas históricas.<br />
MINAG-ANA-DCPRH-AGUAS SUPERFICIALES Pág.205<br />
Suches
<strong>Estudio</strong> <strong>Hidrológico</strong> <strong>de</strong> <strong>la</strong>s <strong>Cuenca</strong>s Huancané y Suches 2010<br />
A continuación se muestra el cuadro <strong>de</strong>l análisis correspondiente:<br />
Ramis<br />
ESTACIÓN<br />
Huancané<br />
Cuadro Nº 6.4 Análisis <strong>de</strong> saltos <strong>de</strong> <strong>la</strong>s <strong>de</strong>scargas medias mensuales - serie histórica<br />
PERÍODO DE<br />
ANÁLISIS<br />
N°<br />
Datos<br />
n 1 , PD 1956-1975 239 17.93 25.67 -0.9067 1.9637 |Tc| < Tt NO 1.1352 1.2133 Fc < Ft NO<br />
n 2 , PC 1976-2009 402 19.91 27.35<br />
n 1 , PC 1956-1982 324 76.60 91.26 0.4476 1.9637 |Tc| < Tt NO 1.1305 1.2037 Fc < Ft NO<br />
n 2 , PD 1983-2009 311 73.45 85.83<br />
Análisis <strong>de</strong> Ten<strong>de</strong>ncias<br />
NÚMERO DE DATOS, PROMEDIO Y<br />
DESVIACIÓN ESTÁNDAR<br />
Promedio<br />
Desv.Est.<br />
T calcu<strong>la</strong>da<br />
Tc<br />
CONSISTENCIA EN LA MEDIA<br />
T tab<strong>la</strong> (95%)<br />
Tt<br />
Comparación<br />
Diferencia<br />
Significativa<br />
F calcu<strong>la</strong>da<br />
Fc<br />
CONSISTENCIA EN LA DESVIACIÓN ESTÁNDAR<br />
F tab<strong>la</strong> (95%)<br />
Ft<br />
Comparación<br />
Diferencia<br />
Significativa<br />
Una vez analizado los Saltos tanto en <strong>la</strong> media y <strong>de</strong>sviación estándar <strong>de</strong> <strong>la</strong> información<br />
hidrométrica se procedió a evaluar <strong>la</strong>s Ten<strong>de</strong>ncias en los dos parámetros <strong>de</strong>terminísticos.<br />
Para saber si <strong>la</strong> ten<strong>de</strong>ncia es significativa o no, se analiza el coeficiente <strong>de</strong> corre<strong>la</strong>ción "R"<br />
mediante <strong>la</strong> prueba estadística <strong>de</strong> T <strong>de</strong> Stu<strong>de</strong>nts.<br />
Generalmente <strong>la</strong> ten<strong>de</strong>ncia en <strong>la</strong> <strong>de</strong>sviación se presenta en los datos semanales o mensuales<br />
pero no en datos anuales.<br />
En este caso, mediante el análisis realizado en forma mensual, se obtiene que <strong>la</strong> serie<br />
mensual <strong>de</strong> <strong>la</strong>s <strong>de</strong>scargas medias <strong>de</strong> <strong>la</strong>s estaciones hidrométricas consi<strong>de</strong>radas en el<br />
presente estudio no muestran “Ten<strong>de</strong>ncias” significativas en los parámetros analizados<br />
(media y <strong>de</strong>sviación estándar) para su posible corrección, sin embargo no se corrige dichas<br />
informaciones. Al respecto <strong>de</strong>l <strong>río</strong> Suches, no se ha realizado el análisis <strong>de</strong> ten<strong>de</strong>ncias,<br />
<strong>de</strong>bido a poca información <strong>de</strong>l registro histórico <strong>de</strong> <strong>la</strong>s <strong>de</strong>scargas medias.<br />
Huancané<br />
Ramis<br />
ESTACIÓN<br />
Cuadro Nº 6.5 Análisis <strong>de</strong> ten<strong>de</strong>ncias <strong>de</strong> <strong>la</strong>s <strong>de</strong>scargas medias mensuales - serie histórica<br />
TENDENCIA EN LA:<br />
MEDIA, DESVEST, COEFICIENTES DE REGRESIÓN Y NÚMERO DE DATOS DE LAS TENDENCIAS EN LA MEDIA<br />
Y EN LA DESVIACIÓN ESTÁNDAR<br />
Parámetros<br />
Coeficientes <strong>de</strong> Regresión<br />
Media Desv.Est. Am Bm Cm<br />
Coeficiente <strong>de</strong><br />
Corre<strong>la</strong>ción<br />
R<br />
ANÁLISIS ESTADÍSTICO DE LA TENDENCIA EN LA MEDIA Y<br />
EN LA DESVIACIÓN ESTÁNDAR<br />
T calcu<strong>la</strong>da<br />
Tc<br />
T tab<strong>la</strong> (95%)<br />
Tt<br />
Media (Tm) 19.17 26.74 17.5971 0.0049 - 0.0340 641 0.8600 1.9637 |Tc| < Tt NO<br />
Desv.Est (Ts) 24.57 11.55 22.9008 0.0642 - 0.0826 51 0.5802 2.0086 |Tc| < Tt NO<br />
Media (Tm) 75.06 88.58 76.9680 -0.0060 - -0.0124 635 -0.3120 1.9637 |Tc| < Tt NO<br />
Desv.Est (Ts) 85.12 28.95 84.1183 0.0378 - 0.0198 52 0.1400 2.0076 |Tc| < Tt NO<br />
MINAG-ANA-DCPRH-AGUAS SUPERFICIALES Pág.206<br />
Número <strong>de</strong><br />
Datos<br />
N<br />
Estadístico T<br />
Comparación<br />
Ten<strong>de</strong>ncia<br />
Significativa<br />
En general, <strong>de</strong>spués <strong>de</strong> haber evaluado con los tres métodos <strong>de</strong> análisis, <strong>la</strong> información<br />
hidrométrica <strong>de</strong> <strong>la</strong>s <strong>de</strong>scargas medias mensuales históricas consi<strong>de</strong>radas en el presente<br />
estudio, es libre <strong>de</strong> saltos y ten<strong>de</strong>ncias, es serie homogénea, consistente y confiable al 95%<br />
<strong>de</strong> probabilidad. Por lo tanto, se pue<strong>de</strong> utilizar para su completación y extensión <strong>de</strong><br />
registros, y su uso para propósitos múltiples.
<strong>Estudio</strong> <strong>Hidrológico</strong> <strong>de</strong> <strong>la</strong>s <strong>Cuenca</strong>s Huancané y Suches 2010<br />
6.4 COMPLETACIÓN Y EXTENSIÓN DE LA INFORMACIÓN HIDROMÉTRICA<br />
La completación y extensión <strong>de</strong> <strong>la</strong> información hidrométrica, se realiza con el fin <strong>de</strong><br />
obtener una serie completa y <strong>de</strong> un pe<strong>río</strong>do uniforme.<br />
Para <strong>la</strong> completación y extensión <strong>de</strong> <strong>la</strong> información hidrométrica, se ha utilizado el<br />
software hidrológico <strong>de</strong>nominado Hec-4 Monthly Streamflow Simu<strong>la</strong>tion, <strong>de</strong>sarrol<strong>la</strong>do por<br />
el Hydrologic Engineering Center <strong>de</strong> los Estados Unidos <strong>de</strong> América.<br />
La completación y extensión <strong>de</strong> registros <strong>de</strong> <strong>la</strong> información hidrométrica, se ha<br />
<strong>de</strong>sarrol<strong>la</strong>do utilizando <strong>la</strong> información consistente y confiable obtenida en el análisis<br />
anterior. Los registros <strong>de</strong> <strong>la</strong>s <strong>de</strong>scargas medias mensuales <strong>de</strong> los <strong>río</strong>s consi<strong>de</strong>rados en el<br />
presente estudio, se han completado y extendido <strong>de</strong>l pe<strong>río</strong>do 1956-2009. Los caudales<br />
completados y extendidos se muestran en el Anexo 1.<br />
En el siguiente cuadro, se muestran <strong>la</strong> información <strong>de</strong>l promedio multimensual <strong>de</strong> <strong>la</strong>s<br />
<strong>de</strong>scargas medias mensuales completadas y extendidas, <strong>de</strong> los <strong>río</strong>s Huancané, Suches y<br />
Ramis.<br />
Cuadro Nº 6.6 Descargas medias mensuales (m3/s) – Promedio multimensual (1956-2009)<br />
Estaciones hidrométricas <strong>de</strong> los <strong>río</strong>s Huancané, Suches y Ramis<br />
Río Estación<br />
Ene Feb Mar Abr May Jun Jul Ago Sep Oct Nov Dic<br />
Huancané Pte.Huancané 46.73 58.38 51.12 26.70 9.81 4.85 3.55 2.69 2.77 3.50 5.27 13.59 19.08<br />
Suches Pte.Escoma 20.77 28.26 23.89 15.18 6.40 4.32 3.89 2.41 3.24 4.56 6.65 9.61 10.76<br />
Ramis Pte.Ramis 151.67 209.51 208.16 124.20 47.69 24.22 16.03 12.57 11.28 13.42 25.51 52.25 74.71<br />
Figura Nº 6.4 Variación mensual <strong>de</strong> <strong>la</strong>s <strong>de</strong>scargas medias (m3/s) – Promedio multimensual (1956-2009)<br />
Descarga (m 3 /s)<br />
80<br />
60<br />
40<br />
20<br />
0<br />
Río Huancané - Estación Puente Huancané<br />
46.73<br />
58.38<br />
51.12<br />
26.70<br />
9.81<br />
4.85 3.55 2.69 2.77 3.50 5.27<br />
13.59<br />
Ene Feb Mar Abr May Jun Jul Ago Sep Oct Nov Dic<br />
Tiempo (mes)<br />
MINAG-ANA-DCPRH-AGUAS SUPERFICIALES Pág.207<br />
Descarga (m 3 /s)<br />
Mes<br />
50<br />
40<br />
30<br />
20<br />
10<br />
0<br />
Río Suches - Estación Puente Escoma<br />
20.77<br />
28.26<br />
23.89<br />
15.18<br />
6.40<br />
4.32 3.89 2.41 3.24 4.56<br />
6.65<br />
Prom<br />
Anual<br />
9.61<br />
Ene Feb Mar Abr May Jun Jul Ago Sep Oct Nov Dic<br />
Tiempo (mes)
<strong>Estudio</strong> <strong>Hidrológico</strong> <strong>de</strong> <strong>la</strong>s <strong>Cuenca</strong>s Huancané y Suches 2010<br />
Descarga (m 3 /s)<br />
250<br />
200<br />
150<br />
100<br />
50<br />
0<br />
151.67<br />
Río Ramis - Estación Puente Ramis<br />
209.51208.16<br />
124.20<br />
47.69<br />
24.22 25.51<br />
16.03 12.57 11.28 13.42<br />
MINAG-ANA-DCPRH-AGUAS SUPERFICIALES Pág.208<br />
52.25<br />
Ene Feb Mar Abr May Jun Jul Ago Sep Oct Nov Dic<br />
Tiempo (mes)<br />
Las <strong>de</strong>scargas medias anuales <strong>de</strong> los <strong>río</strong>s Huancané, Suches y Ramis se muestran en el<br />
Cuadro Nº 6.7 y en los Gráficos Nº 6.5 a 6.7.<br />
Año<br />
Cuadro Nº 6.7 Descargas medias anuales (m3/s) - Ríos Huancané, Suches y Ramis<br />
Río<br />
Río<br />
Año<br />
Huancané Suches Ramis Huancané Suches Ramis<br />
1956 6.15 12.86 33.31 1983 7.23 14.36 24.92<br />
1957 11.15 12.09 45.14 1984 27.77 20.29 94.83<br />
1958 17.67 12.38 92.59 1985 31.20 14.25 108.83<br />
1959 15.27 8.53 88.49 1986 40.04 6.15 113.52<br />
1960 21.36 9.79 102.14 1987 15.02 11.24 61.54<br />
1961 16.57 8.67 80.24 1988 20.97 8.35 84.63<br />
1962 26.82 7.65 107.40 1989 11.68 5.54 87.86<br />
1963 27.03 6.21 113.77 1990 8.23 13.01 41.87<br />
1964 16.31 8.86 56.18 1991 12.15 6.86 41.10<br />
1965 21.46 7.57 80.98 1992 12.56 14.34 42.99<br />
1966 15.83 9.30 53.54 1993 17.51 8.90 70.01<br />
1967 7.67 14.21 41.07 1994 26.25 12.93 85.83<br />
1968 12.19 15.94 57.84 1995 13.61 15.39 52.58<br />
1969 11.29 8.97 37.05 1996 10.47 11.11 51.69<br />
1970 21.41 7.64 82.93 1997 27.57 12.89 93.04<br />
1971 31.02 6.58 87.27 1998 10.00 9.96 51.49<br />
1972 14.16 6.93 65.53 1999 12.85 10.61 67.24<br />
1973 20.17 11.99 87.29 2000 12.97 7.74 65.62<br />
1974 23.96 7.96 100.12 2001 34.11 13.53 99.74<br />
1975 21.03 12.26 94.03 2002 31.01 11.09 105.94<br />
1976 17.39 10.31 75.22 2003 40.50 9.52 107.25<br />
1977 14.33 9.11 57.90 2004 27.45 14.58 82.44<br />
1978 21.23 10.81 100.34 2005 16.74 10.73 63.51<br />
1979 26.12 12.85 90.23 2006 20.40 9.90 69.90<br />
1980 11.43 12.14 66.07 2007 20.69 11.62 83.22<br />
1981 25.96 9.42 89.39 <strong>2008</strong> 11.47 14.51 55.45<br />
1982 24.11 8.41 82.17 2009 10.77 12.46 59.07<br />
Río Huancané = 19.08 m 3 /s<br />
Descarga media multianual: Río Suches = 10.76 m 3 /s<br />
Río Ramis = 74.71 m 3 /s
<strong>Estudio</strong> <strong>Hidrológico</strong> <strong>de</strong> <strong>la</strong>s <strong>Cuenca</strong>s Huancané y Suches 2010<br />
Figura Nº 6.5 Hidrograma <strong>de</strong> <strong>la</strong>s <strong>de</strong>scargas medias anuales - Río Huancané - Estación Puente Huancané<br />
Descarga (m 3 /s)<br />
50.0<br />
40.0<br />
30.0<br />
20.0<br />
10.0<br />
0.0<br />
1955 1960 1965 1970 1975 1980 1985 1990 1995 2000 2005 2010<br />
Tiempo (mes)<br />
Figura Nº 6.6 Hidrograma <strong>de</strong> <strong>la</strong>s <strong>de</strong>scargas medias anuales - Río Suches - Estación Puente Escoma<br />
Descarga (m 3 /s)<br />
25.0<br />
20.0<br />
15.0<br />
10.0<br />
5.0<br />
0.0<br />
1955 1960 1965 1970 1975 1980 1985 1990 1995 2000 2005 2010<br />
Tiempo (mes)<br />
Figura Nº 6.7 Hidrograma <strong>de</strong> <strong>la</strong>s <strong>de</strong>scargas medias anuales - Río Ramis - Estación Puente Ramis<br />
Descarga (m 3 /s)<br />
150.0<br />
125.0<br />
100.0<br />
75.0<br />
50.0<br />
25.0<br />
0.0<br />
1955 1960 1965 1970 1975 1980 1985 1990 1995 2000 2005 2010<br />
Tiempo (mes)<br />
MINAG-ANA-DCPRH-AGUAS SUPERFICIALES Pág.209
<strong>Estudio</strong> <strong>Hidrológico</strong> <strong>de</strong> <strong>la</strong>s <strong>Cuenca</strong>s Huancané y Suches 2010<br />
6.5 PERSISTENCIA DE LAS DESCARGAS MEDIAS MENSUALES<br />
Según <strong>la</strong>s recomendaciones nacionales e internacionales, <strong>la</strong> disponibilidad <strong>de</strong> agua para<br />
aten<strong>de</strong>r <strong>la</strong>s <strong>de</strong>mandas <strong>de</strong> riego se <strong>de</strong>ben <strong>de</strong>terminar con un nivel <strong>de</strong> persistencia <strong>de</strong> 75% <strong>de</strong><br />
probabilidad.<br />
El análisis estadístico <strong>de</strong> probabilidad <strong>de</strong> ocurrencia <strong>de</strong> <strong>la</strong>s <strong>de</strong>scargas medias mensuales,<br />
para fines <strong>de</strong> riego, <strong>la</strong> fórmu<strong>la</strong> <strong>de</strong> Weibull es universalmente utilizada, cuya ecuación es <strong>la</strong><br />
siguiente:<br />
X x <br />
n 1<br />
<br />
m<br />
<br />
P m (1)<br />
Don<strong>de</strong>:<br />
n : Número total <strong>de</strong> datos <strong>de</strong> <strong>la</strong> muestra.<br />
m : Posición <strong>de</strong> un valor en una lista or<strong>de</strong>nada por magnitud<br />
<strong>de</strong>scen<strong>de</strong>nte <strong>de</strong>l respectivo valor <strong>de</strong> caudal al que se refiere <strong>la</strong><br />
probabilidad P <strong>de</strong> exce<strong>de</strong>ncia.<br />
Para el análisis <strong>de</strong> persistencia <strong>de</strong> <strong>la</strong>s <strong>de</strong>scargas medias mensuales <strong>de</strong> los <strong>río</strong>s Huancané y<br />
Suches, se ha empleado <strong>la</strong> información consistente, completado y extendido <strong>de</strong>l pe<strong>río</strong>do<br />
1956-2009.<br />
Utilizando <strong>la</strong> información <strong>de</strong> <strong>la</strong>s <strong>de</strong>scargas medias <strong>de</strong> los <strong>río</strong>s Huancané y Suches, y<br />
aplicando <strong>la</strong> ecuación (1), se ha realizado el análisis <strong>de</strong> persistencia al 75% <strong>de</strong> probabilidad.<br />
En los Cuadros Nº 6.8 y 6.10 se muestran el análisis <strong>de</strong> persistencia <strong>de</strong> <strong>la</strong>s <strong>de</strong>scargas<br />
medias <strong>de</strong> los <strong>río</strong>s en estudio.<br />
MINAG-ANA-DCPRH-AGUAS SUPERFICIALES Pág.210
<strong>Estudio</strong> <strong>Hidrológico</strong> <strong>de</strong> <strong>la</strong>s <strong>Cuenca</strong>s Huancané y Suches 2010<br />
m<br />
Cuadro Nº 6.8 Análisis <strong>de</strong> frecuencia <strong>de</strong> <strong>la</strong>s <strong>de</strong>scargas medias mensuales (m 3 /s)<br />
Río Huancané – Estación Puente Huancané<br />
Ene Feb Mar Abr May Jun Jul Ago Sep Oct Nov Dic<br />
1 149.64 201.62 127.67 80.16 25.63 13.77 5.94 4.63 6.63 14.47 18.20 52.47 1.8<br />
2 132.10 126.32 123.75 67.65 24.61 8.73 5.72 4.25 5.64 8.18 17.43 48.38 3.6<br />
3 130.19 121.64 118.89 66.32 20.99 8.17 5.55 4.12 4.82 7.77 11.09 35.68 5.5<br />
4 105.21 98.41 107.20 59.53 20.12 7.92 5.30 4.07 4.59 7.53 10.12 34.79 7.3<br />
5 98.00 95.08 100.34 48.97 19.01 7.60 5.24 3.86 4.49 6.47 9.80 31.65 9.1<br />
6 96.18 94.95 96.95 47.72 17.37 7.54 5.21 3.77 4.48 5.60 9.63 27.72 10.9<br />
7 95.48 94.84 95.74 45.27 14.25 7.31 5.20 3.73 4.44 5.50 9.49 23.60 12.7<br />
8 86.87 92.19 80.08 42.70 14.11 6.39 4.89 3.72 4.29 5.01 8.50 23.36 14.5<br />
9 84.07 90.31 68.21 42.56 13.87 5.94 4.57 3.71 4.23 4.81 8.29 21.92 16.4<br />
10 78.88 88.71 68.19 40.86 13.37 5.87 4.46 3.52 4.17 4.70 7.89 21.87 18.2<br />
11 70.52 86.62 66.43 38.99 13.37 5.77 4.42 3.49 4.13 4.37 7.75 19.60 20.0<br />
12 70.02 86.00 66.41 36.20 13.34 5.75 4.39 3.45 4.07 4.30 7.72 18.87 21.8<br />
13 66.51 82.46 66.35 34.72 13.29 5.74 3.98 3.45 3.85 4.22 7.72 18.81 23.6<br />
14 62.65 77.37 64.32 33.63 13.01 5.59 3.96 3.35 3.47 4.14 7.43 17.29 25.5<br />
15 60.21 73.93 64.03 33.52 11.95 5.56 3.89 3.28 3.42 4.13 7.08 17.06 27.3<br />
16 57.35 73.54 61.32 33.17 11.68 5.46 3.85 3.15 3.42 4.09 6.76 17.05 29.1<br />
17 57.06 72.86 60.21 32.35 11.35 5.21 3.82 3.03 3.28 3.99 6.67 16.64 30.9<br />
18 56.61 67.99 56.65 32.03 11.27 5.19 3.81 2.98 3.06 3.98 6.02 16.56 32.7<br />
19 55.25 67.47 56.61 29.39 11.08 5.12 3.70 2.92 3.04 3.91 5.67 16.07 34.5<br />
20 54.22 66.12 54.04 29.10 10.97 5.01 3.66 2.84 2.85 3.80 5.62 14.41 36.4<br />
21 54.18 63.65 53.58 27.14 10.92 4.98 3.62 2.82 2.77 3.76 5.59 12.79 38.2<br />
22 48.06 61.38 53.30 27.06 10.72 4.97 3.59 2.80 2.76 3.67 5.49 12.57 40.0<br />
23 47.23 57.53 53.21 27.05 9.83 4.90 3.56 2.78 2.67 3.66 4.76 12.53 41.8<br />
24 47.14 56.97 51.99 25.85 9.70 4.81 3.54 2.69 2.63 3.60 4.71 12.43 43.6<br />
25 46.01 53.43 50.78 25.07 9.49 4.69 3.53 2.68 2.62 3.39 4.51 11.99 45.5<br />
26 45.17 52.26 48.46 24.29 9.23 4.49 3.52 2.68 2.57 3.25 4.43 11.52 47.3<br />
27 40.43 51.38 47.96 24.11 9.18 4.44 3.52 2.59 2.50 3.21 4.24 11.08 49.1<br />
28 38.82 49.68 47.47 23.70 8.86 4.39 3.52 2.59 2.44 3.07 4.04 10.39 50.9<br />
29 35.73 48.13 47.15 23.09 8.16 4.39 3.50 2.56 2.39 2.79 4.03 9.74 52.7<br />
30 34.44 47.17 41.22 22.81 8.08 4.31 3.40 2.52 2.26 2.74 4.03 8.76 54.5<br />
31 34.02 47.10 41.13 22.28 7.92 4.30 3.36 2.43 2.13 2.56 3.87 8.69 56.4<br />
32 26.51 45.22 40.58 21.31 7.67 4.26 3.36 2.42 2.13 2.55 3.83 8.07 58.2<br />
33 25.38 44.80 40.22 19.85 7.33 4.24 3.32 2.42 2.13 2.55 3.68 7.98 60.0<br />
34 22.76 39.19 39.91 18.80 7.27 4.19 3.29 2.36 2.07 2.47 3.61 7.92 61.8<br />
35 22.47 38.47 38.42 17.22 6.82 4.12 3.17 2.34 2.07 2.34 3.40 7.86 63.6<br />
36 21.56 37.39 34.47 16.72 6.70 4.02 3.12 2.24 1.99 2.25 3.23 7.41 65.5<br />
37 21.08 37.05 32.89 16.61 6.53 3.97 3.10 2.19 1.98 2.16 3.17 7.03 67.3<br />
38 20.90 36.33 31.24 15.71 6.41 3.77 3.05 2.19 1.97 2.11 3.14 6.54 69.1<br />
39 20.55 35.99 30.97 15.59 6.31 3.73 3.02 2.17 1.94 1.95 2.85 6.42 70.9<br />
40 20.48 33.55 30.31 14.83 6.05 3.73 2.77 2.13 1.74 1.94 2.58 6.09 72.7<br />
41 19.63 31.73 30.28 14.52 5.75 3.61 2.73 2.03 1.73 1.89 2.56 5.95 74.5<br />
42 19.32 31.67 27.45 12.53 5.62 3.55 2.72 1.98 1.72 1.85 2.52 5.67 76.4<br />
43 17.93 31.55 27.18 11.96 5.31 3.51 2.64 1.91 1.72 1.84 2.47 5.55 78.2<br />
44 15.31 31.10 26.11 11.80 5.21 3.46 2.61 1.87 1.68 1.84 2.42 5.25 80.0<br />
45 15.27 30.54 25.17 11.65 5.11 3.40 2.56 1.87 1.63 1.82 2.17 4.76 81.8<br />
46 14.37 28.68 24.94 11.26 5.02 3.37 2.53 1.86 1.63 1.80 2.10 4.11 83.6<br />
47 13.48 24.68 22.93 11.21 4.95 3.17 2.50 1.86 1.61 1.68 2.00 3.05 85.5<br />
48 12.48 24.14 21.71 10.86 4.54 3.00 2.42 1.76 1.60 1.66 1.86 2.97 87.3<br />
49 12.04 24.02 20.59 9.37 4.50 2.99 2.40 1.72 1.53 1.63 1.73 2.67 89.1<br />
50 11.70 23.58 20.40 7.64 4.50 2.97 2.23 1.62 1.36 1.56 1.45 2.63 90.9<br />
51 10.59 22.45 17.94 7.36 4.08 2.79 2.13 1.50 1.31 1.35 1.43 2.61 92.7<br />
52 8.53 21.33 17.42 7.30 3.01 1.99 2.06 1.46 1.27 1.30 1.35 2.60 94.5<br />
53 8.49 18.21 10.84 5.48 2.96 1.82 1.97 1.39 1.27 1.14 1.34 2.37 96.4<br />
54 4.12 13.87 8.74 5.16 1.36 1.77 1.73 1.30 1.22 0.76 0.85 2.32 98.2<br />
Promedio 46.73 58.38 51.12 26.70 9.81 4.85 3.55 2.69 2.77 3.50 5.27 13.59<br />
P (50%) 39.63 50.53 47.72 23.91 9.02 4.42 3.52 2.59 2.47 3.14 4.14 10.74<br />
P (75%) 19.55 31.71 29.54 14.00 5.72 3.59 2.73 2.02 1.73 1.88 2.55 5.88<br />
P (90%) 11.87 23.80 20.50 8.51 4.50 2.98 2.32 1.67 1.45 1.60 1.59 2.65<br />
P (95%) 8.52 20.51 15.69 6.82 3.00 1.95 2.04 1.44 1.27 1.26 1.35 2.54<br />
Mes<br />
MINAG-ANA-DCPRH-AGUAS SUPERFICIALES Pág.211<br />
P<br />
(%)
<strong>Estudio</strong> <strong>Hidrológico</strong> <strong>de</strong> <strong>la</strong>s <strong>Cuenca</strong>s Huancané y Suches 2010<br />
En el Cuadro Nº 6.9 y en <strong>la</strong> Figura Nº 6.8, se muestra los volúmenes <strong>de</strong> <strong>de</strong>scargas medias<br />
mensuales, calcu<strong>la</strong>dos al 50, 75, 90 y 95% <strong>de</strong> probabilidad <strong>de</strong> ocurrencia para el <strong>río</strong><br />
Huancané, estación hidrométrica Puente Huancané.<br />
Persistencia<br />
Cuadro Nº 6.9 Volúmenes <strong>de</strong> <strong>de</strong>scargas medias mensuales (hm 3 ) al 75% <strong>de</strong> persistencia<br />
Río Huancané - Estación Puente Huancané<br />
Ago Sep Oct Nov Dic Ene Feb Mar Abr May Jun Jul<br />
Promedio 7.20 7.18 9.37 13.66 36.40 125.16 141.23 136.92 69.21 26.28 12.57 9.51 594.69<br />
P (50%) 6.94 6.40 8.41 10.73 28.77 106.14 122.24 127.81 61.97 24.16 11.46 9.43 524.46<br />
P (75%) 5.41 4.48 5.04 6.61 15.75 52.36 76.71 79.12 36.29 15.32 9.31 7.31 313.71<br />
P (90%) 4.47 3.76 4.29 4.12 7.10 31.79 57.58 54.91 22.06 12.05 7.72 6.21 216.06<br />
P (95%) 3.86 3.29 3.37 3.50 6.80 22.82 49.62 42.02 17.68 8.04 5.05 5.46 171.51<br />
Descarga (hm 3 )<br />
160.0<br />
140.0<br />
120.0<br />
100.0<br />
80.0<br />
60.0<br />
40.0<br />
20.0<br />
0.0<br />
Mes<br />
Figura Nº 6.8 Variación mensual <strong>de</strong> los volúmenes <strong>de</strong> <strong>de</strong>scargas medias<br />
Río Huancané - Estación Puente Huancané<br />
MINAG-ANA-DCPRH-AGUAS SUPERFICIALES Pág.212<br />
Total<br />
Anual<br />
Ago Sep Oct Nov Dic Ene Feb Mar Abr May Jun Jul<br />
Tiempo (mes) Promedio P (50%) P (75%)<br />
P (90%) P (95%)
<strong>Estudio</strong> <strong>Hidrológico</strong> <strong>de</strong> <strong>la</strong>s <strong>Cuenca</strong>s Huancané y Suches 2010<br />
m<br />
Cuadro Nº 6.10 Análisis <strong>de</strong> frecuencia <strong>de</strong> <strong>la</strong>s <strong>de</strong>scargas medias mensuales (m 3 /s)<br />
Río Suches – Estación Escoma<br />
Ene Feb Mar Abr May Jun Jul Ago Sep Oct Nov Dic<br />
1 66.66 61.01 37.62 39.63 14.75 16.17 33.87 11.42 32.46 51.34 34.45 24.61 1.8<br />
2 64.19 60.98 35.12 34.90 13.62 14.23 25.71 11.38 18.13 27.74 23.81 18.13 3.6<br />
3 63.09 60.58 34.61 30.36 11.35 12.95 14.48 10.53 8.80 13.22 19.96 17.81 5.5<br />
4 59.91 53.70 34.39 26.43 11.17 9.22 13.30 10.29 7.91 11.50 19.79 17.52 7.3<br />
5 49.69 52.07 33.75 26.37 11.17 8.91 12.47 8.40 7.35 7.22 17.06 16.75 9.1<br />
6 40.72 48.47 32.47 24.27 9.71 8.76 7.42 4.44 6.43 6.78 15.66 15.85 10.9<br />
7 36.37 46.18 32.25 24.10 9.50 8.02 7.05 3.75 4.98 6.30 13.38 15.76 12.7<br />
8 34.20 44.86 32.07 22.46 9.44 7.52 4.82 3.26 4.78 6.29 10.69 15.38 14.5<br />
9 33.79 42.64 32.03 21.64 9.09 6.65 4.66 3.02 3.97 5.38 10.65 14.48 16.4<br />
10 33.22 40.77 31.78 21.20 9.00 6.20 4.64 2.99 3.80 4.93 9.57 12.84 18.2<br />
11 31.79 38.83 31.54 20.41 8.90 5.94 3.97 2.91 3.28 4.89 9.52 12.73 20.0<br />
12 28.76 38.61 31.05 20.04 8.34 5.66 3.62 2.62 3.27 4.69 7.04 12.33 21.8<br />
13 27.20 38.39 30.75 20.04 8.03 5.52 3.09 2.34 3.26 4.57 6.80 12.19 23.6<br />
14 26.60 37.64 30.42 19.81 7.97 5.37 2.92 2.24 3.09 4.10 6.78 12.17 25.5<br />
15 25.33 37.62 30.09 18.52 7.91 4.94 2.89 2.19 2.88 4.07 6.74 11.31 27.3<br />
16 24.06 33.37 30.00 17.20 7.67 4.76 2.80 2.11 2.79 3.91 6.48 10.83 29.1<br />
17 20.75 32.54 29.81 16.76 7.48 4.68 2.78 2.10 2.78 3.80 5.94 10.68 30.9<br />
18 20.40 32.29 29.68 16.31 7.39 4.58 2.78 1.99 2.76 3.77 5.90 10.58 32.7<br />
19 19.51 31.37 29.29 15.81 7.36 4.48 2.77 1.90 2.60 3.52 5.80 10.51 34.5<br />
20 18.82 29.96 28.54 15.25 7.24 4.38 2.65 1.78 1.99 3.17 5.75 10.46 36.4<br />
21 18.32 29.89 28.30 14.30 6.97 4.00 2.45 1.69 1.97 3.12 5.66 10.26 38.2<br />
22 17.84 26.97 27.85 14.24 6.91 3.90 2.35 1.61 1.90 2.99 5.38 10.15 40.0<br />
23 17.14 26.08 27.55 13.91 6.89 3.80 2.33 1.58 1.81 2.98 5.26 9.69 41.8<br />
24 16.78 25.81 27.37 13.89 6.71 3.80 2.28 1.55 1.80 2.97 5.13 9.63 43.6<br />
25 16.12 25.81 25.35 13.61 6.43 3.29 2.21 1.52 1.78 2.95 4.85 9.14 45.5<br />
26 16.05 25.16 25.15 13.60 6.42 3.16 2.03 1.46 1.75 2.67 4.83 9.01 47.3<br />
27 15.83 24.76 24.76 13.50 6.24 3.05 1.91 1.35 1.74 2.66 4.67 8.98 49.1<br />
28 15.61 24.58 23.54 13.43 6.01 3.05 1.90 1.31 1.74 2.52 4.64 8.70 50.9<br />
29 14.76 23.96 23.10 13.18 5.93 3.02 1.82 1.29 1.72 2.30 4.49 8.51 52.7<br />
30 14.57 23.77 22.72 13.17 5.58 2.92 1.75 1.27 1.69 2.20 4.34 8.38 54.5<br />
31 13.72 23.47 22.22 12.98 5.50 2.91 1.63 1.19 1.63 2.18 4.29 8.30 56.4<br />
32 13.36 23.10 21.89 12.34 5.41 2.84 1.57 1.18 1.50 2.12 3.88 8.27 58.2<br />
33 12.62 21.89 21.82 12.23 5.32 2.78 1.56 1.17 1.49 2.11 3.72 8.20 60.0<br />
34 12.46 21.71 21.54 11.90 5.28 2.62 1.55 1.15 1.49 2.04 3.71 7.94 61.8<br />
35 12.22 21.41 21.27 11.78 5.26 2.57 1.46 1.14 1.47 1.99 3.69 7.68 63.6<br />
36 11.92 21.27 20.83 11.72 5.16 2.39 1.45 1.13 1.43 1.97 3.62 7.45 65.5<br />
37 11.62 20.80 20.65 11.49 5.15 2.38 1.41 1.08 1.42 1.94 3.54 7.11 67.3<br />
38 11.47 20.54 19.25 11.16 4.89 2.36 1.39 1.08 1.29 1.86 3.53 7.10 69.1<br />
39 11.28 19.46 17.22 10.96 4.30 2.35 1.33 1.08 1.29 1.69 3.51 6.94 70.9<br />
40 10.82 19.10 17.21 10.89 4.26 2.24 1.27 1.05 1.26 1.66 3.44 6.91 72.7<br />
41 10.38 17.93 16.89 10.70 4.20 2.16 1.27 1.03 1.26 1.64 3.40 6.57 74.5<br />
42 9.89 17.82 16.64 10.58 4.19 2.03 1.27 1.03 1.23 1.64 3.36 6.42 76.4<br />
43 9.79 17.18 16.43 9.82 3.85 1.99 1.26 1.02 1.17 1.64 3.16 6.07 78.2<br />
44 9.17 16.15 15.82 9.18 3.83 1.97 1.25 0.97 1.17 1.56 2.85 6.04 80.0<br />
45 8.84 15.04 15.10 8.93 3.76 1.89 1.20 0.95 1.14 1.54 2.70 6.00 81.8<br />
46 8.83 14.14 14.15 8.76 3.43 1.83 1.18 0.90 1.14 1.32 2.69 5.19 83.6<br />
47 8.03 14.13 14.08 8.57 3.40 1.74 1.17 0.90 1.11 1.31 2.24 5.10 85.5<br />
48 7.66 13.37 13.38 7.60 3.40 1.69 1.15 0.89 1.08 1.30 2.08 4.60 87.3<br />
49 7.29 12.80 13.37 7.60 3.15 1.69 1.08 0.89 1.08 1.22 2.03 4.54 89.1<br />
50 7.28 12.79 13.10 7.18 3.02 1.64 1.08 0.84 1.08 1.20 1.89 4.22 90.9<br />
51 6.68 12.71 12.89 6.54 2.54 1.60 1.06 0.82 1.08 1.16 1.70 3.77 92.7<br />
52 6.33 12.54 12.53 6.29 2.43 1.52 1.04 0.80 1.07 1.02 1.30 3.71 94.5<br />
53 6.22 11.33 11.65 6.29 1.90 1.47 0.93 0.77 0.97 0.92 1.01 2.83 96.4<br />
54 5.36 6.88 7.01 5.66 1.00 1.44 0.85 0.65 0.77 0.92 0.82 2.61 98.2<br />
Promedio 20.77 28.26 23.89 15.18 6.40 4.32 3.89 2.41 3.24 4.56 6.65 9.61<br />
P (50%) 15.72 24.67 24.15 13.47 6.13 3.05 1.91 1.33 1.74 2.59 4.66 8.84<br />
P (75%) 10.25 17.90 16.82 10.67 4.20 2.13 1.27 1.03 1.25 1.64 3.39 6.53<br />
P (90%) 7.29 12.80 13.24 7.39 3.09 1.67 1.08 0.87 1.08 1.21 1.96 4.38<br />
P (95%) 6.30 12.22 12.30 6.29 2.29 1.51 1.01 0.79 1.04 0.99 1.22 3.48<br />
Mes<br />
MINAG-ANA-DCPRH-AGUAS SUPERFICIALES Pág.213<br />
P<br />
(%)
<strong>Estudio</strong> <strong>Hidrológico</strong> <strong>de</strong> <strong>la</strong>s <strong>Cuenca</strong>s Huancané y Suches 2010<br />
En el Cuadro Nº 6.11 y en <strong>la</strong> Figura Nº 6.9, se muestra los volúmenes <strong>de</strong> <strong>de</strong>scargas medias<br />
mensuales, calcu<strong>la</strong>dos al 50, 75, 90 y 95% <strong>de</strong> probabilidad <strong>de</strong> ocurrencia para el <strong>río</strong> Suches,<br />
estación hidrométrica Puente Escoma.<br />
Persistencia<br />
Cuadro Nº 6.11 Volúmenes <strong>de</strong> <strong>de</strong>scargas medias mensuales (hm 3 ) al 75% <strong>de</strong> persistencia<br />
Río Suches - Estación Puente Escoma<br />
Ago Sep Oct Nov Dic Ene Feb Mar Abr May Jun Jul<br />
Promedio 6.45 8.40 12.21 17.24 25.74 55.63 68.37 63.99 39.35 17.14 11.20 10.42 336.14<br />
P (50%) 3.56 4.51 6.94 12.08 23.68 42.10 59.68 64.68 34.91 16.42 7.91 5.12 281.59<br />
P (75%) 2.76 3.24 4.39 8.79 17.49 27.45 43.30 45.05 27.66 11.25 5.52 3.40 200.30<br />
P (90%) 2.33 2.80 3.24 5.08 11.73 19.53 30.97 35.46 19.15 8.28 4.33 2.89 145.79<br />
P (95%) 2.12 2.70 2.65 3.16 9.32 16.87 29.56 32.94 16.30 6.13 3.91 2.71 128.37<br />
Descarga (hm 3 )<br />
80.0<br />
70.0<br />
60.0<br />
50.0<br />
40.0<br />
30.0<br />
20.0<br />
10.0<br />
0.0<br />
Mes<br />
Figura Nº 6.9 Variación mensual <strong>de</strong> los volúmenes <strong>de</strong> <strong>de</strong>scargas medias<br />
Río Suches - Estación Puente Escoma<br />
MINAG-ANA-DCPRH-AGUAS SUPERFICIALES Pág.214<br />
Total<br />
Anual<br />
Ago Sep Oct Nov Dic Ene Feb Mar Abr May Jun Jul<br />
Tiempo (mes) Promedio P (50%) P (75%)<br />
P (90%) P (95%)
<strong>Estudio</strong> <strong>Hidrológico</strong> <strong>de</strong> <strong>la</strong>s <strong>Cuenca</strong>s Huancané y Suches 2010<br />
CAPÍTULO VII<br />
MODELACIÓN HIDROLÓGICA-GENERACIÓN DE<br />
DESCARGAS MEDIAS MENSUALES<br />
7.1 GENERALIDADES<br />
En el presente estudio, para el mo<strong>de</strong><strong>la</strong>miento hidrológico se ha utilizado el método <strong>de</strong> <strong>la</strong><br />
re<strong>la</strong>ción Lluvia-Escurrimiento.<br />
Las re<strong>la</strong>ciones lluvia-escurrimiento se utilizan principalmente para el diseño, los<br />
pronósticos y <strong>la</strong> evaluación. Si los datos <strong>de</strong> escurrimientos no están disponibles o son<br />
insuficientes para una interpretación o extrapo<strong>la</strong>ción fiables, <strong>la</strong>s re<strong>la</strong>ciones lluviaescurrimiento<br />
pue<strong>de</strong>n ser muy útiles porque permiten extraer <strong>la</strong> información <strong>de</strong><br />
escurrimiento a partir <strong>de</strong> los registros <strong>de</strong> precipitación. Como los datos <strong>de</strong> lluvia son<br />
re<strong>la</strong>tivamente fáciles y poco costosos <strong>de</strong> recoger, son generalmente más abundantes que los<br />
datos <strong>de</strong> escurrimiento. Si se pue<strong>de</strong> establecer una re<strong>la</strong>ción estrecha entre lluvia y<br />
escurrimiento para una cuenca <strong>de</strong>terminada, <strong>la</strong> re<strong>la</strong>ción lluvia-escurrimiento, aplicada a los<br />
datos <strong>de</strong> lluvia, pue<strong>de</strong> dar estimaciones más fiables <strong>de</strong> <strong>la</strong> frecuencia <strong>de</strong> gran<strong>de</strong>s caudales<br />
que los que pue<strong>de</strong> dar una re<strong>la</strong>ción regional entre <strong>la</strong>s crecidas o una extrapo<strong>la</strong>ción basada<br />
en los datos <strong>de</strong> escurrimientos <strong>de</strong> <strong>la</strong> cuenca.<br />
Las re<strong>la</strong>ciones lluvia-escurrimiento usualmente se establecen en dos etapas: <strong>la</strong><br />
<strong>de</strong>terminación <strong>de</strong>l volumen <strong>de</strong> escurrimiento que resulta <strong>de</strong> un volumen <strong>de</strong> lluvia<br />
producido durante un pe<strong>río</strong>do <strong>de</strong> tiempo dado, y <strong>la</strong> distribución <strong>de</strong>l volumen <strong>de</strong><br />
escurrimiento en función <strong>de</strong>l tiempo. La primera etapa es necesaria <strong>de</strong>bido a <strong>la</strong> división <strong>de</strong><br />
<strong>la</strong> lluvia en evapotranspiración, infiltración y escurrimiento. La segunda se requiere para<br />
tomar en cuenta el tiempo <strong>de</strong> recorrido y <strong>la</strong> atenuación <strong>de</strong> <strong>la</strong> onda <strong>de</strong> escurrimiento que se<br />
genera por <strong>la</strong> lluvia.<br />
Para el mo<strong>de</strong><strong>la</strong>miento hidrológico y <strong>la</strong> generación <strong>de</strong> <strong>de</strong>scargas medias mensuales para los<br />
<strong>río</strong>s en estudio, se ha empleado el mo<strong>de</strong>lo hidrológico <strong>de</strong> Lutz Scholz.<br />
7.2 IMPORTANCIA DE LA MODELACIÓN HIDROLÓGICA<br />
La necesidad <strong>de</strong> <strong>la</strong> aplicación <strong>de</strong> mo<strong>de</strong>los matemáticos – hidrológicos <strong>de</strong> generación <strong>de</strong><br />
caudales medios mensuales está sustentada en aspectos <strong>de</strong> sustancial importancia, como los<br />
que en seguida mencionamos.<br />
La necesidad <strong>de</strong> contar con información hidrológica en puntos específicos <strong>de</strong><br />
una cuenca, y que en <strong>la</strong> realidad en dichos puntos no existe información<br />
observada <strong>de</strong> caudales.<br />
MINAG-ANA-DCPRH-AGUAS SUPERFICIALES Pág.215
<strong>Estudio</strong> <strong>Hidrológico</strong> <strong>de</strong> <strong>la</strong>s <strong>Cuenca</strong>s Huancané y Suches 2010<br />
La información histórica disponible <strong>de</strong> caudales medios mensuales en <strong>la</strong><br />
estaciones <strong>de</strong> aforo existentes no es totalmente confiable, puesto que en los<br />
periodos <strong>de</strong> lluvia no se efectúan mediciones hidrológicas estandarizadas, y en<br />
muchos casos se tiene conocimiento que se han realizado “estimaciones<br />
subjetivas” <strong>de</strong> datos <strong>de</strong> caudal, a<strong>de</strong>más <strong>de</strong> extrapo<strong>la</strong>r en los periodos <strong>de</strong> máximo<br />
escurrimiento <strong>la</strong> curva altura-caudal.<br />
El hecho <strong>de</strong> contar con escasas estaciones <strong>de</strong> aforo <strong>de</strong>ntro <strong>de</strong> una cuenca, nos<br />
sitúa en un punto <strong>de</strong> incertidumbre por contar so<strong>la</strong>mente con información<br />
localizada y a veces discontinuas mediciones <strong>de</strong> caudal, no existiendo <strong>la</strong> real<br />
posibilidad <strong>de</strong> contrastar y validar <strong>la</strong> información disponible.<br />
Consi<strong>de</strong>rando <strong>la</strong> directa <strong>de</strong>pen<strong>de</strong>ncia o re<strong>la</strong>ción <strong>de</strong> <strong>la</strong> escorrentía respecto a <strong>la</strong><br />
precipitación en <strong>la</strong> cuenca, es importante distinguir que <strong>la</strong> información <strong>de</strong><br />
precipitación es más confiable que <strong>la</strong> hidrométrica, aspecto que nos impulsa a<br />
realizar mo<strong>de</strong><strong>la</strong>ciones matemáticas que simulen dicha re<strong>la</strong>ción, es <strong>de</strong>cir se<br />
emplee mo<strong>de</strong>los <strong>de</strong> transformación lluvia-escorrentía.<br />
Los mo<strong>de</strong>los <strong>de</strong> precipitación-escorrentía más extendidos en hidrología son aquellos que<br />
estiman el ba<strong>la</strong>nce entre <strong>la</strong>s entradas (precipitación) <strong>de</strong> agua al sistema y <strong>la</strong>s salidas <strong>de</strong>l<br />
mismo (evaporación, transpiración, escorrentía superficial y aporte a los acuíferos)<br />
reproduciendo simplificadamente el proceso <strong>de</strong>l ciclo hidrológico.<br />
7.3 MODELO HIDROLÓGICO DE LUTZ SCHOLZ<br />
El mo<strong>de</strong>lo hidrológico <strong>de</strong> Lutz Scholz, ha sido estudiado y calibrado en diecinueve (19)<br />
cuencas <strong>de</strong> <strong>la</strong> sierra peruana, ubicadas en <strong>la</strong>s regiones <strong>de</strong> Cuzco, Huancavelica, Junín y<br />
Cajamarca, y es aplicable generalmente para pequeñas y medianas cuencas con escasa<br />
información hidrométrica.<br />
El mo<strong>de</strong>lo <strong>de</strong> precipitación-escorrentía <strong>de</strong> Lutz Scholz fue propuesta por <strong>la</strong> Misión Técnica<br />
Alemana en 1980 para el Ex-Programa Nacional <strong>de</strong> Pequeñas y Medianas Irrigaciones-<br />
P<strong>la</strong>n Meris II.<br />
El mo<strong>de</strong>lo se basa fundamentalmente en el ba<strong>la</strong>nce hídrico y en parámetros parciales <strong>de</strong><br />
tipo <strong>de</strong>terminístico. Este método permite combinar los factores que producen e influyen en<br />
los caudales, tales como, <strong>la</strong> precipitación, evaporación, el almacenamiento y <strong>la</strong> función <strong>de</strong><br />
agotamiento natural <strong>de</strong> <strong>la</strong> cuenca, para el cálculo <strong>de</strong> <strong>la</strong>s <strong>de</strong>scargas en forma <strong>de</strong> un mo<strong>de</strong>lo<br />
matemático.<br />
El método es completo es su <strong>de</strong>terminación final, vale <strong>de</strong>cir analiza los acuíferos, los<br />
pantanos, los nevados, <strong>la</strong>s <strong>la</strong>gunas, <strong>río</strong>s, manantes, es <strong>de</strong>cir todo el recurso hídrico que<br />
interviene en <strong>la</strong> cuenca, a<strong>de</strong>más <strong>de</strong> manera sustancial <strong>de</strong> <strong>la</strong> precipitación efectiva que cae<br />
en <strong>la</strong> cuenca.<br />
Para <strong>la</strong> <strong>de</strong>terminación <strong>de</strong>l ba<strong>la</strong>nce hídrico en un año promedio, se <strong>de</strong>be tener en cuenta, el<br />
ciclo hidrológico <strong>de</strong> <strong>la</strong> cuenca. Se establece para el <strong>de</strong>sarrollo <strong>de</strong>l presente mo<strong>de</strong>lo, que <strong>la</strong><br />
sierra <strong>de</strong>l Perú, específicamente <strong>la</strong> sierra altiplánica cuenta con dos épocas: época <strong>de</strong><br />
avenidas o <strong>de</strong> lluvias y época <strong>de</strong> estiaje o <strong>de</strong> sequía; por lo que los componentes <strong>de</strong>l<br />
MINAG-ANA-DCPRH-AGUAS SUPERFICIALES Pág.216
<strong>Estudio</strong> <strong>Hidrológico</strong> <strong>de</strong> <strong>la</strong>s <strong>Cuenca</strong>s Huancané y Suches 2010<br />
ba<strong>la</strong>nce hídrico a nivel mensual serán diferentes para cada una <strong>de</strong> <strong>la</strong>s épocas mencionadas,<br />
mostrándose el mismo en <strong>la</strong> ecuación <strong>de</strong> ba<strong>la</strong>nce hídrico.<br />
7.3.1 Descripción general <strong>de</strong>l mo<strong>de</strong>lo<br />
El elemento constitutivo <strong>de</strong>l mo<strong>de</strong>lo es el cálculo en base a <strong>la</strong> precipitación mensual<br />
teniendo en cuenta <strong>la</strong>s características <strong>de</strong> <strong>la</strong> cuenca. En base a los datos disponibles se ha<br />
establecido y calibrado mo<strong>de</strong>los parciales para <strong>la</strong>s influencias <strong>de</strong> mayor importancia al<br />
escurrimiento y <strong>la</strong> retención <strong>de</strong> <strong>la</strong> cuenca. El mo<strong>de</strong>lo compren<strong>de</strong> dos etapas:<br />
Primero se establece el ba<strong>la</strong>nce hídrico, para <strong>de</strong>terminar <strong>la</strong> influencia <strong>de</strong> los<br />
parámetros meteorológicos <strong>de</strong> <strong>la</strong> cuenca durante el año promedio.<br />
Posteriormente se <strong>de</strong>termina los caudales para el pe<strong>río</strong>do extendido, mediante un<br />
proceso Markoviano (<strong>de</strong> regresión triple) teniendo en cuenta <strong>la</strong> precipitación<br />
efectiva como variable <strong>de</strong> impulso para <strong>de</strong>terminar los parámetros estadísticos <strong>de</strong> <strong>la</strong><br />
distribución empírica tales como el promedio, <strong>la</strong> <strong>de</strong>sviación estándar y sesgo.<br />
7.3.1.1 Mo<strong>de</strong><strong>la</strong>miento hidrológico para el año promedio<br />
A.- Precipitación areal <strong>de</strong> <strong>la</strong> cuenca<br />
Es aquel<strong>la</strong> precipitación hidrológica que cae sobre una cuenca <strong>de</strong>terminada. Esta<br />
precipitación se pue<strong>de</strong> calcu<strong>la</strong>r mediante los métodos <strong>de</strong> polígono <strong>de</strong> Thiessen, Thiessen<br />
Modificado, <strong>la</strong>s Isoyetas y el aritmético, los más usados en hidrología.<br />
En este caso <strong>la</strong> precipitación areal mensual en <strong>la</strong> cuenca se <strong>de</strong>termina por el método <strong>de</strong><br />
Thiessen Modificado, por polígonos <strong>de</strong> influencia <strong>de</strong> <strong>la</strong>s estaciones meteorológicas <strong>de</strong>ntro<br />
y alre<strong>de</strong>dor <strong>de</strong> <strong>la</strong> cuenca, teniendo en cuenta <strong>la</strong> gradiente <strong>de</strong> <strong>la</strong> lluviosidad calcu<strong>la</strong>da a<br />
partir <strong>de</strong> datos <strong>de</strong> <strong>la</strong>s mismas estaciones.<br />
B.- Precipitación efectiva<br />
Des<strong>de</strong> el punto <strong>de</strong> vista hidrológico, es aquel<strong>la</strong> precipitación que genera el escurrimiento<br />
superficial <strong>de</strong> <strong>la</strong>s aguas <strong>de</strong> lluvia a través <strong>de</strong> cuencas naturales l<strong>la</strong>mados <strong>río</strong>s. Para llegar a<br />
este tipo <strong>de</strong> escurrimiento <strong>la</strong> precipitación total sufre un <strong>de</strong>cremento por<br />
evapotranspiración, infiltración, retención en acuíferos o abastecimiento <strong>de</strong> acuíferos, para<br />
finalmente <strong>la</strong> diferencia llegar al escurrimiento superficial.<br />
La precipitación efectiva se calcu<strong>la</strong> mediante <strong>la</strong> ecuación <strong>de</strong> un polinomio <strong>de</strong> quinto grado,<br />
e<strong>la</strong>borado por <strong>la</strong> Misión Técnica Alemana en 1980 para el ex-Programa Nacional <strong>de</strong><br />
Pequeñas y Medianas Irrigaciones - P<strong>la</strong>n Meris II.<br />
PE <br />
2 3 4 5<br />
a 0 a1P<br />
a 2P<br />
a 3P<br />
a 4P<br />
a 5P<br />
(1)<br />
Don<strong>de</strong>:<br />
PE = Precipitación efectiva mensual (mm/mes).<br />
P = Precipitación total mensual (mm/mes).<br />
MINAG-ANA-DCPRH-AGUAS SUPERFICIALES Pág.217
<strong>Estudio</strong> <strong>Hidrológico</strong> <strong>de</strong> <strong>la</strong>s <strong>Cuenca</strong>s Huancané y Suches 2010<br />
a i<br />
a 0 0<br />
= coeficiente <strong>de</strong>l polinomio.<br />
Tab<strong>la</strong> A: Coeficientes para el cálculo <strong>de</strong> <strong>la</strong> precipitación efectiva<br />
a i Curva I Curva II Curva III<br />
a 0 (-0.018) (-0.021) (-0.028)<br />
a 1 -0.01850 0.1358 0.2756<br />
a 2 0.001105 -0.002296 -0.004103<br />
a 3 -1204 E-8 4349 E-8 5534 E-8<br />
a 4 144 E-9 -89.0 E-9 124 E-9<br />
a 5 -285 E-12 -879 E-13 -142 E-11<br />
Fuente: Generación <strong>de</strong> caudales mensuales en <strong>la</strong> sierra peruana – Programa nacional <strong>de</strong> pequeñas<br />
y medianas irrigaciones – P<strong>la</strong>n Meris II, Marzo 1980.<br />
Para el cálculo <strong>de</strong> <strong>la</strong> precipitación efectiva mensual en <strong>la</strong> cuenca, se selecciona <strong>la</strong>s curvas<br />
tipo I y II ó tipo II y III, siempre verificando que <strong>la</strong> curva PE este <strong>de</strong>ntro <strong>de</strong> estos límites<br />
(no <strong>de</strong>be separarse mucho <strong>de</strong> <strong>la</strong>s curvas). Escogiendo <strong>la</strong>s curvas tipo I y II, <strong>la</strong> ecuación es<br />
<strong>la</strong> siguiente:<br />
PE 1<br />
2<br />
C PEI<br />
C PEII<br />
(2)<br />
Don<strong>de</strong>:<br />
PE = Precipitación efectiva mensual.<br />
PE I = Precipitación efectiva mensual <strong>de</strong> <strong>la</strong> curva I.<br />
PE II = Precipitación efectiva mensual <strong>de</strong> <strong>la</strong> curva II.<br />
C 1 yC<br />
2 = Coeficientes ( C1 C2<br />
1).<br />
Luego se <strong>de</strong>terminan los coeficientes C 1 y C 2 <strong>de</strong> manera que <strong>la</strong> suma <strong>de</strong> ambas<br />
precipitaciones anuales multiplicados por sus coeficientes respectivos sea igual al producto<br />
<strong>de</strong>l coeficiente <strong>de</strong> escurrimiento C y <strong>de</strong> <strong>la</strong> precipitación total anual P.<br />
PE C.<br />
P<br />
Don<strong>de</strong>:<br />
(3)<br />
C = Coeficiente <strong>de</strong> escurrimiento.<br />
P = Precipitación total anual.<br />
Igua<strong>la</strong>ndo <strong>la</strong>s ecuaciones (2) y (3), se tiene <strong>la</strong>s ecuaciones correspondientes <strong>de</strong> C 1 y C 2 .<br />
C.<br />
P <br />
<br />
PEI<br />
<br />
<br />
<br />
<br />
PEII<br />
C 1 (4)<br />
<br />
<br />
<br />
PEII<br />
C.<br />
P PEI<br />
C2 <br />
(5)<br />
PEII<br />
PEI<br />
Límite superior para <strong>la</strong> precipitación efectiva es:<br />
MINAG-ANA-DCPRH-AGUAS SUPERFICIALES Pág.218
<strong>Estudio</strong> <strong>Hidrológico</strong> <strong>de</strong> <strong>la</strong>s <strong>Cuenca</strong>s Huancané y Suches 2010<br />
Curva I : P > 177.8 mm/mes<br />
Curva II : 127.0 < P < 177.8 mm/mes<br />
Curva III : P < 127.0 mm/mes<br />
C.- Retención en <strong>la</strong> cuenca (contribución <strong>de</strong> <strong>la</strong> retención)<br />
Suponiendo que para el año promedio existe un equilibrio entre el gasto y el<br />
abastecimiento <strong>de</strong> <strong>la</strong> reserva <strong>de</strong> <strong>la</strong> cuenca y admitiendo que el caudal total sea igual a <strong>la</strong><br />
precipitación efectiva anual, se pue<strong>de</strong> calcu<strong>la</strong>r <strong>la</strong> contribución <strong>de</strong> <strong>la</strong> reserva hídrica al<br />
caudal según <strong>la</strong> fórmu<strong>la</strong> siguiente:<br />
R i CMi<br />
PEi<br />
(6)<br />
CM PE G A<br />
(7)<br />
i<br />
i<br />
i<br />
i<br />
Don<strong>de</strong>:<br />
R i = Retención <strong>de</strong> <strong>la</strong> cuenca (mm/mes).<br />
CM i = Caudal mensual (mm/mes).<br />
PE i = Precipitación efectiva mensual (mm/mes).<br />
G i = Gasto <strong>de</strong> <strong>la</strong> retención <strong>de</strong> <strong>la</strong> cuenca (mm/mes).<br />
A i = Abastecimiento <strong>de</strong> <strong>la</strong> retención <strong>de</strong> <strong>la</strong> cuenca (mm/mes).<br />
R i = G i para valores mayores <strong>de</strong> cero (mm/mes).<br />
A para valores menores <strong>de</strong> cero (mm/mes).<br />
R i = i<br />
Sumando todo los valores <strong>de</strong> gasto o abastecimiento, se hal<strong>la</strong> <strong>la</strong> retención total R <strong>de</strong> <strong>la</strong><br />
cuenca para el año promedio en (mm/año). Por <strong>de</strong>finición R es igual al gasto total G<br />
durante <strong>la</strong> estación seca y a<strong>de</strong>más igual al abastecimiento total A durante <strong>la</strong> estación<br />
lluviosa.<br />
Al principio <strong>de</strong> <strong>la</strong> estación lluviosa el proceso <strong>de</strong> agotamiento <strong>de</strong> <strong>la</strong> reserva termina y parte<br />
<strong>de</strong> <strong>la</strong>s lluvias más abundantes entra en los almacenes hídricos. El proceso <strong>de</strong><br />
abastecimiento se muestra por un déficit entre <strong>la</strong> precipitación efectiva y el caudal real.<br />
Analizando los hidrogramas <strong>de</strong> <strong>la</strong> contribución <strong>de</strong> <strong>la</strong> retención a los caudales, se constata<br />
que el abastecimiento es más fuerte al principio <strong>de</strong> <strong>la</strong> estación lluviosa y cuando los<br />
almacenes naturales - <strong>la</strong>gunas, pantanos, nevados y los acuíferos ya están recargados<br />
parcialmente, <strong>la</strong> restitución acaba poco a poco.<br />
1º Gasto <strong>de</strong> <strong>la</strong> retención <strong>de</strong> <strong>la</strong> cuenca ( G )<br />
Es el volumen <strong>de</strong> agua que <strong>de</strong>scarga <strong>la</strong> cuenca durante <strong>la</strong> época <strong>de</strong> estiaje, l<strong>la</strong>mado también<br />
agotamiento <strong>de</strong> <strong>la</strong> cuenca y alimenta al <strong>río</strong> en forma <strong>de</strong> caudal natural. Los parámetros para<br />
calcu<strong>la</strong>r el gasto <strong>de</strong> <strong>la</strong> retención <strong>de</strong> <strong>la</strong> cuenca se <strong>de</strong>scribe a continuación:<br />
Coeficiente <strong>de</strong> agotamiento ( a )<br />
Para el cálculo <strong>de</strong>l coeficiente <strong>de</strong> agotamiento <strong>de</strong> <strong>la</strong> cuenca, hay cuatro ecuaciones para<br />
cuatro c<strong>la</strong>ses <strong>de</strong> cuencas según el mo<strong>de</strong>lo. Las ecuaciones se eligen según <strong>la</strong>s<br />
características <strong>de</strong> <strong>la</strong> cuenca.<br />
MINAG-ANA-DCPRH-AGUAS SUPERFICIALES Pág.219
<strong>Estudio</strong> <strong>Hidrológico</strong> <strong>de</strong> <strong>la</strong>s <strong>Cuenca</strong>s Huancané y Suches 2010<br />
Agotamiento muy rápido, cuencas con temperatura elevada mayor <strong>de</strong> 10ºC y<br />
retención reducida (50 mm/año) hasta retención mediana (80 mm/año).<br />
a 0.00252<br />
Ln(AR) 0.034<br />
(8)<br />
Agotamiento rápido, por <strong>la</strong> retención en 50 y 80 mm/año y vegetación poco<br />
<strong>de</strong>sarrol<strong>la</strong>da (puna).<br />
a 0.00252<br />
Ln(AR) 0.030<br />
(9)<br />
Agotamiento mediano, por retención mediana (alre<strong>de</strong>dor <strong>de</strong> 80 mm/año) y<br />
vegetación mezc<strong>la</strong>da (pastos, bosques y terrenos cultivados).<br />
a 0.<br />
00252Ln(<br />
AR)<br />
0.<br />
026<br />
(10)<br />
Agotamiento reducido, por alta retención (más <strong>de</strong> 100 mm/año) y vegetación<br />
mezc<strong>la</strong>da.<br />
a 0.<br />
00252Ln(<br />
AR)<br />
0.<br />
023<br />
(11)<br />
Don<strong>de</strong>:<br />
a = Coeficiente <strong>de</strong> agotamiento por día.<br />
AR = Área <strong>de</strong> <strong>la</strong> cuenca (km 2 ).<br />
Ln = Logaritmo natural o neperiano.<br />
Se pue<strong>de</strong> <strong>de</strong>terminar el coeficiente <strong>de</strong> agotamiento real <strong>de</strong> <strong>la</strong> cuenca mediante varios aforos<br />
en el <strong>río</strong> durante <strong>la</strong> estación seca. Pero cuando no exista ningún aforo o so<strong>la</strong>mente una<br />
observación, se utiliza una <strong>de</strong> <strong>la</strong>s ecuaciones empíricas (8-11) según <strong>la</strong> predominancia <strong>de</strong><br />
los criterios anteriormente mencionados.<br />
Determinado el coeficiente <strong>de</strong> agotamiento <strong>de</strong> <strong>la</strong> cuenca en base <strong>de</strong> los datos hidrométricos.<br />
Se constata que el coeficiente <strong>de</strong> agotamiento no es constante durante toda <strong>la</strong> estación seca<br />
sino que disminuye poco a poco.<br />
Para los <strong>río</strong>s en <strong>la</strong> Sierra que han sido analizados, el valor <strong>de</strong>l coeficiente <strong>de</strong> agotamiento<br />
“a” inicial es hasta dos veces más gran<strong>de</strong> que el “a” final. Este fenómeno se explica por el<br />
agotamiento más rápido <strong>de</strong> los almacenes hídricos a corto p<strong>la</strong>zo.<br />
Coeficiente <strong>de</strong> gasto <strong>de</strong> <strong>la</strong> retención ( b i )<br />
Re<strong>la</strong>ción entre <strong>la</strong> <strong>de</strong>scarga <strong>de</strong>l mes actual y <strong>de</strong>l mes anterior:<br />
Q t<br />
b0<br />
<br />
Q0<br />
Don<strong>de</strong>:<br />
a.<br />
t<br />
e<br />
(12)<br />
Q = Descarga en el tiempo t.<br />
t<br />
Q 0 = Descarga inicial.<br />
a = Coeficiente <strong>de</strong> agotamiento.<br />
t = Tiempo (número <strong>de</strong> días <strong>de</strong>l mes).<br />
Por lo tanto el coeficiente <strong>de</strong> gasto <strong>de</strong> <strong>la</strong> retención <strong>de</strong> <strong>la</strong> cuenca b i , es igual a:<br />
b <br />
b<br />
i<br />
0<br />
MINAG-ANA-DCPRH-AGUAS SUPERFICIALES Pág.220
<strong>Estudio</strong> <strong>Hidrológico</strong> <strong>de</strong> <strong>la</strong>s <strong>Cuenca</strong>s Huancané y Suches 2010<br />
b<br />
a.<br />
t<br />
i e<br />
(13)<br />
Don<strong>de</strong>:<br />
t = Tiempo (número <strong>de</strong> días <strong>de</strong>l mes, es acumu<strong>la</strong>tivo para los<br />
meses siguientes).<br />
e = Base <strong>de</strong>l logaritmo neperiano.<br />
Cálculo <strong>de</strong> gasto <strong>de</strong> <strong>la</strong> retención ( G )<br />
La contribución mensual <strong>de</strong> <strong>la</strong> retención durante <strong>la</strong> estación seca se calcu<strong>la</strong><br />
mediante <strong>la</strong> siguiente re<strong>la</strong>ción:<br />
<br />
<br />
bi<br />
G i <br />
<br />
R<br />
m <br />
bi<br />
<br />
i1<br />
<br />
Don<strong>de</strong>:<br />
G i = Gasto <strong>de</strong> <strong>la</strong> retención para el mes i (mm/mes).<br />
R = Retención <strong>de</strong> <strong>la</strong> cuenca (mm/año).<br />
m = Número <strong>de</strong> meses <strong>de</strong> estiaje.<br />
b = Coeficiente <strong>de</strong> gasto <strong>de</strong> <strong>la</strong> retención.<br />
i<br />
2º Abastecimiento <strong>de</strong> <strong>la</strong> retención <strong>de</strong> <strong>la</strong> cuenca ( A )<br />
Es el volumen <strong>de</strong> agua que retiene <strong>la</strong> cuenca durante <strong>la</strong> época <strong>de</strong> lluvias, almacenando<br />
naturalmente en acuíferos, <strong>la</strong>gunas, pantanos y nevados como reserva hídrica. Para<br />
posteriormente alimentar al <strong>río</strong> en época <strong>de</strong> estiaje.<br />
La lámina <strong>de</strong> agua A i que entra en <strong>la</strong> reserva <strong>de</strong> <strong>la</strong> cuenca se muestra en forma <strong>de</strong> un<br />
déficit mensual <strong>de</strong> <strong>la</strong> precipitación efectiva mensual. Se calcu<strong>la</strong> mediante <strong>la</strong> siguiente<br />
ecuación:<br />
MINAG-ANA-DCPRH-AGUAS SUPERFICIALES Pág.221<br />
(14)<br />
Ai a iR<br />
(15)<br />
Don<strong>de</strong>:<br />
A i = Abastecimiento <strong>de</strong> <strong>la</strong> retención en el mes i (mm/mes).<br />
a i = Coeficiente <strong>de</strong> abastecimiento.<br />
R = Retención <strong>de</strong> <strong>la</strong> cuenca (mm/año).<br />
i = Mes <strong>de</strong>l año, <strong>de</strong> 1 a 12.<br />
El coeficiente <strong>de</strong> abastecimiento <strong>de</strong> <strong>la</strong> retención, es <strong>la</strong> proporción <strong>de</strong> retención hídrica <strong>de</strong> <strong>la</strong><br />
cuenca durante <strong>la</strong> época <strong>de</strong> lluvias. Se pue<strong>de</strong> estimar con <strong>la</strong> siguiente re<strong>la</strong>ción:<br />
PE<br />
i<br />
a i (16)<br />
PET
<strong>Estudio</strong> <strong>Hidrológico</strong> <strong>de</strong> <strong>la</strong>s <strong>Cuenca</strong>s Huancané y Suches 2010<br />
Don<strong>de</strong>:<br />
a i = Coeficiente <strong>de</strong> abastecimiento.<br />
PE i = Precipitación efectiva <strong>de</strong>l mes i (mm/mes).<br />
PE = Precipitación efectiva total <strong>de</strong> <strong>la</strong> cuenca (mm/mes).<br />
T<br />
Se pue<strong>de</strong> <strong>de</strong>terminar el coeficiente <strong>de</strong> abastecimiento real <strong>de</strong> <strong>la</strong> cuenca mediante aforo <strong>de</strong><br />
<strong>de</strong>scargas en el <strong>río</strong> durante <strong>la</strong> estación lluviosa. Pero cuando no exista ningún aforo, se<br />
utiliza como referencia los valores obtenidos en <strong>la</strong>s cuencas <strong>de</strong> <strong>la</strong>s regiones <strong>de</strong> Cuzco,<br />
Huancavelica, Junín y Cajamarca, Tab<strong>la</strong> B, obtenido en el mo<strong>de</strong>lo.<br />
Tab<strong>la</strong> B: Coeficientes <strong>de</strong> almacenamiento hídrico durante <strong>la</strong> época <strong>de</strong> lluvias.<br />
(valores <strong>de</strong> “ai” en %)<br />
Región Ene Feb Mar Oct Nov Dic S<br />
Cuzco 40 20 0 0 5 35 100<br />
Huancavelica 30 20 5 10 0 35 100<br />
Junín 30 30 5 10 0 25 100<br />
Cajamarca 20 25 35 25 -5 0 100<br />
Fuente: Generación <strong>de</strong> caudales mensuales en <strong>la</strong> sierra peruana – Programa nacional <strong>de</strong> pequeñas y medianas<br />
irrigaciones – P<strong>la</strong>n Meris II, Marzo 1980.<br />
La suma <strong>de</strong> los valores re<strong>la</strong>tivos <strong>de</strong>l abastecimiento “ai” es igual a 1 (100%)<br />
correspondiente a <strong>la</strong> restitución total <strong>de</strong> <strong>la</strong> retención R <strong>de</strong> <strong>la</strong> cuenca.<br />
D.- Caudal mensual para el año promedio<br />
La lámina <strong>de</strong> agua que correspon<strong>de</strong> al caudal mensual para el año promedio se calcu<strong>la</strong><br />
según <strong>la</strong> ecuación <strong>de</strong>l ba<strong>la</strong>nce hídrico a partir <strong>de</strong> los componentes <strong>de</strong>scritos anteriormente.<br />
CM PE G A<br />
(17)<br />
i<br />
i<br />
i<br />
i<br />
Don<strong>de</strong>:<br />
CM i = Caudal <strong>de</strong>l mes i (mm/mes).<br />
PE i = Precipitación efectiva <strong>de</strong>l mes i (mm/mes).<br />
G i = Gasto <strong>de</strong> <strong>la</strong> retención en el mes i (mm/mes).<br />
A = Abastecimiento <strong>de</strong> <strong>la</strong> retención en el mes i (mm/mes).<br />
i<br />
7.3.1.2 Generación <strong>de</strong> caudales mensuales para pe<strong>río</strong>dos extendidos<br />
El método hidrológico presentado anteriormente permite <strong>de</strong>terminar los caudales<br />
mensuales <strong>de</strong>l año promedio con una precisión satisfactoria. Para <strong>de</strong>terminar, a<strong>de</strong>más <strong>de</strong><br />
los promedios, otros parámetros estadísticos, sobre todo <strong>la</strong> <strong>de</strong>sviación tipo que se necesita<br />
para el cálculo <strong>de</strong> <strong>de</strong>scargas sobre un nivel <strong>de</strong> probabilidad pre<strong>de</strong>terminado, se requiere<br />
generar datos para un pe<strong>río</strong>do extendido. Un método apropiado para <strong>la</strong> generación <strong>de</strong><br />
<strong>de</strong>scargas consiste en una combinación <strong>de</strong> un proceso Markoviano <strong>de</strong> primer or<strong>de</strong>n.<br />
Q <br />
2<br />
t b1<br />
b2Q<br />
t<br />
1 b3PEt<br />
S.<br />
Zt<br />
1 R<br />
(18)<br />
MINAG-ANA-DCPRH-AGUAS SUPERFICIALES Pág.222
<strong>Estudio</strong> <strong>Hidrológico</strong> <strong>de</strong> <strong>la</strong>s <strong>Cuenca</strong>s Huancané y Suches 2010<br />
Don<strong>de</strong>:<br />
Q = Caudal <strong>de</strong>l mes t.<br />
t<br />
Q = Caudal <strong>de</strong>l mes anterior (t-1).<br />
t 1<br />
PE t = Precipitación efectiva <strong>de</strong>l mes t.<br />
S = Error estándar <strong>de</strong>l estimado.<br />
Z = Variable aleatoria normal in<strong>de</strong>pendiente (0,1) <strong>de</strong>l mes t.<br />
t<br />
2<br />
R = Coeficiente <strong>de</strong> <strong>de</strong>terminación múltiple.<br />
b , b , b = Coeficientes <strong>de</strong> regresión lineal múltiple.<br />
1<br />
1<br />
2<br />
3<br />
b = Factor constante (caudal básico).<br />
Procedimiento para <strong>la</strong> generación <strong>de</strong> <strong>de</strong>scargas medias mensuales para pe<strong>río</strong>dos extendidos<br />
es <strong>la</strong> siguiente:<br />
Cálculo <strong>de</strong> los parámetros <strong>de</strong>l mo<strong>de</strong>lo b1, b2, b3, S y R 2 ; con el resultado <strong>de</strong><br />
<strong>la</strong> generación <strong>de</strong> caudales mensuales para el año promedio, efectuando <strong>la</strong><br />
regresión lineal múltiple entre el caudal <strong>de</strong>l mes t (Qt) como variable<br />
<strong>de</strong>pendiente, caudal <strong>de</strong>l mes anterior (Qt-1) y <strong>la</strong> precipitación efectiva <strong>de</strong>l<br />
mes t (PEt) como variables in<strong>de</strong>pendientes.<br />
Cálculo <strong>de</strong> <strong>la</strong> precipitación efectiva mensual para el registro <strong>de</strong> <strong>la</strong><br />
precipitación areal mensual <strong>de</strong> <strong>la</strong> cuenca.<br />
Generación <strong>de</strong> números aleatorios normales in<strong>de</strong>pendientes con distribución<br />
normal con media cero y variancia unitaria (0,1).<br />
Generación <strong>de</strong> <strong>de</strong>scargas medias mensuales para pe<strong>río</strong>dos extendidos con <strong>la</strong><br />
información <strong>de</strong> los pasos anteriores mediante <strong>la</strong> ecuación (18).<br />
7.4 APLICACIÓN DEL MODELO<br />
El mo<strong>de</strong>lo hidrológico <strong>de</strong> Lutz Scholz, se ha aplicado en <strong>la</strong>s cuencas <strong>de</strong> los <strong>río</strong>s Huancané<br />
y Suches, <strong>de</strong>bido a que estos <strong>río</strong>s cuentan con información hidrométrica disponible para<br />
realizar el mo<strong>de</strong><strong>la</strong>miento y calibración <strong>de</strong>l mo<strong>de</strong>lo.<br />
7.4.1 Calibración <strong>de</strong>l mo<strong>de</strong>lo en <strong>la</strong> cuenca <strong>de</strong>l <strong>río</strong> Huancané<br />
El mo<strong>de</strong><strong>la</strong>miento y calibración <strong>de</strong>l mo<strong>de</strong>lo hidrológico <strong>de</strong> Lutz Scholz <strong>de</strong>sarrol<strong>la</strong>do para el<br />
<strong>río</strong> Huancané, <strong>de</strong>bido a que este <strong>río</strong> dispone <strong>de</strong> información hidrométrica histórica, ello<br />
permite realizar <strong>la</strong> calibración <strong>de</strong> los parámetros <strong>de</strong>l mo<strong>de</strong>lo, tales como: Coeficiente <strong>de</strong><br />
gasto b i ,<br />
coeficiente <strong>de</strong> abastecimiento a i ,<br />
coeficiente <strong>de</strong> agotamiento a , retención<br />
anual <strong>de</strong> <strong>la</strong> cuenca R y los coeficientes <strong>de</strong> <strong>la</strong> precipitación efectiva C1 y C2,<br />
respectivamente.<br />
La información utilizada para el mo<strong>de</strong><strong>la</strong>miento y calibración <strong>de</strong>l mo<strong>de</strong>lo <strong>de</strong> Lutz Scholz, es<br />
<strong>la</strong> siguiente:<br />
- Caudales promedios multimensuales y anuales <strong>de</strong>l <strong>río</strong> Huancané.<br />
- Precipitación areal <strong>de</strong> <strong>la</strong> cuenca <strong>de</strong>l <strong>río</strong> Huancané.<br />
- Área <strong>de</strong> <strong>la</strong> cuenca <strong>de</strong>l <strong>río</strong> Huancané (3,511.10 km 2 ).<br />
MINAG-ANA-DCPRH-AGUAS SUPERFICIALES Pág.223
<strong>Estudio</strong> <strong>Hidrológico</strong> <strong>de</strong> <strong>la</strong>s <strong>Cuenca</strong>s Huancané y Suches 2010<br />
Utilizando <strong>la</strong> información disponible y empleando <strong>la</strong> metodología <strong>de</strong>scrita anteriormente,<br />
se realizó el mo<strong>de</strong><strong>la</strong>miento hidrológico, llegando a calibrarse los parámetros <strong>de</strong>l mo<strong>de</strong>lo,<br />
tal como se muestra a continuación.<br />
Cuadro Nº 7.1 Mo<strong>de</strong>lo <strong>Hidrológico</strong> <strong>de</strong> Lutz Scholz – Río Huancané<br />
PE - I PE - II PE - III PE b i G i a i A i<br />
(mm/mes) (mm/mes) (mm/mes) (mm/mes) (mm/mes) (mm/mes) (mm/mes) (mm/mes) (m3/s) (m3/s) (mm/mes)<br />
Enero 147.10 30.70 61.00 88.20 58.10 0.000 0.00 0.680 30.40 27.70 36.31 46.73 35.65<br />
Febrero 112.20 12.60 32.10 51.80 32.20 0.000 0.00 -0.195 -8.72 40.92 59.39 58.38 40.22<br />
Marzo 100.80 8.90 24.80 40.80 25.40 0.000 0.00 -0.250 -11.18 36.58 47.95 51.12 39.00<br />
Abril 49.50 1.10 5.80 10.60 6.30 0.526 21.77 0.150 6.71 21.36 28.93 26.70 19.71<br />
Mayo 14.30 0.00 1.60 3.30 1.20 0.271 11.22 0.050 2.24 10.18 13.34 9.81 7.48<br />
Junio 5.60 0.00 0.70 1.40 0.50 0.142 5.88 0.000 0.00 6.38 8.64 4.85 3.58<br />
Julio 5.00 0.00 0.60 1.30 0.40 0.073 3.02 0.000 0.00 3.42 4.48 3.55 2.71<br />
Agosto 11.10 0.00 1.30 2.60 1.00 0.038 1.57 0.000 0.00 2.57 3.37 2.69 2.05<br />
Septiembre 31.40 0.30 3.30 6.40 3.10 0.020 0.83 0.000 0.00 3.93 5.32 2.77 2.04<br />
Octubre 49.00 1.10 5.70 10.50 5.80 0.010 0.41 0.045 2.01 4.20 5.51 3.50 2.67<br />
Noviembre 67.10 2.60 10.00 17.30 11.60 0.000 0.00 0.120 5.36 6.24 8.45 5.27 3.89<br />
Diciembre 106.40 10.60 28.20 46.10 29.30 0.000 0.00 0.400 17.88 11.42 14.97 13.59 10.37<br />
Total 699.50 67.90 175.10 280.30 174.90 1.080 44.70 1.000 44.70 174.90 19.72 19.08 169.37<br />
Caudal (m 3 /s)<br />
Mes<br />
A = 3511.10 km 2<br />
Precipitación efectiva Coeficiente <strong>de</strong> escorrentía<br />
PE = C 1 * PE-I + C 2 * PE-II<br />
70.00<br />
60.00<br />
50.00<br />
40.00<br />
30.00<br />
20.00<br />
10.00<br />
0.00<br />
Total<br />
P<br />
Mo<strong>de</strong>lo <strong>Hidrológico</strong> <strong>de</strong> Lutz Scholz<br />
Generación <strong>de</strong> caudales mensuales para el año promedio - Río Huancané<br />
Estación hidrométrica Puente Huancané<br />
Precipitación mensual Contribución a <strong>la</strong> Retención<br />
Efectiva<br />
Gasto<br />
Abastecimiento<br />
Caudal mensual<br />
Generado Aforado<br />
Área <strong>de</strong> <strong>la</strong> cuenca Retención <strong>de</strong> <strong>la</strong> cuenca<br />
Coeficiente <strong>de</strong> agotamiento<br />
R = 44.70 mm/año a = 0.02143 w = 0.04200<br />
Coeficientes Comprobación<br />
C = 0.242 C 1 = 0.236 C 2 = 0.764 C 1 + C 2 = 1.00 OK'<br />
Figura Nº 7.1 Comparación entre caudales generados y aforados – Río Huancané<br />
Ago Set Oct Nov Dic Ene Feb Mar Abr May Jun Jul<br />
Tiempo (mes)<br />
Generado Aforado<br />
MINAG-ANA-DCPRH-AGUAS SUPERFICIALES Pág.224
<strong>Estudio</strong> <strong>Hidrológico</strong> <strong>de</strong> <strong>la</strong>s <strong>Cuenca</strong>s Huancané y Suches 2010<br />
Se ha realizado el análisis <strong>de</strong> regresión lineal múltiple para obtener los coeficientes b1, b2,<br />
b3, b4; error estándar S y el coeficiente <strong>de</strong> corre<strong>la</strong>ción múltiple R, <strong>de</strong> <strong>la</strong> ecuación <strong>de</strong><br />
generación estocástica. La ecuación original <strong>de</strong> generación estocástica no reproduce los<br />
parámetros estadísticos (media y <strong>de</strong>sviación estándar) <strong>de</strong> <strong>la</strong> serie generada en comparación<br />
a <strong>la</strong> serie histórica <strong>de</strong>l <strong>río</strong> Huancané, por lo que ha sido necesario introducir una variable<br />
más que viene ser el PEt 1,<br />
con el que se ha logrado <strong>la</strong> generación <strong>de</strong> caudales medios<br />
mensuales en forma a<strong>de</strong>cuada. A continuación se muestra los parámetros <strong>de</strong> <strong>la</strong> ecuación <strong>de</strong><br />
generación <strong>de</strong> caudales medios mensuales.<br />
Parámetros:<br />
- Factor constante (caudal básico) : b 1 = 0.62628<br />
- Factor <strong>de</strong> influencia <strong>de</strong>l valor <strong>de</strong> Q t-1 : b 2 = 0.35029<br />
- Factor <strong>de</strong> influencia <strong>de</strong>l valor <strong>de</strong> PE t : b 3 = 0.19434<br />
- Factor <strong>de</strong> influencia <strong>de</strong>l valor <strong>de</strong> PE t-1 : b 4 = 0.41240<br />
- Error estándar <strong>de</strong>l estimado Q' t : S = 2.08457<br />
- Coeficiente <strong>de</strong> <strong>de</strong>terminación múltiple : R 2 = 0.97671<br />
- Coeficiente <strong>de</strong> corre<strong>la</strong>ción múltiple : R = 0.98829<br />
- Valor <strong>de</strong> Q t-1 para el inicio <strong>de</strong> <strong>la</strong> generación (mm): Q t-1 = 11.42<br />
- Valor <strong>de</strong> PE t-1 para el inicio <strong>de</strong> <strong>la</strong> generación (mm): PE t-1 = 11.60<br />
Mo<strong>de</strong>lo Autorregresivo:<br />
Q S.Z 1<br />
R<br />
t b1<br />
b2Q<br />
t1<br />
b3PEt<br />
b4PEt1<br />
Don<strong>de</strong>:<br />
Qt = Caudal <strong>de</strong>l mes t.<br />
Qt-1 = Caudal <strong>de</strong>l mes anterior (t-1).<br />
PEt = Precipitación efectiva <strong>de</strong>l mes t.<br />
PEt-1 = Precipitación efectiva <strong>de</strong>l mes (t-1).<br />
S = Error estándar <strong>de</strong>l estimado Q't. Zt = Variable aleatoria normal in<strong>de</strong>pendiente (0,1) <strong>de</strong>l mes t.<br />
b1,b2,b3,b4 = Coeficientes <strong>de</strong> regresión lineal múltiple.<br />
El procedimiento <strong>de</strong> generación <strong>de</strong> caudales mensuales para pe<strong>río</strong>dos extendidos es <strong>la</strong><br />
siguiente:<br />
- Generación <strong>de</strong> números aleatorios normales in<strong>de</strong>pendientes con media cero y<br />
varianza unitaria (0,1).<br />
- Precipitación efectiva mensual.<br />
- Generación <strong>de</strong> caudales medios mensuales.<br />
La comparación <strong>de</strong> <strong>la</strong> serie anual <strong>de</strong> caudales medios generados con respecto a <strong>la</strong> serie<br />
anual <strong>de</strong> caudales medios históricos <strong>de</strong>l <strong>río</strong> Huancané, son simi<strong>la</strong>res, tal como se muestran<br />
en <strong>la</strong> Figura Nº 7.2.<br />
La comparación <strong>de</strong> caudales promedios multimensuales generados con respecto a los<br />
caudales promedios multimensuales históricos <strong>de</strong>l <strong>río</strong> Huancané, son simi<strong>la</strong>res, tal como se<br />
muestran en <strong>la</strong> Figura Nº 7.3.<br />
MINAG-ANA-DCPRH-AGUAS SUPERFICIALES Pág.225<br />
t<br />
2
<strong>Estudio</strong> <strong>Hidrológico</strong> <strong>de</strong> <strong>la</strong>s <strong>Cuenca</strong>s Huancané y Suches 2010<br />
Caudal (m 3 /s)<br />
Caudal (m 3 /s)<br />
45.00<br />
40.00<br />
35.00<br />
30.00<br />
25.00<br />
20.00<br />
15.00<br />
10.00<br />
5.00<br />
Figura Nº 7.2 Caudales medios anuales generados y aforados – Río Huancané<br />
0.00<br />
1950 1960 1970 1980 1990 2000 2010 2020<br />
70.00<br />
60.00<br />
50.00<br />
40.00<br />
30.00<br />
20.00<br />
10.00<br />
0.00<br />
Tiempo (año) AFORADO GENERADO<br />
Figura Nº 7.3 Variación mensual <strong>de</strong> caudales generados y aforados – Río Huancané<br />
ENE FEB MAR ABR MAY JUN JUL AGO SET OCT NOV DIC<br />
Tiempo (mes) AFORADO GENERADO<br />
MINAG-ANA-DCPRH-AGUAS SUPERFICIALES Pág.226
<strong>Estudio</strong> <strong>Hidrológico</strong> <strong>de</strong> <strong>la</strong>s <strong>Cuenca</strong>s Huancané y Suches 2010<br />
A continuación se muestra <strong>la</strong> comparación <strong>de</strong> hidrogramas <strong>de</strong> precipitación mensual,<br />
precipitación efectiva y escorrentías generadas y aforadas, con el fin conocer el<br />
comportamiento <strong>de</strong> los mismos.<br />
mm/mes<br />
Cuadro Nº 7.2 Precipitación mensual, precipitación efectiva y escorrentías - Río Huancané<br />
Variable Ago Set Oct Nov Dic Ene Feb Mar Abr May Jun Jul<br />
Precipitación total mensual 11.10 31.40 49.00 67.10 106.40 147.10 112.20 100.80 49.50 14.30 5.60 5.00<br />
Precipitación efectiva promedio 1.00 3.10 5.80 11.60 29.30 58.10 32.20 25.40 6.30 1.20 0.50 0.40<br />
Precipitación efectiva 1956-2009 1.00 3.10 5.80 11.60 29.30 58.10 32.20 25.40 6.30 1.20 0.50 0.40<br />
Escorrentía aforada 2.05 2.04 2.67 3.89 10.37 35.65 40.22 39.00 19.71 7.48 3.58 2.71<br />
Escorrentía generada promedio 2.57 3.93 4.20 6.24 11.42 27.70 40.92 36.58 21.36 10.18 6.38 3.42<br />
Escorrentía generada 1956-2009 2.00 2.30 3.80 6.60 13.50 28.60 40.90 33.10 23.90 11.90 5.40 2.80<br />
160.0<br />
140.0<br />
120.0<br />
100.0<br />
80.0<br />
60.0<br />
40.0<br />
20.0<br />
0.0<br />
Figura Nº 7.4 Hidrograma <strong>de</strong> escorrentía - Río Huancané<br />
Ago Set Oct Nov Dic Ene Feb Mar Abr May Jun Jul<br />
Análisis <strong>de</strong> <strong>la</strong> bondad <strong>de</strong>l mo<strong>de</strong>lo<br />
Tiempo (mes)<br />
Precipitación total mensual<br />
Precipitación efectiva promedio<br />
Precipitación efectiva 1956-2009<br />
Escorrentía aforada<br />
Escorrentía generada promedio<br />
Escorrentía generada 1956-2009<br />
Para el análisis <strong>de</strong> <strong>la</strong> bondad <strong>de</strong>l mo<strong>de</strong>lo se comparan <strong>la</strong>s medias y <strong>de</strong>sviaciones estándar<br />
<strong>de</strong> los caudales multimensuales generados y históricos <strong>de</strong>l <strong>río</strong> Huancané, estadísticamente<br />
<strong>de</strong>ben ser iguales a una probabilidad <strong>de</strong> confianza, en este caso al 95% <strong>de</strong> probabilidad.<br />
La comparación <strong>de</strong> <strong>la</strong>s medias se realiza utilizando <strong>la</strong> prueba estadística "T" y para <strong>la</strong>s<br />
<strong>de</strong>sviaciones estándar se utiliza <strong>la</strong> prueba estadística "F".<br />
MINAG-ANA-DCPRH-AGUAS SUPERFICIALES Pág.227
<strong>Estudio</strong> <strong>Hidrológico</strong> <strong>de</strong> <strong>la</strong>s <strong>Cuenca</strong>s Huancané y Suches 2010<br />
De los resultados mostrados en el Cuadro Nº 7.3, se <strong>de</strong>duce que <strong>la</strong>s medias son iguales<br />
estadísticamente en los ocho (8) meses, excepto en los meses <strong>de</strong> mayo, junio, octubre y<br />
noviembre; <strong>la</strong>s <strong>de</strong>sviaciones estándar son iguales estadísticamente en los seis (6) meses,<br />
excepto en los meses <strong>de</strong> enero, febrero, marzo, mayo, junio y noviembre; por lo que <strong>la</strong>s<br />
medias y <strong>de</strong>sviaciones estándar <strong>de</strong> <strong>la</strong> serie generada son iguales estadísticamente a <strong>la</strong>s<br />
medias y <strong>de</strong>sviaciones estándar <strong>de</strong> <strong>la</strong> serie histórica al 95% <strong>de</strong> probabilidad, ya que los<br />
valores <strong>de</strong> "T" y "F" calcu<strong>la</strong>dos resultan menores que los tabu<strong>la</strong>dos, respectivamente.<br />
A<strong>de</strong>más, numéricamente en algunos meses no muestran mucha diferencia entre valores<br />
históricos y generados, concluyéndose que el Mo<strong>de</strong>lo si reproduce <strong>la</strong> media y <strong>de</strong>sviación<br />
estándar, <strong>de</strong> <strong>la</strong> serie histórica en los meses <strong>de</strong> estiaje que es lo más importante y el Mo<strong>de</strong>lo<br />
es bueno.<br />
Cuadro Nº 7.3 Análisis <strong>de</strong> <strong>la</strong> bondad <strong>de</strong>l mo<strong>de</strong>lo hidrológico <strong>de</strong> Lutz Scholz - Río Huancané<br />
Mes<br />
Parámetros estadísticos<br />
Serie histórica Serie generada<br />
Media Desvest Media Desvest<br />
X h Sh Xg g Tc<br />
Media<br />
Tt<br />
Análisis estadístico<br />
Desviación estándar<br />
Fc Ft<br />
Enero 46.73 34.80 37.54 19.36 1.6958 1.9826 SI 3.2311 1.5777 NO<br />
Febrero 58.38 33.91 58.75 26.38 -0.0633 1.9826 SI 1.6524 1.5777 NO<br />
Marzo 51.12 28.64 43.45 18.58 1.6510 1.9826 SI 2.3760 1.5777 NO<br />
Abril 26.70 16.62 32.42 15.16 -1.8685 1.9826 SI 1.2019 1.5777 SI<br />
Mayo 9.81 5.31 15.54 7.10 -4.7492 1.9826 NO 1.7878 1.5777 NO<br />
Junio 4.85 1.98 7.30 2.75 -5.3130 1.9826 NO 1.9290 1.5777 NO<br />
Julio 3.55 1.01 3.69 1.16 -0.6689 1.9826 SI 1.3191 1.5777 SI<br />
Agosto 2.69 0.82 2.60 0.98 0.5176 1.9826 SI 1.4283 1.5777 SI<br />
Setiembre 2.77 1.24 3.15 1.51 -1.4292 1.9826 SI 1.4829 1.5777 SI<br />
Octubre 3.50 2.27 5.03 2.41 -3.3960 1.9826 NO 1.1272 1.5777 SI<br />
Noviembre 5.27 3.63 8.98 4.89 -4.4766 1.9826 NO 1.8147 1.5777 NO<br />
Diciembre 13.59 11.08 17.63 11.27 -1.8785 1.9826 SI 1.0346 1.5777 SI<br />
S Xh Xg<br />
Sh Sg<br />
Número <strong>de</strong> datos F calcu<strong>la</strong>do:<br />
N h = 54 Probabilidad = 95%<br />
N g = 54 a = 0.05<br />
G.L.N. = N h - 1 = 53<br />
T calcu<strong>la</strong>do: G.L.D. = N g - 1 = 53<br />
Probabilidad = 95%<br />
a = 0.05 G.L.N. = N g - 1 = 53<br />
G.L. = N h+N g-2 = 106 G.L.D. = N h - 1 = 53<br />
MINAG-ANA-DCPRH-AGUAS SUPERFICIALES Pág.228<br />
2<br />
h<br />
2<br />
g<br />
S S<br />
2<br />
h<br />
2<br />
g<br />
S S<br />
Cabe recalcar, que para el mo<strong>de</strong><strong>la</strong>miento hidrológico <strong>de</strong> <strong>la</strong>s <strong>de</strong>scargas medias mensuales<br />
<strong>de</strong>l <strong>río</strong> Huancané, se ha utilizado <strong>la</strong> precipitación areal calcu<strong>la</strong>da con el método <strong>de</strong><br />
Polígonos <strong>de</strong> Thiessen, es a <strong>la</strong> que mejor se ajusta <strong>la</strong> serie histórica <strong>de</strong> <strong>la</strong>s <strong>de</strong>scargas medias,<br />
que al método <strong>de</strong> Polígonos <strong>de</strong> Thiessen Modificado.
<strong>Estudio</strong> <strong>Hidrológico</strong> <strong>de</strong> <strong>la</strong>s <strong>Cuenca</strong>s Huancané y Suches 2010<br />
7.4.2 Calibración <strong>de</strong>l mo<strong>de</strong>lo en <strong>la</strong> cuenca <strong>de</strong>l <strong>río</strong> Suches<br />
El mo<strong>de</strong><strong>la</strong>miento y calibración <strong>de</strong>l mo<strong>de</strong>lo hidrológico <strong>de</strong> Lutz Scholz <strong>de</strong>sarrol<strong>la</strong>do para el<br />
<strong>río</strong> Suches, <strong>de</strong>bido a que este <strong>río</strong> dispone <strong>de</strong> información hidrométrica histórica, ello<br />
permite realizar <strong>la</strong> calibración <strong>de</strong> los parámetros <strong>de</strong>l mo<strong>de</strong>lo, tales como: Coeficiente <strong>de</strong><br />
gasto b i ,<br />
coeficiente <strong>de</strong> abastecimiento a i ,<br />
coeficiente <strong>de</strong> agotamiento a , retención<br />
anual <strong>de</strong> <strong>la</strong> cuenca R y los coeficientes <strong>de</strong> <strong>la</strong> precipitación efectiva C1 y C2,<br />
respectivamente.<br />
La información utilizada para el mo<strong>de</strong><strong>la</strong>miento y calibración <strong>de</strong>l mo<strong>de</strong>lo <strong>de</strong> Lutz Scholz, es<br />
<strong>la</strong> siguiente:<br />
- Caudales promedios multimensuales y anuales <strong>de</strong>l <strong>río</strong> Suches.<br />
- Precipitación areal <strong>de</strong> <strong>la</strong> cuenca <strong>de</strong>l <strong>río</strong> Suches.<br />
- Área <strong>de</strong> <strong>la</strong> cuenca <strong>de</strong>l <strong>río</strong> Huancané (2,930.73 km 2 ).<br />
Utilizando <strong>la</strong> información disponible y empleando <strong>la</strong> metodología <strong>de</strong>scrita anteriormente,<br />
se realizó el mo<strong>de</strong><strong>la</strong>miento hidrológico, llegando a calibrarse los parámetros <strong>de</strong>l mo<strong>de</strong>lo,<br />
tal como se muestra a continuación.<br />
Mes<br />
Total<br />
P<br />
Cuadro Nº 7.4 Mo<strong>de</strong>lo <strong>Hidrológico</strong> <strong>de</strong> Lutz Scholz – Río Suches<br />
PE - I PE - II PE - III PE b i G i a i A i<br />
(mm/mes) (mm/mes) (mm/mes) (mm/mes) (mm/mes) (mm/mes) (mm/mes) (mm/mes) (m3/s) (m3/s) (mm/mes)<br />
Enero 128.60 19.60 44.60 69.30 36.80 0.000 0.00 0.448 18.10 18.70 20.46 20.77 18.98<br />
Febrero 105.50 10.30 27.70 45.20 24.70 0.000 0.00 0.038 1.54 23.16 28.06 28.26 23.33<br />
Marzo 95.00 7.40 21.50 35.70 17.50 0.000 0.00 -0.107 -4.32 21.82 23.88 23.89 21.83<br />
Abril 49.40 1.10 5.80 10.60 4.40 0.474 21.71 0.290 11.72 14.39 16.27 15.18 13.43<br />
Mayo 17.30 0.00 1.90 3.80 0.90 0.219 10.03 0.133 5.37 5.56 6.08 6.40 5.85<br />
Junio 7.30 0.00 0.90 1.80 0.40 0.104 4.76 0.000 0.00 5.16 5.83 4.32 3.82<br />
Julio 6.60 0.00 0.80 1.70 0.40 0.048 2.20 0.000 0.00 2.60 2.84 3.89 3.56<br />
Agosto 14.50 0.00 1.60 3.30 0.90 0.022 1.01 0.000 0.00 1.91 2.09 2.41 2.20<br />
Septiembre 34.70 0.40 3.60 7.00 2.70 0.010 0.46 0.000 0.00 3.16 3.57 3.24 2.87<br />
Octubre 48.40 1.00 5.60 10.30 4.10 0.005 0.23 0.008 0.32 4.01 4.39 4.56 4.17<br />
Noviembre 59.50 1.90 7.90 14.00 6.10 0.000 0.00 0.005 0.20 5.90 6.67 6.65 5.88<br />
Diciembre 89.20 6.10 18.60 31.00 16.10 0.000 0.00 0.185 7.47 8.63 9.44 9.61 8.78<br />
Total 656.00 47.80 140.50 233.70 115.00 0.882 40.40 1.000 40.40 115.00 10.80 10.77 114.70<br />
A = 2930.73 km 2<br />
Precipitación efectiva Coeficiente <strong>de</strong> escorrentía<br />
PE = C 1 * PE-I + C 2 * PE-II<br />
Mo<strong>de</strong>lo <strong>Hidrológico</strong> <strong>de</strong> Lutz Scholz<br />
Generación <strong>de</strong> caudales mensuales para el año promedio - Río Suches<br />
Estación hidrométrica Puente Escoma<br />
Precipitación mensual Contribución a <strong>la</strong> Retención<br />
Efectiva<br />
Gasto<br />
Abastecimiento<br />
Caudal mensual<br />
Generado Aforado<br />
Área <strong>de</strong> <strong>la</strong> cuenca Retención <strong>de</strong> <strong>la</strong> cuenca<br />
Coeficiente <strong>de</strong> agotamiento<br />
R = 40.40 mm/año a = 0.02490 w = 0.04502<br />
Coeficientes Comprobación<br />
C = 0.175 C 1 = 0.515 C 2 = 0.485 C 1 + C 2 = 1.00 OK'<br />
MINAG-ANA-DCPRH-AGUAS SUPERFICIALES Pág.229
<strong>Estudio</strong> <strong>Hidrológico</strong> <strong>de</strong> <strong>la</strong>s <strong>Cuenca</strong>s Huancané y Suches 2010<br />
Caudal (m 3 /s)<br />
30.00<br />
25.00<br />
20.00<br />
15.00<br />
10.00<br />
5.00<br />
0.00<br />
Figura Nº 7.5 Comparación entre caudales generados y aforados – Río Suches<br />
Ago Set Oct Nov Dic Ene Feb Mar Abr May Jun Jul<br />
Tiempo (mes)<br />
Generado Aforado<br />
Se ha realizado el análisis <strong>de</strong> regresión lineal múltiple para obtener los coeficientes b1, b2,<br />
b3, b4; error estándar S y el coeficiente <strong>de</strong> corre<strong>la</strong>ción múltiple R, <strong>de</strong> <strong>la</strong> ecuación <strong>de</strong><br />
generación estocástica. La ecuación original <strong>de</strong> generación estocástica no reproduce los<br />
parámetros estadísticos (media y <strong>de</strong>sviación estándar) <strong>de</strong> <strong>la</strong> serie generada en comparación<br />
a <strong>la</strong> serie histórica <strong>de</strong>l <strong>río</strong> Suches, por lo que ha sido necesario introducir una variable más<br />
que viene ser el PEt 1 , con el que se ha logrado <strong>la</strong> generación <strong>de</strong> caudales medios<br />
mensuales en forma a<strong>de</strong>cuada. A continuación se muestra los parámetros <strong>de</strong> <strong>la</strong> ecuación <strong>de</strong><br />
generación <strong>de</strong> caudales medios mensuales.<br />
Parámetros:<br />
- Factor constante (caudal básico) : b1 = 1.15924<br />
- Factor <strong>de</strong> influencia <strong>de</strong>l valor <strong>de</strong> Qt-1 : b2 = 0.33597<br />
- Factor <strong>de</strong> influencia <strong>de</strong>l valor <strong>de</strong> PEt : b3 = 0.28227<br />
- Factor <strong>de</strong> influencia <strong>de</strong>l valor <strong>de</strong> PEt-1 : b4 = 0.26080<br />
- Error estándar <strong>de</strong>l estimado Q't : S = 1.17015<br />
- Coeficiente <strong>de</strong> <strong>de</strong>terminación múltiple : R 2 = 0.97754<br />
- Coeficiente <strong>de</strong> corre<strong>la</strong>ción múltiple : R = 0.98871<br />
- Valor <strong>de</strong> Qt-1 para el inicio <strong>de</strong> <strong>la</strong> generación (mm): Qt-1 = 8.63<br />
- Valor <strong>de</strong> PEt-1 para el inicio <strong>de</strong> <strong>la</strong> generación (mm): PEt-1 = 6.10<br />
Mo<strong>de</strong>lo Autorregresivo:<br />
Don<strong>de</strong>:<br />
Q S.Z 1<br />
R<br />
t b1<br />
b2Q<br />
t1<br />
b3PEt<br />
b4PEt1<br />
Qt = Caudal <strong>de</strong>l mes t.<br />
Qt-1 = Caudal <strong>de</strong>l mes anterior (t-1).<br />
PEt = Precipitación efectiva <strong>de</strong>l mes t.<br />
PEt-1 = Precipitación efectiva <strong>de</strong>l mes (t-1).<br />
S = Error estándar <strong>de</strong>l estimado Q't.<br />
Zt = Variable aleatoria normal in<strong>de</strong>pendiente (0,1) <strong>de</strong>l mes t.<br />
b1,b2,b3,b4 = Coeficientes <strong>de</strong> regresión lineal múltiple.<br />
MINAG-ANA-DCPRH-AGUAS SUPERFICIALES Pág.230<br />
t<br />
2
<strong>Estudio</strong> <strong>Hidrológico</strong> <strong>de</strong> <strong>la</strong>s <strong>Cuenca</strong>s Huancané y Suches 2010<br />
El procedimiento <strong>de</strong> generación <strong>de</strong> caudales mensuales para pe<strong>río</strong>dos extendidos es <strong>la</strong><br />
siguiente:<br />
- Generación <strong>de</strong> números aleatorios normales in<strong>de</strong>pendientes con media cero y<br />
varianza unitaria (0,1).<br />
- Precipitación efectiva mensual.<br />
- Generación <strong>de</strong> caudales medios mensuales.<br />
La comparación <strong>de</strong> <strong>la</strong> serie anual <strong>de</strong> caudales medios generados con respecto a <strong>la</strong> serie<br />
anual <strong>de</strong> caudales medios históricos <strong>de</strong>l <strong>río</strong> Suches, son simi<strong>la</strong>res, tal como se muestran en<br />
<strong>la</strong> Figura Nº 7.6.<br />
La comparación <strong>de</strong> caudales promedios multimensuales generados con respecto a los<br />
caudales promedios multimensuales históricos <strong>de</strong>l <strong>río</strong> Suches, son simi<strong>la</strong>res, tal como se<br />
muestran en <strong>la</strong> Figura Nº 7.7.<br />
Caudal (m 3 /s)<br />
30.00<br />
25.00<br />
20.00<br />
15.00<br />
10.00<br />
5.00<br />
Figura Nº 7.6 Caudales medios anuales generados y aforados – Río Suches<br />
0.00<br />
1950 1960 1970 1980 1990 2000 2010 2020<br />
Tiempo (año) AFORADO GENERADO<br />
MINAG-ANA-DCPRH-AGUAS SUPERFICIALES Pág.231
<strong>Estudio</strong> <strong>Hidrológico</strong> <strong>de</strong> <strong>la</strong>s <strong>Cuenca</strong>s Huancané y Suches 2010<br />
Caudal (m 3 /s)<br />
35.00<br />
30.00<br />
25.00<br />
20.00<br />
15.00<br />
10.00<br />
5.00<br />
0.00<br />
Figura Nº 7.7 Variación mensual <strong>de</strong> caudales generados y aforados – Río Suches<br />
ENE FEB MAR ABR MAY JUN JUL AGO SET OCT NOV DIC<br />
Tiempo (mes) AFORADO GENERADO<br />
A continuación se muestra <strong>la</strong> comparación <strong>de</strong> hidrogramas <strong>de</strong> precipitación mensual,<br />
precipitación efectiva y escorrentías generadas y aforadas, con el fin conocer el<br />
comportamiento <strong>de</strong> los mismos.<br />
Cuadro Nº 7.5 Precipitación mensual, precipitación efectiva y escorrentías - Río Suches<br />
Variable Ago Set Oct Nov Dic Ene Feb Mar Abr May Jun Jul<br />
Precipitación total mensual 14.50 34.70 48.40 59.50 89.20 128.60 105.50 95.00 49.40 17.30 7.30 6.60<br />
Precipitación efectiva promedio 0.90 2.70 4.10 6.10 16.10 36.80 24.70 17.50 4.40 0.90 0.40 0.40<br />
Precipitación efectiva 1956-2009 0.90 2.70 4.10 6.10 16.10 36.80 24.70 17.50 4.40 0.90 0.40 0.40<br />
Escorrentía aforada 2.20 2.87 4.17 5.88 8.78 18.98 23.33 21.83 13.43 5.85 3.82 3.56<br />
Escorrentía generada promedio 1.91 3.16 4.01 5.90 8.63 18.70 23.16 21.82 14.39 5.56 5.16 2.60<br />
Escorrentía generada 1956-2009 2.40 3.00 4.00 5.30 9.10 18.80 24.10 20.60 13.90 7.20 4.00 2.70<br />
MINAG-ANA-DCPRH-AGUAS SUPERFICIALES Pág.232
<strong>Estudio</strong> <strong>Hidrológico</strong> <strong>de</strong> <strong>la</strong>s <strong>Cuenca</strong>s Huancané y Suches 2010<br />
mm/mes<br />
140.0<br />
120.0<br />
100.0<br />
80.0<br />
60.0<br />
40.0<br />
20.0<br />
0.0<br />
Figura Nº 7.8 Hidrograma <strong>de</strong> escorrentía - Río Suches<br />
Ago Set Oct Nov Dic Ene Feb Mar Abr May Jun Jul<br />
Análisis <strong>de</strong> <strong>la</strong> bondad <strong>de</strong>l mo<strong>de</strong>lo<br />
Tiempo (mes)<br />
Precipitación total mensual<br />
Precipitación efectiva promedio<br />
Precipitación efectiva 1956-2009<br />
Escorrentía aforada<br />
Escorrentía generada promedio<br />
Escorrentía generada 1956-2009<br />
Para el análisis <strong>de</strong> <strong>la</strong> bondad <strong>de</strong>l mo<strong>de</strong>lo se comparan <strong>la</strong>s medias y <strong>de</strong>sviaciones estándar<br />
<strong>de</strong> los caudales multimensuales generados y históricos <strong>de</strong>l <strong>río</strong> Suches, estadísticamente<br />
<strong>de</strong>ben ser iguales a una probabilidad <strong>de</strong> confianza, en este caso al 95% <strong>de</strong> probabilidad.<br />
La comparación <strong>de</strong> <strong>la</strong>s medias se realiza utilizando <strong>la</strong> prueba estadística "T" y para <strong>la</strong>s<br />
<strong>de</strong>sviaciones estándar se utiliza <strong>la</strong> prueba estadística "F".<br />
De los resultados mostrados en el Cuadro Nº 7.6, se <strong>de</strong>duce que <strong>la</strong>s medias son iguales<br />
estadísticamente en los once (11) meses, excepto en el mes <strong>de</strong> mayo; <strong>la</strong>s <strong>de</strong>sviaciones<br />
estándar son iguales estadísticamente en los tres (3) meses, excepto en los meses <strong>de</strong> enero,<br />
marzo, junio, julio, agosto, setiembre, octubre, noviembre y diciembre; por lo que <strong>la</strong>s<br />
medias y <strong>de</strong>sviaciones estándar <strong>de</strong> <strong>la</strong> serie generada son iguales estadísticamente a <strong>la</strong>s<br />
medias y <strong>de</strong>sviaciones estándar <strong>de</strong> <strong>la</strong> serie histórica al 95% <strong>de</strong> probabilidad, ya que los<br />
valores <strong>de</strong> "T" y "F" calcu<strong>la</strong>dos resultan menores que los tabu<strong>la</strong>dos, respectivamente.<br />
A<strong>de</strong>más, numéricamente en algunos meses no muestran mucha diferencia entre valores<br />
históricos y generados, concluyéndose que el Mo<strong>de</strong>lo si reproduce <strong>la</strong> media y <strong>de</strong>sviación<br />
estándar, <strong>de</strong> <strong>la</strong> serie histórica en los meses <strong>de</strong> estiaje que es lo más importante y el Mo<strong>de</strong>lo<br />
es bueno.<br />
MINAG-ANA-DCPRH-AGUAS SUPERFICIALES Pág.233
<strong>Estudio</strong> <strong>Hidrológico</strong> <strong>de</strong> <strong>la</strong>s <strong>Cuenca</strong>s Huancané y Suches 2010<br />
Cuadro Nº 7.6 Análisis <strong>de</strong> <strong>la</strong> bondad <strong>de</strong>l mo<strong>de</strong>lo hidrológico <strong>de</strong> Lutz Scholz - Río Suches<br />
Mes<br />
Parámetros estadísticos<br />
Serie histórica Serie generada<br />
Media Desvest Media Desvest<br />
Media<br />
Análisis estadístico<br />
Desviación estándar<br />
X h Sh Xg g Tc Tt Fc Ft<br />
Enero 20.77 15.59 20.56 11.80 0.0789 1.9826 SI 1.7455 1.5777 NO<br />
Febrero 28.26 13.69 28.84 15.79 -0.2039 1.9826 SI 1.3303 1.5777 SI<br />
Marzo 23.89 7.65 22.58 12.42 0.6599 1.9826 SI 2.6358 1.5777 NO<br />
Abril 15.18 7.21 15.70 7.63 -0.3640 1.9826 SI 1.1199 1.5777 SI<br />
Mayo 6.40 2.88 7.91 3.12 -2.6133 1.9826 NO 1.1736 1.5777 SI<br />
Junio 4.32 3.23 4.47 1.17 -0.3209 1.9826 SI 7.6214 1.5777 NO<br />
Julio 3.89 5.96 2.96 0.58 1.1413 1.9826 SI 105.5933 1.5777 NO<br />
Agosto 2.41 2.72 2.63 0.62 -0.5795 1.9826 SI 19.2466 1.5777 NO<br />
Setiembre 3.24 4.92 3.35 1.39 -0.1581 1.9826 SI 12.5285 1.5777 NO<br />
Octubre 4.56 7.68 4.38 1.87 0.1673 1.9826 SI 16.8671 1.5777 NO<br />
Noviembre 6.65 6.30 5.99 2.32 0.7224 1.9826 SI 7.3740 1.5777 NO<br />
Diciembre 9.61 4.45 9.94 6.06 -0.3225 1.9826 SI 1.8545 1.5777 NO<br />
S Xh Xg<br />
Sh Sg<br />
Número <strong>de</strong> datos F calcu<strong>la</strong>do:<br />
Nh = 54 Probabilidad = 95%<br />
Ng = 54 a = 0.05<br />
G.L.N. = Nh - 1 = 53<br />
T calcu<strong>la</strong>do: G.L.D. = N g - 1 = 53<br />
Probabilidad = 95%<br />
a = 0.05 G.L.N. = Ng - 1 = 53<br />
G.L. = Nh+Ng-2 = 106 G.L.D. = Nh - 1 = 53<br />
MINAG-ANA-DCPRH-AGUAS SUPERFICIALES Pág.234<br />
2<br />
h<br />
2<br />
g<br />
S S<br />
2<br />
h<br />
2<br />
g<br />
S S<br />
Cabe recalcar, que para el mo<strong>de</strong><strong>la</strong>miento hidrológico <strong>de</strong> <strong>la</strong>s <strong>de</strong>scargas medias mensuales<br />
<strong>de</strong>l <strong>río</strong> Suches, se ha utilizado <strong>la</strong> precipitación areal calcu<strong>la</strong>da con el método <strong>de</strong> Polígonos<br />
<strong>de</strong> Thiessen, es a <strong>la</strong> que mejor se ajusta <strong>la</strong> serie histórica <strong>de</strong> <strong>la</strong>s <strong>de</strong>scargas medias, que al<br />
método <strong>de</strong> Polígonos <strong>de</strong> Thiessen Modificado.
<strong>Estudio</strong> <strong>Hidrológico</strong> <strong>de</strong> <strong>la</strong>s <strong>Cuenca</strong>s Huancané y Suches 2010<br />
7.5 GENERACIÓN DE CAUDALES MEDIOS MENSUALES EN LOS PUNTOS<br />
DE INTERÉS<br />
Para <strong>la</strong> generación <strong>de</strong> <strong>la</strong>s <strong>de</strong>scargas medias mensuales, se ha realizado el mo<strong>de</strong><strong>la</strong>miento<br />
hidrológico <strong>de</strong> Lutz Scholz para cada subcuenca <strong>de</strong> interés, utilizando los parámetros <strong>de</strong>l<br />
mo<strong>de</strong>lo calibrados en los <strong>río</strong>s Huancané y Suches, en algunos casos se ha variado los<br />
parámetros <strong>de</strong>l mo<strong>de</strong>lo <strong>de</strong>bido a algunos ajustes realizados.<br />
Para el mo<strong>de</strong><strong>la</strong>miento hidrológico <strong>de</strong> <strong>la</strong>s <strong>de</strong>scargas medias, se ha realizado utilizando <strong>la</strong><br />
serie mensual <strong>de</strong> <strong>la</strong>s precipitaciones areales calcu<strong>la</strong>das para cada subcuenca en el ítem 5.5<br />
y el área <strong>de</strong> <strong>la</strong>s subcuencas <strong>de</strong> interés.<br />
En los Cuadros Nº 7.7 y 7.8, se muestran <strong>la</strong>s subcuencas <strong>de</strong> interés en <strong>la</strong>s cuencas<br />
Huancané y Suches, para <strong>la</strong> generación <strong>de</strong> <strong>la</strong>s <strong>de</strong>scargas medias mensuales.<br />
Cuadro Nº 7.7 Subcuencas <strong>de</strong> interés para <strong>la</strong> generación <strong>de</strong> <strong>la</strong>s <strong>de</strong>scargas medias – <strong>Cuenca</strong> Huancané<br />
----------------------------------------------------------------------------------------------------------------------------- ------<br />
Nº Unidad Hidrográfica Área (km 2 )<br />
-----------------------------------------------------------------------------------------------------------------------------------<br />
1 Subcuenca <strong>río</strong> L<strong>la</strong>che 161.93<br />
2 Subcuenca <strong>río</strong> Tuyto 1,107.11<br />
3 Subcuenca <strong>río</strong> Muñani 889.44<br />
4 Subcuenca <strong>río</strong> Pistune 380.43<br />
5 Subcuenca Alto Huancané (<strong>río</strong> Puncune) 524.77<br />
6 Subcuenca Guanaco (vaso Cal<strong>la</strong>tomaza) 216.75<br />
7 Subcuenca Yaputira (vaso Yaputira) 228.24<br />
8 <strong>Cuenca</strong> <strong>río</strong> Huancané (cuenca total) 3,631.19<br />
-----------------------------------------------------------------------------------------------------------------------------------<br />
Cuadro Nº 7.8 Subcuencas <strong>de</strong> interés para <strong>la</strong> generación <strong>de</strong> <strong>la</strong>s <strong>de</strong>scargas medias – <strong>Cuenca</strong> Suches<br />
-----------------------------------------------------------------------------------------------------------------------------------<br />
Nº Unidad Hidrográfica Área (km 2 )<br />
----------------------------------------------------------------------------------------------------------------------------- ------<br />
1 Subcuenca <strong>río</strong> Chueña Huata Jahuira 162.18<br />
2 Subcuenca <strong>río</strong> Caylloma 289.22<br />
3 Subcuenca <strong>río</strong> Trapiche 405.45<br />
4 <strong>Cuenca</strong> <strong>río</strong> Suches (Puente Ramón Castil<strong>la</strong>) 1,056.49<br />
5 <strong>Cuenca</strong> <strong>río</strong> Suches (lugar Cuchaul<strong>la</strong>, Perú-Bolivia) 2,222.07<br />
----------------------------------------------------------------------------------------------------------------------------- ------<br />
Los cuadros <strong>de</strong> mo<strong>de</strong><strong>la</strong>miento hidrológico <strong>de</strong> <strong>la</strong>s <strong>de</strong>scargas medias mensuales, para <strong>la</strong>s<br />
subcuencas <strong>de</strong> interés <strong>de</strong> <strong>la</strong>s cuencas Huancané y Suches, se muestran en el Anexo 1. A<br />
continuación se presentan los parámetros y <strong>la</strong> ecuación <strong>de</strong> generación <strong>de</strong> <strong>la</strong>s <strong>de</strong>scargas<br />
medias mensuales, para cada una <strong>de</strong> <strong>la</strong>s subcuencas <strong>de</strong> interés.<br />
MINAG-ANA-DCPRH-AGUAS SUPERFICIALES Pág.235
<strong>Estudio</strong> <strong>Hidrológico</strong> <strong>de</strong> <strong>la</strong>s <strong>Cuenca</strong>s Huancané y Suches 2010<br />
Parámetros:<br />
Subcuenca <strong>río</strong> L<strong>la</strong>che<br />
- Factor constante (caudal básico) : b 1 = 0.63071<br />
- Factor <strong>de</strong> influencia <strong>de</strong>l valor <strong>de</strong> Q t-1 : b 2 = 0.41238<br />
- Factor <strong>de</strong> influencia <strong>de</strong>l valor <strong>de</strong> PE t : b 3 = 0.35055<br />
- Factor <strong>de</strong> influencia <strong>de</strong>l valor <strong>de</strong> PE t-1 : b 4 = 0.19258<br />
- Error estándar <strong>de</strong>l estimado Q' t : S = 3.83020<br />
- Coeficiente <strong>de</strong> <strong>de</strong>terminación múltiple : R 2 = 0.90561<br />
- Coeficiente <strong>de</strong> corre<strong>la</strong>ción múltiple : R = 0.95164<br />
- Valor <strong>de</strong> Q t-1 para el inicio <strong>de</strong> <strong>la</strong> generación (mm): Q t-1 = 13.20<br />
- Valor <strong>de</strong> PE t-1 para el inicio <strong>de</strong> <strong>la</strong> generación (mm): PE t-1 = 14.00<br />
Mo<strong>de</strong>lo Autorregresivo:<br />
Parámetros:<br />
Q S.Z 1<br />
R<br />
t b1<br />
b2Q<br />
t1<br />
b3PEt<br />
b4PEt1<br />
Don<strong>de</strong>:<br />
Qt = Caudal <strong>de</strong>l mes t.<br />
Qt-1 = Caudal <strong>de</strong>l mes anterior (t-1).<br />
PEt = Precipitación efectiva <strong>de</strong>l mes t.<br />
PEt-1 = Precipitación efectiva <strong>de</strong>l mes (t-1).<br />
S = Error estándar <strong>de</strong>l estimado Q't. Zt = Variable aleatoria normal in<strong>de</strong>pendiente (0,1) <strong>de</strong>l mes t.<br />
b1,b2,b3,b4 = Coeficientes <strong>de</strong> regresión lineal múltiple.<br />
Subcuenca <strong>río</strong> Tuyto<br />
- Factor constante (caudal básico) : b 1 = 0.71984<br />
- Factor <strong>de</strong> influencia <strong>de</strong>l valor <strong>de</strong> Q t-1 : b 2 = 0.29136<br />
- Factor <strong>de</strong> influencia <strong>de</strong>l valor <strong>de</strong> PE t : b 3 = 0.28012<br />
- Factor <strong>de</strong> influencia <strong>de</strong>l valor <strong>de</strong> PE t-1 : b 4 = 0.38755<br />
- Error estándar <strong>de</strong>l estimado Q' t : S = 1.86695<br />
- Coeficiente <strong>de</strong> <strong>de</strong>terminación múltiple : R 2 = 0.98788<br />
- Coeficiente <strong>de</strong> corre<strong>la</strong>ción múltiple : R = 0.99392<br />
- Valor <strong>de</strong> Q t-1 para el inicio <strong>de</strong> <strong>la</strong> generación (mm): Q t-1 = 16.98<br />
- Valor <strong>de</strong> PE t-1 para el inicio <strong>de</strong> <strong>la</strong> generación (mm): PE t-1 = 12.50<br />
Mo<strong>de</strong>lo Autorregresivo:<br />
Q S.Z 1<br />
R<br />
t b1<br />
b2Q<br />
t1<br />
b3PEt<br />
b4PEt1<br />
Don<strong>de</strong>:<br />
Qt = Caudal <strong>de</strong>l mes t.<br />
Qt-1 = Caudal <strong>de</strong>l mes anterior (t-1).<br />
PEt = Precipitación efectiva <strong>de</strong>l mes t.<br />
PEt-1 = Precipitación efectiva <strong>de</strong>l mes (t-1).<br />
S = Error estándar <strong>de</strong>l estimado Q't. Zt = Variable aleatoria normal in<strong>de</strong>pendiente (0,1) <strong>de</strong>l mes t.<br />
b1,b2,b3,b4 = Coeficientes <strong>de</strong> regresión lineal múltiple.<br />
MINAG-ANA-DCPRH-AGUAS SUPERFICIALES Pág.236<br />
t<br />
t<br />
2<br />
2
<strong>Estudio</strong> <strong>Hidrológico</strong> <strong>de</strong> <strong>la</strong>s <strong>Cuenca</strong>s Huancané y Suches 2010<br />
Parámetros:<br />
Subcuenca <strong>río</strong> Muñani<br />
- Factor constante (caudal básico) : b 1 = 1.46549<br />
- Factor <strong>de</strong> influencia <strong>de</strong>l valor <strong>de</strong> Q t-1 : b 2 = 0.27882<br />
- Factor <strong>de</strong> influencia <strong>de</strong>l valor <strong>de</strong> PE t : b 3 = 0.05818<br />
- Factor <strong>de</strong> influencia <strong>de</strong>l valor <strong>de</strong> PE t-1 : b 4 = 0.56082<br />
- Error estándar <strong>de</strong>l estimado Q' t : S = 1.94021<br />
- Coeficiente <strong>de</strong> <strong>de</strong>terminación múltiple : R 2 = 0.97949<br />
- Coeficiente <strong>de</strong> corre<strong>la</strong>ción múltiple : R = 0.98969<br />
- Valor <strong>de</strong> Q t-1 para el inicio <strong>de</strong> <strong>la</strong> generación (mm): Q t-1 = 14.88<br />
- Valor <strong>de</strong> PE t-1 para el inicio <strong>de</strong> <strong>la</strong> generación (mm): PE t-1 = 11.90<br />
Mo<strong>de</strong>lo Autorregresivo:<br />
Parámetros:<br />
Q S.Z 1<br />
R<br />
t b1<br />
b2Q<br />
t1<br />
b3PEt<br />
b4PEt1<br />
Don<strong>de</strong>:<br />
Qt = Caudal <strong>de</strong>l mes t.<br />
Qt-1 = Caudal <strong>de</strong>l mes anterior (t-1).<br />
PEt = Precipitación efectiva <strong>de</strong>l mes t.<br />
PEt-1 = Precipitación efectiva <strong>de</strong>l mes (t-1).<br />
S = Error estándar <strong>de</strong>l estimado Q't. Zt = Variable aleatoria normal in<strong>de</strong>pendiente (0,1) <strong>de</strong>l mes t.<br />
b1,b2,b3,b4 = Coeficientes <strong>de</strong> regresión lineal múltiple.<br />
Subcuenca <strong>río</strong> Pistune<br />
- Factor constante (caudal básico) : b 1 = 1.02299<br />
- Factor <strong>de</strong> influencia <strong>de</strong>l valor <strong>de</strong> Q t-1 : b 2 = 0.34428<br />
- Factor <strong>de</strong> influencia <strong>de</strong>l valor <strong>de</strong> PE t : b 3 = 0.23815<br />
- Factor <strong>de</strong> influencia <strong>de</strong>l valor <strong>de</strong> PE t-1 : b 4 = 0.34841<br />
- Error estándar <strong>de</strong>l estimado Q' t : S = 4.39246<br />
- Coeficiente <strong>de</strong> <strong>de</strong>terminación múltiple : R 2 = 0.88842<br />
- Coeficiente <strong>de</strong> corre<strong>la</strong>ción múltiple : R = 0.94256<br />
- Valor <strong>de</strong> Q t-1 para el inicio <strong>de</strong> <strong>la</strong> generación (mm): Q t-1 = 10.32<br />
- Valor <strong>de</strong> PE t-1 para el inicio <strong>de</strong> <strong>la</strong> generación (mm): PE t-1 = 13.30<br />
Mo<strong>de</strong>lo Autorregresivo:<br />
Q S.Z 1<br />
R<br />
t b1<br />
b2Q<br />
t1<br />
b3PEt<br />
b4PEt1<br />
Don<strong>de</strong>:<br />
Qt = Caudal <strong>de</strong>l mes t.<br />
Qt-1 = Caudal <strong>de</strong>l mes anterior (t-1).<br />
PEt = Precipitación efectiva <strong>de</strong>l mes t.<br />
PEt-1 = Precipitación efectiva <strong>de</strong>l mes (t-1).<br />
S = Error estándar <strong>de</strong>l estimado Q't. Zt = Variable aleatoria normal in<strong>de</strong>pendiente (0,1) <strong>de</strong>l mes t.<br />
b1,b2,b3,b4 = Coeficientes <strong>de</strong> regresión lineal múltiple.<br />
MINAG-ANA-DCPRH-AGUAS SUPERFICIALES Pág.237<br />
t<br />
t<br />
2<br />
2
<strong>Estudio</strong> <strong>Hidrológico</strong> <strong>de</strong> <strong>la</strong>s <strong>Cuenca</strong>s Huancané y Suches 2010<br />
Parámetros:<br />
Subcuenca Alto Huancané (<strong>río</strong> Puncune)<br />
- Factor constante (caudal básico) : b 1 = 0.51708<br />
- Factor <strong>de</strong> influencia <strong>de</strong>l valor <strong>de</strong> Q t-1 : b 2 = 0.32772<br />
- Factor <strong>de</strong> influencia <strong>de</strong>l valor <strong>de</strong> PE t : b 3 = 0.06691<br />
- Factor <strong>de</strong> influencia <strong>de</strong>l valor <strong>de</strong> PE t-1 : b 4 = 0.56083<br />
- Error estándar <strong>de</strong>l estimado Q' t : S = 2.39320<br />
- Coeficiente <strong>de</strong> <strong>de</strong>terminación múltiple : R 2 = 0.95343<br />
- Coeficiente <strong>de</strong> corre<strong>la</strong>ción múltiple : R = 0.97644<br />
- Valor <strong>de</strong> Q t-1 para el inicio <strong>de</strong> <strong>la</strong> generación (mm): Q t-1 = 7.04<br />
- Valor <strong>de</strong> PE t-1 para el inicio <strong>de</strong> <strong>la</strong> generación (mm): PE t-1 = 9.50<br />
Mo<strong>de</strong>lo Autorregresivo:<br />
Parámetros:<br />
Q S.Z 1<br />
R<br />
t b1<br />
b2Q<br />
t1<br />
b3PEt<br />
b4PEt1<br />
Don<strong>de</strong>:<br />
Qt = Caudal <strong>de</strong>l mes t.<br />
Qt-1 = Caudal <strong>de</strong>l mes anterior (t-1).<br />
PEt = Precipitación efectiva <strong>de</strong>l mes t.<br />
PEt-1 = Precipitación efectiva <strong>de</strong>l mes (t-1).<br />
S = Error estándar <strong>de</strong>l estimado Q't. Zt = Variable aleatoria normal in<strong>de</strong>pendiente (0,1) <strong>de</strong>l mes t.<br />
b1,b2,b3,b4 = Coeficientes <strong>de</strong> regresión lineal múltiple.<br />
Subcuenca <strong>río</strong> Guanaco<br />
- Factor constante (caudal básico) : b 1 = 1.90248<br />
- Factor <strong>de</strong> influencia <strong>de</strong>l valor <strong>de</strong> Q t-1 : b 2 = 0.12566<br />
- Factor <strong>de</strong> influencia <strong>de</strong>l valor <strong>de</strong> PE t : b 3 = -0.02314<br />
- Factor <strong>de</strong> influencia <strong>de</strong>l valor <strong>de</strong> PE t-1 : b 4 = 0.77571<br />
- Error estándar <strong>de</strong>l estimado Q' t : S = 2.44222<br />
- Coeficiente <strong>de</strong> <strong>de</strong>terminación múltiple : R 2 = 0.97706<br />
- Coeficiente <strong>de</strong> corre<strong>la</strong>ción múltiple : R = 0.98846<br />
- Valor <strong>de</strong> Q t-1 para el inicio <strong>de</strong> <strong>la</strong> generación (mm): Q t-1 = 16.72<br />
- Valor <strong>de</strong> PE t-1 para el inicio <strong>de</strong> <strong>la</strong> generación (mm): PE t-1 = 12.80<br />
Mo<strong>de</strong>lo Autorregresivo:<br />
Q S.Z 1<br />
R<br />
t b1<br />
b2Q<br />
t1<br />
b3PEt<br />
b4PEt1<br />
Don<strong>de</strong>:<br />
Qt = Caudal <strong>de</strong>l mes t.<br />
Qt-1 = Caudal <strong>de</strong>l mes anterior (t-1).<br />
PEt = Precipitación efectiva <strong>de</strong>l mes t.<br />
PEt-1 = Precipitación efectiva <strong>de</strong>l mes (t-1).<br />
S = Error estándar <strong>de</strong>l estimado Q't. Zt = Variable aleatoria normal in<strong>de</strong>pendiente (0,1) <strong>de</strong>l mes t.<br />
b1,b2,b3,b4 = Coeficientes <strong>de</strong> regresión lineal múltiple.<br />
MINAG-ANA-DCPRH-AGUAS SUPERFICIALES Pág.238<br />
t<br />
t<br />
2<br />
2
<strong>Estudio</strong> <strong>Hidrológico</strong> <strong>de</strong> <strong>la</strong>s <strong>Cuenca</strong>s Huancané y Suches 2010<br />
Parámetros:<br />
Subcuenca <strong>río</strong> Yaputira<br />
- Factor constante (caudal básico) : b 1 = 1.35692<br />
- Factor <strong>de</strong> influencia <strong>de</strong>l valor <strong>de</strong> Q t-1 : b 2 = 0.09777<br />
- Factor <strong>de</strong> influencia <strong>de</strong>l valor <strong>de</strong> PE t : b 3 = 0.02414<br />
- Factor <strong>de</strong> influencia <strong>de</strong>l valor <strong>de</strong> PE t-1 : b 4 = 0.79568<br />
- Error estándar <strong>de</strong>l estimado Q' t : S = 2.03393<br />
- Coeficiente <strong>de</strong> <strong>de</strong>terminación múltiple : R 2 = 0.98481<br />
- Coeficiente <strong>de</strong> corre<strong>la</strong>ción múltiple : R = 0.99238<br />
- Valor <strong>de</strong> Q t-1 para el inicio <strong>de</strong> <strong>la</strong> generación (mm): Q t-1 = 11.06<br />
- Valor <strong>de</strong> PE t-1 para el inicio <strong>de</strong> <strong>la</strong> generación (mm): PE t-1 = 12.30<br />
Mo<strong>de</strong>lo Autorregresivo:<br />
Parámetros:<br />
Q S.Z 1<br />
R<br />
t b1<br />
b2Q<br />
t1<br />
b3PEt<br />
b4PEt1<br />
Don<strong>de</strong>:<br />
Qt = Caudal <strong>de</strong>l mes t.<br />
Qt-1 = Caudal <strong>de</strong>l mes anterior (t-1).<br />
PEt = Precipitación efectiva <strong>de</strong>l mes t.<br />
PEt-1 = Precipitación efectiva <strong>de</strong>l mes (t-1).<br />
S = Error estándar <strong>de</strong>l estimado Q't. Zt = Variable aleatoria normal in<strong>de</strong>pendiente (0,1) <strong>de</strong>l mes t.<br />
b1,b2,b3,b4 = Coeficientes <strong>de</strong> regresión lineal múltiple.<br />
<strong>Cuenca</strong> <strong>río</strong> Huancané (cuenca total)<br />
- Factor constante (caudal básico) : b 1 = 0.68165<br />
- Factor <strong>de</strong> influencia <strong>de</strong>l valor <strong>de</strong> Q t-1 : b 2 = 0.34628<br />
- Factor <strong>de</strong> influencia <strong>de</strong>l valor <strong>de</strong> PE t : b 3 = 0.18796<br />
- Factor <strong>de</strong> influencia <strong>de</strong>l valor <strong>de</strong> PE t-1 : b 4 = 0.41900<br />
- Error estándar <strong>de</strong>l estimado Q' t : S = 2.09968<br />
- Coeficiente <strong>de</strong> <strong>de</strong>terminación múltiple : R 2 = 0.97628<br />
- Coeficiente <strong>de</strong> corre<strong>la</strong>ción múltiple : R = 0.98807<br />
- Valor <strong>de</strong> Q t-1 para el inicio <strong>de</strong> <strong>la</strong> generación (mm): Q t-1 = 11.62<br />
- Valor <strong>de</strong> PE t-1 para el inicio <strong>de</strong> <strong>la</strong> generación (mm): PE t-1 = 11.60<br />
Mo<strong>de</strong>lo Autorregresivo:<br />
Q S.Z 1<br />
R<br />
t b1<br />
b2Q<br />
t1<br />
b3PEt<br />
b4PEt1<br />
Don<strong>de</strong>:<br />
Qt = Caudal <strong>de</strong>l mes t.<br />
Qt-1 = Caudal <strong>de</strong>l mes anterior (t-1).<br />
PEt = Precipitación efectiva <strong>de</strong>l mes t.<br />
PEt-1 = Precipitación efectiva <strong>de</strong>l mes (t-1).<br />
S = Error estándar <strong>de</strong>l estimado Q't. Zt = Variable aleatoria normal in<strong>de</strong>pendiente (0,1) <strong>de</strong>l mes t.<br />
b1,b2,b3,b4 = Coeficientes <strong>de</strong> regresión lineal múltiple.<br />
MINAG-ANA-DCPRH-AGUAS SUPERFICIALES Pág.239<br />
t<br />
t<br />
2<br />
2
<strong>Estudio</strong> <strong>Hidrológico</strong> <strong>de</strong> <strong>la</strong>s <strong>Cuenca</strong>s Huancané y Suches 2010<br />
Parámetros:<br />
Subcuenca <strong>río</strong> Chueña Huata Jahuira<br />
- Factor constante (caudal básico) : b 1 = 0.97087<br />
- Factor <strong>de</strong> influencia <strong>de</strong>l valor <strong>de</strong> Q t-1 : b 2 = 0.23214<br />
- Factor <strong>de</strong> influencia <strong>de</strong>l valor <strong>de</strong> PE t : b 3 = 0.26476<br />
- Factor <strong>de</strong> influencia <strong>de</strong>l valor <strong>de</strong> PE t-1 : b 4 = 0.40698<br />
- Error estándar <strong>de</strong>l estimado Q' t : S = 2.93870<br />
- Coeficiente <strong>de</strong> <strong>de</strong>terminación múltiple : R 2 = 0.92257<br />
- Coeficiente <strong>de</strong> corre<strong>la</strong>ción múltiple : R = 0.96051<br />
- Valor <strong>de</strong> Q t-1 para el inicio <strong>de</strong> <strong>la</strong> generación (mm): Q t-1 = 9.29<br />
- Valor <strong>de</strong> PE t-1 para el inicio <strong>de</strong> <strong>la</strong> generación (mm): PE t-1 = 5.30<br />
Mo<strong>de</strong>lo Autorregresivo:<br />
Parámetros:<br />
Q S.Z 1<br />
R<br />
t b1<br />
b2Q<br />
t1<br />
b3PEt<br />
b4PEt1<br />
Don<strong>de</strong>:<br />
Qt = Caudal <strong>de</strong>l mes t.<br />
Qt-1 = Caudal <strong>de</strong>l mes anterior (t-1).<br />
PEt = Precipitación efectiva <strong>de</strong>l mes t.<br />
PEt-1 = Precipitación efectiva <strong>de</strong>l mes (t-1).<br />
S = Error estándar <strong>de</strong>l estimado Q't. Zt = Variable aleatoria normal in<strong>de</strong>pendiente (0,1) <strong>de</strong>l mes t.<br />
b1,b2,b3,b4 = Coeficientes <strong>de</strong> regresión lineal múltiple.<br />
Subcuenca <strong>río</strong> Caylloma<br />
- Factor constante (caudal básico) : b 1 = 0.99252<br />
- Factor <strong>de</strong> influencia <strong>de</strong>l valor <strong>de</strong> Q t-1 : b 2 = 0.32522<br />
- Factor <strong>de</strong> influencia <strong>de</strong>l valor <strong>de</strong> PE t : b 3 = 0.32599<br />
- Factor <strong>de</strong> influencia <strong>de</strong>l valor <strong>de</strong> PE t-1 : b 4 = 0.25703<br />
- Error estándar <strong>de</strong>l estimado Q' t : S = 1.84281<br />
- Coeficiente <strong>de</strong> <strong>de</strong>terminación múltiple : R 2 = 0.96183<br />
- Coeficiente <strong>de</strong> corre<strong>la</strong>ción múltiple : R = 0.98073<br />
- Valor <strong>de</strong> Q t-1 para el inicio <strong>de</strong> <strong>la</strong> generación (mm): Q t-1 = 11.03<br />
- Valor <strong>de</strong> PE t-1 para el inicio <strong>de</strong> <strong>la</strong> generación (mm): PE t-1 = 7.50<br />
Mo<strong>de</strong>lo Autorregresivo:<br />
Q S.Z 1<br />
R<br />
t b1<br />
b2Q<br />
t1<br />
b3PEt<br />
b4PEt1<br />
Don<strong>de</strong>:<br />
Qt = Caudal <strong>de</strong>l mes t.<br />
Qt-1 = Caudal <strong>de</strong>l mes anterior (t-1).<br />
PEt = Precipitación efectiva <strong>de</strong>l mes t.<br />
PEt-1 = Precipitación efectiva <strong>de</strong>l mes (t-1).<br />
S = Error estándar <strong>de</strong>l estimado Q't. Zt = Variable aleatoria normal in<strong>de</strong>pendiente (0,1) <strong>de</strong>l mes t.<br />
b1,b2,b3,b4 = Coeficientes <strong>de</strong> regresión lineal múltiple.<br />
MINAG-ANA-DCPRH-AGUAS SUPERFICIALES Pág.240<br />
t<br />
t<br />
2<br />
2
<strong>Estudio</strong> <strong>Hidrológico</strong> <strong>de</strong> <strong>la</strong>s <strong>Cuenca</strong>s Huancané y Suches 2010<br />
Parámetros:<br />
Subcuenca <strong>río</strong> Trapiche<br />
- Factor constante (caudal básico) : b 1 = 0.28567<br />
- Factor <strong>de</strong> influencia <strong>de</strong>l valor <strong>de</strong> Q t-1 : b 2 = 0.48105<br />
- Factor <strong>de</strong> influencia <strong>de</strong>l valor <strong>de</strong> PE t : b 3 = 0.17156<br />
- Factor <strong>de</strong> influencia <strong>de</strong>l valor <strong>de</strong> PE t-1 : b 4 = 0.30803<br />
- Error estándar <strong>de</strong>l estimado Q' t : S = 2.03033<br />
- Coeficiente <strong>de</strong> <strong>de</strong>terminación múltiple : R 2 = 0.88043<br />
- Coeficiente <strong>de</strong> corre<strong>la</strong>ción múltiple : R = 0.93831<br />
- Valor <strong>de</strong> Q t-1 para el inicio <strong>de</strong> <strong>la</strong> generación (mm): Q t-1 = 6.74<br />
- Valor <strong>de</strong> PE t-1 para el inicio <strong>de</strong> <strong>la</strong> generación (mm): PE t-1 = 5.30<br />
Mo<strong>de</strong>lo Autorregresivo:<br />
Parámetros:<br />
Q S.Z 1<br />
R<br />
t b1<br />
b2Q<br />
t1<br />
b3PEt<br />
b4PEt1<br />
Don<strong>de</strong>:<br />
Qt = Caudal <strong>de</strong>l mes t.<br />
Qt-1 = Caudal <strong>de</strong>l mes anterior (t-1).<br />
PEt = Precipitación efectiva <strong>de</strong>l mes t.<br />
PEt-1 = Precipitación efectiva <strong>de</strong>l mes (t-1).<br />
S = Error estándar <strong>de</strong>l estimado Q't. Zt = Variable aleatoria normal in<strong>de</strong>pendiente (0,1) <strong>de</strong>l mes t.<br />
b1,b2,b3,b4 = Coeficientes <strong>de</strong> regresión lineal múltiple.<br />
<strong>Cuenca</strong> <strong>río</strong> Suches (Puente Ramón Castil<strong>la</strong>)<br />
- Factor constante (caudal básico) : b 1 = 0.86006<br />
- Factor <strong>de</strong> influencia <strong>de</strong>l valor <strong>de</strong> Q t-1 : b 2 = 0.37005<br />
- Factor <strong>de</strong> influencia <strong>de</strong>l valor <strong>de</strong> PE t : b 3 = 0.13544<br />
- Factor <strong>de</strong> influencia <strong>de</strong>l valor <strong>de</strong> PE t-1 : b 4 = 0.38855<br />
- Error estándar <strong>de</strong>l estimado Q' t : S = 2.24447<br />
- Coeficiente <strong>de</strong> <strong>de</strong>terminación múltiple : R 2 = 0.88447<br />
- Coeficiente <strong>de</strong> corre<strong>la</strong>ción múltiple : R = 0.94046<br />
- Valor <strong>de</strong> Q t-1 para el inicio <strong>de</strong> <strong>la</strong> generación (mm): Q t-1 = 6.53<br />
- Valor <strong>de</strong> PE t-1 para el inicio <strong>de</strong> <strong>la</strong> generación (mm): PE t-1 = 5.80<br />
Mo<strong>de</strong>lo Autorregresivo:<br />
Q S.Z 1<br />
R<br />
t b1<br />
b2Q<br />
t1<br />
b3PEt<br />
b4PEt1<br />
Don<strong>de</strong>:<br />
Qt = Caudal <strong>de</strong>l mes t.<br />
Qt-1 = Caudal <strong>de</strong>l mes anterior (t-1).<br />
PEt = Precipitación efectiva <strong>de</strong>l mes t.<br />
PEt-1 = Precipitación efectiva <strong>de</strong>l mes (t-1).<br />
S = Error estándar <strong>de</strong>l estimado Q't. Zt = Variable aleatoria normal in<strong>de</strong>pendiente (0,1) <strong>de</strong>l mes t.<br />
b1,b2,b3,b4 = Coeficientes <strong>de</strong> regresión lineal múltiple.<br />
MINAG-ANA-DCPRH-AGUAS SUPERFICIALES Pág.241<br />
t<br />
t<br />
2<br />
2
<strong>Estudio</strong> <strong>Hidrológico</strong> <strong>de</strong> <strong>la</strong>s <strong>Cuenca</strong>s Huancané y Suches 2010<br />
Parámetros:<br />
<strong>Cuenca</strong> <strong>río</strong> Suches (lugar Cuchaul<strong>la</strong>, límite Perú-Bolivia)<br />
- Factor constante (caudal básico) : b 1 = 1.08369<br />
- Factor <strong>de</strong> influencia <strong>de</strong>l valor <strong>de</strong> Q t-1 : b 2 = 0.31140<br />
- Factor <strong>de</strong> influencia <strong>de</strong>l valor <strong>de</strong> PE t : b 3 = 0.26086<br />
- Factor <strong>de</strong> influencia <strong>de</strong>l valor <strong>de</strong> PE t-1 : b 4 = 0.31919<br />
- Error estándar <strong>de</strong>l estimado Q' t : S = 1.75294<br />
- Coeficiente <strong>de</strong> <strong>de</strong>terminación múltiple : R 2 = 0.95620<br />
- Coeficiente <strong>de</strong> corre<strong>la</strong>ción múltiple : R = 0.97785<br />
- Valor <strong>de</strong> Q t-1 para el inicio <strong>de</strong> <strong>la</strong> generación (mm): Q t-1 = 9.53<br />
- Valor <strong>de</strong> PE t-1 para el inicio <strong>de</strong> <strong>la</strong> generación (mm): PE t-1 = 6.90<br />
Mo<strong>de</strong>lo Autorregresivo:<br />
Q S.Z 1<br />
R<br />
t b1<br />
b2Q<br />
t1<br />
b3PEt<br />
b4PEt1<br />
Don<strong>de</strong>:<br />
Qt = Caudal <strong>de</strong>l mes t.<br />
Qt-1 = Caudal <strong>de</strong>l mes anterior (t-1).<br />
PEt = Precipitación efectiva <strong>de</strong>l mes t.<br />
PEt-1 = Precipitación efectiva <strong>de</strong>l mes (t-1).<br />
S = Error estándar <strong>de</strong>l estimado Q't. Zt = Variable aleatoria normal in<strong>de</strong>pendiente (0,1) <strong>de</strong>l mes t.<br />
b1,b2,b3,b4 = Coeficientes <strong>de</strong> regresión lineal múltiple.<br />
Con <strong>la</strong>s ecuaciones <strong>de</strong>l mo<strong>de</strong>lo establecidas para cada subcuenca <strong>de</strong> interés, se ha generado<br />
<strong>la</strong>s <strong>de</strong>scargas medias mensuales, utilizando <strong>la</strong> información <strong>de</strong> <strong>la</strong>s precipitaciones areales<br />
calcu<strong>la</strong>das con el método <strong>de</strong> Polígonos <strong>de</strong> Thiessen (se muestran en el Anexo 1). Las<br />
<strong>de</strong>scargas medias mensuales generadas se muestran en el Anexo 1.<br />
En el Cuadro Nº 7.9 se presenta el resumen <strong>de</strong> <strong>la</strong>s <strong>de</strong>scargas medias mensuales (promedio<br />
multimensual) generadas para <strong>la</strong>s subcuencas <strong>de</strong> <strong>la</strong> cuenca Huancané y en <strong>la</strong> Figura Nº 7.9<br />
muestra <strong>la</strong> variación mensual <strong>de</strong> los caudales medios.<br />
Subcuenca/<br />
cuenca<br />
Cuadro Nº 7.9 Descargas medias mensuales generadas (m 3 /s) – <strong>Cuenca</strong> Huancané<br />
Punto <strong>de</strong> control Ene Feb Mar Abr May Jun Jul Ago Sep Oct Nov Dic<br />
Río L<strong>la</strong>che Confl.<strong>río</strong> Huancané 1.972 2.290 1.769 1.278 0.660 0.342 0.186 0.135 0.172 0.265 0.527 0.988 0.882<br />
Río Tuyto Confl.<strong>río</strong> Putina 15.800 22.510 16.530 11.430 4.880 2.090 1.050 0.840 1.290 2.180 3.650 7.380 7.470<br />
Río Muñani Confl.<strong>río</strong> Pongongoni 8.757 15.045 10.853 8.289 3.873 1.838 1.057 0.838 0.919 1.376 2.144 3.922 4.909<br />
Río Pistune Confl.<strong>río</strong> Puncune 4.211 5.995 4.479 3.434 1.704 0.839 0.466 0.365 0.470 0.674 1.175 2.147 2.163<br />
Río Puncune Confl.<strong>río</strong> Pistune 3.541 7.296 5.322 4.258 2.087 0.986 0.487 0.407 0.401 0.558 1.011 1.738 2.341<br />
Río Guanaco Vaso Cal<strong>la</strong>tomaza 2.347 4.309 3.099 2.266 0.790 0.345 0.224 0.199 0.230 0.344 0.531 0.959 1.304<br />
Río Yaputira Vaso Yaputira 2.253 4.656 3.414 2.729 0.874 0.328 0.186 0.177 0.245 0.428 0.682 0.948 1.410<br />
Río Huancané Desemb.<strong>la</strong>go Titicaca 38.580 60.730 44.850 33.570 16.050 7.550 3.860 2.750 3.330 5.260 9.310 18.150 20.330<br />
En el Cuadro Nº 7.10 se presenta el resumen <strong>de</strong> <strong>la</strong>s <strong>de</strong>scargas medias mensuales (promedio<br />
multimensual) generadas para <strong>la</strong>s subcuencas <strong>de</strong> <strong>la</strong> cuenca Suches y en <strong>la</strong> Figura Nº 7.10<br />
muestra <strong>la</strong> variación mensual <strong>de</strong> los caudales medios.<br />
MINAG-ANA-DCPRH-AGUAS SUPERFICIALES Pág.242<br />
t<br />
2<br />
Prom<br />
Anual
<strong>Estudio</strong> <strong>Hidrológico</strong> <strong>de</strong> <strong>la</strong>s <strong>Cuenca</strong>s Huancané y Suches 2010<br />
Descarga (m 3 /s)<br />
Descarga (m 3 /s)<br />
Descarga (m 3 /s)<br />
Descarga (m 3 /s)<br />
3.0<br />
2.5<br />
2.0<br />
1.5<br />
1.0<br />
0.5<br />
0.0<br />
20<br />
16<br />
12<br />
8<br />
4<br />
0<br />
10<br />
8<br />
6<br />
4<br />
2<br />
0<br />
6<br />
5<br />
4<br />
3<br />
2<br />
1<br />
0<br />
1.972<br />
Figura Nº 7.9 Variación mensual <strong>de</strong> <strong>la</strong>s <strong>de</strong>scargas medias generadas (m 3 /s)<br />
Promedio multimensual (1956-2009) – <strong>Cuenca</strong> Huancané<br />
2.290<br />
1.769<br />
Subcuenca <strong>río</strong> L<strong>la</strong>che<br />
1.278<br />
0.660<br />
0.342<br />
0.186 0.135 0.172 0.265<br />
0.527<br />
0.988<br />
Ene Feb Mar Abr May Jun Jul Ago Sep Oct Nov Dic<br />
8.757<br />
15.045<br />
10.853<br />
8.289<br />
3.873<br />
Tiempo (mes)<br />
Subcuenca <strong>río</strong> Muñani<br />
1.838 2.144<br />
1.057 0.838 0.919<br />
1.376<br />
3.922<br />
Ene Feb Mar Abr May Jun Jul Ago Sep Oct Nov Dic<br />
3.541<br />
7.296<br />
5.322<br />
4.258<br />
2.087<br />
Tiempo (mes)<br />
0.986<br />
1.011<br />
0.487 0.407 0.401 0.558<br />
1.738<br />
Ene Feb Mar Abr May Jun Jul Ago Sep Oct Nov Dic<br />
2.253<br />
Subcuenca Alto Huancané (<strong>río</strong> Puncune)<br />
4.656<br />
Tiempo (mes)<br />
Subcuenca <strong>río</strong> Yaputira<br />
3.414<br />
2.729<br />
0.874<br />
0.948<br />
0.682<br />
0.328 0.428<br />
0.186 0.177 0.245<br />
Ene Feb Mar Abr May Jun Jul Ago Sep Oct Nov Dic<br />
Tiempo (mes)<br />
MINAG-ANA-DCPRH-AGUAS SUPERFICIALES Pág.243<br />
Descarga (m 3 /s)<br />
Descarga (m 3 /s)<br />
Descarga (m 3 /s)<br />
Descarga (m 3 /s)<br />
30<br />
25<br />
20<br />
15<br />
10<br />
5<br />
0<br />
8<br />
7<br />
6<br />
5<br />
4<br />
3<br />
2<br />
1<br />
0<br />
5<br />
4<br />
3<br />
2<br />
1<br />
0<br />
80<br />
70<br />
60<br />
50<br />
40<br />
30<br />
20<br />
10<br />
0<br />
15.80<br />
22.51<br />
Subcuenca <strong>río</strong> Tuyto<br />
16.53<br />
11.43<br />
4.88<br />
2.09 1.05 0.84 1.29 2.18<br />
3.65<br />
7.38<br />
Ene Feb Mar Abr May Jun Jul Ago Sep Oct Nov Dic<br />
4.211<br />
5.995<br />
4.479<br />
3.434<br />
Tiempo (mes)<br />
Subcuenca <strong>río</strong> Pistune<br />
1.704<br />
0.839<br />
0.466 0.365 0.470 0.674<br />
2.147<br />
1.175<br />
Ene Feb Mar Abr May Jun Jul Ago Sep Oct Nov Dic<br />
2.347<br />
4.309<br />
3.099<br />
2.266<br />
0.790<br />
Tiempo (mes)<br />
Subcuenca <strong>río</strong> Guanaco<br />
0.345 0.224 0.199 0.230 0.344 0.531<br />
0.959<br />
Ene Feb Mar Abr May Jun Jul Ago Sep Oct Nov Dic<br />
38.58<br />
60.73<br />
44.85<br />
33.57<br />
16.05<br />
Tiempo (mes)<br />
<strong>Cuenca</strong> <strong>río</strong> Huancané (cuenca total)<br />
7.55 3.86 2.75 3.33 5.26<br />
9.31<br />
18.15<br />
Ene Feb Mar Abr May Jun Jul Ago Sep Oct Nov Dic<br />
Tiempo (mes)
<strong>Estudio</strong> <strong>Hidrológico</strong> <strong>de</strong> <strong>la</strong>s <strong>Cuenca</strong>s Huancané y Suches 2010<br />
Subcuenca/<br />
cuenca<br />
Río Chueña<br />
Huata Jahuira<br />
Cuadro Nº 7.10 Descargas medias mensuales generadas (m 3 /s) – <strong>Cuenca</strong> Suches<br />
Punto <strong>de</strong> control Ene Feb Mar Abr May Jun Jul Ago Sep Oct Nov Dic<br />
Confl.<strong>río</strong> Suches 1.252 1.988 1.510 1.007 0.377 0.158 0.097 0.087 0.114 0.169 0.264 0.524 0.629<br />
Río Caylloma Confl.<strong>río</strong> Suches 2.430 3.272 2.568 1.753 0.833 0.435 0.274 0.244 0.310 0.436 0.662 1.175 1.199<br />
Río Trapiche Confl.<strong>río</strong> Suches 1.740 2.739 2.391 2.079 1.191 0.682 0.385 0.269 0.271 0.373 0.573 0.894 1.132<br />
Río Suches Puente Ramón Castil<strong>la</strong> 5.000 8.380 6.980 5.980 3.120 1.690 1.010 0.810 0.890 1.240 1.790 2.620 3.290<br />
Río Suches Lugar Cuchaul<strong>la</strong> 15.620 22.640 18.350 13.550 6.440 3.320 2.080 1.810 2.330 3.290 4.760 7.830 8.500<br />
Descarga (m 3 /s)<br />
Descarga (m 3 /s)<br />
2.5<br />
2.0<br />
1.5<br />
1.0<br />
0.5<br />
0.0<br />
3.5<br />
3.0<br />
2.5<br />
2.0<br />
1.5<br />
1.0<br />
0.5<br />
0.0<br />
1.252<br />
Figura Nº 7.10 Variación mensual <strong>de</strong> <strong>la</strong>s <strong>de</strong>scargas medias generadas (m 3 /s)<br />
Promedio multimensual (1956-2009) – <strong>Cuenca</strong> Suches<br />
Subcuenca <strong>río</strong> Chueña Huata Jahuira<br />
1.988<br />
1.510<br />
1.007<br />
0.377<br />
0.264<br />
0.158<br />
0.097 0.087 0.114<br />
0.169<br />
0.524<br />
Ene Feb Mar Abr May Jun Jul Ago Sep Oct Nov Dic<br />
1.740<br />
2.739<br />
Tiempo (mes)<br />
Subcuenca <strong>río</strong> Trapiche<br />
2.391<br />
2.079<br />
1.191<br />
0.894<br />
0.682<br />
0.573<br />
0.385 0.373<br />
0.269 0.271<br />
Ene Feb Mar Abr May Jun Jul Ago Sep Oct Nov Dic<br />
Tiempo (mes)<br />
Descarga (m 3 /s)<br />
25<br />
20<br />
15<br />
10<br />
5<br />
0<br />
15.62<br />
MINAG-ANA-DCPRH-AGUAS SUPERFICIALES Pág.244<br />
Descarga (m 3 /s)<br />
4<br />
3<br />
2<br />
1<br />
0<br />
10<br />
8<br />
6<br />
4<br />
2<br />
0<br />
2.430<br />
3.272<br />
Subcuenca <strong>río</strong> Caylloma<br />
2.568<br />
1.753<br />
0.833<br />
0.435<br />
0.274 0.244 0.310 0.436<br />
0.662<br />
1.175<br />
Ene Feb Mar Abr May Jun Jul Ago Sep Oct Nov Dic<br />
5.00<br />
8.38<br />
<strong>Cuenca</strong> <strong>río</strong> Suches (lugar Cuchaul<strong>la</strong>)<br />
22.64<br />
18.35<br />
13.55<br />
6.44<br />
3.32<br />
Descarga (m 3 /s)<br />
2.08 1.81<br />
6.98<br />
5.98<br />
3.12<br />
Tiempo (mes)<br />
<strong>Cuenca</strong> <strong>río</strong> Suches (Pte. Ramón Castil<strong>la</strong>)<br />
1.69<br />
1.01 0.81 0.89 1.24<br />
1.79<br />
2.62<br />
Ene Feb Mar Abr May Jun Jul Ago Sep Oct Nov Dic<br />
2.33 3.29<br />
4.76<br />
7.83<br />
Ene Feb Mar Abr May Jun Jul Ago Sep Oct Nov Dic<br />
Tiempo (mes)<br />
Tiempo (mes)<br />
Prom<br />
Anual
<strong>Estudio</strong> <strong>Hidrológico</strong> <strong>de</strong> <strong>la</strong>s <strong>Cuenca</strong>s Huancané y Suches 2010<br />
7.6 PERSISTENCIA DE LAS DESCARGAS MEDIAS MENSUALES<br />
Según <strong>la</strong>s recomendaciones nacionales e internacionales, <strong>la</strong> disponibilidad <strong>de</strong> agua para<br />
aten<strong>de</strong>r <strong>la</strong>s <strong>de</strong>mandas <strong>de</strong> riego se <strong>de</strong>ben <strong>de</strong>terminar con un nivel <strong>de</strong> persistencia <strong>de</strong> 75% <strong>de</strong><br />
probabilidad.<br />
El análisis estadístico <strong>de</strong> probabilidad <strong>de</strong> ocurrencia <strong>de</strong> <strong>la</strong>s <strong>de</strong>scargas medias mensuales,<br />
para fines <strong>de</strong> riego, <strong>la</strong> fórmu<strong>la</strong> <strong>de</strong> Weibull es universalmente utilizada, cuya ecuación es <strong>la</strong><br />
siguiente:<br />
X x <br />
n 1<br />
<br />
m<br />
<br />
P m (1)<br />
Don<strong>de</strong>:<br />
n : Número total <strong>de</strong> datos <strong>de</strong> <strong>la</strong> muestra.<br />
m : Posición <strong>de</strong> un valor en una lista or<strong>de</strong>nada por magnitud<br />
<strong>de</strong>scen<strong>de</strong>nte <strong>de</strong>l respectivo valor <strong>de</strong> caudal al que se refiere <strong>la</strong><br />
probabilidad P <strong>de</strong> exce<strong>de</strong>ncia.<br />
Para el análisis <strong>de</strong> persistencia <strong>de</strong> los caudales <strong>de</strong> <strong>la</strong>s subcuencas <strong>de</strong> interés, se ha empleado<br />
<strong>la</strong> serie mensual <strong>de</strong> <strong>la</strong>s <strong>de</strong>scargas medias generadas <strong>de</strong>l pe<strong>río</strong>do 1956-2009, dicha<br />
información se muestra en el Anexo 1.<br />
Utilizando <strong>la</strong> información <strong>de</strong> <strong>la</strong>s <strong>de</strong>scargas medias generadas para <strong>la</strong>s subcuencas <strong>de</strong> interés<br />
y aplicando <strong>la</strong> ecuación (1), se ha analizado <strong>la</strong> persistencia al 50, 75, 90 y 95% <strong>de</strong><br />
probabilidad, los cuadros <strong>de</strong> análisis <strong>de</strong> frecuencia <strong>de</strong> <strong>la</strong>s <strong>de</strong>scargas medias se muestran en<br />
el Anexo 1.<br />
En los Cuadros Nº 7.11 a 7.23 y en <strong>la</strong>s Figuras Nº 7.11 a 7.23, se presenta los volúmenes<br />
<strong>de</strong> <strong>de</strong>scargas medias mensuales, calcu<strong>la</strong>dos al 50, 75, 90 y 95% <strong>de</strong> probabilidad <strong>de</strong><br />
persistencia para <strong>la</strong>s subcuencas <strong>de</strong> <strong>la</strong>s cuencas Huancané y Suches.<br />
Persistencia<br />
Cuadro Nº 7.11 Volúmenes <strong>de</strong> <strong>de</strong>scargas medias mensuales (hm 3 ) al 75% <strong>de</strong> persistencia<br />
Subcuenca <strong>río</strong> L<strong>la</strong>che<br />
Mes<br />
Ago Sep Oct Nov Dic Ene Feb Mar Abr May Jun Jul<br />
Promedio 0.36 0.45 0.71 1.37 2.65 5.28 5.54 4.74 3.31 1.77 0.89 0.50 27.57<br />
P (50%) 0.35 0.34 0.51 1.01 2.09 5.07 5.09 4.32 2.86 1.65 0.79 0.39 24.47<br />
P (75%) 0.13 0.16 0.34 0.56 1.25 2.91 3.85 3.04 1.94 0.95 0.58 0.31 16.02<br />
P (90%) 0.11 0.11 0.16 0.35 0.77 1.81 2.00 1.98 1.26 0.68 0.32 0.24 9.79<br />
P (95%) 0.08 0.09 0.11 0.21 0.63 0.82 1.63 1.63 0.92 0.43 0.22 0.17 6.94<br />
MINAG-ANA-DCPRH-AGUAS SUPERFICIALES Pág.245<br />
Total<br />
Anual
<strong>Estudio</strong> <strong>Hidrológico</strong> <strong>de</strong> <strong>la</strong>s <strong>Cuenca</strong>s Huancané y Suches 2010<br />
Persistencia<br />
Descarga (hm 3 )<br />
Figura Nº 7.11 Variación mensual <strong>de</strong> los volúmenes <strong>de</strong> <strong>de</strong>scargas medias<br />
Subcuenca <strong>río</strong> L<strong>la</strong>che<br />
6.0<br />
5.0<br />
4.0<br />
3.0<br />
2.0<br />
1.0<br />
0.0<br />
Ago Sep Oct Nov Dic Ene Feb Mar Abr May Jun Jul<br />
Tiempo (mes) Promedio P (50%) P (75%)<br />
P (90%) P (95%)<br />
Cuadro Nº 7.12 Volúmenes <strong>de</strong> <strong>de</strong>scargas medias mensuales (hm 3 ) al 75% <strong>de</strong> persistencia<br />
Subcuenca <strong>río</strong> Tuyto<br />
Ago Sep Oct Nov Dic Ene Feb Mar Abr May Jun Jul<br />
Promedio 2.25 3.34 5.84 9.46 19.77 42.32 54.46 44.27 29.63 13.07 5.42 2.81 232.64<br />
P (50%) 2.09 2.75 4.37 7.13 17.68 42.08 54.31 39.99 23.98 11.09 5.16 2.65 213.28<br />
P (75%) 1.53 2.02 3.35 5.13 11.52 23.14 36.12 25.66 15.58 7.66 3.71 2.14 137.56<br />
P (90%) 1.31 1.37 2.57 4.10 7.23 15.88 23.59 19.85 12.49 5.84 2.64 1.58 98.45<br />
P (95%) 1.21 1.22 2.44 3.81 6.86 14.54 20.01 16.04 8.58 4.69 2.41 1.50 83.31<br />
Descarga (hm 3 )<br />
Mes<br />
Figura Nº 7.12 Variación mensual <strong>de</strong> los volúmenes <strong>de</strong> <strong>de</strong>scargas medias<br />
Subcuenca <strong>río</strong> Tuyto<br />
60.0<br />
50.0<br />
40.0<br />
30.0<br />
20.0<br />
10.0<br />
0.0<br />
Ago Sep Oct Nov Dic Ene Feb Mar Abr May Jun Jul<br />
Tiempo (mes) Promedio P (50%) P (75%)<br />
P (90%) P (95%)<br />
MINAG-ANA-DCPRH-AGUAS SUPERFICIALES Pág.246<br />
Total<br />
Anual
<strong>Estudio</strong> <strong>Hidrológico</strong> <strong>de</strong> <strong>la</strong>s <strong>Cuenca</strong>s Huancané y Suches 2010<br />
Persistencia<br />
Cuadro Nº 7.13 Volúmenes <strong>de</strong> <strong>de</strong>scargas medias mensuales (hm 3 ) al 75% <strong>de</strong> persistencia<br />
Subcuenca <strong>río</strong> Muñani<br />
Ago Sep Oct Nov Dic Ene Feb Mar Abr May Jun Jul<br />
Promedio 2.24 2.38 3.69 5.56 10.50 23.45 36.40 29.07 21.49 10.37 4.76 2.83 152.74<br />
P (50%) 2.07 2.21 3.07 4.89 8.26 16.41 30.78 22.83 18.68 9.24 4.05 2.72 125.21<br />
P (75%) 1.87 1.86 2.44 3.43 5.43 11.24 19.67 15.66 10.40 6.42 3.37 2.31 84.10<br />
P (90%) 1.76 1.67 2.19 2.97 4.29 7.57 11.68 11.49 7.49 4.37 2.82 2.06 60.36<br />
P (95%) 1.70 1.64 2.06 2.54 3.41 5.60 8.98 9.20 6.37 3.72 2.46 1.96 49.64<br />
Persistencia<br />
Descarga (hm 3 )<br />
40.0<br />
35.0<br />
30.0<br />
25.0<br />
20.0<br />
15.0<br />
10.0<br />
Mes<br />
Figura Nº 7.13 Variación mensual <strong>de</strong> los volúmenes <strong>de</strong> <strong>de</strong>scargas medias<br />
Subcuenca <strong>río</strong> Muñani<br />
5.0<br />
0.0<br />
Ago Sep Oct Nov Dic Ene Feb Mar Abr May Jun Jul<br />
Tiempo (mes) Promedio P (50%) P (75%)<br />
P (90%) P (95%)<br />
Cuadro Nº 7.14 Volúmenes <strong>de</strong> <strong>de</strong>scargas medias mensuales (hm 3 ) al 75% <strong>de</strong> persistencia<br />
Subcuenca <strong>río</strong> Pistune<br />
Mes<br />
Ago Sep Oct Nov Dic Ene Feb Mar Abr May Jun Jul<br />
Promedio 0.98 1.22 1.81 3.05 5.75 11.28 14.50 12.00 8.90 4.56 2.17 1.25 67.47<br />
P (50%) 0.87 0.97 1.68 2.28 4.82 10.87 12.58 11.54 7.74 4.00 2.07 1.03 60.45<br />
P (75%) 0.36 0.49 1.02 1.81 3.08 7.87 10.52 8.13 5.18 2.62 1.44 0.78 43.30<br />
P (90%) 0.23 0.35 0.45 0.89 1.83 4.90 6.86 5.20 3.50 1.67 0.81 0.54 27.23<br />
P (95%) 0.18 0.29 0.23 0.48 1.56 2.65 5.86 4.52 2.32 0.96 0.64 0.39 20.08<br />
MINAG-ANA-DCPRH-AGUAS SUPERFICIALES Pág.247<br />
Total<br />
Anual<br />
Total<br />
Anual
<strong>Estudio</strong> <strong>Hidrológico</strong> <strong>de</strong> <strong>la</strong>s <strong>Cuenca</strong>s Huancané y Suches 2010<br />
Persistencia<br />
Descarga (hm 3 )<br />
Figura Nº 7.14 Variación mensual <strong>de</strong> los volúmenes <strong>de</strong> <strong>de</strong>scargas medias<br />
Subcuenca <strong>río</strong> Pistune<br />
15.0<br />
12.0<br />
9.0<br />
6.0<br />
3.0<br />
0.0<br />
Ago Sep Oct Nov Dic Ene Feb Mar Abr May Jun Jul<br />
Tiempo (mes) Promedio P (50%) P (75%)<br />
P (90%) P (95%)<br />
Cuadro Nº 7.15 Volúmenes <strong>de</strong> <strong>de</strong>scargas medias mensuales (hm 3 ) al 75% <strong>de</strong> persistencia<br />
Subcuenca Alto Huancané (<strong>río</strong> Puncune)<br />
Ago Sep Oct Nov Dic Ene Feb Mar Abr May Jun Jul<br />
Promedio 1.09 1.04 1.49 2.62 4.66 9.48 17.65 14.25 11.04 5.59 2.56 1.30 72.77<br />
P (50%) 0.84 0.89 1.37 2.32 3.92 8.22 15.23 11.93 10.31 5.12 2.38 1.24 63.77<br />
P (75%) 0.51 0.55 0.93 1.78 2.61 5.77 9.65 9.70 7.15 3.71 1.84 0.94 45.14<br />
P (90%) 0.32 0.29 0.67 1.03 1.75 4.37 7.55 8.15 5.18 2.86 1.45 0.72 34.34<br />
P (95%) 0.27 0.25 0.51 0.75 1.39 2.76 5.86 7.07 4.96 2.60 1.23 0.66 28.31<br />
Descarga (hm 3 )<br />
Mes<br />
Figura Nº 7.15 Variación mensual <strong>de</strong> los volúmenes <strong>de</strong> <strong>de</strong>scargas medias<br />
Subcuenca Alto Huancané (<strong>río</strong> Puncune)<br />
20.0<br />
16.0<br />
12.0<br />
8.0<br />
4.0<br />
0.0<br />
Ago Sep Oct Nov Dic Ene Feb Mar Abr May Jun Jul<br />
Tiempo (mes) Promedio P (50%) P (75%)<br />
P (90%) P (95%)<br />
MINAG-ANA-DCPRH-AGUAS SUPERFICIALES Pág.248<br />
Total<br />
Anual
<strong>Estudio</strong> <strong>Hidrológico</strong> <strong>de</strong> <strong>la</strong>s <strong>Cuenca</strong>s Huancané y Suches 2010<br />
Persistencia<br />
Cuadro Nº 7.16 Volúmenes <strong>de</strong> <strong>de</strong>scargas medias mensuales (hm 3 ) al 75% <strong>de</strong> persistencia<br />
Subcuenca <strong>río</strong> Guanaco (vaso Cal<strong>la</strong>tomaza)<br />
Ago Sep Oct Nov Dic Ene Feb Mar Abr May Jun Jul<br />
Promedio 0.53 0.60 0.92 1.38 2.57 6.29 10.42 8.30 5.87 2.12 0.89 0.60 40.49<br />
P (50%) 0.49 0.56 0.82 1.08 1.66 4.61 9.69 5.88 4.66 1.87 0.79 0.55 32.66<br />
P (75%) 0.44 0.46 0.66 0.94 1.08 2.14 5.35 3.47 2.72 1.30 0.65 0.49 19.70<br />
P (90%) 0.42 0.40 0.55 0.74 0.76 1.21 2.60 2.76 1.82 0.97 0.58 0.47 13.28<br />
P (95%) 0.41 0.39 0.52 0.67 0.73 1.00 1.68 2.19 1.39 0.80 0.55 0.44 10.77<br />
Persistencia<br />
Descarga (hm 3 )<br />
12.0<br />
10.0<br />
Mes<br />
Figura Nº 7.16 Variación mensual <strong>de</strong> los volúmenes <strong>de</strong> <strong>de</strong>scargas medias<br />
Subcuenca <strong>río</strong> Guanaco (vaso Cal<strong>la</strong>tomaza)<br />
8.0<br />
6.0<br />
4.0<br />
2.0<br />
0.0<br />
Ago Sep Oct Nov Dic Ene Feb Mar Abr May Jun Jul<br />
Tiempo (mes) Promedio P (50%) P (75%)<br />
P (90%) P (95%)<br />
Cuadro Nº 7.17 Volúmenes <strong>de</strong> <strong>de</strong>scargas medias mensuales (hm 3 ) al 75% <strong>de</strong> persistencia<br />
Subcuenca <strong>río</strong> Yaputira (vaso Yaputira)<br />
Mes<br />
Ago Sep Oct Nov Dic Ene Feb Mar Abr May Jun Jul<br />
Promedio 0.47 0.64 1.15 1.77 2.54 6.03 11.26 9.14 7.07 2.34 0.85 0.50 43.76<br />
P (50%) 0.42 0.53 0.84 1.53 2.00 4.16 10.56 5.39 5.23 2.19 0.80 0.46 34.11<br />
P (75%) 0.32 0.41 0.63 1.01 1.39 2.66 6.08 3.78 2.58 1.36 0.55 0.37 21.14<br />
P (90%) 0.31 0.32 0.54 0.81 1.04 1.74 3.69 2.34 1.87 0.84 0.42 0.34 14.26<br />
P (95%) 0.30 0.30 0.38 0.69 0.62 1.63 3.33 1.94 1.25 0.59 0.40 0.32 11.75<br />
MINAG-ANA-DCPRH-AGUAS SUPERFICIALES Pág.249<br />
Total<br />
Anual<br />
Total<br />
Anual
<strong>Estudio</strong> <strong>Hidrológico</strong> <strong>de</strong> <strong>la</strong>s <strong>Cuenca</strong>s Huancané y Suches 2010<br />
Persistencia<br />
Descarga (hm 3 )<br />
Figura Nº 7.17 Variación mensual <strong>de</strong> los volúmenes <strong>de</strong> <strong>de</strong>scargas medias<br />
Subcuenca <strong>río</strong> Yaputira (vaso Yaputira)<br />
12.0<br />
10.0<br />
8.0<br />
6.0<br />
4.0<br />
2.0<br />
0.0<br />
Ago Sep Oct Nov Dic Ene Feb Mar Abr May Jun Jul<br />
Tiempo (mes) Promedio P (50%) P (75%)<br />
P (90%) P (95%)<br />
Cuadro Nº 7.18 Volúmenes <strong>de</strong> <strong>de</strong>scargas medias mensuales (hm 3 ) al 75% <strong>de</strong> persistencia<br />
<strong>Cuenca</strong> <strong>río</strong> Huancané (cuenca total)<br />
Ago Sep Oct Nov Dic Ene Feb Mar Abr May Jun Jul<br />
Promedio 7.37 8.63 14.09 24.13 48.61 103.33 146.92 120.13 87.01 42.99 19.57 10.34 633.12<br />
P (50%) 7.29 7.98 12.91 19.65 42.83 93.99 129.40 117.47 82.24 39.40 17.96 10.12 581.24<br />
P (75%) 5.09 5.86 8.92 14.83 26.22 68.19 94.66 80.70 54.74 28.26 14.00 7.85 409.32<br />
P (90%) 4.47 3.89 7.26 12.23 20.62 45.05 77.10 62.65 37.17 20.30 10.86 6.54 308.14<br />
P (95%) 3.88 3.47 6.86 10.24 18.72 36.94 56.13 51.83 31.16 15.45 8.76 5.38 248.82<br />
Descarga (hm 3 )<br />
160.0<br />
140.0<br />
120.0<br />
100.0<br />
Mes<br />
Figura Nº 7.18 Variación mensual <strong>de</strong> los volúmenes <strong>de</strong> <strong>de</strong>scargas medias<br />
<strong>Cuenca</strong> <strong>río</strong> Huancané (cuenca total)<br />
80.0<br />
60.0<br />
40.0<br />
20.0<br />
0.0<br />
Ago Sep Oct Nov Dic Ene Feb Mar Abr May Jun Jul<br />
Tiempo (mes) Promedio P (50%) P (75%)<br />
P (90%) P (95%)<br />
MINAG-ANA-DCPRH-AGUAS SUPERFICIALES Pág.250<br />
Total<br />
Anual
<strong>Estudio</strong> <strong>Hidrológico</strong> <strong>de</strong> <strong>la</strong>s <strong>Cuenca</strong>s Huancané y Suches 2010<br />
Persistencia<br />
Cuadro Nº 7.19 Volúmenes <strong>de</strong> <strong>de</strong>scargas medias mensuales (hm 3 ) al 75% <strong>de</strong> persistencia<br />
Subcuenca <strong>río</strong> Chueña Huata Jahuira<br />
Ago Sep Oct Nov Dic Ene Feb Mar Abr May Jun Jul<br />
Promedio 0.23 0.30 0.45 0.68 1.40 3.35 4.81 4.04 2.61 1.01 0.41 0.26 19.55<br />
P (50%) 0.17 0.21 0.34 0.53 1.02 2.58 3.78 2.70 1.70 0.82 0.33 0.21 14.39<br />
P (75%) 0.09 0.11 0.17 0.30 0.53 1.34 2.27 1.53 0.96 0.38 0.24 0.14 8.06<br />
P (90%) 0.08 0.05 0.09 0.15 0.32 0.75 1.24 0.95 0.47 0.16 0.14 0.12 4.52<br />
P (95%) 0.07 0.03 0.00 0.07 0.23 0.54 0.88 0.61 0.31 0.12 0.12 0.11 3.09<br />
Persistencia<br />
Descarga (hm 3 )<br />
Mes<br />
Figura Nº 7.19 Variación mensual <strong>de</strong> los volúmenes <strong>de</strong> <strong>de</strong>scargas medias<br />
Subcuenca <strong>río</strong> Chueña Huata Jahuira<br />
6.0<br />
5.0<br />
4.0<br />
3.0<br />
2.0<br />
1.0<br />
0.0<br />
Ago Sep Oct Nov Dic Ene Feb Mar Abr May Jun Jul<br />
Tiempo (mes) Promedio P (50%) P (75%)<br />
P (90%) P (95%)<br />
Cuadro Nº 7.20 Volúmenes <strong>de</strong> <strong>de</strong>scargas medias mensuales (hm 3 ) al 75% <strong>de</strong> persistencia<br />
Subcuenca <strong>río</strong> Caylloma<br />
Mes<br />
Ago Sep Oct Nov Dic Ene Feb Mar Abr May Jun Jul<br />
Promedio 0.65 0.80 1.17 1.72 3.15 6.51 7.92 6.88 4.54 2.23 1.13 0.73 37.43<br />
P (50%) 0.61 0.69 1.01 1.46 2.72 6.01 7.00 6.07 3.82 2.07 1.08 0.66 33.20<br />
P (75%) 0.46 0.54 0.78 1.02 1.63 3.95 5.20 3.88 2.58 1.40 0.83 0.61 22.88<br />
P (90%) 0.40 0.40 0.63 0.82 1.22 2.27 3.46 2.94 1.91 1.01 0.66 0.48 16.20<br />
P (95%) 0.38 0.37 0.55 0.64 0.98 1.92 2.48 2.45 1.57 0.80 0.55 0.46 13.15<br />
MINAG-ANA-DCPRH-AGUAS SUPERFICIALES Pág.251<br />
Total<br />
Anual<br />
Total<br />
Anual
<strong>Estudio</strong> <strong>Hidrológico</strong> <strong>de</strong> <strong>la</strong>s <strong>Cuenca</strong>s Huancané y Suches 2010<br />
Persistencia<br />
Descarga (hm 3 )<br />
Figura Nº 7.20 Variación mensual <strong>de</strong> los volúmenes <strong>de</strong> <strong>de</strong>scargas medias<br />
Subcuenca <strong>río</strong> Caylloma<br />
9.0<br />
8.0<br />
7.0<br />
6.0<br />
5.0<br />
4.0<br />
3.0<br />
2.0<br />
1.0<br />
0.0<br />
Ago Sep Oct Nov Dic Ene Feb Mar Abr May Jun Jul<br />
Tiempo (mes) Promedio P (50%) P (75%)<br />
P (90%) P (95%)<br />
Cuadro Nº 7.21 Volúmenes <strong>de</strong> <strong>de</strong>scargas medias mensuales (hm 3 ) al 75% <strong>de</strong> persistencia<br />
Subcuenca <strong>río</strong> Trapiche<br />
Ago Sep Oct Nov Dic Ene Feb Mar Abr May Jun Jul<br />
Promedio 0.72 0.70 1.00 1.49 2.39 4.66 6.63 6.40 5.39 3.19 1.77 1.03 35.37<br />
P (50%) 0.61 0.53 0.76 1.18 1.82 3.96 6.06 5.12 4.37 3.03 1.75 0.96 30.15<br />
P (75%) 0.39 0.30 0.48 0.82 1.13 2.27 4.43 4.05 2.86 1.74 1.03 0.72 20.22<br />
P (90%) 0.28 0.21 0.33 0.35 0.78 1.14 2.29 2.85 2.33 1.35 0.68 0.44 13.03<br />
P (95%) 0.23 0.17 0.25 0.27 0.37 0.65 1.27 2.03 1.90 1.18 0.60 0.31 9.23<br />
Descarga (hm 3 )<br />
Mes<br />
Figura Nº 7.21 Variación mensual <strong>de</strong> los volúmenes <strong>de</strong> <strong>de</strong>scargas medias<br />
Subcuenca <strong>río</strong> Trapiche<br />
8.0<br />
7.0<br />
6.0<br />
5.0<br />
4.0<br />
3.0<br />
2.0<br />
1.0<br />
0.0<br />
Ago Sep Oct Nov Dic Ene Feb Mar Abr May Jun Jul<br />
Tiempo (mes) Promedio P (50%) P (75%)<br />
P (90%) P (95%)<br />
MINAG-ANA-DCPRH-AGUAS SUPERFICIALES Pág.252<br />
Total<br />
Anual
<strong>Estudio</strong> <strong>Hidrológico</strong> <strong>de</strong> <strong>la</strong>s <strong>Cuenca</strong>s Huancané y Suches 2010<br />
Persistencia<br />
Cuadro Nº 7.22 Volúmenes <strong>de</strong> <strong>de</strong>scargas medias mensuales (hm 3 ) al 75% <strong>de</strong> persistencia<br />
<strong>Cuenca</strong> <strong>río</strong> Suches (Puente Ramón Castil<strong>la</strong>)<br />
Ago Sep Oct Nov Dic Ene Feb Mar Abr May Jun Jul<br />
Promedio 2.17 2.31 3.32 4.64 7.02 13.39 20.27 18.70 15.50 8.36 4.38 2.71 102.77<br />
P (50%) 1.90 2.05 2.71 3.84 5.95 11.20 18.41 15.32 11.77 7.58 4.20 2.65 87.58<br />
P (75%) 1.29 1.30 1.96 2.93 4.02 6.83 13.38 11.17 8.06 4.45 2.88 2.09 60.36<br />
P (90%) 1.10 0.86 1.47 1.35 2.49 4.29 6.94 7.66 5.73 3.80 2.20 1.42 39.31<br />
P (95%) 0.86 0.73 1.12 1.01 1.34 2.33 4.04 6.72 5.29 2.84 1.97 1.31 29.56<br />
Persistencia<br />
Descarga (hm 3 )<br />
24.0<br />
20.0<br />
16.0<br />
12.0<br />
Mes<br />
Figura Nº 7.22 Variación mensual <strong>de</strong> los volúmenes <strong>de</strong> <strong>de</strong>scargas medias<br />
<strong>Cuenca</strong> <strong>río</strong> Suches (Puente Ramón Castil<strong>la</strong>)<br />
8.0<br />
4.0<br />
0.0<br />
Ago Sep Oct Nov Dic Ene Feb Mar Abr May Jun Jul<br />
Tiempo (mes) Promedio P (50%) P (75%)<br />
P (90%) P (95%)<br />
Cuadro Nº 7.23 Volúmenes <strong>de</strong> <strong>de</strong>scargas medias mensuales (hm 3 ) al 75% <strong>de</strong> persistencia<br />
<strong>Cuenca</strong> <strong>río</strong> Suches (lugar Cuchaul<strong>la</strong>, límite Perú-Bolivia)<br />
Mes<br />
Ago Sep Oct Nov Dic Ene Feb Mar Abr May Jun Jul<br />
Promedio 4.85 6.04 8.81 12.34 20.97 41.84 54.77 49.15 35.12 17.25 8.61 5.57 265.32<br />
P (50%) 4.69 5.39 7.39 10.99 17.46 34.74 49.33 38.62 29.39 16.74 7.98 5.30 228.02<br />
P (75%) 3.56 3.99 5.81 7.26 10.79 24.88 36.05 26.89 18.48 9.48 6.32 4.45 157.96<br />
P (90%) 3.27 3.29 5.01 5.91 8.17 14.30 20.59 20.01 13.19 7.20 4.90 3.64 109.48<br />
P (95%) 3.00 3.06 4.45 4.80 7.18 10.61 16.31 18.03 11.22 6.05 4.43 3.51 92.65<br />
MINAG-ANA-DCPRH-AGUAS SUPERFICIALES Pág.253<br />
Total<br />
Anual<br />
Total<br />
Anual
<strong>Estudio</strong> <strong>Hidrológico</strong> <strong>de</strong> <strong>la</strong>s <strong>Cuenca</strong>s Huancané y Suches 2010<br />
Descarga (hm 3 )<br />
Figura Nº 7.23 Variación mensual <strong>de</strong> los volúmenes <strong>de</strong> <strong>de</strong>scargas medias<br />
<strong>Cuenca</strong> <strong>río</strong> Suches (lugar Cuchaul<strong>la</strong>, límite Perú-Bolivia)<br />
60.0<br />
55.0<br />
50.0<br />
45.0<br />
40.0<br />
35.0<br />
30.0<br />
25.0<br />
20.0<br />
15.0<br />
10.0<br />
5.0<br />
0.0<br />
Ago Sep Oct Nov Dic Ene Feb Mar Abr May Jun Jul<br />
7.7 MODELACIÓN ESTOCÁSTICA<br />
Tiempo (mes) Promedio P (50%) P (75%)<br />
P (90%) P (95%)<br />
La mo<strong>de</strong><strong>la</strong>ción estocástica en el presente estudio, se ha utilizado para generar <strong>la</strong>s series<br />
sintéticas <strong>de</strong> caudales medios mensuales <strong>de</strong> los <strong>río</strong>s Guanaco e Yaputira. Información<br />
básica para <strong>la</strong> <strong>de</strong>terminación <strong>de</strong> <strong>la</strong> capacidad <strong>de</strong> embalse <strong>de</strong>s<strong>de</strong> el punto <strong>de</strong> vista<br />
hidrológico. En <strong>la</strong>s subcuencas <strong>de</strong>l <strong>río</strong> Guanaco e Yaputira se han propuesto dos vasos <strong>de</strong><br />
represamiento <strong>de</strong> agua.<br />
7.7.1 Mo<strong>de</strong>lo estocástico autorregresivo<br />
Los mo<strong>de</strong>los estocásticos en <strong>la</strong> econometría contemporánea <strong>de</strong> recursos <strong>de</strong> agua está<br />
basado en <strong>la</strong> confianza <strong>de</strong> los mo<strong>de</strong>los matemáticos <strong>de</strong> ingeniería para <strong>la</strong> toma <strong>de</strong><br />
<strong>de</strong>cisiones y evaluación <strong>de</strong> diversos proyectos <strong>de</strong> recurso hídrico. Estos mo<strong>de</strong>los pue<strong>de</strong>n<br />
ser hechos suficientemente confiables con el tiempo, únicamente por el <strong>de</strong>sarrollo <strong>de</strong><br />
<strong>de</strong>scripciones matemáticas apropiadas <strong>de</strong> procesos hidrológicos <strong>de</strong> natuleza estocástica.<br />
Un mo<strong>de</strong>lo estocástico utiliza propieda<strong>de</strong>s estadísticas <strong>de</strong> los registros existentes (muestra<br />
<strong>de</strong> datos) y leyes <strong>de</strong> probabilidad, junto con generador <strong>de</strong> números aleatorios para generar<br />
series sintéticas (eventos posibles) los cuales son usados en <strong>la</strong> resolución <strong>de</strong> problemas<br />
hidrológicos [Nuñez].<br />
Según Sa<strong>la</strong>s citado por Villón [1983], hay varios mo<strong>de</strong>los estocásticos que han sido<br />
propuestos para el mo<strong>de</strong><strong>la</strong>miento hidrológico <strong>de</strong> series <strong>de</strong> tiempo, <strong>de</strong> los cuales los<br />
mo<strong>de</strong>los Markovianos se utilizarán en el presente estudio.<br />
MINAG-ANA-DCPRH-AGUAS SUPERFICIALES Pág.254
<strong>Estudio</strong> <strong>Hidrológico</strong> <strong>de</strong> <strong>la</strong>s <strong>Cuenca</strong>s Huancané y Suches 2010<br />
A.- Mo<strong>de</strong>los Markovianos<br />
Según Sa<strong>la</strong>s citado por Villón[1983], los mo<strong>de</strong>los Markovianos l<strong>la</strong>mado también mo<strong>de</strong>los<br />
Autorregresivos (AR) han sido usados extensamente en hidrología y recursos <strong>de</strong> agua<br />
<strong>de</strong>s<strong>de</strong> principios <strong>de</strong> los años 1960, para el mo<strong>de</strong><strong>la</strong>miento <strong>de</strong> series <strong>de</strong> tiempo hidrológica<br />
periódica (mensual, semanal y diaria) y anual. La aplicación <strong>de</strong> estos mo<strong>de</strong>los en<br />
hidrología han sido atractivos principalmente porque:<br />
1. La forma autorregresiva tiene un tipo intuitivo <strong>de</strong> <strong>de</strong>pen<strong>de</strong>ncia en el tiempo<br />
(el valor <strong>de</strong> una variable en el tiempo presente <strong>de</strong>pen<strong>de</strong> <strong>de</strong> los valores <strong>de</strong><br />
tiempos previos), y<br />
2. Son mo<strong>de</strong>los simples a usar.<br />
Los Mo<strong>de</strong>los Markovianos o Autorregresivos pue<strong>de</strong>n tener parámetros constantes o<br />
periódicos que varían con el tiempo o una combinación <strong>de</strong> ambos. El primero es<br />
típicamente usado para el mo<strong>de</strong><strong>la</strong>miento <strong>de</strong> series <strong>de</strong> tiempo anuales, mientras el segundo<br />
es usado para el mo<strong>de</strong><strong>la</strong>miento <strong>de</strong> series <strong>de</strong> tiempo estacionales (mensuales, semanales o<br />
diarias).<br />
En este trabajo se usarán los Mo<strong>de</strong>los Estocásticos Markovianos <strong>de</strong> Series Mensuales, <strong>la</strong><br />
metodología se basa en el análisis y mo<strong>de</strong><strong>la</strong>miento matemático <strong>de</strong> los diferentes<br />
componentes que se observan en <strong>la</strong>s series hidrológicas históricas cuando se hace <strong>la</strong><br />
<strong>de</strong>scomposición <strong>de</strong> el<strong>la</strong>.<br />
Mo<strong>de</strong>los Markovianos <strong>de</strong> series mensuales<br />
Yevjevich [1972], <strong>de</strong>scribe los mo<strong>de</strong>los Markovianos <strong>de</strong> series no anuales (mensuales),<br />
presentan periodicida<strong>de</strong>s en sus diferentes parámetros, a diferencia <strong>de</strong> los anuales que no<br />
presentan, lo que hace un poco más complicado su análisis.<br />
El mo<strong>de</strong>lo estocástico general consi<strong>de</strong>rado para una serie mensual, tiene <strong>la</strong> forma <strong>de</strong> <strong>la</strong><br />
ecuación general <strong>de</strong> series anuales, <strong>la</strong> misma que se <strong>de</strong>scribe para una serie mensual con<br />
parámetros periódicos.<br />
X M S .Z<br />
(1)<br />
p, τ<br />
τ<br />
τ<br />
p, τ<br />
Don<strong>de</strong>:<br />
X = Serie hidrológica mensual.<br />
p, <br />
M = Media periódica para el pe<strong>río</strong>do .<br />
<br />
S = Desviación estandar periódica para el pe<strong>río</strong>do .<br />
<br />
Z = Componente estocástica para el año p y el pe<strong>río</strong>do .<br />
p, <br />
p = 1, 2, 3,..............................., m<br />
m = Número total <strong>de</strong> años.<br />
= 1, 2, 3,..............................., w<br />
w = 12, si el análisis es mensual.<br />
MINAG-ANA-DCPRH-AGUAS SUPERFICIALES Pág.255
<strong>Estudio</strong> <strong>Hidrológico</strong> <strong>de</strong> <strong>la</strong>s <strong>Cuenca</strong>s Huancané y Suches 2010<br />
a.1.- Mo<strong>de</strong>lo Markoviano <strong>de</strong> primer or<strong>de</strong>n<br />
La suposición básica <strong>de</strong>l análisis estocástico es que el proceso es estacionario, es <strong>de</strong>cir, que<br />
<strong>la</strong>s propieda<strong>de</strong>s estadísticas <strong>de</strong>l proceso no varían con el tiempo(tiempo invariante). Por<br />
esto <strong>la</strong>s propieda<strong>de</strong>s estadísticas <strong>de</strong>l registro histórico pue<strong>de</strong>n utilizarse para obtener una<br />
secuencia sintética <strong>la</strong>rga, <strong>la</strong> cual pue<strong>de</strong> usarse <strong>de</strong> manera más efectiva en <strong>la</strong> p<strong>la</strong>neación <strong>de</strong><br />
un registro histórico corto. Las secuencias sintéticas <strong>de</strong>ben ser semejantes a <strong>la</strong> secuencia<br />
histórica, es <strong>de</strong>cir <strong>de</strong>ben poseer características estadísticas semejantes.[Linsley].<br />
El mo<strong>de</strong>lo Markoviano <strong>de</strong> primer or<strong>de</strong>n es l<strong>la</strong>mado también Autorregresivo <strong>de</strong> primer<br />
or<strong>de</strong>n AR(1), es <strong>la</strong> estructura más simple <strong>de</strong> <strong>de</strong>pen<strong>de</strong>ncia, <strong>la</strong> ecuación es <strong>la</strong> siguiente:<br />
Z<br />
2 α1,<br />
-1<br />
E <br />
1<br />
2<br />
p, α , 1Zp,<br />
-1<br />
<br />
p,<br />
1 1 (2)<br />
Don<strong>de</strong> :<br />
α ρ Primer coeficiente <strong>de</strong> autorregresión, que es igual al primer<br />
1 1 1 1<br />
, ,<br />
E =<br />
coeficiente <strong>de</strong> autocorre<strong>la</strong>ción.<br />
Componente estocástica in<strong>de</strong>pendiente.<br />
p, <br />
Sa<strong>la</strong>s [1976], en <strong>la</strong> práctica, generalmente se utilizan los coeficientes <strong>de</strong> autocorre<strong>la</strong>ción<br />
constantes como <strong>de</strong> los datos anuales.<br />
ρ 1,<br />
1<br />
ρ<br />
y obteniendo <strong>la</strong> Ec.(2), como:<br />
Z<br />
1<br />
2 ρ E <br />
1<br />
2<br />
1<br />
p, ρ Zp,<br />
-1<br />
<br />
p,<br />
1 1 (3)<br />
La estructura es simi<strong>la</strong>r al mo<strong>de</strong>lo Markoviano <strong>de</strong> primer or<strong>de</strong>n <strong>de</strong> series anuales.<br />
Los coeficientes <strong>de</strong> autorregresión i,-i se estima en función <strong>de</strong> los coeficientes <strong>de</strong><br />
autocorre<strong>la</strong>ción k,-i para k, i = 1, 2 ,3 y estas son estimados por rk,-i.<br />
Si el mo<strong>de</strong>lo es a<strong>de</strong>cuado para <strong>de</strong>scribir <strong>la</strong> <strong>de</strong>pen<strong>de</strong>ncia <strong>de</strong> Zp,, entonces <strong>la</strong> variable Ep,, se<br />
calcu<strong>la</strong> <strong>de</strong>spejando <strong>de</strong> <strong>la</strong> Ec.(3) y se tiene:<br />
E<br />
p,<br />
<br />
2<br />
1<br />
Zp,<br />
ρ1Zp,<br />
-1<br />
2<br />
1 ρ<br />
<br />
(4)<br />
El cual <strong>de</strong>be ser una serie in<strong>de</strong>pendiente.<br />
a.2.- Pruebas <strong>de</strong>l mo<strong>de</strong>lo<br />
1<br />
En el análisis estocástico <strong>de</strong> series hidrológicas, pue<strong>de</strong> ocurrir que <strong>la</strong> componente<br />
estocástica Zp, <strong>de</strong> <strong>la</strong> Ec.(1) sea in<strong>de</strong>pendiente, por lo tanto, no será necesario ningún<br />
MINAG-ANA-DCPRH-AGUAS SUPERFICIALES Pág.256
<strong>Estudio</strong> <strong>Hidrológico</strong> <strong>de</strong> <strong>la</strong>s <strong>Cuenca</strong>s Huancané y Suches 2010<br />
mo<strong>de</strong>lo <strong>de</strong> <strong>de</strong>pen<strong>de</strong>ncia, en este caso se <strong>de</strong>be usar el mo<strong>de</strong>lo Markov 0, y su coeficiente <strong>de</strong><br />
autocorre<strong>la</strong>ción es = 0. En caso contrario hay que <strong>de</strong>cidir por el mo<strong>de</strong>lo Markoviano más<br />
a<strong>de</strong>cuado para <strong>de</strong>scribir <strong>la</strong> <strong>de</strong>pen<strong>de</strong>ncia <strong>de</strong> <strong>la</strong> componente estocástica Z p,.<br />
1.- Prueba <strong>de</strong> <strong>la</strong> forma <strong>de</strong>l correlograma<br />
Esta prueba se basa en <strong>la</strong> comparación <strong>de</strong> <strong>la</strong>s formas <strong>de</strong>l correlograma <strong>de</strong>l<br />
mo<strong>de</strong>lo postu<strong>la</strong>do y <strong>de</strong>l corre<strong>la</strong>grama calcu<strong>la</strong>do.<br />
2.- Prueba <strong>de</strong> in<strong>de</strong>pen<strong>de</strong>ncia <strong>de</strong> <strong>la</strong> variable residual<br />
Esta prueba se basa en el hecho <strong>de</strong> que, si <strong>la</strong> componente estocástica Zp, <strong>de</strong><br />
<strong>la</strong> ecuación (1) es in<strong>de</strong>pendiente, entonces k, (zp,) = 0 para k 0.<br />
Asimismo, si un mo<strong>de</strong>lo Markoviano <strong>de</strong> or<strong>de</strong>n m es a<strong>de</strong>cuado para<br />
representar <strong>la</strong> <strong>de</strong>pen<strong>de</strong>ncia <strong>de</strong> Zp,, entonces <strong>la</strong> variable Ep, es in<strong>de</strong>pendiente<br />
y por lo tanto k, (Ep,) = 0 para k 0. En literal a.3 se indica el<br />
procedimiento <strong>de</strong> cálculo para este caso.<br />
a.3.- Procedimiento general <strong>de</strong>l mo<strong>de</strong><strong>la</strong>miento estocástico Markoviano<br />
El procedimiento general para hal<strong>la</strong>r el mo<strong>de</strong>lo estocástico Markoviano <strong>de</strong> datos<br />
mensuales, es <strong>la</strong> siguiente:<br />
1° Dada <strong>la</strong> serie histórica X p, :<br />
X1 , 1,<br />
X1,<br />
2<br />
,......... .......... .......... ....... X<br />
Don<strong>de</strong>: n es el número total <strong>de</strong> años y es el número <strong>de</strong> meses.<br />
2° P<strong>la</strong>nteo <strong>de</strong> hipótesis:<br />
Hp (hipótesis p<strong>la</strong>nteada) : Z p,<br />
es totalmente in<strong>de</strong>pendiente.<br />
Ha (hipótesis alterna) : Z p,<br />
es totalmente <strong>de</strong>pendiente.<br />
3° Cálculo <strong>de</strong> los parámetros pe<strong>río</strong>dicos <strong>de</strong>terminísticos <strong>de</strong>l mo<strong>de</strong>lo, <strong>la</strong> media<br />
M y <strong>la</strong> <strong>de</strong>sviación estándar S con <strong>la</strong>s siguientes ecuaciones:<br />
M<br />
<br />
1<br />
n<br />
n<br />
<br />
i1<br />
X<br />
p,<br />
<br />
M X<br />
MINAG-ANA-DCPRH-AGUAS SUPERFICIALES Pág.257<br />
1<br />
2<br />
n<br />
1<br />
2 <br />
S <br />
<br />
p,<br />
<br />
1<br />
<br />
<br />
(6)<br />
n i1<br />
<br />
4° Cálculo <strong>de</strong>l componente estocástica <strong>de</strong>pendiente Z p,<br />
. Según Aliaga [1985],<br />
<strong>la</strong> componente estocástica <strong>de</strong> una serie hidrológica pue<strong>de</strong> ser <strong>de</strong>pendiente o<br />
in<strong>de</strong>pendiente. En <strong>la</strong>s series mensuales por lo general son <strong>de</strong>pendientes, y se<br />
tiene <strong>la</strong> siguiente expresión:<br />
n<br />
, <br />
(5)
<strong>Estudio</strong> <strong>Hidrológico</strong> <strong>de</strong> <strong>la</strong>s <strong>Cuenca</strong>s Huancané y Suches 2010<br />
Z<br />
X M <br />
p, <br />
p, (7)<br />
S<br />
La componente estocástica Zp,, obtenido en <strong>la</strong> Ec.(7) usualmente tiene una<br />
<strong>de</strong>pen<strong>de</strong>ncia en el tiempo, lo que se representa según los mo<strong>de</strong>los<br />
Markovianos, en forma simi<strong>la</strong>r que en los datos anuales.<br />
5° Cálculo <strong>de</strong> los coeficientes <strong>de</strong> autocorre<strong>la</strong>ción k . En hidrología, se pue<strong>de</strong><br />
asumir en ciertos casos que los coeficientes <strong>de</strong> autocorre<strong>la</strong>ción <strong>de</strong>l proceso<br />
Zp, son constantes.<br />
El coeficiente <strong>de</strong> autocorre<strong>la</strong>ción <br />
es <strong>de</strong>finido como:[Aliaga].<br />
ρ<br />
ó<br />
ρ<br />
κ, τ<br />
κ, τ<br />
<br />
<br />
2<br />
COV Zp,<br />
τ , Zp,<br />
τκ<br />
1<br />
VAR Z VAR Z<br />
p, τ<br />
k, para <strong>la</strong> componente estocástica Z p, <br />
(8)<br />
Zp,<br />
τ<br />
Zp,<br />
τ<br />
κ<br />
MINAG-ANA-DCPRH-AGUAS SUPERFICIALES Pág.258<br />
p, τκ<br />
Zp,<br />
τ.Z<br />
Zp,<br />
τ.<br />
Zp,<br />
τκ<br />
p, τκ<br />
S .S<br />
<br />
(9)<br />
Don<strong>de</strong>: k = retardo o <strong>de</strong>sfasaje.<br />
6° Cálculo <strong>de</strong> los límites <strong>de</strong> confianza (LC) <strong>de</strong>l correlograma. Al 95% <strong>de</strong><br />
probabilidad <strong>de</strong> confianza y 0. 05 <strong>de</strong> nivel <strong>de</strong> significancia, con <strong>la</strong><br />
siguiente ecuación:<br />
<br />
<br />
1 2<br />
. 96 n k 2 <br />
n k 1<br />
<br />
<br />
1<br />
1<br />
LC <br />
(10)<br />
<br />
<br />
<br />
Don<strong>de</strong>:<br />
n = Tamaño muestral.<br />
k = Retardo o <strong>de</strong>sfasaje.<br />
Los límites <strong>de</strong> confianza es igual para todos los mo<strong>de</strong>los Markovianos <strong>de</strong><br />
primer, segundo y tercer or<strong>de</strong>n.<br />
7° Probar si <strong>la</strong> componente estocástica Z p,<br />
es in<strong>de</strong>pendiente o no, para esto se<br />
aplica <strong>la</strong> prueba <strong>de</strong>l correlograma, con el siguiente criterio <strong>de</strong> <strong>de</strong>cisión:<br />
- Si al menos el 95% <strong>de</strong> los valores <strong>de</strong>l correlograma caen <strong>de</strong>ntro <strong>de</strong> los<br />
límites <strong>de</strong> confianza, entonces se acepta <strong>la</strong> Hp, no siendo necesario<br />
calcu<strong>la</strong>r un mo<strong>de</strong>lo <strong>de</strong> <strong>de</strong>pen<strong>de</strong>ncia para <strong>la</strong> serie. A este mo<strong>de</strong>lo se le<br />
<strong>de</strong>nomina Markov 0 según Sa<strong>la</strong>s <strong>la</strong> Cruz [1975] citado por Aliaga.<br />
- Si más <strong>de</strong>l 5% <strong>de</strong> los valores <strong>de</strong>l correlograma caen fuera <strong>de</strong> los límites<br />
<strong>de</strong> confianza, entonces se rechaza <strong>la</strong> hipótesis p<strong>la</strong>nteada Hp, vale <strong>de</strong>cir <strong>la</strong><br />
componente estocástica Z p,<br />
es <strong>de</strong>pendiente. En este caso es necesario
<strong>Estudio</strong> <strong>Hidrológico</strong> <strong>de</strong> <strong>la</strong>s <strong>Cuenca</strong>s Huancané y Suches 2010<br />
<strong>de</strong>terminar los parámetros <strong>de</strong> los mo<strong>de</strong>los Markovianos para <strong>de</strong>finir <strong>la</strong><br />
<strong>de</strong>pen<strong>de</strong>ncia <strong>de</strong> <strong>la</strong> componenete estocástica.<br />
8° Si Z p,<br />
es in<strong>de</strong>pendiente, no es necesario <strong>de</strong>sarrol<strong>la</strong>r ningún mo<strong>de</strong>lo <strong>de</strong><br />
<strong>de</strong>pen<strong>de</strong>ncia, y se <strong>de</strong>nomina mo<strong>de</strong>lo Markov 0.<br />
X M S .Z<br />
(11)<br />
p, τ<br />
τ<br />
τ<br />
p, τ<br />
Para que el mo<strong>de</strong>lo que<strong>de</strong> <strong>de</strong>finido, los valores obtenidos en el paso 4° se<br />
ajusta a diferentes funciones <strong>de</strong> distribución <strong>de</strong> probabilida<strong>de</strong>s con <strong>la</strong>s<br />
pruebas estadísticas <strong>de</strong> Chi-cuadrado, Smirnov-Kolmogorov, etc.<br />
9° Si Z p,<br />
es <strong>de</strong>pendiente, asumir que el mo<strong>de</strong>lo Markoviano <strong>de</strong> primer or<strong>de</strong>n<br />
es el a<strong>de</strong>cuado.<br />
10° Cálculo <strong>de</strong>l primer coeficiente <strong>de</strong> autorregresión 1,<br />
que es igual al primer<br />
coeficiente <strong>de</strong> autocorre<strong>la</strong>ción 1 1,<br />
estimado con <strong>la</strong> Ec.(9) para k =1.<br />
11° Cálculo <strong>de</strong>l componente estocástica in<strong>de</strong>pendiente (variable aleatoria<br />
in<strong>de</strong>pendiente) E p,<br />
, con <strong>la</strong> Ec.(4).<br />
12° Cálculo <strong>de</strong> los coeficientes <strong>de</strong> autocorre<strong>la</strong>ción para <strong>la</strong> componente<br />
estocástica in<strong>de</strong>pendiente (variable aleatoria in<strong>de</strong>pendiente), con <strong>la</strong> Ec.(9).<br />
13° Probar si <strong>la</strong> componente estocástica E p,<br />
es in<strong>de</strong>pendiente o no, para esto se<br />
aplica <strong>la</strong> prueba <strong>de</strong>l correlograma.<br />
14° Si E p,<br />
es in<strong>de</strong>pendiente, entonces el mo<strong>de</strong>lo Markoviano <strong>de</strong> primer or<strong>de</strong>n<br />
es bueno para representar <strong>la</strong> <strong>de</strong>pen<strong>de</strong>ncia <strong>de</strong> <strong>la</strong> serie analizada Z p,<br />
.<br />
En este caso <strong>de</strong> <strong>la</strong>s ecuaciones (1) y (3), se obtiene:<br />
X<br />
2 <br />
ρ E <br />
<br />
1<br />
2<br />
1<br />
<br />
M<br />
S<br />
ρ1Z<br />
p, -1<br />
1 <br />
(12)<br />
<br />
p,<br />
p,<br />
Para que el mo<strong>de</strong>lo que<strong>de</strong> <strong>de</strong>finido, los valores obtenidos en el paso 11° se<br />
ajusta a diferentes funciones <strong>de</strong> distribución <strong>de</strong> probabilida<strong>de</strong>s con <strong>la</strong>s<br />
pruebas estadísticas <strong>de</strong> Chi-cuadrado, Smirnov-Kolmogorov, etc.<br />
15° Si E p,<br />
es <strong>de</strong>pendiente, entonces el mo<strong>de</strong>lo Markoviano <strong>de</strong> primer or<strong>de</strong>n no<br />
es el a<strong>de</strong>cuado para esta serie y se p<strong>la</strong>ntea el mo<strong>de</strong>lo Markoviano <strong>de</strong><br />
segundo or<strong>de</strong>n.<br />
16° Cálculo <strong>de</strong> los parámetros <strong>de</strong>l mo<strong>de</strong>lo Markoviano <strong>de</strong> segundo or<strong>de</strong>n y a su<br />
componente estocástica E p,<br />
aplicar <strong>la</strong> prueba <strong>de</strong>l correlograma, es <strong>de</strong>cir<br />
repetir los pasos <strong>de</strong>l 10° en a<strong>de</strong><strong>la</strong>nte para el mo<strong>de</strong>lo Markoviano <strong>de</strong> segundo<br />
or<strong>de</strong>n.<br />
MINAG-ANA-DCPRH-AGUAS SUPERFICIALES Pág.259
<strong>Estudio</strong> <strong>Hidrológico</strong> <strong>de</strong> <strong>la</strong>s <strong>Cuenca</strong>s Huancané y Suches 2010<br />
17° Si E p,<br />
es in<strong>de</strong>pendiente, entonces el mo<strong>de</strong>lo Markoviano <strong>de</strong> segundo or<strong>de</strong>n<br />
es el a<strong>de</strong>cuado para representar <strong>la</strong> <strong>de</strong>pen<strong>de</strong>ncia <strong>de</strong> <strong>la</strong> serie analizada Z p,<br />
.<br />
Cuya ecuación es <strong>la</strong> siguiente:<br />
α Z α Z R E <br />
Xp, M<br />
S<br />
1 p, -1<br />
2 p, -2<br />
p, <br />
(13)<br />
R <br />
2<br />
1<br />
2 2<br />
1<br />
α α 2α α ρ<br />
1<br />
2<br />
1<br />
2<br />
1<br />
Para que el mo<strong>de</strong>lo que<strong>de</strong> <strong>de</strong>finido, los valores <strong>de</strong> <strong>la</strong> componente estocástica<br />
in<strong>de</strong>pendiente E p,<br />
se ajusta a diferentes funciones <strong>de</strong> distribución <strong>de</strong><br />
probabilida<strong>de</strong>s con <strong>la</strong>s pruebas estadísticas <strong>de</strong> Chi-cuadrado, Smirnov-<br />
Kolmogorov, etc.<br />
18° Si E p,<br />
es <strong>de</strong>pendiente, entonces el mo<strong>de</strong>lo Markoviano <strong>de</strong> segundo or<strong>de</strong>n<br />
no es el a<strong>de</strong>cuado y se p<strong>la</strong>ntea el mo<strong>de</strong>lo Markoviano <strong>de</strong> tercer or<strong>de</strong>n.<br />
19° Cálculo <strong>de</strong> los parámetros <strong>de</strong>l mo<strong>de</strong>lo Markoviano <strong>de</strong> tercer or<strong>de</strong>n y a su<br />
componente estocástica E p,<br />
aplicar <strong>la</strong> prueba <strong>de</strong>l correlograma, es <strong>de</strong>cir,<br />
repetir los pasos <strong>de</strong>l 10º en a<strong>de</strong><strong>la</strong>nte para el mo<strong>de</strong>lo Markoviano <strong>de</strong> tercer<br />
or<strong>de</strong>n.<br />
20° Si E p,<br />
es in<strong>de</strong>pendiente, entonces el mo<strong>de</strong>lo Markoviano <strong>de</strong> tercer or<strong>de</strong>n es<br />
el a<strong>de</strong>cuado para representar <strong>la</strong> <strong>de</strong>pen<strong>de</strong>ncia <strong>de</strong> <strong>la</strong> serie analizada Z p,<br />
.<br />
Cuya ecuación es <strong>la</strong> siguiente:<br />
α Z α Z α Z R.E <br />
X <br />
p,<br />
M<br />
S<br />
1 p, -1<br />
2 p, -2<br />
3 p, -3<br />
p, τ<br />
(14)<br />
R <br />
<br />
2<br />
1<br />
2 2 2<br />
1-<br />
α α α 2α α ρ 2α<br />
α ρ 2α<br />
α ρ<br />
1<br />
2<br />
3<br />
1<br />
2<br />
MINAG-ANA-DCPRH-AGUAS SUPERFICIALES Pág.260<br />
1<br />
1<br />
Para que el mo<strong>de</strong>lo que<strong>de</strong> <strong>de</strong>finido, los valores <strong>de</strong> <strong>la</strong> componente estocástica<br />
in<strong>de</strong>pendiente E p,<br />
se ajusta a diferentes funciones <strong>de</strong> distribución <strong>de</strong><br />
probabilida<strong>de</strong>s con <strong>la</strong>s pruebas estadísticas <strong>de</strong> Chi-cuadrado, Smirnov-<br />
Kolmogorov, etc, así sucesivamente.<br />
7.7.2 Mo<strong>de</strong><strong>la</strong>miento estocástico <strong>de</strong> series mensuales<br />
A.- Mo<strong>de</strong><strong>la</strong>miento estocástico <strong>de</strong> caudales medios mensuales – Subcuencas <strong>de</strong>l <strong>río</strong><br />
Guanaco e Yaputira<br />
Aplicando <strong>la</strong> metodología <strong>de</strong>scrita en los ítems anteriores, el mo<strong>de</strong><strong>la</strong>miento estocástico<br />
para <strong>la</strong>s subcuencas <strong>de</strong>l <strong>río</strong> Guanaco e Yaputira, se ha realizado, utilizando <strong>la</strong> información<br />
<strong>de</strong> caudales medios generados con el mo<strong>de</strong>lo hidrológico <strong>de</strong> Lutz Scholz. Los resultados<br />
<strong>de</strong>l mo<strong>de</strong><strong>la</strong>miento se muestran en los Cuadros Nº 7.24 al 7.26 y <strong>la</strong>s Figuras Nº 7.24 y 7.25.<br />
3<br />
2<br />
2<br />
3<br />
1
<strong>Estudio</strong> <strong>Hidrológico</strong> <strong>de</strong> <strong>la</strong>s <strong>Cuenca</strong>s Huancané y Suches 2010<br />
Para <strong>la</strong> generación <strong>de</strong> series sintéticas o hidrológicas, se requiere mucho <strong>de</strong>l conocimiento<br />
<strong>de</strong>l tipo <strong>de</strong> mo<strong>de</strong>lo estocástico Markoviano y así como <strong>de</strong> sus parámetros respectivos, vale<br />
<strong>de</strong>cir seleccionar el mo<strong>de</strong>lo Markoviano representativo <strong>de</strong> un or<strong>de</strong>n a<strong>de</strong>cuado para<br />
representar <strong>la</strong> <strong>de</strong>pen<strong>de</strong>ncia <strong>de</strong> <strong>la</strong> componente estocástica <strong>de</strong> <strong>la</strong> serie analizada y sus<br />
respectivos parámetros.<br />
Los correlogramas <strong>de</strong> <strong>la</strong> serie residual <strong>de</strong>pendiente, <strong>de</strong> <strong>la</strong> serie in<strong>de</strong>pendiente resultante <strong>de</strong>l<br />
mo<strong>de</strong>lo <strong>de</strong> primer, segundo y tercer or<strong>de</strong>n, con sus respectivos límites <strong>de</strong> confianza al 95%<br />
<strong>de</strong> probabilidad, para cada subcuenca <strong>de</strong> interés, se dan en los Cuadros Nº 7.24 y 7.25.<br />
Cuadro Nº 7.24 Coeficientes <strong>de</strong> autocorre<strong>la</strong>ción y límites <strong>de</strong> confianza <strong>de</strong> <strong>la</strong> componente<br />
estocástica <strong>de</strong> caudales medios mensuales<br />
Río Guanaco – Embalse Cal<strong>la</strong>tomaza<br />
Desfasaje<br />
k<br />
Coeficiente <strong>de</strong> autocorre<strong>la</strong>ción <br />
Límites <strong>de</strong> confianza Coeficientes <strong>de</strong> autocorre<strong>la</strong>ción <br />
LCI LCS Markov 0 Markov 1 Markov 2 Markov 3<br />
1 -0.0786 0.0755 0.3942 -0.0028 0.1338 0.0019<br />
2 -0.0787 0.0756 0.1614 -0.0135 0.0367 -0.0029<br />
3 -0.0787 0.0756 0.1124 0.0375 0.0545 -0.0145<br />
4 -0.0788 0.0757 0.0866 0.0121 0.0317 -0.0091<br />
5 -0.0789 0.0757 0.1155 0.0713 0.0856 0.0698<br />
6 -0.0789 0.0758 0.1001 0.0368 0.0707 0.0308<br />
7 -0.0790 0.0759 0.0990 0.0693 0.0720 0.0689<br />
8 -0.0790 0.0759 0.0400 -0.0306 -0.0136 -0.0359<br />
9 -0.0791 0.0760 0.0826 0.0549 0.0611 0.0495<br />
10 -0.0792 0.0760 0.0833 0.0340 0.0456 0.0298<br />
11 -0.0792 0.0761 0.0877 0.0228 0.0420 0.0261<br />
12 -0.0793 0.0761 0.1245 0.0868 0.1007 0.0818<br />
0.40<br />
0.35<br />
0.30<br />
0.25<br />
0.20<br />
0.15<br />
0.10<br />
0.05<br />
0.00<br />
-0.05<br />
-0.10<br />
Figura Nº 7.24 Correlogramas <strong>de</strong>l mo<strong>de</strong>lo Markoviano – Río Guanaco<br />
0 1 2 3 4 5 6 7 8 9 10 11 12 13<br />
Desfasaje (k)<br />
LCS LCI<br />
Markov 0 Markov 1<br />
Markov 2 Markov 3<br />
MINAG-ANA-DCPRH-AGUAS SUPERFICIALES Pág.261
<strong>Estudio</strong> <strong>Hidrológico</strong> <strong>de</strong> <strong>la</strong>s <strong>Cuenca</strong>s Huancané y Suches 2010<br />
Cuadro Nº 7.25 Coeficientes <strong>de</strong> autocorre<strong>la</strong>ción y límites <strong>de</strong> confianza <strong>de</strong> <strong>la</strong> componente<br />
estocástica <strong>de</strong> caudales medios mensuales<br />
Río Yaputira – Embalse Yaputira<br />
Desfasaje<br />
k<br />
Coeficiente <strong>de</strong> autocorre<strong>la</strong>ción <br />
Límites <strong>de</strong> confianza Coeficientes <strong>de</strong> autocorre<strong>la</strong>ción <br />
LCI LCS Markov 0 Markov 1 Markov 2 Markov 3<br />
1 -0.0786 0.0755 0.3701 -0.0075 0.1060 0.0016<br />
2 -0.0787 0.0756 0.1552 0.0012 0.0264 -0.0102<br />
3 -0.0787 0.0756 0.1088 0.0354 0.0511 -0.0209<br />
4 -0.0788 0.0757 0.0947 0.0288 0.0369 0.0075<br />
5 -0.0789 0.0757 0.1199 0.0753 0.0862 0.0686<br />
6 -0.0789 0.0758 0.0996 0.0351 0.0616 0.0305<br />
7 -0.0790 0.0759 0.1044 0.0698 0.0721 0.0633<br />
8 -0.0790 0.0759 0.0589 -0.0169 0.0053 -0.0255<br />
9 -0.0791 0.0760 0.1143 0.0679 0.0722 0.0626<br />
10 -0.0792 0.0760 0.1332 0.0488 0.0709 0.0434<br />
11 -0.0792 0.0761 0.1793 0.1151 0.1124 0.1148<br />
12 -0.0793 0.0761 0.1474 0.0673 0.0820 0.0598<br />
0.40<br />
0.35<br />
0.30<br />
0.25<br />
0.20<br />
0.15<br />
0.10<br />
0.05<br />
0.00<br />
-0.05<br />
-0.10<br />
Figura Nº 7.25 Correlogramas <strong>de</strong>l mo<strong>de</strong>lo Markoviano – Río Yaputira<br />
0 1 2 3 4 5 6 7 8 9 10 11 12 13<br />
Desfasaje (k)<br />
LCS LCI<br />
Markov 0 Markov 1<br />
Markov 2 Markov 3<br />
De <strong>la</strong> prueba <strong>de</strong>l correlograma se <strong>de</strong>spren<strong>de</strong> que <strong>la</strong> componente estocástica Z p,<br />
es<br />
<strong>de</strong>pendiente y que el mo<strong>de</strong>lo más a<strong>de</strong>cuado para representar <strong>la</strong> componente estocástica<br />
<strong>de</strong>pendiente <strong>de</strong> los <strong>río</strong>s Guanaco e Yaputira es el mo<strong>de</strong>lo MARKOVIANO DE PRIMER<br />
ORDEN. Observando el correlograma, el 95% <strong>de</strong> los valores <strong>de</strong>l coeficiente <strong>de</strong><br />
autocorre<strong>la</strong>ción caen <strong>de</strong>ntro <strong>de</strong> los límites <strong>de</strong> confianza, basándose en los criterios <strong>de</strong> <strong>la</strong><br />
prueba <strong>de</strong>l correlograma.<br />
MINAG-ANA-DCPRH-AGUAS SUPERFICIALES Pág.262
<strong>Estudio</strong> <strong>Hidrológico</strong> <strong>de</strong> <strong>la</strong>s <strong>Cuenca</strong>s Huancané y Suches 2010<br />
Cuadro Nº 7.26 Valores <strong>de</strong>l coeficiente <strong>de</strong> autocorre<strong>la</strong>ción y autorregresión<br />
Subcuenca<br />
Mo<strong>de</strong>lo Coeficiente <strong>de</strong><br />
Coeficiente <strong>de</strong><br />
Coeficiente <strong>de</strong><br />
autocorre<strong>la</strong>ción<br />
autocorre<strong>la</strong>ción<br />
autorregresión k<br />
k<br />
Río Guanaco<br />
Río Yaputira<br />
1 = 0.3942 1 = 0.3701<br />
Markov 0 2 = 0.1614 2 = 0.1552<br />
3 = 0.1124 3 = 0.1088<br />
Markov 1 1 = 0.3942 1 = 0.3701<br />
Markov 2<br />
1 = 0.3914<br />
2 = 0.0071<br />
1 = 0.3623<br />
2 = 0.0211<br />
1 = 0.3910 1 = 0.3612<br />
Markov 3<br />
2 = -0.0144 2 = 0.0023<br />
3 = 0.0550 3 = 0.0519<br />
MINAG-ANA-DCPRH-AGUAS SUPERFICIALES Pág.263<br />
k<br />
Coeficiente <strong>de</strong><br />
autorregresión k<br />
B.- Ajuste a una función <strong>de</strong> distribución <strong>de</strong> probabilida<strong>de</strong>s teóricas <strong>de</strong> <strong>la</strong><br />
componente estocástica in<strong>de</strong>pendiente<br />
Despues <strong>de</strong> haber seleccionado el mo<strong>de</strong>lo <strong>de</strong> <strong>de</strong>pen<strong>de</strong>ncia, se <strong>de</strong>be buscar el tipo <strong>de</strong><br />
distribución <strong>de</strong> probabilidad que sigue <strong>la</strong> compnente estocástica in<strong>de</strong>pendiente Ep, , con el<br />
cual se <strong>de</strong>fine el mo<strong>de</strong>lo matemático <strong>de</strong> <strong>la</strong> serie hidrológica estudiada.<br />
En el presente se ajusta a <strong>la</strong> distribuciones <strong>de</strong> probabilidad normal y lognormal <strong>de</strong> 3<br />
parámetros.<br />
1º Distribución empírica o experimental<br />
Se ha realizado cálculo <strong>de</strong> <strong>la</strong> distribución <strong>de</strong> probabilidad empírica <strong>de</strong> datos<br />
agrupados en intervalos <strong>de</strong> c<strong>la</strong>se aplicados a <strong>la</strong> componente estocástica in<strong>de</strong>pendiente<br />
<strong>de</strong> los <strong>río</strong>s Guanaco e Yaputira.<br />
Para el análisis <strong>de</strong> <strong>la</strong> distribución <strong>de</strong> probabilidad empírica <strong>de</strong> <strong>la</strong> componente<br />
estocástica in<strong>de</strong>pendiente Ep,, <strong>de</strong>l Mo<strong>de</strong>lo Markoviano <strong>de</strong> Primer Or<strong>de</strong>n, se obtuvo<br />
10 intervalos <strong>de</strong> c<strong>la</strong>se para agrupar los datos en estudio, con <strong>la</strong> siguiente fórmu<strong>la</strong>:<br />
NC 11.33<br />
Lnn<br />
Don<strong>de</strong>: n = número <strong>de</strong> datos <strong>de</strong> <strong>la</strong> componente estocástica in<strong>de</strong>pendiente Ep,,<br />
en este caso son 647 valores.<br />
El análisis <strong>de</strong> <strong>la</strong> distribución <strong>de</strong> probabilidad empírica <strong>de</strong> <strong>la</strong> componente estocástica<br />
in<strong>de</strong>pendiente <strong>de</strong>l Mo<strong>de</strong>lo Markoviano <strong>de</strong> Primer Or<strong>de</strong>n <strong>de</strong> los <strong>río</strong>s Guanaco e<br />
Yaputira, se muestran en los Cuadros Nº 7.27 y 7.28.
<strong>Estudio</strong> <strong>Hidrológico</strong> <strong>de</strong> <strong>la</strong>s <strong>Cuenca</strong>s Huancané y Suches 2010<br />
Cuadro Nº 7.27 Distribución <strong>de</strong> probabilidad empírica o experimental <strong>de</strong> <strong>la</strong> componente estocástica<br />
in<strong>de</strong>pendiente – Río Guanaco<br />
Intervalos<br />
NC<br />
Límites <strong>de</strong> C<strong>la</strong>se<br />
LCI 1 LCS 2<br />
Marcas <strong>de</strong><br />
C<strong>la</strong>se<br />
Frecuencia<br />
Absoluta<br />
1 -3.3156 -2.4218 -2.8687 2 0.00309 0.0031 0.00346 0.0031<br />
2 -2.4218 -1.5279 -1.9749 8 0.01236 0.0155 0.01383 0.0155<br />
3 -1.5279 -0.6341 -1.0810 127 0.19629 0.2117 0.21960 0.2117<br />
4 -0.6341 0.2598 -0.1871 339 0.52396 0.7357 0.58617 0.7357<br />
5 0.2598 1.1537 0.7067 102 0.15765 0.8934 0.17637 0.8934<br />
6 1.1537 2.0476 1.6006 36 0.05564 0.9490 0.06225 0.9490<br />
7 2.0476 2.9414 2.4945 20 0.03091 0.9799 0.03458 0.9799<br />
8 2.9414 3.8353 3.3884 10 0.01546 0.9954 0.01729 0.9954<br />
9 3.8353 4.7292 4.2822 0 0.00000 0.9954 0.00000 0.9954<br />
10 4.7292 5.6230 5.1761 3 0.00464 1.0000 0.00519 1.0000<br />
10 647<br />
Frecuencia<br />
Re<strong>la</strong>tiva<br />
Frecuencia<br />
Re<strong>la</strong>tiva<br />
Acumu<strong>la</strong>da<br />
Función<br />
Densidad<br />
Valor mínimo <strong>de</strong> <strong>la</strong> serie Ep, = -2.8687 Rango <strong>de</strong> <strong>la</strong> muestra: R =<br />
8.0448<br />
Valor máximo <strong>de</strong> <strong>la</strong> serie Ep, = 5.1761 Amplitud <strong>de</strong> cada intervalo: DX = 0.89387<br />
Distribución<br />
Acumu<strong>la</strong>da<br />
Cuadro Nº 7.28 Distribución <strong>de</strong> probabilidad empírica o experimental <strong>de</strong> <strong>la</strong> componente estocástica<br />
in<strong>de</strong>pendiente – Río Yaputira<br />
Intervalos<br />
NC<br />
Límites <strong>de</strong> C<strong>la</strong>se<br />
LCI 1 LCS 2<br />
Marcas <strong>de</strong><br />
C<strong>la</strong>se<br />
Frecuencia<br />
Absoluta<br />
1 -2.3898 -1.5522 -1.9710 12 0.01855 0.0185 0.0221 0.0185<br />
2 -1.5522 -0.7146 -1.1334 132 0.20402 0.2226 0.2436 0.2226<br />
3 -0.7146 0.1230 -0.2958 276 0.42658 0.6491 0.5093 0.6491<br />
4 0.1230 0.9606 0.5418 136 0.21020 0.8594 0.2510 0.8594<br />
5 0.9606 1.7982 1.3794 55 0.08501 0.9444 0.1015 0.9444<br />
6 1.7982 2.6358 2.2170 22 0.03400 0.9784 0.0406 0.9784<br />
7 2.6358 3.4734 3.0546 8 0.01236 0.9907 0.0148 0.9907<br />
8 3.4734 4.3110 3.8922 5 0.00773 0.9985 0.0092 0.9985<br />
9 4.3110 5.1486 4.7298 0 0.00000 0.9985 0.0000 0.9985<br />
10 5.1486 5.9862 5.5674 1 0.00155 1.0000 0.0018 1.0000<br />
10 647<br />
Frecuencia<br />
Re<strong>la</strong>tiva<br />
Frecuencia<br />
Re<strong>la</strong>tiva<br />
Acumu<strong>la</strong>da<br />
Función<br />
Densidad<br />
Valor mínimo <strong>de</strong> <strong>la</strong> serie Ep, = -1.9710 Rango <strong>de</strong> <strong>la</strong> muestra: R =<br />
7.5384<br />
Valor máximo <strong>de</strong> <strong>la</strong> serie Ep, = 5.5674 Amplitud <strong>de</strong> cada intervalo: DX =<br />
0.8376<br />
2º Distribución Normal y LogNormal <strong>de</strong> 3 parámetros<br />
Distribución<br />
Acumu<strong>la</strong>da<br />
Estimación <strong>de</strong> los parámetros <strong>de</strong> <strong>la</strong>s funciones <strong>de</strong> distribución <strong>de</strong> probabilida<strong>de</strong>s <strong>de</strong> <strong>la</strong><br />
componente estocástica in<strong>de</strong>pendiente <strong>de</strong> los <strong>río</strong>s Guanaco e Yaputira, se ha utilizado el<br />
método <strong>de</strong> momentos para <strong>la</strong> distribución normal y el método <strong>de</strong> máxima verosimilitud<br />
para <strong>la</strong> distribucion <strong>de</strong> probabilidad lognormal <strong>de</strong> 3 parámetros.<br />
A continuación se tiene los parámetros <strong>de</strong> cada función <strong>de</strong> distribución <strong>de</strong> probabilida<strong>de</strong>s:<br />
Río Guanaco<br />
Distribución Normal: AN = 0.0008<br />
BN = 0.9917<br />
MINAG-ANA-DCPRH-AGUAS SUPERFICIALES Pág.264
<strong>Estudio</strong> <strong>Hidrológico</strong> <strong>de</strong> <strong>la</strong>s <strong>Cuenca</strong>s Huancané y Suches 2010<br />
Distribución LogNormal <strong>de</strong> 3 parámetros: AL = 3.2192<br />
BL = 0.0385<br />
C = -25.0250<br />
Río Yaputira<br />
Distribución Normal: AN = 0.0008<br />
BN = 0.9918<br />
Distribución LogNormal <strong>de</strong> 3 parámetros: AL = 3.5046<br />
BL = 0.0292<br />
C = -33.2812<br />
En los Cuadros Nº 7.29 y 7.30 se muestran <strong>la</strong>s funciones <strong>de</strong> <strong>de</strong>nsidad y acumu<strong>la</strong>da <strong>de</strong> <strong>la</strong>s<br />
distribuciones <strong>de</strong> probabilidad <strong>de</strong> <strong>la</strong> componente estocástica in<strong>de</strong>pendiente <strong>de</strong>l Mo<strong>de</strong>lo<br />
Markoviano <strong>de</strong> Primer Or<strong>de</strong>n <strong>de</strong> los <strong>río</strong>s Guanaco e Yaputira.<br />
Cuadro Nº 7.29 Función <strong>de</strong> <strong>de</strong>nsidad y acumu<strong>la</strong>da <strong>de</strong> <strong>la</strong> distribución <strong>de</strong> probabilida<strong>de</strong>s<br />
<strong>de</strong> <strong>la</strong> componente estocástica in<strong>de</strong>pendiente Ep, – Río Guanaco<br />
NORMAL LOG-NORMAL DE 3 PARAMETROS<br />
NC NC<br />
Marcas <strong>de</strong><br />
C<strong>la</strong>se<br />
Función <strong>de</strong><br />
Densidad<br />
Distribución<br />
Acumu<strong>la</strong>da<br />
Marcas <strong>de</strong><br />
C<strong>la</strong>se<br />
Función <strong>de</strong><br />
Densidad<br />
Distribución<br />
Acumu<strong>la</strong>da<br />
1 -2.8687 0.0061 0.0027 1 -2.8687 0.0033 0.0015<br />
2 -1.9749 0.0553 0.0302 2 -1.9749 0.0478 0.0243<br />
3 -1.0810 0.2219 0.1541 3 -1.0810 0.2287 0.1479<br />
4 -0.1871 0.3951 0.4298 4 -0.1871 0.4107 0.4336<br />
5 0.7067 0.3122 0.7460 5 0.7067 0.3060 0.7540<br />
6 1.6006 0.1095 0.9345 6 1.6006 0.1034 0.9370<br />
7 2.4945 0.0170 0.9910 7 2.4945 0.0172 0.9909<br />
8 3.3884 0.0012 0.9992 8 3.3884 0.0015 0.9992<br />
9 4.2822 0.0000 0.9997 9 4.2822 0.0001 0.9999<br />
10 5.1761 0.0000 0.9997 10 5.1761 0.0000 0.9999<br />
Cuadro Nº 7.30 Función <strong>de</strong> <strong>de</strong>nsidad y acumu<strong>la</strong>da <strong>de</strong> <strong>la</strong> distribución <strong>de</strong> probabilida<strong>de</strong>s<br />
<strong>de</strong> <strong>la</strong> componente estocástica in<strong>de</strong>pendiente Ep, – Río Yaputira<br />
NORMAL<br />
LOG-NORMAL DE 3 PARAMETROS<br />
NC Marcas <strong>de</strong> Función <strong>de</strong> Distribución<br />
NC Marcas <strong>de</strong> Función <strong>de</strong> Distribución<br />
C<strong>la</strong>se Densidad Acumu<strong>la</strong>da<br />
C<strong>la</strong>se Densidad Acumu<strong>la</strong>da<br />
1 -1.9710 0.0557 0.0233 1 -1.9710 0.0504 0.0211<br />
2 -1.1334 0.2092 0.1343 2 -1.1334 0.2136 0.1317<br />
3 -0.2958 0.3847 0.3830 3 -0.2958 0.3969 0.3873<br />
4 0.5418 0.3466 0.6893 4 0.5418 0.3441 0.6976<br />
5 1.3794 0.1531 0.8985 5 1.3794 0.1471 0.9033<br />
6 2.2170 0.0331 0.9765 6 2.2170 0.0326 0.9786<br />
7 3.0546 0.0035 0.9919 7 3.0546 0.0039 0.9939<br />
8 3.8922 0.0002 0.9934 8 3.8922 0.0003 0.9956<br />
9 4.7298 0.0000 0.9935 9 4.7298 0.0000 0.9957<br />
10 5.5674 0.0000 0.9935 10 5.5674 0.0000 0.9957<br />
3º Pruebas <strong>de</strong> ajuste<br />
Ajuste gráfico<br />
El ajuste gráfico se ha realizado comparando gráficamente <strong>la</strong> función <strong>de</strong> <strong>de</strong>nsidad y<br />
acumu<strong>la</strong>da <strong>de</strong> <strong>la</strong> frecuencia empírica con <strong>la</strong> función <strong>de</strong> <strong>de</strong>nsidad y acumu<strong>la</strong>da <strong>de</strong> <strong>la</strong><br />
frecuencia teórica. Tal como se muestra en <strong>la</strong>s Figuras Nº 7.26 al 7.29.<br />
MINAG-ANA-DCPRH-AGUAS SUPERFICIALES Pág.265
<strong>Estudio</strong> <strong>Hidrológico</strong> <strong>de</strong> <strong>la</strong>s <strong>Cuenca</strong>s Huancané y Suches 2010<br />
Figura Nº 7.26 Función <strong>de</strong> <strong>de</strong>nsidad <strong>de</strong> <strong>la</strong> componente estocástica in<strong>de</strong>pendiente Ep, – Río Guanaco<br />
Probabilidad Ep,<br />
0.70<br />
0.60<br />
0.50<br />
0.40<br />
0.30<br />
0.20<br />
0.10<br />
0.00<br />
-3.00 -2.00 -1.00 0.00 1.00 2.00 3.00 4.00 5.00 6.00<br />
Marcas <strong>de</strong> C<strong>la</strong>se Ep,<br />
Empírica<br />
Normal<br />
LogNormal 3 P.<br />
Figura Nº 7.27 Función <strong>de</strong> distribución acumu<strong>la</strong>da <strong>de</strong> probabilida<strong>de</strong>s <strong>de</strong> <strong>la</strong> componente<br />
estocástica in<strong>de</strong>pendiente Ep, – Río Guanaco<br />
Probabilidad Ep,<br />
1.10<br />
1.00<br />
0.90<br />
0.80<br />
0.70<br />
0.60<br />
0.50<br />
0.40<br />
0.30<br />
0.20<br />
0.10<br />
0.00<br />
-4.00 -3.00 -2.00 -1.00 0.00 1.00 2.00 3.00 4.00 5.00 6.00<br />
Marcas <strong>de</strong> C<strong>la</strong>se Ep,<br />
Empírica<br />
MINAG-ANA-DCPRH-AGUAS SUPERFICIALES Pág.266<br />
Normal<br />
LogNormal 3 P.
<strong>Estudio</strong> <strong>Hidrológico</strong> <strong>de</strong> <strong>la</strong>s <strong>Cuenca</strong>s Huancané y Suches 2010<br />
Figura Nº 7.28 Función <strong>de</strong> <strong>de</strong>nsidad <strong>de</strong> <strong>la</strong> componente estocástica in<strong>de</strong>pendiente Ep, – Río Yaputira<br />
Probabilidad Ep,<br />
0.60<br />
0.50<br />
0.40<br />
0.30<br />
0.20<br />
0.10<br />
0.00<br />
-3.00 -2.00 -1.00 0.00 1.00 2.00 3.00 4.00 5.00 6.00<br />
Marcas <strong>de</strong> C<strong>la</strong>se Ep,<br />
Empírica<br />
Normal<br />
LogNormal 3 P.<br />
Figura Nº 7.29 Función <strong>de</strong> distribución acumu<strong>la</strong>da <strong>de</strong> probabilida<strong>de</strong>s <strong>de</strong> <strong>la</strong> componente<br />
estocástica in<strong>de</strong>pendiente Ep, – Río Yaputira<br />
Probabilidad Ep,<br />
1.10<br />
1.00<br />
0.90<br />
0.80<br />
0.70<br />
0.60<br />
0.50<br />
0.40<br />
0.30<br />
0.20<br />
0.10<br />
0.00<br />
-3.00 -2.00 -1.00 0.00 1.00 2.00 3.00 4.00 5.00 6.00<br />
Marcas <strong>de</strong> C<strong>la</strong>se Ep,<br />
Empírica<br />
MINAG-ANA-DCPRH-AGUAS SUPERFICIALES Pág.267<br />
Normal<br />
LogNormal 3 P.
<strong>Estudio</strong> <strong>Hidrológico</strong> <strong>de</strong> <strong>la</strong>s <strong>Cuenca</strong>s Huancané y Suches 2010<br />
Prueba Chi-cuadrado<br />
La prueba <strong>de</strong> Chi-cuadrado es <strong>la</strong> más comunmente usada para verificar <strong>la</strong> bondad<br />
<strong>de</strong> ajuste <strong>de</strong> <strong>la</strong> distribución empírica a una distribución teórica conocida.<br />
En el presente estudio <strong>la</strong> fórmu<strong>la</strong> utilizada es <strong>la</strong> acuación computacional <strong>de</strong><br />
Markovic (1965) citado por Aliaga (1985).<br />
2<br />
NC n<br />
N<br />
n i1<br />
2<br />
i <br />
n<br />
Don<strong>de</strong>:<br />
NC = Número <strong>de</strong> intervalos <strong>de</strong> c<strong>la</strong>se.<br />
N i = Número <strong>de</strong> observaciones que caen <strong>de</strong>ntro <strong>de</strong> los límites <strong>de</strong><br />
c<strong>la</strong>se ajustadas <strong>de</strong>l intervalo i.<br />
n = Número total <strong>de</strong> observaciones <strong>de</strong> <strong>la</strong> muestra.<br />
i = 1,2,…….., NC.<br />
Cálculo <strong>de</strong> Chi-cuadrado<br />
= 0.05<br />
G.L. = NC - 1 - h<br />
2<br />
t <strong>de</strong> <strong>la</strong>s tab<strong>la</strong>s con:<br />
Don<strong>de</strong>:<br />
= nivel <strong>de</strong> significancia.<br />
G.L. = grados <strong>de</strong> libertad.<br />
h = número <strong>de</strong> parámetros a estimarse.<br />
h = 2 para <strong>la</strong> distribución normal.<br />
h = 3 para <strong>la</strong> distribución log-normal <strong>de</strong> 3 parámetros.<br />
Criterio <strong>de</strong> <strong>de</strong>cisión se fundamenta en <strong>la</strong> comparación <strong>de</strong>l valor calcu<strong>la</strong>do <strong>de</strong> Chicuadrado<br />
con el valor tabu<strong>la</strong>r encontrado <strong>de</strong>s<strong>de</strong> <strong>la</strong> tab<strong>la</strong>, esto es:<br />
- Si Chi-cuadrado calcu<strong>la</strong>do es menor o igual que el valor tabu<strong>la</strong>r, entonces el<br />
ajuste es bueno al nivel <strong>de</strong> significación seleccionado.<br />
<br />
2<br />
c<br />
<br />
2<br />
t<br />
- Si Chi-cuadrado calcu<strong>la</strong>do es mayor que el valor tabu<strong>la</strong>r, entonces el ajuste<br />
es malo, siendo necesario probar con otra función <strong>de</strong> distribución teórica.<br />
<br />
2<br />
c<br />
<br />
2<br />
t<br />
Los resultados <strong>de</strong> ajuste <strong>de</strong> chi-cuadrado <strong>de</strong> <strong>la</strong> componente estocástica in<strong>de</strong>pendiente<br />
a <strong>la</strong> distribución normal y lognormal <strong>de</strong> 3 parámetros <strong>de</strong> los <strong>río</strong>s Guanaco e Yaputira,<br />
se muestran en los Cuadros Nº 7.31 al 7.34.<br />
MINAG-ANA-DCPRH-AGUAS SUPERFICIALES Pág.268<br />
(1)
<strong>Estudio</strong> <strong>Hidrológico</strong> <strong>de</strong> <strong>la</strong>s <strong>Cuenca</strong>s Huancané y Suches 2010<br />
Intervalo<br />
No<br />
Cuadro Nº 7.31 Prueba <strong>de</strong> ajuste <strong>de</strong> Chi-cuadrado 2 – Distribución normal<br />
<strong>de</strong> <strong>la</strong> componente estocástica in<strong>de</strong>pendiente – Río Guanaco<br />
1 0.20000 0.20000 -0.84162 < -0.8338 3 9<br />
2 0.20000 0.40000 -0.25335 -0.8338 -0.2504 0 0<br />
3 0.20000 0.60000 0.25335 -0.2504 0.2520 1 1<br />
4 0.20000 0.80000 0.84162 0.2520 0.8354 1 1<br />
5 0.20000 1.00000 5.61200 0.8354 5.5662 5 25<br />
5 Sumatoria: 10 36<br />
Intervalo<br />
No<br />
P i Pacum. Z<br />
Límites <strong>de</strong> C<strong>la</strong>se<br />
Chi-cuadrado calcu<strong>la</strong>do Chi-cuadrado tabu<strong>la</strong>r Comparación<br />
MINAG-ANA-DCPRH-AGUAS SUPERFICIALES Pág.269<br />
LC I<br />
LC S<br />
2<br />
C = 8.0000 2<br />
t = 5.9915 2<br />
C > 2<br />
t<br />
Cuadro Nº 7.32 Prueba <strong>de</strong> ajuste <strong>de</strong> Chi-cuadrado 2 – Distribución normal<br />
<strong>de</strong> <strong>la</strong> componente estocástica in<strong>de</strong>pendiente – Río Yaputira<br />
P i Pacum. Z<br />
Límites <strong>de</strong> C<strong>la</strong>se<br />
LC I<br />
LC S<br />
N i<br />
2<br />
Ni<br />
No se ajusta<br />
1 0.2000 0.2000 -0.8416 < -0.8339 2 4<br />
2 0.2000 0.4000 -0.2533 -0.8339 -0.2505 1 1<br />
3 0.2000 0.6000 0.2533 -0.2505 0.2521 0 0<br />
4 0.2000 0.8000 0.8416 0.2521 0.8355 1 1<br />
5 0.2000 1.0000 5.9978 0.8355 5.9494 6 36<br />
5 Sumatoria: 10 42<br />
Chi-cuadrado calcu<strong>la</strong>do Chi-cuadrado tabu<strong>la</strong>r Comparación<br />
2<br />
C = 11.0000 2<br />
t = 5.9915 2<br />
C > 2<br />
t<br />
N i<br />
2<br />
Ni<br />
No se ajusta<br />
Cuadro Nº 7.33 Prueba <strong>de</strong> ajuste <strong>de</strong> Chi-cuadrado 2 – Distribución lognormal 3 p.<br />
<strong>de</strong> <strong>la</strong> componente estocástica in<strong>de</strong>pendiente – Río Guanaco<br />
Intervalo<br />
No<br />
P i Pacum. Z<br />
Límites <strong>de</strong> C<strong>la</strong>se<br />
1 0.2000 0.2000 -0.8416 < -0.8142 3 9<br />
2 0.2000 0.4000 -0.2533 -0.8142 -0.2596 0 0<br />
3 0.2000 0.6000 0.2533 -0.2596 0.2282 1 1<br />
4 0.2000 0.8000 0.8416 0.2282 0.8067 1 1<br />
5 0.2000 1.0000 5.1993 0.8067 5.5253 5 25<br />
5 Sumatoria: 10 36<br />
Chi-cuadrado calcu<strong>la</strong>do Chi-cuadrado tabu<strong>la</strong>r Comparación<br />
LC I<br />
LC S<br />
2<br />
C = 8.000 2<br />
t = 3.8415 2<br />
C > 2<br />
t<br />
N i<br />
2<br />
Ni<br />
No se ajusta<br />
Cuadro Nº 7.34 Prueba <strong>de</strong> ajuste <strong>de</strong> Chi-cuadrado 2 – Distribución lognormal 3 p.<br />
<strong>de</strong> <strong>la</strong> componente estocástica in<strong>de</strong>pendiente – Río Yaputira<br />
Intervalo<br />
No<br />
P i Pacum. Z<br />
Límites <strong>de</strong> C<strong>la</strong>se<br />
1 0.2000 0.2000 -0.8416 < -0.8207 2 4<br />
2 0.2000 0.4000 -0.2533 -0.8207 -0.2583 1 1<br />
3 0.2000 0.6000 0.2533 -0.2583 0.2340 0 0<br />
4 0.2000 0.8000 0.8416 0.2340 0.8146 1 1<br />
5 0.2000 1.0000 5.6120 0.8146 5.9107 6 36<br />
5 Sumatoria: 10 42<br />
Chi-cuadrado calcu<strong>la</strong>do Chi-cuadrado tabu<strong>la</strong>r Comparación<br />
LC I<br />
LC S<br />
2<br />
C = 11.000 2<br />
t = 3.8415 2<br />
C > 2<br />
t<br />
N i<br />
2<br />
Ni<br />
No se ajusta
<strong>Estudio</strong> <strong>Hidrológico</strong> <strong>de</strong> <strong>la</strong>s <strong>Cuenca</strong>s Huancané y Suches 2010<br />
Prueba Smirnov-Kolmogorov<br />
La prueba <strong>de</strong> ajuste <strong>de</strong> Smirnov-Kolmogorov consiste en comparar <strong>la</strong>s diferencias<br />
existentes entre <strong>la</strong> probabilidad <strong>de</strong> los datos agrupados y <strong>la</strong> probabilidad ajustada,<br />
tomando <strong>la</strong> distancia más gran<strong>de</strong> entre el valor observado y <strong>la</strong> recta <strong>de</strong>l mo<strong>de</strong>lo, es<br />
<strong>de</strong>cir:<br />
E PE<br />
D máx F <br />
(1)<br />
Don<strong>de</strong>:<br />
D = Estadístico <strong>de</strong> Smirnov-Kolmogorov, cuyo valor es igual a <strong>la</strong><br />
diferencia máxima existente entre <strong>la</strong> probabilidad ajustada y <strong>la</strong><br />
probabilidad empírica.<br />
F(E) = Probabilidad <strong>de</strong> <strong>la</strong> distribución <strong>de</strong> ajuste o teórica.<br />
P(E) = Probabilidad experimental o empírica <strong>de</strong> los datos agrupados,<br />
<strong>de</strong>nominado también frecuencia acumu<strong>la</strong>da.<br />
El procedimiento para efectuar el ajuste, mediante el estadístico <strong>de</strong> Smirnov-<br />
Kolmogorov, es <strong>la</strong> siguiente:<br />
1° Calcu<strong>la</strong>r <strong>la</strong> probabilidad empírica o experimental P(E) <strong>de</strong> los datos<br />
observados, en el presente utilizar los valores obtenidos en los Cuadros Nº<br />
7.27 y 7.28.<br />
2° Calcu<strong>la</strong>r <strong>la</strong> probabilidad ajustada o teórica F(E).<br />
F E P E para todos los valores <strong>de</strong> E.<br />
3° Calcu<strong>la</strong>r <strong>la</strong>s diferencias <br />
4° Seleccionar <strong>la</strong> máxima diferencia <strong>de</strong>l estadístico <strong>de</strong> Smirnov-Kolmogorov,<br />
D <strong>de</strong> <strong>la</strong> serie analizada.<br />
5° Calcu<strong>la</strong>r el valor crítico <strong>de</strong>l estadístico D , es <strong>de</strong>cir D o para un 05 0. y n<br />
igual al número <strong>de</strong> datos.<br />
6° Comparar el valor <strong>de</strong>l estadístico D con el valor crítico D o <strong>de</strong> <strong>la</strong> tab<strong>la</strong> con<br />
los siguientes criterios <strong>de</strong> <strong>de</strong>cisión:<br />
Si o D <br />
Si o D <br />
D el ajuste es bueno.<br />
D el ajuste no es bueno al nivel <strong>de</strong> significancia seleccionada.<br />
Los resultados <strong>de</strong>l ajuste estadístico <strong>de</strong> Smirnov-Kolmogorov <strong>de</strong> <strong>la</strong> componente<br />
estocástica in<strong>de</strong>pendiente <strong>de</strong> los <strong>río</strong>s Guanaco e Yaputira, se muestran en los<br />
Cuadros Nº 7.35 y 7.36.<br />
MINAG-ANA-DCPRH-AGUAS SUPERFICIALES Pág.270
<strong>Estudio</strong> <strong>Hidrológico</strong> <strong>de</strong> <strong>la</strong>s <strong>Cuenca</strong>s Huancané y Suches 2010<br />
Cuadro Nº 7.35 Prueba <strong>de</strong> ajuste <strong>de</strong> Smirnov-Kolmogorov <strong>de</strong> <strong>la</strong> componente estocástica<br />
in<strong>de</strong>pendiente Ep, – Río Guanaco<br />
m<br />
Marcas <strong>de</strong> C<strong>la</strong>se<br />
Ep,<br />
P(Ep,)<br />
Log-Normal <strong>de</strong> 3 Parámetros<br />
F(E) |F(E)-P(E)| F(E) |F(E)-P(E)|<br />
1 -2.8687 0.0031 0.0027 0.0004 0.0015 0.0016<br />
2 -1.9749 0.0155 0.0302 0.0147 0.0243 0.0089<br />
3 -1.0810 0.2117 0.1541 0.0577 0.1479 0.0639<br />
4 -0.1871 0.7357 0.4298 0.3059 0.4336 0.3021<br />
5 0.7067 0.8934 0.7460 0.1474 0.7540 0.1394<br />
6 1.6006 0.9490 0.9345 0.0145 0.9370 0.0120<br />
7 2.4945 0.9799 0.9910 0.0111 0.9909 0.0110<br />
8 3.3884 0.9954 0.9992 0.0038 0.9992 0.0038<br />
9 4.2822 0.9954 0.9997 0.0043 0.9999 0.0045<br />
10 5.1761 1.0000 0.9997 0.0003 0.9999 0.0001<br />
La diferencia máxima : D = máx |F(X) - P(X)|<br />
Normal<br />
0.3059 0.3021<br />
Cuadro Nº 7.36 Prueba <strong>de</strong> ajuste <strong>de</strong> Smirnov-Kolmogorov <strong>de</strong> <strong>la</strong> componente estocástica<br />
in<strong>de</strong>pendiente Ep, – Río Yaputira<br />
m<br />
Marcas <strong>de</strong> C<strong>la</strong>se<br />
Ep,<br />
P(Ep,)<br />
Normal Log-Normal <strong>de</strong> 3 Parámetros<br />
F(E) |F(E)-P(E)| F(E) |F(E)-P(E)|<br />
1 -1.9710 0.0185 0.0233 0.0048 0.0211 0.0026<br />
2 -1.1334 0.2226 0.1343 0.0883 0.1317 0.0909<br />
3 -0.2958 0.6491 0.3830 0.2662 0.3873 0.2618<br />
4 0.5418 0.8594 0.6893 0.1701 0.6976 0.1617<br />
5 1.3794 0.9444 0.8985 0.0458 0.9033 0.0410<br />
6 2.2170 0.9784 0.9765 0.0018 0.9786 0.0002<br />
7 3.0546 0.9907 0.9919 0.0011 0.9939 0.0031<br />
8 3.8922 0.9985 0.9934 0.0050 0.9956 0.0028<br />
9 4.7298 0.9985 0.9935 0.0050 0.9957 0.0027<br />
10 5.5674 1.0000 0.9935 0.0065 0.9957 0.0043<br />
La diferencia máxima : D = máx |F(X) - P(X)|<br />
0.2662 0.2618<br />
Realizado <strong>la</strong>s pruebas <strong>de</strong> ajuste <strong>de</strong> <strong>la</strong> componente estocástica in<strong>de</strong>pendiente, a <strong>la</strong>s<br />
distribuciones teóricas como <strong>la</strong> normal y <strong>la</strong> lognormal <strong>de</strong> 3 parámetros, los resultdaos se<br />
reume en el Cuadro Nº 3.37.<br />
Cuadro Nº 7.37 Reumen <strong>de</strong>l ajuste <strong>de</strong> <strong>la</strong> componente estocastica in<strong>de</strong>pendiente a <strong>la</strong> función <strong>de</strong> distribución<br />
<strong>de</strong> probabilida<strong>de</strong>s teóricas mediante <strong>la</strong>s pruebas estadísticas Chi-cuadrado y Smirnov-Kolmogorov<br />
Río<br />
Guanaco (Vaso<br />
Cal<strong>la</strong>tomaza)<br />
Yaputira (Vaso<br />
Yaputira)<br />
Distribución<br />
Chi-cuadrado<br />
2<br />
c calcu<strong>la</strong>do 2t<br />
, =0.05<br />
tab<strong>la</strong><br />
Ajuste D calcu<strong>la</strong>do<br />
Smirnov-Kolmogorov<br />
Do, =0.05<br />
tab<strong>la</strong><br />
MINAG-ANA-DCPRH-AGUAS SUPERFICIALES Pág.271<br />
Ajuste<br />
Normal 8.0000 5.9915 No se ajusta 0.3059 0.4090 Se ajusta<br />
Log-Normal 3 P. 8.0000 3.8415 No se ajusta 0.3021 0.4090 Se ajusta<br />
Normal 11.0000 5.9915 No se ajusta 0.2662 0.4090 Se ajusta<br />
Log-Normal 3 P. 11.0000 3.8415 No se ajusta 0.2618 0.4090 Se ajusta
<strong>Estudio</strong> <strong>Hidrológico</strong> <strong>de</strong> <strong>la</strong>s <strong>Cuenca</strong>s Huancané y Suches 2010<br />
Según el Cuadro Nº 7.37, ninguna <strong>de</strong> <strong>la</strong>s distribuciones <strong>de</strong> probabilidad se ajustan con <strong>la</strong><br />
prueba <strong>de</strong> Chi-cuadrado, en cambio con <strong>la</strong> prueba estadística <strong>de</strong> Smirnov-Kolmogorov se<br />
ajustan mejor a <strong>la</strong> serie <strong>de</strong> <strong>la</strong> componente estocástica in<strong>de</strong>pendiente <strong>de</strong> los <strong>río</strong>s Guanaco e<br />
Yaputira.<br />
Determinada <strong>la</strong> función <strong>de</strong> distribución <strong>de</strong> mejor ajuste <strong>de</strong> <strong>la</strong> componente estocástica<br />
in<strong>de</strong>pendiente, entonces el mo<strong>de</strong>lo queda <strong>de</strong>finido y ya se pue<strong>de</strong> utilizar en <strong>la</strong> generación<br />
<strong>de</strong> n series hidrológicas.<br />
7.7.2 Generación <strong>de</strong> series sintéticas <strong>de</strong> caudales medios mensuales<br />
La generación <strong>de</strong> series sintéticas con el mo<strong>de</strong>lo estocástico Markoviano, se realiza en dos<br />
partes: primero, <strong>la</strong> generación <strong>de</strong> n series sintéticas <strong>de</strong> un tamaño igual a <strong>la</strong> longitud <strong>de</strong> <strong>la</strong><br />
serie histórica para el análisis <strong>de</strong> <strong>la</strong> bondad <strong>de</strong>l mo<strong>de</strong>lo utilizado y el segundo es <strong>la</strong><br />
generación <strong>de</strong> n series <strong>de</strong> una longitud igual a <strong>la</strong> vida económica <strong>de</strong>l proyecto.<br />
A- Análisis <strong>de</strong> <strong>la</strong> bondad <strong>de</strong>l mo<strong>de</strong>lo Markoviano <strong>de</strong> primer or<strong>de</strong>n<br />
Para el análisis <strong>de</strong> <strong>la</strong> bondad <strong>de</strong>l mo<strong>de</strong>lo Markoviano, se ha generado 10 series sintéticas <strong>de</strong><br />
caudales medios mensuales <strong>de</strong> 54 años <strong>de</strong> información, utilizando el ajuste Normal y<br />
LogNormal <strong>de</strong> 3 parámetros para los <strong>río</strong>s Guanaco e Yaputira. Las series sintéticas<br />
generadas se muestran en el Anexo 1.<br />
En el análisis <strong>de</strong> <strong>la</strong> bondad <strong>de</strong>l mo<strong>de</strong>lo, se comparan <strong>la</strong>s medias y <strong>de</strong>sviaciones estándar<br />
multimensuales <strong>de</strong> los caudales generados e históricos <strong>de</strong> los <strong>río</strong>s Guanaco e Yaputira, los<br />
cuales estadísticamente <strong>de</strong>ben ser iguales a una probabilidad <strong>de</strong> confianza, en este caso al<br />
95% <strong>de</strong> probabilidad.<br />
Para <strong>la</strong> comparación estadística <strong>de</strong> <strong>la</strong>s medias <strong>de</strong> <strong>la</strong>s series históricas y generadas, se utiliza<br />
<strong>la</strong> prueba estadística "T" y para <strong>la</strong>s <strong>de</strong>sviaciones estándar <strong>la</strong> prueba estadística "F".<br />
De los resultados mostrados en los Cuadros N° 7.43 y 7.45, se <strong>de</strong>duce que <strong>la</strong>s medias y<br />
<strong>de</strong>sviaciones estándar <strong>de</strong> <strong>la</strong> serie generada son iguales estadísticamente a <strong>la</strong>s medias y<br />
<strong>de</strong>sviaciones estándar <strong>de</strong> <strong>la</strong> serie histórica al 95% <strong>de</strong> probabilidad, ya que los valores <strong>de</strong><br />
"T" y "F" calcu<strong>la</strong>dos resultan menores que los tabu<strong>la</strong>dos, respectivamente, concluyéndose<br />
que el mo<strong>de</strong>lo reproduce <strong>la</strong> media y <strong>de</strong>sviación estándar <strong>de</strong> <strong>la</strong> serie histórica, y el mo<strong>de</strong>lo<br />
es bueno.<br />
MINAG-ANA-DCPRH-AGUAS SUPERFICIALES Pág.272
<strong>Estudio</strong> <strong>Hidrológico</strong> <strong>de</strong> <strong>la</strong>s <strong>Cuenca</strong>s Huancané y Suches 2010<br />
Serie<br />
Cuadro Nº 7.38 Resumen <strong>de</strong> <strong>la</strong>s medias y <strong>de</strong>sviaciones estándar <strong>de</strong> <strong>la</strong>s 10 series generadas<br />
con distribución Normal <strong>de</strong> 54 años en m 3 /s – Río Guanaco<br />
Parámetro<br />
Ene Feb Mar Abr May Jun Jul Ago Sep Oct Nov Dic<br />
1<br />
Promedio<br />
Desv. Estándar<br />
2.979<br />
1.665<br />
4.790<br />
1.924<br />
3.842<br />
1.709<br />
2.777<br />
1.621<br />
0.834<br />
0.437<br />
0.338<br />
0.131<br />
0.226<br />
0.059<br />
0.194<br />
0.053<br />
0.226<br />
0.098<br />
0.338<br />
0.163<br />
0.638<br />
0.245<br />
1.353<br />
0.725<br />
2<br />
Promedio<br />
Desv. Estándar<br />
2.836<br />
1.793<br />
4.199<br />
2.287<br />
3.527<br />
2.026<br />
2.651<br />
1.350<br />
0.882<br />
0.409<br />
0.345<br />
0.143<br />
0.222<br />
0.067<br />
0.188<br />
0.053<br />
0.235<br />
0.090<br />
0.381<br />
0.157<br />
0.594<br />
0.272<br />
1.306<br />
0.738<br />
3<br />
Promedio<br />
Desv. Estándar<br />
2.672<br />
1.626<br />
4.306<br />
2.304<br />
3.691<br />
2.021<br />
2.941<br />
1.691<br />
0.776<br />
0.439<br />
0.349<br />
0.143<br />
0.219<br />
0.067<br />
0.191<br />
0.061<br />
0.233<br />
0.091<br />
0.351<br />
0.145<br />
0.535<br />
0.298<br />
1.111<br />
0.670<br />
4<br />
Promedio<br />
Desv. Estándar<br />
2.774<br />
1.747<br />
4.734<br />
2.415<br />
3.731<br />
2.013<br />
2.402<br />
1.602<br />
0.847<br />
0.459<br />
0.323<br />
0.149<br />
0.231<br />
0.064<br />
0.194<br />
0.061<br />
0.214<br />
0.111<br />
0.368<br />
0.148<br />
0.624<br />
0.291<br />
1.220<br />
0.659<br />
5<br />
Promedio<br />
Desv. Estándar<br />
2.731<br />
1.593<br />
4.495<br />
2.085<br />
3.377<br />
1.972<br />
2.460<br />
1.259<br />
0.766<br />
0.363<br />
0.321<br />
0.126<br />
0.223<br />
0.062<br />
0.206<br />
0.054<br />
0.229<br />
0.090<br />
0.336<br />
0.175<br />
0.563<br />
0.273<br />
1.039<br />
0.533<br />
6<br />
Promedio<br />
Desv. Estándar<br />
3.027<br />
1.691<br />
5.029<br />
2.347<br />
4.250<br />
2.439<br />
2.997<br />
1.927<br />
0.910<br />
0.390<br />
0.367<br />
0.111<br />
0.235<br />
0.051<br />
0.199<br />
0.060<br />
0.223<br />
0.109<br />
0.335<br />
0.167<br />
0.561<br />
0.215<br />
1.195<br />
0.667<br />
7<br />
Promedio<br />
Desv. Estándar<br />
2.347<br />
1.520<br />
4.353<br />
2.145<br />
2.951<br />
2.132<br />
2.285<br />
1.467<br />
0.672<br />
0.348<br />
0.301<br />
0.121<br />
0.201<br />
0.051<br />
0.196<br />
0.052<br />
0.229<br />
0.101<br />
0.327<br />
0.130<br />
0.571<br />
0.309<br />
0.928<br />
0.697<br />
8<br />
Promedio<br />
Desv. Estándar<br />
2.608<br />
1.365<br />
4.420<br />
2.469<br />
3.424<br />
1.899<br />
2.611<br />
1.369<br />
0.796<br />
0.437<br />
0.369<br />
0.124<br />
0.229<br />
0.053<br />
0.193<br />
0.046<br />
0.221<br />
0.088<br />
0.356<br />
0.150<br />
0.568<br />
0.273<br />
1.154<br />
0.520<br />
9<br />
Promedio<br />
Desv. Estándar<br />
3.139<br />
1.721<br />
4.962<br />
2.213<br />
3.708<br />
2.142<br />
2.557<br />
1.411<br />
0.820<br />
0.420<br />
0.358<br />
0.112<br />
0.219<br />
0.054<br />
0.198<br />
0.049<br />
0.237<br />
0.082<br />
0.324<br />
0.145<br />
0.524<br />
0.261<br />
1.131<br />
0.618<br />
10<br />
Promedio<br />
Desv. Estándar<br />
2.941<br />
1.728<br />
4.661<br />
2.250<br />
3.628<br />
1.852<br />
2.713<br />
1.312<br />
0.837<br />
0.435<br />
0.357<br />
0.155<br />
0.232<br />
0.058<br />
0.197<br />
0.051<br />
0.219<br />
0.073<br />
0.357<br />
0.148<br />
0.584<br />
0.332<br />
1.034<br />
0.587<br />
Promedio <strong>de</strong> Promedio 2.805 4.595 3.613 2.639 0.814 0.343 0.224 0.196 0.227 0.347 0.576 1.147<br />
Promedio <strong>de</strong> Desvest. 1.645 2.244 2.020 1.501 0.414 0.132 0.059 0.054 0.093 0.153 0.277 0.642<br />
Cuadro Nº 7.39 Resumen <strong>de</strong> <strong>la</strong>s medias y <strong>de</strong>sviaciones estándar <strong>de</strong> <strong>la</strong>s 10 series generadas<br />
con distribución LogNormal 3 P. <strong>de</strong> 54 años en m 3 /s – Río Guanaco<br />
Serie Parámetro<br />
MINAG-ANA-DCPRH-AGUAS SUPERFICIALES Pág.273<br />
Mes<br />
Ene Feb Mar Abr May Jun Jul Ago Sep Oct Nov Dic<br />
1<br />
Promedio<br />
Desv. Estándar<br />
2.728<br />
1.652<br />
4.664<br />
2.490<br />
3.721<br />
2.361<br />
2.674<br />
1.236<br />
0.784<br />
0.390<br />
0.317<br />
0.127<br />
0.213<br />
0.055<br />
0.195<br />
0.048<br />
0.233<br />
0.074<br />
0.379<br />
0.185<br />
0.509<br />
0.270<br />
1.124<br />
0.673<br />
2<br />
Promedio<br />
Desv. Estándar<br />
2.897<br />
1.708<br />
4.486<br />
2.340<br />
3.386<br />
2.155<br />
2.382<br />
1.245<br />
0.713<br />
0.412<br />
0.363<br />
0.135<br />
0.220<br />
0.062<br />
0.202<br />
0.056<br />
0.243<br />
0.076<br />
0.345<br />
0.141<br />
0.583<br />
0.280<br />
1.117<br />
0.515<br />
3<br />
Promedio<br />
Desv. Estándar<br />
3.062<br />
1.724<br />
4.636<br />
2.437<br />
4.352<br />
2.558<br />
2.804<br />
1.457<br />
0.909<br />
0.448<br />
0.364<br />
0.121<br />
0.229<br />
0.058<br />
0.199<br />
0.043<br />
0.235<br />
0.076<br />
0.327<br />
0.131<br />
0.548<br />
0.261<br />
1.226<br />
0.756<br />
4<br />
Promedio<br />
Desv. Estándar<br />
3.005<br />
1.872<br />
4.567<br />
2.059<br />
3.568<br />
1.817<br />
2.585<br />
1.467<br />
0.859<br />
0.354<br />
0.351<br />
0.123<br />
0.229<br />
0.056<br />
0.202<br />
0.047<br />
0.230<br />
0.091<br />
0.349<br />
0.153<br />
0.655<br />
0.256<br />
1.297<br />
0.634<br />
5<br />
Promedio<br />
Desv. Estándar<br />
3.039<br />
1.951<br />
4.896<br />
2.254<br />
3.622<br />
1.768<br />
2.618<br />
1.396<br />
0.819<br />
0.445<br />
0.318<br />
0.127<br />
0.218<br />
0.061<br />
0.186<br />
0.051<br />
0.207<br />
0.080<br />
0.343<br />
0.147<br />
0.563<br />
0.254<br />
1.198<br />
0.691<br />
6<br />
Promedio<br />
Desv. Estándar<br />
3.127<br />
1.823<br />
4.407<br />
2.202<br />
3.572<br />
1.762<br />
2.176<br />
1.420<br />
0.818<br />
0.378<br />
0.346<br />
0.116<br />
0.234<br />
0.055<br />
0.197<br />
0.051<br />
0.238<br />
0.078<br />
0.355<br />
0.165<br />
0.536<br />
0.245<br />
1.176<br />
0.591<br />
7<br />
Promedio<br />
Desv. Estándar<br />
3.067<br />
1.506<br />
5.134<br />
2.194<br />
3.580<br />
2.103<br />
2.575<br />
1.419<br />
0.814<br />
0.374<br />
0.324<br />
0.136<br />
0.225<br />
0.059<br />
0.211<br />
0.049<br />
0.255<br />
0.083<br />
0.342<br />
0.128<br />
0.557<br />
0.258<br />
1.184<br />
0.727<br />
8<br />
Promedio<br />
Desv. Estándar<br />
2.800<br />
1.590<br />
4.465<br />
2.057<br />
3.555<br />
1.902<br />
2.729<br />
1.283<br />
0.798<br />
0.410<br />
0.344<br />
0.136<br />
0.218<br />
0.059<br />
0.197<br />
0.054<br />
0.231<br />
0.068<br />
0.355<br />
0.153<br />
0.566<br />
0.270<br />
1.054<br />
0.600<br />
9<br />
Promedio<br />
Desv. Estándar<br />
2.827<br />
1.711<br />
4.591<br />
2.537<br />
3.319<br />
1.930<br />
2.853<br />
1.642<br />
0.843<br />
0.425<br />
0.332<br />
0.129<br />
0.220<br />
0.055<br />
0.185<br />
0.046<br />
0.206<br />
0.085<br />
0.299<br />
0.119<br />
0.557<br />
0.310<br />
1.132<br />
0.679<br />
10<br />
Promedio<br />
Desv. Estándar<br />
2.875<br />
1.703<br />
4.526<br />
1.973<br />
3.701<br />
1.860<br />
2.327<br />
1.251<br />
0.786<br />
0.395<br />
0.354<br />
0.115<br />
0.212<br />
0.055<br />
0.202<br />
0.062<br />
0.224<br />
0.078<br />
0.330<br />
0.148<br />
0.565<br />
0.253<br />
0.925<br />
0.609<br />
Promedio <strong>de</strong> Promedio 2.943 4.637 3.638 2.572 0.814 0.341 0.222 0.198 0.230 0.342 0.564 1.143<br />
Promedio <strong>de</strong> Desvest. 1.724 2.254 2.022 1.382 0.403 0.126 0.058 0.051 0.079 0.147 0.266 0.648<br />
Mes
<strong>Estudio</strong> <strong>Hidrológico</strong> <strong>de</strong> <strong>la</strong>s <strong>Cuenca</strong>s Huancané y Suches 2010<br />
Cuadro Nº 7.40 Resumen <strong>de</strong> <strong>la</strong>s medias y <strong>de</strong>sviaciones estándar <strong>de</strong> <strong>la</strong>s 10 series generadas<br />
con distribución Normal <strong>de</strong> 54 años en m 3 /s – Río Yaputira<br />
Serie Parámetro<br />
Ene Feb Mar Abr May Jun Jul Ago Sep Oct Nov Dic<br />
1<br />
Promedio<br />
Desv. Estándar<br />
2.928<br />
1.720<br />
5.429<br />
2.283<br />
4.538<br />
2.730<br />
3.072<br />
1.619<br />
0.943<br />
0.466<br />
0.336<br />
0.144<br />
0.190<br />
0.055<br />
0.191<br />
0.077<br />
0.254<br />
0.103<br />
0.449<br />
0.270<br />
0.773<br />
0.338<br />
1.029<br />
0.508<br />
2<br />
Promedio<br />
Desv. Estándar<br />
2.671<br />
1.289<br />
4.827<br />
2.305<br />
4.408<br />
2.260<br />
3.377<br />
2.100<br />
0.907<br />
0.421<br />
0.334<br />
0.140<br />
0.179<br />
0.039<br />
0.172<br />
0.071<br />
0.237<br />
0.124<br />
0.428<br />
0.272<br />
0.734<br />
0.351<br />
1.024<br />
0.647<br />
3<br />
Promedio<br />
Desv. Estándar<br />
2.442<br />
1.340<br />
5.531<br />
2.650<br />
4.038<br />
2.637<br />
3.008<br />
1.957<br />
0.873<br />
0.380<br />
0.325<br />
0.139<br />
0.190<br />
0.043<br />
0.174<br />
0.064<br />
0.235<br />
0.142<br />
0.454<br />
0.248<br />
0.668<br />
0.387<br />
1.045<br />
0.543<br />
4<br />
Promedio<br />
Desv. Estándar<br />
2.638<br />
1.475<br />
4.640<br />
2.590<br />
4.049<br />
2.218<br />
3.048<br />
1.854<br />
0.944<br />
0.412<br />
0.372<br />
0.170<br />
0.180<br />
0.051<br />
0.180<br />
0.075<br />
0.249<br />
0.116<br />
0.477<br />
0.258<br />
0.678<br />
0.300<br />
0.994<br />
0.473<br />
5<br />
Promedio<br />
Desv. Estándar<br />
2.836<br />
1.543<br />
5.048<br />
2.118<br />
4.160<br />
2.307<br />
3.161<br />
2.009<br />
0.885<br />
0.468<br />
0.323<br />
0.142<br />
0.184<br />
0.060<br />
0.168<br />
0.062<br />
0.252<br />
0.126<br />
0.490<br />
0.300<br />
0.729<br />
0.360<br />
1.002<br />
0.517<br />
6<br />
Promedio<br />
Desv. Estándar<br />
2.592<br />
1.578<br />
4.768<br />
1.914<br />
4.325<br />
2.018<br />
3.407<br />
1.881<br />
0.967<br />
0.484<br />
0.342<br />
0.142<br />
0.177<br />
0.042<br />
0.161<br />
0.064<br />
0.251<br />
0.113<br />
0.481<br />
0.294<br />
0.656<br />
0.365<br />
1.180<br />
0.478<br />
7<br />
Promedio<br />
Desv. Estándar<br />
2.654<br />
1.723<br />
5.137<br />
3.015<br />
4.253<br />
2.450<br />
3.424<br />
1.934<br />
0.871<br />
0.421<br />
0.299<br />
0.129<br />
0.181<br />
0.051<br />
0.167<br />
0.056<br />
0.242<br />
0.125<br />
0.413<br />
0.237<br />
0.696<br />
0.283<br />
1.031<br />
0.553<br />
8<br />
Promedio<br />
Desv. Estándar<br />
3.185<br />
1.588<br />
5.353<br />
2.115<br />
4.767<br />
2.518<br />
3.147<br />
1.666<br />
1.016<br />
0.492<br />
0.344<br />
0.148<br />
0.194<br />
0.052<br />
0.195<br />
0.067<br />
0.264<br />
0.118<br />
0.433<br />
0.272<br />
0.631<br />
0.325<br />
1.049<br />
0.478<br />
9<br />
Promedio<br />
Desv. Estándar<br />
2.782<br />
1.279<br />
4.596<br />
1.976<br />
4.105<br />
2.575<br />
3.008<br />
1.988<br />
0.897<br />
0.406<br />
0.346<br />
0.133<br />
0.191<br />
0.053<br />
0.182<br />
0.069<br />
0.256<br />
0.110<br />
0.470<br />
0.241<br />
0.646<br />
0.338<br />
1.046<br />
0.492<br />
10<br />
Promedio<br />
Desv. Estándar<br />
2.418<br />
1.450<br />
4.772<br />
1.920<br />
4.197<br />
2.177<br />
3.025<br />
1.880<br />
0.855<br />
0.410<br />
0.307<br />
0.141<br />
0.180<br />
0.054<br />
0.152<br />
0.066<br />
0.234<br />
0.107<br />
0.479<br />
0.283<br />
0.762<br />
0.348<br />
1.119<br />
0.506<br />
Promedio <strong>de</strong> Promedio 2.714 5.010 4.284 3.168 0.916 0.333 0.185 0.174 0.247 0.457 0.697 1.052<br />
Promedio <strong>de</strong> Desvest. 1.499 2.289 2.389 1.889 0.436 0.143 0.050 0.067 0.118 0.267 0.340 0.520<br />
Cuadro Nº 7.41 Resumen <strong>de</strong> <strong>la</strong>s medias y <strong>de</strong>sviaciones estándar <strong>de</strong> <strong>la</strong>s 10 series generadas<br />
con distribución LogNormal 3 P. <strong>de</strong> 54 años en m 3 /s – Río Yaputira<br />
Serie Parámetro<br />
MINAG-ANA-DCPRH-AGUAS SUPERFICIALES Pág.274<br />
Mes<br />
Ene Feb Mar Abr May Jun Jul Ago Sep Oct Nov Dic<br />
1<br />
Promedio<br />
Desv. Estándar<br />
2.824<br />
1.464<br />
4.694<br />
2.032<br />
4.392<br />
2.548<br />
3.454<br />
2.044<br />
0.879<br />
0.465<br />
0.320<br />
0.126<br />
0.185<br />
0.047<br />
0.187<br />
0.074<br />
0.251<br />
0.127<br />
0.505<br />
0.247<br />
0.681<br />
0.353<br />
0.914<br />
0.588<br />
2<br />
Promedio<br />
Desv. Estándar<br />
2.608<br />
1.490<br />
5.012<br />
2.354<br />
3.945<br />
2.537<br />
3.047<br />
1.690<br />
0.847<br />
0.403<br />
0.315<br />
0.124<br />
0.185<br />
0.057<br />
0.177<br />
0.067<br />
0.228<br />
0.101<br />
0.406<br />
0.208<br />
0.684<br />
0.308<br />
1.072<br />
0.613<br />
3<br />
Promedio<br />
Desv. Estándar<br />
2.334<br />
1.333<br />
4.539<br />
2.282<br />
3.614<br />
2.548<br />
2.984<br />
2.008<br />
0.872<br />
0.412<br />
0.298<br />
0.143<br />
0.180<br />
0.046<br />
0.188<br />
0.061<br />
0.264<br />
0.114<br />
0.456<br />
0.211<br />
0.658<br />
0.371<br />
0.880<br />
0.430<br />
4<br />
Promedio<br />
Desv. Estándar<br />
2.313<br />
1.313<br />
4.117<br />
1.793<br />
3.365<br />
2.237<br />
2.864<br />
1.877<br />
0.816<br />
0.424<br />
0.315<br />
0.124<br />
0.185<br />
0.053<br />
0.165<br />
0.067<br />
0.227<br />
0.124<br />
0.512<br />
0.233<br />
0.664<br />
0.293<br />
0.952<br />
0.568<br />
5<br />
Promedio<br />
Desv. Estándar<br />
2.782<br />
1.562<br />
4.448<br />
2.301<br />
3.768<br />
1.756<br />
3.488<br />
1.834<br />
0.978<br />
0.508<br />
0.334<br />
0.132<br />
0.180<br />
0.046<br />
0.170<br />
0.064<br />
0.250<br />
0.117<br />
0.499<br />
0.263<br />
0.712<br />
0.367<br />
1.059<br />
0.530<br />
6<br />
Promedio<br />
Desv. Estándar<br />
2.953<br />
1.786<br />
4.603<br />
2.290<br />
4.144<br />
2.088<br />
3.542<br />
2.169<br />
0.839<br />
0.417<br />
0.323<br />
0.116<br />
0.188<br />
0.056<br />
0.184<br />
0.066<br />
0.249<br />
0.125<br />
0.466<br />
0.274<br />
0.751<br />
0.412<br />
1.028<br />
0.482<br />
7<br />
Promedio<br />
Desv. Estándar<br />
2.913<br />
1.600<br />
4.579<br />
2.250<br />
4.215<br />
2.394<br />
3.562<br />
2.085<br />
0.877<br />
0.515<br />
0.321<br />
0.152<br />
0.186<br />
0.052<br />
0.165<br />
0.065<br />
0.258<br />
0.106<br />
0.480<br />
0.235<br />
0.751<br />
0.369<br />
0.983<br />
0.486<br />
8<br />
Promedio<br />
Desv. Estándar<br />
2.215<br />
1.094<br />
4.469<br />
2.406<br />
4.110<br />
2.079<br />
3.189<br />
1.856<br />
0.846<br />
0.475<br />
0.295<br />
0.139<br />
0.185<br />
0.055<br />
0.189<br />
0.063<br />
0.249<br />
0.104<br />
0.469<br />
0.230<br />
0.702<br />
0.361<br />
1.077<br />
0.542<br />
9<br />
Promedio<br />
Desv. Estándar<br />
3.154<br />
1.686<br />
4.697<br />
2.460<br />
3.791<br />
2.446<br />
3.004<br />
1.804<br />
0.833<br />
0.423<br />
0.303<br />
0.157<br />
0.171<br />
0.052<br />
0.163<br />
0.067<br />
0.236<br />
0.108<br />
0.527<br />
0.289<br />
0.727<br />
0.353<br />
0.997<br />
0.508<br />
10<br />
Promedio<br />
Desv. Estándar<br />
2.415<br />
1.604<br />
5.216<br />
2.509<br />
4.810<br />
2.754<br />
3.584<br />
1.904<br />
0.850<br />
0.443<br />
0.316<br />
0.161<br />
0.171<br />
0.055<br />
0.159<br />
0.067<br />
0.255<br />
0.108<br />
0.454<br />
0.247<br />
0.718<br />
0.324<br />
1.014<br />
0.535<br />
Promedio <strong>de</strong> Promedio 2.651 4.637 4.015 3.272 0.864 0.314 0.182 0.175 0.247 0.477 0.705 0.998<br />
Promedio <strong>de</strong> Desvest.<br />
1.493 2.268 2.339 1.927 0.448 0.137 0.052 0.066 0.113 0.244 0.351 0.528<br />
Mes
<strong>Estudio</strong> <strong>Hidrológico</strong> <strong>de</strong> <strong>la</strong>s <strong>Cuenca</strong>s Huancané y Suches 2010<br />
Enero<br />
Febrero<br />
Marzo<br />
Abril<br />
Mayo<br />
Junio<br />
Julio<br />
Agosto<br />
Septiembre<br />
Octubre<br />
Noviembre<br />
Diciembre<br />
Enero<br />
Febrero<br />
Marzo<br />
Abril<br />
Mayo<br />
Junio<br />
Julio<br />
Agosto<br />
Septiembre<br />
Octubre<br />
Noviembre<br />
Diciembre<br />
Cuadro Nº 7.42 Promedio <strong>de</strong> <strong>la</strong>s medias y <strong>de</strong>sviaciones estándar <strong>de</strong> <strong>la</strong>s series históricas<br />
y generadas en m 3 /s – Río Guanaco<br />
Mes<br />
Caudales medios mensuales en m3/s<br />
(Serie histórica)<br />
Media<br />
Desv. Estándar<br />
Cuadales medios mensuales en m3/s (10 series generadas)<br />
Normal LogNormal 3 parámetros<br />
Promedio <strong>de</strong> <strong>la</strong>:<br />
Media Desv. Estándar Media<br />
Desv. Estándar<br />
2.347 2.157 2.805 1.645 2.943 1.724<br />
4.309 2.531 4.595 2.244 4.637 2.254<br />
3.099 2.551 3.613 2.020 3.638 2.022<br />
2.266 1.922 2.639 1.501 2.572 1.382<br />
0.790 0.485 0.814 0.414 0.814 0.403<br />
0.345 0.134 0.343 0.132 0.341 0.126<br />
0.224 0.060 0.224 0.059 0.222 0.058<br />
0.199 0.053 0.196 0.054 0.198 0.051<br />
0.230 0.091 0.227 0.093 0.230 0.079<br />
0.344 0.158 0.347 0.153 0.342 0.147<br />
0.531 0.308 0.576 0.277 0.564 0.266<br />
0.959 0.861 1.147 0.642 1.143 0.648<br />
Cuadro Nº 7.43 Comparación estadística <strong>de</strong> <strong>la</strong>s medias y <strong>de</strong>sviaciones estándar <strong>de</strong> <strong>la</strong>s series<br />
históricas y generadas – Río Guanaco<br />
Mes<br />
Distribución ajustada<br />
Normal LogNormal 3 parámetros<br />
Media Desv. Estándar<br />
Media<br />
Desv. Estándar<br />
Tc Tt Dif. Sig. Fc Ft Dif. Sig. Tc Tt Dif. Sig. Fc Ft Dif. Sig.<br />
-0.7563 1.9990 NO 1.7194 2.7976 NO -0.9781 1.9996 NO 1.5654 2.7976 NO<br />
-0.3938 1.9990 NO 1.2722 2.7976 NO -0.4513 1.9996 NO 1.2609 2.7976 NO<br />
-0.7141 1.9990 NO 1.5948 2.7976 NO -0.7488 1.9996 NO 1.5917 2.7976 NO<br />
-0.6891 1.9990 NO 1.6396 2.7976 NO -0.5711 1.9996 NO 1.9342 2.7976 NO<br />
-0.1735 1.9990 NO 1.3724 2.7976 NO -0.1742 1.9996 NO 1.4483 2.7976 NO<br />
0.0510 1.9990 NO 1.0305 2.7976 NO 0.1030 1.9996 NO 1.1310 2.7976 NO<br />
0.0000 1.9990 NO 1.0342 2.7976 NO 0.1144 1.9996 NO 1.0702 2.7976 NO<br />
0.1923 1.9990 NO 1.0381 2.0620 NO 0.0648 1.9996 NO 1.0800 2.7976 NO<br />
0.1119 1.9990 NO 1.0444 2.0620 NO 0.0000 1.9996 NO 1.3269 2.7976 NO<br />
-0.0651 1.9990 NO 1.0664 2.7976 NO 0.0438 1.9996 NO 1.1553 2.7976 NO<br />
-0.5080 1.9990 NO 1.2364 2.7976 NO -0.3750 1.9996 NO 1.3407 2.7976 NO<br />
-0.7799 1.9990 NO 1.7986 2.7976 NO -0.7624 1.9996 NO 1.7655 2.7976 NO<br />
n1 = 54 n2 = 10 La diferencia no es significativo, por lo tanto <strong>la</strong>s medias y <strong>de</strong>sviaciones<br />
estandar son iguales estadísticamente y el Mo<strong>de</strong>lo es bueno.<br />
Cuadro Nº 7.44 Promedio <strong>de</strong> <strong>la</strong>s medias y <strong>de</strong>sviaciones estándar <strong>de</strong> <strong>la</strong>s series históricas<br />
y generadas en m 3 /s – Río Yaputira<br />
Mes<br />
Enero<br />
Febrero<br />
Marzo<br />
Abril<br />
Mayo<br />
Junio<br />
Julio<br />
Agosto<br />
Septiembre<br />
Octubre<br />
Noviembre<br />
Diciembre<br />
Caudales medios mensuales en m3/s<br />
(Serie histórica)<br />
Cuadales medios mensuales en m3/s (10 series generadas)<br />
Normal LogNormal 3 parámetros<br />
Promedio <strong>de</strong> <strong>la</strong>:<br />
Media Desv. Estándar Media Desv. Estándar Media Desv. Estándar<br />
2.253 1.976 2.714 1.499 2.651 1.493<br />
4.656 2.617 5.010 2.289 4.637 2.268<br />
3.414 3.221 4.284 2.389 4.015 2.339<br />
2.729 2.438 3.168 1.889 3.272 1.927<br />
0.874 0.475 0.916 0.436 0.864 0.448<br />
0.328 0.146 0.333 0.143 0.314 0.137<br />
0.186 0.051 0.185 0.050 0.182 0.052<br />
0.177 0.071 0.174 0.067 0.175 0.066<br />
0.245 0.122 0.247 0.118 0.247 0.113<br />
0.428 0.307 0.457 0.267 0.477 0.244<br />
0.682 0.386 0.697 0.340 0.705 0.351<br />
0.948 0.607 1.052 0.520 0.998 0.528<br />
MINAG-ANA-DCPRH-AGUAS SUPERFICIALES Pág.275
<strong>Estudio</strong> <strong>Hidrológico</strong> <strong>de</strong> <strong>la</strong>s <strong>Cuenca</strong>s Huancané y Suches 2010<br />
Enero<br />
Febrero<br />
Marzo<br />
Abril<br />
Mayo<br />
Junio<br />
Julio<br />
Agosto<br />
Septiembre<br />
Octubre<br />
Noviembre<br />
Diciembre<br />
Cuadro Nº 7.45 Comparación estadística <strong>de</strong> <strong>la</strong>s medias y <strong>de</strong>sviaciones estándar <strong>de</strong> <strong>la</strong>s series<br />
históricas y generadas – Río Yaputira<br />
Mes<br />
Distribución ajustada<br />
Normal LogNormal 3 parámetros<br />
Media Desv. Estándar Media Desv. Estándar<br />
Tc Tt Dif. Sig. Fc Ft Dif. Sig. Tc Tt Dif. Sig. Fc Ft Dif. Sig.<br />
-0.8315 1.9990 NO 1.7377 2.7976 NO -0.7183 1.9996 NO 1.7517 2.7976 NO<br />
-0.4724 1.9990 NO 1.3071 2.7976 NO 0.0254 1.9996 NO 1.3314 2.7976 NO<br />
-0.9654 1.9990 NO 1.8178 2.7976 NO -0.6686 1.9996 NO 1.8964 2.7976 NO<br />
-0.6401 1.9990 NO 1.6657 2.7976 NO -0.7896 1.9996 NO 1.6007 2.7976 NO<br />
-0.3063 1.9990 NO 1.1869 2.7976 NO 0.0726 1.9996 NO 1.1242 2.7976 NO<br />
-0.1172 1.9990 NO 1.0424 2.7976 NO 0.3309 1.9996 NO 1.1357 2.7976 NO<br />
0.0671 1.9990 NO 1.0404 2.7976 NO 0.2664 1.9996 NO 1.0396 2.0620 NO<br />
0.1457 1.9990 NO 1.1230 2.7976 NO 0.0974 1.9996 NO 1.1573 2.7976 NO<br />
-0.0563 1.9990 NO 1.0689 2.7976 NO -0.0567 1.9996 NO 1.1656 2.7976 NO<br />
-0.3302 1.9990 NO 1.3221 2.7976 NO -0.5654 1.9996 NO 1.5831 2.7976 NO<br />
-0.1356 1.9990 NO 1.2889 2.7976 NO -0.2068 1.9996 NO 1.2094 2.7976 NO<br />
-0.6004 1.9990 NO 1.3626 2.7976 NO -0.2879 1.9996 NO 1.3216 2.7976 NO<br />
n1 = 54 n2 = 10 La diferencia no es significativo, por lo tanto <strong>la</strong>s medias y <strong>de</strong>sviaciones<br />
estandar son iguales estadísticamente y el Mo<strong>de</strong>lo es bueno.<br />
De acuerdo <strong>de</strong> los resultados obtenidos, <strong>la</strong> distribución LogNormal <strong>de</strong> 3 parámetros queda<br />
seleccionado como <strong>la</strong> distribución ajustada, para generar <strong>la</strong>s variables aleatorias<br />
in<strong>de</strong>pendientes en <strong>la</strong> generación <strong>de</strong> series sintéticas <strong>de</strong> caudales medios mensuales <strong>de</strong> los<br />
<strong>río</strong>s Guanaco e Yaputira.<br />
B.- Generación <strong>de</strong> series sintéticas<br />
Para <strong>la</strong> <strong>de</strong>terminación <strong>de</strong> <strong>la</strong> capacidad <strong>de</strong> embalse <strong>de</strong> los vasos propuestos en el presente<br />
estudio, para almacenamiento <strong>de</strong> agua en <strong>la</strong>s subcuencas <strong>de</strong>l <strong>río</strong> Guancao e Yaputira, se<br />
han generado 50 series sintéticas <strong>de</strong> 50 años <strong>de</strong> información, con el Mo<strong>de</strong>lo Markoviano <strong>de</strong><br />
Primer Or<strong>de</strong>n para los <strong>río</strong>s Guanaco e Yaputira. Los caudales generados en volumenes se<br />
muestran en el Anexo 1.<br />
MINAG-ANA-DCPRH-AGUAS SUPERFICIALES Pág.276
<strong>Estudio</strong> <strong>Hidrológico</strong> <strong>de</strong> <strong>la</strong>s <strong>Cuenca</strong>s Huancané y Suches 2010<br />
8.1 GENERALIDADES<br />
CAPÍTULO VIII<br />
DISPONIBILIDAD HÍDRICA<br />
La disponibilidad hídrica <strong>de</strong> una cuenca hidrográfica es <strong>la</strong> cantidad <strong>de</strong> volumen total <strong>de</strong><br />
agua (oferta hídrica) que dispone <strong>la</strong> cuenca, provenientes <strong>de</strong> diferentes fuentes, tales como<br />
aguas superficiales, aguas subterráneas, aguas <strong>de</strong> recuperación, aguas <strong>de</strong> almacenamiento<br />
en represas, aguas <strong>de</strong> trasvase y otras fuentes hídricas.<br />
Conocer <strong>la</strong> disponibilidad hídrica <strong>de</strong> <strong>la</strong> cuenca permite optimizar y utilizar el recurso<br />
hídrico en forma racional y eficiente, en aprovechamiento <strong>de</strong> uso pob<strong>la</strong>cional, agríco<strong>la</strong>,<br />
pecuario, industria, minera, energético, entre otros usos.<br />
En el presente capítulo, se presenta <strong>la</strong> disponibilidad hídrica para realizar el ba<strong>la</strong>nce hídrico<br />
<strong>de</strong> <strong>la</strong>s subcuencas <strong>de</strong> interés, don<strong>de</strong> existe requerimientos o <strong>de</strong>mandas hídricas localizadas<br />
<strong>de</strong>ntro <strong>de</strong>l ámbito <strong>de</strong> <strong>la</strong>s cuencas Huancané y Suches.<br />
8.2 AGUAS SUPERFICIALES<br />
Son <strong>la</strong>s aguas continentales que se encuentran en <strong>la</strong> superficie <strong>de</strong> <strong>la</strong> tierra, don<strong>de</strong> escurren<br />
continuamente en los <strong>río</strong>s y arroyos, o bien estancadas como en <strong>la</strong>gos, <strong>la</strong>gunas, charcas y<br />
pantanos. Esta fuente <strong>de</strong> agua es <strong>la</strong> que abunda más en <strong>la</strong> mayoría <strong>de</strong> <strong>la</strong>s cuencas<br />
hidrográficas.<br />
Las aguas superficiales proce<strong>de</strong>n directamente <strong>de</strong> <strong>la</strong>s precipitaciones que caen <strong>de</strong>s<strong>de</strong> <strong>la</strong>s<br />
nubes y discurren en <strong>la</strong> superficie <strong>de</strong> <strong>la</strong> tierra, generalmente son agua dulce, que es ahora el<br />
precioso e indispensable recurso natural para <strong>la</strong> existencia <strong>de</strong> los seres vivientes.<br />
Una característica importante <strong>de</strong> los <strong>río</strong>s <strong>de</strong> <strong>la</strong>s cuencas Huancané y Suches, es su régimen<br />
temporal, los mismos que presentan irregu<strong>la</strong>ridad en sus <strong>de</strong>scargas, con corto pe<strong>río</strong>do <strong>de</strong><br />
abundancia o avenida <strong>de</strong> 5 meses (diciembre a abril) y prolongado pe<strong>río</strong>do <strong>de</strong> estiaje <strong>de</strong> 7<br />
meses (mayo a noviembre), situación no favorable a <strong>la</strong>s necesida<strong>de</strong>s hídricas <strong>de</strong> <strong>la</strong> región.<br />
La mayoría <strong>de</strong> los <strong>río</strong>s <strong>de</strong> <strong>la</strong>s cuencas Huancané y Suches se originan por <strong>la</strong>s<br />
precipitaciones pluviales. En <strong>la</strong> cuenca Suches los <strong>río</strong>s Trapiche y Suches se originan<br />
también <strong>de</strong> los <strong>de</strong>shielos <strong>de</strong> <strong>la</strong> cordillera <strong>de</strong> los An<strong>de</strong>s <strong>de</strong>l Sur.<br />
En <strong>la</strong> cuenca Huancané, <strong>la</strong> disponibilidad hídrica al 75% <strong>de</strong> persistencia (caudales medios<br />
anuales) <strong>de</strong> los <strong>río</strong>s L<strong>la</strong>che son <strong>de</strong> 0.515 m 3 /s, Tuyto 4.428 m 3 /s, Muñani 2.702 m 3 /s,<br />
Pistune 1.391 m 3 /s, Puncune 1.449 m 3 /s y Huancané (cuenca total) 13.143 m 3 /s. Ver<br />
Cuadros Nº 8.1 y 8.2.<br />
MINAG-ANA-DCPRH-AGUAS SUPERFICIALES Pág.277
<strong>Estudio</strong> <strong>Hidrológico</strong> <strong>de</strong> <strong>la</strong>s <strong>Cuenca</strong>s Huancané y Suches 2010<br />
En <strong>la</strong> cuenca Suches, <strong>la</strong> disponibilidad hídrica al 75% <strong>de</strong> persistencia (caudales medios<br />
anuales) <strong>de</strong> los <strong>río</strong>s Chueña Huata Jahuira son <strong>de</strong> 0216 m 3 /s, Caylloma 0.734 m 3 /s y<br />
Trapiche <strong>de</strong> 0.649 m 3 /s. Ver Cuadros Nº 8.3 y 8.4.<br />
8.3 AGUAS SUBTERRÁNEAS<br />
El agua subterránea se encuentra almacenada en acuíferos bajo <strong>la</strong> superficie <strong>de</strong> <strong>la</strong> tierra y<br />
ocupa los poros y <strong>la</strong>s fisuras <strong>de</strong> <strong>la</strong>s rocas más sólidas. La más profunda pue<strong>de</strong> permanecer<br />
oculta durante miles y millones <strong>de</strong> años.<br />
A nivel global, el agua subterránea representa unas veinte (20) veces más que el total <strong>de</strong> <strong>la</strong>s<br />
aguas superficiales <strong>de</strong> todos los continentes e is<strong>la</strong>s, <strong>de</strong> ahí <strong>la</strong> importancia <strong>de</strong> esta agua<br />
como reserva y como recurso <strong>de</strong> agua dulce. A<strong>de</strong>más, tiene un importante papel en <strong>la</strong><br />
naturaleza. El efecto <strong>de</strong> <strong>la</strong> gran reserva <strong>de</strong> agua respecto al flujo anual, es esencial para<br />
mantener el caudal <strong>de</strong> base <strong>de</strong> muchos <strong>río</strong>s y <strong>la</strong> humedad <strong>de</strong>l suelo en <strong>la</strong>s riberas y áreas<br />
bajas.<br />
La disponibilidad actual (reservas explotables) <strong>de</strong>l agua subterránea aún no ha sido<br />
estudiada en <strong>la</strong>s cuencas Huancané y Suches, por lo tanto no existe información respectiva.<br />
8.4 AGUAS DE RECUPERACIÓN<br />
Reciben ese nombre, <strong>la</strong>s aguas que son producto <strong>de</strong> filtraciones proce<strong>de</strong>ntes <strong>de</strong> <strong>la</strong>s<br />
irrigaciones, don<strong>de</strong> predominan suelos gruesos y baja eficiencia <strong>de</strong> riego; también <strong>de</strong> los<br />
embalses. Se encuentran en <strong>la</strong> parte baja <strong>de</strong> <strong>la</strong> cuenca y generalmente son recuperadas para<br />
uso agríco<strong>la</strong>. Este tipo <strong>de</strong> disponibilidad hídrica se genera en <strong>la</strong> mayoría <strong>de</strong> <strong>la</strong>s cuencas<br />
costeras. En algunos casos es significativa como el caso <strong>de</strong> El Paraíso en <strong>la</strong> cuenca <strong>de</strong>l <strong>río</strong><br />
Huaura que, a partir <strong>de</strong> <strong>la</strong> irrigación Santa Rosa se obtienen aguas <strong>de</strong> recuperación no<br />
menores <strong>de</strong> 2 m 3 /s.<br />
En <strong>la</strong>s cuencas Huancané y Suches, no existe esta fuente <strong>de</strong> agua, carecen <strong>de</strong> embalses <strong>de</strong><br />
agua y gran<strong>de</strong>s irrigaciones.<br />
8.5 AGUAS DE ALMACENAMIENTO EN REPRESAS<br />
Son aguas almacenadas en represas durante el pe<strong>río</strong>do <strong>de</strong> avenidas, para aumentar <strong>la</strong><br />
disponibilidad <strong>de</strong> agua para diversos fines durante el pe<strong>río</strong>do <strong>de</strong> estiaje.<br />
Las presas <strong>de</strong> almacenamiento tienen <strong>la</strong> función <strong>de</strong>l suministro <strong>de</strong> agua a una pob<strong>la</strong>ción, ya<br />
sea para uso doméstico, agríco<strong>la</strong>, pecuario, generación <strong>de</strong> energía, etc. In<strong>de</strong>pendientemente<br />
<strong>de</strong> cuál sea el uso que se le da a una presa <strong>de</strong> almacenamiento, su función principal es<br />
mantener el <strong>de</strong>pósito lleno para asegurar <strong>la</strong> disponibilidad <strong>de</strong>l recurso agua en tiempos <strong>de</strong><br />
sequía. Para asegurar que esto ocurra, es necesario realizar un a<strong>de</strong>cuado diseño hidrológico<br />
<strong>de</strong> una presa <strong>de</strong> almacenamiento.<br />
En <strong>la</strong>s cuencas <strong>de</strong> los <strong>río</strong>s Huancané y Suches, no existen represas <strong>de</strong> almacenamiento <strong>de</strong><br />
agua, por lo tanto carece esta información.<br />
MINAG-ANA-DCPRH-AGUAS SUPERFICIALES Pág.278
<strong>Estudio</strong> <strong>Hidrológico</strong> <strong>de</strong> <strong>la</strong>s <strong>Cuenca</strong>s Huancané y Suches 2010<br />
8.6 AGUAS DE TRASVASE<br />
Son aguas provenientes <strong>de</strong> otra cuenca, se origina mediante el trasvase <strong>de</strong> una cuenca a<br />
otra a través <strong>de</strong> <strong>la</strong>s obras hidráulicas, cuya finalidad es afianzar e incrementar <strong>la</strong><br />
disponibilidad <strong>de</strong> agua en <strong>la</strong> cuenca con escasez <strong>de</strong>l recurso hídrico.<br />
En <strong>la</strong>s cuencas Huancané y Suches, no existe <strong>la</strong>s aguas <strong>de</strong> trasvase <strong>de</strong> una cuenca a otra.<br />
8.7 OTRAS FUENTES DE AGUA<br />
Una <strong>de</strong> <strong>la</strong>s otras fuentes <strong>de</strong> agua, vendría ser el <strong>de</strong>shielo <strong>de</strong> g<strong>la</strong>ciares.<br />
Los g<strong>la</strong>ciares, especialmente los tropicales, son excelentes indicadores <strong>de</strong> <strong>la</strong> evolución <strong>de</strong>l<br />
clima, y ecosistemas vulnerables. Constituyen reservas sólidas <strong>de</strong> agua dulce utilizadas<br />
para el consumo y activida<strong>de</strong>s productivas, tales como: agricultura, hidroelectricidad,<br />
industria, minería y proyectos agroindustriales; éstos juegan un rol vital en el <strong>de</strong>sarrollo<br />
socio-económico <strong>de</strong> <strong>la</strong>s pob<strong>la</strong>ciones. La notable disminución y pérdida <strong>de</strong> estas reservas<br />
como consecuencia <strong>de</strong>l acelerado proceso <strong>de</strong> <strong>de</strong>g<strong>la</strong>ciación y sus repercusiones, actualmente<br />
son motivo <strong>de</strong> preocupación creciente en todo el mundo.<br />
El 71% <strong>de</strong> los g<strong>la</strong>ciares tropicales <strong>de</strong> los An<strong>de</strong>s Sudamericanos se encuentran en el Perú;<br />
22% en Bolivia; 4% en Ecuador y 3% en Colombia (G<strong>la</strong>ciares y Cambio Climático en <strong>la</strong><br />
Comunidad Andina - 2007).<br />
En <strong>la</strong> cuenca Huancané no existe zonas <strong>de</strong> nevados. En cambio en <strong>la</strong> cuenca Suches si<br />
existe en <strong>la</strong> zona alta (nevados San Francisco, Callejón, Ananea Gran<strong>de</strong>, Chapi, Riti<br />
Urmasca, Caballune y Palomani) y forma parte <strong>de</strong> <strong>la</strong> cordillera <strong>de</strong> los An<strong>de</strong>s <strong>de</strong>l Sur,<br />
abarca una superficie <strong>de</strong> 23.40 km 2 . En <strong>la</strong> actualidad no existe <strong>la</strong> información sobre <strong>la</strong><br />
medición <strong>de</strong> caudales <strong>de</strong> <strong>de</strong>shielo <strong>de</strong> nevados que aporta a los <strong>río</strong>s, por lo que es necesario<br />
monitorear en a<strong>de</strong><strong>la</strong>nte, para obtener <strong>la</strong> información necesaria.<br />
8.8 DISPONIBILIDAD HÍDRICA TOTAL DE LA CUENCA<br />
Según <strong>la</strong> información existente, <strong>la</strong> disponibilidad hídrica total en <strong>la</strong>s cuencas Huancané y<br />
Suches, correspon<strong>de</strong> a aguas superficiales. A continuación se presenta <strong>la</strong>s <strong>de</strong>scargas<br />
medias mensuales al 75% <strong>de</strong> persistencia <strong>de</strong> <strong>la</strong>s subcuencas <strong>de</strong> interés.<br />
Subcuenca/<br />
cuenca<br />
Cuadro Nº 8.1 Descargas medias al 75% <strong>de</strong> persistencia (m 3 /s)<br />
Subcuencas <strong>de</strong> <strong>la</strong> cuenca Huancané<br />
Punto <strong>de</strong> control Ago Sep Oct Nov Dic Ene Feb Mar Abr May Jun Jul<br />
Río L<strong>la</strong>che Confl.<strong>río</strong> Huancané 0.050 0.062 0.128 0.216 0.467 1.085 1.592 1.134 0.750 0.355 0.223 0.115 0.515<br />
Río Tuyto Confl.<strong>río</strong> Putina 0.570 0.780 1.250 1.980 4.300 8.640 14.930 9.580 6.010 2.860 1.430 0.800 4.428<br />
Río Muñani Confl.<strong>río</strong> Pongongoni 0.697 0.716 0.910 1.323 2.029 4.197 8.132 5.845 4.011 2.396 1.301 0.864 2.702<br />
Río Pistune Confl.<strong>río</strong> Puncune 0.135 0.189 0.379 0.697 1.150 2.940 4.347 3.034 1.999 0.980 0.554 0.292 1.391<br />
Río Puncune Confl.<strong>río</strong> Pistune 0.191 0.214 0.348 0.686 0.975 2.155 3.990 3.623 2.758 1.384 0.709 0.350 1.449<br />
Río Huancané Desemb.<strong>la</strong>go Titicaca 1.900 2.260 3.330 5.720 9.790 25.460 39.130 30.130 21.120 10.550 5.400 2.930 13.143<br />
MINAG-ANA-DCPRH-AGUAS SUPERFICIALES Pág.279<br />
Prom<br />
Anual
<strong>Estudio</strong> <strong>Hidrológico</strong> <strong>de</strong> <strong>la</strong>s <strong>Cuenca</strong>s Huancané y Suches 2010<br />
Subcuenca/<br />
cuenca<br />
Cuadro Nº 8.2 Volúmenes <strong>de</strong> <strong>la</strong>s <strong>de</strong>scargas medias al 75% <strong>de</strong> persistencia (hm 3 )<br />
Subcuencas <strong>de</strong> <strong>la</strong> cuenca Huancané<br />
Punto <strong>de</strong> control Ago Sep Oct Nov Dic Ene Feb Mar Abr May Jun Jul<br />
Río L<strong>la</strong>che Confl.<strong>río</strong> Huancané 0.13 0.16 0.34 0.56 1.25 2.91 3.85 3.04 1.94 0.95 0.58 0.31 16.02<br />
Río Tuyto Confl.<strong>río</strong> Putina 1.53 2.02 3.35 5.13 11.52 23.14 36.12 25.66 15.58 7.66 3.71 2.14 137.56<br />
Río Muñani Confl.<strong>río</strong> Pongongoni 1.87 1.86 2.44 3.43 5.43 11.24 19.67 15.66 10.40 6.42 3.37 2.31 84.10<br />
Río Pistune Confl.<strong>río</strong> Puncune 0.36 0.49 1.02 1.81 3.08 7.87 10.52 8.13 5.18 2.62 1.44 0.78 43.30<br />
Río Puncune Confl.<strong>río</strong> Pistune 0.51 0.55 0.93 1.78 2.61 5.77 9.65 9.70 7.15 3.71 1.84 0.94 45.14<br />
Río Huancané Desemb.<strong>la</strong>go Titicaca 5.09 5.86 8.92 14.83 26.22 68.19 94.66 80.70 54.74 28.26 14.00 7.85 409.32<br />
Figura Nº 8.1 Variación mensual <strong>de</strong> los volúmenes <strong>de</strong> <strong>la</strong>s <strong>de</strong>scargas medias al 75% <strong>de</strong> persistencia (hm 3 )<br />
Subcuencas <strong>de</strong> <strong>la</strong> cuenca Huancané<br />
Descarga (hm 3 )<br />
Subcuenca/<br />
cuenca<br />
Río Chueña<br />
Huata Jahuira<br />
100.0<br />
90.0<br />
80.0<br />
70.0<br />
60.0<br />
50.0<br />
40.0<br />
30.0<br />
20.0<br />
10.0<br />
0.0<br />
0 2 4 6 8 10 12 14<br />
Tiempo (mes)<br />
Cuadro Nº 8.3 Descargas medias al 75% <strong>de</strong> persistencia (m 3 /s)<br />
Subcuencas <strong>de</strong> <strong>la</strong> cuenca Suches<br />
Río Huancané<br />
Río Tuyto<br />
Río Muñani<br />
Río Puncune<br />
Río Pistune<br />
Río L<strong>la</strong>che<br />
Punto <strong>de</strong> control Ago Sep Oct Nov Dic Ene Feb Mar Abr May Jun Jul<br />
Confl.<strong>río</strong> Suches 0.035 0.043 0.065 0.116 0.197 0.501 0.938 0.573 0.370 0.142 0.093 0.054 0.261<br />
Río Caylloma Confl.<strong>río</strong> Suches 0.170 0.209 0.292 0.392 0.607 1.475 2.148 1.449 0.995 0.522 0.321 0.227 0.734<br />
Río Trapiche Confl.<strong>río</strong> Suches 0.146 0.117 0.180 0.316 0.422 0.848 1.833 1.512 1.104 0.648 0.398 0.267 0.649<br />
MINAG-ANA-DCPRH-AGUAS SUPERFICIALES Pág.280<br />
Total<br />
Anual<br />
Prom<br />
Anual
<strong>Estudio</strong> <strong>Hidrológico</strong> <strong>de</strong> <strong>la</strong>s <strong>Cuenca</strong>s Huancané y Suches 2010<br />
Subcuenca/<br />
cuenca<br />
Río Chueña<br />
Huata Jahuira<br />
Cuadro Nº 8.4 Volúmenes <strong>de</strong> <strong>la</strong>s <strong>de</strong>scargas medias al 75% <strong>de</strong> persistencia (hm 3 )<br />
Subcuencas <strong>de</strong> <strong>la</strong> cuenca Suches<br />
Punto <strong>de</strong> control Ago Sep Oct Nov Dic Ene Feb Mar Abr May Jun Jul<br />
Confl.<strong>río</strong> Suches 0.09 0.11 0.17 0.30 0.53 1.34 2.27 1.53 0.96 0.38 0.24 0.14 8.06<br />
Río Caylloma Confl.<strong>río</strong> Suches 0.46 0.54 0.78 1.02 1.63 3.95 5.20 3.88 2.58 1.40 0.83 0.61 22.88<br />
Río Trapiche Confl.<strong>río</strong> Suches 0.39 0.30 0.48 0.82 1.13 2.27 4.43 4.05 2.86 1.74 1.03 0.72 20.22<br />
Figura Nº 8.2 Variación mensual <strong>de</strong> los volúmenes <strong>de</strong> <strong>la</strong>s <strong>de</strong>scargas medias al 75% <strong>de</strong> persistencia (hm 3 )<br />
Subcuencas <strong>de</strong> <strong>la</strong> cuenca Suches<br />
Descarga (hm 3 )<br />
6.0<br />
5.0<br />
4.0<br />
3.0<br />
2.0<br />
1.0<br />
0.0<br />
0 2 4 6 8 10 12 14<br />
Tiempo (mes)<br />
Río Caylloma<br />
Río Trapiche<br />
Río Chueña Huata<br />
Jahuira<br />
MINAG-ANA-DCPRH-AGUAS SUPERFICIALES Pág.281<br />
Total<br />
Anual
<strong>Estudio</strong> <strong>Hidrológico</strong> <strong>de</strong> <strong>la</strong>s <strong>Cuenca</strong>s Huancané y Suches 2010<br />
9.1 GENERALIDADES<br />
CAPÍTULO IX<br />
DEMANDA HÍDRICA<br />
La <strong>de</strong>manda hídrica es <strong>la</strong> cantidad <strong>de</strong> agua necesaria <strong>de</strong> los usuarios para satisfacer <strong>la</strong>s<br />
necesida<strong>de</strong>s <strong>de</strong> agua en uso agríco<strong>la</strong>, uso pob<strong>la</strong>cional, minero, industria, pecuario,<br />
energético, piscíco<strong>la</strong>s, recreación, etc.<br />
La <strong>de</strong>manda hídrica son <strong>de</strong> dos tipos, uso consuntivo y uso no consuntivo, a continuación<br />
se <strong>de</strong>tal<strong>la</strong> lo siguiente:<br />
Uso consuntivo<br />
El uso consuntivo es aquel que consume o extrae el agua <strong>de</strong> su fuente <strong>de</strong> origen, por lo que,<br />
en general, este uso pue<strong>de</strong> ser medido cuantitativamente. Los usos consuntivos más<br />
frecuentes vendrían ser lo siguiente:<br />
Uso no consuntivo<br />
- Sector agricultura (uso agríco<strong>la</strong>)<br />
- Sector vivienda (uso pob<strong>la</strong>cional)<br />
- Sector minería (uso minero)<br />
- Otros usos <strong>de</strong> agua (industria, pecuario, etc.)<br />
El uso no consuntivo es aquel que no consume el agua <strong>de</strong> su fuente <strong>de</strong> origen, porque el<br />
agua es usada pero no consumida <strong>de</strong> su ambiente natural. Los usos no consuntivos<br />
resaltantes vendrían ser lo siguiente:<br />
- Sector energía (uso hidroenergético)<br />
- Sector pesquería (piscíco<strong>la</strong>s)<br />
- Otros usos <strong>de</strong> agua (recreación, caudal ecológico, etc.)<br />
En <strong>la</strong>s cuencas Huancané y Suches, se ha i<strong>de</strong>ntificado el uso consuntivo en los sectores <strong>de</strong><br />
agricultura, vivienda y minería; mientras el uso no consuntivo el caudal ecológico <strong>de</strong> los<br />
<strong>río</strong>s en estudio.<br />
En a<strong>de</strong><strong>la</strong>nte se <strong>de</strong>terminan los usos <strong>de</strong> agua i<strong>de</strong>ntificados en <strong>la</strong>s subcuencas pertenecientes<br />
a <strong>la</strong>s cuencas Huancané y Suches.<br />
MINAG-ANA-DCPRH-AGUAS SUPERFICIALES Pág.282
<strong>Estudio</strong> <strong>Hidrológico</strong> <strong>de</strong> <strong>la</strong>s <strong>Cuenca</strong>s Huancané y Suches 2010<br />
9.2 DEMANDA HÍDRICA ACTUAL<br />
Son <strong>de</strong>mandas <strong>de</strong> agua actualmente utilizadas en diferentes tipos <strong>de</strong> usos en <strong>la</strong>s cuencas<br />
Huancané y Suches.<br />
Es necesario precisar que en <strong>la</strong>s cuencas Huancané y Suches, se distingue varios tipos <strong>de</strong><br />
usos actuales <strong>de</strong> agua superficial, siendo en or<strong>de</strong>n <strong>de</strong> prioridad, por <strong>la</strong> magnitud <strong>de</strong><br />
volumen consumido: uso agríco<strong>la</strong>, pob<strong>la</strong>cional y minero.<br />
El uso agríco<strong>la</strong> es <strong>de</strong> mayor significancia, no sólo por ser notablemente superior respecto a<br />
los otros, sino también por su importancia socio-económica.<br />
9.2.1 Demanda agríco<strong>la</strong><br />
La <strong>de</strong>manda hídrica en agricultura se <strong>de</strong>fine como <strong>la</strong> cantidad <strong>de</strong> agua necesaria para que<br />
los cultivos <strong>de</strong>sarrollen su máximo potencial productivo, en función <strong>de</strong> <strong>la</strong> cantidad <strong>de</strong> agua<br />
necesaria para el <strong>de</strong>sarrollo <strong>de</strong> sus procesos fisiológicos (respiración y fotosíntesis),<br />
manteniendo los otros factores <strong>de</strong> producción constantes.<br />
Par el cálculo <strong>de</strong> <strong>la</strong> <strong>de</strong>manda <strong>de</strong> agua <strong>de</strong> un proyecto se <strong>de</strong>be tener en cuenta, por lo tanto<br />
todas <strong>la</strong>s pérdidas resultantes <strong>de</strong>l sistema <strong>de</strong> distribución <strong>de</strong>l agua <strong>de</strong> riego y <strong>de</strong> <strong>la</strong><br />
eficiencia <strong>de</strong> aplicación <strong>de</strong>l agua al cultivo.<br />
Debido a <strong>la</strong> disponibilidad <strong>de</strong> extensiones <strong>de</strong> terreno, en <strong>la</strong>s cuencas <strong>de</strong> los <strong>río</strong>s Huancané y<br />
Suches, existen <strong>de</strong>mandas actuales que están re<strong>la</strong>cionados mayormente con <strong>la</strong> agricultura.<br />
9.2.1.1 Uso actual <strong>de</strong> <strong>la</strong> tierra y superficie <strong>de</strong> <strong>la</strong> cedu<strong>la</strong> <strong>de</strong> cultivo<br />
En <strong>la</strong>s cuencas Huancané y Suches el uso actual <strong>de</strong> <strong>la</strong>s tierras agríco<strong>la</strong>s son trabajadas en<br />
parce<strong>la</strong>s familiares muy fraccionadas y cuya producción agríco<strong>la</strong> generalmente es <strong>de</strong> uso<br />
familiar. Las tierras <strong>de</strong> pastos (en su mayor extensión), en los casos <strong>de</strong> <strong>la</strong>s comunida<strong>de</strong>s,<br />
son <strong>de</strong> uso común, utilizando para el pastoreo <strong>de</strong> ganado que es <strong>de</strong> propiedad <strong>de</strong> <strong>la</strong><br />
pob<strong>la</strong>ción. En los Cuadros Nº 9.1 y 9.9 se presenta el resumen <strong>de</strong> <strong>la</strong> superficie total <strong>de</strong> <strong>la</strong>s<br />
áreas <strong>de</strong> cultivo por subcuencas <strong>de</strong> <strong>la</strong>s cuencas Huancané y Suches (Perú), información<br />
obtenida <strong>de</strong>l P<strong>la</strong>n <strong>de</strong> Cultivo y Riego <strong>de</strong> <strong>la</strong> campaña agríco<strong>la</strong> 2010-2011 <strong>de</strong> <strong>la</strong> ALA<br />
Huancané.<br />
<strong>Cuenca</strong> Huancané<br />
Cuadro Nº 9.1 Resumen <strong>de</strong> superficie <strong>de</strong> cedu<strong>la</strong> <strong>de</strong> cultivo – <strong>Cuenca</strong> Huancané<br />
Nº Subcuenca Nº Usuarios<br />
Area Bajo<br />
Riego<br />
(ha)<br />
1 Alto Huancané 425 313.90<br />
2 Pistune 854 389.22<br />
3 Muñani 1,207 751.00<br />
4 Medio Huancané 334 172.50<br />
5 Tuyto 1,341 525.00<br />
6 L<strong>la</strong>che 534 152.00<br />
7 Bajo Huancané 388 42.00<br />
Total<br />
5,083 2,345.62<br />
Papa Habas<br />
3.30<br />
3.00<br />
14.50<br />
7.20<br />
50.00<br />
10.50<br />
11.30<br />
99.80<br />
Avena<br />
Forrajera<br />
Cebada Hortalizas<br />
Pastos<br />
Naturales<br />
Pastos<br />
Cultivados<br />
MINAG-ANA-DCPRH-AGUAS SUPERFICIALES Pág.283<br />
-<br />
-<br />
-<br />
-<br />
14.10<br />
0.50<br />
14.70<br />
29.30<br />
Cultivos predominantes (ha)<br />
4.80<br />
9.00<br />
20.00<br />
8.00<br />
29.70<br />
7.00<br />
1.80<br />
80.30<br />
2.20<br />
0.46<br />
3.50<br />
-<br />
-<br />
-<br />
-<br />
6.16<br />
-<br />
-<br />
-<br />
0.80<br />
1.50<br />
2.70<br />
0.80<br />
5.80<br />
292.90<br />
362.76<br />
645.00<br />
142.30<br />
316.80<br />
91.90<br />
9.40<br />
1,861.06<br />
10.70<br />
14.00<br />
68.00<br />
14.20<br />
112.90<br />
39.40<br />
4.00<br />
263.20
<strong>Estudio</strong> <strong>Hidrológico</strong> <strong>de</strong> <strong>la</strong>s <strong>Cuenca</strong>s Huancané y Suches 2010<br />
Cuadro Nº 9.2 Superficie <strong>de</strong> cedu<strong>la</strong> <strong>de</strong> cultivo – Subcuenca Alto Huancané<br />
Nº Comité <strong>de</strong> Riego Nº Usuarios<br />
1 ANEXO HUANCHO TARUCANI 8 4.50<br />
2 SAN FRANCISCO 20 3.00<br />
3 SAN JUAN DE CHINQUILLA 37 5.00<br />
4 SANTA CATALINA DE CHINQUILLA 31 18.00<br />
5 SANTA ROSA DE UYUNI 55 30.00<br />
6 SANTA RITA 32 21.00<br />
7 TICANI 46 50.00<br />
8 CONDORAQUE 12 15.00<br />
9 VICTORIA ALVARIZANI 20 7.30<br />
10 BUENOS AIRES 43 31.30<br />
11 GRAN CHAPARRAL 43 36.80<br />
12 ALTOS HILATA 47 29.00<br />
13 ACCOCUNCA 10 4.00<br />
14 QUISHUARANI TIQ. ANEXO CONDORAQUE 15 4.00<br />
15 TUPAC AMARU QUILCA - 20.00<br />
USOS INDIVIDUALES<br />
1 PRUDENCIO VALENCIA MAMANI 1 1.00<br />
2 BERNARDO LUQUE CONDORI 1 1.00<br />
3 JOSE ANGEL REYES LUJAN (FUNDO CONDORAQUE) 1 30.00<br />
4 FAM. COSI MAMANI DE CAJON HUYO 1 1.00<br />
5 MARIA LIPE DE QUISPE 1 1.00<br />
6 NICOLAS LIPE MAMANI 1 1.00<br />
Total<br />
425 313.90<br />
Nº Comité <strong>de</strong> Riego<br />
Area Bajo<br />
Riego<br />
(ha)<br />
Papa Habas<br />
0.30<br />
Avena<br />
Forrajera<br />
Cebada Hortalizas<br />
Pastos<br />
Naturales<br />
Pastos<br />
Cultivados<br />
MINAG-ANA-DCPRH-AGUAS SUPERFICIALES Pág.284<br />
-<br />
-<br />
-<br />
2.00<br />
-<br />
1.00<br />
-<br />
-<br />
-<br />
-<br />
-<br />
-<br />
-<br />
-<br />
-<br />
-<br />
-<br />
-<br />
-<br />
-<br />
3.30<br />
-<br />
-<br />
-<br />
-<br />
-<br />
-<br />
-<br />
-<br />
-<br />
-<br />
-<br />
-<br />
-<br />
-<br />
-<br />
-<br />
-<br />
-<br />
-<br />
-<br />
-<br />
-<br />
Cultivos predominantes (ha)<br />
0.80<br />
-<br />
-<br />
-<br />
2.00<br />
-<br />
2.00<br />
-<br />
-<br />
-<br />
-<br />
-<br />
-<br />
-<br />
-<br />
-<br />
-<br />
-<br />
-<br />
-<br />
-<br />
4.80<br />
0.20<br />
-<br />
-<br />
-<br />
1.00<br />
-<br />
1.00<br />
-<br />
-<br />
-<br />
-<br />
-<br />
-<br />
-<br />
-<br />
-<br />
-<br />
-<br />
-<br />
-<br />
-<br />
2.20<br />
Cuadro Nº 9.3 Superficie <strong>de</strong> cedu<strong>la</strong> <strong>de</strong> cultivo – Subcuenca Pistune<br />
1 AZIRUNI ANDAMARCA 51 70.00<br />
2 CAJON HUYO CENTRAL 56 35.00<br />
3 CAJON HUYO KELENE SORAPAMPA 29 7.50<br />
4 CHECTACOLLO - TIRAPUNCO 27 30.00<br />
5 HUARACOYO - JANANSAYA 77 30.00<br />
6 QUISUNI 20 1.50<br />
7 TIRAPUNCO 63 20.00<br />
8 SAN SALVADOR DE TARUCANI 35 26.00<br />
9 TISNAHUYO 57 33.93<br />
10 SANTIAGO MAYOR DE AZIRUNI 65 6.00<br />
11 CHALANANI 32 10.00<br />
12 CONTIHUYO-JANANSAYA 69 30.00<br />
13 COMBUCO 93 20.46<br />
14 ALTO LIBERTAD 37 33.83<br />
15 UMAJALSO LLUCHULLUCHUNI 27 2.00<br />
16 PERLAHUMANI SALTOPATA 36 2.00<br />
17 TISMIÑA HUANCANRANI 17 16.00<br />
18 PEÑA GRANDE INCHUPALLA 58 6.00<br />
USOS INDIVIDUALES<br />
Nº Usuarios<br />
Area Bajo<br />
Riego<br />
(ha)<br />
1 MIGUEL CHAVEZ FUENTES 1 8.00<br />
2 VELENTIN GIL TICONA Y Fam. GIL CANAZA 4 1.00<br />
Total<br />
854 389.22<br />
Papa Habas<br />
-<br />
2.00<br />
-<br />
-<br />
-<br />
-<br />
-<br />
-<br />
-<br />
-<br />
-<br />
-<br />
-<br />
-<br />
0.50<br />
0.50<br />
-<br />
-<br />
-<br />
-<br />
3.00<br />
-<br />
-<br />
-<br />
-<br />
-<br />
-<br />
-<br />
-<br />
-<br />
-<br />
-<br />
-<br />
-<br />
-<br />
-<br />
-<br />
-<br />
-<br />
-<br />
-<br />
-<br />
Cultivos predominantes (ha)<br />
Avena<br />
Forrajera<br />
7.00<br />
-<br />
-<br />
-<br />
-<br />
-<br />
-<br />
-<br />
-<br />
-<br />
-<br />
-<br />
2.00<br />
-<br />
-<br />
-<br />
-<br />
-<br />
-<br />
-<br />
9.00<br />
-<br />
-<br />
-<br />
-<br />
-<br />
-<br />
-<br />
-<br />
-<br />
-<br />
-<br />
-<br />
-<br />
-<br />
-<br />
-<br />
-<br />
-<br />
-<br />
-<br />
-<br />
-<br />
Cebada Hortalizas<br />
-<br />
-<br />
-<br />
-<br />
-<br />
-<br />
-<br />
-<br />
-<br />
-<br />
-<br />
-<br />
0.46<br />
-<br />
-<br />
-<br />
-<br />
-<br />
-<br />
-<br />
0.46<br />
-<br />
-<br />
-<br />
-<br />
-<br />
-<br />
-<br />
-<br />
-<br />
-<br />
-<br />
-<br />
-<br />
-<br />
-<br />
-<br />
-<br />
-<br />
-<br />
-<br />
-<br />
3.00<br />
2.50<br />
5.00<br />
16.00<br />
20.00<br />
21.00<br />
43.00<br />
15.00<br />
7.30<br />
31.30<br />
36.80<br />
29.00<br />
4.00<br />
4.00<br />
20.00<br />
1.00<br />
1.00<br />
30.00<br />
1.00<br />
1.00<br />
1.00<br />
292.90<br />
Pastos<br />
Naturales<br />
60.00<br />
33.00<br />
7.50<br />
30.00<br />
30.00<br />
1.50<br />
18.00<br />
25.00<br />
33.93<br />
6.00<br />
10.00<br />
25.00<br />
15.00<br />
33.83<br />
1.50<br />
1.50<br />
16.00<br />
6.00<br />
8.00<br />
1.00<br />
362.76<br />
0.20<br />
0.50<br />
-<br />
2.00<br />
5.00<br />
-<br />
3.00<br />
-<br />
-<br />
-<br />
-<br />
-<br />
-<br />
-<br />
-<br />
-<br />
-<br />
-<br />
-<br />
-<br />
-<br />
10.70<br />
Pastos<br />
Cultivados<br />
3.00<br />
-<br />
-<br />
-<br />
-<br />
-<br />
2.00<br />
1.00<br />
-<br />
-<br />
-<br />
5.00<br />
3.00<br />
-<br />
-<br />
-<br />
-<br />
-<br />
-<br />
-<br />
14.00<br />
Comisión <strong>de</strong><br />
Regantes<br />
Putina<br />
Putina<br />
Putina<br />
Putina<br />
Putina<br />
Quilcapunco-Inchupal<strong>la</strong><br />
Quilcapunco-Inchupal<strong>la</strong><br />
Quilcapunco-Inchupal<strong>la</strong><br />
Quilcapunco-Inchupal<strong>la</strong><br />
Quilcapunco-Inchupal<strong>la</strong><br />
Quilcapunco-Inchupal<strong>la</strong><br />
Quilcapunco-Inchupal<strong>la</strong><br />
Quilcapunco-Inchupal<strong>la</strong><br />
Quilcapunco-Inchupal<strong>la</strong><br />
Quilcapunco-Inchupal<strong>la</strong><br />
Putina<br />
Quilcapunco-Inchupal<strong>la</strong><br />
Quilcapunco-Inchupal<strong>la</strong><br />
Quilcapunco-Inchupal<strong>la</strong><br />
Quilcapunco-Inchupal<strong>la</strong><br />
Quilcapunco-Inchupal<strong>la</strong><br />
Comisión <strong>de</strong><br />
Regantes<br />
Quilcapunco-Inchupal<strong>la</strong><br />
Quilcapunco-Inchupal<strong>la</strong><br />
Quilcapunco-Inchupal<strong>la</strong><br />
Quilcapunco-Inchupal<strong>la</strong><br />
Quilcapunco-Inchupal<strong>la</strong><br />
Quilcapunco-Inchupal<strong>la</strong><br />
Quilcapunco-Inchupal<strong>la</strong><br />
Quilcapunco-Inchupal<strong>la</strong><br />
Quilcapunco-Inchupal<strong>la</strong><br />
Quilcapunco-Inchupal<strong>la</strong><br />
Quilcapunco-Inchupal<strong>la</strong><br />
Quilcapunco-Inchupal<strong>la</strong><br />
Quilcapunco-Inchupal<strong>la</strong><br />
Quilcapunco-Inchupal<strong>la</strong><br />
Quilcapunco-Inchupal<strong>la</strong><br />
Quilcapunco-Inchupal<strong>la</strong><br />
Quilcapunco-Inchupal<strong>la</strong><br />
Quilcapunco-Inchupal<strong>la</strong><br />
Quilcapunco-Inchupal<strong>la</strong><br />
Quilcapunco-Inchupal<strong>la</strong>
<strong>Estudio</strong> <strong>Hidrológico</strong> <strong>de</strong> <strong>la</strong>s <strong>Cuenca</strong>s Huancané y Suches 2010<br />
Nº<br />
Cuadro Nº 9.4 Superficie <strong>de</strong> cedu<strong>la</strong> <strong>de</strong> cultivo – Subcuenca Muñani<br />
1 ALIANZA LLANCACAHUA 38 30.00<br />
2 JOSE CARLOS MARIATEGUI 34 50.00<br />
3 SAN ANTONIO DE PEÑON 20 14.00<br />
4 PEÑA GRANDE SAN FRANCISCO 21 50.00<br />
5 SAN ISIDRO DE PAMPA GRANDE 48 22.50<br />
6 SANTA ANA DE TARUCANI 111 80.00<br />
7 SANTA CRUZ DE MIJANI 20 61.00<br />
8 SANTA CRUZ DE CHOCALLACA 29 17.00<br />
9 SANTISIMA TRINIDAD 26 53.50<br />
10 CAMBRIA SUCHO 100 10.00<br />
11 CHOQUECHAMBI CARPANI 164 50.00<br />
12 CONDOR CANQUE CALLATOMASA 19 13.00<br />
13 MUÑANI CHICO 136 61.00<br />
14 ÑEQUEÑEQUE 45 30.00<br />
15 HUARACHANI-C.P NEQUENEQUE (Parceleros) 6 3.00<br />
16 PEDRO VILCAPAZA DE CHECAYANI 42 30.00<br />
17 TUPAC AMARU-II MALLQUINI 33 22.50<br />
18 JUAN VELASCO ALVARADO 41 18.00<br />
19 MAMAYA 16 10.00<br />
20 HUASACONA 191 70.00<br />
21 HUAMBUYO MITA 9 14.50<br />
22 TOMA 45 15.00<br />
USOS INDIVIDUALES<br />
Comité <strong>de</strong> Riego Nº Usuarios<br />
Area Bajo<br />
Riego<br />
(ha)<br />
1 CARMEN ABDON LIPA ESTEVEZ 1 6.00<br />
2 JESUSA VDA. DE PALAZUELOS 1 1.00<br />
3 MARIA N. PALAZUELOS CHOQUE Y FAMILIA 5 3.00<br />
4 VITALIANO MALAGA SANCHEZ 1 3.00<br />
5 JULIAN OCHOCHOQUE AGUIRRE 1 7.00<br />
6 MARIA MAMANI TIPO 1 1.00<br />
7 HERMOGENES COLQUE HUACANTARA 1 3.00<br />
8 ANDRES CCUNO CCUNO 1 1.00<br />
9 QUINTIN FLORES SACACA 1 1.00<br />
Total<br />
1207 751.00<br />
Papa Habas<br />
1.00<br />
Avena<br />
Forrajera<br />
Cebada Hortalizas<br />
Pastos<br />
Naturales<br />
Pastos<br />
Cultivados<br />
MINAG-ANA-DCPRH-AGUAS SUPERFICIALES Pág.285<br />
-<br />
-<br />
-<br />
-<br />
4.00<br />
-<br />
2.00<br />
-<br />
-<br />
-<br />
-<br />
1.00<br />
2.00<br />
-<br />
-<br />
0.50<br />
-<br />
-<br />
3.00<br />
-<br />
-<br />
0.50<br />
-<br />
0.50<br />
-<br />
-<br />
-<br />
-<br />
-<br />
-<br />
14.50<br />
-<br />
-<br />
-<br />
-<br />
-<br />
-<br />
-<br />
-<br />
-<br />
-<br />
-<br />
-<br />
-<br />
-<br />
-<br />
-<br />
-<br />
-<br />
-<br />
-<br />
-<br />
-<br />
-<br />
-<br />
-<br />
-<br />
-<br />
-<br />
-<br />
-<br />
-<br />
-<br />
Cultivos predominantes (ha)<br />
2.00<br />
-<br />
-<br />
-<br />
-<br />
4.00<br />
-<br />
-<br />
-<br />
-<br />
2.00<br />
-<br />
1.00<br />
1.00<br />
-<br />
2.00<br />
-<br />
1.00<br />
-<br />
5.00<br />
-<br />
-<br />
0.50<br />
-<br />
0.50<br />
-<br />
1.00<br />
-<br />
-<br />
-<br />
-<br />
20.00<br />
-<br />
-<br />
-<br />
-<br />
-<br />
-<br />
-<br />
-<br />
-<br />
-<br />
-<br />
-<br />
1.00<br />
-<br />
-<br />
-<br />
-<br />
-<br />
-<br />
2.00<br />
-<br />
-<br />
0.50<br />
-<br />
-<br />
-<br />
-<br />
-<br />
-<br />
-<br />
-<br />
3.50<br />
-<br />
-<br />
-<br />
-<br />
-<br />
-<br />
-<br />
-<br />
-<br />
-<br />
-<br />
-<br />
-<br />
-<br />
-<br />
-<br />
-<br />
-<br />
-<br />
-<br />
-<br />
-<br />
-<br />
-<br />
-<br />
-<br />
-<br />
-<br />
-<br />
-<br />
-<br />
-<br />
25.00<br />
50.00<br />
12.00<br />
46.00<br />
22.50<br />
60.00<br />
56.00<br />
14.00<br />
53.50<br />
10.00<br />
45.00<br />
13.00<br />
55.00<br />
22.00<br />
3.00<br />
20.00<br />
14.00<br />
16.00<br />
8.00<br />
50.00<br />
14.50<br />
15.00<br />
4.50<br />
1.00<br />
2.00<br />
2.00<br />
5.00<br />
1.00<br />
3.00<br />
1.00<br />
1.00<br />
645.00<br />
Cuadro Nº 9.5 Superficie <strong>de</strong> cedu<strong>la</strong> <strong>de</strong> cultivo – Subcuenca Medio Huancané<br />
Nº Comité <strong>de</strong> Riego<br />
1 CENTRAL HUASUNTA 10 10.00<br />
2 SAN MARTIN 41 17.00<br />
3 SANTIAGO DE BELLAVISTA 82 50.00<br />
4 VILLA CANDELARIA DE CHURURA 62 50.00<br />
5 SAN SALVADOR 40 10.00<br />
6 CCANCO 33 10.00<br />
7 CANCO A - CUPISCO 50 3.00<br />
USOS INDIVIDUALES<br />
Nº Usuarios<br />
Area Bajo<br />
Riego<br />
(ha)<br />
1 HONORATO LAVILLA LAURA 1 3.00<br />
2 MARIA MAMANI MINAYA 1 2.50<br />
3 MARIA ISABEL LUJAN PAREDES 1 4.00<br />
4 INES MINAYA VDA. DE LUJAN 1 4.00<br />
5 FRANCISCO LUJAN PAREDES 1 1.00<br />
6 MATIAS MOSCAIRO SACACA 1 3.00<br />
7 NEMESIO SURCO Y FRANCISCO CARITA 2 1.00<br />
8 MARCOS VILCAPAZA MAMANI 1 1.00<br />
9 LUCIA URVIOLA QUISPE 1 1.00<br />
10 BENITO, MIRANDA QUISPE Y FAMILIA 6 2.00<br />
Total<br />
334 172.50<br />
Papa Habas<br />
1.00<br />
2.00<br />
-<br />
2.00<br />
0.50<br />
0.70<br />
0.50<br />
-<br />
-<br />
-<br />
-<br />
-<br />
-<br />
-<br />
-<br />
-<br />
0.50<br />
7.20<br />
-<br />
-<br />
-<br />
-<br />
-<br />
-<br />
-<br />
-<br />
-<br />
-<br />
-<br />
-<br />
-<br />
-<br />
-<br />
-<br />
-<br />
-<br />
Cultivos predominantes (ha)<br />
Avena<br />
Forrajera<br />
2.00<br />
-<br />
-<br />
5.00<br />
-<br />
-<br />
-<br />
-<br />
-<br />
0.50<br />
0.50<br />
-<br />
-<br />
-<br />
-<br />
-<br />
-<br />
8.00<br />
Cebada Hortalizas<br />
-<br />
-<br />
-<br />
-<br />
-<br />
-<br />
-<br />
-<br />
-<br />
-<br />
-<br />
-<br />
-<br />
-<br />
-<br />
-<br />
-<br />
-<br />
-<br />
-<br />
-<br />
-<br />
-<br />
0.30<br />
0.50<br />
-<br />
-<br />
-<br />
-<br />
-<br />
-<br />
-<br />
-<br />
-<br />
-<br />
0.80<br />
Pastos<br />
Naturales<br />
6.00<br />
14.00<br />
50.00<br />
40.00<br />
6.60<br />
6.30<br />
1.40<br />
2.00<br />
2.00<br />
3.00<br />
3.00<br />
1.00<br />
3.00<br />
1.00<br />
1.00<br />
1.00<br />
1.00<br />
142.30<br />
Pastos<br />
Cultivados<br />
1.00<br />
1.00<br />
-<br />
3.00<br />
2.90<br />
2.70<br />
0.60<br />
1.00<br />
0.50<br />
0.50<br />
0.50<br />
-<br />
-<br />
-<br />
-<br />
-<br />
0.50<br />
14.20<br />
2.00<br />
-<br />
2.00<br />
4.00<br />
-<br />
12.00<br />
5.00<br />
1.00<br />
-<br />
-<br />
3.00<br />
-<br />
3.00<br />
5.00<br />
-<br />
8.00<br />
8.00<br />
1.00<br />
2.00<br />
10.00<br />
-<br />
-<br />
-<br />
-<br />
-<br />
1.00<br />
1.00<br />
-<br />
-<br />
-<br />
-<br />
68.00<br />
Comisión <strong>de</strong><br />
Regantes<br />
Putina<br />
Putina<br />
Putina<br />
Putina<br />
Huancané<br />
Huancané<br />
Huancané<br />
Putina<br />
Putina<br />
Putina<br />
Putina<br />
Putina<br />
Putina<br />
Putina<br />
Putina<br />
Putina<br />
Huancané<br />
Comisión <strong>de</strong><br />
Regantes<br />
Putina<br />
Putina<br />
Putina<br />
Putina<br />
Putina<br />
Putina<br />
Putina<br />
Putina<br />
Putina<br />
Putina<br />
Muñani<br />
Muñani<br />
Muñani<br />
Muñani<br />
Muñani<br />
Muñani<br />
Muñani<br />
Muñani<br />
Muñani<br />
Muñani<br />
Muñani<br />
Muñani<br />
Muñani<br />
Muñani<br />
Muñani<br />
Putina<br />
Putina<br />
Putina<br />
Putina<br />
Putina<br />
Putina
<strong>Estudio</strong> <strong>Hidrológico</strong> <strong>de</strong> <strong>la</strong>s <strong>Cuenca</strong>s Huancané y Suches 2010<br />
Cuadro Nº 9.6 Superficie <strong>de</strong> cedu<strong>la</strong> <strong>de</strong> cultivo – Subcuenca Tuyto<br />
Nº Comité <strong>de</strong> Riego<br />
Nº Usuarios<br />
1 LOS ANDES 14 15.00<br />
2 SAN JORGE 21 20.00<br />
3 SORATIRA 16 6.00<br />
4 MILLICUYO TUYTO 39 21.00<br />
5 MUNAYPA LACAYRIA 39 25.00<br />
6 MUNAYPA - JACHA MUNAYPA 24 3.00<br />
7 PAJCHACUYO 34 10.00<br />
8 LA PAMPILLA 24 2.00<br />
9 QUEJONI 83 3.00<br />
10 VILLA CANTUTANI 17 2.00<br />
11 YAPUTIRA 56 25.00<br />
12 JALSO HUERTAPATA - TUITO 12 1.00<br />
13 LA LIBERTAD 53 20.00<br />
14 TISNACOLLO 30 4.00<br />
15 NUEVO PROGRESO SOLITARIO 158 80.00<br />
16 CACERIO CALLEJON - LACAYPATA 33 10.00<br />
17 CCHACANI -CALAHUYO 13 6.00<br />
18 SOL SALIENTE - CALAHUYO 52 29.00<br />
19 PATACUCHO - CALAHUYO 21 4.00<br />
20 SOMBRERUNI 46 6.00<br />
21 PICHACANI PARIANI CALAHUYO 20 17.00<br />
22 VILALACAYA 16 1.00<br />
23 GUITARRANI 45 4.00<br />
24 QUEJONI PUTINA CUCHO 21 2.00<br />
25 PAMPA LACAYA 15 5.00<br />
26 LACAYANE - PANASCACHI - 4.00<br />
27 CARAHUTA - HUIJIPATA - 5.00<br />
28 COM. CAMP. CATAHUI - III SECTOR - 2.00<br />
29 CASTILLA UMA MALLCUSUCA MOHO 17 1.00<br />
30 HUARIHUMA 23 10.00<br />
31 MALLCOSUCA SECTOR CENTRO DE MOHO 30 2.00<br />
32 LLOCALLAMARCA SECTOR PALLAJAPA 9 4.00<br />
33 ANCO KARCA - ESQUERICA 94 50.00<br />
34 HALLA ALTO GRANDE 75 43.00<br />
35 LIZANI PAMPA 41 8.00<br />
36 HUAYLLACUYO 75 30.00<br />
37 FUNDO HUILACAYA DEL ISTPH. 1 3.00<br />
38 CHIASIPAMPA 9 6.00<br />
39 QUELLO QUELLO QUELLHUACOTA 47 10.00<br />
USUARIOS INDIVIDUALES<br />
Area Bajo<br />
Riego<br />
(ha)<br />
1 Victor, CHURA TINTA 1 1.00<br />
2 Mariano, MAMANI PERALTA 1 3.00<br />
3 Mariano, MAMANI CHAMBI 1 1.00<br />
4 Juan, MAMANI MAMANI 1 1.00<br />
5 Juan, TITO TINTA 1 1.00<br />
6 Constantino MAMANI QUISPE 1 1.00<br />
7 Julian LIMACHI MAMANI 1 1.00<br />
8 Andres, GODOY MIRANDA 1 1.00<br />
9 Andres, ABREGON TERAN (Campiña Chatruma) 1 1.00<br />
10 Familia, MAMANI SAAVEDRA(Hachauta) 1 2.00<br />
11 Nicolás, VARGAS CONDORI (P. Ananiso-Vilq.) 1 3.00<br />
12 Pedro, MAMANI LLUNGO 1 1.00<br />
13 Cipriano, CAMA PINTO 1 2.00<br />
14 Casimiro, CARRIZALES QUEA Y Adofo … 2 3.00<br />
15 ROGELIO MAYTA TITO 1 1.00<br />
16 JERONIMO VALERO MACEDO 1 1.00<br />
17 GLICERIO HERRERA CAMA Y OTROS 1 1.00<br />
18 ENRIQUE LARICO CAMA (CONCAPATA - CARAHUTA) 1.00<br />
Total<br />
1341 525.00<br />
Papa Habas<br />
MINAG-ANA-DCPRH-AGUAS SUPERFICIALES Pág.286<br />
-<br />
-<br />
-<br />
-<br />
5.00<br />
-<br />
3.00<br />
-<br />
-<br />
-<br />
-<br />
-<br />
2.00<br />
0.50<br />
20.00<br />
-<br />
-<br />
-<br />
-<br />
-<br />
-<br />
-<br />
0.70<br />
0.50<br />
0.70<br />
-<br />
-<br />
-<br />
0.50<br />
3.50<br />
1.00<br />
1.00<br />
-<br />
-<br />
-<br />
10.00<br />
-<br />
-<br />
-<br />
-<br />
-<br />
-<br />
-<br />
-<br />
-<br />
-<br />
-<br />
-<br />
-<br />
1.00<br />
-<br />
-<br />
-<br />
-<br />
0.30<br />
0.30<br />
-<br />
50.00<br />
-<br />
-<br />
-<br />
-<br />
1.00<br />
0.20<br />
4.00<br />
-<br />
-<br />
-<br />
-<br />
-<br />
-<br />
-<br />
-<br />
-<br />
-<br />
-<br />
-<br />
-<br />
-<br />
-<br />
-<br />
-<br />
-<br />
-<br />
-<br />
-<br />
-<br />
2.00<br />
-<br />
0.50<br />
-<br />
-<br />
-<br />
6.00<br />
-<br />
-<br />
-<br />
-<br />
-<br />
-<br />
-<br />
-<br />
-<br />
-<br />
-<br />
-<br />
-<br />
-<br />
-<br />
-<br />
-<br />
-<br />
0.20<br />
0.20<br />
-<br />
14.10<br />
Cultivos predominantes (ha)<br />
Avena<br />
Forrajera<br />
-<br />
-<br />
-<br />
-<br />
10.00<br />
0.30<br />
-<br />
-<br />
-<br />
-<br />
-<br />
-<br />
2.00<br />
0.50<br />
10.00<br />
-<br />
-<br />
-<br />
-<br />
-<br />
-<br />
-<br />
-<br />
0.50<br />
0.30<br />
-<br />
-<br />
-<br />
0.20<br />
-<br />
0.40<br />
2.00<br />
-<br />
-<br />
-<br />
3.50<br />
-<br />
-<br />
-<br />
-<br />
-<br />
-<br />
-<br />
-<br />
-<br />
-<br />
-<br />
-<br />
-<br />
-<br />
-<br />
-<br />
-<br />
-<br />
-<br />
-<br />
-<br />
29.70<br />
Cebada Hortalizas<br />
-<br />
-<br />
-<br />
-<br />
-<br />
-<br />
-<br />
-<br />
-<br />
-<br />
-<br />
-<br />
-<br />
-<br />
-<br />
-<br />
-<br />
-<br />
-<br />
-<br />
-<br />
-<br />
-<br />
-<br />
-<br />
-<br />
-<br />
-<br />
-<br />
-<br />
-<br />
-<br />
-<br />
-<br />
-<br />
-<br />
-<br />
-<br />
-<br />
-<br />
-<br />
-<br />
-<br />
-<br />
-<br />
-<br />
-<br />
-<br />
-<br />
-<br />
-<br />
-<br />
-<br />
-<br />
-<br />
-<br />
-<br />
-<br />
-<br />
-<br />
-<br />
-<br />
-<br />
-<br />
-<br />
-<br />
-<br />
-<br />
-<br />
-<br />
-<br />
-<br />
-<br />
-<br />
-<br />
-<br />
-<br />
-<br />
-<br />
0.30<br />
-<br />
-<br />
-<br />
-<br />
-<br />
-<br />
0.50<br />
-<br />
-<br />
-<br />
-<br />
-<br />
0.50<br />
-<br />
-<br />
-<br />
-<br />
-<br />
-<br />
-<br />
-<br />
-<br />
-<br />
-<br />
-<br />
0.20<br />
-<br />
-<br />
-<br />
-<br />
-<br />
-<br />
-<br />
-<br />
1.50<br />
Pastos<br />
Naturales<br />
15.00<br />
20.00<br />
6.00<br />
14.70<br />
6.30<br />
1.75<br />
2.10<br />
1.40<br />
2.10<br />
1.40<br />
17.50<br />
0.70<br />
11.20<br />
2.10<br />
35.00<br />
7.00<br />
4.20<br />
20.30<br />
2.80<br />
4.20<br />
11.90<br />
0.70<br />
2.10<br />
0.70<br />
2.80<br />
4.00<br />
5.00<br />
2.00<br />
0.20<br />
2.80<br />
0.40<br />
0.40<br />
35.00<br />
30.20<br />
5.60<br />
7.00<br />
2.10<br />
4.20<br />
7.00<br />
0.70<br />
2.10<br />
0.70<br />
0.70<br />
0.70<br />
0.70<br />
0.70<br />
0.70<br />
0.70<br />
1.25<br />
1.40<br />
0.70<br />
1.40<br />
2.10<br />
0.70<br />
0.40<br />
0.30<br />
1.00<br />
316.80<br />
Cuadro Nº 9.7 Superficie <strong>de</strong> cedu<strong>la</strong> <strong>de</strong> cultivo – Subcuenca L<strong>la</strong>che<br />
Nº Comité <strong>de</strong> Riego Nº Usuarios<br />
1 SAN JOSE DE SANTA CRUZ 49 15.00<br />
2 SAN IGNACIO DE MAYAPUNCO 60 18.00<br />
3 CENTRAL HUILACUNCA 16 6.00<br />
4 SANTIAGO DE AJJATIRA 96 51.00<br />
5 ALTO CUYO TUPAC AMARU 10 3.00<br />
6 TUPAC AMARU CALACALA 40 8.00<br />
7 CAQUEN 10 14.00<br />
8 TUNILA CAQUEN 20 8.00<br />
9 TUNILA HUATASANI 58 6.00<br />
10 CENTRO PECUARIO CALACALA DRAP 1 4.00<br />
11 JARDIN DE VICUÑAS CALACALA 170 15.00<br />
USOS INDIVIDUALES<br />
Area Bajo<br />
Riego<br />
(ha)<br />
1 Angel Damian ZAPATA LARICO 1 1.00<br />
2 Gabino G. LARICO YUCRA/FLORENCIA/ GODOY 1 1.00<br />
3 Marcos, MAMANI CHIPANA 1 1.00<br />
4 Gracie<strong>la</strong>, LARICO LARICO 1 1.00<br />
Total<br />
534 152.00<br />
Papa Habas<br />
-<br />
-<br />
3.00<br />
4.00<br />
0.50<br />
1.00<br />
2.00<br />
-<br />
-<br />
-<br />
-<br />
-<br />
-<br />
-<br />
-<br />
10.50<br />
-<br />
-<br />
0.50<br />
-<br />
-<br />
-<br />
-<br />
-<br />
-<br />
-<br />
-<br />
-<br />
-<br />
-<br />
-<br />
0.50<br />
Cultivos predominantes (ha)<br />
Avena<br />
Forrajera<br />
-<br />
-<br />
2.00<br />
3.00<br />
-<br />
1.00<br />
1.00<br />
-<br />
-<br />
-<br />
-<br />
-<br />
-<br />
-<br />
-<br />
7.00<br />
Cebada Hortalizas<br />
-<br />
-<br />
-<br />
-<br />
-<br />
-<br />
-<br />
-<br />
-<br />
-<br />
-<br />
-<br />
-<br />
-<br />
-<br />
-<br />
-<br />
-<br />
0.20<br />
2.00<br />
0.50<br />
-<br />
-<br />
-<br />
-<br />
-<br />
-<br />
-<br />
-<br />
-<br />
-<br />
2.70<br />
Pastos<br />
Naturales<br />
Pastos<br />
Cultivados<br />
10.50<br />
12.60<br />
0.20<br />
29.40<br />
1.40<br />
4.20<br />
7.70<br />
5.60<br />
4.20<br />
2.80<br />
10.50<br />
0.70<br />
0.70<br />
0.70<br />
0.70<br />
91.90<br />
-<br />
-<br />
-<br />
6.30<br />
2.70<br />
0.75<br />
0.90<br />
0.60<br />
0.90<br />
0.60<br />
7.50<br />
0.30<br />
4.80<br />
0.90<br />
15.00<br />
3.00<br />
1.80<br />
8.70<br />
1.20<br />
1.80<br />
5.10<br />
0.30<br />
0.90<br />
0.30<br />
1.20<br />
-<br />
-<br />
-<br />
0.10<br />
1.20<br />
0.20<br />
0.10<br />
15.00<br />
12.80<br />
2.40<br />
3.00<br />
0.90<br />
1.80<br />
3.00<br />
0.30<br />
0.90<br />
0.30<br />
0.30<br />
0.30<br />
0.30<br />
0.30<br />
0.30<br />
0.30<br />
0.55<br />
0.60<br />
0.30<br />
0.60<br />
0.90<br />
0.30<br />
0.10<br />
0.20<br />
-<br />
112.90<br />
Pastos<br />
Cultivados<br />
4.50<br />
5.40<br />
0.10<br />
12.60<br />
0.60<br />
1.80<br />
3.30<br />
2.40<br />
1.80<br />
1.20<br />
4.50<br />
0.30<br />
0.30<br />
0.30<br />
0.30<br />
39.40<br />
Comisión <strong>de</strong><br />
Regantes<br />
Cojata<br />
Cojata<br />
Cojata<br />
Huancané<br />
Huancané<br />
Huancané<br />
Huancané<br />
Huancané<br />
Huancané<br />
Huancané<br />
Huancané<br />
Huancané<br />
Huancané<br />
Huancané<br />
Huancané<br />
Huancané<br />
Huancané<br />
Huancané<br />
Huancané<br />
Huancané<br />
Huancané<br />
Huancané<br />
Huancané<br />
Huancané<br />
Huancané<br />
Huancané<br />
Huancané<br />
Huancané<br />
Rosaspata<br />
Rosaspata<br />
Rosaspata<br />
Rosaspata<br />
Rosaspata<br />
Rosaspata<br />
Rosaspata<br />
Rosaspata<br />
Rosaspata<br />
Rosaspata<br />
Rosaspata<br />
Rosaspata<br />
Rosaspata<br />
Rosaspata<br />
Rosaspata<br />
Rosaspata<br />
Rosaspata<br />
Huancané<br />
Huancané<br />
Huancané<br />
Huancané<br />
Huancané<br />
Huancané<br />
Huancané<br />
Huancané<br />
Huancané<br />
Huancané<br />
Huancané<br />
Huancané<br />
Comisión <strong>de</strong><br />
Regantes<br />
Huancané<br />
Huancané<br />
Huancané<br />
Huancané<br />
Huancané<br />
Huancané<br />
Huancané<br />
Huancané<br />
Huancané<br />
Huancané<br />
Huancané<br />
Huancané<br />
Huancané<br />
Huancané<br />
Huancané
<strong>Estudio</strong> <strong>Hidrológico</strong> <strong>de</strong> <strong>la</strong>s <strong>Cuenca</strong>s Huancané y Suches 2010<br />
<strong>Cuenca</strong> Suches<br />
Cuadro Nº 9.8 Superficie <strong>de</strong> cedu<strong>la</strong> <strong>de</strong> cultivo – Subcuenca Bajo Huancané<br />
Nº Comité <strong>de</strong> Riego Nº Usuarios<br />
1 LLACHOJANI HUANCHO 49 6.00<br />
2 ACOCOLLO HUERTACUCHO 38 4.00<br />
3 ACOCOLO RINCONADA 34 6.00<br />
4 FUJUPAMPA - HUANCHO 35 8.00<br />
5 CAPARAYA 92 3.00<br />
6 HUANCHO LIMA 108 6.00<br />
7 PAJCHACUCHO - QUECHAYA 12 2.00<br />
8 HUAYLLACUYO TUTUNI MILLIRAYA 20 1.00<br />
Nº<br />
USOS INDIVIDUALES<br />
Cuadro Nº 9.9 Resumen <strong>de</strong> superficie <strong>de</strong> cedu<strong>la</strong> <strong>de</strong> cultivo – <strong>Cuenca</strong> Suches (Perú)<br />
Subcuenca<br />
Nº Usuarios<br />
Area Bajo<br />
Riego<br />
(ha)<br />
1 Trapiche 115 392.30<br />
2 Caylloma 323 532.36<br />
3 Chueña Huata Jahuira 84 26.00<br />
4 Suches 93 407.77<br />
Total<br />
615 1,358.43<br />
Papa Habas<br />
-<br />
-<br />
-<br />
-<br />
-<br />
Avena<br />
Forrajera<br />
Cebada Hortalizas<br />
Pastos<br />
Naturales<br />
Pastos<br />
Cultivados<br />
MINAG-ANA-DCPRH-AGUAS SUPERFICIALES Pág.287<br />
-<br />
-<br />
-<br />
-<br />
-<br />
Cultivos predominantes (ha)<br />
Cuadro Nº 9.10 Superficie <strong>de</strong> cedu<strong>la</strong> <strong>de</strong> cultivo – Subcuenca Trapiche<br />
Nº Comité <strong>de</strong> Riego Nº Usuarios<br />
1 AURORA NORTE 10 70.00<br />
2 AURORA SECTOR NORTE 10 30.00<br />
3 MALLCUTIRA 19 10.08<br />
4 SANTA ROSA DE POKERA 40 60.00<br />
5 TRAPICHE 27 170.00<br />
6 CHOCÑACOTA - TRAPICHE 7 30.00<br />
7 COM.ADJUDICATORIA DE QUELLOTACUNI-TRAPICHE - 4.22<br />
USOS INDIVIDUALES<br />
Area Bajo<br />
Riego<br />
(ha)<br />
1 Bartolomé LUQUE MAMANI 1 1.00<br />
2 ANTONIO, QUISPE MAYATA 1 1.00<br />
3 SEVERINO, SANCHO VARGAS Y FAMILIA 6 2.00<br />
4 LUIS INGALUQUE Y ERNESTO INGALUQUE 2 1.00<br />
5 GERARDO HILASACA Y FAMILIA VARGAS 5 1.00<br />
Total<br />
388 42.00<br />
Area Bajo<br />
Riego<br />
(ha)<br />
1 JESUSA QUEA VDA DE MAMANI 1 8.00<br />
2 HILARIO FLORES CCAMA 1 10.00<br />
Total<br />
115 392.30<br />
Papa Habas<br />
2.00<br />
1.00<br />
2.00<br />
1.00<br />
Papa Habas<br />
-<br />
-<br />
-<br />
-<br />
-<br />
-<br />
-<br />
-<br />
3.00<br />
1.00<br />
0.50<br />
-<br />
-<br />
-<br />
0.30<br />
0.50<br />
11.30<br />
-<br />
-<br />
3.00<br />
2.50<br />
3.00<br />
2.00<br />
-<br />
-<br />
-<br />
-<br />
-<br />
-<br />
-<br />
-<br />
-<br />
2.00<br />
1.00<br />
0.50<br />
-<br />
-<br />
-<br />
0.20<br />
0.50<br />
14.70<br />
-<br />
-<br />
Cultivos predominantes (ha)<br />
Avena<br />
Forrajera<br />
0.30<br />
-<br />
-<br />
-<br />
-<br />
-<br />
Avena<br />
Forrajera<br />
-<br />
-<br />
-<br />
-<br />
-<br />
-<br />
-<br />
-<br />
-<br />
1.50<br />
-<br />
-<br />
-<br />
-<br />
-<br />
-<br />
-<br />
-<br />
-<br />
1.80<br />
-<br />
-<br />
Cebada Hortalizas<br />
-<br />
-<br />
-<br />
-<br />
Cultivos predominantes (ha)<br />
Cebada Hortalizas<br />
-<br />
-<br />
-<br />
-<br />
-<br />
-<br />
-<br />
-<br />
-<br />
-<br />
-<br />
-<br />
-<br />
-<br />
-<br />
-<br />
-<br />
-<br />
-<br />
-<br />
-<br />
-<br />
-<br />
-<br />
-<br />
0.30<br />
0.50<br />
-<br />
-<br />
-<br />
-<br />
-<br />
-<br />
-<br />
-<br />
-<br />
-<br />
-<br />
-<br />
-<br />
-<br />
-<br />
-<br />
-<br />
-<br />
-<br />
0.80<br />
-<br />
-<br />
Pastos<br />
Naturales<br />
-<br />
-<br />
-<br />
-<br />
-<br />
0.30<br />
-<br />
0.70<br />
2.40<br />
2.10<br />
0.70<br />
-<br />
-<br />
0.70<br />
0.70<br />
1.40<br />
0.40<br />
-<br />
9.40<br />
Pastos<br />
Naturales<br />
70.00<br />
30.00<br />
10.08<br />
60.00<br />
170.00<br />
30.00<br />
4.22<br />
8.00<br />
10.00<br />
392.30<br />
Pastos<br />
Cultivados<br />
0.10<br />
392.30<br />
532.36<br />
26.00<br />
407.77<br />
1,358.43<br />
Pastos<br />
Cultivados<br />
-<br />
-<br />
-<br />
-<br />
-<br />
-<br />
-<br />
-<br />
0.30<br />
1.10<br />
0.90<br />
0.30<br />
-<br />
-<br />
0.30<br />
0.30<br />
0.60<br />
0.10<br />
-<br />
4.00<br />
-<br />
-<br />
Comisión <strong>de</strong><br />
Regantes<br />
Huancané<br />
Huancané<br />
Huancané<br />
Huancané<br />
Huancané<br />
Huancané<br />
Huancané<br />
Huancané<br />
Huancané<br />
Huancané<br />
Huancané<br />
Huancané<br />
Huancané<br />
Cojata<br />
Cojata<br />
Cojata<br />
Cojata<br />
Cojata<br />
Cojata<br />
Cojata<br />
Cojata<br />
Cojata<br />
-<br />
-<br />
-<br />
-<br />
-<br />
Comisión <strong>de</strong><br />
Regantes
<strong>Estudio</strong> <strong>Hidrológico</strong> <strong>de</strong> <strong>la</strong>s <strong>Cuenca</strong>s Huancané y Suches 2010<br />
Nº Comité <strong>de</strong> Riego<br />
Cuadro Nº 9.11 Superficie <strong>de</strong> cedu<strong>la</strong> <strong>de</strong> cultivo – Subcuenca Caylloma<br />
1 CANTUMA 19 5.00<br />
2 QUENAJANI - COTAPATA 5 9.50<br />
3 QUENAJANI - PALCA JAHUIRA 10 30.46<br />
4 QUENAJANI - QUENCHEJE JAHUIRA 14 48.00<br />
5 QUENAJANI - QUIRINE 7 7.00<br />
6 QUENAJANI - SIGANA WICHINCA 6 4.00<br />
7 CAYLLOMA - CALANAZA 15 19.69<br />
8 CAYLLOMA - S. CHOJÑAPATA CHULL… 11 30.00<br />
9 CAYLLOMA - JICHAPALCA LETRERO PATA 7 45.00<br />
10 CAYLLOMA - JICHAPALCA WICHINCA PAMPA 4 21.00<br />
11 CAYLLOMA - VIZCACHANI 10 18.00<br />
12 SAN JUAN BAUTISTA DE CHAJANA 97 104.00<br />
13 JAPO 50 39.31<br />
14 KELLOTACUNI 11 9.00<br />
15 MALLCUNUTA 23 100.00<br />
16 OCCOPAMPA 16 16.00<br />
17 QUENAJANI QUILLCAPATA 8 9.00<br />
18 COM. CAMP. EN FORMACION BAJO JAPO - 1.00<br />
USOS INDIVIDUALES<br />
Nº Usuarios<br />
Area Bajo<br />
Riego<br />
(ha)<br />
1 MARCOS QUISPE CALLISAYA 1 8.00<br />
2 TOMAS YAMPARA TITO 1 2.00<br />
3 MANUEL MARIANO SUXSO CHURA 1 1.00<br />
4 JUANA VICTORIA LOPEZ VDA. DE YAMPARA 1 2.00<br />
5 GUILLERMO Y LEONIDAS LOPEZ CALIZAYA 3 2.00<br />
6 JUAN QUISPE, EMILIO E HILARIA BRAVO 3 1.40<br />
Total<br />
323 532.36<br />
Papa Habas<br />
Avena<br />
Forrajera<br />
Cebada Hortalizas<br />
Pastos<br />
Naturales<br />
Pastos<br />
Cultivados<br />
MINAG-ANA-DCPRH-AGUAS SUPERFICIALES Pág.288<br />
-<br />
-<br />
-<br />
-<br />
-<br />
-<br />
-<br />
-<br />
-<br />
-<br />
-<br />
-<br />
-<br />
-<br />
-<br />
-<br />
-<br />
-<br />
-<br />
-<br />
-<br />
-<br />
-<br />
-<br />
-<br />
-<br />
-<br />
-<br />
-<br />
-<br />
-<br />
-<br />
-<br />
-<br />
-<br />
-<br />
-<br />
-<br />
-<br />
-<br />
-<br />
-<br />
-<br />
-<br />
-<br />
-<br />
-<br />
-<br />
-<br />
-<br />
Cultivos predominantes (ha)<br />
-<br />
-<br />
-<br />
-<br />
-<br />
-<br />
-<br />
-<br />
-<br />
-<br />
-<br />
-<br />
-<br />
-<br />
-<br />
-<br />
-<br />
-<br />
-<br />
-<br />
-<br />
-<br />
-<br />
-<br />
-<br />
-<br />
-<br />
-<br />
-<br />
-<br />
-<br />
-<br />
-<br />
-<br />
-<br />
-<br />
-<br />
-<br />
-<br />
-<br />
-<br />
-<br />
-<br />
-<br />
-<br />
-<br />
-<br />
-<br />
-<br />
-<br />
-<br />
-<br />
-<br />
-<br />
-<br />
-<br />
-<br />
-<br />
-<br />
-<br />
-<br />
-<br />
-<br />
-<br />
-<br />
-<br />
-<br />
-<br />
-<br />
-<br />
-<br />
-<br />
-<br />
-<br />
-<br />
5.00<br />
9.50<br />
30.46<br />
48.00<br />
7.00<br />
4.00<br />
19.69<br />
30.00<br />
45.00<br />
21.00<br />
18.00<br />
104.00<br />
39.31<br />
9.00<br />
100.00<br />
16.00<br />
9.00<br />
1.00<br />
8.00<br />
2.00<br />
1.00<br />
2.00<br />
2.00<br />
1.40<br />
532.36<br />
Cuadro Nº 9.12 Superficie <strong>de</strong> cedu<strong>la</strong> <strong>de</strong> cultivo – Subcuenca Chueña Huata Jahuira<br />
Nº Comité <strong>de</strong> Riego Nº Usuarios<br />
1 SORAYCUCHO UMABAMBA ABAJO 18 8.00<br />
2 TOMAPIRHUA 30 5.00<br />
3 TOMAPIRHUA HUANACUYAPU 12 5.00<br />
4 UYULLANI TIRA - UMABAMBA 18 2.00<br />
USOS INDIVIDUALES<br />
1 GREGORIO SUXSO MAMANI 1 1.00<br />
2 SATURNINO MAMANI RAMIREZ 1 1.00<br />
3 JULIO SABINO TITO MACHACA 1 1.00<br />
4 VICENTE APAZA ANCCO 1 1.00<br />
5 CECILIO MAMANI CHALCO 1 1.00<br />
6 VICENTE QUISPE MAMANI 1 1.00<br />
Total<br />
84 26.00<br />
Nº<br />
Area Bajo<br />
Riego<br />
(ha)<br />
Papa Habas<br />
-<br />
-<br />
-<br />
-<br />
-<br />
-<br />
-<br />
-<br />
-<br />
-<br />
-<br />
-<br />
-<br />
-<br />
-<br />
-<br />
-<br />
-<br />
-<br />
-<br />
-<br />
-<br />
Cultivos predominantes (ha)<br />
Avena<br />
Forrajera<br />
-<br />
Cebada Hortalizas<br />
-<br />
-<br />
Pastos<br />
Naturales<br />
Cuadro Nº 9.13 Superficie <strong>de</strong> cedu<strong>la</strong> <strong>de</strong> cultivo – Subcuenca Suches<br />
1 AURORA PIÑUNI 7 24.00<br />
2 PERLAS DE ORO 17 105.00<br />
3 PIÑUNI 14 69.76<br />
4 RIO SUCHES 15 26.00<br />
5 ALTO PIÑUNI 9 15.00<br />
6 KISCACOLLO PULLAPULLANI - BELLAPAMPA 13 45.00<br />
7 ÑIQUEPATA PULLAPULLANI 18 47.85<br />
8 ÑIQUEPATA PULLAPULLANI SECTOR ARRIBA - 40.00<br />
9 NIPTON ÑIUQEPATA - 5.16<br />
USOS INDIVIDUALES<br />
Comité <strong>de</strong> Riego Nº Usuarios<br />
Area Bajo<br />
Riego<br />
(ha)<br />
1 BENITO QUISPE IQUISE 1 15.00<br />
2 HIPÓLITO LOPEZ CCALA (Aurora Chuaña) 1 15.00<br />
Total<br />
93 407.77<br />
Papa Habas<br />
-<br />
-<br />
-<br />
-<br />
-<br />
-<br />
-<br />
-<br />
-<br />
-<br />
-<br />
-<br />
-<br />
-<br />
-<br />
-<br />
-<br />
-<br />
-<br />
-<br />
-<br />
-<br />
-<br />
-<br />
-<br />
-<br />
-<br />
-<br />
-<br />
-<br />
-<br />
-<br />
-<br />
-<br />
-<br />
-<br />
-<br />
-<br />
-<br />
-<br />
-<br />
-<br />
-<br />
-<br />
Cultivos predominantes (ha)<br />
Avena<br />
Forrajera<br />
-<br />
-<br />
-<br />
-<br />
-<br />
-<br />
-<br />
-<br />
-<br />
-<br />
-<br />
-<br />
-<br />
-<br />
-<br />
-<br />
-<br />
-<br />
-<br />
-<br />
-<br />
-<br />
Cebada Hortalizas<br />
-<br />
-<br />
-<br />
-<br />
-<br />
-<br />
-<br />
-<br />
-<br />
-<br />
-<br />
-<br />
-<br />
-<br />
-<br />
-<br />
-<br />
-<br />
-<br />
-<br />
-<br />
-<br />
-<br />
-<br />
8.00<br />
5.00<br />
5.00<br />
2.00<br />
1.00<br />
1.00<br />
1.00<br />
1.00<br />
1.00<br />
1.00<br />
26.00<br />
Pastos<br />
Naturales<br />
24.00<br />
105.00<br />
69.76<br />
26.00<br />
15.00<br />
45.00<br />
47.85<br />
40.00<br />
5.16<br />
15.00<br />
15.00<br />
407.77<br />
-<br />
-<br />
-<br />
-<br />
-<br />
-<br />
-<br />
-<br />
-<br />
-<br />
-<br />
-<br />
-<br />
-<br />
-<br />
-<br />
-<br />
-<br />
-<br />
-<br />
-<br />
-<br />
-<br />
-<br />
-<br />
Pastos<br />
Cultivados<br />
-<br />
-<br />
-<br />
-<br />
-<br />
-<br />
-<br />
-<br />
-<br />
-<br />
-<br />
Pastos<br />
Cultivados<br />
-<br />
-<br />
-<br />
-<br />
-<br />
-<br />
-<br />
-<br />
-<br />
-<br />
-<br />
-<br />
Comisión <strong>de</strong><br />
Regantes<br />
Quilcapunco-Inchupal<strong>la</strong><br />
Cojata<br />
Cojata<br />
Cojata<br />
Cojata<br />
Cojata<br />
Cojata<br />
Cojata<br />
Cojata<br />
Cojata<br />
Cojata<br />
Cojata<br />
Cojata<br />
Cojata<br />
Cojata<br />
Cojata<br />
Cojata<br />
Cojata<br />
Cojata<br />
Cojata<br />
Cojata<br />
Cojata<br />
Cojata<br />
Cojata<br />
Comisión <strong>de</strong><br />
Regantes<br />
Cojata<br />
Cojata<br />
Cojata<br />
Cojata<br />
Cojata<br />
Cojata<br />
Cojata<br />
Cojata<br />
Cojata<br />
Cojata<br />
Comisión <strong>de</strong><br />
Regantes<br />
Cojata<br />
Cojata<br />
Cojata<br />
Cojata<br />
Cojata<br />
Cojata<br />
Cojata<br />
Cojata<br />
Cojata<br />
Cojata<br />
Cojata
<strong>Estudio</strong> <strong>Hidrológico</strong> <strong>de</strong> <strong>la</strong>s <strong>Cuenca</strong>s Huancané y Suches 2010<br />
9.2.1.2 Cedu<strong>la</strong> <strong>de</strong> cultivo<br />
En base a <strong>la</strong>s áreas <strong>de</strong> cultivo disponibles en cada una <strong>de</strong> <strong>la</strong>s subcuencas, se ha programado<br />
<strong>la</strong> cedu<strong>la</strong> <strong>de</strong> cultivo <strong>de</strong> acuerdo al pe<strong>río</strong>do vegetativo <strong>de</strong> cada especie existente en <strong>la</strong>s<br />
cuencas Huancané y Suches. Información obtenida <strong>de</strong>l PCR 2010-2011 ALA Huancané.<br />
Para <strong>la</strong>s subcuencas Alto Huancané, Pistune, Muñani y Medio Huancané, <strong>la</strong> cedu<strong>la</strong> <strong>de</strong><br />
cultivo programado <strong>de</strong> acuerdo al pe<strong>río</strong>do vegetativo <strong>de</strong> cada especie, es <strong>la</strong> siguiente:<br />
Papa : noviembre - mayo.<br />
Avena forrajera y Cebada : noviembre - abril.<br />
Hortalizas, pastos naturales y cultivados: todo el año.<br />
Para <strong>la</strong>s subcuencas Tuyto, L<strong>la</strong>che, Bajo Huancané, <strong>la</strong> cedu<strong>la</strong> <strong>de</strong> cultivo programado <strong>de</strong><br />
acuerdo al pe<strong>río</strong>do vegetativo <strong>de</strong> cada especie, es <strong>la</strong> siguiente:<br />
Papa : setiembre - marzo.<br />
Habas : agosto - marzo.<br />
Avena forrajera : octubre - marzo.<br />
Hortalizas, pastos naturales y cultivados: todo el año.<br />
Para <strong>la</strong>s subcuencas Trapiche, Caylloma, Chueña Huata Jahuira y Suches, <strong>la</strong> cedu<strong>la</strong> <strong>de</strong><br />
cultivo <strong>de</strong> pastos naturales el pe<strong>río</strong>do vegetativo es todo el año.<br />
En los Cuadros Nº 9.14 a 9.20 se presentan <strong>la</strong> cedu<strong>la</strong> <strong>de</strong> cultivo representativa, don<strong>de</strong><br />
muestra el calendario <strong>de</strong> siembra y cosecha <strong>de</strong> los cultivos en <strong>la</strong>s subcuencas <strong>de</strong> <strong>la</strong> cuenca<br />
Huancané. Igualmente para <strong>la</strong>s subcuencas <strong>de</strong> <strong>la</strong> cuenca Suches (Perú) en los Cuadros Nº<br />
9.21 a 9.24.<br />
Cuadro Nº 9.14 Cedu<strong>la</strong> <strong>de</strong> cultivo (calendario <strong>de</strong> siembra y cosecha) - Subcuenca Alto Huancané<br />
Cultivo<br />
Papa 3.30<br />
Avena forrajera 4.80<br />
Cebada 2.20<br />
Pastos naturales 292.90<br />
Pastos cultivados 10.70<br />
Total 313.90<br />
Cultivo<br />
Área<br />
(ha)<br />
Ago Sep Oct Nov Dic Ene Feb Mar Abr May Jun Jul<br />
Cuadro Nº 9.15 Cedu<strong>la</strong> <strong>de</strong> cultivo (calendario <strong>de</strong> siembra y cosecha) - Subcuenca Pistune<br />
Área<br />
(ha)<br />
Papa 3.00<br />
Avena forrajera 9.00<br />
Cebada 0.46<br />
Pastos naturales 362.76<br />
Pastos cultivados 14.00<br />
Total 389.22<br />
MINAG-ANA-DCPRH-AGUAS SUPERFICIALES Pág.289<br />
Mes<br />
Mes<br />
Ago Sep Oct Nov Dic Ene Feb Mar Abr May Jun Jul
<strong>Estudio</strong> <strong>Hidrológico</strong> <strong>de</strong> <strong>la</strong>s <strong>Cuenca</strong>s Huancané y Suches 2010<br />
Cultivo<br />
Cuadro Nº 9.16 Cedu<strong>la</strong> <strong>de</strong> cultivo (calendario <strong>de</strong> siembra y cosecha) - Subcuenca Muñani<br />
Área<br />
(ha)<br />
Papa 14.50<br />
Avena forrajera 20.00<br />
Cebada 3.50<br />
Pastos naturales 645.00<br />
Pastos cultivados 68.00<br />
Total 751.00<br />
Ago Sep Oct Nov Dic Ene Feb Mar Abr May Jun Jul<br />
Cuadro Nº 9.17 Cedu<strong>la</strong> <strong>de</strong> cultivo (calendario <strong>de</strong> siembra y cosecha) - Subcuenca Medio Huancané<br />
Cultivo<br />
Papa 7.20<br />
Avena forrajera 8.00<br />
Hortalizas 0.80<br />
Pastos naturales 142.30<br />
Pastos cultivados 14.20<br />
Total 172.50<br />
Cultivo<br />
Área<br />
(ha)<br />
MINAG-ANA-DCPRH-AGUAS SUPERFICIALES Pág.290<br />
Mes<br />
Mes<br />
Ago Sep Oct Nov Dic Ene Feb Mar Abr May Jun Jul<br />
Cuadro Nº 9.18 Cedu<strong>la</strong> <strong>de</strong> cultivo (calendario <strong>de</strong> siembra y cosecha) - Subcuenca Tuyto<br />
Papa 50.00<br />
Habas 14.10<br />
Avena forrajera 29.70<br />
Hortalizas 1.50<br />
Pastos naturales 316.80<br />
Pastos cultivados 112.90<br />
Total 525.00<br />
Cultivo<br />
Área<br />
(ha)<br />
Mes<br />
Ago Sep Oct Nov Dic Ene Feb Mar Abr May Jun Jul<br />
Cuadro Nº 9.19 Cedu<strong>la</strong> <strong>de</strong> cultivo (calendario <strong>de</strong> siembra y cosecha) - Subcuenca L<strong>la</strong>che<br />
Área<br />
(ha)<br />
Papa 10.50<br />
Habas 0.50<br />
Avena forrajera 7.00<br />
Hortalizas 2.70<br />
Pastos naturales 91.90<br />
Pastos cultivados 39.40<br />
Total 152.00<br />
Mes<br />
Ago Sep Oct Nov Dic Ene Feb Mar Abr May Jun Jul<br />
Cuadro Nº 9.20 Cedu<strong>la</strong> <strong>de</strong> cultivo (calendario <strong>de</strong> siembra y cosecha) - Subcuenca Bajo Huancané<br />
Cultivo<br />
Área<br />
(ha)<br />
Papa 11.30<br />
Habas 14.70<br />
Avena forrajera 1.80<br />
Hortalizas 0.80<br />
Pastos naturales 9.40<br />
Pastos cultivados 4.00<br />
Total 42.00<br />
Mes<br />
Ago Sep Oct Nov Dic Ene Feb Mar Abr May Jun Jul
<strong>Estudio</strong> <strong>Hidrológico</strong> <strong>de</strong> <strong>la</strong>s <strong>Cuenca</strong>s Huancané y Suches 2010<br />
Papa<br />
Habas<br />
Avena forrajera<br />
Hortalizas<br />
Cuadro Nº 9.21 Cedu<strong>la</strong> <strong>de</strong> cultivo (calendario <strong>de</strong> siembra y cosecha) - Subcuenca Trapiche<br />
Pastos naturales 392.30<br />
Pastos cultivados<br />
Papa<br />
Habas<br />
Cultivo<br />
Avena forrajera<br />
Hortalizas<br />
Área<br />
(ha)<br />
Total 392.30<br />
Cultivo<br />
Ago Sep Oct Nov Dic Ene Feb Mar Abr May Jun Jul<br />
Cuadro Nº 9.22 Cedu<strong>la</strong> <strong>de</strong> cultivo (calendario <strong>de</strong> siembra y cosecha) - Subcuenca Caylloma<br />
Pastos naturales 532.36<br />
Pastos cultivados<br />
Área<br />
(ha)<br />
Total 532.36<br />
MINAG-ANA-DCPRH-AGUAS SUPERFICIALES Pág.291<br />
Mes<br />
Mes<br />
Ago Sep Oct Nov Dic Ene Feb Mar Abr May Jun Jul<br />
Cuadro Nº 9.23 Cedu<strong>la</strong> <strong>de</strong> cultivo (calendario <strong>de</strong> siembra y cosecha) - Subcuenca Chueña Huata Jahuira<br />
Papa<br />
Habas<br />
Avena forrajera<br />
Hortalizas<br />
Pastos naturales 26.00<br />
Pastos cultivados<br />
Papa<br />
Habas<br />
Cultivo<br />
Avena forrajera<br />
Hortalizas<br />
Área<br />
(ha)<br />
Total 26.00<br />
Cultivo<br />
Mes<br />
Ago Sep Oct Nov Dic Ene Feb Mar Abr May Jun Jul<br />
Cuadro Nº 9.24 Cedu<strong>la</strong> <strong>de</strong> cultivo (calendario <strong>de</strong> siembra y cosecha) - Subcuenca Suches<br />
Pastos naturales 407.77<br />
Pastos cultivados<br />
Área<br />
(ha)<br />
Total 407.77<br />
Mes<br />
Ago Sep Oct Nov Dic Ene Feb Mar Abr May Jun Jul
<strong>Estudio</strong> <strong>Hidrológico</strong> <strong>de</strong> <strong>la</strong>s <strong>Cuenca</strong>s Huancané y Suches 2010<br />
9.2.1.3 Coeficiente <strong>de</strong> cultivo (Kc)<br />
Los coeficiente <strong>de</strong> uso consuntivo (Kc) <strong>de</strong> cada uno <strong>de</strong> los cultivos consi<strong>de</strong>rados en <strong>la</strong>s<br />
cedu<strong>la</strong>s <strong>de</strong> cultivo, correspon<strong>de</strong>n a los mismos valores <strong>de</strong>l P<strong>la</strong>n <strong>de</strong> Cultivo y Riego <strong>de</strong> <strong>la</strong><br />
campaña agríco<strong>la</strong> 2010-2011, información proporcionada por <strong>la</strong> Administración Local <strong>de</strong><br />
Agua Huancané, estos valores están previstos para <strong>la</strong>s diferentes fases <strong>de</strong>l pe<strong>río</strong>do<br />
vegetativo <strong>de</strong> los cultivos.<br />
En el presente estudio, se ha <strong>de</strong>terminado el coeficiente <strong>de</strong> cultivo pon<strong>de</strong>rado (Kcp) para el<br />
cálculo <strong>de</strong> <strong>la</strong> <strong>de</strong>manda <strong>de</strong> agua por subcuencas, el cual correspon<strong>de</strong> a <strong>la</strong> sumatoria <strong>de</strong> Kcp<br />
<strong>de</strong> cada cultivo en el mes. El Kcp para cada cultivo resulta al multiplicar el coeficiente Kc<br />
por el área <strong>de</strong> cada cultivo y dividido por el área total <strong>de</strong> riego correspondiente al mes, en<br />
forma simi<strong>la</strong>r se obtiene para otros meses <strong>de</strong>l año.<br />
En los Cuadros Nº 9.25 a 9.31 se muestran los coeficientes <strong>de</strong> cultivo Kc y Kcp para cada<br />
mes, para <strong>la</strong>s subcuencas <strong>de</strong> <strong>la</strong> cuenca <strong>de</strong>l <strong>río</strong> Huancané. Igualmente para <strong>la</strong>s subcuencas <strong>de</strong><br />
<strong>la</strong> cuenca <strong>de</strong>l <strong>río</strong> Suches (Perú) se muestran en los Cuadros Nº 9.32 a 9.35.<br />
Cultivo<br />
Cuadro Nº 9.25 Coeficientes <strong>de</strong> cultivo pon<strong>de</strong>rado (Kcp) - Subcuenca Alto Huancané<br />
Kc Kcp Kc Kcp Kc Kcp Kc Kcp Kc Kcp Kc Kcp Kc Kcp Kc Kcp Kc Kcp Kc Kcp Kc Kcp Kc Kcp<br />
Papa 3.30 0.52 0.01 0.75 0.01 1.00 0.01 1.00 0.01 0.73 0.01 0.69 0.01 0.57 0.01<br />
Avena forrajera 4.80 0.64 0.01 0.84 0.01 1.04 0.02 1.07 0.02 0.80 0.01 0.18 0.00<br />
Cebada 2.20 0.58 0.00 0.83 0.01 1.05 0.01 1.07 0.01 0.67 0.00 0.16 0.00<br />
Pastos naturales 292.90 0.71 0.68 0.84 0.81 0.89 0.86 0.90 0.84 0.90 0.84 0.80 0.75 0.83 0.77 0.88 0.82 0.90 0.84 0.90 0.86 0.90 0.87 0.63 0.61<br />
Pastos cultivados 10.70 0.83 0.03 0.96 0.03 1.01 0.04 1.00 0.03 0.98 0.03 0.80 0.03 0.84 0.03 0.95 0.03 0.99 0.03 1.01 0.04 0.98 0.03 0.77 0.03<br />
Área y Kp 313.90 303.60 0.71 303.60 0.84 303.60 0.90 313.90 0.89 313.90 0.90 313.90 0.82 313.90 0.84 313.90 0.87 313.90 0.88 306.90 0.91 303.60 0.90 303.60 0.64<br />
Cultivo<br />
Área<br />
(ha)<br />
Área<br />
(ha)<br />
Ago<br />
MINAG-ANA-DCPRH-AGUAS SUPERFICIALES Pág.292<br />
Mes<br />
Sep Oct Nov Dic Ene Feb Mar Abr May Jun<br />
Cuadro Nº 9.26 Coeficientes <strong>de</strong> cultivo pon<strong>de</strong>rado (Kcp) - Subcuenca Pistune<br />
Kc Kcp Kc Kcp Kc Kcp Kc Kcp Kc Kcp Kc Kcp Kc Kcp Kc Kcp Kc Kcp Kc Kcp Kc Kcp Kc Kcp<br />
Papa 3.00 0.52 0.00 0.75 0.01 1.00 0.01 1.00 0.01 0.73 0.01 0.69 0.01 0.57 0.00<br />
Avena forrajera 9.00 0.64 0.01 0.84 0.02 1.04 0.02 1.07 0.02 0.80 0.02 0.18 0.00<br />
Cebada 0.46 0.58 0.00 0.83 0.00 1.05 0.00 1.07 0.00 0.67 0.00 0.16 0.00<br />
Pastos naturales 362.76 0.71 0.68 0.84 0.81 0.89 0.86 0.90 0.84 0.90 0.84 0.80 0.75 0.83 0.77 0.88 0.82 0.90 0.84 0.90 0.86 0.90 0.87 0.63 0.61<br />
Pastos cultivados 14.00 0.83 0.03 0.96 0.04 1.01 0.04 1.00 0.04 0.98 0.04 0.80 0.03 0.84 0.03 0.95 0.03 0.99 0.04 1.01 0.04 0.98 0.04 0.77 0.03<br />
Área y Kp 389.22 376.76 0.71 376.76 0.85 376.76 0.90 389.22 0.89 389.22 0.91 389.22 0.81 389.22 0.83 389.22 0.88 389.22 0.89 379.76 0.90 376.76 0.91 376.76 0.64<br />
Cultivo<br />
Área<br />
(ha)<br />
Ago Sep Oct Nov Dic Ene Feb Mar Abr May<br />
Cuadro Nº 9.27 Coeficientes <strong>de</strong> cultivo pon<strong>de</strong>rado (Kcp) - Subcuenca Muñani<br />
Ago Sep Oct Nov Dic<br />
Ene Feb<br />
Mes<br />
Jul<br />
Jun Jul<br />
Kc Kcp Kc Kcp Kc Kcp Kc Kcp Kc Kcp Kc Kcp Kc Kcp Kc Kcp Kc Kcp Kc Kcp Kc Kcp Kc Kcp<br />
Papa 14.50 0.52 0.01 0.75 0.01 1.00 0.02 1.00 0.02 0.73 0.01 0.69 0.01 0.57 0.01<br />
Avena forrajera 20.00 0.64 0.02 0.84 0.02 1.04 0.03 1.07 0.03 0.80 0.02 0.18 0.00<br />
Cebada 3.50 0.58 0.00 0.83 0.00 1.05 0.00 1.07 0.00 0.67 0.00 0.16 0.00<br />
Pastos naturales 645.00 0.71 0.64 0.84 0.76 0.89 0.81 0.90 0.77 0.90 0.77 0.80 0.69 0.83 0.71 0.88 0.76 0.90 0.77 0.90 0.80 0.90 0.81 0.63 0.57<br />
Pastos cultivados 68.00 0.83 0.08 0.96 0.09 1.01 0.10 1.00 0.09 0.98 0.09 0.80 0.07 0.84 0.08 0.95 0.09 0.99 0.09 1.01 0.09 0.98 0.09 0.77 0.07<br />
Área y Kp 751.00 713.00 0.72 713.00 0.85 713.00 0.91 751.00 0.89 751.00 0.89 751.00 0.81 751.00 0.84 751.00 0.88 751.00 0.87 727.50 0.90 713.00 0.90 713.00 0.64<br />
Mes<br />
Mar Abr May Jun Jul
<strong>Estudio</strong> <strong>Hidrológico</strong> <strong>de</strong> <strong>la</strong>s <strong>Cuenca</strong>s Huancané y Suches 2010<br />
Cultivo<br />
Cuadro Nº 9.28 Coeficientes <strong>de</strong> cultivo pon<strong>de</strong>rado (Kcp) - Subcuenca Medio Huancané<br />
Área<br />
(ha)<br />
Ago Sep Oct Nov Dic Ene Feb Mar Abr May<br />
Kc Kcp Kc Kcp Kc Kcp Kc Kcp Kc Kcp Kc Kcp Kc Kcp Kc Kcp Kc Kcp Kc Kcp Kc Kcp Kc Kcp<br />
Papa 7.20 0.52 0.02 0.75 0.03 1.00 0.04 1.00 0.04 0.73 0.03 0.69 0.03 0.57 0.02<br />
Avena forrajera 8.00 0.64 0.03 0.84 0.04 1.04 0.05 1.07 0.05 0.80 0.04 0.18 0.01<br />
Hortalizas 0.80 0.98 0.00 0.98 0.00 0.98 0.00 0.98 0.00 0.98 0.00 0.98 0.00 0.98 0.00 0.98 0.00 0.98 0.00 0.98 0.00 0.98 0.00 0.98 0.00<br />
Pastos naturales 142.30 0.71 0.64 0.84 0.76 0.89 0.81 0.90 0.74 0.90 0.74 0.80 0.66 0.83 0.68 0.88 0.73 0.90 0.74 0.90 0.78 0.90 0.81 0.63 0.57<br />
Pastos cultivados 14.20 0.83 0.07 0.96 0.09 1.01 0.09 1.00 0.08 0.98 0.08 0.80 0.07 0.84 0.07 0.95 0.08 0.99 0.08 1.01 0.09 0.98 0.09 0.77 0.07<br />
Área y Kp 172.50 157.30 0.71 157.30 0.85 157.30 0.90 172.50 0.87 172.50 0.89 172.50 0.82 172.50 0.84 172.50 0.88 172.50 0.86 164.50 0.89 157.30 0.90 157.30 0.64<br />
Cultivo<br />
Área<br />
(ha)<br />
Cuadro Nº 9.29 Coeficientes <strong>de</strong> cultivo pon<strong>de</strong>rado (Kcp) - Subcuenca Tuyto<br />
MINAG-ANA-DCPRH-AGUAS SUPERFICIALES Pág.293<br />
Mes<br />
Jun Jul<br />
Ago Sep Oct Nov Dic Ene Feb Mar Abr May Jun Jul<br />
Kc Kcp Kc Kcp Kc Kcp Kc Kcp Kc Kcp Kc Kcp Kc Kcp Kc Kcp Kc Kcp Kc Kcp Kc Kcp Kc Kcp<br />
Papa 50.00 0.52 0.05 0.75 0.07 1.00 0.10 1.00 0.10 0.73 0.07 0.69 0.07 0.57 0.05<br />
Habas 14.10 0.73 0.02 0.74 0.02 0.76 0.02 0.87 0.02 1.06 0.03 1.09 0.03 0.57 0.02 0.52 0.01<br />
Avena forrajera 29.70 0.64 0.04 0.84 0.05 1.04 0.06 1.07 0.06 0.80 0.05 0.18 0.01<br />
Hortalizas 1.50 0.98 0.00 0.98 0.00 0.98 0.00 0.98 0.00 0.98 0.00 0.98 0.00 0.98 0.00 0.98 0.00 0.98 0.00 0.98 0.00 0.98 0.00 0.98 0.00<br />
Pastos naturales 316.80 0.71 0.51 0.84 0.54 0.89 0.54 0.90 0.54 0.90 0.54 0.80 0.48 0.83 0.50 0.88 0.53 0.90 0.66 0.90 0.66 0.90 0.66 0.63 0.46<br />
Pastos cultivados 112.90 0.83 0.21 0.96 0.22 1.01 0.22 1.00 0.22 0.98 0.21 0.80 0.17 0.84 0.18 0.95 0.20 0.99 0.26 1.01 0.26 0.98 0.26 0.77 0.20<br />
Área y Kp 525.00 445.30 0.74 495.30 0.83 525.00 0.89 525.00 0.93 525.00 0.94 525.00 0.81 525.00 0.82 525.00 0.80 431.20 0.92 431.20 0.92 431.20 0.92 431.20 0.66<br />
Cultivo<br />
Área<br />
(ha)<br />
Cuadro Nº 9.30 Coeficientes <strong>de</strong> cultivo pon<strong>de</strong>rado (Kcp) - Subcuenca L<strong>la</strong>che<br />
Ago Sep Oct Nov Dic Ene Feb Mar Abr May Jun<br />
Mes<br />
Kc Kcp Kc Kcp Kc Kcp Kc Kcp Kc Kcp Kc Kcp Kc Kcp Kc Kcp Kc Kcp Kc Kcp Kc Kcp Kc Kcp<br />
Papa 10.50 0.52 0.04 0.75 0.05 1.00 0.07 1.00 0.07 0.73 0.05 0.69 0.05 0.57 0.04<br />
Habas 0.50 0.73 0.00 0.74 0.00 0.76 0.00 0.87 0.00 1.06 0.00 1.09 0.00 0.57 0.00 0.52 0.00<br />
Avena forrajera 7.00 0.64 0.03 0.84 0.04 1.04 0.05 1.07 0.05 0.80 0.04 0.18 0.01<br />
Hortalizas 2.70 0.98 0.02 0.98 0.02 0.98 0.02 0.98 0.02 0.98 0.02 0.98 0.02 0.98 0.02 0.98 0.02 0.98 0.02 0.98 0.02 0.98 0.02 0.98 0.02<br />
Pastos naturales 91.90 0.71 0.49 0.84 0.53 0.89 0.54 0.90 0.54 0.90 0.54 0.80 0.48 0.83 0.50 0.88 0.53 0.90 0.62 0.90 0.62 0.90 0.62 0.63 0.43<br />
Pastos cultivados 39.40 0.83 0.24 0.96 0.26 1.01 0.26 1.00 0.26 0.98 0.25 0.80 0.21 0.84 0.22 0.95 0.25 0.99 0.29 1.01 0.30 0.98 0.29 0.77 0.23<br />
Área y Kp 152.00 134.50 0.75 145.00 0.85 152.00 0.90 152.00 0.93 152.00 0.93 152.00 0.81 152.00 0.83 152.00 0.85 134.00 0.93 134.00 0.94 134.00 0.93 134.00 0.68<br />
Cuadro Nº 9.31 Coeficientes <strong>de</strong> cultivo pon<strong>de</strong>rado (Kcp) - Subcuenca Bajo Huancané<br />
Mes<br />
Kc Kcp Kc Kcp Kc Kcp Kc Kcp Kc Kcp Kc Kcp Kc Kcp Kc Kcp Kc Kcp Kc Kcp Kc Kcp Kc Kcp<br />
Papa 11.30 0.52 0.15 0.75 0.20 1.00 0.27 1.00 0.27 0.73 0.20 0.69 0.19 0.57 0.15<br />
Habas 14.70 0.73 0.37 0.74 0.27 0.76 0.27 0.87 0.30 1.06 0.37 1.09 0.38 0.57 0.20 0.52 0.18<br />
Avena forrajera 1.80 0.64 0.03 0.84 0.04 1.04 0.04 1.07 0.05 0.80 0.03 0.18 0.01<br />
Hortalizas 0.80 0.98 0.03 0.98 0.02 0.98 0.02 0.98 0.02 0.98 0.02 0.98 0.02 0.98 0.02 0.98 0.02 0.98 0.06 0.98 0.06 0.98 0.06 0.98 0.06<br />
Pastos naturales 9.40 0.71 0.23 0.84 0.20 0.89 0.20 0.90 0.20 0.90 0.20 0.80 0.18 0.83 0.19 0.88 0.20 0.90 0.60 0.90 0.60 0.90 0.60 0.63 0.42<br />
Pastos cultivados 4.00 0.83 0.11 0.96 0.10 1.01 0.10 1.00 0.10 0.98 0.09 0.80 0.08 0.84 0.08 0.95 0.09 0.99 0.28 1.01 0.28 0.98 0.28 0.77 0.22<br />
Papa<br />
Habas<br />
Cultivo<br />
Área<br />
(ha)<br />
Ago Sep Oct Nov Dic Ene Feb<br />
Área y Kp 42.00 28.90 0.74 40.20 0.74 42.00 0.82 42.00 0.93 42.00 0.99 42.00 0.91 42.00 0.71 42.00 0.65 14.20 0.94 14.20 0.94 14.20 0.94 14.20 0.70<br />
Cultivo<br />
Avena forrajera<br />
Hortalizas<br />
Mes<br />
Mar Abr May Jun Jul<br />
Cuadro Nº 9.32 Coeficientes <strong>de</strong> cultivo pon<strong>de</strong>rado (Kcp) - Subcuenca Trapiche<br />
Kc Kcp Kc Kcp Kc Kcp Kc Kcp Kc Kcp Kc Kcp Kc Kcp Kc Kcp Kc Kcp Kc Kcp Kc Kcp Kc Kcp<br />
Pastos naturales 392.30 0.71 0.71 0.84 0.84 0.89 0.89 0.90 0.90 0.90 0.90 0.80 0.80 0.83 0.83 0.88 0.88 0.90 0.90 0.90 0.90 0.90 0.90 0.63 0.63<br />
Pastos cultivados<br />
Área<br />
(ha)<br />
Área y Kp 392.30 392.30 0.71 392.30 0.84 392.30 0.89 392.30 0.90 392.30 0.90 392.30 0.80 392.30 0.83 392.30 0.88 392.30 0.90 392.30 0.90 392.30 0.90 392.30 0.63<br />
Mes<br />
Ago Sep Oct Nov Dic Ene Feb Mar Abr May Jun Jul<br />
Jul
<strong>Estudio</strong> <strong>Hidrológico</strong> <strong>de</strong> <strong>la</strong>s <strong>Cuenca</strong>s Huancané y Suches 2010<br />
Papa<br />
Habas<br />
Cultivo<br />
Avena forrajera<br />
Hortalizas<br />
Cuadro Nº 9.33 Coeficientes <strong>de</strong> cultivo pon<strong>de</strong>rado (Kcp) - Subcuenca Caylloma<br />
Kc Kcp Kc Kcp Kc Kcp Kc Kcp Kc Kcp Kc Kcp Kc Kcp Kc Kcp Kc Kcp Kc Kcp Kc Kcp Kc Kcp<br />
Pastos naturales 532.36 0.71 0.71 0.84 0.84 0.89 0.89 0.90 0.90 0.90 0.90 0.80 0.80 0.83 0.83 0.88 0.88 0.90 0.90 0.90 0.90 0.90 0.90 0.63 0.63<br />
Pastos cultivados<br />
Papa<br />
Habas<br />
Área<br />
(ha)<br />
Área y Kp 532.36 532.36 0.71 532.36 0.84 532.36 0.89 532.36 0.90 532.36 0.90 532.36 0.80 532.36 0.83 532.36 0.88 532.36 0.90 532.36 0.90 532.36 0.90 532.36 0.63<br />
Cultivo<br />
Avena forrajera<br />
Hortalizas<br />
MINAG-ANA-DCPRH-AGUAS SUPERFICIALES Pág.294<br />
Mes<br />
Ago Sep Oct Nov Dic Ene Feb Mar Abr May Jun Jul<br />
Cuadro Nº 9.34 Coeficientes <strong>de</strong> cultivo pon<strong>de</strong>rado (Kcp) - Subcuenca Chueña Huata Jahuira<br />
Kc Kcp Kc Kcp Kc Kcp Kc Kcp Kc Kcp Kc Kcp Kc Kcp Kc Kcp Kc Kcp Kc Kcp Kc Kcp Kc Kcp<br />
Pastos naturales 26.00 0.71 0.71 0.84 0.84 0.89 0.89 0.90 0.90 0.90 0.90 0.80 0.80 0.83 0.83 0.88 0.88 0.90 0.90 0.90 0.90 0.90 0.90 0.63 0.63<br />
Pastos cultivados<br />
Papa<br />
Habas<br />
Área<br />
(ha)<br />
Ago Sep Oct Nov Dic Ene Feb Mar Abr May Jun Jul<br />
Área y Kp 26.00 26.00 0.71 26.00 0.84 26.00 0.89 26.00 0.90 26.00 0.90 26.00 0.80 26.00 0.83 26.00 0.88 26.00 0.90 26.00 0.90 26.00 0.90 26.00 0.63<br />
Cultivo<br />
Avena forrajera<br />
Hortalizas<br />
Cuadro Nº 9.35 Coeficientes <strong>de</strong> cultivo pon<strong>de</strong>rado (Kcp) - Subcuenca Suches<br />
Mes<br />
Kc Kcp Kc Kcp Kc Kcp Kc Kcp Kc Kcp Kc Kcp Kc Kcp Kc Kcp Kc Kcp Kc Kcp Kc Kcp Kc Kcp<br />
Pastos naturales 407.77 0.71 0.71 0.84 0.84 0.89 0.89 0.90 0.90 0.90 0.90 0.80 0.80 0.83 0.83 0.88 0.88 0.90 0.90 0.90 0.90 0.90 0.90 0.63 0.63<br />
Pastos cultivados<br />
Área<br />
(ha)<br />
Ago Sep Oct Nov<br />
Dic Ene Feb Mar<br />
Abr May Jun Jul<br />
Área y Kp 407.77 407.77 0.71 407.77 0.84 407.77 0.89 407.77 0.90 407.77 0.90 407.77 0.80 407.77 0.83 407.77 0.88 407.77 0.90 407.77 0.90 407.77 0.90 407.77 0.63<br />
9.2.1.4 Evapotranspiración potencial (ETP)<br />
Con <strong>la</strong> información <strong>de</strong> evapotranspiración potencial calcu<strong>la</strong>da para cada estación<br />
meteorológica en el capítulo 4, ítem 4.1.7.4, se ha calcu<strong>la</strong>do <strong>la</strong> evapotranspiración<br />
potencial areal para cada subcuenca <strong>de</strong> <strong>la</strong>s cuencas Huancané y Suches, empleando el<br />
método <strong>de</strong> Polígonos <strong>de</strong> Thiessen. Ver Cuadros Nº 9.36 y 9.37.<br />
Subcuenca<br />
Cuadro Nº 9.36 Evapotranspiración potencial areal (mm) - <strong>Cuenca</strong> Huancané<br />
Alto Huancane 91.6 92.8 101.6 96.8 92.1 84.0 78.0 86.6 83.1 83.4 76.6 75.9 1042.5<br />
Pistune 106.3 106.0 119.0 111.8 107.3 93.4 86.3 96.5 93.2 92.0 87.0 82.4 1181.2<br />
Muñani 127.0 130.1 136.2 129.9 120.2 107.3 97.9 107.8 105.0 109.5 100.1 111.3 1382.3<br />
Medio Huancané 109.1 106.5 124.9 115.5 112.8 95.8 89.0 102.0 98.1 95.8 94.8 83.7 1228.1<br />
Tuyto 101.8 107.4 116.6 111.1 104.3 94.9 85.9 93.2 89.1 86.7 76.4 81.8 1149.2<br />
L<strong>la</strong>che 108.9 108.1 125.9 117.1 113.5 96.9 89.8 101.9 97.9 95.6 93.3 84.6 1233.5<br />
Bajo Huancane 107.6 119.7 133.0 129.0 118.7 105.1 95.8 101.4 96.6 94.6 82.2 90.8 1274.4<br />
Mes<br />
Mes Total<br />
Ago Sep Oct Nov Dic Ene Feb Mar Abr May Jun Jul anual
<strong>Estudio</strong> <strong>Hidrológico</strong> <strong>de</strong> <strong>la</strong>s <strong>Cuenca</strong>s Huancané y Suches 2010<br />
Subcuenca<br />
Cuadro Nº 9.37 Evapotranspiración potencial areal (mm) - <strong>Cuenca</strong> Suches<br />
Mes Total<br />
Ago Sep Oct Nov Dic Ene Feb Mar Abr May Jun Jul anual<br />
Trapiche 81.0 82.9 85.6 83.5 78.4 75.7 70.4 76.7 73.5 74.7 65.1 68.6 916.1<br />
Caylloma 92.2 91.6 94.0 90.5 85.3 79.6 73.4 80.2 78.2 79.6 70.3 72.5 987.4<br />
Chueña Huata Jahuira 100.1 97.5 99.2 94.8 89.6 82.2 75.3 82.5 81.3 82.8 73.8 75.0 1034.1<br />
Suches (lugar Cuchaul<strong>la</strong>) 91.2 90.6 92.8 89.5 84.3 79.2 73.0 79.8 77.6 79.0 69.7 72.1 978.8<br />
9.2.1.5 Evapotranspiración <strong>de</strong> cultivo (ETc)<br />
L<strong>la</strong>mado también evapotranspiración real <strong>de</strong> cultivo, se obtiene multiplicando el<br />
coeficiente <strong>de</strong> cultivo (Kcp) con <strong>la</strong> evapotranspiración potencial <strong>de</strong>l mes correspondiente.<br />
La ecuación <strong>de</strong> evapotranspiración <strong>de</strong> cultivo es <strong>la</strong> siguiente:<br />
ETc Kcp ETP<br />
Don<strong>de</strong>:<br />
ETc = Evapotranspiración <strong>de</strong> cultivo (mm).<br />
Kcp = Coeficiente <strong>de</strong> cultivo pon<strong>de</strong>rado.<br />
ETP = Evapotranspiración potencial (mm).<br />
Los resultados se muestran en a<strong>de</strong><strong>la</strong>nte, en los cuadros <strong>de</strong> cálculo <strong>de</strong> <strong>de</strong>mandas <strong>de</strong> agua<br />
para cada una <strong>de</strong> <strong>la</strong>s subcuencas <strong>de</strong> estudio.<br />
9.2.1.6 Precipitación efectiva (PE)<br />
La precipitación efectiva es aquel<strong>la</strong> fracción <strong>de</strong> <strong>la</strong> precipitación total que es aprovechada<br />
por <strong>la</strong>s p<strong>la</strong>ntas. La otra fracción <strong>de</strong> <strong>la</strong> precipitación total que no es utilizada por el cultivo,<br />
se pier<strong>de</strong> por escorrentía, perco<strong>la</strong>ción profunda, evaporación, etc. Depen<strong>de</strong> <strong>de</strong> múltiples<br />
factores como pue<strong>de</strong>n ser <strong>la</strong> intensidad <strong>de</strong> <strong>la</strong> precipitación o <strong>la</strong> ari<strong>de</strong>z <strong>de</strong>l clima, y también<br />
<strong>de</strong> otros como <strong>la</strong> inclinación <strong>de</strong>l terreno, contenido en humedad <strong>de</strong>l suelo o velocidad <strong>de</strong><br />
infiltración.<br />
Para el cálculo <strong>de</strong> <strong>la</strong> precipitación efectiva se ha empleado el método <strong>de</strong>l Water Power<br />
Resources Service (WPRS-USA), para ello se ha utilizado <strong>la</strong> precipitación areal mensual al<br />
75% <strong>de</strong> persistencia <strong>de</strong>terminadas con <strong>la</strong> fórmu<strong>la</strong> <strong>de</strong> Weibull.<br />
Tab<strong>la</strong> Nº 9.1 Método <strong>de</strong> Water Power Resources Service (WPRS-USA)<br />
para <strong>de</strong>terminar <strong>la</strong> precipitación efectiva<br />
Incremento <strong>de</strong> <strong>la</strong> precipitación (mm)<br />
Porcentaje <strong>de</strong> <strong>la</strong> precipitación<br />
efectiva<br />
5 0<br />
30 95<br />
55 90<br />
80 82<br />
105 65<br />
130 45<br />
155 25<br />
> 155 5<br />
MINAG-ANA-DCPRH-AGUAS SUPERFICIALES Pág.295
<strong>Estudio</strong> <strong>Hidrológico</strong> <strong>de</strong> <strong>la</strong>s <strong>Cuenca</strong>s Huancané y Suches 2010<br />
La precipitación mensual calcu<strong>la</strong>da al 75% <strong>de</strong> persistencia y <strong>la</strong> precipitación efectiva<br />
correspondiente para cada subcuenca <strong>de</strong> <strong>la</strong>s cuencas Huancané y Suches, se muestran en<br />
los Cuadros Nº 9.38 y 9.39.<br />
Cuadro Nº 9.38 Precipitación mensual al 75% <strong>de</strong> persistencia y precipitación efectiva (mm) - <strong>Cuenca</strong><br />
Huancané<br />
Subcuenca<br />
Subcuenca Alto Huancané<br />
Precipitación al 75% P. 1.8 14.8 30.2 40.0 74.6 100.8 81.5 72.8 30.5 6.2 0.1 0.2 453.5<br />
Precipitación efectiva 0.0 9.3 23.9 32.8 62.3 80.3 67.7 60.8 24.2 1.1 0.0 0.0 362.4<br />
Subcuenca Pistune<br />
Precipitación al 75% P. 2.6 18.3 35.4 45.9 74.0 115.2 81.7 70.9 25.9 3.4 0.2 0.4 473.9<br />
Precipitación efectiva 0.0 12.6 28.6 38.1 61.8 87.6 67.9 59.3 19.9 0.0 0.0 0.0 375.8<br />
Subcuenca Muñani<br />
Precipitación al 75% P. 0.4 9.9 29.4 36.9 63.2 105.9 76.7 65.9 24.4 2.3 0.0 0.0 415.0<br />
Precipitación efectiva 0.0 4.7 23.2 30.0 53.0 83.4 64.0 55.2 18.4 0.0 0.0 0.0 331.9<br />
Subcuenca Medio Huancané<br />
Precipitación al 75% P. 0.7 15.3 27.0 45.5 71.8 106.4 80.6 74.4 22.8 2.4 0.0 0.0 446.9<br />
Precipitación efectiva 0.0 9.8 20.9 37.7 60.0 83.6 67.1 62.2 16.9 0.0 0.0 0.0 358.2<br />
Subcuenca Tuyto<br />
Precipitación al 75% P. 2.8 20.4 37.6 44.5 83.1 124.0 86.8 76.9 30.3 6.0 0.5 0.1 513.0<br />
Precipitación efectiva 0.0 14.6 30.6 36.8 68.8 91.6 71.2 64.2 24.0 1.0 0.0 0.0 402.8<br />
Subcuenca L<strong>la</strong>che<br />
Precipitación al 75% P. 0.9 16.2 26.4 45.6 73.3 116.7 78.6 73.9 22.3 2.9 0.0 0.0 456.8<br />
Precipitación efectiva 0.0 10.6 20.3 37.8 61.3 88.3 65.6 61.7 16.4 0.0 0.0 0.0 362.0<br />
Subcuenca Bajo Huancané<br />
Mes Total<br />
Ago Sep Oct Nov Dic Ene Feb Mar Abr May Jun Jul anual<br />
Precipitación al 75% P. 1.2 12.3 20.8 44.0 81.7 105.1 70.9 68.0 13.8 1.5 0.0 0.0 419.3<br />
Precipitación efectiva 0.0 6.9 15.0 36.4 67.9 83.0 59.3 56.9 8.4 0.0 0.0 0.0 333.8<br />
Cuadro Nº 9.39 Precipitación mensual al 75% <strong>de</strong> persistencia y precipitación efectiva (mm) - <strong>Cuenca</strong> Suches<br />
Subcuenca<br />
Subcuenca Trapiche<br />
Precipitación al 75% P. 1.2 16.1 25.7 33.7 50.5 87.7 65.9 66.1 24.2 5.3 0.3 0.3 377.0<br />
Precipitación efectiva 0.0 10.5 19.7 27.1 42.2 71.8 55.2 55.4 18.2 0.3 0.0 0.0 300.4<br />
Subcuenca Caylloma<br />
Precipitación al 75% P. 2.9 15.4 40.4 42.5 67.6 108.2 77.7 73.4 32.1 6.2 0.3 0.1 466.8<br />
Precipitación efectiva 0.0 9.9 33.1 35.0 56.6 84.4 64.9 61.3 25.6 1.1 0.0 0.0 371.9<br />
Subcuenca Chueña Huata Jahuira<br />
Precipitación al 75% P. 2.7 17.0 33.7 41.0 72.4 105.6 77.5 66.2 31.5 4.2 0.0 0.0 451.8<br />
Precipitación efectiva 0.0 11.4 27.1 33.7 60.5 83.3 64.7 55.4 25.1 0.0 0.0 0.0 361.2<br />
Subcuenca Suches (lugar Cuchaul<strong>la</strong>)<br />
Mes Total<br />
Ago Sep Oct Nov Dic Ene Feb Mar Abr May Jun Jul anual<br />
Precipitación al 75% P. 2.3 17.1 35.0 43.4 62.6 104.8 68.7 69.0 30.6 6.3 0.5 0.3 440.6<br />
Precipitación efectiva 0.0 11.5 28.3 35.8 52.5 82.9 57.5 57.7 24.3 1.2 0.0 0.0 351.7<br />
9.2.1.7 Demanda hídrica neta (lámina <strong>de</strong> riego neta)<br />
La lámina neta es <strong>la</strong> cantidad <strong>de</strong> agua que se <strong>de</strong>be aplicar durante el riego, con el fin <strong>de</strong><br />
cubrir el agua que ha utilizado el cultivo durante <strong>la</strong> evapotranspiración. Se obtiene a través<br />
<strong>de</strong> <strong>la</strong> diferencia entre <strong>la</strong> evapotranspiración <strong>de</strong> cultivo (ETc) y <strong>la</strong> precipitación efectiva<br />
(PE).<br />
MINAG-ANA-DCPRH-AGUAS SUPERFICIALES Pág.296
<strong>Estudio</strong> <strong>Hidrológico</strong> <strong>de</strong> <strong>la</strong>s <strong>Cuenca</strong>s Huancané y Suches 2010<br />
Ln ETc - PE<br />
Don<strong>de</strong>:<br />
Ln = Lámina <strong>de</strong> riego neta o <strong>de</strong>manda hídrica neta (mm).<br />
ETc = Evapotranspiración <strong>de</strong> cultivo (mm).<br />
PE = Precipitación efectiva (mm).<br />
Los resultados se muestran en a<strong>de</strong><strong>la</strong>nte, en los cuadros <strong>de</strong> cálculo <strong>de</strong> <strong>la</strong> <strong>de</strong>manda <strong>de</strong> agua<br />
para cada una <strong>de</strong> <strong>la</strong>s subcuencas <strong>de</strong> estudio.<br />
9.2.1.8 Eficiencia <strong>de</strong> riego (Er)<br />
La eficiencia <strong>de</strong>l riego es <strong>la</strong> re<strong>la</strong>ción o porcentaje entre el volumen <strong>de</strong> agua efectivamente<br />
utilizado por <strong>la</strong>s p<strong>la</strong>ntas y el volumen <strong>de</strong> agua <strong>de</strong> <strong>la</strong> fuente <strong>de</strong> captación. Del volumen <strong>de</strong><br />
agua <strong>de</strong> <strong>la</strong> fuente <strong>de</strong> captación <strong>de</strong> un sistema <strong>de</strong> riego, una parte importante no es utilizada<br />
por <strong>la</strong>s p<strong>la</strong>ntas. Las "pérdidas" pue<strong>de</strong>n ser en el sistema <strong>de</strong> conducción, distribución y<br />
aplicación, por infiltración, evaporación, evapotranspiración, fugas y operación errada <strong>de</strong><br />
compuertas que ocasiona pérdidas <strong>de</strong> agua; y <strong>la</strong>s pérdidas <strong>de</strong> agua en el interior <strong>de</strong> <strong>la</strong><br />
parce<strong>la</strong> pue<strong>de</strong>n ser por <strong>la</strong>s técnicas <strong>de</strong> riego utilizada y <strong>la</strong>s características geomorfológicas<br />
<strong>de</strong> <strong>la</strong> parce<strong>la</strong>.<br />
En el presente estudio, <strong>la</strong> eficiencia <strong>de</strong> riego se ha utilizado el 45% para todas <strong>la</strong>s<br />
subcuencas <strong>de</strong> estudio, esta información es obtenida <strong>de</strong>l P<strong>la</strong>n <strong>de</strong> Cultivo y Riego <strong>de</strong> <strong>la</strong><br />
campaña agríco<strong>la</strong> 2010-2011, proporcionada por <strong>la</strong> Administración Local <strong>de</strong> Agua<br />
Huancané.<br />
9.2.1.9 Demanda hídrica bruta (lámina <strong>de</strong> riego bruta)<br />
La lámina bruta es <strong>la</strong> cantidad total <strong>de</strong> agua que se tiene que dotar durante el riego. Se<br />
obtiene a través <strong>de</strong> <strong>la</strong> re<strong>la</strong>ción entre <strong>la</strong> lámina <strong>de</strong> riego neta y <strong>la</strong> eficiencia <strong>de</strong> riego. Es<br />
importante recalcar que <strong>la</strong> eficiencia <strong>de</strong> riego incluye pérdidas posibles <strong>de</strong> agua en el<br />
sistema.<br />
La ecuación que <strong>de</strong>termina <strong>la</strong> lámina bruta es <strong>la</strong> siguiente:<br />
Ln <br />
Lb 100<br />
Er <br />
Don<strong>de</strong>:<br />
Lb = Lámina <strong>de</strong> riego bruta o <strong>de</strong>manda hídrica bruta (mm).<br />
Ln = Lámina <strong>de</strong> riego neta o <strong>de</strong>manda hídrica neta (mm).<br />
Er = Eficiencia <strong>de</strong> riego <strong>de</strong>l sistema (%).<br />
Los resultados se muestran en a<strong>de</strong><strong>la</strong>nte, en los cuadros siguientes para cada una <strong>de</strong> <strong>la</strong>s<br />
subcuencas <strong>de</strong> <strong>la</strong>s cuencas Huancané y Suches.<br />
MINAG-ANA-DCPRH-AGUAS SUPERFICIALES Pág.297
<strong>Estudio</strong> <strong>Hidrológico</strong> <strong>de</strong> <strong>la</strong>s <strong>Cuenca</strong>s Huancané y Suches 2010<br />
Cuadro Nº 9.40 Cálculo <strong>de</strong> <strong>de</strong>manda <strong>de</strong> agua <strong>de</strong>l proyecto - Subcuenca Alto Huancané<br />
Descripción<br />
Ago Sep Oct Nov Dic Ene Feb Mar Abr May Jun Jul<br />
Area cultivada (ha) 303.60 303.60 303.60 313.90 313.90 313.90 313.90 313.90 313.90 306.90 303.60 303.60<br />
Coeficiente <strong>de</strong> cultivo pon<strong>de</strong>rado (Kcp) - 0.71 0.84 0.90 0.89 0.90 0.82 0.84 0.87 0.88 0.91 0.90 0.64<br />
Evapotranspiración Potencial (ETP) (mm) 91.60 92.80 101.60 96.80 92.10 84.00 78.00 86.60 83.10 83.40 76.60 75.90<br />
Evapotranspiración Real (ETc) (mm) 65.04 77.95 91.44 86.15 82.89 68.88 65.52 75.34 73.13 75.89 68.94 48.58<br />
Precipitación media mensual al 75% <strong>de</strong> P. (mm) 1.80 14.80 30.20 40.00 74.60 100.80 81.50 72.80 30.50 6.20 0.10 0.20<br />
Precipitación efectiva (PE) (mm) 0.00 9.30 23.90 32.80 62.30 80.30 67.70 60.80 24.20 1.10 0.00 0.00<br />
Ascención capi<strong>la</strong>r (mm) 0.00 0.00 0.00 0.00 0.00 0.00 0.00 0.00 0.00 0.00 0.00 0.00<br />
Lámina <strong>de</strong> riego neta (Ln) (mm) 65.04 68.65 67.54 53.35 20.59 -11.42 -2.18 14.54 48.93 74.79 68.94 48.58<br />
Eficiencia <strong>de</strong> riego (Er) (%) 45.00 45.00 45.00 45.00 45.00 45.00 45.00 45.00 45.00 45.00 45.00 45.00<br />
Lámina <strong>de</strong> riego bruta (Lb) (mm) 144.53 152.56 150.09 118.56 45.76 -25.38 -4.84 32.31 108.73 166.20 153.20 107.96<br />
Modulo <strong>de</strong> riego (24 horas) (lt/s/ha) 0.54 0.59 0.56 0.46 0.17 0.00 0.00 0.12 0.42 0.62 0.59 0.40<br />
Requerimiento total <strong>de</strong> caudal (Q24horas) (lt/s) 163.94 179.12 170.02 144.39 53.36 0.00 0.00 37.67 131.84 190.28 179.12 121.44<br />
Requerimiento total <strong>de</strong> caudal (Q24horas) (m3/s) 0.16 0.18 0.17 0.14 0.05 0.00 0.00 0.04 0.13 0.19 0.18 0.12<br />
Días <strong>de</strong>l mes (días) 31 30 31 30 31 31 28 31 30 31 30 31<br />
Requerimiento total <strong>de</strong> volumen (hm3) 0.43 0.47 0.46 0.36 0.13 0.00 0.00 0.11 0.34 0.51 0.47 0.32<br />
Requerimiento total <strong>de</strong> volumen anual<br />
= 3.60 hm3<br />
Cuadro Nº 9.41 Cálculo <strong>de</strong> <strong>de</strong>manda <strong>de</strong> agua <strong>de</strong>l proyecto - Subcuenca Pistune<br />
Descripción<br />
MINAG-ANA-DCPRH-AGUAS SUPERFICIALES Pág.298<br />
Mes<br />
Ago Sep Oct Nov Dic Ene Feb Mar Abr May Jun Jul<br />
Area cultivada (ha) 376.76 376.76 376.76 389.22 389.22 389.22 389.22 389.22 389.22 379.76 376.76 376.76<br />
Coeficiente <strong>de</strong> cultivo pon<strong>de</strong>rado (Kcp) - 0.71 0.85 0.90 0.89 0.91 0.81 0.83 0.88 0.89 0.90 0.91 0.64<br />
Evapotranspiración Potencial (ETP) (mm) 106.30 106.00 119.00 111.80 107.30 93.40 86.30 96.50 93.20 92.00 87.00 82.40<br />
Evapotranspiración Real (ETc) (mm) 75.47 90.10 107.10 99.50 97.64 75.65 71.63 84.92 82.95 82.80 79.17 52.74<br />
Precipitación media mensual al 75% <strong>de</strong> P. (mm) 2.60 18.30 35.40 45.90 74.00 115.20 81.70 70.90 25.90 3.40 0.20 0.40<br />
Precipitación efectiva (PE) (mm) 0.00 12.60 28.60 38.10 61.80 87.60 67.90 59.30 19.90 0.00 0.00 0.00<br />
Ascención capi<strong>la</strong>r (mm) 0.00 0.00 0.00 0.00 0.00 0.00 0.00 0.00 0.00 0.00 0.00 0.00<br />
Lámina <strong>de</strong> riego neta (Ln) (mm) 75.47 77.50 78.50 61.40 35.84 -11.95 3.73 25.62 63.05 82.80 79.17 52.74<br />
Eficiencia <strong>de</strong> riego (Er) (%) 45.00 45.00 45.00 45.00 45.00 45.00 45.00 45.00 45.00 45.00 45.00 45.00<br />
Lámina <strong>de</strong> riego bruta (Lb) (mm) 167.71 172.22 174.44 136.44 79.64 -26.56 8.29 56.93 140.11 184.00 175.93 117.20<br />
Modulo <strong>de</strong> riego (24 horas) (lt/s/ha) 0.63 0.66 0.65 0.53 0.30 0.00 0.03 0.21 0.54 0.69 0.68 0.44<br />
Requerimiento total <strong>de</strong> caudal (Q24horas) (lt/s) 237.36 248.66 244.89 206.29 116.77 0.00 11.68 81.74 210.18 262.03 256.20 165.77<br />
Requerimiento total <strong>de</strong> caudal (Q24horas) (m3/s) 0.24 0.25 0.24 0.21 0.12 0.00 0.01 0.08 0.21 0.26 0.26 0.17<br />
Días <strong>de</strong>l mes (días) 31 30 31 30 31 31 28 31 30 31 30 31<br />
Requerimiento total <strong>de</strong> volumen (hm3) 0.64 0.65 0.64 0.54 0.32 0.00 0.02 0.21 0.54 0.70 0.67 0.46<br />
Requerimiento total <strong>de</strong> volumen anual<br />
= 5.39 hm3<br />
Cuadro Nº 9.42 Cálculo <strong>de</strong> <strong>de</strong>manda <strong>de</strong> agua <strong>de</strong>l proyecto - Subcuenca Muñani<br />
Descripción<br />
Mes<br />
Ago Sep Oct Nov Dic Ene Feb Mar Abr May Jun Jul<br />
Area cultivada (ha) 713.00 713.00 713.00 751.00 751.00 751.00 751.00 751.00 751.00 727.50 713.00 713.00<br />
Coeficiente <strong>de</strong> cultivo pon<strong>de</strong>rado (Kcp) - 0.72 0.85 0.91 0.89 0.89 0.81 0.84 0.88 0.87 0.90 0.90 0.64<br />
Evapotranspiración Potencial (ETP) (mm) 127.00 130.10 136.20 129.90 120.20 107.30 97.90 107.80 105.00 109.50 100.10 111.30<br />
Evapotranspiración Real (ETc) (mm) 91.44 110.59 123.94 115.61 106.98 86.91 82.24 94.86 91.35 98.55 90.09 71.23<br />
Precipitación media mensual al 75% <strong>de</strong> P. (mm) 0.40 9.90 29.40 36.90 63.20 105.90 76.70 65.90 24.40 2.30 0.00 0.00<br />
Precipitación efectiva (PE) (mm) 0.00 4.70 23.20 30.00 53.00 83.40 64.00 55.20 18.40 0.00 0.00 0.00<br />
Ascención capi<strong>la</strong>r (mm) 0.00 0.00 0.00 0.00 0.00 0.00 0.00 0.00 0.00 0.00 0.00 0.00<br />
Lámina <strong>de</strong> riego neta (Ln) (mm) 91.44 105.89 100.74 85.61 53.98 3.51 18.24 39.66 72.95 98.55 90.09 71.23<br />
Eficiencia <strong>de</strong> riego (Er) (%) 45.00 45.00 45.00 45.00 45.00 45.00 45.00 45.00 45.00 45.00 45.00 45.00<br />
Lámina <strong>de</strong> riego bruta (Lb) (mm) 203.20 235.31 223.87 190.24 119.96 7.80 40.53 88.13 162.11 219.00 200.20 158.29<br />
Modulo <strong>de</strong> riego (24 horas) (lt/s/ha) 0.76 0.91 0.84 0.73 0.45 0.03 0.17 0.33 0.63 0.82 0.77 0.59<br />
Requerimiento total <strong>de</strong> caudal (Q24horas) (lt/s) 541.88 648.83 598.92 548.23 337.95 22.53 127.67 247.83 473.13 596.55 549.01 420.67<br />
Requerimiento total <strong>de</strong> caudal (Q24horas) (m3/s) 0.54 0.65 0.60 0.55 0.34 0.02 0.13 0.25 0.47 0.60 0.55 0.42<br />
Días <strong>de</strong>l mes (días) 31 30 31 30 31 31 28 31 30 31 30 31<br />
Requerimiento total <strong>de</strong> volumen (hm3) 1.45 1.68 1.61 1.43 0.91 0.05 0.31 0.67 1.22 1.61 1.43 1.12<br />
Requerimiento total <strong>de</strong> volumen anual<br />
= 13.49 hm3<br />
Mes
<strong>Estudio</strong> <strong>Hidrológico</strong> <strong>de</strong> <strong>la</strong>s <strong>Cuenca</strong>s Huancané y Suches 2010<br />
Cuadro Nº 9.43 Cálculo <strong>de</strong> <strong>de</strong>manda <strong>de</strong> agua <strong>de</strong>l proyecto - Subcuenca Medio Huancané<br />
Descripción<br />
Ago Sep Oct Nov Dic Ene Feb Mar Abr May Jun Jul<br />
Area cultivada (ha) 157.30 157.30 157.30 172.50 172.50 172.50 172.50 172.50 172.50 164.50 157.30 157.30<br />
Coeficiente <strong>de</strong> cultivo pon<strong>de</strong>rado (Kcp) - 0.71 0.85 0.90 0.87 0.89 0.82 0.84 0.88 0.86 0.89 0.90 0.64<br />
Evapotranspiración Potencial (ETP) (mm) 109.12 106.50 124.93 115.50 112.84 95.79 89.04 101.99 98.10 95.79 94.80 83.70<br />
Evapotranspiración Real (ETc) (mm) 77.48 90.53 112.44 100.49 100.43 78.55 74.79 89.75 84.37 85.25 85.32 53.57<br />
Precipitación media mensual al 75% <strong>de</strong> P. (mm) 0.70 15.30 27.00 45.50 71.80 106.40 80.60 74.40 22.80 2.40 0.00 0.00<br />
Precipitación efectiva (PE) (mm) 0.00 9.80 20.90 37.70 60.00 83.60 67.10 62.20 16.90 0.00 0.00 0.00<br />
Ascención capi<strong>la</strong>r (mm) 0.00 0.00 0.00 0.00 0.00 0.00 0.00 0.00 0.00 0.00 0.00 0.00<br />
Lámina <strong>de</strong> riego neta (Ln) (mm) 77.48 80.73 91.54 62.79 40.43 -5.05 7.69 27.55 67.47 85.25 85.32 53.57<br />
Eficiencia <strong>de</strong> riego (Er) (%) 45.00 45.00 45.00 45.00 45.00 45.00 45.00 45.00 45.00 45.00 45.00 45.00<br />
Lámina <strong>de</strong> riego bruta (Lb) (mm) 172.18 179.40 203.42 139.53 89.84 -11.22 17.09 61.22 149.93 189.44 189.60 119.04<br />
Modulo <strong>de</strong> riego (24 horas) (lt/s/ha) 0.64 0.69 0.76 0.54 0.34 0.00 0.07 0.23 0.58 0.71 0.73 0.44<br />
Requerimiento total <strong>de</strong> caudal (Q24horas) (lt/s) 100.67 108.54 119.55 93.15 58.65 0.00 12.08 39.68 100.05 116.80 114.83 69.21<br />
Requerimiento total <strong>de</strong> caudal (Q24horas) (m3/s) 0.10 0.11 0.12 0.09 0.06 0.00 0.01 0.04 0.10 0.12 0.11 0.07<br />
Días <strong>de</strong>l mes (días) 31 30 31 30 31 31 28 31 30 31 30 31<br />
Requerimiento total <strong>de</strong> volumen (hm3) 0.27 0.29 0.32 0.23 0.16 0.00 0.02 0.11 0.26 0.32 0.29 0.19<br />
Requerimiento total <strong>de</strong> volumen anual<br />
= 2.46 hm3<br />
Cuadro Nº 9.44 Cálculo <strong>de</strong> <strong>de</strong>manda <strong>de</strong> agua <strong>de</strong>l proyecto - Subcuenca Tuyto<br />
Descripción<br />
MINAG-ANA-DCPRH-AGUAS SUPERFICIALES Pág.299<br />
Mes<br />
Ago Sep Oct Nov Dic Ene Feb Mar Abr May Jun Jul<br />
Area cultivada (ha) 445.30 495.30 525.00 525.00 525.00 525.00 525.00 525.00 431.20 431.20 431.20 431.20<br />
Coeficiente <strong>de</strong> cultivo pon<strong>de</strong>rado (Kcp) - 0.74 0.83 0.89 0.93 0.94 0.81 0.82 0.80 0.92 0.92 0.92 0.66<br />
Evapotranspiración Potencial (ETP) (mm) 101.80 107.40 116.60 111.10 104.30 94.90 85.90 93.20 89.10 86.70 76.40 81.80<br />
Evapotranspiración Real (ETc) (mm) 75.33 89.14 103.77 103.32 98.04 76.87 70.44 74.56 81.97 79.76 70.29 53.99<br />
Precipitación media mensual al 75% <strong>de</strong> P. (mm) 2.80 20.40 37.60 44.50 83.10 124.00 86.80 76.90 30.30 6.00 0.50 0.10<br />
Precipitación efectiva (PE) (mm) 0.00 14.60 30.60 36.80 68.80 91.60 71.20 64.20 24.00 1.00 0.00 0.00<br />
Ascención capi<strong>la</strong>r (mm) 0.00 0.00 0.00 0.00 0.00 0.00 0.00 0.00 0.00 0.00 0.00 0.00<br />
Lámina <strong>de</strong> riego neta (Ln) (mm) 75.33 74.54 73.17 66.52 29.24 -14.73 -0.76 10.36 57.97 78.76 70.29 53.99<br />
Eficiencia <strong>de</strong> riego (Er) (%) 45.00 45.00 45.00 45.00 45.00 45.00 45.00 45.00 45.00 45.00 45.00 45.00<br />
Lámina <strong>de</strong> riego bruta (Lb) (mm) 167.40 165.64 162.60 147.82 64.98 -32.73 -1.69 23.02 128.82 175.02 156.20 119.98<br />
Modulo <strong>de</strong> riego (24 horas) (lt/s/ha) 0.63 0.64 0.61 0.57 0.24 0.00 0.00 0.09 0.50 0.65 0.60 0.45<br />
Requerimiento total <strong>de</strong> caudal (Q24horas) (lt/s) 280.54 316.99 320.25 299.25 126.00 0.00 0.00 47.25 215.60 280.28 258.72 194.04<br />
Requerimiento total <strong>de</strong> caudal (Q24horas) (m3/s) 0.28 0.32 0.32 0.30 0.13 0.00 0.00 0.05 0.22 0.28 0.26 0.19<br />
Días <strong>de</strong>l mes (días) 31 30 31 30 31 31 28 31 30 31 30 31<br />
Requerimiento total <strong>de</strong> volumen (hm3) 0.75 0.83 0.86 0.78 0.35 0.00 0.00 0.13 0.57 0.75 0.67 0.51<br />
Requerimiento total <strong>de</strong> volumen anual<br />
= 6.20 hm3<br />
Cuadro Nº 9.45 Cálculo <strong>de</strong> <strong>de</strong>manda <strong>de</strong> agua <strong>de</strong>l proyecto - Subcuenca L<strong>la</strong>che<br />
Descripción<br />
Mes<br />
Ago Sep Oct Nov Dic Ene Feb Mar Abr May Jun Jul<br />
Area cultivada (ha) 134.50 145.00 152.00 152.00 152.00 152.00 152.00 152.00 134.00 134.00 134.00 134.00<br />
Coeficiente <strong>de</strong> cultivo pon<strong>de</strong>rado (Kcp) - 0.75 0.85 0.90 0.93 0.93 0.81 0.83 0.85 0.93 0.94 0.93 0.68<br />
Evapotranspiración Potencial (ETP) (mm) 108.90 108.10 125.90 117.10 113.50 96.90 89.80 101.90 97.90 95.60 93.30 84.60<br />
Evapotranspiración Real (ETc) (mm) 81.68 91.89 113.31 108.90 105.56 78.49 74.53 86.62 91.05 89.86 86.77 57.53<br />
Precipitación media mensual al 75% <strong>de</strong> P. (mm) 0.90 16.20 26.40 45.60 73.30 116.70 78.60 73.90 22.30 2.90 0.00 0.00<br />
Precipitación efectiva (PE) (mm) 0.00 10.60 20.30 37.80 61.30 88.30 65.60 61.70 16.40 0.00 0.00 0.00<br />
Ascención capi<strong>la</strong>r (mm) 0.00 0.00 0.00 0.00 0.00 0.00 0.00 0.00 0.00 0.00 0.00 0.00<br />
Lámina <strong>de</strong> riego neta (Ln) (mm) 81.68 81.29 93.01 71.10 44.26 -9.81 8.93 24.92 74.65 89.86 86.77 57.53<br />
Eficiencia <strong>de</strong> riego (Er) (%) 45.00 45.00 45.00 45.00 45.00 45.00 45.00 45.00 45.00 45.00 45.00 45.00<br />
Lámina <strong>de</strong> riego bruta (Lb) (mm) 181.51 180.64 206.69 158.00 98.36 -21.80 19.84 55.38 165.89 199.69 192.82 127.84<br />
Modulo <strong>de</strong> riego (24 horas) (lt/s/ha) 0.68 0.70 0.77 0.61 0.37 0.00 0.08 0.21 0.64 0.75 0.74 0.48<br />
Requerimiento total <strong>de</strong> caudal (Q24horas) (lt/s) 91.46 101.50 117.04 92.72 56.24 0.00 12.16 31.92 85.76 100.50 99.16 64.32<br />
Requerimiento total <strong>de</strong> caudal (Q24horas) (m3/s) 0.09 0.10 0.12 0.09 0.06 0.00 0.01 0.03 0.09 0.10 0.10 0.06<br />
Días <strong>de</strong>l mes (días) 31 30 31 30 31 31 28 31 30 31 30 31<br />
Requerimiento total <strong>de</strong> volumen (hm3) 0.24 0.26 0.32 0.23 0.16 0.00 0.02 0.08 0.23 0.27 0.26 0.16<br />
Requerimiento total <strong>de</strong> volumen anual<br />
= 2.23 hm3<br />
Mes
<strong>Estudio</strong> <strong>Hidrológico</strong> <strong>de</strong> <strong>la</strong>s <strong>Cuenca</strong>s Huancané y Suches 2010<br />
Cuadro Nº 9.46 Cálculo <strong>de</strong> <strong>de</strong>manda <strong>de</strong> agua <strong>de</strong>l proyecto - Subcuenca Bajo Huancané<br />
Descripción<br />
Ago Sep Oct Nov Dic Ene Feb Mar Abr May Jun Jul<br />
Area cultivada (ha) 28.90 40.20 42.00 42.00 42.00 42.00 42.00 42.00 14.20 14.20 14.20 14.20<br />
Coeficiente <strong>de</strong> cultivo pon<strong>de</strong>rado (Kcp) - 0.74 0.74 0.82 0.93 0.99 0.91 0.71 0.65 0.94 0.94 0.94 0.70<br />
Evapotranspiración Potencial (ETP) (mm) 107.57 119.70 132.99 129.00 118.73 105.09 95.76 101.37 96.60 94.55 82.20 90.83<br />
Evapotranspiración Real (ETc) (mm) 79.60 88.58 109.05 119.97 117.54 95.63 67.99 65.89 90.80 88.88 77.27 63.58<br />
Precipitación media mensual al 75% <strong>de</strong> P. (mm) 1.20 12.30 20.80 44.00 81.70 105.10 70.90 68.00 13.80 1.50 0.00 0.00<br />
Precipitación efectiva (PE) (mm) 0.00 6.90 15.00 36.40 67.90 83.00 59.30 56.90 8.40 0.00 0.00 0.00<br />
Ascención capi<strong>la</strong>r (mm) 0.00 0.00 0.00 0.00 0.00 0.00 0.00 0.00 0.00 0.00 0.00 0.00<br />
Lámina <strong>de</strong> riego neta (Ln) (mm) 79.60 81.68 94.05 83.57 49.64 12.63 8.69 8.99 82.40 88.88 77.27 63.58<br />
Eficiencia <strong>de</strong> riego (Er) (%) 45.00 45.00 45.00 45.00 45.00 45.00 45.00 45.00 45.00 45.00 45.00 45.00<br />
Lámina <strong>de</strong> riego bruta (Lb) (mm) 176.89 181.51 209.00 185.71 110.31 28.07 19.31 19.98 183.11 197.51 171.71 141.29<br />
Modulo <strong>de</strong> riego (24 horas) (lt/s/ha) 0.66 0.70 0.78 0.72 0.41 0.10 0.08 0.07 0.71 0.74 0.66 0.53<br />
Requerimiento total <strong>de</strong> caudal (Q24horas) (lt/s) 19.07 28.14 32.76 30.24 17.22 4.20 3.36 2.94 10.08 10.51 9.37 7.53<br />
Requerimiento total <strong>de</strong> caudal (Q24horas) (m3/s) 0.02 0.03 0.03 0.03 0.02 0.00 0.00 0.00 0.01 0.01 0.01 0.01<br />
Días <strong>de</strong>l mes (días) 31 30 31 30 31 31 28 31 30 31 30 31<br />
Requerimiento total <strong>de</strong> volumen (hm3) 0.05 0.08 0.08 0.08 0.05 0.00 0.00 0.00 0.03 0.03 0.03 0.03<br />
Requerimiento total <strong>de</strong> volumen anual<br />
= 0.46 hm3<br />
Cuadro Nº 9.47 Cálculo <strong>de</strong> <strong>de</strong>manda <strong>de</strong> agua <strong>de</strong>l proyecto - Subcuenca Trapiche<br />
Descripción<br />
MINAG-ANA-DCPRH-AGUAS SUPERFICIALES Pág.300<br />
Mes<br />
Ago Sep Oct Nov Dic Ene Feb Mar Abr May Jun Jul<br />
Area cultivada (ha) 392.30 392.30 392.30 392.30 392.30 392.30 392.30 392.30 392.30 392.30 392.30 392.30<br />
Coeficiente <strong>de</strong> cultivo pon<strong>de</strong>rado (Kcp) - 0.71 0.84 0.89 0.90 0.90 0.80 0.83 0.88 0.90 0.90 0.90 0.63<br />
Evapotranspiración Potencial (ETP) (mm) 81.00 82.90 85.60 83.50 78.40 75.70 70.40 76.70 73.50 74.70 65.10 68.60<br />
Evapotranspiración Real (ETc) (mm) 57.51 69.64 76.18 75.15 70.56 60.56 58.43 67.50 66.15 67.23 58.59 43.22<br />
Precipitación media mensual al 75% <strong>de</strong> P. (mm) 1.20 16.10 25.70 33.70 50.50 87.70 65.90 66.10 24.20 5.30 0.30 0.30<br />
Precipitación efectiva (PE) (mm) 0.00 10.50 19.70 27.10 42.20 71.80 55.20 55.40 18.20 0.30 0.00 0.00<br />
Ascención capi<strong>la</strong>r (mm) 0.00 0.00 0.00 0.00 0.00 0.00 0.00 0.00 0.00 0.00 0.00 0.00<br />
Lámina <strong>de</strong> riego neta (Ln) (mm) 57.51 59.14 56.48 48.05 28.36 -11.24 3.23 12.10 47.95 66.93 58.59 43.22<br />
Eficiencia <strong>de</strong> riego (Er) (%) 45.00 45.00 45.00 45.00 45.00 45.00 45.00 45.00 45.00 45.00 45.00 45.00<br />
Lámina <strong>de</strong> riego bruta (Lb) (mm) 127.80 131.42 125.51 106.78 63.02 -24.98 7.18 26.89 106.56 148.73 130.20 96.04<br />
Modulo <strong>de</strong> riego (24 horas) (lt/s/ha) 0.48 0.51 0.47 0.41 0.24 0.00 0.03 0.10 0.41 0.56 0.50 0.36<br />
Requerimiento total <strong>de</strong> caudal (Q24horas) (lt/s) 188.30 200.07 184.38 160.84 94.15 0.00 11.77 39.23 160.84 219.69 196.15 141.23<br />
Requerimiento total <strong>de</strong> caudal (Q24horas) (m3/s) 0.19 0.20 0.18 0.16 0.09 0.00 0.01 0.04 0.16 0.22 0.20 0.14<br />
Días <strong>de</strong>l mes (días) 31 30 31 30 31 31 28 31 30 31 30 31<br />
Requerimiento total <strong>de</strong> volumen (hm3) 0.51 0.52 0.48 0.41 0.24 0.00 0.02 0.11 0.41 0.59 0.52 0.37<br />
Requerimiento total <strong>de</strong> volumen anual<br />
= 4.18 hm3<br />
Cuadro Nº 9.48 Cálculo <strong>de</strong> <strong>de</strong>manda <strong>de</strong> agua <strong>de</strong>l proyecto - Subcuenca Caylloma<br />
Descripción<br />
Mes<br />
Ago Sep Oct Nov Dic Ene Feb Mar Abr May Jun Jul<br />
Area cultivada (ha) 532.36 532.36 532.36 532.36 532.36 532.36 532.36 532.36 532.36 532.36 532.36 532.36<br />
Coeficiente <strong>de</strong> cultivo pon<strong>de</strong>rado (Kcp) - 0.71 0.84 0.89 0.90 0.90 0.80 0.83 0.88 0.90 0.90 0.90 0.63<br />
Evapotranspiración Potencial (ETP) (mm) 92.20 91.60 94.00 90.50 85.30 79.60 73.40 80.20 78.20 79.60 70.30 72.50<br />
Evapotranspiración Real (ETc) (mm) 65.46 76.94 83.66 81.45 76.77 63.68 60.92 70.58 70.38 71.64 63.27 45.68<br />
Precipitación media mensual al 75% <strong>de</strong> P. (mm) 2.90 15.40 40.40 42.50 67.60 108.20 77.70 73.40 32.10 6.20 0.30 0.10<br />
Precipitación efectiva (PE) (mm) 0.00 9.90 33.10 35.00 56.60 84.40 64.90 61.30 25.60 1.10 0.00 0.00<br />
Ascención capi<strong>la</strong>r (mm) 0.00 0.00 0.00 0.00 0.00 0.00 0.00 0.00 0.00 0.00 0.00 0.00<br />
Lámina <strong>de</strong> riego neta (Ln) (mm) 65.46 67.04 50.56 46.45 20.17 -20.72 -3.98 9.28 44.78 70.54 63.27 45.68<br />
Eficiencia <strong>de</strong> riego (Er) (%) 45.00 45.00 45.00 45.00 45.00 45.00 45.00 45.00 45.00 45.00 45.00 45.00<br />
Lámina <strong>de</strong> riego bruta (Lb) (mm) 145.47 148.98 112.36 103.22 44.82 -46.04 -8.84 20.62 99.51 156.76 140.60 101.51<br />
Modulo <strong>de</strong> riego (24 horas) (lt/s/ha) 0.54 0.57 0.42 0.40 0.17 0.00 0.00 0.08 0.38 0.59 0.54 0.38<br />
Requerimiento total <strong>de</strong> caudal (Q24horas) (lt/s) 287.47 303.45 223.59 212.94 90.50 0.00 0.00 42.59 202.30 314.09 287.47 202.30<br />
Requerimiento total <strong>de</strong> caudal (Q24horas) (m3/s) 0.29 0.30 0.22 0.21 0.09 0.00 0.00 0.04 0.20 0.31 0.29 0.20<br />
Días <strong>de</strong>l mes (días) 31 30 31 30 31 31 28 31 30 31 30 31<br />
Requerimiento total <strong>de</strong> volumen (hm3) 0.78 0.78 0.59 0.54 0.24 0.00 0.00 0.11 0.52 0.83 0.75 0.54<br />
Requerimiento total <strong>de</strong> volumen anual<br />
= 5.68 hm3<br />
Mes
<strong>Estudio</strong> <strong>Hidrológico</strong> <strong>de</strong> <strong>la</strong>s <strong>Cuenca</strong>s Huancané y Suches 2010<br />
Cuadro Nº 9.49 Cálculo <strong>de</strong> <strong>de</strong>manda <strong>de</strong> agua <strong>de</strong>l proyecto - Subcuenca Chueña Huata Jahuira<br />
Descripción<br />
Ago Sep Oct Nov Dic Ene Feb Mar Abr May Jun Jul<br />
Area cultivada (ha) 26.00 26.00 26.00 26.00 26.00 26.00 26.00 26.00 26.00 26.00 26.00 26.00<br />
Coeficiente <strong>de</strong> cultivo pon<strong>de</strong>rado (Kcp) - 0.71 0.84 0.89 0.90 0.90 0.80 0.83 0.88 0.90 0.90 0.90 0.63<br />
Evapotranspiración Potencial (ETP) (mm) 100.10 97.50 99.20 94.80 89.60 82.20 75.30 82.50 81.30 82.80 73.80 75.00<br />
Evapotranspiración Real (ETc) (mm) 71.07 81.90 88.29 85.32 80.64 65.76 62.50 72.60 73.17 74.52 66.42 47.25<br />
Precipitación media mensual al 75% <strong>de</strong> P. (mm) 2.70 17.00 33.70 41.00 72.40 105.60 77.50 66.20 31.50 4.20 0.00 0.00<br />
Precipitación efectiva (PE) (mm) 0.00 11.40 27.10 33.70 60.50 83.30 64.70 55.40 25.10 0.00 0.00 0.00<br />
Ascención capi<strong>la</strong>r (mm) 0.00 0.00 0.00 0.00 0.00 0.00 0.00 0.00 0.00 0.00 0.00 0.00<br />
Lámina <strong>de</strong> riego neta (Ln) (mm) 71.07 70.50 61.19 51.62 20.14 -17.54 -2.20 17.20 48.07 74.52 66.42 47.25<br />
Eficiencia <strong>de</strong> riego (Er) (%) 45.00 45.00 45.00 45.00 45.00 45.00 45.00 45.00 45.00 45.00 45.00 45.00<br />
Lámina <strong>de</strong> riego bruta (Lb) (mm) 157.93 156.67 135.98 114.71 44.76 -38.98 -4.89 38.22 106.82 165.60 147.60 105.00<br />
Modulo <strong>de</strong> riego (24 horas) (lt/s/ha) 0.59 0.60 0.51 0.44 0.17 0.00 0.00 0.14 0.41 0.62 0.57 0.39<br />
Requerimiento total <strong>de</strong> caudal (Q24horas) (lt/s) 15.34 15.60 13.26 11.44 4.42 0.00 0.00 3.64 10.66 16.12 14.82 10.14<br />
Requerimiento total <strong>de</strong> caudal (Q24horas) (m3/s) 0.02 0.02 0.01 0.01 0.00 0.00 0.00 0.00 0.01 0.02 0.01 0.01<br />
Días <strong>de</strong>l mes (días) 31 30 31 30 31 31 28 31 30 31 30 31<br />
Requerimiento total <strong>de</strong> volumen (hm3) 0.05 0.05 0.03 0.03 0.00 0.00 0.00 0.00 0.03 0.05 0.03 0.03<br />
Requerimiento total <strong>de</strong> volumen anual<br />
= 0.30 hm3<br />
Cuadro Nº 9.50 Cálculo <strong>de</strong> <strong>de</strong>manda <strong>de</strong> agua <strong>de</strong>l proyecto - Subcuenca Suches<br />
Descripción<br />
MINAG-ANA-DCPRH-AGUAS SUPERFICIALES Pág.301<br />
Mes<br />
Ago Sep Oct Nov Dic Ene Feb Mar Abr May Jun Jul<br />
Area cultivada (ha) 407.77 407.77 407.77 407.77 407.77 407.77 407.77 407.77 407.77 407.77 407.77 407.77<br />
Coeficiente <strong>de</strong> cultivo pon<strong>de</strong>rado (Kcp) - 0.71 0.84 0.89 0.90 0.90 0.80 0.83 0.88 0.90 0.90 0.90 0.63<br />
Evapotranspiración Potencial (ETP) (mm) 91.20 90.60 92.80 89.50 84.30 79.20 73.00 79.80 77.60 79.00 69.70 72.10<br />
Evapotranspiración Real (ETc) (mm) 64.75 76.10 82.59 80.55 75.87 63.36 60.59 70.22 69.84 71.10 62.73 45.42<br />
Precipitación media mensual al 75% <strong>de</strong> P. (mm) 2.30 17.10 35.00 43.40 62.60 104.80 68.70 69.00 30.60 6.30 0.50 0.30<br />
Precipitación efectiva (PE) (mm) 0.00 11.50 28.30 35.80 52.50 82.90 57.50 57.70 24.30 1.20 0.00 0.00<br />
Ascención capi<strong>la</strong>r (mm) 0.00 0.00 0.00 0.00 0.00 0.00 0.00 0.00 0.00 0.00 0.00 0.00<br />
Lámina <strong>de</strong> riego neta (Ln) (mm) 64.75 64.60 54.29 44.75 23.37 -19.54 3.09 12.52 45.54 69.90 62.73 45.42<br />
Eficiencia <strong>de</strong> riego (Er) (%) 45.00 45.00 45.00 45.00 45.00 45.00 45.00 45.00 45.00 45.00 45.00 45.00<br />
Lámina <strong>de</strong> riego bruta (Lb) (mm) 143.89 143.56 120.64 99.44 51.93 -43.42 6.87 27.82 101.20 155.33 139.40 100.93<br />
Modulo <strong>de</strong> riego (24 horas) (lt/s/ha) 0.54 0.55 0.45 0.38 0.19 0.00 0.03 0.10 0.39 0.58 0.54 0.38<br />
Requerimiento total <strong>de</strong> caudal (Q24horas) (lt/s) 220.20 224.27 183.50 154.95 77.48 0.00 12.23 40.78 159.03 236.51 220.20 154.95<br />
Requerimiento total <strong>de</strong> caudal (Q24horas) (m3/s) 0.22 0.22 0.18 0.15 0.08 0.00 0.01 0.04 0.16 0.24 0.22 0.15<br />
Días <strong>de</strong>l mes (días) 31 30 31 30 31 31 28 31 30 31 30 31<br />
Requerimiento total <strong>de</strong> volumen (hm3) 0.59 0.57 0.48 0.39 0.21 0.00 0.02 0.11 0.41 0.64 0.57 0.40<br />
Requerimiento total <strong>de</strong> volumen anual<br />
= 4.39 hm3<br />
En los Cuadros Nº 9.51 y 9.52, se muestran el resumen <strong>de</strong> <strong>la</strong> <strong>de</strong>manda <strong>de</strong> agua <strong>de</strong> <strong>la</strong>s<br />
subcuencas <strong>de</strong> <strong>la</strong> cuenca <strong>de</strong>l <strong>río</strong> Huancané.<br />
En los Cuadros Nº 9.53 y 9.54, se muestran el resumen <strong>de</strong> <strong>la</strong> <strong>de</strong>manda <strong>de</strong> agua <strong>de</strong> <strong>la</strong>s<br />
subcuencas <strong>de</strong> <strong>la</strong> cuenca <strong>de</strong>l <strong>río</strong> Suches.<br />
Mes
<strong>Estudio</strong> <strong>Hidrológico</strong> <strong>de</strong> <strong>la</strong>s <strong>Cuenca</strong>s Huancané y Suches 2010<br />
Subcuenca<br />
Cuadro Nº 9.51 Demanda <strong>de</strong> agua (m 3 /s) - <strong>Cuenca</strong> Huancané<br />
Ago Sep Oct Nov Dic Ene Feb Mar Abr May Jun Jul<br />
Alto Huancané 0.16 0.18 0.17 0.14 0.05 0.00 0.00 0.04 0.13 0.19 0.18 0.12 0.11<br />
Pistune 0.24 0.25 0.24 0.21 0.12 0.00 0.01 0.08 0.21 0.26 0.26 0.17 0.17<br />
Muñani 0.54 0.65 0.60 0.55 0.34 0.02 0.13 0.25 0.47 0.60 0.55 0.42 0.43<br />
Medio Huancané 0.10 0.11 0.12 0.09 0.06 0.00 0.01 0.04 0.10 0.12 0.11 0.07 0.08<br />
Tuyto 0.28 0.32 0.32 0.30 0.13 0.00 0.00 0.05 0.22 0.28 0.26 0.19 0.20<br />
L<strong>la</strong>che 0.09 0.10 0.12 0.09 0.06 0.00 0.01 0.03 0.09 0.10 0.10 0.06 0.07<br />
Bajo Huancané 0.02 0.03 0.03 0.03 0.02 0.00 0.00 0.00 0.01 0.01 0.01 0.01 0.01<br />
<strong>Cuenca</strong> Huancané 1.43 1.64 1.60 1.41 0.78 0.02 0.16 0.49 1.23 1.56 1.47 1.04 1.07<br />
Subcuenca<br />
Cuadro Nº 9.52 Demanda <strong>de</strong> agua (hm 3 ) - <strong>Cuenca</strong> Huancané<br />
MINAG-ANA-DCPRH-AGUAS SUPERFICIALES Pág.302<br />
Mes<br />
Ago Sep Oct Nov Dic Ene Feb Mar Abr May Jun Jul<br />
Alto Huancané 0.43 0.47 0.46 0.36 0.13 0.00 0.00 0.11 0.34 0.51 0.47 0.32 3.60<br />
Pistune 0.64 0.65 0.64 0.54 0.32 0.00 0.02 0.21 0.54 0.70 0.67 0.46 5.39<br />
Muñani 1.45 1.68 1.61 1.43 0.91 0.05 0.31 0.67 1.22 1.61 1.43 1.12 13.49<br />
Medio Huancané 0.27 0.29 0.32 0.23 0.16 0.00 0.02 0.11 0.26 0.32 0.29 0.19 2.46<br />
Tuyto 0.75 0.83 0.86 0.78 0.35 0.00 0.00 0.13 0.57 0.75 0.67 0.51 6.20<br />
L<strong>la</strong>che 0.24 0.26 0.32 0.23 0.16 0.00 0.02 0.08 0.23 0.27 0.26 0.16 2.23<br />
Bajo Huancané 0.05 0.08 0.08 0.08 0.05 0.00 0.00 0.00 0.03 0.03 0.03 0.03 0.46<br />
<strong>Cuenca</strong> Huancané 3.83 4.26 4.29 3.65 2.08 0.05 0.37 1.31 3.19 4.19 3.82 2.79 33.83<br />
Subcuenca<br />
Cuadro Nº 9.53 Demanda <strong>de</strong> agua (m 3 /s) - <strong>Cuenca</strong> Suches<br />
Mes<br />
Ago Sep Oct Nov Dic Ene Feb Mar Abr May Jun Jul<br />
Trapiche 0.19 0.20 0.18 0.16 0.09 0.00 0.01 0.04 0.16 0.22 0.20 0.14 0.13<br />
Caylloma 0.29 0.30 0.22 0.21 0.09 0.00 0.00 0.04 0.20 0.31 0.29 0.20 0.18<br />
Chueña Huata Jahuira 0.02 0.02 0.01 0.01 0.00 0.00 0.00 0.00 0.01 0.02 0.01 0.01 0.01<br />
Suches (intercuenca) 0.22 0.22 0.18 0.15 0.08 0.00 0.01 0.04 0.16 0.24 0.22 0.15 0.14<br />
<strong>Cuenca</strong> Suches (Cuchaul<strong>la</strong>) 0.72 0.74 0.59 0.53 0.26 0.00 0.02 0.12 0.53 0.79 0.72 0.50 0.46<br />
Subcuenca<br />
Cuadro Nº 9.54 Demanda <strong>de</strong> agua (hm 3 ) - <strong>Cuenca</strong> Suches<br />
Mes<br />
Ago Sep Oct Nov Dic Ene Feb Mar Abr May Jun Jul<br />
Trapiche 0.51 0.52 0.48 0.41 0.24 0.00 0.02 0.11 0.41 0.59 0.52 0.37 4.18<br />
Caylloma 0.78 0.78 0.59 0.54 0.24 0.00 0.00 0.11 0.52 0.83 0.75 0.54 5.68<br />
Chueña Huata Jahuira 0.05 0.05 0.03 0.03 0.00 0.00 0.00 0.00 0.03 0.05 0.03 0.03 0.30<br />
Suches (intercuenca) 0.59 0.57 0.48 0.39 0.21 0.00 0.02 0.11 0.41 0.64 0.57 0.40 4.39<br />
<strong>Cuenca</strong> Suches (Cuchaul<strong>la</strong>) 1.93 1.92 1.58 1.37 0.69 0.00 0.04 0.33 1.37 2.11 1.87 1.34 14.55<br />
Mes<br />
Prom<br />
Anual<br />
Total<br />
Anual<br />
Prom<br />
Anual<br />
Prom<br />
Anual
<strong>Estudio</strong> <strong>Hidrológico</strong> <strong>de</strong> <strong>la</strong>s <strong>Cuenca</strong>s Huancané y Suches 2010<br />
9.2.2 Demanda pob<strong>la</strong>cional<br />
La <strong>de</strong>manda hídrica pob<strong>la</strong>cional <strong>de</strong> <strong>la</strong>s cuencas Huancané y Suches, se ha obtenido <strong>de</strong>l<br />
registro <strong>de</strong> volúmenes <strong>de</strong> agua entregados a los usuarios <strong>de</strong> agua con fines no agrarios en el<br />
año 2009, para <strong>la</strong> cobranza <strong>de</strong> <strong>la</strong> retribución económica <strong>de</strong>l año 2010, información<br />
proporcionada por <strong>la</strong> Administración Local <strong>de</strong> Agua Huancané.<br />
En los Cuadros Nº 9.55 al 9.65 se muestran los caudales otorgados a los usuarios <strong>de</strong> agua,<br />
consolidados por subcuencas correspondientes a <strong>la</strong>s cuencas Huancané y Suches.<br />
Cuadro Nº 9.55 Demanda pob<strong>la</strong>cional - Subcuenca Alto Huancané<br />
N° Nombre <strong>de</strong>l Usuario /Razón Social<br />
Caudal Otorgado<br />
(l/s)<br />
1 DISTRITO DE QUILCA PUNCO 3.00<br />
Total<br />
Cuadro Nº 9.56 Demanda pob<strong>la</strong>cional - Subcuenca Pistune<br />
N° Nombre <strong>de</strong>l Usuario /Razón Social<br />
MINAG-ANA-DCPRH-AGUAS SUPERFICIALES Pág.303<br />
3.00<br />
Caudal Otorgado<br />
(l/s)<br />
1 JAAP HUATUHUYO 0.35<br />
2 DISTRITO DE INCHUPALLA 0.60<br />
3 JAAP IÑOCAPATA SECTOR HUARACUYO 0.10<br />
4 JAAP SECTOR PUQUILMURI - QUISUNI 0.27<br />
5 COMUNIDAD CAMPESINA DE CHECTACOLLO 0.50<br />
6 COMUNIDAD URINSAYA HILATA 0.45<br />
7 JAAP TIRAPUNCO 0.30<br />
8 JAAP SANTA ROSA DE HUAYRAPATA 0.45<br />
9 JAAP PARCIALIDAD HUACCOTONI 0.05<br />
10 JAAP TISNAHUYO 0.42<br />
Total<br />
3.50<br />
Cuadro Nº 9.57 Demanda pob<strong>la</strong>cional - Subcuenca Medio Alto Huancané<br />
N° Nombre <strong>de</strong>l Usuario /Razón Social<br />
Caudal Otorgado<br />
(l/s)<br />
1 JAAPS DEL C.P. SANTIAGO GIRALDO 1.16<br />
Total<br />
Cuadro Nº 9.58 Demanda pob<strong>la</strong>cional - Subcuenca Muñani<br />
N° Nombre <strong>de</strong>l Usuario /Razón Social<br />
1.16<br />
Caudal Otorgado<br />
(l/s)<br />
1 JAAP MUÑANI CHICO 0.70<br />
2 CENTRO POBLADO SAN ISIDRO 1.56<br />
3 PARCIALIDAD DE CARASUPO GRANDE 0.22<br />
4 C.P. VIRGEN COPACABANA NEQUENEQUE 0.40<br />
5 DISTRITO DE MUÑANI 4.00<br />
Total<br />
6.88
<strong>Estudio</strong> <strong>Hidrológico</strong> <strong>de</strong> <strong>la</strong>s <strong>Cuenca</strong>s Huancané y Suches 2010<br />
Cuadro Nº 9.59 Demanda pob<strong>la</strong>cional - Subcuenca Medio Huancané<br />
N° Nombre <strong>de</strong>l Usuario /Razón Social<br />
Caudal Otorgado<br />
(l/s)<br />
1 PARCIALIDAD VILACCARCA SAN ISIDRO 0.20<br />
2 JAAP SAN SALVADOR 0.33<br />
3 JAAP CAYACAYA 0.32<br />
4 DISTRITO DE PUTINA 3.50<br />
5 JAAP TOQUEPANI - HUATASANI 0.08<br />
Total<br />
Cuadro Nº 9.60 Demanda pob<strong>la</strong>cional - Subcuenca Tuyto<br />
N° Nombre <strong>de</strong>l Usuario /Razón Social<br />
MINAG-ANA-DCPRH-AGUAS SUPERFICIALES Pág.304<br />
4.43<br />
Caudal Otorgado<br />
(l/s)<br />
1 JAAP PARCIALIDAD VILUYO - MALLCOSUCA 0.18<br />
2 PARCIALIDAD DE CENTRAL MALLCOSUCA 0.18<br />
3 CENTRO POBLADO MALLCOSUCA COM. CASTILLUMA 0.25<br />
4 JAAP. QUEQUESA DEL C.P. MALLCOSUCA 0.15<br />
5 CENTRO POBLADO MALLCOSUCA SECTOR CENTRO 0.50<br />
6 CENTRO POBLADO MALLCOSUCA SECTOR LAUCATA 0.27<br />
7 COMUNIDAD CAMPESINA DE NIQUIRI 0.25<br />
8 ESCUELA PRIMARIA N72365 MALLCOSUCA JARARANCUNI 0.13<br />
9 JAAP PAMPA CAHUAYA 0.10<br />
10 CENTRO POBLADO QUELLAHUYO POMAOCA 0.40<br />
11 JAAP ALTO CHALLAPA 0.30<br />
12 PARCIALIDAD PARQUI CAHUAYA SECTOR HUANCANMITA 0.16<br />
13 JAAP CHALLAPA CARIQUITA 0.22<br />
14 JAAP ÑAPA SECTOR CENTRAL 0.50<br />
15 ASOC. USUARIOS AG. POT. DISTRITO DE ROSASPATA 1.00<br />
16 JAAP ÑAPA SECTOR QUERATA 0.30<br />
17 COMUNIDAD ALTOS HUARAYA SECT. JACHA CARCA 0.11<br />
18 COMUNIDAD DE JAROCOLLPA 0.25<br />
19 CENTRO POBLADO ALTOS HUAYRAPATA 0.25<br />
20 COMUNIDAD SAN ANTONIO SECTOR ESQUERICA 0.25<br />
21 COMUNIDAD QUELLO QUELLO Y ANCOCARCA 2.00<br />
22 PARCIALIDAD DE LLOCALLAMARCA 0.20<br />
23 JAAP CENTRO POBLADO SOLITARIO 0.50<br />
24 PARCIALIDAD DE TUITO SECTOR CONDORIQUIÑA 0.22<br />
25 JAAP. SILLUTA CHUCALLANI C.P. MUNAYPA 0.46<br />
26 JAAS MILLICUYO TUYTO 0.35<br />
27 COMUNIDAD DE MUNAYPA SECTOR JACHA MUNAYPA 0.30<br />
28 JAAP ÑAPA SECTOR TOMAPIURA 0.10<br />
29 JAAP CULACHATA 0.20<br />
30 JAAP CRISTAL VIKAPAQUE – SOLITARIO 0.60<br />
Total<br />
10.68<br />
Cuadro Nº 9.61 Demanda pob<strong>la</strong>cional – Subcuenca Medio Bajo Huancané<br />
N° Nombre <strong>de</strong>l Usuario /Razón Social<br />
Caudal Otorgado<br />
(l/s)<br />
1 JAAP COMUNIDAD SUSTIA MUNAYPA 0.25<br />
2 JAAP QUEALLI 0.15<br />
3 DISTRITO DE HUATASANI 3.00<br />
Total<br />
3.40
<strong>Estudio</strong> <strong>Hidrológico</strong> <strong>de</strong> <strong>la</strong>s <strong>Cuenca</strong>s Huancané y Suches 2010<br />
Cuadro Nº 9.62 Demanda pob<strong>la</strong>cional - Subcuenca L<strong>la</strong>che<br />
N° Nombre <strong>de</strong>l Usuario /Razón Social<br />
Caudal Otorgado<br />
(l/s)<br />
1 JASS HUILACUNCA 0.40<br />
2 DISTRITO DE PEDRO VILCAPAZA - AYRAMPUNI 0.70<br />
3 COMUNIDAD DE SAN IGNACIO DE MAYAPUNCO 0.30<br />
4 ASOC.DE JAAP MULTICOMUNAL HUANCANE 2.25<br />
5 JAAP. DE TUNILA 0.20<br />
6 JAAP SANTIAGO DE AJJATIRA 0.73<br />
7 JAAP SAN JOSE DE SANTA CRUZ 0.54<br />
8 JAAP NAZACARA 0.30<br />
Total<br />
5.42<br />
Cuadro Nº 9.63 Demanda pob<strong>la</strong>cional - Subcuenca Bajo Huancané<br />
N° Nombre <strong>de</strong>l Usuario /Razón Social<br />
Caudal Otorgado<br />
(l/s)<br />
1 JAAP. SECTOR LARICO - QUECHAYA 0.25<br />
2 JAAP. YANCANI HUYO - QUECHAYA 0.22<br />
3 JAAP CENTRAL ROSASANI - QUECHAYA 0.10<br />
4 JASAP COMUNIDAD CAMPESINA MUÑAPATA 0.30<br />
5 JAAP MARCATACANA HUANCHO 0.17<br />
6 JAAP. SECTOR QUECHUATA-HUANCHO 0.15<br />
7 JAAP. ALPAHAQUE- HUANCHO 0.18<br />
8 JAPP CHURURAYA-HUANCHO 0.13<br />
9 SECT. MUCURAYA Y LACAYA - HUANCHO 0.52<br />
10 JAAP AQUECUCHO Y QUEAPATA - HUANCHO 0.12<br />
11 JAAP. SECTOR HUAYLLARAYA-HUANCHO 0.12<br />
12 JAAP CARLOS CONDORENA - QUEÑCHA 0.30<br />
13 JAAP CENTRAL MILLIRAYA 0.25<br />
14 JAAP. SECTOR LLACHOJANI-HUANCHO 0.32<br />
15 EPS. NOR PUNO S.A. ZONAL HUANCANE 18.00<br />
16 JAAP. CUYURAYA PRIMER SECTOR 0.46<br />
17 JASAP LACAR═A HUAYRAPATA û TAURAHUTA 0.50<br />
18 PARCIALIDAD ACOCOLLO 06 SECTORES 0.75<br />
19 CENTRO POBLADO ACOCOLLO 0.72<br />
20 PARC. (AZANGARILLO, CALLAPANI, HUAYRAPATA Y TOTORANI) 1.43<br />
21 JAAP CHEJEPAMPA HUAYLLACUYO 0.20<br />
22 JAAP SANTIAGUILLO 0.35<br />
23 JAAP CUPISCO 0.10<br />
24 JAAP SUCUNI 0.39<br />
25 JAAP JAPISSE 0.92<br />
Total<br />
26.95<br />
Cuadro Nº 9.64 Demanda pob<strong>la</strong>cional - Subcuenca Chueña Huata Jahuira<br />
N° Nombre <strong>de</strong>l Usuario /Razón Social<br />
Caudal Otorgado<br />
(l/s)<br />
1 MUNICIPALIDAD DISTRITAL DE COJATA 2.00<br />
Total<br />
MINAG-ANA-DCPRH-AGUAS SUPERFICIALES Pág.305<br />
2.00
<strong>Estudio</strong> <strong>Hidrológico</strong> <strong>de</strong> <strong>la</strong>s <strong>Cuenca</strong>s Huancané y Suches 2010<br />
Cuadro Nº 9.65 Demanda pob<strong>la</strong>cional - Subcuenca Trapiche<br />
N° Nombre <strong>de</strong>l Usuario /Razón Social<br />
Caudal Otorgado<br />
(l/s)<br />
1 CENTRO POBLADO RINCONADA ESAP-RINCONADA 3.00<br />
2 ESAP Y SERV. MULT. "EL SOL" EIR Ltda 0.25<br />
3 JUSTO TICONA OLAZABAL (SUMIN. AGUA POT C.P. RINCONADA) 0.50<br />
Total<br />
En base a <strong>la</strong> información disponible <strong>de</strong> los caudales otorgados a los usuarios <strong>de</strong> agua en <strong>la</strong>s<br />
cuencas Huancané y Suches, se ha <strong>de</strong>terminado los volúmenes <strong>de</strong> agua consi<strong>de</strong>rando los 24<br />
horas <strong>de</strong> uso, información proporcionada por <strong>la</strong> Administración Local <strong>de</strong> Agua Huancané.<br />
En los Cuadros Nº 9.66 y 9.67 se presenta lo volúmenes <strong>de</strong> agua mensualizados en hm3<br />
para cada subcuencas <strong>de</strong> <strong>la</strong>s cuencas Huancané y Suches.<br />
Subcuenca<br />
Cuadro Nº 9.66 Demanda pob<strong>la</strong>cional - <strong>Cuenca</strong> Huancané<br />
Ago Sep Oct Nov Dic Ene Feb Mar Abr May Jun Jul<br />
Alto Huancané 3.00 0.01 0.01 0.01 0.01 0.01 0.01 0.01 0.01 0.01 0.01 0.01 0.01 0.12<br />
Pistune 3.50 0.01 0.01 0.01 0.01 0.01 0.01 0.01 0.01 0.01 0.01 0.01 0.01 0.12<br />
Medio Alto Huancané 1.16 0.00 0.00 0.00 0.00 0.00 0.00 0.00 0.00 0.00 0.00 0.00 0.00 0.00<br />
Muñani 6.88 0.02 0.02 0.02 0.02 0.02 0.02 0.02 0.02 0.02 0.02 0.02 0.02 0.24<br />
Medio Huancané 4.43 0.01 0.01 0.01 0.01 0.01 0.01 0.01 0.01 0.01 0.01 0.01 0.01 0.12<br />
Tuyto 10.68 0.03 0.03 0.03 0.03 0.03 0.03 0.03 0.03 0.03 0.03 0.03 0.03 0.36<br />
Medio Bajo Huancané 3.40 0.01 0.01 0.01 0.01 0.01 0.01 0.01 0.01 0.01 0.01 0.01 0.01 0.12<br />
L<strong>la</strong>che 5.42 0.01 0.01 0.01 0.01 0.01 0.01 0.01 0.01 0.01 0.01 0.01 0.01 0.12<br />
Bajo Huancané 26.95 0.07 0.07 0.07 0.07 0.07 0.07 0.07 0.07 0.07 0.07 0.07 0.07 0.84<br />
<strong>Cuenca</strong> Huancané 65.41 0.17 0.17 0.17 0.17 0.17 0.17 0.17 0.17 0.17 0.17 0.17 0.17 2.04<br />
Subcuenca<br />
Caudal<br />
(l/s)<br />
Caudal<br />
(l/s)<br />
Volumen <strong>de</strong> agua mensualizado (hm3)<br />
Cuadro Nº 9.67 Demanda pob<strong>la</strong>cional - <strong>Cuenca</strong> Suches<br />
Volumen <strong>de</strong> agua mensualizado (hm3)<br />
Ago Sep Oct Nov Dic Ene Feb Mar Abr May Jun Jul<br />
Trapiche 2.00 0.01 0.01 0.01 0.01 0.01 0.01 0.00 0.01 0.01 0.01 0.01 0.01 0.11<br />
Chueña Huata Jahuira 3.75 0.01 0.01 0.01 0.01 0.01 0.01 0.01 0.01 0.01 0.01 0.01 0.01 0.12<br />
<strong>Cuenca</strong> Suches (Cuchaul<strong>la</strong>) 5.75 0.02 0.02 0.02 0.02 0.02 0.02 0.01 0.02 0.02 0.02 0.02 0.02 0.23<br />
MINAG-ANA-DCPRH-AGUAS SUPERFICIALES Pág.306<br />
3.75<br />
Total<br />
Anual<br />
Total<br />
Anual
<strong>Estudio</strong> <strong>Hidrológico</strong> <strong>de</strong> <strong>la</strong>s <strong>Cuenca</strong>s Huancané y Suches 2010<br />
9.2.3 Demanda hídrica <strong>de</strong> uso minero<br />
En <strong>la</strong> minería el agua es utilizada para separar y extraer los minerales <strong>de</strong> rocas y limpiar los<br />
materiales <strong>de</strong> <strong>de</strong>secho.<br />
La <strong>de</strong>manda hídrica <strong>de</strong> uso minero en <strong>la</strong> cuenca Suches, se ha obtenido <strong>de</strong>l registro <strong>de</strong><br />
volúmenes <strong>de</strong> agua entregados a los usuarios <strong>de</strong> agua con fines no agrarios en el año 2009,<br />
para <strong>la</strong> cobranza <strong>de</strong> <strong>la</strong> retribución económica <strong>de</strong>l año 2010, información proporcionada por<br />
<strong>la</strong> Administración Local <strong>de</strong> Agua Huancané. En <strong>la</strong> cuenca Huancané no existe uso <strong>de</strong> agua<br />
en explotación <strong>de</strong> minas.<br />
En el Cuadro Nº 9.68 se muestra los caudales otorgados a los usuarios <strong>de</strong> agua, en <strong>la</strong><br />
subcuenca <strong>de</strong>l <strong>río</strong> Trapiche correspondiente a <strong>la</strong> cuenca <strong>de</strong>l <strong>río</strong> Suches.<br />
Cuadro Nº 9.68 Demanda hídrica <strong>de</strong> uso minero – Subcuenca Trapiche<br />
N° Nombre <strong>de</strong>l Usuario /Razón Social<br />
Caudal Otorgado<br />
(l/s)<br />
1 JOSE LUIS, SUCSO RAMIREZ (MINERO ARTESANAL-PAMPA BLANCA) 0.75<br />
2 PEQUEÑOS LAV. AURIFEROS SECTOR PAMPA BLANCA (SOSA) 2.00<br />
3 CECOMSAP - ANANEA LTDA. 40.00<br />
4 EMPRESA MINERA TITAN CONTRATISTAS GENERALES SAC. 0.18<br />
Total<br />
42.93<br />
En el Cuadro Nº 9.69 se muestra los volúmenes <strong>de</strong> agua mensualizados <strong>de</strong> uso minero,<br />
correspondiente a <strong>la</strong> subcuenca <strong>de</strong>l <strong>río</strong> Trapiche en <strong>la</strong> cuenca Suches.<br />
Subcuenca<br />
Caudal<br />
(l/s)<br />
Cuadro Nº 9.69 Demanda hídrica <strong>de</strong> uso minero – <strong>Cuenca</strong> Suches<br />
Ago Sep Oct Nov Dic Ene Feb Mar Abr May Jun Jul<br />
Trapiche 42.93 0.11 0.11 0.11 0.11 0.11 0.11 0.10 0.11 0.11 0.11 0.11 0.11 1.31<br />
<strong>Cuenca</strong> Suches (Cuchaul<strong>la</strong>) 42.93 0.11 0.11 0.11 0.11 0.11 0.11 0.10 0.11 0.11 0.11 0.11 0.11 1.31<br />
9.2.4 Caudal ecológico<br />
Volumen <strong>de</strong> agua mensualizado (hm3)<br />
Es el caudal mínimo que <strong>de</strong>be mantenerse en un curso <strong>de</strong> agua al construir una represa, una<br />
captación, o una <strong>de</strong>rivación, <strong>de</strong> forma que no se alteren <strong>la</strong>s condiciones naturales <strong>de</strong>l<br />
biotopo y se garantice el <strong>de</strong>sarrollo <strong>de</strong> una vida natural igual a <strong>la</strong> que existía anteriormente.<br />
Los métodos más simples son los hidrológicos o estadísticos, que <strong>de</strong>terminan el caudal<br />
mínimo ecológico a través <strong>de</strong>l estudio <strong>de</strong> los datos <strong>de</strong> caudales. Un método matemático<br />
simple (Ley <strong>de</strong> Aguas Francesa) es <strong>de</strong>finir el caudal mínimo ecológico como un 5% <strong>de</strong>l<br />
caudal medio histórico, al menos hasta <strong>la</strong> fecha aplicados en otras cuencas <strong>de</strong>l país, y es <strong>la</strong><br />
que se ha utilizado en el presente estudio.<br />
Los volúmenes <strong>de</strong> los caudales ecológicos calcu<strong>la</strong>dos para cada subcuenca <strong>de</strong> <strong>la</strong>s cuencas<br />
Huancané y Suches, se muestran en los Cuadros Nº 9.71 y 9.73.<br />
MINAG-ANA-DCPRH-AGUAS SUPERFICIALES Pág.307<br />
Total<br />
Anual
<strong>Estudio</strong> <strong>Hidrológico</strong> <strong>de</strong> <strong>la</strong>s <strong>Cuenca</strong>s Huancané y Suches 2010<br />
Subcuenca/<br />
cuenca<br />
Cuadro Nº 9.70 Caudal ecológico (m3/s) – <strong>Cuenca</strong> Huancané<br />
Punto <strong>de</strong> control Ene Feb Mar Abr May Jun Jul Ago Sep Oct Nov Dic<br />
Río L<strong>la</strong>che Confl.<strong>río</strong> Huancané 0.099 0.115 0.088 0.064 0.033 0.017 0.009 0.007 0.009 0.013 0.026 0.049 0.044<br />
Río Tuyto Confl.<strong>río</strong> Putina 0.790 1.126 0.827 0.572 0.244 0.105 0.053 0.042 0.065 0.109 0.183 0.369 0.374<br />
Río Muñani Confl.<strong>río</strong> Pongongoni 0.438 0.752 0.543 0.414 0.194 0.092 0.053 0.042 0.046 0.069 0.107 0.196 0.246<br />
Río Pistune Confl.<strong>río</strong> Puncune 0.211 0.300 0.224 0.172 0.085 0.042 0.023 0.018 0.024 0.034 0.059 0.107 0.108<br />
Río Puncune Confl.<strong>río</strong> Pistune 0.177 0.365 0.266 0.213 0.104 0.049 0.024 0.020 0.020 0.028 0.051 0.087 0.117<br />
Río Huancané Desemb.<strong>la</strong>go Titicaca 1.929 3.037 2.243 1.679 0.803 0.378 0.193 0.138 0.167 0.263 0.466 0.908 1.017<br />
Subcuenca/<br />
cuenca<br />
Cuadro Nº 9.71 Caudal ecológico (hm3) – <strong>Cuenca</strong> Huancané<br />
Punto <strong>de</strong> control Ene Feb Mar Abr May Jun Jul Ago Sep Oct Nov Dic<br />
Río L<strong>la</strong>che Confl.<strong>río</strong> Huancané 0.27 0.28 0.24 0.17 0.09 0.04 0.02 0.02 0.02 0.03 0.07 0.13 1.38<br />
Río Tuyto Confl.<strong>río</strong> Putina 2.12 2.72 2.22 1.48 0.65 0.27 0.14 0.11 0.17 0.29 0.47 0.99 11.63<br />
Río Muñani Confl.<strong>río</strong> Pongongoni 1.17 1.82 1.45 1.07 0.52 0.24 0.14 0.11 0.12 0.18 0.28 0.52 7.62<br />
Río Pistune Confl.<strong>río</strong> Puncune 0.57 0.73 0.60 0.45 0.23 0.11 0.06 0.05 0.06 0.09 0.15 0.29 3.39<br />
Río Puncune Confl.<strong>río</strong> Pistune 0.47 0.88 0.71 0.55 0.28 0.13 0.06 0.05 0.05 0.07 0.13 0.23 3.61<br />
Río Huancané Desemb.<strong>la</strong>go Titicaca 5.17 7.35 6.01 4.35 2.15 0.98 0.52 0.37 0.43 0.70 1.21 2.43 31.67<br />
Subcuenca/<br />
cuenca<br />
Río Chueña<br />
Huata Jahuira<br />
Cuadro Nº 9.72 Caudal ecológico (m3/s) – <strong>Cuenca</strong> Suches<br />
Punto <strong>de</strong> control Ene Feb Mar Abr May Jun Jul Ago Sep Oct Nov Dic<br />
Confl.<strong>río</strong> Suches 0.063 0.099 0.076 0.050 0.019 0.008 0.005 0.004 0.006 0.008 0.013 0.026 0.031<br />
Río Caylloma Confl.<strong>río</strong> Suches 0.122 0.164 0.128 0.088 0.042 0.022 0.014 0.012 0.016 0.022 0.033 0.059 0.060<br />
Río Trapiche Confl.<strong>río</strong> Suches 0.087 0.137 0.120 0.104 0.060 0.034 0.019 0.013 0.014 0.019 0.029 0.045 0.057<br />
Subcuenca/<br />
cuenca<br />
Río Chueña<br />
Huata Jahuira<br />
Cuadro Nº 9.73 Caudal ecológico (hm3) – <strong>Cuenca</strong> Suches<br />
Punto <strong>de</strong> control Ene Feb Mar Abr May Jun Jul Ago Sep Oct Nov Dic<br />
Confl.<strong>río</strong> Suches 0.17 0.24 0.20 0.13 0.05 0.02 0.01 0.01 0.02 0.02 0.03 0.07 0.97<br />
Río Caylloma Confl.<strong>río</strong> Suches 0.33 0.40 0.34 0.23 0.11 0.06 0.04 0.03 0.04 0.06 0.09 0.16 1.89<br />
Río Trapiche Confl.<strong>río</strong> Suches 0.23 0.33 0.32 0.27 0.16 0.09 0.05 0.03 0.04 0.05 0.08 0.12 1.77<br />
MINAG-ANA-DCPRH-AGUAS SUPERFICIALES Pág.308<br />
Prom<br />
Anual<br />
Total<br />
Anual<br />
Prom<br />
Anual<br />
Total<br />
Anual
<strong>Estudio</strong> <strong>Hidrológico</strong> <strong>de</strong> <strong>la</strong>s <strong>Cuenca</strong>s Huancané y Suches 2010<br />
9.3 DEMANDA HÍDRICA FUTURA<br />
Las <strong>de</strong>mandas hídricas <strong>de</strong> usos futuros <strong>de</strong> agua correspondiente al Proyecto <strong>de</strong> Irrigación<br />
Muñani, se ha obtenido <strong>de</strong>l estudio hidrológico <strong>de</strong>l Perfil <strong>de</strong> Proyecto “Construcción<br />
Irrigación Muñani” ubicado en <strong>la</strong> subcuenca <strong>de</strong>l <strong>río</strong> Muñani, ámbito <strong>de</strong> <strong>la</strong> cuenca <strong>de</strong>l <strong>río</strong><br />
Huancané, <strong>de</strong>sarrol<strong>la</strong>do por el Programa Regional <strong>de</strong> Riego y Drenaje (PRORRIDRE) y<br />
Gobierno Local <strong>de</strong> Muñani, en el año 2009.<br />
Los cultivos principales <strong>de</strong> <strong>la</strong> cedu<strong>la</strong> <strong>de</strong> cultivo <strong>de</strong>l Proyecto <strong>de</strong> Irrigación Muñani, son: <strong>la</strong><br />
papa dulce, papa amarga, quinua, cañihua, pastos cultivados, avena forrajera y cebada<br />
forrajera; cuya superficie total es <strong>de</strong> 500 ha y <strong>la</strong> eficiencia <strong>de</strong> riego es <strong>de</strong> 40%.<br />
Cuadro Nº 9.74 Cedu<strong>la</strong> <strong>de</strong> cultivo (calendario <strong>de</strong> siembra y cosecha) - Irrigación Muñani - Subcuenca<br />
Muñani<br />
Cultivo<br />
Papa dulce 17.30<br />
Papa amarga 3.75<br />
Quinua 9.60<br />
Cañihua 3.85<br />
Pastos cultivados 381.88<br />
Avena forrajera 75.42<br />
Cebada forrajera 8.20<br />
Total 500.00<br />
Demanda hídrica<br />
Área<br />
(ha)<br />
Ago Sep Oct Nov Dic Ene Feb Mar Abr May Jun Jul<br />
Cuadro Nº 9.75 Demanda <strong>de</strong> agua - Irrigación Muñani - Subcuenca <strong>río</strong> Muñani<br />
Ago Sep Oct Nov Dic Ene Feb Mar Abr May Jun Jul<br />
Caudal (m3/s) 0.35 0.40 0.43 0.45 0.36 0.23 0.29 0.30 0.35 0.32 0.28 0.29 -<br />
Volumen <strong>de</strong> agua (hm3) 0.94 1.04 1.15 1.17 0.96 0.62 0.70 0.80 0.91 0.86 0.73 0.78 10.66<br />
Fuente: Perfil <strong>de</strong> Proyecto "Construcción Irrigación Muñani - Hidrología", Gobierno Local <strong>de</strong> Muñani y PRORRIDRE, 2009.<br />
9.4 ESQUEMA HIDRÁULICO<br />
El esquema hidráulico <strong>de</strong> <strong>la</strong>s cuencas Huancané y Suches, se muestran en <strong>la</strong>s Figuras Nº<br />
9.1 y 9.2; consiste en red hidrográfica <strong>de</strong> aguas superficiales a nivel <strong>de</strong> subcuencas para el<br />
<strong>de</strong>sarrollo <strong>de</strong>l ba<strong>la</strong>nce hídrico <strong>de</strong> <strong>la</strong>s ofertas y <strong>de</strong>mandas hídricas. En <strong>la</strong>s cuencas Huancané<br />
y Suches no existen captaciones <strong>de</strong> gran<strong>de</strong>s irrigaciones para mostrar en el esquema, todos<br />
los usos actuales <strong>de</strong> agua tienen captaciones diferentes y muy esparcidas. A<strong>de</strong>más, en <strong>la</strong><br />
actualidad no existen almacenamientos <strong>de</strong> agua en represas en ambas cuencas <strong>de</strong> estudio.<br />
MINAG-ANA-DCPRH-AGUAS SUPERFICIALES Pág.309<br />
Mes<br />
Mes<br />
Total<br />
Anual
<strong>Estudio</strong> <strong>Hidrológico</strong> <strong>de</strong> <strong>la</strong>s <strong>Cuenca</strong>s Huancané y Suches 2010<br />
Muñani<br />
Figura Nº 9.1 Esquema hidráulico <strong>de</strong> <strong>la</strong> cuenca <strong>de</strong>l <strong>río</strong> Huancané<br />
Putina<br />
Huatasani<br />
Río L<strong>la</strong>che<br />
Lago Titicaca<br />
Río Putina Río Muñani<br />
Río Huancané<br />
Río<br />
Pongongoni<br />
Río Tuyto<br />
Huancané<br />
Río Puncune<br />
Río Pistune<br />
Quilcapuncu<br />
Río<br />
Pob<strong>la</strong>ción<br />
MINAG-ANA-DCPRH-AGUAS SUPERFICIALES Pág.310
<strong>Estudio</strong> <strong>Hidrológico</strong> <strong>de</strong> <strong>la</strong>s <strong>Cuenca</strong>s Huancané y Suches 2010<br />
Figura Nº 9.2 Esquema hidráulico <strong>de</strong> <strong>la</strong> cuenca <strong>de</strong>l <strong>río</strong> Suches<br />
Trapiche<br />
Río Caylloma<br />
Río Chueña Huata Jahuira<br />
Cojata<br />
Lugar Cuchaul<strong>la</strong><br />
Lago Titicaca<br />
Río Trapiche<br />
Río Suches<br />
Río Suches<br />
Río Suches<br />
Río Suches<br />
Río Japollo<br />
Río Raya<br />
Escoma<br />
Río<br />
Pob<strong>la</strong>ción<br />
MINAG-ANA-DCPRH-AGUAS SUPERFICIALES Pág.311<br />
Laguna<br />
Suches
<strong>Estudio</strong> <strong>Hidrológico</strong> <strong>de</strong> <strong>la</strong>s <strong>Cuenca</strong>s Huancané y Suches 2010<br />
10.1 GENERALIDADES<br />
CAPÍTULO X<br />
BALANCE HÍDRICO<br />
El ba<strong>la</strong>nce hídrico es <strong>la</strong> comparación entre <strong>la</strong> oferta y <strong>de</strong>manda hídrica <strong>de</strong> una cuenca, cuyo<br />
resultado permite conocer el déficit y/o exceso <strong>de</strong>l recurso hídrico. En el presente estudio<br />
se ha realizado en ba<strong>la</strong>nce hídrico por subcuencas <strong>de</strong> interés <strong>de</strong>ntro <strong>de</strong> <strong>la</strong>s cuencas<br />
Huancané y Suches (Perú).<br />
El punto <strong>de</strong> referencia para <strong>de</strong>sarrol<strong>la</strong>r el ba<strong>la</strong>nce hídrico <strong>de</strong> <strong>la</strong>s subcuencas, es <strong>la</strong> “Salida”<br />
<strong>de</strong> <strong>la</strong>s mismas, a partir <strong>de</strong> ese punto se contabilizan <strong>la</strong> oferta y <strong>la</strong> <strong>de</strong>manda hídrica. En el<br />
ámbito <strong>de</strong> <strong>la</strong>s cuencas Huancané y Suches, actualmente no existen irrigaciones en<br />
funcionamiento con infraestructura <strong>de</strong> riego a mayor esca<strong>la</strong>, generalmente son pequeñas<br />
irrigaciones con captaciones rústicas.<br />
Ecuación <strong>de</strong>l ba<strong>la</strong>nce hídrico <strong>de</strong> <strong>la</strong> cuenca<br />
La ecuación general <strong>de</strong>l ba<strong>la</strong>nce hídrico <strong>de</strong>l <strong>río</strong>, es <strong>la</strong> siguiente:<br />
Ba<strong>la</strong>nce Hídrico Q D<br />
Don<strong>de</strong>:<br />
Q = Oferta hídrica (caudal) <strong>de</strong>l <strong>río</strong>.<br />
D = Demanda hídrica (usos <strong>de</strong> agua).<br />
El caudal medido o generado en un punto <strong>de</strong>l <strong>río</strong>, viene a ser <strong>la</strong> oferta hídrica en situación natural;<br />
don<strong>de</strong> <strong>la</strong> evapotranspiración, infiltración, aguas subterráneas y entre otras variables, ya están<br />
<strong>de</strong>scontadas; razón por <strong>la</strong> que <strong>la</strong>s variables <strong>de</strong>l ciclo hidrológico mencionados anteriormente, no se<br />
consi<strong>de</strong>ran en <strong>la</strong> ecuación <strong>de</strong>l ba<strong>la</strong>nce hídrico <strong>de</strong>scrito anteriormente.<br />
Componentes <strong>de</strong>l ba<strong>la</strong>nce hídrico <strong>de</strong> <strong>la</strong> cuenca<br />
Oferta hídrica (caudal).- Es <strong>la</strong> disponibilidad hídrica <strong>de</strong> un <strong>río</strong> en estado natural, se pue<strong>de</strong> obtener<br />
a partir <strong>de</strong>l registro histórico ó generación <strong>de</strong> <strong>la</strong>s <strong>de</strong>scargas medias utilizando un mo<strong>de</strong>lo <strong>de</strong><br />
precipitación-escorrentía.<br />
Demanda hídrica (usos <strong>de</strong> agua).- La <strong>de</strong>manda <strong>de</strong> agua es el requerimiento <strong>de</strong> los usuarios para<br />
satisfacer una necesidad. En tal sentido el agua se caracteriza no sólo por <strong>la</strong> diversidad <strong>de</strong> usos, sino<br />
por <strong>la</strong> multiplicidad <strong>de</strong> usuarios.<br />
En <strong>de</strong>mandas hídricas, <strong>de</strong>be obtenerse <strong>la</strong> información <strong>de</strong> usos actuales, proyectados y/o futuros, para<br />
<strong>de</strong>sarrol<strong>la</strong>r el ba<strong>la</strong>nce hídrico en situación actual y futura. Los usos <strong>de</strong> agua pue<strong>de</strong>n ser, <strong>de</strong> agríco<strong>la</strong>,<br />
pob<strong>la</strong>cional, industrial, minería, piscicultura y entre otros usos.<br />
MINAG-ANA-DCPRH-AGUAS SUPERFICIALES Pág.312
<strong>Estudio</strong> <strong>Hidrológico</strong> <strong>de</strong> <strong>la</strong>s <strong>Cuenca</strong>s Huancané y Suches 2010<br />
En el presente estudio, el ba<strong>la</strong>nce hídrico se ha <strong>de</strong>sarrol<strong>la</strong>do en dos partes, primero en<br />
situación actual y el segundo en situación futura.<br />
Una vez <strong>de</strong>finido <strong>la</strong> disponibilidad hídrica, <strong>la</strong>s <strong>de</strong>mandas hídricas actuales y futuras, a nivel<br />
<strong>de</strong> subcuencas, se <strong>de</strong>sarrol<strong>la</strong> el ba<strong>la</strong>nce hídrico a nivel mensual.<br />
10.2 OFERTA HÍDRICA<br />
Las ofertas hídricas potencial y disponible en <strong>la</strong>s subcuencas <strong>de</strong> <strong>la</strong>s cuencas Huancané y<br />
Suches se ha <strong>de</strong>terminado en el Capítulo VIII, ítem 8.8. La oferta hídrica superficial<br />
proviene <strong>de</strong> los <strong>río</strong>s y quebradas, que son afluentes al cauce principal <strong>de</strong> <strong>la</strong>s unida<strong>de</strong>s<br />
hidrográficas. Cabe recalcar que en <strong>la</strong>s subcuencas <strong>de</strong> estudio, solo existe información <strong>de</strong><br />
aguas superficiales.<br />
Para el ba<strong>la</strong>nce hídrico <strong>de</strong> <strong>la</strong>s subcuencas, se ha consi<strong>de</strong>rado <strong>la</strong> oferta hídrica superficial<br />
disponible al 75% <strong>de</strong> persistencia, los valores correspondientes se presentaron en los<br />
Cuadros Nº 8.2 y 8.4.<br />
10.3 DEMANDA HÍDRICA EN SITUACIÓN ACTUAL Y FUTURA<br />
La <strong>de</strong>manda hídrica actual correspon<strong>de</strong> básicamente al uso agríco<strong>la</strong>, que es <strong>la</strong> más<br />
relevante en cuanto a volumen <strong>de</strong> agua requerida. Las áreas <strong>de</strong> riego actuales se ha<br />
obtenido <strong>de</strong>l P<strong>la</strong>n <strong>de</strong> Cultivo y Riego <strong>de</strong> <strong>la</strong> campaña agríco<strong>la</strong> 2010-2011, proporcionado<br />
por <strong>la</strong> Administración Local <strong>de</strong> Agua Huancané, cuya superficie <strong>de</strong> riego en <strong>la</strong> cuenca<br />
Huancané es <strong>de</strong> 2345.62 ha y en <strong>la</strong> cuenca Suches (Perú) 1358.43 ha.<br />
Las <strong>de</strong>mandas hídricas actuales por subcuencas se presentaron en el ítem 9.2, lo siguiente:<br />
- Demanda agríco<strong>la</strong>, Cuadros Nº 9.52 y 9.54.<br />
- Demanda pob<strong>la</strong>cional, Cuadros Nº 9.66 y 9.67.<br />
- Demanda minera, Cuadro Nº 9.69.<br />
El caudal ecológico para <strong>la</strong>s subcuencas <strong>de</strong> <strong>la</strong>s cuencas Huancané y Suches, se presentaron<br />
en el ítem 9.2.4, Cuadros Nº 9.71 y 9.73.<br />
La <strong>de</strong>manda hídrica futura correspon<strong>de</strong> básicamente al uso agríco<strong>la</strong> y se presentaron en el<br />
ítem 9.3, Cuadro Nº 9.75.<br />
10.4 BALANCE HÍDRICO EN SITUACIÓN ACTUAL<br />
Para el <strong>de</strong>sarrollo <strong>de</strong>l ba<strong>la</strong>nce hídrico <strong>de</strong> <strong>la</strong>s subcuencas <strong>de</strong> interés, se ha utilizado <strong>la</strong><br />
información <strong>de</strong> <strong>la</strong>s <strong>de</strong>mandas actuales <strong>de</strong> agua y caudales ecológicos, con el fin <strong>de</strong><br />
<strong>de</strong>terminar <strong>la</strong> situación actual <strong>de</strong>l recurso hídrico <strong>de</strong> <strong>la</strong>s subcuencas L<strong>la</strong>che, Tuyto, Muñani,<br />
Pistune y Alto Huancané en <strong>la</strong> cuenca Huancané y <strong>la</strong>s subcuencas Chueña Huata Jahuira,<br />
Caylloma y Trapiche en <strong>la</strong> cuenca Suches (Perú).<br />
MINAG-ANA-DCPRH-AGUAS SUPERFICIALES Pág.313
<strong>Estudio</strong> <strong>Hidrológico</strong> <strong>de</strong> <strong>la</strong>s <strong>Cuenca</strong>s Huancané y Suches 2010<br />
Con <strong>la</strong> información <strong>de</strong> <strong>la</strong> disponibilidad hídrica y <strong>de</strong>mandas <strong>de</strong> agua establecidas, se ha<br />
<strong>de</strong>sarrol<strong>la</strong>do el ba<strong>la</strong>nce hídrico mensual a nivel <strong>de</strong> subcuencas y/o unida<strong>de</strong>s hidrográficas.<br />
En a<strong>de</strong><strong>la</strong>nte se muestran los correspondientes cuadros <strong>de</strong> análisis, don<strong>de</strong> los excesos <strong>de</strong><br />
agua aparecen con signo positivo y los déficit <strong>de</strong> agua con signo negativo, respectivamente.<br />
Los resultados <strong>de</strong>l ba<strong>la</strong>nce hídrico con <strong>de</strong>mandas actuales <strong>de</strong> agua, es <strong>la</strong> siguiente:<br />
Subcuenca L<strong>la</strong>che<br />
En el Cuadro Nº 10.1 se ha <strong>de</strong>sarrol<strong>la</strong>do el ba<strong>la</strong>nce hídrico mensual para <strong>la</strong> subcuenca<br />
L<strong>la</strong>che, cuyo resultado muestra que hay déficit <strong>de</strong>l recurso hídrico en los meses <strong>de</strong> agosto a<br />
octubre, en los meses restantes <strong>la</strong> <strong>de</strong>manda se satisface al 100%. En <strong>la</strong> Figura Nº 10.1 se<br />
muestra <strong>la</strong> comparación gráfica entre <strong>la</strong> oferta y <strong>la</strong> <strong>de</strong>manda hídrica correspondiente.<br />
Componente Variable<br />
Oferta<br />
hídrica<br />
Demanda<br />
hídrica<br />
Ba<strong>la</strong>nce<br />
hídrico<br />
Volumen <strong>de</strong> agua (hm 3 )<br />
Cuadro Nº 10.1 Ba<strong>la</strong>nce hídrico <strong>de</strong> <strong>la</strong> subcuenca L<strong>la</strong>che - Situación actual<br />
Ago Sep Oct Nov Dic Ene Feb Mar Abr May Jun Jul<br />
Aguas superficiales al 75% P (<strong>río</strong>) 0.13 0.16 0.34 0.56 1.25 2.91 3.85 3.04 1.94 0.95 0.58 0.31 16.02<br />
Aguas subterráneas - - - - - - - - - - - - -<br />
Aguas <strong>de</strong> recuperación - - - - - - - - - - - - -<br />
Aguas <strong>de</strong> almacenamiento en represas - - - - - - - - - - - - -<br />
Aguas <strong>de</strong> trasvase - - - - - - - - - - - - -<br />
Otros fuentes <strong>de</strong> agua - - - - - - - - - - - - -<br />
Total 0.13 0.16 0.34 0.56 1.25 2.91 3.85 3.04 1.94 0.95 0.58 0.31 16.02<br />
Uso consuntivo 0.25 0.27 0.33 0.24 0.17 0.01 0.03 0.09 0.24 0.28 0.27 0.17 2.35<br />
Sector Agrícultura (uso agríco<strong>la</strong>) 0.24 0.26 0.32 0.23 0.16 0.00 0.02 0.08 0.23 0.27 0.26 0.16 2.23<br />
Sector Vivienda (uso pob<strong>la</strong>cional) 0.01 0.01 0.01 0.01 0.01 0.01 0.01 0.01 0.01 0.01 0.01 0.01 0.12<br />
Sector minería (uso minero) - - - - - - - - - - - - -<br />
Otros usos <strong>de</strong> agua - - - - - - - - - - - - -<br />
Uso no consuntivo(caudal ecológico) 0.02 0.02 0.03 0.07 0.13 0.27 0.28 0.24 0.17 0.09 0.04 0.02 1.38<br />
Total 0.27 0.29 0.36 0.31 0.30 0.28 0.31 0.33 0.41 0.37 0.31 0.19 3.73<br />
Demanda atendida<br />
Superávit (+)<br />
Déficit (-)<br />
Ba<strong>la</strong>nce hídrico = Oferta hídrica (total) - Demanda hídrica (total).<br />
Déficit<br />
Déficit<br />
Volumen <strong>de</strong> agua mensualizada en hm 3<br />
0.13 0.16 0.34 0.31 0.30 0.28 0.31 0.33 0.41 0.37 0.31 0.19 3.73<br />
48.1% 55.2% 94.4% 100.0% 100.0% 100.0% 100.0% 100.0% 100.0% 100.0% 100.0% 100.0% 100.0%<br />
- - - 0.25 0.95 2.63 3.54 2.71 1.53 0.58 0.27 0.12 12.29<br />
- - - 44.6% 76.0% 90.4% 91.9% 89.1% 78.9% 61.1% 46.6% 38.7% 76.7%<br />
-0.14 -0.13 -0.02 - - - - - - - - - -<br />
51.9% 44.8% 5.6% - - - - - - - - - -<br />
Figura Nº 10.1 Comparación <strong>de</strong> oferta y <strong>de</strong>manda hídrica <strong>de</strong> <strong>la</strong> subcuenca L<strong>la</strong>che - Situación actual<br />
4.5<br />
4.0<br />
3.5<br />
3.0<br />
2.5<br />
2.0<br />
1.5<br />
1.0<br />
0.5<br />
0.0<br />
Ago Sep Oct Nov Dic Ene Feb Mar Abr May Jun Jul<br />
Tiempo (Mes)<br />
Superávit<br />
MINAG-ANA-DCPRH-AGUAS SUPERFICIALES Pág.314<br />
Total<br />
Oferta hídrica Demanda hídrica
<strong>Estudio</strong> <strong>Hidrológico</strong> <strong>de</strong> <strong>la</strong>s <strong>Cuenca</strong>s Huancané y Suches 2010<br />
Subcuenca Tuyto<br />
En el Cuadro Nº 10.2 se ha <strong>de</strong>sarrol<strong>la</strong>do el ba<strong>la</strong>nce hídrico mensual para <strong>la</strong> subcuenca <strong>de</strong>l<br />
<strong>río</strong> Tuyto, cuyo resultado muestra que no hay déficit <strong>de</strong>l recurso hídrico en todo los meses<br />
<strong>de</strong>l año, por lo que <strong>la</strong> <strong>de</strong>manda se satisface al 100%. En <strong>la</strong> Figura Nº 10.2 se muestra <strong>la</strong><br />
comparación gráfica entre <strong>la</strong> oferta y <strong>la</strong> <strong>de</strong>manda hídrica correspondiente.<br />
Componente Variable<br />
Oferta<br />
hídrica<br />
Demanda<br />
hídrica<br />
Ba<strong>la</strong>nce<br />
hídrico<br />
Volumen <strong>de</strong> agua (hm 3 )<br />
Cuadro Nº 10.2 Ba<strong>la</strong>nce hídrico <strong>de</strong> <strong>la</strong> subcuenca Tuyto - Situación actual<br />
Ago Sep Oct Nov Dic Ene Feb Mar Abr May Jun Jul<br />
Aguas superficiales al 75% P (<strong>río</strong>) 1.53 2.02 3.35 5.13 11.52 23.14 36.12 25.66 15.58 7.66 3.71 2.14 137.56<br />
Aguas subterráneas - - - - - - - - - - - - -<br />
Aguas <strong>de</strong> recuperación - - - - - - - - - - - - -<br />
Aguas <strong>de</strong> almacenamiento en represas - - - - - - - - - - - - -<br />
Aguas <strong>de</strong> trasvase - - - - - - - - - - - - -<br />
Otros fuentes <strong>de</strong> agua - - - - - - - - - - - - -<br />
Total 1.53 2.02 3.35 5.13 11.52 23.14 36.12 25.66 15.58 7.66 3.71 2.14 137.56<br />
Uso consuntivo 0.78 0.86 0.89 0.81 0.38 0.03 0.03 0.16 0.60 0.78 0.70 0.54 6.56<br />
Sector Agrícultura (uso agríco<strong>la</strong>) 0.75 0.83 0.86 0.78 0.35 0.00 0.00 0.13 0.57 0.75 0.67 0.51 6.20<br />
Sector Vivienda (uso pob<strong>la</strong>cional) 0.03 0.03 0.03 0.03 0.03 0.03 0.03 0.03 0.03 0.03 0.03 0.03 0.36<br />
Sector minería (uso minero) - - - - - - - - - - - - -<br />
Otros usos <strong>de</strong> agua - - - - - - - - - - - - -<br />
Uso no consuntivo(caudal ecológico) 0.11 0.17 0.29 0.47 0.99 2.12 2.72 2.22 1.48 0.65 0.27 0.14 11.63<br />
Total 0.89 1.03 1.18 1.28 1.37 2.15 2.75 2.38 2.08 1.43 0.97 0.68 18.19<br />
Demanda atendida<br />
Superávit (+)<br />
Déficit (-)<br />
Ba<strong>la</strong>nce hídrico = Oferta hídrica (total) - Demanda hídrica (total).<br />
Volumen <strong>de</strong> agua mensualizada en hm 3<br />
0.89 1.03 1.18 1.28 1.37 2.15 2.75 2.38 2.08 1.43 0.97 0.68 18.19<br />
100.0% 100.0% 100.0% 100.0% 100.0% 100.0% 100.0% 100.0% 100.0% 100.0% 100.0% 100.0% 100.0%<br />
0.64 0.99 2.17 3.85 10.15 20.99 33.37 23.28 13.50 6.23 2.74 1.46 119.37<br />
41.8% 49.0% 64.8% 75.0% 88.1% 90.7% 92.4% 90.7% 86.6% 81.3% 73.9% 68.2% 86.8%<br />
- - - - - - - - - - - - -<br />
- - - - - - - - - - - - -<br />
Figura Nº 10.2 Comparación <strong>de</strong> oferta y <strong>de</strong>manda hídrica <strong>de</strong> <strong>la</strong> subcuenca Tuyto - Situación actual<br />
40.0<br />
35.0<br />
30.0<br />
25.0<br />
20.0<br />
15.0<br />
10.0<br />
5.0<br />
0.0<br />
Ago Sep Oct Nov Dic Ene Feb Mar Abr May Jun Jul<br />
Tiempo (Mes)<br />
Superávit<br />
MINAG-ANA-DCPRH-AGUAS SUPERFICIALES Pág.315<br />
Total<br />
Oferta hídrica Demanda hídrica
<strong>Estudio</strong> <strong>Hidrológico</strong> <strong>de</strong> <strong>la</strong>s <strong>Cuenca</strong>s Huancané y Suches 2010<br />
Subcuenca Muñani<br />
En el Cuadro Nº 10.3 se ha <strong>de</strong>sarrol<strong>la</strong>do el ba<strong>la</strong>nce hídrico mensual para <strong>la</strong> subcuenca <strong>de</strong>l<br />
<strong>río</strong> Muñani, cuyo resultado muestra que no hay déficit <strong>de</strong>l recurso hídrico en todo los<br />
meses <strong>de</strong>l año, por lo que <strong>la</strong> <strong>de</strong>manda se satisface al 100%. En <strong>la</strong> Figura Nº 10.3 se muestra<br />
<strong>la</strong> comparación gráfica entre <strong>la</strong> oferta y <strong>la</strong> <strong>de</strong>manda hídrica correspondiente.<br />
Componente Variable<br />
Oferta<br />
hídrica<br />
Demanda<br />
hídrica<br />
Ba<strong>la</strong>nce<br />
hídrico<br />
Volumen <strong>de</strong> agua (hm 3 )<br />
Cuadro Nº 10.3 Ba<strong>la</strong>nce hídrico <strong>de</strong> <strong>la</strong> subcuenca Muñani - Situación actual<br />
Ago Sep Oct Nov Dic Ene Feb Mar Abr May Jun Jul<br />
Aguas superficiales al 75% P (<strong>río</strong>) 1.87 1.86 2.44 3.43 5.43 11.24 19.67 15.66 10.40 6.42 3.37 2.31 84.10<br />
Aguas subterráneas - - - - - - - - - - - - -<br />
Aguas <strong>de</strong> recuperación - - - - - - - - - - - - -<br />
Aguas <strong>de</strong> almacenamiento en represas - - - - - - - - - - - - -<br />
Aguas <strong>de</strong> trasvase - - - - - - - - - - - - -<br />
Otros fuentes <strong>de</strong> agua - - - - - - - - - - - - -<br />
Total 1.87 1.86 2.44 3.43 5.43 11.24 19.67 15.66 10.40 6.42 3.37 2.31 84.10<br />
Uso consuntivo 1.47 1.70 1.63 1.45 0.93 0.07 0.33 0.69 1.24 1.63 1.45 1.14 13.73<br />
Sector Agrícultura (uso agríco<strong>la</strong>) 1.45 1.68 1.61 1.43 0.91 0.05 0.31 0.67 1.22 1.61 1.43 1.12 13.49<br />
Sector Vivienda (uso pob<strong>la</strong>cional) 0.02 0.02 0.02 0.02 0.02 0.02 0.02 0.02 0.02 0.02 0.02 0.02 0.24<br />
Sector minería (uso minero) - - - - - - - - - - - - -<br />
Otros usos <strong>de</strong> agua - - - - - - - - - - - - -<br />
Uso no consuntivo(caudal ecológico) 0.11 0.12 0.18 0.28 0.52 1.17 1.82 1.45 1.07 0.52 0.24 0.14 7.62<br />
Total 1.58 1.82 1.81 1.73 1.45 1.24 2.15 2.14 2.31 2.15 1.69 1.28 21.35<br />
Demanda atendida<br />
Superávit (+)<br />
Déficit (-)<br />
Ba<strong>la</strong>nce hídrico = Oferta hídrica (total) - Demanda hídrica (total).<br />
Volumen <strong>de</strong> agua mensualizada en hm 3<br />
1.58 1.82 1.81 1.73 1.45 1.24 2.15 2.14 2.31 2.15 1.69 1.28 21.35<br />
100.0% 100.0% 100.0% 100.0% 100.0% 100.0% 100.0% 100.0% 100.0% 100.0% 100.0% 100.0% 100.0%<br />
0.29 0.04 0.63 1.70 3.98 10.00 17.52 13.52 8.09 4.27 1.68 1.03 62.75<br />
15.5% 2.2% 25.8% 49.6% 73.3% 89.0% 89.1% 86.3% 77.8% 66.5% 49.9% 44.6% 74.6%<br />
- - - - - - - - - - - - -<br />
- - - - - - - - - - - - -<br />
Figura Nº 10.3 Comparación <strong>de</strong> oferta y <strong>de</strong>manda hídrica <strong>de</strong> <strong>la</strong> subcuenca Muñani - Situación actual<br />
25.0<br />
20.0<br />
15.0<br />
10.0<br />
5.0<br />
0.0<br />
Ago Sep Oct Nov Dic Ene Feb Mar Abr May Jun Jul<br />
Tiempo (Mes)<br />
Superávit<br />
MINAG-ANA-DCPRH-AGUAS SUPERFICIALES Pág.316<br />
Total<br />
Oferta hídrica Demanda hídrica
<strong>Estudio</strong> <strong>Hidrológico</strong> <strong>de</strong> <strong>la</strong>s <strong>Cuenca</strong>s Huancané y Suches 2010<br />
Subcuenca Pistune<br />
En el Cuadro Nº 10.4 se ha <strong>de</strong>sarrol<strong>la</strong>do el ba<strong>la</strong>nce hídrico mensual para <strong>la</strong> subcuenca <strong>de</strong>l<br />
<strong>río</strong> Pistune, cuyo resultado muestra que hay déficit <strong>de</strong>l recurso hídrico en los meses <strong>de</strong><br />
agosto y setiembre, en los meses restantes <strong>la</strong> <strong>de</strong>manda se satisface al 100%. En <strong>la</strong> Figura<br />
Nº 10.4 se muestra <strong>la</strong> comparación gráfica entre <strong>la</strong> oferta y <strong>la</strong> <strong>de</strong>manda hídrica<br />
correspondiente.<br />
Componente Variable<br />
Oferta<br />
hídrica<br />
Demanda<br />
hídrica<br />
Ba<strong>la</strong>nce<br />
hídrico<br />
Volumen <strong>de</strong> agua (hm 3 )<br />
Cuadro Nº 10.4 Ba<strong>la</strong>nce hídrico <strong>de</strong> <strong>la</strong> subcuenca Pistune - Situación actual<br />
Ago Sep Oct Nov Dic Ene Feb Mar Abr May Jun Jul<br />
Aguas superficiales al 75% P (<strong>río</strong>) 0.36 0.49 1.02 1.81 3.08 7.87 10.52 8.13 5.18 2.62 1.44 0.78 43.30<br />
Aguas subterráneas - - - - - - - - - - - - -<br />
Aguas <strong>de</strong> recuperación - - - - - - - - - - - - -<br />
Aguas <strong>de</strong> almacenamiento en represas - - - - - - - - - - - - -<br />
Aguas <strong>de</strong> trasvase - - - - - - - - - - - - -<br />
Otros fuentes <strong>de</strong> agua - - - - - - - - - - - - -<br />
Total 0.36 0.49 1.02 1.81 3.08 7.87 10.52 8.13 5.18 2.62 1.44 0.78 43.30<br />
Uso consuntivo 0.65 0.66 0.65 0.55 0.33 0.01 0.03 0.22 0.55 0.71 0.68 0.47 5.51<br />
Sector Agrícultura (uso agríco<strong>la</strong>) 0.64 0.65 0.64 0.54 0.32 0.00 0.02 0.21 0.54 0.70 0.67 0.46 5.39<br />
Sector Vivienda (uso pob<strong>la</strong>cional) 0.01 0.01 0.01 0.01 0.01 0.01 0.01 0.01 0.01 0.01 0.01 0.01 0.12<br />
Sector minería (uso minero) - - - - - - - - - - - - -<br />
Otros usos <strong>de</strong> agua - - - - - - - - - - - - -<br />
Uso no consuntivo(caudal ecológico) 0.05 0.06 0.09 0.15 0.29 0.57 0.73 0.60 0.45 0.23 0.11 0.06 3.39<br />
Total 0.70 0.72 0.74 0.70 0.62 0.58 0.76 0.82 1.00 0.94 0.79 0.53 8.90<br />
Demanda atendida<br />
Superávit (+)<br />
Déficit (-)<br />
Ba<strong>la</strong>nce hídrico = Oferta hídrica (total) - Demanda hídrica (total).<br />
Volumen <strong>de</strong> agua mensualizada en hm 3<br />
0.36 0.49 0.74 0.70 0.62 0.58 0.76 0.82 1.00 0.94 0.79 0.53 8.90<br />
51.4% 68.1% 100.0% 100.0% 100.0% 100.0% 100.0% 100.0% 100.0% 100.0% 100.0% 100.0% 100.0%<br />
- - 0.28 1.11 2.46 7.29 9.76 7.31 4.18 1.68 0.65 0.25 34.40<br />
- - 27.5% 61.3% 79.9% 92.6% 92.8% 89.9% 80.7% 64.1% 45.1% 32.1% 79.4%<br />
-0.34 -0.23 - - - - - - - - - - -<br />
48.6% 31.9% - - - - - - - - - - -<br />
Figura Nº 10.4 Comparación <strong>de</strong> oferta y <strong>de</strong>manda hídrica <strong>de</strong> <strong>la</strong> subcuenca Pistune - Situación actual<br />
12.0<br />
10.0<br />
8.0<br />
6.0<br />
4.0<br />
2.0<br />
0.0<br />
Déficit<br />
Déficit<br />
Ago Sep Oct Nov Dic Ene Feb Mar Abr May Jun Jul<br />
Tiempo (Mes)<br />
Superávit<br />
MINAG-ANA-DCPRH-AGUAS SUPERFICIALES Pág.317<br />
Total<br />
Oferta hídrica Demanda hídrica
<strong>Estudio</strong> <strong>Hidrológico</strong> <strong>de</strong> <strong>la</strong>s <strong>Cuenca</strong>s Huancané y Suches 2010<br />
Subcuenca Alto Huancané (<strong>río</strong> Puncune)<br />
En el Cuadro Nº 10.5 se ha <strong>de</strong>sarrol<strong>la</strong>do el ba<strong>la</strong>nce hídrico mensual para <strong>la</strong> subcuenca Alto<br />
Huancané (<strong>río</strong> Puncune), cuyo resultado muestra que no hay déficit <strong>de</strong>l recurso hídrico en<br />
todo los meses <strong>de</strong>l año, por lo que <strong>la</strong> <strong>de</strong>manda se satisface al 100%. En <strong>la</strong> Figura Nº 10.5 se<br />
muestra <strong>la</strong> comparación gráfica entre <strong>la</strong> oferta y <strong>la</strong> <strong>de</strong>manda hídrica correspondiente.<br />
Cuadro Nº 10.5 Ba<strong>la</strong>nce hídrico <strong>de</strong> <strong>la</strong> subcuenca Alto Huancané (<strong>río</strong> Puncune) - Situación actual<br />
Componente Variable<br />
Oferta<br />
hídrica<br />
Demanda<br />
hídrica<br />
Ba<strong>la</strong>nce<br />
hídrico<br />
Ago Sep Oct Nov Dic Ene Feb Mar Abr May Jun Jul<br />
Aguas superficiales al 75% P (<strong>río</strong>) 0.51 0.55 0.93 1.78 2.61 5.77 9.65 9.70 7.15 3.71 1.84 0.94 45.14<br />
Aguas subterráneas - - - - - - - - - - - - -<br />
Aguas <strong>de</strong> recuperación - - - - - - - - - - - - -<br />
Aguas <strong>de</strong> almacenamiento en represas - - - - - - - - - - - - -<br />
Aguas <strong>de</strong> trasvase - - - - - - - - - - - - -<br />
Otros fuentes <strong>de</strong> agua - - - - - - - - - - - - -<br />
Total 0.51 0.55 0.93 1.78 2.61 5.77 9.65 9.70 7.15 3.71 1.84 0.94 45.14<br />
Uso consuntivo 0.44 0.48 0.47 0.37 0.14 0.01 0.01 0.12 0.35 0.52 0.48 0.33 3.72<br />
Sector Agrícultura (uso agríco<strong>la</strong>) 0.43 0.47 0.46 0.36 0.13 0.00 0.00 0.11 0.34 0.51 0.47 0.32 3.60<br />
Sector Vivienda (uso pob<strong>la</strong>cional) 0.01 0.01 0.01 0.01 0.01 0.01 0.01 0.01 0.01 0.01 0.01 0.01 0.12<br />
Sector minería (uso minero) - - - - - - - - - - - - -<br />
Otros usos <strong>de</strong> agua - - - - - - - - - - - - -<br />
Uso no consuntivo(caudal ecológico) 0.05 0.05 0.07 0.13 0.23 0.47 0.88 0.71 0.55 0.28 0.13 0.06 3.61<br />
Total 0.49 0.53 0.54 0.50 0.37 0.48 0.89 0.83 0.90 0.80 0.61 0.39 7.33<br />
Demanda atendida<br />
Superávit (+)<br />
Déficit (-)<br />
Ba<strong>la</strong>nce hídrico = Oferta hídrica (total) - Demanda hídrica (total).<br />
Volumen <strong>de</strong> agua mensualizada en hm 3<br />
0.49 0.53 0.54 0.50 0.37 0.48 0.89 0.83 0.90 0.80 0.61 0.39 7.33<br />
100.0% 100.0% 100.0% 100.0% 100.0% 100.0% 100.0% 100.0% 100.0% 100.0% 100.0% 100.0% 100.0%<br />
0.02 0.02 0.39 1.28 2.24 5.29 8.76 8.87 6.25 2.91 1.23 0.55 37.81<br />
3.9% 3.6% 41.9% 71.9% 85.8% 91.7% 90.8% 91.4% 87.4% 78.4% 66.8% 58.5% 83.8%<br />
- - - - - - - - - - - - -<br />
- - - - - - - - - - - - -<br />
Figura Nº 10.5 Comparación <strong>de</strong> oferta y <strong>de</strong>manda hídrica <strong>de</strong> <strong>la</strong> subcuenca Alto Huancané - Situación actual<br />
Volumen <strong>de</strong> agua (hm 3 )<br />
12.0<br />
10.0<br />
8.0<br />
6.0<br />
4.0<br />
2.0<br />
0.0<br />
Ago Sep Oct Nov Dic Ene Feb Mar Abr May Jun Jul<br />
Tiempo (Mes)<br />
Superávit<br />
MINAG-ANA-DCPRH-AGUAS SUPERFICIALES Pág.318<br />
Total<br />
Oferta hídrica Demanda hídrica
<strong>Estudio</strong> <strong>Hidrológico</strong> <strong>de</strong> <strong>la</strong>s <strong>Cuenca</strong>s Huancané y Suches 2010<br />
<strong>Cuenca</strong> Huancané (cuenca total)<br />
En el Cuadro Nº 10.6 se ha <strong>de</strong>sarrol<strong>la</strong>do el ba<strong>la</strong>nce hídrico mensual para <strong>la</strong> cuenca <strong>de</strong>l <strong>río</strong><br />
Huancané (cuenca total), cuyo resultado muestra que no hay déficit <strong>de</strong>l recurso hídrico en<br />
todo los meses <strong>de</strong>l año, por lo que <strong>la</strong> <strong>de</strong>manda se satisface al 100%. En <strong>la</strong> Figura Nº 10.6 se<br />
muestra <strong>la</strong> comparación gráfica entre <strong>la</strong> oferta y <strong>la</strong> <strong>de</strong>manda hídrica correspondiente.<br />
Cuadro Nº 10.6 Ba<strong>la</strong>nce hídrico <strong>de</strong> <strong>la</strong> cuenca Huancané (cuenca total) - Situación actual<br />
Componente Variable<br />
Oferta<br />
hídrica<br />
Demanda<br />
hídrica<br />
Ba<strong>la</strong>nce<br />
hídrico<br />
Ago Sep Oct Nov Dic Ene Feb Mar Abr May Jun Jul<br />
Aguas superficiales al 75% P (<strong>río</strong>) 5.09 5.86 8.92 14.83 26.22 68.19 94.66 80.70 54.74 28.26 14.00 7.85 409.32<br />
Aguas subterráneas - - - - - - - - - - - - -<br />
Aguas <strong>de</strong> recuperación - - - - - - - - - - - - -<br />
Aguas <strong>de</strong> almacenamiento en represas - - - - - - - - - - - - -<br />
Aguas <strong>de</strong> trasvase - - - - - - - - - - - - -<br />
Otros fuentes <strong>de</strong> agua - - - - - - - - - - - - -<br />
Total 5.09 5.86 8.92 14.83 26.22 68.19 94.66 80.70 54.74 28.26 14.00 7.85 409.32<br />
Uso consuntivo 4.00 4.43 4.46 3.82 2.25 0.22 0.54 1.48 3.36 4.36 3.99 2.96 35.87<br />
Sector Agrícultura (uso agríco<strong>la</strong>) 3.83 4.26 4.29 3.65 2.08 0.05 0.37 1.31 3.19 4.19 3.82 2.79 33.83<br />
Sector Vivienda (uso pob<strong>la</strong>cional) 0.17 0.17 0.17 0.17 0.17 0.17 0.17 0.17 0.17 0.17 0.17 0.17 2.04<br />
Sector minería (uso minero) - - - - - - - - - - - - -<br />
Otros usos <strong>de</strong> agua - - - - - - - - - - - - -<br />
Uso no consuntivo(caudal ecológico) 0.37 0.43 0.70 1.21 2.43 5.17 7.35 6.01 4.35 2.15 0.98 0.52 31.67<br />
Total 4.37 4.86 5.16 5.03 4.68 5.39 7.89 7.49 7.71 6.51 4.97 3.48 67.54<br />
Demanda atendida<br />
Superávit (+)<br />
Déficit (-)<br />
Ba<strong>la</strong>nce hídrico = Oferta hídrica (total) - Demanda hídrica (total).<br />
Volumen <strong>de</strong> agua mensualizada en hm 3<br />
4.37 4.86 5.16 5.03 4.68 5.39 7.89 7.49 7.71 6.51 4.97 3.48 67.54<br />
100.0% 100.0% 100.0% 100.0% 100.0% 100.0% 100.0% 100.0% 100.0% 100.0% 100.0% 100.0% 100.0%<br />
0.72 1.00 3.76 9.80 21.54 62.80 86.77 73.21 47.03 21.75 9.03 4.37 341.78<br />
14.1% 17.1% 42.2% 66.1% 82.2% 92.1% 91.7% 90.7% 85.9% 77.0% 64.5% 55.7% 83.5%<br />
- - - - - - - - - - - - -<br />
- - - - - - - - - - - - -<br />
Figura Nº 10.6 Comparación <strong>de</strong> oferta y <strong>de</strong>manda hídrica <strong>de</strong> <strong>la</strong> cuenca Huancané (cuenca total) - Situación<br />
actual<br />
Volumen <strong>de</strong> agua (hm 3 )<br />
100.0<br />
90.0<br />
80.0<br />
70.0<br />
60.0<br />
50.0<br />
40.0<br />
30.0<br />
20.0<br />
10.0<br />
0.0<br />
Ago Sep Oct Nov Dic Ene Feb Mar Abr May Jun Jul<br />
Tiempo (Mes)<br />
Superávit<br />
MINAG-ANA-DCPRH-AGUAS SUPERFICIALES Pág.319<br />
Total<br />
Oferta hídrica Demanda hídrica
<strong>Estudio</strong> <strong>Hidrológico</strong> <strong>de</strong> <strong>la</strong>s <strong>Cuenca</strong>s Huancané y Suches 2010<br />
Subcuenca Chueña Huata Jahuira<br />
En el Cuadro Nº 10.7 se ha <strong>de</strong>sarrol<strong>la</strong>do el ba<strong>la</strong>nce hídrico mensual para <strong>la</strong> subcuenca <strong>de</strong>l<br />
<strong>río</strong> Chueña Huata Jahuira, cuyo resultado muestra que no hay déficit <strong>de</strong>l recurso hídrico en<br />
todo los meses <strong>de</strong>l año, por lo que <strong>la</strong> <strong>de</strong>manda se satisface al 100%. En <strong>la</strong> Figura Nº 10.7 se<br />
muestra <strong>la</strong> comparación gráfica entre <strong>la</strong> oferta y <strong>la</strong> <strong>de</strong>manda hídrica correspondiente.<br />
Cuadro Nº 10.7 Ba<strong>la</strong>nce hídrico <strong>de</strong> <strong>la</strong> subcuenca Chueña Huata Jahuira - Situación actual<br />
Componente Variable<br />
Oferta<br />
hídrica<br />
Demanda<br />
hídrica<br />
Ba<strong>la</strong>nce<br />
hídrico<br />
Ago Sep Oct Nov Dic Ene Feb Mar Abr May Jun Jul<br />
Aguas superficiales al 75% P (<strong>río</strong>) 0.09 0.11 0.17 0.30 0.53 1.34 2.27 1.53 0.96 0.38 0.24 0.14 8.06<br />
Aguas subterráneas - - - - - - - - - - - - -<br />
Aguas <strong>de</strong> recuperación - - - - - - - - - - - - -<br />
Aguas <strong>de</strong> almacenamiento en represas - - - - - - - - - - - - -<br />
Aguas <strong>de</strong> trasvase - - - - - - - - - - - - -<br />
Otros fuentes <strong>de</strong> agua - - - - - - - - - - - - -<br />
Total 0.09 0.11 0.17 0.30 0.53 1.34 2.27 1.53 0.96 0.38 0.24 0.14 8.06<br />
Uso consuntivo 0.06 0.06 0.04 0.04 0.01 0.01 0.01 0.01 0.04 0.06 0.04 0.04 0.42<br />
Sector Agrícultura (uso agríco<strong>la</strong>) 0.05 0.05 0.03 0.03 0.00 0.00 0.00 0.00 0.03 0.05 0.03 0.03 0.30<br />
Sector Vivienda (uso pob<strong>la</strong>cional) 0.01 0.01 0.01 0.01 0.01 0.01 0.01 0.01 0.01 0.01 0.01 0.01 0.12<br />
Sector minería (uso minero) - - - - - - - - - - - - -<br />
Otros usos <strong>de</strong> agua - - - - - - - - - - - - -<br />
Uso no consuntivo(caudal ecológico) 0.01 0.02 0.02 0.03 0.07 0.17 0.24 0.20 0.13 0.05 0.02 0.01 0.97<br />
Total 0.07 0.08 0.06 0.07 0.08 0.18 0.25 0.21 0.17 0.11 0.06 0.05 1.39<br />
Demanda atendida<br />
Superávit (+)<br />
Déficit (-)<br />
Ba<strong>la</strong>nce hídrico = Oferta hídrica (total) - Demanda hídrica (total).<br />
Volumen <strong>de</strong> agua mensualizada en hm 3<br />
0.07 0.08 0.06 0.07 0.08 0.18 0.25 0.21 0.17 0.11 0.06 0.05 1.39<br />
100.0% 100.0% 100.0% 100.0% 100.0% 100.0% 100.0% 100.0% 100.0% 100.0% 100.0% 100.0% 100.0%<br />
0.02 0.03 0.11 0.23 0.45 1.16 2.02 1.32 0.79 0.27 0.18 0.09 6.67<br />
22.2% 27.3% 64.7% 76.7% 84.9% 86.6% 89.0% 86.3% 82.3% 71.1% 75.0% 64.3% 82.8%<br />
- - - - - - - - - - - - -<br />
- - - - - - - - - - - - -<br />
Figura Nº 10.7 Comparación <strong>de</strong> oferta y <strong>de</strong>manda hídrica <strong>de</strong> <strong>la</strong> subcuenca Chueña Huata Jahuira - Situación<br />
actual<br />
Volumen <strong>de</strong> agua (hm 3 )<br />
2.5<br />
2.0<br />
1.5<br />
1.0<br />
0.5<br />
0.0<br />
Ago Sep Oct Nov Dic Ene Feb Mar Abr May Jun Jul<br />
Tiempo (Mes)<br />
Superávit<br />
MINAG-ANA-DCPRH-AGUAS SUPERFICIALES Pág.320<br />
Total<br />
Oferta hídrica Demanda hídrica
<strong>Estudio</strong> <strong>Hidrológico</strong> <strong>de</strong> <strong>la</strong>s <strong>Cuenca</strong>s Huancané y Suches 2010<br />
Subcuenca Caylloma<br />
En el Cuadro Nº 10.8 se ha <strong>de</strong>sarrol<strong>la</strong>do el ba<strong>la</strong>nce hídrico mensual para <strong>la</strong> subcuenca <strong>de</strong>l<br />
<strong>río</strong> Caylloma, cuyo resultado muestra que hay déficit <strong>de</strong>l recurso hídrico en los meses <strong>de</strong><br />
agosto y setiembre, en los meses restantes <strong>la</strong> <strong>de</strong>manda se satisface al 100%. En <strong>la</strong> Figura<br />
Nº 10.8 se muestra <strong>la</strong> comparación gráfica entre <strong>la</strong> oferta y <strong>la</strong> <strong>de</strong>manda hídrica<br />
correspondiente.<br />
Componente Variable<br />
Oferta<br />
hídrica<br />
Demanda<br />
hídrica<br />
Ba<strong>la</strong>nce<br />
hídrico<br />
Volumen <strong>de</strong> agua (hm 3 )<br />
Cuadro Nº 10.8 Ba<strong>la</strong>nce hídrico <strong>de</strong> <strong>la</strong> subcuenca Caylloma - Situación actual<br />
Ago Sep Oct Nov Dic Ene Feb Mar Abr May Jun Jul<br />
Aguas superficiales al 75% P (<strong>río</strong>) 0.46 0.54 0.78 1.02 1.63 3.95 5.20 3.88 2.58 1.40 0.83 0.61 22.88<br />
Aguas subterráneas - - - - - - - - - - - - -<br />
Aguas <strong>de</strong> recuperación - - - - - - - - - - - - -<br />
Aguas <strong>de</strong> almacenamiento en represas - - - - - - - - - - - - -<br />
Aguas <strong>de</strong> trasvase - - - - - - - - - - - - -<br />
Otros fuentes <strong>de</strong> agua - - - - - - - - - - - - -<br />
Total 0.46 0.54 0.78 1.02 1.63 3.95 5.20 3.88 2.58 1.40 0.83 0.61 22.88<br />
Uso consuntivo 0.78 0.78 0.59 0.54 0.24 0.00 0.00 0.11 0.52 0.83 0.75 0.54 5.68<br />
Sector Agrícultura (uso agríco<strong>la</strong>) 0.78 0.78 0.59 0.54 0.24 0.00 0.00 0.11 0.52 0.83 0.75 0.54 5.68<br />
Sector Vivienda (uso pob<strong>la</strong>cional) - - - - - - - - - - - - -<br />
Sector minería (uso minero) - - - - - - - - - - - - -<br />
Otros usos <strong>de</strong> agua - - - - - - - - - - - - -<br />
Uso no consuntivo(caudal ecológico) 0.03 0.04 0.06 0.09 0.16 0.33 0.40 0.34 0.23 0.11 0.06 0.04 1.89<br />
Total 0.81 0.82 0.65 0.63 0.40 0.33 0.40 0.45 0.75 0.94 0.81 0.58 7.57<br />
Demanda atendida<br />
Superávit (+)<br />
Déficit (-)<br />
Ba<strong>la</strong>nce hídrico = Oferta hídrica (total) - Demanda hídrica (total).<br />
Volumen <strong>de</strong> agua mensualizada en hm 3<br />
0.46 0.54 0.65 0.63 0.40 0.33 0.40 0.45 0.75 0.94 0.81 0.58 7.57<br />
56.8% 65.9% 100.0% 100.0% 100.0% 100.0% 100.0% 100.0% 100.0% 100.0% 100.0% 100.0% 100.0%<br />
- - 0.13 0.39 1.23 3.62 4.80 3.43 1.83 0.46 0.02 0.03 15.31<br />
- - 16.7% 38.2% 75.5% 91.6% 92.3% 88.4% 70.9% 32.9% 2.4% 4.9% 66.9%<br />
-0.35 -0.28 - - - - - - - - - - -<br />
43.2% 34.1% - - - - - - - - - - -<br />
Figura Nº 10.8 Comparación <strong>de</strong> oferta y <strong>de</strong>manda hídrica <strong>de</strong> <strong>la</strong> subcuenca Caylloma - Situación actual<br />
6.0<br />
5.0<br />
4.0<br />
3.0<br />
2.0<br />
1.0<br />
0.0<br />
Déficit<br />
Déficit<br />
Superávit<br />
Ago Sep Oct Nov Dic Ene Feb Mar Abr May Jun Jul<br />
Tiempo (Mes)<br />
MINAG-ANA-DCPRH-AGUAS SUPERFICIALES Pág.321<br />
Total<br />
Oferta hídrica Demanda hídrica
<strong>Estudio</strong> <strong>Hidrológico</strong> <strong>de</strong> <strong>la</strong>s <strong>Cuenca</strong>s Huancané y Suches 2010<br />
Subcuenca Trapiche<br />
En el Cuadro Nº 10.9 se ha <strong>de</strong>sarrol<strong>la</strong>do el ba<strong>la</strong>nce hídrico mensual para <strong>la</strong> subcuenca <strong>de</strong>l<br />
<strong>río</strong> Trapiche, cuyo resultado muestra que hay déficit <strong>de</strong>l recurso hídrico en los meses <strong>de</strong><br />
agosto a octubre, en los meses restantes <strong>la</strong> <strong>de</strong>manda se satisface al 100%. En <strong>la</strong> Figura Nº<br />
10.9 se muestra <strong>la</strong> comparación gráfica entre <strong>la</strong> oferta y <strong>la</strong> <strong>de</strong>manda hídrica<br />
correspondiente.<br />
Componente Variable<br />
Oferta<br />
hídrica<br />
Demanda<br />
hídrica<br />
Ba<strong>la</strong>nce<br />
hídrico<br />
Volumen <strong>de</strong> agua (hm 3 )<br />
Cuadro Nº 10.9 Ba<strong>la</strong>nce hídrico <strong>de</strong> <strong>la</strong> subcuenca Trapiche - Situación actual<br />
Ago Sep Oct Nov Dic Ene Feb Mar Abr May Jun Jul<br />
Aguas superficiales al 75% P (<strong>río</strong>) 0.39 0.30 0.48 0.82 1.13 2.27 4.43 4.05 2.86 1.74 1.03 0.72 20.22<br />
Aguas subterráneas - - - - - - - - - - - - -<br />
Aguas <strong>de</strong> recuperación - - - - - - - - - - - - -<br />
Aguas <strong>de</strong> almacenamiento en represas - - - - - - - - - - - - -<br />
Aguas <strong>de</strong> trasvase - - - - - - - - - - - - -<br />
Otros fuentes <strong>de</strong> agua - - - - - - - - - - - - -<br />
Total 0.39 0.30 0.48 0.82 1.13 2.27 4.43 4.05 2.86 1.74 1.03 0.72 20.22<br />
Uso consuntivo 0.63 0.64 0.60 0.53 0.36 0.12 0.12 0.23 0.53 0.71 0.64 0.49 5.60<br />
Sector Agrícultura (uso agríco<strong>la</strong>) 0.51 0.52 0.48 0.41 0.24 0.00 0.02 0.11 0.41 0.59 0.52 0.37 4.18<br />
Sector Vivienda (uso pob<strong>la</strong>cional) 0.01 0.01 0.01 0.01 0.01 0.01 0.00 0.01 0.01 0.01 0.01 0.01 0.11<br />
Sector minería (uso minero) 0.11 0.11 0.11 0.11 0.11 0.11 0.10 0.11 0.11 0.11 0.11 0.11 1.31<br />
Otros usos <strong>de</strong> agua - - - - - - - - - - - - -<br />
Uso no consuntivo(caudal ecológico) 0.03 0.04 0.05 0.08 0.12 0.23 0.33 0.32 0.27 0.16 0.09 0.05 1.77<br />
Total 0.66 0.68 0.65 0.61 0.48 0.35 0.45 0.55 0.80 0.87 0.73 0.54 7.37<br />
Demanda atendida<br />
Superávit (+)<br />
Déficit (-)<br />
Ba<strong>la</strong>nce hídrico = Oferta hídrica (total) - Demanda hídrica (total).<br />
Volumen <strong>de</strong> agua mensualizada en hm 3<br />
0.39 0.30 0.48 0.61 0.48 0.35 0.45 0.55 0.80 0.87 0.73 0.54 7.37<br />
59.1% 44.1% 73.8% 100.0% 100.0% 100.0% 100.0% 100.0% 100.0% 100.0% 100.0% 100.0% 100.0%<br />
- - - 0.21 0.65 1.92 3.98 3.50 2.06 0.87 0.30 0.18 12.85<br />
- - - 25.6% 57.5% 84.6% 89.8% 86.4% 72.0% 50.0% 29.1% 25.0% 63.6%<br />
-0.27 -0.38 -0.17 - - - - - - - - - -<br />
40.9% 55.9% 26.2% - - - - - - - - - -<br />
Figura Nº 10.9 Comparación <strong>de</strong> oferta y <strong>de</strong>manda hídrica <strong>de</strong> <strong>la</strong> subcuenca Trapiche - Situación actual<br />
5.0<br />
4.5<br />
4.0<br />
3.5<br />
3.0<br />
2.5<br />
2.0<br />
1.5<br />
1.0<br />
0.5<br />
0.0<br />
Déficit<br />
Déficit<br />
Ago Sep Oct Nov Dic Ene Feb Mar Abr May Jun Jul<br />
Tiempo (Mes)<br />
Superávit<br />
MINAG-ANA-DCPRH-AGUAS SUPERFICIALES Pág.322<br />
Total<br />
Oferta hídrica Demanda hídrica
<strong>Estudio</strong> <strong>Hidrológico</strong> <strong>de</strong> <strong>la</strong>s <strong>Cuenca</strong>s Huancané y Suches 2010<br />
10.5 BALANCE HÍDRICO EN SITUACIÓN FUTURA<br />
Para el <strong>de</strong>sarrollo <strong>de</strong>l ba<strong>la</strong>nce hídrico <strong>de</strong> <strong>la</strong>s subcuencas <strong>de</strong> interés, se ha utilizado <strong>la</strong><br />
información <strong>de</strong> <strong>la</strong>s <strong>de</strong>mandas actuales, caudales ecológicos y <strong>de</strong>mandas futuras, con el fin<br />
<strong>de</strong> <strong>de</strong>terminar <strong>la</strong> situación futura <strong>de</strong>l recurso hídrico <strong>de</strong> <strong>la</strong>s subcuencas. En este caso <strong>la</strong><br />
<strong>de</strong>manda futura solo existe en <strong>la</strong> subcuenca <strong>de</strong>l <strong>río</strong> Muñani, por lo tanto el ba<strong>la</strong>nce hídrico<br />
se ha <strong>de</strong>sarrol<strong>la</strong>do para <strong>la</strong> subcuenca Muñani y <strong>la</strong> cuenca Huancané. Cabe recalcar que <strong>la</strong><br />
<strong>de</strong>manda <strong>de</strong> agua utilizada para el ba<strong>la</strong>nce hídrico en situación futura, es <strong>la</strong> total <strong>de</strong> <strong>la</strong> suma<br />
<strong>de</strong> <strong>la</strong>s <strong>de</strong>mandas actuales y <strong>de</strong>mandas futuras.<br />
Con <strong>la</strong> información <strong>de</strong> <strong>la</strong> disponibilidad hídrica y <strong>de</strong>mandas <strong>de</strong> agua establecidas, se ha<br />
<strong>de</strong>sarrol<strong>la</strong>do el ba<strong>la</strong>nce hídrico mensual para <strong>la</strong> subcuenca <strong>de</strong>l <strong>río</strong> Muñani y <strong>la</strong> cuenca<br />
Huancané. En a<strong>de</strong><strong>la</strong>nte se muestran los correspondientes cuadros <strong>de</strong> análisis, don<strong>de</strong> los<br />
excesos <strong>de</strong> agua aparecen con signo positivo y los déficit <strong>de</strong> agua con signo negativo,<br />
respectivamente.<br />
Subcuenca Muñani<br />
En el Cuadro Nº 10.10 se ha <strong>de</strong>sarrol<strong>la</strong>do el ba<strong>la</strong>nce hídrico mensual para <strong>la</strong> subcuenca <strong>de</strong>l<br />
<strong>río</strong> Muñani, cuyo resultado muestra que hay déficit <strong>de</strong>l recurso hídrico en los meses <strong>de</strong><br />
agosto a octubre en situación futura, en los meses restantes <strong>la</strong> <strong>de</strong>manda se satisface al<br />
100%. En <strong>la</strong> Figura Nº 10.10 se muestra <strong>la</strong> comparación gráfica entre <strong>la</strong> oferta y <strong>la</strong><br />
<strong>de</strong>manda hídrica correspondiente.<br />
<strong>Cuenca</strong> Huancané<br />
En el Cuadro Nº 10.11 se ha <strong>de</strong>sarrol<strong>la</strong>do el ba<strong>la</strong>nce hídrico mensual para <strong>la</strong> cuenca <strong>de</strong>l <strong>río</strong><br />
Huancané, cuyo resultado muestra que hay déficit <strong>de</strong>l recurso hídrico en los meses <strong>de</strong><br />
agosto y setiembre en situación futura, en los meses restantes <strong>la</strong> <strong>de</strong>manda se satisface al<br />
100%. En <strong>la</strong> Figura Nº 10.11 se muestra <strong>la</strong> comparación gráfica entre <strong>la</strong> oferta y <strong>la</strong><br />
<strong>de</strong>manda hídrica correspondiente.<br />
Componente Variable<br />
Oferta<br />
hídrica<br />
Demanda<br />
hídrica<br />
Ba<strong>la</strong>nce<br />
hídrico<br />
Cuadro Nº 10.10 Ba<strong>la</strong>nce hídrico <strong>de</strong> <strong>la</strong> subcuenca Muñani - Situación futura<br />
Ago Sep Oct Nov Dic Ene Feb Mar Abr May Jun Jul<br />
Aguas superficiales al 75% P (<strong>río</strong>) 1.87 1.86 2.44 3.43 5.43 11.24 19.67 15.66 10.40 6.42 3.37 2.31 84.10<br />
Aguas subterráneas - - - - - - - - - - - - -<br />
Aguas <strong>de</strong> recuperación - - - - - - - - - - - - -<br />
Aguas <strong>de</strong> almacenamiento en represas - - - - - - - - - - - - -<br />
Aguas <strong>de</strong> trasvase - - - - - - - - - - - - -<br />
Otros fuentes <strong>de</strong> agua - - - - - - - - - - - - -<br />
Total 1.87 1.86 2.44 3.43 5.43 11.24 19.67 15.66 10.40 6.42 3.37 2.31 84.10<br />
Uso consuntivo 2.41 2.74 2.78 2.62 1.89 0.69 1.03 1.49 2.15 2.49 2.18 1.92 24.39<br />
Sector Agrícultura (uso agríco<strong>la</strong>) 2.39 2.72 2.76 2.60 1.87 0.67 1.01 1.47 2.13 2.47 2.16 1.90 24.15<br />
Sector Vivienda (uso pob<strong>la</strong>cional) 0.02 0.02 0.02 0.02 0.02 0.02 0.02 0.02 0.02 0.02 0.02 0.02 0.24<br />
Sector minería (uso minero) - - - - - - - - - - - - -<br />
Otros usos <strong>de</strong> agua - - - - - - - - - - - - -<br />
Uso no consuntivo(caudal ecológico) 0.11 0.12 0.18 0.28 0.52 1.17 1.82 1.45 1.07 0.52 0.24 0.14 7.62<br />
Total 2.52 2.86 2.96 2.90 2.41 1.86 2.85 2.94 3.22 3.01 2.42 2.06 32.01<br />
Demanda atendida<br />
Superávit (+)<br />
Déficit (-)<br />
Ba<strong>la</strong>nce hídrico = Oferta hídrica (total) - Demanda hídrica (total).<br />
Volumen <strong>de</strong> agua mensualizada en hm 3<br />
1.87 1.86 2.44 2.90 2.41 1.86 2.85 2.94 3.22 3.01 2.42 2.06 32.01<br />
74.2% 65.0% 82.4% 100.0% 100.0% 100.0% 100.0% 100.0% 100.0% 100.0% 100.0% 100.0% 100.0%<br />
- - - 0.53 3.02 9.38 16.82 12.72 7.18 3.41 0.95 0.25 52.09<br />
- - - 15.5% 55.6% 83.5% 85.5% 81.2% 69.0% 53.1% 28.2% 10.8% 61.9%<br />
-0.65 -1.00 -0.52 - - - - - - - - - -<br />
25.8% 35.0% 17.6% - - - - - - - - - -<br />
MINAG-ANA-DCPRH-AGUAS SUPERFICIALES Pág.323<br />
Total
<strong>Estudio</strong> <strong>Hidrológico</strong> <strong>de</strong> <strong>la</strong>s <strong>Cuenca</strong>s Huancané y Suches 2010<br />
Volumen <strong>de</strong> agua (hm 3 )<br />
Figura Nº 10.10 Comparación <strong>de</strong> oferta y <strong>de</strong>manda hídrica <strong>de</strong> <strong>la</strong> subcuenca Muñani - Situación futura<br />
25.0<br />
20.0<br />
15.0<br />
10.0<br />
5.0<br />
0.0<br />
Déficit<br />
Ago Sep Oct Nov Dic Ene Feb Mar Abr May Jun Jul<br />
Tiempo (Mes)<br />
Superávit<br />
Oferta hídrica Demanda hídrica<br />
Cuadro Nº 10.11 Ba<strong>la</strong>nce hídrico <strong>de</strong> <strong>la</strong> cuenca Huancané (cuenca total) - Situación futura<br />
Componente Variable<br />
Oferta<br />
hídrica<br />
Demanda<br />
hídrica<br />
Ba<strong>la</strong>nce<br />
hídrico<br />
Volumen <strong>de</strong> agua (hm 3 )<br />
Ago Sep Oct Nov Dic Ene Feb Mar Abr May Jun Jul<br />
Aguas superficiales al 75% P (<strong>río</strong>) 5.09 5.86 8.92 14.83 26.22 68.19 94.66 80.70 54.74 28.26 14.00 7.85 409.32<br />
Aguas subterráneas - - - - - - - - - - - - -<br />
Aguas <strong>de</strong> recuperación - - - - - - - - - - - - -<br />
Aguas <strong>de</strong> almacenamiento en represas - - - - - - - - - - - - -<br />
Aguas <strong>de</strong> trasvase - - - - - - - - - - - - -<br />
Otros fuentes <strong>de</strong> agua - - - - - - - - - - - - -<br />
Total 5.09 5.86 8.92 14.83 26.22 68.19 94.66 80.70 54.74 28.26 14.00 7.85 409.32<br />
Uso consuntivo 4.94 5.47 5.61 4.99 3.21 0.84 1.24 2.28 4.27 5.22 4.72 3.74 46.53<br />
Sector Agrícultura (uso agríco<strong>la</strong>) 4.77 5.30 5.44 4.82 3.04 0.67 1.07 2.11 4.10 5.05 4.55 3.57 44.49<br />
Sector Vivienda (uso pob<strong>la</strong>cional) 0.17 0.17 0.17 0.17 0.17 0.17 0.17 0.17 0.17 0.17 0.17 0.17 2.04<br />
Sector minería (uso minero) - - - - - - - - - - - - -<br />
Otros usos <strong>de</strong> agua - - - - - - - - - - - - -<br />
Uso no consuntivo(caudal ecológico) 0.37 0.43 0.70 1.21 2.43 5.17 7.35 6.01 4.35 2.15 0.98 0.52 31.67<br />
Total 5.31 5.90 6.31 6.20 5.64 6.01 8.59 8.29 8.62 7.37 5.70 4.26 78.20<br />
Demanda atendida<br />
Superávit (+)<br />
Déficit (-)<br />
Ba<strong>la</strong>nce hídrico = Oferta hídrica (total) - Demanda hídrica (total).<br />
Volumen <strong>de</strong> agua mensualizada en hm 3<br />
5.09 5.86 6.31 6.20 5.64 6.01 8.59 8.29 8.62 7.37 5.70 4.26 78.20<br />
95.9% 99.3% 100.0% 100.0% 100.0% 100.0% 100.0% 100.0% 100.0% 100.0% 100.0% 100.0% 100.0%<br />
- - 2.61 8.63 20.58 62.18 86.07 72.41 46.12 20.89 8.30 3.59 331.12<br />
- - 29.3% 58.2% 78.5% 91.2% 90.9% 89.7% 84.3% 73.9% 59.3% 45.7% 80.9%<br />
-0.22 -0.04 - - - - - - - - - - -<br />
4.1% 0.7% - - - - - - - - - - -<br />
Figura Nº 10.11 Comparación <strong>de</strong> oferta y <strong>de</strong>manda hídrica <strong>de</strong> <strong>la</strong> cuenca Huancané - Situación futura<br />
100.0<br />
90.0<br />
80.0<br />
70.0<br />
60.0<br />
50.0<br />
40.0<br />
30.0<br />
20.0<br />
10.0<br />
0.0<br />
Déficit<br />
Ago Sep Oct Nov Dic Ene Feb Mar Abr May Jun Jul<br />
Tiempo (Mes)<br />
Superávit<br />
MINAG-ANA-DCPRH-AGUAS SUPERFICIALES Pág.324<br />
Total<br />
Oferta hídrica Demanda hídrica
<strong>Estudio</strong> <strong>Hidrológico</strong> <strong>de</strong> <strong>la</strong>s <strong>Cuenca</strong>s Huancané y Suches 2010<br />
11.1 GENERALIDADES<br />
CAPÍTULO XI<br />
EVENTOS HIDROLÓGICOS EXTREMOS<br />
En el presente capítulo se ha realizado el análisis <strong>de</strong> eventos extremos <strong>de</strong> naturaleza<br />
hidrometeorológica como exceso <strong>de</strong> escorrentías (avenidas) y escasez <strong>de</strong> lluvias (sequías)<br />
en el ámbito <strong>de</strong> <strong>la</strong>s cuencas Huancané y Suches.<br />
Las máximas avenidas para el <strong>río</strong> Huancané, se ha <strong>de</strong>terminado a través <strong>de</strong>l análisis <strong>de</strong><br />
frecuencia <strong>de</strong> <strong>la</strong>s <strong>de</strong>scargas máximas instantáneas. Para <strong>la</strong>s subcuencas <strong>de</strong> interés, se ha<br />
<strong>de</strong>terminado <strong>la</strong>s máximas avenidas en función <strong>de</strong> <strong>la</strong> información <strong>de</strong> precipitaciones<br />
máximas en 24 horas, aplicando el método <strong>de</strong>l hidrograma unitario sintético <strong>de</strong>l Servicio<br />
<strong>de</strong> Conservación <strong>de</strong> Suelos (SCS).<br />
Con respecto al análisis <strong>de</strong> sequías, se ha i<strong>de</strong>ntificado los pe<strong>río</strong>dos <strong>de</strong> déficit <strong>de</strong><br />
precipitación en el ámbito y entorno <strong>de</strong> <strong>la</strong>s cuencas Huancané y Suches, en base a <strong>la</strong><br />
información disponible <strong>de</strong> registros <strong>de</strong> precipitación total anual y mensual.<br />
11.2 ANÁLISIS DE MÁXIMAS AVENIDAS<br />
Uso <strong>de</strong>l análisis <strong>de</strong> frecuencia en hidrología<br />
En el ámbito <strong>de</strong> <strong>la</strong> hidrología, numerosos fenómenos extremos no pue<strong>de</strong>n pronosticarse en<br />
base a una información <strong>de</strong>terminística, con <strong>la</strong> suficiente <strong>de</strong>streza y tiempo <strong>de</strong> ante<strong>la</strong>ción,<br />
para po<strong>de</strong>r tomar <strong>la</strong>s <strong>de</strong>cisiones pertinentes a su ocurrencia. En dichos casos, se requiere un<br />
enfoque probabilístico con el fin <strong>de</strong> incorporar los efectos <strong>de</strong> esos fenómenos en <strong>la</strong>s<br />
<strong>de</strong>cisiones. Si se pue<strong>de</strong> suponer que <strong>la</strong>s ocurrencias son temporalmente in<strong>de</strong>pendientes,<br />
esto es, el tiempo y <strong>la</strong> magnitud <strong>de</strong> un evento no tiene re<strong>la</strong>ción con los eventos anteriores,<br />
entonces se pue<strong>de</strong> usar el análisis <strong>de</strong> frecuencias para <strong>de</strong>scribir <strong>la</strong> probabilidad <strong>de</strong> cualquier<br />
evento o <strong>de</strong> una combinación <strong>de</strong> ellos, durante el intervalo <strong>de</strong> tiempo necesario para una<br />
<strong>de</strong>cisión. Los fenómenos hidrológicos que se <strong>de</strong>scriben en general mediante el análisis <strong>de</strong><br />
frecuencias son <strong>la</strong>s precipitaciones y <strong>la</strong>s crecidas anuales máximas.<br />
El análisis <strong>de</strong> frecuencias pue<strong>de</strong> ser gráfico o matemático. En el enfoque gráfico, <strong>la</strong>s<br />
observaciones históricas <strong>de</strong> <strong>la</strong> variable <strong>de</strong> interés se or<strong>de</strong>nan en or<strong>de</strong>n ascen<strong>de</strong>nte o<br />
<strong>de</strong>scen<strong>de</strong>nte, y se traza un gráfico <strong>de</strong> <strong>la</strong>s magnitu<strong>de</strong>s <strong>de</strong> los eventos en función <strong>de</strong> su<br />
frecuencia <strong>de</strong> exce<strong>de</strong>ncia o intervalo <strong>de</strong> repetición. Después, se ajusta una curva a través <strong>de</strong><br />
los puntos representados gráficamente para <strong>de</strong>scribir <strong>la</strong> probabilidad <strong>de</strong> ocurrencia futura<br />
<strong>de</strong> cualquier evento. Se dispone <strong>de</strong> un papel especial para gráficos, que pue<strong>de</strong> usarse para<br />
ilustrar <strong>la</strong> curva suave como una línea recta.<br />
MINAG-ANA-DCPRH-AGUAS SUPERFICIALES Pág.325
<strong>Estudio</strong> <strong>Hidrológico</strong> <strong>de</strong> <strong>la</strong>s <strong>Cuenca</strong>s Huancané y Suches 2010<br />
El enfoque matemático para el análisis <strong>de</strong> frecuencias se basa en <strong>la</strong> suposición <strong>de</strong> una<br />
<strong>de</strong>scripción matemática específica, conocida como distribución <strong>de</strong> probabilida<strong>de</strong>s, para<br />
<strong>de</strong>finir el equivalente <strong>de</strong> <strong>la</strong> curva <strong>de</strong>l enfoque gráfico. Los parámetros <strong>de</strong> <strong>la</strong> distribución <strong>de</strong><br />
probabilida<strong>de</strong>s se <strong>de</strong>finen como funciones <strong>de</strong> <strong>la</strong>s estadísticas <strong>de</strong> <strong>la</strong>s observaciones<br />
hidrológicas.<br />
El análisis <strong>de</strong> frecuencia es una herramienta utilizada, para pre<strong>de</strong>cir el comportamiento<br />
futuro <strong>de</strong> <strong>la</strong>s <strong>de</strong>scargas <strong>de</strong> un <strong>río</strong>, a partir <strong>de</strong> <strong>la</strong> información histórica <strong>de</strong> <strong>la</strong>s <strong>de</strong>scargas<br />
máximas. Es un método basado en procedimientos estadísticos que permite calcu<strong>la</strong>r <strong>la</strong><br />
magnitud <strong>de</strong>l caudal asociado a un pe<strong>río</strong>do <strong>de</strong> retorno. Su confiabilidad <strong>de</strong>pen<strong>de</strong> <strong>de</strong> <strong>la</strong><br />
longitud y calidad <strong>de</strong> <strong>la</strong> serie histórica, a<strong>de</strong>más <strong>de</strong> <strong>la</strong> incertidumbre propia <strong>de</strong> <strong>la</strong><br />
distribución <strong>de</strong> probabilida<strong>de</strong>s seleccionada.<br />
Series estadísticas y pe<strong>río</strong>do <strong>de</strong> retorno<br />
En el análisis probabilístico, una serie es una secuencia conveniente <strong>de</strong> datos, como son <strong>la</strong>s<br />
observaciones horarias, diarias, estacionales o anuales <strong>de</strong> una variable hidrológica. Si el<br />
registro <strong>de</strong> estas observaciones contiene todos los eventos que ocurrieron <strong>de</strong>ntro <strong>de</strong> un<br />
pe<strong>río</strong>do dado, a <strong>la</strong> serie se le l<strong>la</strong>ma serie <strong>de</strong> duración completa.<br />
Por razones <strong>de</strong> conveniencia, el registro contiene frecuentemente sólo los eventos cuya<br />
magnitud es superior a una base preseleccionada. A esta serie se le l<strong>la</strong>ma serie <strong>de</strong> duración<br />
parcial. Una serie que contiene sólo el evento con <strong>la</strong> magnitud más gran<strong>de</strong> que ocurrió en<br />
cada año se <strong>de</strong>nomina serie <strong>de</strong> máximos anuales.<br />
El uso <strong>de</strong> <strong>la</strong>s series <strong>de</strong> máximos anuales es muy común en el análisis probabilístico por dos<br />
razones. La primera es por conveniencia, ya que <strong>la</strong> mayoría <strong>de</strong> los datos se procesan <strong>de</strong><br />
manera que <strong>la</strong> serie anual está fácilmente disponible. La segunda es que hay una base<br />
teórica para extrapo<strong>la</strong>r los datos <strong>de</strong> series anuales más allá <strong>de</strong> <strong>la</strong>s posibilida<strong>de</strong>s <strong>de</strong><br />
observación, pero esa teoría hace falta para datos <strong>de</strong> series parciales.<br />
Una razón <strong>de</strong> <strong>la</strong> ausencia <strong>de</strong> una teoría estadística para <strong>la</strong>s series <strong>de</strong> duración parcial es <strong>la</strong><br />
falta <strong>de</strong> in<strong>de</strong>pen<strong>de</strong>ncia <strong>de</strong> los eventos que podrían seguirse uno a otro en secuencia<br />
contigua.<br />
Una limitación <strong>de</strong> los datos <strong>de</strong> series anuales, es que cada año está representado por sólo<br />
un evento. El segundo evento más alto en un año en particu<strong>la</strong>r pue<strong>de</strong> ser más alto que los<br />
más altos <strong>de</strong> otros años, y aun así no estaría contenido en <strong>la</strong> serie. Por tanto, un evento <strong>de</strong><br />
una magnitud dada tendría una frecuencia <strong>de</strong> ocurrencia diferente para cada una <strong>de</strong> <strong>la</strong>s dos<br />
series.<br />
Las series <strong>de</strong> duración completa pue<strong>de</strong>n requerirse para el enfoque estocástico en el cual no<br />
se requiere <strong>la</strong> in<strong>de</strong>pen<strong>de</strong>ncia. También pue<strong>de</strong>n servir para el análisis probabilístico <strong>de</strong> datos<br />
en regiones áridas, don<strong>de</strong> los eventos son raros y casi in<strong>de</strong>pendientes.<br />
El pe<strong>río</strong>do <strong>de</strong> retorno (TR) <strong>de</strong> un evento dado, es el número promedio <strong>de</strong> años <strong>de</strong>ntro <strong>de</strong>l<br />
cual se espera que el evento sea igua<strong>la</strong>do o excedido sólo una vez. El evento que se espera<br />
sea igua<strong>la</strong>do o excedido cada n años, es el evento <strong>de</strong> n años (XTR). Ambos términos se<br />
MINAG-ANA-DCPRH-AGUAS SUPERFICIALES Pág.326
<strong>Estudio</strong> <strong>Hidrológico</strong> <strong>de</strong> <strong>la</strong>s <strong>Cuenca</strong>s Huancané y Suches 2010<br />
refieren a <strong>la</strong> frecuencia <strong>de</strong> ocurrencia promedio esperada <strong>de</strong> un evento durante un <strong>la</strong>rgo<br />
pe<strong>río</strong>do <strong>de</strong> años. El pe<strong>río</strong>do <strong>de</strong> retorno es igual al inverso <strong>de</strong> <strong>la</strong> probabilidad <strong>de</strong> exce<strong>de</strong>ncia<br />
<strong>de</strong> un evento dado.<br />
Distribución <strong>de</strong> probabilida<strong>de</strong>s usadas en hidrología<br />
La distribución <strong>de</strong> probabilida<strong>de</strong>s se usan en una amplia variedad <strong>de</strong> estudios hidrológicos,<br />
por ejemplo los estudios <strong>de</strong> recursos hídricos, <strong>de</strong> caudales extremos altos y bajos, <strong>de</strong><br />
sequías, <strong>de</strong> volúmenes en embalses, <strong>de</strong> cantida<strong>de</strong>s <strong>de</strong> lluvia y <strong>de</strong> mo<strong>de</strong>los <strong>de</strong> series<br />
cronológicas.<br />
Los totales anuales, como los volúmenes <strong>de</strong> escurrimiento o <strong>la</strong> cantidad <strong>de</strong> lluvia, tien<strong>de</strong>n a<br />
estar distribuidos normalmente o casi <strong>de</strong>bido al teorema estadístico <strong>de</strong>l límite central. Los<br />
totales semanales y mensuales son menos simétricos (asimetría casi siempre positiva) y,<br />
por lo general, no se pue<strong>de</strong>n mo<strong>de</strong><strong>la</strong>r con <strong>la</strong> distribución normal.<br />
Las funciones <strong>de</strong> distribución <strong>de</strong> probabilida<strong>de</strong>s usadas en hidrología, específicamente para<br />
el análisis <strong>de</strong> máximas avenidas, se muestran en a<strong>de</strong><strong>la</strong>nte. Sus <strong>de</strong>finiciones matemáticas<br />
figuran en <strong>la</strong>s bibliografías citadas en el presente estudio.<br />
- Distribución LogNormal <strong>de</strong> 2 parámetros.<br />
- Distribución LogNormal <strong>de</strong> 3 parámetros.<br />
- Distribución Gumbel.<br />
- Distribución Pearson Tipo III.<br />
- Distribución LogPearson Tipo III.<br />
Estimación <strong>de</strong> parámetros<br />
A<strong>de</strong>más <strong>de</strong> <strong>la</strong> elección <strong>de</strong> una distribución, el método <strong>de</strong> estimación <strong>de</strong> parámetros que se<br />
usa con <strong>la</strong> distribución pue<strong>de</strong> tener un efecto en los resultados. Tradicionalmente, el<br />
método <strong>de</strong> momentos ordinarios (MMO) y el método <strong>de</strong> máxima verosimilitud (MMV)<br />
han sido muy usados en hidrología.<br />
Homogeneidad <strong>de</strong> datos<br />
La homogeneidad <strong>de</strong> los datos hidrológicos es indispensable para una aplicación<br />
estadística válida. Existen muchas razones por <strong>la</strong>s cuales una serie <strong>de</strong> datos pudiera no ser<br />
homogénea, por ejemplo:<br />
a) Una serie cronológica <strong>de</strong> caudales máximos, pue<strong>de</strong> contener caudales<br />
proce<strong>de</strong>ntes <strong>de</strong> nieve <strong>de</strong>rretida y <strong>de</strong> lluvia;<br />
b) Una serie cronológica pue<strong>de</strong> contener datos <strong>de</strong> caudales medidos antes <strong>de</strong> <strong>la</strong><br />
construcción <strong>de</strong> una estructura hidráulica, en condiciones inalteradas, y <strong>de</strong>spués<br />
<strong>de</strong> <strong>la</strong> construcción, cuando el régimen <strong>de</strong> escurrimiento está contro<strong>la</strong>do; o<br />
c) Una serie cronológica pue<strong>de</strong> contener datos <strong>de</strong> caudales que incluyen mezc<strong>la</strong>s <strong>de</strong><br />
errores sistemáticos y aleatorios.<br />
La homogeneidad <strong>de</strong> los datos también pue<strong>de</strong> ser alterada por los cambios antropógenos<br />
<strong>de</strong>l clima.<br />
MINAG-ANA-DCPRH-AGUAS SUPERFICIALES Pág.327
<strong>Estudio</strong> <strong>Hidrológico</strong> <strong>de</strong> <strong>la</strong>s <strong>Cuenca</strong>s Huancané y Suches 2010<br />
11.2.1 Análisis <strong>de</strong> máximas avenidas en el <strong>río</strong> Huancané<br />
En el <strong>río</strong> Huancané se dispone <strong>de</strong> <strong>la</strong> información hidrométrica, consistente en caudales<br />
máximos promedios diarios <strong>de</strong>l pe<strong>río</strong>do <strong>de</strong> 1956-2009 (53 años con información), ésta<br />
información se ha utilizado para el análisis <strong>de</strong> máximas avenidas, empleando los métodos<br />
probabilísticos se <strong>de</strong>terminarán los caudales máximos para diferentes pe<strong>río</strong>dos <strong>de</strong> retorno.<br />
11.2.1.1 Información básica<br />
La información faltante en el registro <strong>de</strong> caudales máximos promedios diarios <strong>de</strong>l <strong>río</strong><br />
Huancané, se ha completado a través <strong>de</strong> <strong>la</strong> corre<strong>la</strong>ción con los caudales máximos <strong>de</strong>l <strong>río</strong><br />
Ramis, utilizando el Software <strong>Hidrológico</strong> HEC-4.<br />
Según <strong>la</strong> información <strong>de</strong>l SENAMHI, los caudales máximos <strong>de</strong>l <strong>río</strong> Huancané, son<br />
caudales máximos promedios diarios, vale <strong>de</strong>cir, promedio <strong>de</strong> <strong>la</strong>s lecturas diarias, y por lo<br />
tanto no son datos instantáneos, por esta razón se convirtieron a caudales máximos<br />
instantáneos mediante <strong>la</strong> aplicación <strong>de</strong>l Método <strong>de</strong> Fuller, que se fundamenta en función<br />
<strong>de</strong>l área <strong>de</strong> <strong>la</strong> cuenca. La información <strong>de</strong> caudales máximos instantáneos, es <strong>la</strong> que se<br />
utiliza para el análisis <strong>de</strong> máximas avenidas.<br />
2.66 <br />
Fórmu<strong>la</strong> <strong>de</strong> Fuller: Q inst Qmáx<br />
1<br />
0.3 <br />
A <br />
Don<strong>de</strong>: Qinst = Caudal máximo instantáneo (m 3 /s).<br />
Qmáx = Caudal máximo medio diario (m 3 /s).<br />
A = Área <strong>de</strong> <strong>la</strong> cuenca <strong>de</strong> interés (km 2 ).<br />
Reemp<strong>la</strong>zando el área <strong>de</strong> <strong>la</strong> cuenca <strong>de</strong>l <strong>río</strong> Huancané (3511.10 km 2 , área <strong>de</strong> influencia <strong>de</strong> <strong>la</strong><br />
estación hidrométrica), se obtiene un factor <strong>de</strong> 1.23 aproximadamente y por lo tanto <strong>la</strong><br />
ecuación queda <strong>de</strong> <strong>la</strong> siguiente forma:<br />
Q 1.23 Q<br />
inst<br />
Para el diseño <strong>de</strong> estructuras hidráulicas, <strong>la</strong> información hidrométrica <strong>de</strong>ben ser valores<br />
máximos instantáneos, no los valores medios diarios, sabiendo que una estructura<br />
hidráulica construida en el <strong>río</strong> <strong>de</strong>be soportar a <strong>la</strong> máxima avenida instantánea.<br />
El registro <strong>de</strong> <strong>la</strong> información <strong>de</strong> <strong>la</strong> serie anual <strong>de</strong> caudales máximos instantáneos <strong>de</strong>l <strong>río</strong><br />
Huancané, correspon<strong>de</strong> al pe<strong>río</strong>do <strong>de</strong> 1956-2009 (54 años <strong>de</strong> información). Esta<br />
información proviene <strong>de</strong> una selección <strong>de</strong> valores máximos <strong>de</strong>l registro históricocompletado<br />
<strong>de</strong> <strong>la</strong>s <strong>de</strong>scargas máximas <strong>de</strong> <strong>la</strong> estación hidrométrica <strong>de</strong> Puente Huancané.<br />
En el Cuadro Nº 11.1 se presenta <strong>la</strong> serie anual <strong>de</strong> <strong>la</strong>s <strong>de</strong>scargas máximas instantáneas<br />
diarias <strong>de</strong>l <strong>río</strong> Huancané, cuyo caudal máximo histórico registrado es <strong>de</strong> 447.72 m 3 /s en el<br />
año 1971 y el mínimo es <strong>de</strong> 56.33 m 3 /s en el año 1990.<br />
MINAG-ANA-DCPRH-AGUAS SUPERFICIALES Pág.328<br />
máx
<strong>Estudio</strong> <strong>Hidrológico</strong> <strong>de</strong> <strong>la</strong>s <strong>Cuenca</strong>s Huancané y Suches 2010<br />
Cuadro Nº 11.1 Registro <strong>de</strong> <strong>la</strong> serie anual <strong>de</strong> caudales máximos diarios<br />
Río Huancané – Estación Puente Huancané<br />
Longitud W: 69°47'33.37" ; Latitud S: 15°12'57.10" ; Altitud: 3814.00 msnm ; Área: 3,511.10 km2<br />
No Año<br />
Históricos Generados Completados Instantáneos<br />
(1) (2) (3) (4)<br />
1 1956 111.80 111.80 137.51<br />
2 1957 133.00 133.00 163.59<br />
3 1958 117.90 117.90 145.02<br />
4 1959 155.30 155.30 191.02<br />
5 1960 156.40 156.40 192.37<br />
6 1961 96.40 96.40 118.57<br />
7 1962 191.00 191.00 234.93<br />
8 1963 183.40 183.40 225.58<br />
9 1964 150.00 150.00 184.50<br />
10 1965 147.00 147.00 180.81<br />
11 1966 147.70 147.70 181.67<br />
12 1967 93.00 93.00 114.39<br />
13 1968 77.40 77.40 95.20<br />
14 1969 82.30 82.30 101.23<br />
15 1970 155.00 155.00 190.65<br />
16 1971 364.00 364.00 447.72<br />
17 1972 93.40 93.40 114.88<br />
18 1973 145.40 145.40 178.84<br />
19 1974 210.50 210.50 258.92<br />
20 1975 163.00 163.00 200.49<br />
21 1976 111.2 111.20 136.78<br />
22 1977 132.1 132.10 162.48<br />
23 1978 130.4 130.40 160.39<br />
24 1979 243.9 243.90 300.00<br />
25 1980 89.60 89.60 110.21<br />
26 1981 170.10 170.10 209.22<br />
27 1982 159.10 159.10 195.69<br />
28 1983 64.00 64.00 78.72<br />
29 1984 179.20 179.20 220.42<br />
30 1985 155.00 155.00 190.65<br />
31 1986 212.00 212.00 260.76<br />
32 1987 141.60 141.60 174.17<br />
33 1988 155.00 155.00 190.65<br />
34 1989 79.50 79.50 97.79<br />
35 1990 45.80 45.80 56.33<br />
36 1991 66.80 66.80 82.16<br />
37 1992 56.60 56.60 69.62<br />
38 1993 128.50 128.50 158.06<br />
39 1994 203.30 203.30 250.06<br />
40 1995 109.30 109.30 134.44<br />
41 1996 98.80 98.80 121.52<br />
42 1997 200.00 200.00 246.00<br />
43 1998 102.70 102.70 126.32<br />
44 1999 176.80 176.80 217.46<br />
45 2000 123.70 123.70 152.15<br />
46 2001 187.20 187.20 230.26<br />
47 2002 150.00 150.00 184.50<br />
48 2003 206.10 206.10 253.50<br />
49 2004 246.00 246.00 302.58<br />
50 2005 160.30 160.30 197.17<br />
51 2006 139.10 139.10 171.09<br />
52 2007 97.10 97.10 119.43<br />
53 <strong>2008</strong> 175.40 175.40 215.74<br />
54 2009 66.80 66.80 82.16<br />
Caudal máximo <strong>de</strong> <strong>la</strong> serie:<br />
Caudales máximos diarios anuales (m3/s)<br />
364.00 175.40 364.00 447.72<br />
(1) Caudales máximos diarios promedios históricos. (3) Caudales completados con <strong>la</strong> información generada.<br />
(2) Caudales generados con Hec-4 con el Río Ramis. (4) Caudales máximos instantáneos (Fuller=1.23).<br />
MINAG-ANA-DCPRH-AGUAS SUPERFICIALES Pág.329
<strong>Estudio</strong> <strong>Hidrológico</strong> <strong>de</strong> <strong>la</strong>s <strong>Cuenca</strong>s Huancané y Suches 2010<br />
Caudal (m 3 /s)<br />
500<br />
450<br />
400<br />
350<br />
300<br />
250<br />
200<br />
150<br />
100<br />
50<br />
0<br />
Figura Nº 11.1 Hidrograma <strong>de</strong> caudales máximos instantáneos<br />
Río Huancané – Estación Puente Huancané<br />
1955 1960 1965 1970 1975 1980 1985 1990 1995 2000 2005 2010<br />
Tiempo (año)<br />
11.2.1.2 Análisis <strong>de</strong> frecuencia <strong>de</strong> caudales máximos instantáneos<br />
El análisis <strong>de</strong> frecuencia consiste en <strong>de</strong>terminar los parámetros <strong>de</strong> <strong>la</strong>s distribuciones <strong>de</strong><br />
probabilidad y <strong>de</strong>terminar <strong>la</strong> magnitud <strong>de</strong>l evento para un pe<strong>río</strong>do <strong>de</strong> retorno dado.<br />
Para realizar el análisis <strong>de</strong> frecuencia <strong>de</strong> <strong>la</strong>s <strong>de</strong>scargas máximas instantáneas <strong>de</strong>l <strong>río</strong><br />
Huancané, se ha utilizado el Software <strong>Hidrológico</strong> <strong>de</strong> Eventos Extremos FLFREQ, es un<br />
programa que permite calcu<strong>la</strong>r <strong>la</strong>s <strong>de</strong>scargas máximas para diferentes pe<strong>río</strong>dos <strong>de</strong> retorno,<br />
consi<strong>de</strong>rando <strong>la</strong>s funciones <strong>de</strong> distribución <strong>de</strong> probabilida<strong>de</strong>s <strong>de</strong> LogNormal <strong>de</strong> 2<br />
parámetros, LogNormal <strong>de</strong> 3 parámetros, Gumbel I y LogPearson III.<br />
En los Cuadros Nº 11.2 a 11.4, se muestran el resultado <strong>de</strong>l análisis <strong>de</strong> frecuencia <strong>de</strong> <strong>la</strong>s<br />
<strong>de</strong>scargas máximas instantáneas <strong>de</strong>l <strong>río</strong> Huancané.<br />
MINAG-ANA-DCPRH-AGUAS SUPERFICIALES Pág.330
<strong>Estudio</strong> <strong>Hidrológico</strong> <strong>de</strong> <strong>la</strong>s <strong>Cuenca</strong>s Huancané y Suches 2010<br />
Cuadro Nº 11.2 Análisis <strong>de</strong> frecuencia <strong>de</strong> caudales máximos instantáneos<br />
Río Huancané – Estación Puente Huancané<br />
--------------------------------------------------------------------------------------<br />
YEAR DATA ORDERED RANK PROB. RET. PERIOD<br />
--------------------------------------------------------------------------------------<br />
1956 137.5 447.7 1 .011 90.333<br />
1957 163.6 302.6 2 .030 33.875<br />
1958 145.0 300.0 3 .048 20.846<br />
1959 191.0 260.8 4 .066 15.056<br />
1960 192.4 258.9 5 .085 11.783<br />
1961 118.6 253.5 6 .103 9.679<br />
1962 234.9 250.1 7 .122 8.212<br />
1963 225.6 246.0 8 .140 7.132<br />
1964 184.5 234.9 9 .159 6.302<br />
1965 180.8 230.3 10 .177 5.646<br />
1966 181.7 225.6 11 .196 5.113<br />
1967 114.4 220.4 12 .214 4.672<br />
1968 95.2 217.5 13 .232 4.302<br />
1969 101.2 215.7 14 .251 3.985<br />
1970 190.6 209.2 15 .269 3.712<br />
1971 447.7 200.5 16 .288 3.474<br />
1972 114.9 197.2 17 .306 3.265<br />
1973 178.8 195.7 18 .325 3.080<br />
1974 258.9 192.4 19 .343 2.914<br />
1975 200.5 191.0 20 .362 2.765<br />
1976 136.8 190.6 21 .380 2.631<br />
1977 162.5 190.6 22 .399 2.509<br />
1978 160.4 190.6 23 .417 2.398<br />
1979 300.0 184.5 24 .435 2.297<br />
1980 110.2 184.5 25 .454 2.203<br />
1981 209.2 181.7 26 .472 2.117<br />
1982 195.7 180.8 27 .491 2.038<br />
1983 78.7 178.8 28 .509 1.964<br />
1984 220.4 174.2 29 .528 1.895<br />
1985 190.6 171.1 30 .546 1.831<br />
1986 260.8 163.6 31 .565 1.771<br />
1987 174.2 162.5 32 .583 1.715<br />
1988 190.6 160.4 33 .601 1.663<br />
1989 97.8 158.1 34 .620 1.613<br />
1990 56.3 152.1 35 .638 1.566<br />
1991 82.2 145.0 36 .657 1.522<br />
1992 69.6 137.5 37 .675 1.481<br />
1993 158.1 136.8 38 .694 1.441<br />
1994 250.1 134.4 39 .712 1.404<br />
1995 134.4 126.3 40 .731 1.369<br />
1996 121.5 121.5 41 .749 1.335<br />
1997 246.0 119.4 42 .768 1.303<br />
1998 126.3 118.6 43 .786 1.272<br />
1999 217.5 114.9 44 .804 1.243<br />
2000 152.1 114.4 45 .823 1.215<br />
2001 230.3 110.2 46 .841 1.189<br />
2002 184.5 101.2 47 .860 1.163<br />
2003 253.5 97.8 48 .878 1.139<br />
2004 302.6 95.2 49 .897 1.115<br />
2005 197.2 82.2 50 .915 1.093<br />
2006 171.1 82.2 51 .934 1.071<br />
2007 119.4 78.7 52 .952 1.050<br />
<strong>2008</strong> 215.7 69.6 53 .970 1.030<br />
2009 82.2 56.3 54 .989 1.011<br />
-------------------------------------------------------------------------------------<br />
MINAG-ANA-DCPRH-AGUAS SUPERFICIALES Pág.331
<strong>Estudio</strong> <strong>Hidrológico</strong> <strong>de</strong> <strong>la</strong>s <strong>Cuenca</strong>s Huancané y Suches 2010<br />
Cuadro Nº 11.3 Parámetros estadísticos <strong>de</strong> <strong>la</strong> muestra y <strong>de</strong> <strong>la</strong>s distribuciones teóricas<br />
-----------------------------------------------------------------------------------------------<br />
SAMPLE STATISTICS<br />
MEAN = 176. S.D. = 69.5 C.S. = 1.0788 C.K. = 6.2986<br />
SAMPLE STATISTICS (LOGS)<br />
MEAN = 5.0951 S.D. = .4052 C.S. = -.3977 C.K. = 3.4610<br />
SAMPLE MIN = 56. SAMPLE MAX = 448. N = 54<br />
PARAMETERS FOR GUMBEL I A = .017652 U = 145.<br />
PARAMETERS FOR LOGNORMAL M = 5.0951 S = .4052<br />
PARAMETERS FOR THREE PARAMETER LOGNORMAL A = -76. M = 5.4948 S = .2684<br />
STATISTICS OF LOG(X-A)<br />
MEAN = 5.4948 S.D. = .2684 C.S. = .0046 C.K. = 3.4783<br />
PARAMETERS FOR LOG PEARSON III BY MOMENTS A = -.0806 B = .2529E+02<br />
LOG(M)= 7.1331 M = .1253E+04<br />
PARAMETERS FOR LOG PEARSON III BY MAXIMUM LIKELIHOOD A = -.0639<br />
B = .3930E+02 LOG(M) = 7.6056 M = .2009E+04<br />
DISTRIBUTION STATISTICS MEAN = 5.0951 S.D. = .4005 C.S. = -.3190<br />
-----------------------------------------------------------------------------------------------<br />
Cuadro Nº 11.4 Caudales máximos instantáneos (m 3 /s) para diferentes distribuciones <strong>de</strong> probabilidad<br />
Río Huancané – Estación Puente Huancané<br />
TR<br />
(años)<br />
Gumbel LogNormal 2P LogNormal 3P<br />
% Error<br />
% Error<br />
% Error<br />
Caudal Caudal<br />
Caudal<br />
Caudal<br />
Estándar<br />
Estándar<br />
Estándar<br />
LogPearson Tipo III<br />
Verosimilitud Momentos<br />
% Error<br />
Estándar<br />
1.005 50.10 57.50 45.90 51.60 49.40<br />
1.05 81.50 83.80 80.60 81.60 80.30<br />
1.25 118.00 116.00 118.00 117.00 117.00<br />
2 165.00 163.00 167.00 167.00 168.00<br />
5 230.00 6.05 230.00 6.42 229.00 5.67 230.00 5.81 231.00 5.75<br />
10 272.00 6.55 274.00 7.44 267.00 6.50 268.00 6.41 269.00 6.28<br />
20 313.00 6.97 318.00 8.46 303.00 7.69 304.00 7.51 303.00 7.51<br />
50 366.00 7.42 375.00 9.72 347.00 9.49 347.00 9.52 344.00 9.86<br />
100 405.00 7.69 419.00 10.60 379.00 10.90 377.00 11.30 372.00 11.90<br />
200 445.00 7.92 464.00 11.50 410.00 12.30 407.00 13.20 399.00 14.20<br />
500 497.00 8.18 524.00 12.50 451.00 14.20 444.00 15.90 433.00 17.20<br />
1000 536.00 8.35 573.00 13.30 483.00 15.60 472.00 18.00 458.00 19.60<br />
2000 575.00 8.49 621.00 14.00 514.00 17.00 499.00 20.00 482.00 22.00<br />
5000 627.00 8.66 685.00 14.90 554.00 18.70 532.00 22.70 510.00 25.00<br />
10000 666.00 8.77 737.00 15.50 585.00 20.00 557.00 24.80 532.00 27.30<br />
11.2.1.3 Caudales máximos instantáneos para diferentes pe<strong>río</strong>dos <strong>de</strong> retorno<br />
MINAG-ANA-DCPRH-AGUAS SUPERFICIALES Pág.332<br />
Caudal<br />
% Error<br />
Estándar<br />
Según el análisis <strong>de</strong> frecuencia resulta que <strong>la</strong> serie anual <strong>de</strong> caudales máximos instantáneos<br />
<strong>de</strong>l <strong>río</strong> Huancané se ajusta mejor a <strong>la</strong> distribución Gumbel (método <strong>de</strong> máxima<br />
verosimilitud), por mostrar menor porcentaje <strong>de</strong> error estándar que otras distibuciones<br />
teóricas. A continuación se muestran los caudales máximos instantáneos <strong>de</strong> diseño para<br />
diferentes pe<strong>río</strong>dos <strong>de</strong> retorno.
<strong>Estudio</strong> <strong>Hidrológico</strong> <strong>de</strong> <strong>la</strong>s <strong>Cuenca</strong>s Huancané y Suches 2010<br />
Caudal (m 3 /s)<br />
Cuadro Nº 11.5 Caudales máximos instantáneos para diferentes pe<strong>río</strong>dos <strong>de</strong> retorno<br />
Río Huancané – Estación Puente Huancané<br />
(ajuste distribución Gumbel - Método <strong>de</strong> máxima verosimilitud)<br />
700.0<br />
600.0<br />
500.0<br />
400.0<br />
300.0<br />
200.0<br />
100.0<br />
0.0<br />
Pe<strong>río</strong>do <strong>de</strong> retorno (TR)<br />
(años)<br />
Caudales Máximos Instantáneos<br />
(m 3 /s)<br />
2 165.0<br />
5 230.0<br />
10 272.0<br />
20 313.0<br />
50 366.0<br />
100 405.0<br />
200 445.0<br />
500 497.0<br />
1000 536.0<br />
Figura Nº 11.2 Curva <strong>de</strong> frecuencia <strong>de</strong> caudales máximos instantáneos<br />
Río Huancané - Puente Huancané<br />
(ajuste distribución Gumbel - Método <strong>de</strong> máxima verosimilitud)<br />
0 100 200 300 400 500 600 700 800 900 1000 1100<br />
Pe<strong>río</strong>do <strong>de</strong> retorno (año)<br />
MINAG-ANA-DCPRH-AGUAS SUPERFICIALES Pág.333
<strong>Estudio</strong> <strong>Hidrológico</strong> <strong>de</strong> <strong>la</strong>s <strong>Cuenca</strong>s Huancané y Suches 2010<br />
11.2.2 Análisis <strong>de</strong> máximas avenidas en <strong>la</strong>s subcuencas<br />
Para el análisis <strong>de</strong> máximas avenidas <strong>de</strong> <strong>la</strong>s subcuencas correspondientes a <strong>la</strong>s cuencas<br />
Huancané y Suches, no existen <strong>la</strong> información hidrométrica, pero dispone <strong>la</strong> información<br />
meteorológica consistente en precipitación máxima en 24 horas <strong>de</strong> <strong>la</strong>s estaciones ubicadas<br />
en el ámbito <strong>de</strong> <strong>la</strong>s cuencas <strong>de</strong> estudio. Por lo tanto según <strong>la</strong> información disponible, para<br />
<strong>la</strong> <strong>de</strong>terminación <strong>de</strong> caudales máximos instantáneos <strong>de</strong> los <strong>río</strong>s en estudio, se ha empleado<br />
el método <strong>de</strong>l Hidrograma Unitario Sintético <strong>de</strong>l Servicio <strong>de</strong> Conservación <strong>de</strong> Suelos<br />
(SCS), el método consiste en calcu<strong>la</strong>r <strong>la</strong>s <strong>de</strong>scargas máximas apartir <strong>de</strong> los datos <strong>de</strong> <strong>la</strong><br />
precipitación máxima en 24 horas y datos geomorfológcios <strong>de</strong> <strong>la</strong> cuenca.<br />
Las subcuencas <strong>de</strong> interés para el análisis <strong>de</strong> máximas avenidas, es <strong>la</strong> siguiente:<br />
- <strong>Cuenca</strong> Huancané: subcuencas L<strong>la</strong>che, Tuyto, Muñani, Pistune, Alto Huancané,<br />
Guanaco y Yaputira.<br />
- <strong>Cuenca</strong> Suches: subcuencas Chueña Huata Jahuira, Caylloma, Trapiche y Suches<br />
(Puente Ramón Castil<strong>la</strong>).<br />
11.2.2.1 Descripción <strong>de</strong>l método <strong>de</strong>l Hidrograma Unitario <strong>de</strong>l U.S. Soil Conservation<br />
Service (SCS)<br />
A.- Introducción<br />
El Método SCS (Soil Conservation Service) en 1982, fue <strong>de</strong>sarrol<strong>la</strong>do inicialmente para<br />
estimar avenidas e hidrogramas <strong>de</strong> avenidas <strong>de</strong> cuencas pequeñas; sin embargo, <strong>de</strong>sarrollos<br />
posteriores permiten aplicar a cuencas mayores, al incorporar los efectos <strong>de</strong>l<br />
almacenamiento <strong>de</strong>l cauce.<br />
El Método es utilizado para <strong>la</strong> estimación <strong>de</strong> <strong>la</strong> lluvia en exceso ocasionada por una<br />
tormenta, y es <strong>la</strong> consolidación <strong>de</strong> diversos procedimientos, se aplica principalmente en los<br />
estudios <strong>de</strong> máximas avenidas en cuencas sin aforos.<br />
En el Método SCS, se <strong>de</strong>nomina Complejo <strong>Hidrológico</strong> Suelo–Vegetación, a una<br />
combinación específica <strong>de</strong> suelo, uso <strong>de</strong>l terreno y su tratamiento, y se <strong>de</strong>signa con <strong>la</strong>s<br />
letras CN.<br />
El valor <strong>de</strong> CN es un parámetro hidrológico <strong>de</strong> una cuenca o zona <strong>de</strong>terminada e indica el<br />
potencial para generar escurrimiento cuando los suelos no están conge<strong>la</strong>dos, <strong>de</strong> manera que<br />
un alto valor <strong>de</strong> CN (se obtiene <strong>de</strong> <strong>la</strong>s tab<strong>la</strong>s) produciría gran escurrimiento y viceversa.<br />
B.- Definición <strong>de</strong> parámetros <strong>de</strong>l hidrograma unitario - método SCS<br />
Básicamente el método consiste en estimar un hidrograma unitario triangu<strong>la</strong>r a partir <strong>de</strong> <strong>la</strong>s<br />
características físicas <strong>de</strong> <strong>la</strong> cuenca y el perfil <strong>de</strong> precipitación para una duración<br />
<strong>de</strong>terminada, <strong>la</strong>s cuales convolucionan para producir un hidrograma compuesto <strong>de</strong> <strong>la</strong><br />
avenida.<br />
A continuación se muestra <strong>la</strong> geometría <strong>de</strong>l hidrograma unitario triangu<strong>la</strong>r.<br />
MINAG-ANA-DCPRH-AGUAS SUPERFICIALES Pág.334
<strong>Estudio</strong> <strong>Hidrológico</strong> <strong>de</strong> <strong>la</strong>s <strong>Cuenca</strong>s Huancané y Suches 2010<br />
Figura Nº 11.3 Hidrograma unitario triangu<strong>la</strong>r <strong>de</strong>l Soil Conservation Service (SCS).<br />
Don<strong>de</strong>:<br />
T R = Tiempo <strong>de</strong> retardo entre el centro <strong>de</strong> <strong>la</strong> precipitación efectiva y el<br />
caudal pico <strong>de</strong>l hidrograma (horas).<br />
D = Duración <strong>de</strong>l incremento unitario <strong>de</strong> precipitación efectiva (horas).<br />
T P = Tiempo pico <strong>de</strong>l hidrograma (horas).<br />
T = Tiempo base <strong>de</strong>l hidrograma (horas).<br />
b<br />
Q P = Caudal pico <strong>de</strong>l hidrograma unitario (m 3 /s.mm).<br />
Las re<strong>la</strong>ciones básicas <strong>de</strong>l hidrograma unitario triangu<strong>la</strong>r, para el cálculo <strong>de</strong>l caudal pico<br />
<strong>de</strong>l hidrograma unitario para una lámina unitaria <strong>de</strong> precipitación <strong>de</strong> 1 mm, es <strong>la</strong> siguiente:<br />
T<br />
C<br />
R<br />
L<br />
<br />
0.<br />
80<br />
T 0.<br />
60T<br />
D 0.<br />
40T<br />
1000<br />
<br />
9<br />
CN <br />
8.<br />
34 S<br />
C<br />
R<br />
m<br />
D<br />
TP TR<br />
3D<br />
2<br />
T 2.<br />
67T<br />
b<br />
+<br />
D<br />
TP<br />
TR<br />
P<br />
1.<br />
67<br />
Tb<br />
MINAG-ANA-DCPRH-AGUAS SUPERFICIALES Pág.335<br />
QP
<strong>Estudio</strong> <strong>Hidrológico</strong> <strong>de</strong> <strong>la</strong>s <strong>Cuenca</strong>s Huancané y Suches 2010<br />
Q<br />
P<br />
0.<br />
208 Pe A<br />
<br />
T<br />
P<br />
Don<strong>de</strong>:<br />
T = Tiempo <strong>de</strong> concentración (horas).<br />
C<br />
T R = Tiempo <strong>de</strong> retardo (horas).<br />
L = Longitud <strong>de</strong>l cauce principal (km).<br />
S m = Pendiente media <strong>de</strong>l cauce principal (%).<br />
CN = Número <strong>de</strong> curva <strong>de</strong>l SCS.<br />
D = Duración <strong>de</strong>l incremento unitario <strong>de</strong> precipitación efectiva (horas).<br />
T P = Tiempo pico <strong>de</strong>l hidrograma (horas).<br />
T = Tiempo base <strong>de</strong>l hidrograma (horas).<br />
b<br />
A = Área <strong>de</strong> <strong>la</strong> cuenca (km 2 ).<br />
Q P = Caudal pico <strong>de</strong>l hidrograma (m 3 /s).<br />
P = Precipitación efectiva o escorrentía directa (mm).<br />
e<br />
La estimación <strong>de</strong> CN es un paso importante <strong>de</strong>l método, por su influencia sobre el<br />
resultado final. Su valor se obtiene a partir <strong>de</strong> <strong>la</strong>s tab<strong>la</strong>s e<strong>la</strong>boradas por el US – SCS o por<br />
calibración.<br />
Es aconsejable, cuando se cuenta con información suficiente, estimar dicho valor a partir<br />
<strong>de</strong> una calibración, partiendo <strong>de</strong> una precipitación efectiva para <strong>de</strong>terminado pe<strong>río</strong>do <strong>de</strong><br />
retorno y comparando el resultado con el valor <strong>de</strong> <strong>la</strong> avenida calcu<strong>la</strong>da por el anáilsis <strong>de</strong><br />
frecuencias para el mismo pe<strong>río</strong>do.<br />
En general, el caudal pico calcu<strong>la</strong>do por el Método SCS correspon<strong>de</strong> al pe<strong>río</strong>do <strong>de</strong> retorno<br />
<strong>de</strong> <strong>la</strong> precipitción utilizada para su aplicación. De esta manera pue<strong>de</strong>n calcu<strong>la</strong>rse avenidas<br />
para diferentes pe<strong>río</strong>dos <strong>de</strong> retorno.<br />
La precipitación utilizada en el método es aquel<strong>la</strong> con duración <strong>de</strong> 24 horas, dato obtenible<br />
con un simple pluviómetro.<br />
En el análisis <strong>de</strong> máximas avenidas con el método <strong>de</strong>l Hidrograma Unitario Sintético <strong>de</strong>l<br />
SCS, se utilizan dos tipos <strong>de</strong> perfiles <strong>de</strong> precipitación <strong>de</strong> 24 horas (Figura N° 11.5), <strong>la</strong> <strong>de</strong><br />
Tipo I correspon<strong>de</strong> a tormentas frontales y <strong>la</strong> <strong>de</strong> Tipo II a tormentas convectivas, el<br />
segundo que son más intensas y que mejor se adaptaría al tipo <strong>de</strong> precipitación en <strong>la</strong>s<br />
subcuencas <strong>de</strong> <strong>la</strong>s cuencas Huancané, Suches y al contexto regional.<br />
Para obtener el perfil real <strong>de</strong> <strong>la</strong> tormenta en cualquier punto basta multiplicar <strong>la</strong><br />
precipitación total <strong>de</strong> 24 horas por <strong>la</strong>s or<strong>de</strong>nadas <strong>de</strong>l perfil seleccionado.<br />
El Método SCS asume que <strong>la</strong> escorrentía es producida por <strong>la</strong> precipitación efectiva, vale<br />
<strong>de</strong>cir, luego <strong>de</strong> <strong>de</strong>scontar <strong>la</strong>s pérdidas por abstracción inicial I a y por <strong>la</strong>s pérdidas<br />
continuas F durante el resto <strong>de</strong> <strong>la</strong> tormenta, tal como se muestra en <strong>la</strong> figura siguiente.<br />
MINAG-ANA-DCPRH-AGUAS SUPERFICIALES Pág.336
<strong>Estudio</strong> <strong>Hidrológico</strong> <strong>de</strong> <strong>la</strong>s <strong>Cuenca</strong>s Huancané y Suches 2010<br />
Figura Nº 11.4 Variables <strong>de</strong>l método SCS para abstracciones.<br />
La escorrentía se inicia cuando <strong>la</strong> precipitación exce<strong>de</strong> a I a , asumiéndose que <strong>la</strong><br />
I a<br />
5.<br />
08 S mm.<br />
La escorrentía directa en mm, está dada por <strong>la</strong> siguiente expresión:<br />
Pe<br />
i<br />
5080 <br />
Pi<br />
50.<br />
8<br />
CN<br />
<br />
<br />
20320 <br />
Pi<br />
203.<br />
2<br />
CN <br />
2<br />
Don<strong>de</strong>:<br />
Pe = Precipitación efectiva o escorrentía directa en el pe<strong>río</strong>do i (mm).<br />
i<br />
P i = Precipitación acumu<strong>la</strong>da en el pe<strong>río</strong>do i (mm).<br />
CN = Número <strong>de</strong> curva o curva estándar.<br />
El incremento <strong>de</strong> escorrentía en el pe<strong>río</strong>do i será entonces:<br />
D Pe<br />
i Pei<br />
Pei1<br />
El caudal pico <strong>de</strong>l hidrograma que comienza en el pe<strong>río</strong>do i será igual a:<br />
Don<strong>de</strong>:<br />
Q<br />
Pi<br />
0.<br />
208 DPe<br />
<br />
T<br />
P<br />
Q pi = Caudal pico <strong>de</strong>l hidrograma (m 3 /s).<br />
i<br />
A<br />
D Pei<br />
= Incremento <strong>de</strong>l volumen <strong>de</strong> escorrentía directa entre pe<strong>río</strong>dos<br />
sucesivos, como consecuencia <strong>de</strong> <strong>la</strong> precipitación efectiva (mm).<br />
A = Área <strong>de</strong> <strong>la</strong> cuenca (km 2 ).<br />
P<br />
D<br />
Ia<br />
T = Tiempo pico <strong>de</strong>l hidrograma (horas).<br />
MINAG-ANA-DCPRH-AGUAS SUPERFICIALES Pág.337<br />
F<br />
Precipitación<br />
Efectiva
<strong>Estudio</strong> <strong>Hidrológico</strong> <strong>de</strong> <strong>la</strong>s <strong>Cuenca</strong>s Huancané y Suches 2010<br />
PORCENTAJE ACUMULADO DE LLUVIA DESDE<br />
INICIO DE LA TORMENTA (%)<br />
100<br />
90<br />
80<br />
70<br />
60<br />
50<br />
40<br />
30<br />
20<br />
10<br />
0<br />
Figura Nº 11.5 Perfiles <strong>de</strong> lluvia para 24 horas<br />
Perfil Tipo I: Tormenta Frontal<br />
0 2 4 6 8 10 12 14 16 18 20 22 24<br />
TIEMPO EN HORAS<br />
Perfil Tipo II: Tormenta Convectiva<br />
Fuente: Programa <strong>de</strong>l método SCS (Soil Conservation Service).<br />
11.2.2.2 Determinación <strong>de</strong> máximas avenidas<br />
Para <strong>la</strong> <strong>de</strong>terminación <strong>de</strong> máximas avenidas instantáneas <strong>de</strong> diseño en <strong>la</strong>s subcuencas <strong>de</strong><br />
interés, se ha utilizado el Método <strong>de</strong>l Hidrograma Unitario Sintético <strong>de</strong>l U.S. Soil<br />
Conservation Service (SCS), anteriormente expuesto.<br />
La aplicación <strong>de</strong>l Método SCS requiere <strong>de</strong> los siguientes pasos:<br />
- Análisis <strong>de</strong> frecuencia <strong>de</strong> <strong>la</strong> precipitación máxima en 24 horas.<br />
- Elección <strong>de</strong>l valor <strong>de</strong> <strong>la</strong> Curva Número CN.<br />
- Cálculo <strong>de</strong> <strong>la</strong>s avenidas y los hidrogramas <strong>de</strong> diseño para diversos pe<strong>río</strong>dos<br />
<strong>de</strong> retorno.<br />
A.- Análisis <strong>de</strong> frecuencia <strong>de</strong> <strong>la</strong> precipitación máxima en 24 horas<br />
Para el análisis <strong>de</strong> frecuencia <strong>de</strong> <strong>la</strong> precipitación máxima en 24 horas, se ha utilizado <strong>la</strong><br />
información <strong>de</strong> <strong>la</strong>s estaciones meteorológicas que influyen el área <strong>de</strong> <strong>la</strong>s subcuencas <strong>de</strong><br />
interés en el ámbito <strong>de</strong> <strong>la</strong>s cuencas Huancané y Suches. El registro mensual <strong>de</strong> <strong>la</strong>s<br />
precipitaciones máximas, se ha completado con <strong>la</strong> misma metodología que <strong>de</strong> <strong>la</strong>s<br />
preciptaciones totales mensuales y grupos <strong>de</strong> estaciones correspondientes, <strong>la</strong> información<br />
completada y extendida se muestra en el Anexo 1. El registro <strong>de</strong> <strong>la</strong> serie anual <strong>de</strong> <strong>la</strong>s<br />
precipitaciones máximas en 24 horas se muestran en el Cuadro N° 11.6.<br />
MINAG-ANA-DCPRH-AGUAS SUPERFICIALES Pág.338
<strong>Estudio</strong> <strong>Hidrológico</strong> <strong>de</strong> <strong>la</strong>s <strong>Cuenca</strong>s Huancané y Suches 2010<br />
Año<br />
Cuadro Nº 11.6 Serie anual <strong>de</strong> precipitaciones máximas en 24 horas (mm)<br />
Estaciones meteorológicas <strong>de</strong> <strong>la</strong>s cuencas Huancané, Suches y cuencas vecinas<br />
Huancané<br />
Putina<br />
Muñani<br />
Estación Meteorológica<br />
Huaraya Moho<br />
1956 56.1 32.0 37.0 68.3 45.8 21.9 20.8 41.4<br />
1957 32.9 40.0 20.5 50.0 22.3 21.1 20.0 41.9<br />
1958 47.2 32.8 51.8 74.0 19.0 29.5 15.9 25.0<br />
1959 33.2 40.0 33.2 45.7 20.0 18.0 18.2 42.0<br />
1960 27.2 32.0 37.5 42.1 27.5 21.9 30.5 20.8<br />
1961 40.8 48.0 24.8 40.0 39.7 23.6 17.9 35.5<br />
1962 34.0 20.0 27.3 59.8 25.0 25.3 15.8 56.3<br />
1963 68.1 32.0 25.5 45.5 62.0 27.6 22.2 31.0<br />
1964 48.0 18.0 44.2 43.6 44.1 36.6 23.0 31.5<br />
1965 35.0 28.9 30.3 58.3 23.7 36.2 15.0 31.8<br />
1966 49.0 36.7 35.1 56.2 38.0 17.8 18.0 18.9<br />
1967 54.2 31.0 45.4 46.0 27.9 22.5 29.4 22.0<br />
1968 35.4 35.0 27.3 40.0 26.4 25.1 22.0 38.0<br />
1969 31.2 43.0 26.2 41.2 22.3 24.0 17.9 30.2<br />
1970 47.5 39.8 35.2 31.3 33.5 16.9 14.7 35.2<br />
1971 44.0 43.8 31.0 42.5 37.3 28.1 16.1 54.3<br />
1972 35.0 30.0 17.2 45.0 48.4 21.0 16.2 36.1<br />
1973 39.5 43.4 24.2 36.5 22.0 24.9 22.6 72.9<br />
1974 39.0 30.9 23.2 55.4 25.0 55.5 14.0 41.9<br />
1975 36.0 16.7 18.8 31.7 34.6 19.3 15.4 25.7<br />
1976 21.0 28.4 16.7 50.5 23.0 21.1 14.6 45.2<br />
1977 34.1 43.2 30.4 42.2 37.0 22.9 18.3 34.4<br />
1978 45.2 32.7 41.8 55.4 33.4 27.8 15.6 43.2<br />
1979 36.8 35.7 52.2 54.7 24.8 28.0 16.8 54.2<br />
1980 32.4 26.6 25.8 31.6 29.6 18.7 16.5 45.4<br />
1981 42.2 52.2 46.7 42.6 35.0 22.5 14.6 46.7<br />
1982 38.2 38.3 27.5 39.0 33.1 24.6 24.5 37.8<br />
1983 21.2 32.0 17.6 26.6 34.0 22.3 12.2 39.3<br />
1984 46.6 33.4 40.4 62.0 33.6 29.0 26.7 36.0<br />
1985 42.2 36.3 23.6 51.6 68.9 72.8 19.1 51.1<br />
1986 39.4 30.2 27.6 37.8 31.0 28.7 19.3 51.0<br />
1987 58.0 33.2 24.3 38.0 35.1 21.7 14.0 39.1<br />
1988 52.4 25.8 27.7 63.2 38.6 22.7 11.6 37.4<br />
1989 35.2 21.2 26.6 31.4 24.8 16.2 16.0 45.2<br />
1990 23.8 26.7 31.0 26.4 25.0 26.6 15.2 45.0<br />
1991 58.0 33.0 28.3 45.2 26.7 27.1 17.3 38.7<br />
1992 48.5 26.0 31.0 51.0 55.5 35.3 13.5 70.7<br />
1993 34.2 36.4 20.8 45.3 20.7 22.2 12.1 24.0<br />
1994 68.7 28.0 24.5 41.5 34.0 42.7 18.6 52.3<br />
1995 35.0 48.9 26.0 33.4 27.5 16.5 18.2 37.5<br />
1996 51.6 46.1 29.2 38.7 20.2 32.5 22.4 30.1<br />
1997 35.6 46.5 38.2 48.7 45.4 26.8 16.2 35.0<br />
1998 54.5 44.5 21.8 34.5 22.1 44.8 36.0 34.8<br />
1999 45.0 31.6 30.2 50.5 32.5 25.9 19.2 71.3<br />
2000 28.4 37.7 20.7 39.5 21.6 21.5 25.2 18.5<br />
2001 29.7 36.5 32.7 62.0 28.1 29.8 23.6 31.7<br />
2002 32.0 29.0 20.4 43.8 34.4 22.1 23.8 37.8<br />
2003 39.2 43.5 29.6 74.3 61.1 28.0 36.9 39.4<br />
2004 35.9 37.9 32.2 52.4 30.6 20.3 31.0 21.7<br />
2005 26.4 26.2 30.1 35.8 19.2 23.6 21.4 17.6<br />
2006 31.6 29.8 29.2 34.8 40.9 55.8 31.5 22.4<br />
2007 34.6 20.4 22.2 28.5 29.6 19.2 33.1 22.0<br />
<strong>2008</strong> 43.9 30.8 33.4 42.0 22.6 19.1 22.4 23.7<br />
2009 25.3 24.9 20.0 38.6 25.0 27.1 23.0 26.4<br />
Nº datos 54 54 54 54 54 54 54 54<br />
Prom 40.0 33.8 29.6 45.3 32.4 27.1 20.1 37.8<br />
Desvest 10.8 8.1 8.4 11.3 11.2 10.5 6.1 12.9<br />
Máx 68.7 52.2 52.2 74.3 68.9 72.8 36.9 72.9<br />
Mín 21.0 16.7 16.7 26.4 19.0 16.2 11.6 17.6<br />
MINAG-ANA-DCPRH-AGUAS SUPERFICIALES Pág.339<br />
Cojata<br />
Suches<br />
Ananea<br />
Crucero
Precipitación (mm)<br />
Precipitación (mm)<br />
Precipitación (mm)<br />
Precipitación (mm)<br />
<strong>Estudio</strong> <strong>Hidrológico</strong> <strong>de</strong> <strong>la</strong>s <strong>Cuenca</strong>s Huancané y Suches 2010<br />
80.0<br />
70.0<br />
60.0<br />
50.0<br />
40.0<br />
30.0<br />
20.0<br />
10.0<br />
0.0<br />
60.0<br />
50.0<br />
40.0<br />
30.0<br />
20.0<br />
10.0<br />
0.0<br />
80.0<br />
70.0<br />
60.0<br />
50.0<br />
40.0<br />
30.0<br />
20.0<br />
10.0<br />
0.0<br />
40.0<br />
35.0<br />
30.0<br />
25.0<br />
20.0<br />
15.0<br />
10.0<br />
5.0<br />
0.0<br />
Figura Nº 11.6 Hidrograma <strong>de</strong> serie anual <strong>de</strong> precipitaciones máximas en 24 Horas<br />
Estaciones meteorológicas <strong>de</strong> <strong>la</strong>s cuencas Huancané, Suches y cuencas vecinas<br />
Estación Huancané<br />
1955 1960 1965 1970 1975 1980 1985 1990 1995 2000 2005 2010<br />
Tiempo (año)<br />
Estación Muñani<br />
1955 1960 1965 1970 1975 1980 1985 1990 1995 2000 2005 2010<br />
Tiempo (año)<br />
Estación Cojata<br />
1955 1960 1965 1970 1975 1980 1985 1990 1995 2000 2005 2010<br />
Tiempo (año)<br />
Estación Ananea<br />
1955 1960 1965 1970 1975 1980 1985 1990 1995 2000 2005 2010<br />
Tiempo (año)<br />
MINAG-ANA-DCPRH-AGUAS SUPERFICIALES Pág.340<br />
Precipitación (mm)<br />
Precipitación (mm)<br />
Precipitación (mm)<br />
Precipitación (mm)<br />
60.0<br />
50.0<br />
40.0<br />
30.0<br />
20.0<br />
10.0<br />
0.0<br />
80.0<br />
70.0<br />
60.0<br />
50.0<br />
40.0<br />
30.0<br />
20.0<br />
10.0<br />
0.0<br />
80.0<br />
70.0<br />
60.0<br />
50.0<br />
40.0<br />
30.0<br />
20.0<br />
10.0<br />
0.0<br />
80.0<br />
70.0<br />
60.0<br />
50.0<br />
40.0<br />
30.0<br />
20.0<br />
10.0<br />
0.0<br />
Estación Putina<br />
1955 1960 1965 1970 1975 1980 1985 1990 1995 2000 2005 2010<br />
Tiempo (año)<br />
Estación Huaraya Moho<br />
1955 1960 1965 1970 1975 1980 1985 1990 1995 2000 2005 2010<br />
Tiempo (año)<br />
Estación Suches<br />
1955 1960 1965 1970 1975 1980 1985 1990 1995 2000 2005 2010<br />
Tiempo (año)<br />
Estación Crucero<br />
1955 1960 1965 1970 1975 1980 1985 1990 1995 2000 2005 2010<br />
Tiempo (año)<br />
Para el análisis <strong>de</strong> frecuencia <strong>de</strong> <strong>la</strong> precipitación máxima en 24 horas, se ha empleado el<br />
Software <strong>Hidrológico</strong> <strong>de</strong> Eventos Extremos FLFREQ, es un programa que permite calcu<strong>la</strong>r<br />
<strong>la</strong> precipitación máxima en 24 horas para diferentes pe<strong>río</strong>dos <strong>de</strong> retorno, consi<strong>de</strong>rando <strong>la</strong>s<br />
funciones <strong>de</strong> distribución <strong>de</strong> probabilida<strong>de</strong>s <strong>de</strong> LogNormal <strong>de</strong> 2 parámetros, LogNormal <strong>de</strong><br />
3 parámetros, Gumbel I y LogPearson III.<br />
Los cuadros <strong>de</strong> análisis <strong>de</strong> frecuencia <strong>de</strong> <strong>la</strong> precipitación máxima en 24 horas, para cada<br />
una <strong>de</strong> <strong>la</strong>s estaciones consi<strong>de</strong>radas en el presente estudio, se muestran en el Anexo 1.
<strong>Estudio</strong> <strong>Hidrológico</strong> <strong>de</strong> <strong>la</strong>s <strong>Cuenca</strong>s Huancané y Suches 2010<br />
Según el análisis <strong>de</strong> frecuencia, resulta que <strong>la</strong>s series anuales <strong>de</strong> precipitaciones máximas<br />
en 24 horas <strong>de</strong> <strong>la</strong>s estaciones Huancané, Putina, Muñani, Huaraya Moho, Cojata, Suches,<br />
Ananea y Crucero, se ajustan mejor a <strong>la</strong> distribución Gumbel (método <strong>de</strong> máxima<br />
verosimilitud), por mostrar menor porcentaje <strong>de</strong> error estándar que otras distribuciones<br />
teóricas.<br />
En el Cuadro Nº 11.7 se muestra <strong>la</strong>s precipitaciones máximas para diferentes pe<strong>río</strong>dos <strong>de</strong><br />
retorno <strong>de</strong> <strong>la</strong>s estaciones meteorológicas consi<strong>de</strong>radas en el presente estudio, asímismo en<br />
<strong>la</strong> Figura Nº 11.7 se muestra <strong>la</strong>s curvas <strong>de</strong> frecuencia <strong>de</strong> <strong>la</strong>s precipitaciones máximas en 24<br />
horas.<br />
Nº<br />
Precipitación (mm)<br />
Cuadro Nº 11.7 Precipitaciones máximas en 24 horas para diferentes periodos <strong>de</strong> retorno<br />
Estaciones <strong>de</strong> <strong>la</strong>s cuencas Huancané, Suches y cuencas vecinas<br />
(ajuste distribución Gumbel - Método <strong>de</strong> máxima verosimilitud)<br />
Estación<br />
Altitud<br />
(msnm)<br />
Pe<strong>río</strong>do <strong>de</strong> Retorno (año)<br />
5 10 20 50 100 200 500 1000 2000 5000 10000<br />
1 Huancané 3840 48.4 55.2 61.6 70.0 76.3 82.5 90.7 97.0 103.0 111.0 118.0<br />
2 Putina 3856 41.3 47.0 52.5 59.5 64.9 70.1 77.1 82.4 87.7 94.6 99.9<br />
3 Muñani 3948 35.5 40.4 45.1 51.1 55.7 60.2 66.2 70.7 75.2 81.1 85.7<br />
4 Huaraya Moho 3832 54.0 60.9 67.6 76.2 82.7 89.1 97.6 104.0 110.0 119.0 125.0<br />
5 Cojata 4327 39.1 44.8 50.3 57.4 62.8 68.1 75.1 80.4 85.7 92.7 98.0<br />
6 Suches 4655 32.0 36.4 40.6 46.0 50.1 54.2 59.6 63.6 67.7 73.1 77.1<br />
7 Ananea 4640 24.0 27.3 30.4 34.5 37.6 40.6 44.6 47.7 50.7 54.7 57.8<br />
8 Crucero 4130 47.5 55.4 62.9 72.7 80.0 87.3 96.9 104.0 111.0 121.0 128.0<br />
130.0<br />
120.0<br />
110.0<br />
100.0<br />
90.0<br />
80.0<br />
70.0<br />
60.0<br />
50.0<br />
40.0<br />
30.0<br />
20.0<br />
Figura Nº 11.7 Curva <strong>de</strong> frecuencia <strong>de</strong> <strong>la</strong>s precipitaciones máximas en 24 horas<br />
Estaciones <strong>de</strong> <strong>la</strong>s cuencas Huancané, Suches y cuencas vecinas<br />
(ajuste distribución Gumbel - Método <strong>de</strong> máxima verosimilitud)<br />
-1000 0 1000 2000 3000 4000 5000 6000 7000 8000 9000 10000 11000<br />
Pe<strong>río</strong>do <strong>de</strong> Retorno (año)<br />
Huancané Putina<br />
Muñani Huaraya Moho<br />
Cojata Suches<br />
Ananea Crucero<br />
MINAG-ANA-DCPRH-AGUAS SUPERFICIALES Pág.341
<strong>Estudio</strong> <strong>Hidrológico</strong> <strong>de</strong> <strong>la</strong>s <strong>Cuenca</strong>s Huancané y Suches 2010<br />
En base a <strong>la</strong> información <strong>de</strong>l análisis <strong>de</strong> frecuencia <strong>de</strong> precipitaciones máximas en 24 horas<br />
<strong>de</strong> <strong>la</strong>s estaciones consi<strong>de</strong>radas en el presente estudio, se ha calcu<strong>la</strong>do <strong>la</strong>s precipitaciones<br />
máximas <strong>de</strong> diseño para <strong>la</strong>s subcuencas <strong>de</strong> interés, mediante <strong>la</strong>s áreas <strong>de</strong> influyencia <strong>de</strong><br />
cada estación, empleando el método <strong>de</strong> Polígonos <strong>de</strong> Thiessen.<br />
En los Cuadros Nº 11.8 y 11.9 se muestran los coeficientes <strong>de</strong>l área <strong>de</strong> influencia <strong>de</strong> <strong>la</strong>s<br />
estaciones meteorológicas en <strong>la</strong>s subcuencas <strong>de</strong> <strong>la</strong>s cuencas Huancané y Suches.<br />
En los Cuadros Nº 11.10 y 11.11 se presentan <strong>la</strong>s precipitaciones máximas en 24 horas<br />
calcu<strong>la</strong>das para diferentes pe<strong>río</strong>dos <strong>de</strong> retorno para <strong>la</strong>s subcuencas <strong>de</strong> <strong>la</strong>s cuencas<br />
Huancané y Suches.<br />
Cuadro Nº 11.8 Coeficientes <strong>de</strong>l área <strong>de</strong> influencia <strong>de</strong> <strong>la</strong>s estaciones meteorológicas<br />
Subcuencas <strong>de</strong> <strong>la</strong> cuenca Huancané<br />
Subcuenca<br />
Huancané Putina Muñani<br />
L<strong>la</strong>che 0.12042 0.87958<br />
Estación Meteorológica<br />
Huaraya<br />
Moho<br />
Tuyto 0.32551 0.00617 0.26429 0.40403<br />
Cojata Suches Ananea Crucero<br />
Muñani 0.09351 0.80887 0.09762<br />
Pistune 0.15459 0.57030 0.26804 0.00707<br />
Alto Huancané 0.32843 0.04354 0.00528 0.62275<br />
Guanaco 0.59940 0.40060<br />
Yaputira 1.00000<br />
Cuadro Nº 11.9 Coeficientes <strong>de</strong>l área <strong>de</strong> influencia <strong>de</strong> <strong>la</strong>s estaciones meteorológicas<br />
Subcuencas <strong>de</strong> <strong>la</strong> cuenca Suches<br />
Subcuenca<br />
Huancané Putina Muñani<br />
Estación Meteorológica<br />
Huaraya<br />
Moho<br />
Chueña Huata Jahuira 1.00000<br />
Cojata Suches Ananea Crucero<br />
Caylloma 0.60293 0.12402 0.27304<br />
Trapiche 0.67964 0.32036<br />
Suches (Pte Ramón Castil<strong>la</strong>) 0.20152 0.60080 0.19768<br />
Cuadro Nº 11.10 Precipitaciones máximas en 24 horas (mm) - Subcuencas <strong>de</strong> <strong>la</strong> cuenca Huancané<br />
Subcuenca<br />
Pe<strong>río</strong>do <strong>de</strong> retorno (año)<br />
5 10 20 50 100 200 500 1000<br />
L<strong>la</strong>che 42.2 48.0 53.6 60.8 66.3 71.6 78.7 84.2<br />
Tuyto 46.1 52.5 58.6 66.5 72.5 78.3 86.1 92.1<br />
Muñani 37.2 42.5 47.5 54.0 58.9 63.8 70.2 75.0<br />
Pistune 41.7 47.5 53.2 60.4 65.9 71.3 78.4 83.9<br />
Alto Huancané 30.3 34.4 38.4 43.6 47.5 51.3 56.4 60.3<br />
Guanaco 40.3 46.4 52.2 59.8 65.4 71.1 78.5 84.0<br />
Yaputira 39.1 44.8 50.3 57.4 62.8 68.1 75.1 80.4<br />
MINAG-ANA-DCPRH-AGUAS SUPERFICIALES Pág.342
<strong>Estudio</strong> <strong>Hidrológico</strong> <strong>de</strong> <strong>la</strong>s <strong>Cuenca</strong>s Huancané y Suches 2010<br />
Cuadro Nº 11.11 Precipitaciones máximas en 24 horas (mm) - Subcuencas <strong>de</strong> <strong>la</strong> cuenca Suches<br />
Subcuenca<br />
5 10 20 50 100 200 500 1000<br />
Chueña Huata Jahuira 39.1 44.8 50.3 57.4 62.8 68.1 75.1 80.4<br />
Caylloma 34.1 39.0 43.7 49.7 54.3 58.9 64.8 69.4<br />
Trapiche 29.4 33.5 37.3 42.3 46.1 49.8 54.8 58.5<br />
Suches (Pte Ramón Castil<strong>la</strong>) 31.8 36.3 40.5 46.0 50.2 54.3 59.8 63.8<br />
B.- Elección <strong>de</strong>l valor <strong>de</strong> <strong>la</strong> curva número CN<br />
Pe<strong>río</strong>do <strong>de</strong> retorno (año)<br />
La elección <strong>de</strong> <strong>la</strong> curva número (CN), se obtiene <strong>de</strong>l grupo hidrológico <strong>de</strong> suelos, en base a<br />
<strong>la</strong>s características <strong>de</strong>l complejo suelo-vegetación <strong>de</strong> <strong>la</strong> cuenca y <strong>de</strong> <strong>la</strong> experiencia regional.<br />
Es preferible <strong>la</strong> estimación a partir <strong>de</strong> una calibración, cuando se dispone <strong>de</strong> registros <strong>de</strong><br />
máximas avenidas en alguna estación hidrométrica local o <strong>de</strong>l entorno regional.<br />
La CN a partir <strong>de</strong> <strong>la</strong>s tab<strong>la</strong>s <strong>de</strong>l Método SCS (al no ser posible <strong>la</strong> calibración por aforos,<br />
caso <strong>de</strong>l presente estudio) podría ser para los <strong>río</strong>s en estudio <strong>la</strong> condición II y grupo <strong>de</strong><br />
suelo hidrológico C a D, es <strong>de</strong>cir un valor <strong>de</strong> CN comprendido en un rango <strong>de</strong> 78 a 84.<br />
Las CN con valores igual o mayores a 80 correspon<strong>de</strong>rían en el Perú, a cuencas <strong>de</strong> <strong>la</strong>s<br />
regiones <strong>de</strong> sierra y costa (Aplicaciones <strong>de</strong> ELECTROPERU).<br />
Por <strong>la</strong>s características <strong>de</strong> <strong>la</strong>s subcuencas, pluviosidad, experiencias anteriores y el marco<br />
teórico, se optó para <strong>la</strong>s subcuencas en estudio, por un valor <strong>de</strong> CN = 80.<br />
C.- Avenidas e hidrogramas <strong>de</strong> diseño<br />
Para <strong>la</strong> <strong>de</strong>terminación <strong>de</strong> <strong>la</strong>s avenidas <strong>de</strong> diseño se ha aplicado el método <strong>de</strong>l Hidrograma<br />
Unitario Sintético <strong>de</strong>l Servicio <strong>de</strong> Conservación <strong>de</strong> Suelos (SCS). Para ello se ha utilizado<br />
<strong>la</strong>s precipitaciones máximas en 24 horas para diferentes pe<strong>río</strong>dos <strong>de</strong> retorno, presentados<br />
en los Cuadros Nº 11.10 y 11.11, y los parámetros geomorfológicos <strong>de</strong> <strong>la</strong>s subcuencas en<br />
estudio.<br />
<strong>Cuenca</strong> Huancané:<br />
Subcuenca <strong>río</strong> L<strong>la</strong>che: Area <strong>de</strong> <strong>la</strong> cuenca = 161.93 km 2<br />
Longitud <strong>de</strong>l cauce principal = 40.42 km<br />
Pendiente media <strong>de</strong>l cauce principal = 2.04 %<br />
Curva Número (CN) = 80.00<br />
Subcuenca <strong>río</strong> Tuyto: Area <strong>de</strong> <strong>la</strong> cuenca = 1107.11 km 2<br />
Longitud <strong>de</strong>l cauce principal = 94.17 km<br />
Pendiente media <strong>de</strong>l cauce principal = 0.50 %<br />
Curva Número (CN) = 80.00<br />
Subcuenca <strong>río</strong> Muñani: Area <strong>de</strong> <strong>la</strong> cuenca = 889.44 km 2<br />
Longitud <strong>de</strong>l cauce principal = 71.58 km<br />
Pendiente media <strong>de</strong>l cauce principal = 1.26 %<br />
Curva Número (CN) = 80.00<br />
MINAG-ANA-DCPRH-AGUAS SUPERFICIALES Pág.343
<strong>Estudio</strong> <strong>Hidrológico</strong> <strong>de</strong> <strong>la</strong>s <strong>Cuenca</strong>s Huancané y Suches 2010<br />
Subcuenca <strong>río</strong> Pistune: Area <strong>de</strong> <strong>la</strong> cuenca = 380.43 km 2<br />
Longitud <strong>de</strong>l cauce principal = 52.53 km<br />
Pendiente media <strong>de</strong>l cauce principal = 1.68 %<br />
Curva Número (CN) = 80.00<br />
Subcuenca Alto Huancané: Area <strong>de</strong> <strong>la</strong> cuenca = 524.77 km 2<br />
(<strong>río</strong> Puncune) Longitud <strong>de</strong>l cauce principal = 49.34 km<br />
Pendiente media <strong>de</strong>l cauce principal = 1.89 %<br />
Curva Número (CN) = 80.00<br />
Subcuenca <strong>río</strong> Guanaco: Area <strong>de</strong> <strong>la</strong> cuenca = 216.75 km 2<br />
(Vaso Cal<strong>la</strong>tomaza) Longitud <strong>de</strong>l cauce principal = 24.34 km<br />
Cota máxima <strong>de</strong>l <strong>río</strong> principal = 4760.00 msnm<br />
Cota mínima <strong>de</strong>l <strong>río</strong> principal = 4154.00 msnm<br />
Pendiente media <strong>de</strong>l cauce principal = 2.49 %<br />
Curva Número (CN) = 80.00<br />
Subcuenca <strong>río</strong> Yaputira: Area <strong>de</strong> <strong>la</strong> cuenca = 228.24 km 2<br />
(Vaso Yaputira) Longitud <strong>de</strong>l cauce principal = 27.86 km<br />
Cota máxima <strong>de</strong>l <strong>río</strong> principal = 4300.00 msnm<br />
Cota mínima <strong>de</strong>l <strong>río</strong> principal = 3980.00 msnm<br />
Pendiente media <strong>de</strong>l cauce principal = 1.15 %<br />
Curva Número (CN) = 80.00<br />
<strong>Cuenca</strong> Suches:<br />
Subcuenca <strong>río</strong> Chueña Area <strong>de</strong> <strong>la</strong> cuenca = 162.18 km 2<br />
Huata Jahuira: Longitud <strong>de</strong>l cauce principal = 36.76 km<br />
Pendiente media <strong>de</strong>l cauce principal = 1.03 %<br />
Curva Número (CN) = 80.00<br />
Subcuenca <strong>río</strong> Caylloma: Area <strong>de</strong> <strong>la</strong> cuenca = 289.22 km 2<br />
Longitud <strong>de</strong>l cauce principal = 40.24 km<br />
Pendiente media <strong>de</strong>l cauce principal = 1.26 %<br />
Curva Número (CN) = 80.00<br />
Subcuenca <strong>río</strong> Trapiche: Area <strong>de</strong> <strong>la</strong> cuenca = 405.45 km 2<br />
Longitud <strong>de</strong>l cauce principal = 38.63 km<br />
Pendiente media <strong>de</strong>l cauce principal = 1.64 %<br />
Curva Número (CN) = 80.00<br />
<strong>Cuenca</strong> <strong>río</strong> Suches: Area <strong>de</strong> <strong>la</strong> cuenca = 1056.49 km 2<br />
(Pte. Ramón Castil<strong>la</strong>) Longitud <strong>de</strong>l cauce principal = 55.77 km<br />
Pendiente media <strong>de</strong>l cauce principal = 1.24 %<br />
Curva Número (CN) = 80.00<br />
Con <strong>la</strong> información establecida, se calcu<strong>la</strong>n <strong>la</strong>s máximas avenidas <strong>de</strong> diseño para diferentes<br />
pe<strong>río</strong>dos <strong>de</strong> retorno, para <strong>la</strong>s subcuencas en estudio. En el Cuadro Nº 11.12 se muestra el<br />
resultado <strong>de</strong> cálculo <strong>de</strong> caudales máximos instantáneos para el <strong>río</strong> L<strong>la</strong>che, para el pe<strong>río</strong>do<br />
<strong>de</strong> retorno <strong>de</strong> 50 años; para otros pe<strong>río</strong>dos <strong>de</strong> retorno y subcuencas se muestran en el<br />
Anexo 1.<br />
MINAG-ANA-DCPRH-AGUAS SUPERFICIALES Pág.344
<strong>Estudio</strong> <strong>Hidrológico</strong> <strong>de</strong> <strong>la</strong>s <strong>Cuenca</strong>s Huancané y Suches 2010<br />
Cuadro Nº 11.12 Análisis <strong>de</strong> Máximas Avenidas – Subcuenca <strong>río</strong> L<strong>la</strong>che<br />
Método SCS<br />
------------------------------------------------------------------------------------------------------------------------<br />
NOMBRE DE LA CUENCA *RIO LLACHE*<br />
------------------------------------------------------------------------------------------------------------------------<br />
DURACION LLUVIA = 3.15 HRS TIEMPO PICO = 9.45 HRS TIEMPO BASE = 25.22 HRS<br />
LONGITUD = 40.42 KMS AREA CUENCA = 161.93 KM2 COEFICI. CN = 80.00<br />
PRECIPITACION = 60.80 MM ABS.INICIAL = 12.70 MM PER.RETORNO = 50.00 AÑOS<br />
PENDIENTE = 2.04 O/O<br />
------------------------------------------------------------------------------------------------------------------------<br />
TIEMPO DESDE TIEMPO DESDE PRECIPITACION ESCORRENTIA INCREMENTO CAUDAL PICO<br />
INICIO DE LA INICIO DE LA ACUMULADA ACUMULADA DE DEL<br />
TORMENTA ESCORRENTIA ESCORRENTIA HIDROGRAMA<br />
(HORAS) (HORAS) O/O MM (MM) (MM) M3/SEG<br />
------------ ------------ ------------------- ----------- ----------- ------------<br />
10.58 .00 20.89 12.7 .00 .00 .00<br />
13.72 3.15 80.82 49.1 13.29 13.29 47.38<br />
16.87 6.30 89.92 54.7 16.70 3.42 12.18<br />
20.02 9.45 95.22 57.9 18.79 2.09 7.44<br />
23.17 12.59 99.11 60.3 20.36 1.57 5.61<br />
24.00 15.74 100.00 60.8 20.73 .37 1.31<br />
------------ ------------ ------------------- ----------- ----------- ------------<br />
HIDROGRAMAS INCREMENTALES PARA SIGUIENTES TIEMPOS DESDE EL INICIO DE LA ESCORRENTIA<br />
-----------------------------------------------------------------------------------------------------------------------<br />
TIEMPO DE INICIO DE LA ESCORRENTIA<br />
-----------------------------------------------------------------------------------------------------------------------<br />
.0 3.1 6.3 9.4 12.6 15.7 18.9 22.0 25.2 28.3 31.5 34.6 37.8 40.9<br />
-----------------------------------------------------------------------------------------------------------------------<br />
.0 .0 .0 .0 .0 .0 .0 .0 .0<br />
.0 15.6 31.7 47.4 37.9 28.4 19.0 9.5 .0<br />
.0 4.0 8.2 12.2 9.7 7.3 4.9 2.4 .0<br />
.0 2.5 5.0 7.4 6.0 4.5 3.0 1.5 .0<br />
.0 1.9 3.8 5.6 4.5 3.4 2.2 1.1 .0<br />
.0 .4 .9 1.3 1.0 .8 .5 .3 .0<br />
-----------------------------------------------------------------------------------------------------------------------<br />
.0 .0 15.6 35.8 58.0 56.9 49.8 38.7 24.6 9.8 4.5 1.6 .3 .0<br />
-----------------------------------------------------------------------------------------------------------------------<br />
En forma simi<strong>la</strong>r se calcu<strong>la</strong> para otros pe<strong>río</strong>dos <strong>de</strong> retorno y para cada subcuenca en<br />
estudio. A continuación se tiene el resumen <strong>de</strong>l resultado <strong>de</strong> <strong>la</strong>s máximas avenidas <strong>de</strong><br />
diseño y sus respectivas hidrogramas para los <strong>río</strong>s en estudio, calcu<strong>la</strong>das para diferentes<br />
pe<strong>río</strong>dos <strong>de</strong> retorno, ver Cuadro Nº 11.13 y <strong>la</strong>s Figuras Nº 11.8 al 11.18.<br />
TR<br />
(año)<br />
L<strong>la</strong>che<br />
Tuyto<br />
Cuadro Nº 11.13 Caudales máximos instantáneos (m 3 /s)<br />
Subcuencas <strong>de</strong> <strong>la</strong>s cuencas Huancané y Suches<br />
Muñani<br />
<strong>Cuenca</strong> <strong>río</strong> Huancané <strong>Cuenca</strong> <strong>río</strong> Suches<br />
Pistune<br />
Alto Huancané (<strong>río</strong><br />
Puncune)<br />
Subcuenca<br />
5 26.4 70.6 62.0 48.6 29.4 44.1 30.7 18.1 22.6 22.7 54.9<br />
10 35.8 93.8 86.9 66.2 43.2 63.0 43.5 25.5 32.8 33.5 80.3<br />
20 45.3 117.5 112.7 84.5 58.6 81.3 56.3 32.9 43.7 45.5 106.9<br />
50 58.0 150.1 148.4 108.7 81.0 106.4 73.8 43.2 58.4 63.3 145.4<br />
100 67.9 176.0 176.7 127.7 98.7 127.6 87.5 51.3 70.4 77.8 176.4<br />
200 77.4 201.9 206.2 146.8 116.6 155.9 100.9 59.4 82.6 92.3 208.4<br />
500 91.5 237.7 245.9 172.0 141.6 195.0 119.7 70.2 98.8 112.8 252.7<br />
1000 103.5 265.9 276.4 191.5 161.3 216.4 135.1 78.5 111.7 128.2 286.2<br />
MINAG-ANA-DCPRH-AGUAS SUPERFICIALES Pág.345<br />
Guanaco<br />
Yaputira<br />
Chueña Huata<br />
Jahuira<br />
Caylloma<br />
Trapiche<br />
Suches (Pte.Ramón<br />
Castil<strong>la</strong>)
<strong>Estudio</strong> <strong>Hidrológico</strong> <strong>de</strong> <strong>la</strong>s <strong>Cuenca</strong>s Huancané y Suches 2010<br />
Caudal (m 3 /s)<br />
Caudal (m 3 /s)<br />
120<br />
100<br />
80<br />
60<br />
40<br />
20<br />
0<br />
300<br />
250<br />
200<br />
150<br />
100<br />
50<br />
0<br />
Figura Nº 11.8 Hidrogramas unitarios sintéticos - Método SCS<br />
Subcuenca <strong>río</strong> L<strong>la</strong>che<br />
0 5 10 15 20 25 30 35 40 45<br />
Tiempo <strong>de</strong> inicio <strong>de</strong> <strong>la</strong> escorrentía (horas)<br />
Figura Nº 11.9 Hidrogramas unitarios sintéticos - Método SCS<br />
Subcuenca <strong>río</strong> Tuyto<br />
Q 1000 = 103.5 m 3 /s<br />
Q 500 = 91.5 m 3 /s<br />
Q 200 = 77.4 m 3 /s<br />
Q 100 = 67.9 m 3 /s<br />
Q 50 = 58.0 m 3 /s<br />
Q 20 = 45.3 m 3 /s<br />
Q 10 = 35.8 m 3 /s<br />
Q 5 = 26.4 m 3 /s<br />
0 20 40 60 80 100 120 140<br />
Tiempo <strong>de</strong> inicio <strong>de</strong> <strong>la</strong> escorrentía (horas)<br />
Q 1000 = 265.9 m 3 /s<br />
Q 500 = 237.7 m 3 /s<br />
Q 200 = 201.9 m 3 /s<br />
Q 100 = 176.0 m 3 /s<br />
Q 50 = 150.1 m 3 /s<br />
Q 20 = 117.5 m 3 /s<br />
Q 10 = 93.8 m 3 /s<br />
Q 5 = 70.6 m 3 /s<br />
MINAG-ANA-DCPRH-AGUAS SUPERFICIALES Pág.346
<strong>Estudio</strong> <strong>Hidrológico</strong> <strong>de</strong> <strong>la</strong>s <strong>Cuenca</strong>s Huancané y Suches 2010<br />
Caudal (m 3 /s)<br />
Caudal (m 3 /s)<br />
300<br />
250<br />
200<br />
150<br />
100<br />
50<br />
0<br />
250<br />
200<br />
150<br />
100<br />
50<br />
0<br />
Figura Nº 11.10 Hidrogramas unitarios sintéticos - Método SCS<br />
Subcuenca <strong>río</strong> Muñani<br />
0 10 20 30 40 50 60 70 80<br />
Tiempo <strong>de</strong> inicio <strong>de</strong> <strong>la</strong> escorrentía (horas)<br />
Figura Nº 11.11 Hidrogramas unitarios sintéticos - Método SCS<br />
Subcuenca <strong>río</strong> Pistune<br />
Q 1000 = 276.4 m 3 /s<br />
Q 500 = 245.9 m 3 /s<br />
Q 200 = 206.2 m 3 /s<br />
Q 100 = 176.7 m 3 /s<br />
Q 50 = 148.4 m 3 /s<br />
Q 20 = 112.7 m 3 /s<br />
Q 10 = 86.9 m 3 /s<br />
Q 5 = 62.0 m 3 /s<br />
0 10 20 30 40 50 60<br />
Tiempo <strong>de</strong> inicio <strong>de</strong> <strong>la</strong> escorrentía (horas)<br />
Q 1000 = 191.5 m 3 /s<br />
Q 500 = 172.0 m 3 /s<br />
Q 200 = 146.8 m 3 /s<br />
Q 100 = 127.7 m 3 /s<br />
Q 50 = 108.7 m 3 /s<br />
Q 20 = 84.5 m 3 /s<br />
Q 10 = 66.2 m 3 /s<br />
Q 5 = 48.6 m 3 /s<br />
MINAG-ANA-DCPRH-AGUAS SUPERFICIALES Pág.347
<strong>Estudio</strong> <strong>Hidrológico</strong> <strong>de</strong> <strong>la</strong>s <strong>Cuenca</strong>s Huancané y Suches 2010<br />
Caudal (m 3 /s)<br />
Caudal (m 3 /s)<br />
180<br />
160<br />
140<br />
120<br />
100<br />
80<br />
60<br />
40<br />
20<br />
350<br />
300<br />
250<br />
200<br />
150<br />
100<br />
50<br />
0<br />
0<br />
Figura Nº 11.12 Hidrogramas unitarios sintéticos - Método SCS<br />
Subcuenca Alto Huancané (<strong>río</strong> Puncune)<br />
0 5 10 15 20 25 30 35 40 45 50<br />
Tiempo <strong>de</strong> inicio <strong>de</strong> <strong>la</strong> escorrentía (horas)<br />
Figura Nº 11.13 Hidrogramas unitarios sintéticos - Método SCS<br />
Subcuenca <strong>río</strong> Guanaco<br />
Q 1000 = 161.3 m 3 /s<br />
Q 500 = 141.6 m 3 /s<br />
Q 200 = 116.6 m 3 /s<br />
Q 100 = 98.7 m 3 /s<br />
Q 50 = 81.0 m 3 /s<br />
Q 20 = 58.6 m 3 /s<br />
Q 10 = 43.2 m 3 /s<br />
Q 5 = 29.4 m 3 /s<br />
0 5 10 15 20 25 30 35<br />
Tiempo <strong>de</strong> inicio <strong>de</strong> <strong>la</strong> escorrentía (horas)<br />
Q 10000 = 293.1 m 3 /s<br />
Q 1000 = 216.4 m 3 /s<br />
Q 500 = 195.0 m 3 /s<br />
Q 200 = 155.9 m 3 /s<br />
Q 100 = 127.6 m 3 /s<br />
Q 50 = 106.4 m 3 /s<br />
Q 20 = 81.3 m 3 /s<br />
Q 10 = 63.0 m 3 /s<br />
Q 5 = 44.1 m 3 /s<br />
MINAG-ANA-DCPRH-AGUAS SUPERFICIALES Pág.348
<strong>Estudio</strong> <strong>Hidrológico</strong> <strong>de</strong> <strong>la</strong>s <strong>Cuenca</strong>s Huancané y Suches 2010<br />
Caudal (m 3 /s)<br />
Caudal (m 3 /s)<br />
250<br />
200<br />
150<br />
100<br />
50<br />
0<br />
90<br />
80<br />
70<br />
60<br />
50<br />
40<br />
30<br />
20<br />
10<br />
0<br />
Figura Nº 11.14 Hidrogramas unitarios sintéticos - Método SCS<br />
Subcuenca <strong>río</strong> Yaputira<br />
0 10 20 30 40 50<br />
Tiempo <strong>de</strong> inicio <strong>de</strong> <strong>la</strong> escorrentía (horas)<br />
Figura Nº 11.15 Hidrogramas unitarios sintéticos - Método SCS<br />
Subcuenca <strong>río</strong> Chueña Huata Jahuira<br />
Q 10000 = 208.3 m 3 /s<br />
Q 1000 = 135.1 m 3 /s<br />
Q 500 = 119.7 m 3 /s<br />
Q 200 = 100.9 m 3 /s<br />
Q 100 = 87.5 m 3 /s<br />
Q 50 = 73.8 m 3 /s<br />
Q 20 = 56.3 m 3 /s<br />
Q 10 = 43.5 m 3 /s<br />
Q 5 = 30.7 m 3 /s<br />
0 10 20 30 40 50 60<br />
Tiempo <strong>de</strong> inicio <strong>de</strong> <strong>la</strong> escorrentía (horas)<br />
Q 1000 = 78.5 m 3 /s<br />
Q 500 = 70.2 m 3 /s<br />
Q 200 = 59.4 m 3 /s<br />
Q 100 = 51.3 m 3 /s<br />
Q 50 = 43.2 m 3 /s<br />
Q 20 = 32.9 m 3 /s<br />
Q 10 = 25.5 m 3 /s<br />
Q 5 = 18.1 m 3 /s<br />
MINAG-ANA-DCPRH-AGUAS SUPERFICIALES Pág.349
<strong>Estudio</strong> <strong>Hidrológico</strong> <strong>de</strong> <strong>la</strong>s <strong>Cuenca</strong>s Huancané y Suches 2010<br />
Caudal (m 3 /s)<br />
Caudal (m 3 /s)<br />
120<br />
100<br />
80<br />
60<br />
40<br />
20<br />
0<br />
140<br />
120<br />
100<br />
80<br />
60<br />
40<br />
20<br />
0<br />
Figura Nº 11.16 Hidrogramas unitarios sintéticos - Método SCS<br />
Subcuenca <strong>río</strong> Caylloma<br />
0 10 20 30 40 50 60<br />
Tiempo <strong>de</strong> inicio <strong>de</strong> <strong>la</strong> escorrentía (horas)<br />
Figura Nº 11.17 Hidrogramas unitarios sintéticos - Método SCS<br />
Subcuenca <strong>río</strong> Trapiche<br />
Q 1000 = 111.7 m 3 /s<br />
Q 500 = 98.8 m 3 /s<br />
Q 200 = 82.6 m 3 /s<br />
Q 100 = 70.4 m 3 /s<br />
Q 50 = 58.4 m 3 /s<br />
Q 20 = 43.7 m 3 /s<br />
Q 10 = 32.8 m 3 /s<br />
Q 5 = 22.6 m 3 /s<br />
0 5 10 15 20 25 30 35 40 45<br />
Tiempo <strong>de</strong> inicio <strong>de</strong> <strong>la</strong> escorrentía (horas)<br />
Q 1000 = 128.2 m 3 /s<br />
Q 500 = 112.8 m 3 /s<br />
Q 200 = 92.3 m 3 /s<br />
Q 100 = 77.8 m 3 /s<br />
Q 50 = 63.3 m 3 /s<br />
Q 20 = 45.5 m 3 /s<br />
Q 10 = 33.5 m 3 /s<br />
Q 5 = 22.7 m 3 /s<br />
MINAG-ANA-DCPRH-AGUAS SUPERFICIALES Pág.350
<strong>Estudio</strong> <strong>Hidrológico</strong> <strong>de</strong> <strong>la</strong>s <strong>Cuenca</strong>s Huancané y Suches 2010<br />
Caudal (m 3 /s)<br />
350<br />
300<br />
250<br />
200<br />
150<br />
100<br />
50<br />
0<br />
Figura Nº 11.18 Hidrogramas unitarios sintéticos - Método SCS<br />
<strong>Cuenca</strong> <strong>río</strong> Suches (Puente Ramón Castil<strong>la</strong>)<br />
0 10 20 30 40 50 60 70<br />
Tiempo <strong>de</strong> inicio <strong>de</strong> <strong>la</strong> escorrentía (horas)<br />
Q 1000 = 286.2 m 3 /s<br />
Q 500 = 252.7 m 3 /s<br />
Q 200 = 208.4 m 3 /s<br />
Q 100 = 176.4 m 3 /s<br />
Q 50 = 145.4 m 3 /s<br />
Q 20 = 106.9 m 3 /s<br />
Q 10 = 80.3 m 3 /s<br />
Q 5 = 54.9 m 3 /s<br />
MINAG-ANA-DCPRH-AGUAS SUPERFICIALES Pág.351
<strong>Estudio</strong> <strong>Hidrológico</strong> <strong>de</strong> <strong>la</strong>s <strong>Cuenca</strong>s Huancané y Suches 2010<br />
11.3 ANÁLISIS DE SEQUÍAS<br />
11.3.1 Generalida<strong>de</strong>s<br />
La sequía en una cuenca hidrográfica se comporta como un evento extremo mínimo, el<br />
cual se origina <strong>de</strong> <strong>la</strong> carencia <strong>de</strong> lluvias que provoca el déficit <strong>de</strong>l recurso hídrico en el<br />
abastecimiento <strong>de</strong> agua para <strong>la</strong>s p<strong>la</strong>ntas, animales, pob<strong>la</strong>ción, industrias, etc. Bajo este<br />
contexto, se consi<strong>de</strong>ra <strong>de</strong> suma importancia realizar en el presente estudio, el análisis <strong>de</strong><br />
sequía <strong>de</strong>terminando su magnitud, duración e intensidad <strong>de</strong> ocurrencia.<br />
Sequía<br />
En términos generales, <strong>la</strong> sequía es un fenómeno natural extremo re<strong>la</strong>cionado con el<br />
tiempo atmosférico, cuya característica es <strong>la</strong> disminución temporal notable <strong>de</strong> agua<br />
disponible, por <strong>de</strong>bajo <strong>de</strong> <strong>la</strong> cantidad normal en un pe<strong>río</strong>do <strong>de</strong>terminado y varía en el<br />
espacio y tiempo; afecta a extensas regiones por meses o años.<br />
La sequía difiere <strong>de</strong> <strong>la</strong> ari<strong>de</strong>z en que <strong>la</strong> sequía es temporal; <strong>la</strong> ari<strong>de</strong>z es una característica<br />
permanente <strong>de</strong> regiones con baja lluvia.<br />
La severidad <strong>de</strong> una sequía <strong>de</strong>pen<strong>de</strong> no so<strong>la</strong>mente <strong>de</strong>l grado <strong>de</strong> reducción <strong>de</strong> <strong>la</strong> lluvia, <strong>de</strong><br />
su duración o <strong>de</strong> su extensión geográfica, sino también <strong>de</strong> <strong>la</strong>s <strong>de</strong>mandas <strong>de</strong>l recurso hídrico<br />
para <strong>la</strong> permanencia <strong>de</strong> los sistemas naturales y para el <strong>de</strong>sarrollo <strong>de</strong> <strong>la</strong>s activida<strong>de</strong>s<br />
humanas, razón por <strong>la</strong> cual es posible expresar el grado <strong>de</strong> severidad <strong>de</strong> <strong>la</strong> sequía en<br />
términos <strong>de</strong> sus impactos sociales y económicos.<br />
Tipos <strong>de</strong> sequía<br />
Se distinguen diferentes tipos <strong>de</strong> sequía, los cuales son: meteorológica, hidrológica,<br />
agríco<strong>la</strong> y socioeconómica. De estos tipos <strong>de</strong> sequía, los dos primeros <strong>de</strong>scriben fenómenos<br />
físicos, mientras que el tercero <strong>de</strong>scribe el impacto <strong>de</strong> los dos primeros en <strong>la</strong> producción<br />
agríco<strong>la</strong>.<br />
Sequía meteorológica.- Des<strong>de</strong> el punto <strong>de</strong> vista meteorológico, <strong>la</strong> sequía pue<strong>de</strong> <strong>de</strong>finirse como una<br />
condición anormal y recurrente <strong>de</strong>l clima que ocurre en todas <strong>la</strong>s regiones climáticas <strong>de</strong> <strong>la</strong> tierra.<br />
Este fenómeno se caracteriza por una marcada reducción <strong>de</strong> <strong>la</strong> cantidad <strong>de</strong> precipitación que se<br />
presenta en una zona, y pue<strong>de</strong> producir serios <strong>de</strong>sba<strong>la</strong>nces hidrológicos. Describe una situación en <strong>la</strong><br />
cual hay una disminución en <strong>la</strong> caída <strong>de</strong> lluvias durante un pe<strong>río</strong>do específico por <strong>de</strong>bajo <strong>de</strong> una<br />
cantidad específica. Su <strong>de</strong>finición sólo compren<strong>de</strong> datos <strong>de</strong> precipitación.<br />
Sequía hidrológica.- En términos hidrológicos, <strong>la</strong> sequía ocurre cuando se presenta una<br />
precipitación menor a <strong>la</strong> media estacional en esca<strong>la</strong> regional, lo que se traduce en un nivel <strong>de</strong><br />
suministro anormal <strong>de</strong> los cursos <strong>de</strong> agua y <strong>de</strong> los reservorios <strong>de</strong> agua superficial o subterránea. Es<br />
<strong>de</strong>cir, existe una disminución <strong>de</strong> los recursos hídricos por <strong>de</strong>bajo <strong>de</strong> un nivel <strong>de</strong>terminado durante un<br />
pe<strong>río</strong>do <strong>de</strong> tiempo dado. Su <strong>de</strong>finición incorpora datos <strong>de</strong> disponibilidad y tasas <strong>de</strong> consumo basadas<br />
en el suministro normal <strong>de</strong>l sistema (uso doméstico, agríco<strong>la</strong>, industrial, etc).<br />
La sequía hidrológica pue<strong>de</strong> durar meses y años, <strong>de</strong>s<strong>de</strong> el inicio <strong>de</strong> <strong>la</strong> escasez pluviométrica o, si <strong>la</strong>s<br />
precipitaciones retornan en poco tiempo y no llega a manifestarse. Por tanto, <strong>la</strong> secuencia temporal<br />
<strong>de</strong> sequía es: meteorológica-agríco<strong>la</strong>- hidrológica.<br />
Sequía agríco<strong>la</strong>.- Por ser el primer sector económico que resulta afectado por <strong>la</strong> escasez <strong>de</strong><br />
precipitaciones, <strong>la</strong> agricultura adquiere una especial relevancia en re<strong>la</strong>ción con <strong>la</strong> sequía. Por tanto,<br />
<strong>la</strong> sequía agríco<strong>la</strong> se produce cuando no hay suficiente humedad en el suelo para permitir el<br />
<strong>de</strong>sarrollo <strong>de</strong> un <strong>de</strong>terminado cultivo en cualquiera <strong>de</strong> sus fases <strong>de</strong> crecimiento. Dado que <strong>la</strong><br />
MINAG-ANA-DCPRH-AGUAS SUPERFICIALES Pág.352
<strong>Estudio</strong> <strong>Hidrológico</strong> <strong>de</strong> <strong>la</strong>s <strong>Cuenca</strong>s Huancané y Suches 2010<br />
T<br />
I<br />
E<br />
M<br />
P<br />
O<br />
-<br />
D<br />
U<br />
R<br />
A<br />
C<br />
I<br />
Ó<br />
N<br />
cantidad <strong>de</strong> agua es diferente para cada tipo <strong>de</strong> cultivo, e incluso pue<strong>de</strong> variar a lo <strong>la</strong>rgo <strong>de</strong>l<br />
crecimiento <strong>de</strong> una misma p<strong>la</strong>nta, no es posible establecer umbrales <strong>de</strong> sequía agríco<strong>la</strong> válidos ni tan<br />
siquiera para una única área geográfica.<br />
Este tipo <strong>de</strong> sequía, por <strong>de</strong>pen<strong>de</strong>r no sólo <strong>de</strong> <strong>la</strong>s condiciones meteorológicas, sino también <strong>de</strong> <strong>la</strong>s<br />
características biológicas <strong>de</strong>l cultivo y <strong>la</strong>s propieda<strong>de</strong>s <strong>de</strong>l suelo, no es equivalente a <strong>la</strong> sequía<br />
meteorológica. Si los niveles <strong>de</strong> humedad en el subsuelo son suficientes para proporcionar agua a un<br />
<strong>de</strong>terminado tipo <strong>de</strong> cultivo durante el pe<strong>río</strong>do que dure <strong>la</strong> sequía meteorológica, no llegará a<br />
producirse una sequía agríco<strong>la</strong>.<br />
Sequía socioeconómica.- La sequía en el sector socio-económico ocurre cuando <strong>la</strong>s lluvias son<br />
insuficientes y tienen un efecto significativo sobre <strong>la</strong>s comunida<strong>de</strong>s y su economía (energía<br />
hidroeléctrica, suministro <strong>de</strong> agua potable, industria, etc).<br />
Los cuatro tipos <strong>de</strong> evento seco analizados reflejan un proceso <strong>de</strong> evolución <strong>de</strong> <strong>la</strong> sequía,<br />
<strong>de</strong>terminado tanto por <strong>la</strong> variabilidad natural <strong>de</strong>l clima, como por <strong>la</strong> duración <strong>de</strong>l evento, y<br />
por <strong>la</strong> interacción entre clima y sociedad, ver <strong>la</strong> siguiente figura.<br />
Figura Nº 11.19 Secuencia <strong>de</strong> evolución <strong>de</strong> los diversos tipos <strong>de</strong> sequía operacional<br />
Menor caudal <strong>río</strong>s<br />
Disminución nivel <strong>de</strong><br />
<strong>la</strong>gos, embalses…<br />
IMPACTO<br />
ECONÓMICO<br />
VARIABILIDAD NATURAL DEL CLIMA<br />
DÉFICIT<br />
PLUVIOMÉTRICO<br />
Reducción infiltración<br />
Menor recarga aguas<br />
subterráneas<br />
Déficit hídrico en<br />
suelos y subsuelos<br />
IMPACTO<br />
SOCIAL<br />
Incremento <strong>de</strong> temperatura<br />
Reducción <strong>de</strong> humedad<br />
Aumento <strong>de</strong> <strong>la</strong> inso<strong>la</strong>ción<br />
Disminución <strong>de</strong> <strong>la</strong> nubosidad<br />
Incremento<br />
evapotranspiración<br />
Déficit hídrico en <strong>la</strong><br />
vegetación<br />
Reducción <strong>de</strong> biomasa<br />
Pérdida <strong>de</strong> cosechas<br />
IMPACTO MEDIO<br />
AMBIENTAL<br />
Fuente: Investigaciones Geográficas, nº 26 (2001) pp. 59-80<br />
Instituto Universitario <strong>de</strong> Geografía<br />
Universidad <strong>de</strong> Alicante (Fuente: Basado en NDMC, 1995).<br />
Sequía<br />
Meteorológica<br />
Sequía<br />
Agríco<strong>la</strong><br />
Sequía<br />
Hidrológica<br />
Sequía<br />
Socioeconómica<br />
MINAG-ANA-DCPRH-AGUAS SUPERFICIALES Pág.353<br />
I<br />
N<br />
T<br />
E<br />
R<br />
A<br />
C<br />
C<br />
I<br />
Ó<br />
N<br />
C<br />
L<br />
I<br />
M<br />
A<br />
S<br />
O<br />
C<br />
I<br />
E<br />
D<br />
A<br />
D
<strong>Estudio</strong> <strong>Hidrológico</strong> <strong>de</strong> <strong>la</strong>s <strong>Cuenca</strong>s Huancané y Suches 2010<br />
11.3.2 Sequía meteorológica<br />
11.3.2.1 Información básica - Metodología <strong>de</strong> análisis<br />
A.- Información básica<br />
La información utilizada para el análisis <strong>de</strong> sequía meteorológica en el presente estudio, es<br />
<strong>la</strong> serie anual <strong>de</strong> <strong>la</strong> precipitación areal <strong>de</strong>l pe<strong>río</strong>do 1956-2009 calcu<strong>la</strong>das para <strong>la</strong>s cuencas<br />
Huancané y Suches. La información fueron presentados en el Capítulo V, ítem 5.5.<br />
B.- Método <strong>de</strong> análisis <strong>de</strong> sequía<br />
Para cuantificar <strong>la</strong> sequía se han <strong>de</strong>sarrol<strong>la</strong>do diferentes índices <strong>de</strong> sequía, cada uno con<br />
sus aciertos y <strong>de</strong>saciertos. Dos <strong>de</strong> los más comúnmente usados son el Índice <strong>de</strong> Severidad<br />
<strong>de</strong> <strong>la</strong> Sequía <strong>de</strong> Palmer (PDSI) y el Índice Estándar <strong>de</strong> Precipitación (IPE). Las condiciones<br />
<strong>de</strong> sequía son monitorizadas constantemente usando estos índices para proveer información<br />
actual sobre regiones afectadas por <strong>la</strong> sequía.<br />
En el presente estudio <strong>la</strong> sequía meteorológica en <strong>la</strong>s cuencas Huancané y Suches, se ha<br />
evaluado con el Índice <strong>de</strong> Precipitación Estandarizada, <strong>de</strong> acuerdo a <strong>la</strong> información<br />
disponible.<br />
b.1.- Índice <strong>de</strong> Precipitación Estandarizada (IPE)<br />
Internacionalmente muy conocido por <strong>la</strong>s sig<strong>la</strong>s en ingles SPI (Standard Precipitation<br />
In<strong>de</strong>x).<br />
El Índice <strong>de</strong> Precipitación Estandarizada (IPE) cuantifica <strong>la</strong>s condiciones <strong>de</strong> déficit o<br />
exceso <strong>de</strong> precipitación en un lugar, para un <strong>la</strong>pso <strong>de</strong>terminado <strong>de</strong> tiempo el cual varía,<br />
generalmente, entre 1 y 24 meses. Fue <strong>de</strong>sarrol<strong>la</strong>do por McKee y otros en 1993, con <strong>la</strong><br />
finalidad <strong>de</strong> mejorar <strong>la</strong> <strong>de</strong>tección <strong>de</strong>l inicio <strong>de</strong> <strong>la</strong>s sequías meteorológicas (<strong>de</strong>finición <strong>de</strong><br />
sequía en función <strong>de</strong> <strong>la</strong> precipitación, únicamente, sin consi<strong>de</strong>rar <strong>la</strong> temperatura ni <strong>la</strong>s<br />
variables <strong>de</strong>l suelo) y su posterior monitoreo.<br />
El índice estandarizado <strong>de</strong> precipitación pue<strong>de</strong> ser consi<strong>de</strong>rado como el número <strong>de</strong><br />
<strong>de</strong>sviaciones estándar que el valor <strong>de</strong> <strong>la</strong> precipitación <strong>de</strong> interés sería lejos <strong>de</strong> <strong>la</strong> media,<br />
para una distribución normal equivalente y <strong>la</strong> elección a<strong>de</strong>cuada <strong>de</strong> <strong>la</strong> distribución teórica<br />
preparado para los datos reales. En efecto, el método consiste en una transformación <strong>de</strong><br />
una distribución <strong>de</strong> frecuencia a otra <strong>de</strong> distribución <strong>de</strong> frecuencias, en este caso el<br />
ampliamente utilizado es <strong>la</strong> distribución normal o <strong>de</strong> Gauss, con media cero y <strong>de</strong>sviación<br />
estándar unitaria. Cuya ecuación <strong>de</strong> <strong>la</strong> estandarización se muestra a continuación.<br />
Z<br />
t<br />
X t X<br />
<br />
S<br />
Don<strong>de</strong>: Zt variable estandarizada, Xt variable pluviométrica, X media y S <strong>de</strong>sviación<br />
estándar.<br />
MINAG-ANA-DCPRH-AGUAS SUPERFICIALES Pág.354
<strong>Estudio</strong> <strong>Hidrológico</strong> <strong>de</strong> <strong>la</strong>s <strong>Cuenca</strong>s Huancané y Suches 2010<br />
Los valores negativos <strong>de</strong>l IPE, indican los años <strong>de</strong> déficit <strong>de</strong> precipitación, y estas son <strong>la</strong><br />
materia <strong>de</strong>l análisis <strong>de</strong> sequías.<br />
La sequía pue<strong>de</strong> c<strong>la</strong>sificarse según los índices <strong>de</strong>l IPE mostrados en <strong>la</strong> Tab<strong>la</strong> Nº 11.1.<br />
IPE<br />
Tab<strong>la</strong> Nº 11.1 C<strong>la</strong>sificación <strong>de</strong>l IPE<br />
-2.00 o menor Extremadamente Seco (sequía extrema) 1 en 50 años<br />
-1.50 a -1.99 Muy Seco (sequía severa) 1 en 20 años<br />
-1.00 a -1.49 Mo<strong>de</strong>radamente Seco (sequía mo<strong>de</strong>rada) 1 en 10 años<br />
-0.50 a -0.99 Ligeramente Seco<br />
0.49 a -0.49 Normal<br />
0.50 a 0.99 Ligeramente Húmedo<br />
Categorías<br />
1.00 a 1.49 Mo<strong>de</strong>radamente Húmedo (exceso mo<strong>de</strong>rado) 1 en 10 años<br />
1.50 a 1.99 Muy Húmedo (exceso severo) 1 en 20 años<br />
2.00 o mayor Extremadamente Húmedo (exceso extremo) 1 en 50 años<br />
b.2.- Ventajas y <strong>de</strong>sventajas <strong>de</strong>l IPE<br />
Ventajas:<br />
Frecuencia Teórica <strong>de</strong><br />
Ocurrencia<br />
1 en 3 años<br />
La primera es su simplicidad <strong>de</strong> cálculo, dado que está basado so<strong>la</strong>mente en <strong>la</strong><br />
precipitación.<br />
La segunda es que pue<strong>de</strong> ser calcu<strong>la</strong>do para esca<strong>la</strong>s <strong>de</strong> tiempo variables, lo cual lo hace<br />
aplicable en el ámbito <strong>de</strong> <strong>la</strong> meteorología, agricultura e hidrología superficial y subterránea.<br />
Esta versatilidad temporal es particu<strong>la</strong>rmente útil en el análisis <strong>de</strong> <strong>la</strong> dinámica <strong>de</strong> <strong>la</strong> sequía<br />
(al igual que <strong>la</strong> <strong>de</strong> los pe<strong>río</strong>dos con excesos hídricos), especialmente en <strong>la</strong> <strong>de</strong>terminación<br />
<strong>de</strong>l comienzo y el fin <strong>de</strong> estos episodios, lo que es difícil <strong>de</strong> reconocer por medio <strong>de</strong> otros<br />
índices.<br />
La tercera proviene <strong>de</strong> <strong>la</strong> estandarización, lo que asegura que <strong>la</strong> frecuencia <strong>de</strong> los eventos<br />
extremos en cualquier localidad y en cualquier esca<strong>la</strong> <strong>de</strong> tiempo es consistente.<br />
Desventajas:<br />
La primera <strong>de</strong>pen<strong>de</strong> <strong>de</strong> <strong>la</strong> calidad <strong>de</strong> los datos <strong>de</strong> precipitación utilizados. Datos erróneos<br />
conducen a IPE erróneos.<br />
Una segunda limitación <strong>de</strong>l IPE surge <strong>de</strong> <strong>la</strong> naturaleza estandarizada <strong>de</strong>l mismo índice, es<br />
<strong>de</strong>cir que los eventos extremos (secos o húmedos) tienen <strong>la</strong> misma probabilidad <strong>de</strong><br />
ocurrencia en cualquier lugar. Luego, el IPE no es capaz <strong>de</strong> i<strong>de</strong>ntificar regiones que son<br />
más propensas que otras a <strong>la</strong> ocurrencia <strong>de</strong> estos tipos <strong>de</strong> episodios.<br />
Un tercer problema pue<strong>de</strong> surgir cuando el IPE es empleado en <strong>la</strong>s esca<strong>la</strong>s <strong>de</strong> tiempo más<br />
cortas (1, 2 ó 3 meses), en regiones <strong>de</strong> baja precipitación estacional. En estos casos, pue<strong>de</strong>n<br />
ocurrir valores positivos (o negativos) altos que son susceptibles <strong>de</strong> ser erróneamente<br />
interpretados. En estas situaciones, un acabado conocimiento <strong>de</strong> <strong>la</strong> climatología <strong>de</strong> estas<br />
regiones mejora <strong>la</strong> interpretación <strong>de</strong>l IPE.<br />
11.3.2.2 Cuantificación y <strong>de</strong>scripción <strong>de</strong> <strong>la</strong>s sequías críticas<br />
Con <strong>la</strong> información <strong>de</strong> <strong>la</strong> precipitación areal <strong>de</strong> <strong>la</strong>s cuencas Huancané y Suches, se ha<br />
<strong>de</strong>sarrol<strong>la</strong>do <strong>la</strong> caracterización meteorológica <strong>de</strong> <strong>la</strong>s sequías históricas ocurridas durante el<br />
pe<strong>río</strong>do <strong>de</strong> 1956 a 2009, mediante <strong>la</strong> aplicación <strong>de</strong>l Índice <strong>de</strong> Precipitación Estandarizada.<br />
MINAG-ANA-DCPRH-AGUAS SUPERFICIALES Pág.355
<strong>Estudio</strong> <strong>Hidrológico</strong> <strong>de</strong> <strong>la</strong>s <strong>Cuenca</strong>s Huancané y Suches 2010<br />
<strong>Cuenca</strong> Huancané<br />
En el Cuadro Nº 11.14 se muestra el cálculo <strong>de</strong>l Índice <strong>de</strong> Precipitación Estandarizada<br />
(IPE) y c<strong>la</strong>sificación <strong>de</strong> <strong>la</strong> sequía meteorológica <strong>de</strong> <strong>la</strong> cuenca Huancané.<br />
Cuadro Nº 11.14 Análisis <strong>de</strong> sequía meteorológica (precipitación areal anual)<br />
<strong>Cuenca</strong> <strong>de</strong>l <strong>río</strong> Huancané<br />
Nº Año<br />
1 1956 661.3 -0.35 Normal<br />
2 1957 719.5 0.19 Normal<br />
3 1958 764.6 0.61 Ligeramente húmedo<br />
4 1959 746.2 0.44 Normal<br />
5 1960 779.1 0.75 Ligeramente húmedo<br />
6 1961 759.0 0.56 Ligeramente húmedo<br />
7 1962 849.8 1.41 Mo<strong>de</strong>radamente húmedo<br />
8 1963 767.7 0.64 Ligeramente húmedo<br />
9 1964 637.4 -0.57 Ligeramente seco<br />
10 1965 731.2 0.30 Normal<br />
11 1966 550.6 -1.39 Mo<strong>de</strong>radamente seco<br />
12 1967 636.6 -0.58 Ligeramente seco<br />
13 1968 662.8 -0.34 Normal<br />
14 1969 585.5 -1.06 Mo<strong>de</strong>radamente seco<br />
15 1970 746.8 0.45 Normal<br />
16 1971 602.4 -0.90 Ligeramente seco<br />
17 1972 611.6 -0.82 Ligeramente seco<br />
18 1973 679.3 -0.18 Normal<br />
19 1974 618.7 -0.75 Ligeramente seco<br />
20 1975 659.2 -0.37 Normal<br />
21 1976 753.2 0.51 Ligeramente húmedo<br />
22 1977 667.2 -0.30 Normal<br />
23 1978 876.3 1.66 Muy húmedo<br />
24 1979 741.6 0.40 Normal<br />
25 1980 648.7 -0.47 Normal<br />
26 1981 869.6 1.60 Muy húmedo<br />
27 1982 722.5 0.22 Normal<br />
28 1983 471.7 -2.12 Extremadamente seco<br />
29 1984 940.3 2.26 Extremadamente húmedo<br />
30 1985 973.9 2.57 Extremadamente húmedo<br />
31 1986 867.1 1.57 Muy húmedo<br />
32 1987 630.8 -0.64 Ligeramente seco<br />
33 1988 722.8 0.22 Normal<br />
34 1989 624.9 -0.69 Ligeramente seco<br />
35 1990 655.7 -0.40 Normal<br />
36 1991 701.7 0.03 Normal<br />
37 1992 634.9 -0.60 Ligeramente seco<br />
38 1993 704.4 0.05 Normal<br />
39 1994 807.1 1.01 Mo<strong>de</strong>radamente húmedo<br />
40 1995 593.3 -0.99 Ligeramente seco<br />
41 1996 639.6 -0.55 Ligeramente seco<br />
42 1997 817.6 1.11 Mo<strong>de</strong>radamente húmedo<br />
43 1998 564.9 -1.25 Mo<strong>de</strong>radamente seco<br />
44 1999 613.8 -0.80 Ligeramente seco<br />
45 2000 636.8 -0.58 Ligeramente seco<br />
46 2001 838.7 1.31 Mo<strong>de</strong>radamente húmedo<br />
47 2002 823.9 1.17 Mo<strong>de</strong>radamente húmedo<br />
48 2003 774.1 0.70 Ligeramente húmedo<br />
49 2004 720.7 0.20 Normal<br />
50 2005 620.2 -0.74 Ligeramente seco<br />
51 2006 629.8 -0.65 Ligeramente seco<br />
52 2007 619.5 -0.74 Ligeramente seco<br />
53 <strong>2008</strong> 572.3 -1.18 Mo<strong>de</strong>radamente seco<br />
54 2009 489.0 -1.96 Muy seco<br />
Promedio<br />
Desvest<br />
Precipitación<br />
Anual<br />
(mm)<br />
Índice <strong>de</strong><br />
Precipitación<br />
Estandarizada<br />
(IPE)<br />
698.9 0.00<br />
107.0 1.00<br />
C<strong>la</strong>sificación <strong>de</strong>l<br />
IPE<br />
MINAG-ANA-DCPRH-AGUAS SUPERFICIALES Pág.356
<strong>Estudio</strong> <strong>Hidrológico</strong> <strong>de</strong> <strong>la</strong>s <strong>Cuenca</strong>s Huancané y Suches 2010<br />
Para su mejor visualización se presenta en forma gráfica <strong>la</strong> variación anual <strong>de</strong>l IPE, ver<br />
Figura Nº 11.20.<br />
Indice <strong>de</strong> Precipitación Estandarizada (IPE)<br />
-1.0<br />
-2.0<br />
-3.0<br />
Figura Nº 11.20 Índice <strong>de</strong> Precipitación Estandarizada (IPE) - <strong>Cuenca</strong> <strong>de</strong>l <strong>río</strong> Huancané<br />
3.0<br />
2.0<br />
1.0<br />
0.0<br />
1956<br />
1958<br />
1960<br />
1962<br />
1964<br />
1966<br />
1968<br />
1970<br />
1972<br />
1974<br />
1976<br />
1978<br />
1980<br />
MINAG-ANA-DCPRH-AGUAS SUPERFICIALES Pág.357<br />
1982<br />
Tiempo (año)<br />
Mediante el análisis <strong>de</strong> sequía <strong>de</strong> <strong>la</strong> precipitación anual <strong>de</strong> <strong>la</strong> cuenca <strong>de</strong>l <strong>río</strong> Huancané, se<br />
ha encontrado siete (7) pe<strong>río</strong>dos <strong>de</strong> sequía con mayor duración e intensidad, don<strong>de</strong> cinco<br />
(5) pe<strong>río</strong>dos son <strong>de</strong> sequía extremadamente seco, un (1) pe<strong>río</strong>do <strong>de</strong> sequía muy seco y un<br />
(1) pe<strong>río</strong>do <strong>de</strong> sequía mo<strong>de</strong>radamente seco, ver Cuadro Nº 11.15.<br />
Cuadro Nº 11.15 Pe<strong>río</strong>dos <strong>de</strong> sequía meteorológica - <strong>Cuenca</strong> <strong>de</strong>l <strong>río</strong> Huancané<br />
Pe<strong>río</strong>dos <strong>de</strong> sequía<br />
Duración <strong>de</strong> <strong>la</strong> sequía<br />
(años)<br />
1984<br />
Magnitud <strong>de</strong> <strong>la</strong> sequía<br />
(S IPE)<br />
1986<br />
1988<br />
1990<br />
1992<br />
1994<br />
Intensidad <strong>de</strong><br />
sequía<br />
1996<br />
1998<br />
2000<br />
2002<br />
2004<br />
Categoría <strong>de</strong> <strong>la</strong> sequía<br />
1 Sequía <strong>de</strong> 1966 - 1969 4 -3.37 -0.84 Extremadamente seco<br />
2 Sequía <strong>de</strong> 1971 - 1975 5 -3.02 -0.60 Extremadamente seco<br />
3 Sequía <strong>de</strong> 1983 1 -2.12 -2.12 Extremadamente seco<br />
4 Sequía <strong>de</strong> 1989 - 1990 2 -1.09 -0.55 Mo<strong>de</strong>radamente seco<br />
5 Sequía <strong>de</strong> 1995 - 1996 2 -1.54 -0.77 Muy seco<br />
6 Sequía <strong>de</strong> 1998 - 2000 3 -2.63 -0.88 Extremadamente seco<br />
7 Sequía <strong>de</strong> 2005 - 2009 5 -5.27 -1.05 Extremadamente seco<br />
Según el Cuadro Nº 11.15, se observa que <strong>la</strong> sequía más intensa ocurrieron en los pe<strong>río</strong>dos<br />
<strong>de</strong> 1971-1975 y 2005-2009, con una duración <strong>de</strong> cinco (5) años consecutivos. La sequía<br />
más crítica ha ocurrido en el pe<strong>río</strong>do <strong>de</strong> 1983 con una intensidad <strong>de</strong> -2.12.<br />
La sequía meteorológica ocurrida en el año <strong>de</strong> 1983, fue un año extremadamente seco en <strong>la</strong><br />
cuenca Huancané y a nivel <strong>de</strong> <strong>la</strong> región hidrográfica <strong>de</strong>l Titicaca, <strong>la</strong> escasez <strong>de</strong> <strong>la</strong><br />
precipitación pluvial ha afectado en mayor magnitud a <strong>la</strong> producción agríco<strong>la</strong> y pecuaria,<br />
generando <strong>la</strong> disminución <strong>de</strong> <strong>la</strong> economía <strong>de</strong> <strong>la</strong> pob<strong>la</strong>ción rural y <strong>de</strong> <strong>la</strong> región. La<br />
agricultura en general en <strong>la</strong> región hidrográfica <strong>de</strong>l Titicaca es bajo lluvia, por lo que es<br />
importante construir represas <strong>de</strong> almacenamiento <strong>de</strong> agua en épocas <strong>de</strong> avenida para suplir<br />
el déficit <strong>de</strong>l recurso hídrico en <strong>la</strong> época <strong>de</strong> estiaje o sequía.<br />
2006<br />
<strong>2008</strong>
<strong>Estudio</strong> <strong>Hidrológico</strong> <strong>de</strong> <strong>la</strong>s <strong>Cuenca</strong>s Huancané y Suches 2010<br />
<strong>Cuenca</strong> Suches<br />
En el Cuadro Nº 11.16 se muestra el cálculo <strong>de</strong>l Índice <strong>de</strong> Precipitación Estandarizada<br />
(IPE) y c<strong>la</strong>sificación <strong>de</strong> <strong>la</strong> sequía meteorológica <strong>de</strong> <strong>la</strong> cuenca Suches.<br />
Cuadro Nº 11.16 Análisis <strong>de</strong> sequía meteorológica (precipitación areal anual)<br />
<strong>Cuenca</strong> <strong>de</strong>l <strong>río</strong> Suches<br />
Nº Año<br />
1 1956 714.9 0.55 Ligeramente húmedo<br />
2 1957 630.5 -0.24 Normal<br />
3 1958 618.6 -0.35 Normal<br />
4 1959 609.2 -0.43 Normal<br />
5 1960 599.8 -0.52 Ligeramente seco<br />
6 1961 750.9 0.88 Ligeramente húmedo<br />
7 1962 781.4 1.17 Mo<strong>de</strong>radamente húmedo<br />
8 1963 856.0 1.86 Muy húmedo<br />
9 1964 732.7 0.72 Ligeramente húmedo<br />
10 1965 777.3 1.13 Mo<strong>de</strong>radamente húmedo<br />
11 1966 522.8 -1.24 Mo<strong>de</strong>radamente seco<br />
12 1967 567.8 -0.82 Ligeramente seco<br />
13 1968 545.4 -1.03 Mo<strong>de</strong>radamente seco<br />
14 1969 463.0 -1.80 Muy seco<br />
15 1970 678.3 0.21 Normal<br />
16 1971 551.8 -0.97 Ligeramente seco<br />
17 1972 636.4 -0.18 Normal<br />
18 1973 738.2 0.77 Ligeramente húmedo<br />
19 1974 750.9 0.88 Ligeramente húmedo<br />
20 1975 653.8 -0.02 Normal<br />
21 1976 592.8 -0.59 Ligeramente seco<br />
22 1977 706.6 0.47 Normal<br />
23 1978 823.7 1.56 Muy húmedo<br />
24 1979 741.2 0.79 Ligeramente húmedo<br />
25 1980 598.5 -0.53 Ligeramente seco<br />
26 1981 790.6 1.25 Mo<strong>de</strong>radamente húmedo<br />
27 1982 680.3 0.23 Normal<br />
28 1983 514.9 -1.31 Mo<strong>de</strong>radamente seco<br />
29 1984 905.7 2.33 Extremadamente húmedo<br />
30 1985 922.8 2.49 Extremadamente húmedo<br />
31 1986 784.1 1.19 Mo<strong>de</strong>radamente húmedo<br />
32 1987 588.9 -0.62 Ligeramente seco<br />
33 1988 659.9 0.04 Normal<br />
34 1989 495.0 -1.50 Muy seco<br />
35 1990 574.0 -0.76 Ligeramente seco<br />
36 1991 526.2 -1.21 Mo<strong>de</strong>radamente seco<br />
37 1992 618.5 -0.35 Normal<br />
38 1993 614.9 -0.38 Normal<br />
39 1994 721.2 0.61 Ligeramente húmedo<br />
40 1995 588.6 -0.63 Ligeramente seco<br />
41 1996 641.8 -0.13 Normal<br />
42 1997 704.7 0.45 Normal<br />
43 1998 566.9 -0.83 Ligeramente seco<br />
44 1999 607.9 -0.45 Normal<br />
45 2000 591.8 -0.60 Ligeramente seco<br />
46 2001 739.3 0.78 Ligeramente húmedo<br />
47 2002 791.2 1.26 Mo<strong>de</strong>radamente húmedo<br />
48 2003 738.8 0.77 Ligeramente húmedo<br />
49 2004 555.7 -0.93 Ligeramente seco<br />
50 2005 580.5 -0.70 Ligeramente seco<br />
51 2006 608.7 -0.44 Normal<br />
52 2007 645.7 -0.09 Normal<br />
53 <strong>2008</strong> 542.9 -1.05 Mo<strong>de</strong>radamente seco<br />
54 2009 473.7 -1.70 Muy seco<br />
Promedio<br />
Desvest<br />
Precipitación<br />
Anual<br />
(mm)<br />
Índice <strong>de</strong><br />
Precipitación<br />
Estandarizada<br />
(IPE)<br />
655.9 0.00<br />
107.4 1.00<br />
C<strong>la</strong>sificación <strong>de</strong>l<br />
IPE<br />
MINAG-ANA-DCPRH-AGUAS SUPERFICIALES Pág.358
<strong>Estudio</strong> <strong>Hidrológico</strong> <strong>de</strong> <strong>la</strong>s <strong>Cuenca</strong>s Huancané y Suches 2010<br />
Para su mejor visualización se presenta en forma gráfica <strong>la</strong> variación anual <strong>de</strong>l IPE, ver<br />
Figura Nº 11.21.<br />
Indice <strong>de</strong> Precipitación Estandarizada (IPE)<br />
3.0<br />
2.0<br />
1.0<br />
0.0<br />
-1.0<br />
-2.0<br />
-3.0<br />
Figura Nº 11.21 Índice <strong>de</strong> Precipitación Estandarizada (IPE) - <strong>Cuenca</strong> <strong>de</strong>l <strong>río</strong> Suches<br />
1956<br />
1958<br />
1960<br />
1962<br />
1964<br />
1966<br />
1968<br />
1970<br />
1972<br />
1974<br />
1976<br />
1978<br />
1980<br />
MINAG-ANA-DCPRH-AGUAS SUPERFICIALES Pág.359<br />
1982<br />
Tiempo (año)<br />
Mediante el análisis <strong>de</strong> sequía <strong>de</strong> <strong>la</strong> precipitación anual <strong>de</strong> <strong>la</strong> cuenca <strong>de</strong>l <strong>río</strong> Suches, se ha<br />
encontrado ocho (8) pe<strong>río</strong>dos <strong>de</strong> sequía con mayor duración e intensidad, don<strong>de</strong> tres (3)<br />
pe<strong>río</strong>dos son <strong>de</strong> sequía extremadamente seco, dos (2) pe<strong>río</strong>dos <strong>de</strong> sequía muy seco, dos (2)<br />
pe<strong>río</strong>dos <strong>de</strong> sequía mo<strong>de</strong>radamente seco y un (1) pe<strong>río</strong>do <strong>de</strong> sequía ligeramente seco, ver<br />
Cuadro Nº 11.17.<br />
Cuadro Nº 11.17 Pe<strong>río</strong>dos <strong>de</strong> sequía meteorológica - <strong>Cuenca</strong> <strong>de</strong>l <strong>río</strong> Suches<br />
Pe<strong>río</strong>dos <strong>de</strong> sequía<br />
Duración <strong>de</strong> <strong>la</strong> sequía<br />
(años)<br />
1984<br />
Magnitud <strong>de</strong> <strong>la</strong> sequía<br />
(S IPE)<br />
1986<br />
1988<br />
1990<br />
1992<br />
Intensidad <strong>de</strong><br />
sequía<br />
1994<br />
1996<br />
1998<br />
2000<br />
2002<br />
Categoría <strong>de</strong> <strong>la</strong> sequía<br />
1 Sequía <strong>de</strong> 1957 - 1960 4 -1.54 -0.39 Muy seco<br />
2 Sequía <strong>de</strong> 1966 - 1969 4 -4.89 -1.22 Extremadamente seco<br />
3 Sequía <strong>de</strong> 1971 - 1972 2 -1.15 -0.58 Mo<strong>de</strong>radamente seco<br />
4 Sequía <strong>de</strong> 1983 1 -1.31 -1.31 Mo<strong>de</strong>radamente seco<br />
5 Sequía <strong>de</strong> 1989 - 1993 5 -4.20 -0.84 Extremadamente seco<br />
6 Sequía <strong>de</strong> 1995 - 1996 2 -0.76 -0.38 Ligeramente seco<br />
7 Sequía <strong>de</strong> 1998 - 2000 3 -1.88 -0.63 Muy seco<br />
8 Sequía <strong>de</strong> 2004 - 2009 6 -4.91 -0.82 Extremadamente seco<br />
Según el Cuadro Nº 11.17, se observa que <strong>la</strong> sequía más intensa ocurrieron en el pe<strong>río</strong>do<br />
<strong>de</strong> 2004-2009, con una duración <strong>de</strong> seis (6) años consecutivos. La sequía más crítica ha<br />
ocurrido en el pe<strong>río</strong>do <strong>de</strong> 1983 con una intensidad <strong>de</strong> -1.31.<br />
La sequía meteorológica ocurrida en el año <strong>de</strong> 1983, fue un año extremadamente seco en <strong>la</strong><br />
cuenca Suches y a nivel <strong>de</strong> <strong>la</strong> región hidrográfica <strong>de</strong>l Titicaca, <strong>la</strong> escasez <strong>de</strong> <strong>la</strong><br />
precipitación pluvial ha afectado en mayor magnitud a <strong>la</strong> producción agríco<strong>la</strong> y pecuaria,<br />
generando <strong>la</strong> disminución <strong>de</strong> <strong>la</strong> economía <strong>de</strong> <strong>la</strong> pob<strong>la</strong>ción rural y <strong>de</strong> <strong>la</strong> región. La<br />
agricultura en general en <strong>la</strong> región hidrográfica <strong>de</strong>l Titicaca es bajo lluvia, por lo que es<br />
importante construir represas <strong>de</strong> almacenamiento <strong>de</strong> agua en épocas <strong>de</strong> avenida para suplir<br />
el déficit <strong>de</strong>l recurso hídrico en <strong>la</strong> época <strong>de</strong> estiaje o sequía.<br />
2004<br />
2006<br />
<strong>2008</strong>
<strong>Estudio</strong> <strong>Hidrológico</strong> <strong>de</strong> <strong>la</strong>s <strong>Cuenca</strong>s Huancané y Suches 2010<br />
Para <strong>la</strong> e<strong>la</strong>boración <strong>de</strong>l mapa <strong>de</strong> <strong>la</strong> variación espacial <strong>de</strong> sequía meteorológica, se ha<br />
calcu<strong>la</strong>do el IPE para cada una <strong>de</strong> <strong>la</strong>s estaciones meteorológicas y con ayuda <strong>de</strong>l software<br />
<strong>de</strong> Sistema <strong>de</strong> Información Geográfica (Arc Gis) se obtuvo los mapas <strong>de</strong> sequía a nivel<br />
mensual en <strong>la</strong>s cuencas Huancané (Figura Nº 11.22) y Suches (Figura Nº 11.23), don<strong>de</strong> <strong>la</strong><br />
variación <strong>de</strong> <strong>la</strong> sequía se muestra espacialmente en <strong>la</strong>s cuencas <strong>de</strong> estudio.<br />
Figura Nº 11.22 Variación espacial <strong>de</strong> <strong>la</strong> sequía meteorológica (pe<strong>río</strong>do 2005-2009) – <strong>Cuenca</strong> Huancané<br />
Año 2005<br />
Año 2006<br />
MINAG-ANA-DCPRH-AGUAS SUPERFICIALES Pág.360
<strong>Estudio</strong> <strong>Hidrológico</strong> <strong>de</strong> <strong>la</strong>s <strong>Cuenca</strong>s Huancané y Suches 2010<br />
Continuación<br />
Año 2007<br />
Año <strong>2008</strong><br />
MINAG-ANA-DCPRH-AGUAS SUPERFICIALES Pág.361
<strong>Estudio</strong> <strong>Hidrológico</strong> <strong>de</strong> <strong>la</strong>s <strong>Cuenca</strong>s Huancané y Suches 2010<br />
Continuación<br />
Año 2009<br />
Figura Nº 11.23 Variación espacial <strong>de</strong> <strong>la</strong> sequía meteorológica (pe<strong>río</strong>do 2004-2009) – <strong>Cuenca</strong> Suches<br />
Año 2004<br />
MINAG-ANA-DCPRH-AGUAS SUPERFICIALES Pág.362
<strong>Estudio</strong> <strong>Hidrológico</strong> <strong>de</strong> <strong>la</strong>s <strong>Cuenca</strong>s Huancané y Suches 2010<br />
Continuación<br />
Año 2005<br />
Año 2006<br />
MINAG-ANA-DCPRH-AGUAS SUPERFICIALES Pág.363
<strong>Estudio</strong> <strong>Hidrológico</strong> <strong>de</strong> <strong>la</strong>s <strong>Cuenca</strong>s Huancané y Suches 2010<br />
Continuación<br />
Año 2007<br />
Año <strong>2008</strong><br />
MINAG-ANA-DCPRH-AGUAS SUPERFICIALES Pág.364
<strong>Estudio</strong> <strong>Hidrológico</strong> <strong>de</strong> <strong>la</strong>s <strong>Cuenca</strong>s Huancané y Suches 2010<br />
11.3.3 Sequía hidrológica<br />
11.3.3.1 Información básica - Metodología <strong>de</strong> análisis<br />
A.- Información básica<br />
Continuación<br />
La información utilizada para el análisis <strong>de</strong> sequía hidrológica en el presente estudio, es <strong>la</strong><br />
serie anual <strong>de</strong> <strong>la</strong>s <strong>de</strong>scargas medias <strong>de</strong>l pe<strong>río</strong>do 1956-2009, correspondiente a <strong>la</strong>s cuencas<br />
Huancané y Suches. La información fueron presentados en el Capítulo VI, ítem 6.4.<br />
B.- Método <strong>de</strong> análisis <strong>de</strong> sequía<br />
Para el análisis <strong>de</strong> sequía hidrológica <strong>de</strong> <strong>la</strong>s cuencas Huancané y Suches, se ha empleado el<br />
Método <strong>de</strong> RUN para caracterizar <strong>la</strong> sequía crítica <strong>de</strong> <strong>la</strong> serie analizada.<br />
Un RUN es <strong>de</strong>finido como una sucesión <strong>de</strong> eventos simi<strong>la</strong>res precedidos y sucedidos por<br />
eventos diferentes, con el número <strong>de</strong> elementos en un run referido en toda su longitud.<br />
Las características principales que <strong>de</strong>fine <strong>la</strong> sequía, es <strong>la</strong> siguiente:<br />
Año 2009<br />
Duración <strong>de</strong> <strong>la</strong> sequía.- L<strong>la</strong>mado también longitud <strong>de</strong>l run negativo, es <strong>de</strong>finido<br />
como el número <strong>de</strong> intervalos <strong>de</strong> tiempo consecutivos (tiempo total), durante el cual<br />
Zt es negativo.<br />
MINAG-ANA-DCPRH-AGUAS SUPERFICIALES Pág.365
<strong>Estudio</strong> <strong>Hidrológico</strong> <strong>de</strong> <strong>la</strong>s <strong>Cuenca</strong>s Huancané y Suches 2010<br />
Magnitud <strong>de</strong> <strong>la</strong> sequía.- L<strong>la</strong>mado también suma <strong>de</strong>l run negativo, es <strong>la</strong> suma <strong>de</strong><br />
déficits individuales para una duración ininterrumpida <strong>de</strong> sequía dada. Saldarriaga<br />
(1970) y Millán (1972).<br />
Intensidad <strong>de</strong> <strong>la</strong> sequía.- Severidad <strong>de</strong> <strong>la</strong> sequía, es <strong>la</strong> razón <strong>de</strong> <strong>la</strong> magnitud entre <strong>la</strong><br />
duración respectiva.<br />
M<br />
I <br />
D<br />
Don<strong>de</strong>: I = Intensidad <strong>de</strong> <strong>la</strong> sequía<br />
M = Magnitud <strong>de</strong> <strong>la</strong> sequía<br />
D = Duración <strong>de</strong> <strong>la</strong> sequía<br />
Sequía crítica.- Es <strong>de</strong>finido como el pe<strong>río</strong>do para el cual el abastecimiento histórico es el<br />
más crítico con respecto a <strong>la</strong> <strong>de</strong>manda requerida <strong>de</strong> un sistema <strong>de</strong> agua.<br />
El problema básico en diseño y operación, usando <strong>la</strong> sequía crítica histórica es que, no se<br />
conoce su probabilidad <strong>de</strong> ocurrencia, lo que significa que una sequía crítica para un<br />
abastecimiento <strong>de</strong> un record histórico <strong>de</strong> una longitud dada, pue<strong>de</strong> ser mayor ó menor que<br />
<strong>la</strong> sequía crítica durante el siguiente pe<strong>río</strong>do <strong>de</strong> <strong>la</strong> misma longitud.<br />
Ecuación <strong>de</strong> estandarización <strong>de</strong> caudales<br />
La metodología <strong>de</strong>scrita ha sido utilizada en varias cuencas <strong>de</strong>l Perú, cuyo procedimiento<br />
<strong>de</strong> cálculo en forma resumida es <strong>la</strong> siguiente:<br />
Z<br />
t<br />
X t X<br />
<br />
S<br />
Don<strong>de</strong>: Zt = Variable estandarizada<br />
Xt = Variable hidrológica<br />
X = Media<br />
S = Desviación estándar<br />
Los datos calcu<strong>la</strong>dos <strong>de</strong> Zt se plotea en el eje <strong>de</strong> <strong>la</strong>s or<strong>de</strong>nadas y el tiempo en el eje <strong>de</strong> <strong>la</strong>s<br />
abscisas, lo cual permite <strong>de</strong>terminar <strong>la</strong> duración y magnitud <strong>de</strong> <strong>la</strong> sequía histórica.<br />
11.3.3.2 Cuantificación y <strong>de</strong>scripción <strong>de</strong> <strong>la</strong>s sequías críticas<br />
Con <strong>la</strong> información <strong>de</strong> <strong>la</strong>s <strong>de</strong>scargas medias anuales <strong>de</strong> <strong>la</strong>s cuencas Huancané y Suches, se<br />
ha <strong>de</strong>sarrol<strong>la</strong>do <strong>la</strong> caracterización hidrológica <strong>de</strong> <strong>la</strong>s sequías históricas ocurridas durante el<br />
pe<strong>río</strong>do <strong>de</strong> 1956 a 2009, mediante <strong>la</strong> aplicación <strong>de</strong>l Método <strong>de</strong> RUN.<br />
MINAG-ANA-DCPRH-AGUAS SUPERFICIALES Pág.366
<strong>Estudio</strong> <strong>Hidrológico</strong> <strong>de</strong> <strong>la</strong>s <strong>Cuenca</strong>s Huancané y Suches 2010<br />
<strong>Cuenca</strong> Huancané<br />
En el Cuadro Nº 11.18 se muestra el cálculo <strong>de</strong>l RUN <strong>de</strong> <strong>la</strong>s <strong>de</strong>scargas medias anuales <strong>de</strong><br />
<strong>la</strong> cuenca Huancané.<br />
Cuadro Nº 11.18 Análisis <strong>de</strong> sequía hidrológica (<strong>de</strong>scargas medias anuales)<br />
<strong>Cuenca</strong> <strong>de</strong>l <strong>río</strong> Huancané<br />
Nº Año<br />
Descarga media anual<br />
1 1956 6.15 -1.58<br />
2 1957 11.15 -0.97<br />
3 1958 17.67 -0.17<br />
4 1959 15.27 -0.46<br />
5 1960 21.36 0.28<br />
6 1961 16.57 -0.31<br />
7 1962 26.82 0.94<br />
8 1963 27.03 0.97<br />
9 1964 16.31 -0.34<br />
10 1965 21.46 0.29<br />
11 1966 15.83 -0.40<br />
12 1967 7.67 -1.39<br />
13 1968 12.19 -0.84<br />
14 1969 11.29 -0.95<br />
15 1970 21.41 0.28<br />
16 1971 31.02 1.46<br />
17 1972 14.16 -0.60<br />
18 1973 20.17 0.13<br />
19 1974 23.96 0.60<br />
20 1975 21.03 0.24<br />
21 1976 17.39 -0.21<br />
22 1977 14.33 -0.58<br />
23 1978 21.23 0.26<br />
24 1979 26.12 0.86<br />
25 1980 11.43 -0.93<br />
26 1981 25.96 0.84<br />
27 1982 24.11 0.61<br />
28 1983 7.23 -1.45<br />
29 1984 27.77 1.06<br />
30 1985 31.20 1.48<br />
31 1986 40.04 2.56<br />
32 1987 15.02 -0.50<br />
33 1988 20.97 0.23<br />
34 1989 11.68 -0.90<br />
35 1990 8.23 -1.32<br />
36 1991 12.15 -0.85<br />
37 1992 12.56 -0.80<br />
38 1993 17.51 -0.19<br />
39 1994 26.25 0.87<br />
40 1995 13.61 -0.67<br />
41 1996 10.47 -1.05<br />
42 1997 27.57 1.04<br />
43 1998 10.00 -1.11<br />
44 1999 12.85 -0.76<br />
45 2000 12.97 -0.75<br />
46 2001 34.11 1.83<br />
47 2002 31.01 1.45<br />
48 2003 40.50 2.61<br />
49 2004 27.45 1.02<br />
50 2005 16.74 -0.29<br />
51 2006 20.40 0.16<br />
52 2007 20.69 0.20<br />
53 <strong>2008</strong> 11.47 -0.93<br />
54 2009 10.77 -1.01<br />
Promedio<br />
19.08 0.00<br />
Desvest<br />
8.20 1.00<br />
MINAG-ANA-DCPRH-AGUAS SUPERFICIALES Pág.367<br />
(m 3 /s)<br />
RUN
<strong>Estudio</strong> <strong>Hidrológico</strong> <strong>de</strong> <strong>la</strong>s <strong>Cuenca</strong>s Huancané y Suches 2010<br />
Para su mejor visualización se presenta en forma gráfica <strong>la</strong> variación anual <strong>de</strong>l RUN, ver<br />
Figura Nº 11.24.<br />
RUN<br />
Figura Nº 11.24 Valores <strong>de</strong> RUN <strong>de</strong> <strong>la</strong>s <strong>de</strong>scargas medias anuales - <strong>Cuenca</strong> <strong>de</strong>l <strong>río</strong> Huancané<br />
3.0<br />
2.5<br />
2.0<br />
1.5<br />
1.0<br />
0.5<br />
0.0<br />
-0.5<br />
-1.0<br />
-1.5<br />
-2.0<br />
1956<br />
1958<br />
1960<br />
1962<br />
1964<br />
1966<br />
1968<br />
1970<br />
1972<br />
1974<br />
1976<br />
1978<br />
1980<br />
MINAG-ANA-DCPRH-AGUAS SUPERFICIALES Pág.368<br />
1982<br />
Tiempo (año)<br />
Mediante el análisis <strong>de</strong> sequía hidrológica <strong>de</strong> <strong>la</strong> cuenca <strong>de</strong>l <strong>río</strong> Huancané, se ha encontrado<br />
ocho (8) pe<strong>río</strong>dos <strong>de</strong> sequía con mayor duración e intensidad, ver Cuadro Nº 11.19.<br />
Cuadro Nº 11.19 Pe<strong>río</strong>dos <strong>de</strong> sequía hidrológica - <strong>Cuenca</strong> <strong>de</strong>l <strong>río</strong> Huancané<br />
Pe<strong>río</strong>dos <strong>de</strong> sequía<br />
Duración <strong>de</strong> <strong>la</strong> sequía<br />
(años)<br />
1984<br />
1986<br />
1988<br />
1990<br />
Magnitud <strong>de</strong> <strong>la</strong> sequía<br />
(S RUN)<br />
1992<br />
1994<br />
1996<br />
1998<br />
2000<br />
2002<br />
Intensidad <strong>de</strong> <strong>la</strong><br />
sequía<br />
1 Sequía <strong>de</strong> 1956 - 1959 4 -3.18 -0.80<br />
2 Sequía <strong>de</strong> 1966 - 1969 4 -3.58 -0.90<br />
3 Sequía <strong>de</strong> 1976 - 1977 2 -0.79 -0.40<br />
4 Sequía <strong>de</strong> 1983 1 -1.45 -1.45<br />
5 Sequía <strong>de</strong> 1989 - 1993 5 -4.06 -0.81<br />
6 Sequía <strong>de</strong> 1995 - 1996 2 -1.72 -0.86<br />
7 Sequía <strong>de</strong> 1998 - 2000 3 -2.62 -0.87<br />
8 Sequía <strong>de</strong> <strong>2008</strong> - 2009 2 -1.94 -0.97<br />
Según el Cuadro Nº 11.19, se observa que <strong>la</strong> sequía más intensa ocurrieron en los pe<strong>río</strong>dos<br />
<strong>de</strong> 1956-1959 y 1966-1969, cada pe<strong>río</strong>do con una duración <strong>de</strong> cuatro (4) años<br />
consecutivos. La sequía más crítica ha ocurrido en el pe<strong>río</strong>do <strong>de</strong> 1983 con una intensidad<br />
<strong>de</strong> -1.45.<br />
2004<br />
2006<br />
<strong>2008</strong>
<strong>Estudio</strong> <strong>Hidrológico</strong> <strong>de</strong> <strong>la</strong>s <strong>Cuenca</strong>s Huancané y Suches 2010<br />
<strong>Cuenca</strong> Suches<br />
En el Cuadro Nº 11.20 se muestra el cálculo <strong>de</strong>l RUN <strong>de</strong> <strong>la</strong>s <strong>de</strong>scargas medias anuales <strong>de</strong><br />
<strong>la</strong> cuenca Suches.<br />
Cuadro Nº 11.20 Análisis <strong>de</strong> sequía hidrológica (<strong>de</strong>scargas medias anuales)<br />
<strong>Cuenca</strong> <strong>de</strong>l <strong>río</strong> Suches<br />
Nº Año<br />
1 1956 12.86 0.71<br />
2 1957 12.09 0.45<br />
3 1958 12.38 0.55<br />
4 1959 8.53 -0.75<br />
5 1960 9.79 -0.33<br />
6 1961 8.67 -0.70<br />
7 1962 7.65 -1.05<br />
8 1963 6.21 -1.53<br />
9 1964 8.86 -0.64<br />
10 1965 7.57 -1.07<br />
11 1966 9.30 -0.49<br />
12 1967 14.21 1.16<br />
13 1968 15.94 1.74<br />
14 1969 8.97 -0.60<br />
15 1970 7.64 -1.05<br />
16 1971 6.58 -1.41<br />
17 1972 6.93 -1.29<br />
18 1973 11.99 0.41<br />
19 1974 7.96 -0.94<br />
20 1975 12.26 0.51<br />
21 1976 10.31 -0.15<br />
22 1977 9.11 -0.56<br />
23 1978 10.81 0.02<br />
24 1979 12.85 0.70<br />
25 1980 12.14 0.46<br />
26 1981 9.42 -0.45<br />
27 1982 8.41 -0.79<br />
28 1983 14.36 1.21<br />
29 1984 20.29 3.21<br />
30 1985 14.25 1.18<br />
31 1986 6.15 -1.55<br />
32 1987 11.24 0.16<br />
33 1988 8.35 -0.81<br />
34 1989 5.54 -1.76<br />
35 1990 13.01 0.76<br />
36 1991 6.86 -1.31<br />
37 1992 14.34 1.21<br />
38 1993 8.90 -0.63<br />
39 1994 12.93 0.73<br />
40 1995 15.39 1.56<br />
41 1996 11.11 0.12<br />
42 1997 12.89 0.72<br />
43 1998 9.96 -0.27<br />
44 1999 10.61 -0.05<br />
45 2000 7.74 -1.02<br />
46 2001 13.53 0.93<br />
47 2002 11.09 0.11<br />
48 2003 9.52 -0.42<br />
49 2004 14.58 1.29<br />
50 2005 10.73 -0.01<br />
51 2006 9.90 -0.29<br />
52 2007 11.62 0.29<br />
53 <strong>2008</strong> 14.51 1.26<br />
54 2009 12.46 0.57<br />
Promedio<br />
Desvest<br />
Descarga media anual<br />
(m3/s)<br />
10.76 0.00<br />
2.97 1.00<br />
MINAG-ANA-DCPRH-AGUAS SUPERFICIALES Pág.369<br />
RUN
<strong>Estudio</strong> <strong>Hidrológico</strong> <strong>de</strong> <strong>la</strong>s <strong>Cuenca</strong>s Huancané y Suches 2010<br />
Para su mejor visualización se presenta en forma gráfica <strong>la</strong> variación anual <strong>de</strong>l RUN, ver<br />
Figura Nº 11.25.<br />
RUN<br />
Figura Nº 11.25 Valores <strong>de</strong> RUN <strong>de</strong> <strong>la</strong>s <strong>de</strong>scargas medias anuales - <strong>Cuenca</strong> <strong>de</strong>l <strong>río</strong> Suches<br />
4.0<br />
3.0<br />
2.0<br />
1.0<br />
0.0<br />
-1.0<br />
-2.0<br />
-3.0<br />
1956<br />
1958<br />
1960<br />
1962<br />
1964<br />
1966<br />
1968<br />
1970<br />
1972<br />
1974<br />
1976<br />
1978<br />
1980<br />
MINAG-ANA-DCPRH-AGUAS SUPERFICIALES Pág.370<br />
1982<br />
Tiempo (año)<br />
Mediante el análisis <strong>de</strong> sequía hidrológica <strong>de</strong> <strong>la</strong> cuenca <strong>de</strong>l <strong>río</strong> Suches, se ha encontrado<br />
ocho (8) pe<strong>río</strong>dos <strong>de</strong> sequía con mayor duración e intensidad, ver Cuadro Nº 11.21.<br />
Cuadro Nº 11.21 Pe<strong>río</strong>dos <strong>de</strong> sequía hidrológica - <strong>Cuenca</strong> <strong>de</strong>l <strong>río</strong> Suches<br />
Pe<strong>río</strong>dos <strong>de</strong> sequía<br />
Duración <strong>de</strong> <strong>la</strong> sequía<br />
(años)<br />
1984<br />
1986<br />
1988<br />
1990<br />
Magnitud <strong>de</strong> <strong>la</strong> sequía<br />
(S RUN)<br />
1992<br />
1994<br />
1996<br />
1998<br />
2000<br />
2002<br />
Intensidad <strong>de</strong> <strong>la</strong><br />
sequía<br />
1 Sequía <strong>de</strong> 1959 - 1966 8 -6.56 -0.82<br />
2 Sequía <strong>de</strong> 1969 - 1972 4 -4.35 -1.09<br />
3 Sequía <strong>de</strong> 1976 - 1977 2 -0.71 -0.36<br />
4 Sequía <strong>de</strong> 1981 - 1982 2 -1.24 -0.62<br />
5 Sequía <strong>de</strong> 1986 1 -1.55 -1.55<br />
6 Sequía <strong>de</strong> 1988 - 1989 2 -2.57 -1.29<br />
7 Sequía <strong>de</strong> 1991 1 -1.31 -1.31<br />
8 Sequía <strong>de</strong> 1998 - 2000 3 -1.34 -0.45<br />
Según el Cuadro Nº 11.21, se observa que <strong>la</strong> sequía más intensa ocurrieron en el pe<strong>río</strong>do<br />
<strong>de</strong> 1959-1966, con una duración <strong>de</strong> ocho (8) años consecutivos. La sequía más crítica ha<br />
ocurrido en el pe<strong>río</strong>do <strong>de</strong> 1986 con una intensidad <strong>de</strong> -1.55, seguido el pe<strong>río</strong>do 1991 con -<br />
1.31, pe<strong>río</strong>do 1988-1989 con -1.29 y el pe<strong>río</strong>do 1969-1972 con -1.09.<br />
2004<br />
2006<br />
<strong>2008</strong>
<strong>Estudio</strong> <strong>Hidrológico</strong> <strong>de</strong> <strong>la</strong>s <strong>Cuenca</strong>s Huancané y Suches 2010<br />
11.3.3.3 Análisis <strong>de</strong> pe<strong>río</strong>dos secos y húmedos<br />
Para el análisis <strong>de</strong> los pe<strong>río</strong>dos secos y húmedos, se ha utilizado <strong>la</strong> información <strong>de</strong> <strong>la</strong>s<br />
<strong>de</strong>scargas medias anuales <strong>de</strong>l pe<strong>río</strong>do <strong>de</strong> 1956-2009 correspondiente a <strong>la</strong>s cuencas<br />
Huancané y Suches. Mediante este análisis se i<strong>de</strong>ntifican los pe<strong>río</strong>dos secos, normales y<br />
húmedos.<br />
Para i<strong>de</strong>ntificar tipo <strong>de</strong> los años hidrológicos, se <strong>de</strong>terminan los límites entre los pe<strong>río</strong>dos<br />
seco-normal y normal-húmedo, luego se cuantifican los años secos que es <strong>la</strong> materia <strong>de</strong>l<br />
presente estudio, tomando los valores que se encuentran por <strong>de</strong>bajo <strong>de</strong>l límite <strong>de</strong>l pe<strong>río</strong>do<br />
seco-normal.<br />
<strong>Cuenca</strong> Huancané<br />
Durante el pe<strong>río</strong>do <strong>de</strong> 1956-2009 se han i<strong>de</strong>ntificado siete (7) años secos; <strong>de</strong> los cuales<br />
cuatro años han sido muy secos (1956, 1967, 1983 y 1990) y sus caudales medios anuales<br />
registrados son <strong>de</strong> 6.15, 7.67, 7.23 y 8.23 m 3 /s, respectivamente. En forma simi<strong>la</strong>r los otros<br />
tres años (1996, 1998 y 2009) han sido ligeramente secos, don<strong>de</strong> sus caudales medios<br />
anuales registrados son <strong>de</strong> 10.47, 10.00 y 10.77 m 3 /s.<br />
En el Cuadro N° 11.22 se presenta el análisis <strong>de</strong> pe<strong>río</strong>dos secos y húmedos, y <strong>la</strong> Figura N°<br />
11.26 se muestran visualmente los pe<strong>río</strong>dos secos, normales y húmedos en <strong>la</strong> cuenca <strong>de</strong>l<br />
<strong>río</strong> Huancané.<br />
<strong>Cuenca</strong> Suches<br />
Durante el pe<strong>río</strong>do <strong>de</strong> 1956-2009 se han i<strong>de</strong>ntificado diez (10) años secos; <strong>de</strong> los cuales<br />
tres años han sido muy secos (1963, 1986 y 1989) y sus caudales medios anuales<br />
registrados son <strong>de</strong> 6.21, 6.15 y 5.54 m 3 /s, respectivamente. Los años mo<strong>de</strong>radamente secos<br />
fueron 1971, 1972 y 1991, con 6.58, 6.93 y 6.86 m 3 /s <strong>de</strong> caudales medios anuales. En<br />
forma simi<strong>la</strong>r los otros cuatro años (1962, 1965, 1970 y 2000) han sido ligeramente secos,<br />
don<strong>de</strong> sus caudales medios anuales registrados son <strong>de</strong> 7.65, 7.57, 7.64 y 7.74 m 3 /s.<br />
En el Cuadro N° 11.23 se presenta el análisis <strong>de</strong> pe<strong>río</strong>dos secos y húmedos, y <strong>la</strong> Figura N°<br />
11.27 se muestran visualmente los pe<strong>río</strong>dos secos, normales y húmedos en <strong>la</strong> cuenca <strong>de</strong>l<br />
<strong>río</strong> Suches.<br />
MINAG-ANA-DCPRH-AGUAS SUPERFICIALES Pág.371
<strong>Estudio</strong> <strong>Hidrológico</strong> <strong>de</strong> <strong>la</strong>s <strong>Cuenca</strong>s Huancané y Suches 2010<br />
Cuadro Nº 11.22 Análisis <strong>de</strong> los pe<strong>río</strong>dos secos y húmedos <strong>de</strong> <strong>la</strong> serie anual <strong>de</strong> <strong>la</strong>s <strong>de</strong>scargas medias<br />
<strong>Cuenca</strong> <strong>de</strong>l <strong>río</strong> Huancané<br />
Nº Año<br />
1 1956 6.15 10.88 27.28 Seco<br />
2 1957 11.15 10.88 27.28 Normal<br />
3 1958 17.67 10.88 27.28 Normal<br />
4 1959 15.27 10.88 27.28 Normal<br />
5 1960 21.36 10.88 27.28 Normal<br />
6 1961 16.57 10.88 27.28 Normal<br />
7 1962 26.82 10.88 27.28 Normal<br />
8 1963 27.03 10.88 27.28 Normal<br />
9 1964 16.31 10.88 27.28 Normal<br />
10 1965 21.46 10.88 27.28 Normal<br />
11 1966 15.83 10.88 27.28 Normal<br />
12 1967 7.67 10.88 27.28 Seco<br />
13 1968 12.19 10.88 27.28 Normal<br />
14 1969 11.29 10.88 27.28 Normal<br />
15 1970 21.41 10.88 27.28 Normal<br />
16 1971 31.02 10.88 27.28 Húmedo<br />
17 1972 14.16 10.88 27.28 Normal<br />
18 1973 20.17 10.88 27.28 Normal<br />
19 1974 23.96 10.88 27.28 Normal<br />
20 1975 21.03 10.88 27.28 Normal<br />
21 1976 17.39 10.88 27.28 Normal<br />
22 1977 14.33 10.88 27.28 Normal<br />
23 1978 21.23 10.88 27.28 Normal<br />
24 1979 26.12 10.88 27.28 Normal<br />
25 1980 11.43 10.88 27.28 Normal<br />
26 1981 25.96 10.88 27.28 Normal<br />
27 1982 24.11 10.88 27.28 Normal<br />
28 1983 7.23 10.88 27.28 Seco<br />
29 1984 27.77 10.88 27.28 Húmedo<br />
30 1985 31.20 10.88 27.28 Húmedo<br />
31 1986 40.04 10.88 27.28 Húmedo<br />
32 1987 15.02 10.88 27.28 Normal<br />
33 1988 20.97 10.88 27.28 Normal<br />
34 1989 11.68 10.88 27.28 Normal<br />
35 1990 8.23 10.88 27.28 Seco<br />
36 1991 12.15 10.88 27.28 Normal<br />
37 1992 12.56 10.88 27.28 Normal<br />
38 1993 17.51 10.88 27.28 Normal<br />
39 1994 26.25 10.88 27.28 Normal<br />
40 1995 13.61 10.88 27.28 Normal<br />
41 1996 10.47 10.88 27.28 Seco<br />
42 1997 27.57 10.88 27.28 Húmedo<br />
43 1998 10.00 10.88 27.28 Seco<br />
44 1999 12.85 10.88 27.28 Normal<br />
45 2000 12.97 10.88 27.28 Normal<br />
46 2001 34.11 10.88 27.28 Húmedo<br />
47 2002 31.01 10.88 27.28 Húmedo<br />
48 2003 40.50 10.88 27.28 Húmedo<br />
49 2004 27.45 10.88 27.28 Húmedo<br />
50 2005 16.74 10.88 27.28 Normal<br />
51 2006 20.40 10.88 27.28 Normal<br />
52 2007 20.69 10.88 27.28 Normal<br />
53 <strong>2008</strong> 11.47 10.88 27.28 Normal<br />
54 2009 10.77 10.88 27.28 Seco<br />
Promedio<br />
Desvest<br />
Descargas medias<br />
anuales<br />
(m 3 /s)<br />
19.08<br />
8.20<br />
Límite entre el<br />
pe<strong>río</strong>do seco y<br />
normal (m 3 /s)<br />
Límite entre el<br />
pe<strong>río</strong>do húmedo<br />
y normal (m 3 /s)<br />
C<strong>la</strong>sificación<br />
hidrológica <strong>de</strong>l<br />
año<br />
MINAG-ANA-DCPRH-AGUAS SUPERFICIALES Pág.372
<strong>Estudio</strong> <strong>Hidrológico</strong> <strong>de</strong> <strong>la</strong>s <strong>Cuenca</strong>s Huancané y Suches 2010<br />
Descarga (m 3 /s)<br />
Descarga (m 3 /s)<br />
45.0<br />
40.0<br />
35.0<br />
30.0<br />
25.0<br />
20.0<br />
15.0<br />
10.0<br />
5.0<br />
0.0<br />
25.0<br />
20.0<br />
15.0<br />
10.0<br />
5.0<br />
0.0<br />
1955<br />
1955<br />
Figura Nº 11.26 Años secos y húmedos <strong>de</strong> <strong>la</strong> serie anual <strong>de</strong> <strong>la</strong>s <strong>de</strong>scargas medias<br />
<strong>Cuenca</strong> <strong>de</strong>l <strong>río</strong> Huancané<br />
Pe<strong>río</strong>do Normal<br />
1957<br />
1959<br />
1961<br />
1963<br />
1965<br />
1967<br />
1969<br />
1971<br />
1973<br />
1975<br />
Pe<strong>río</strong>do Húmedo<br />
Pe<strong>río</strong>do Seco<br />
1977<br />
1979<br />
Tiempo (año)<br />
MINAG-ANA-DCPRH-AGUAS SUPERFICIALES Pág.373<br />
1981<br />
1983<br />
1985<br />
1987<br />
1989<br />
1991<br />
1993<br />
1995<br />
1997<br />
Qmedias Anuales Media<br />
1999<br />
Limite pe<strong>río</strong>do seco Limite pe<strong>río</strong>do húmedo<br />
Figura Nº 11.27 Años secos y húmedos <strong>de</strong> <strong>la</strong> serie anual <strong>de</strong> <strong>la</strong>s <strong>de</strong>scargas medias<br />
<strong>Cuenca</strong> <strong>de</strong>l <strong>río</strong> Suches<br />
Pe<strong>río</strong>do Normal<br />
1957<br />
1959<br />
1961<br />
1963<br />
1965<br />
1967<br />
1969<br />
1971<br />
1973<br />
Pe<strong>río</strong>do Húmedo<br />
1975<br />
Pe<strong>río</strong>do Seco<br />
1977<br />
1979<br />
Tiempo (año)<br />
1981<br />
1983<br />
1985<br />
1987<br />
1989<br />
1991<br />
1993<br />
1995<br />
1997<br />
Qmedias Anuales Media<br />
1999<br />
Limite pe<strong>río</strong>do seco Limite pe<strong>río</strong>do húmedo<br />
2001<br />
2001<br />
2003<br />
2003<br />
2005<br />
2005<br />
2007<br />
2007<br />
2009<br />
2009
<strong>Estudio</strong> <strong>Hidrológico</strong> <strong>de</strong> <strong>la</strong>s <strong>Cuenca</strong>s Huancané y Suches 2010<br />
Cuadro Nº 11.23 Análisis <strong>de</strong> los pe<strong>río</strong>dos secos y húmedos <strong>de</strong> <strong>la</strong> serie anual <strong>de</strong> <strong>la</strong>s <strong>de</strong>scargas medias<br />
<strong>Cuenca</strong> <strong>de</strong>l <strong>río</strong> Suches<br />
Nº Año<br />
1 1956 12.86 7.79 13.73 Normal<br />
2 1957 12.09 7.79 13.73 Normal<br />
3 1958 12.38 7.79 13.73 Normal<br />
4 1959 8.53 7.79 13.73 Normal<br />
5 1960 9.79 7.79 13.73 Normal<br />
6 1961 8.67 7.79 13.73 Normal<br />
7 1962 7.65 7.79 13.73 Seco<br />
8 1963 6.21 7.79 13.73 Seco<br />
9 1964 8.86 7.79 13.73 Normal<br />
10 1965 7.57 7.79 13.73 Seco<br />
11 1966 9.30 7.79 13.73 Normal<br />
12 1967 14.21 7.79 13.73 Húmedo<br />
13 1968 15.94 7.79 13.73 Húmedo<br />
14 1969 8.97 7.79 13.73 Normal<br />
15 1970 7.64 7.79 13.73 Seco<br />
16 1971 6.58 7.79 13.73 Seco<br />
17 1972 6.93 7.79 13.73 Seco<br />
18 1973 11.99 7.79 13.73 Normal<br />
19 1974 7.96 7.79 13.73 Normal<br />
20 1975 12.26 7.79 13.73 Normal<br />
21 1976 10.31 7.79 13.73 Normal<br />
22 1977 9.11 7.79 13.73 Normal<br />
23 1978 10.81 7.79 13.73 Normal<br />
24 1979 12.85 7.79 13.73 Normal<br />
25 1980 12.14 7.79 13.73 Normal<br />
26 1981 9.42 7.79 13.73 Normal<br />
27 1982 8.41 7.79 13.73 Normal<br />
28 1983 14.36 7.79 13.73 Húmedo<br />
29 1984 20.29 7.79 13.73 Húmedo<br />
30 1985 14.25 7.79 13.73 Húmedo<br />
31 1986 6.15 7.79 13.73 Seco<br />
32 1987 11.24 7.79 13.73 Normal<br />
33 1988 8.35 7.79 13.73 Normal<br />
34 1989 5.54 7.79 13.73 Seco<br />
35 1990 13.01 7.79 13.73 Normal<br />
36 1991 6.86 7.79 13.73 Seco<br />
37 1992 14.34 7.79 13.73 Húmedo<br />
38 1993 8.90 7.79 13.73 Normal<br />
39 1994 12.93 7.79 13.73 Normal<br />
40 1995 15.39 7.79 13.73 Húmedo<br />
41 1996 11.11 7.79 13.73 Normal<br />
42 1997 12.89 7.79 13.73 Normal<br />
43 1998 9.96 7.79 13.73 Normal<br />
44 1999 10.61 7.79 13.73 Normal<br />
45 2000 7.74 7.79 13.73 Seco<br />
46 2001 13.53 7.79 13.73 Normal<br />
47 2002 11.09 7.79 13.73 Normal<br />
48 2003 9.52 7.79 13.73 Normal<br />
49 2004 14.58 7.79 13.73 Húmedo<br />
50 2005 10.73 7.79 13.73 Normal<br />
51 2006 9.90 7.79 13.73 Normal<br />
52 2007 11.62 7.79 13.73 Normal<br />
53 <strong>2008</strong> 14.51 7.79 13.73 Húmedo<br />
54 2009 12.46 7.79 13.73 Normal<br />
Promedio<br />
Desvest<br />
Descargas medias<br />
anuales<br />
(m 3 /s)<br />
10.76<br />
2.97<br />
Límite entre el<br />
pe<strong>río</strong>do seco y<br />
normal (m 3 /s)<br />
Límite entre el<br />
pe<strong>río</strong>do húmedo y<br />
normal (m 3 /s)<br />
C<strong>la</strong>sificación<br />
hidrológica <strong>de</strong>l<br />
año<br />
MINAG-ANA-DCPRH-AGUAS SUPERFICIALES Pág.374
<strong>Estudio</strong> <strong>Hidrológico</strong> <strong>de</strong> <strong>la</strong>s <strong>Cuenca</strong>s Huancané y Suches 2010<br />
CAPÍTULO XII<br />
PROPUESTA DE REPRESAMIENTO HÍDRICO EN LA<br />
CUENCA<br />
12.1 GENERALIDADES<br />
Los recursos hídricos en <strong>la</strong>s cuencas Huancané y Suches, en los últimos años viene<br />
disminuyendo pau<strong>la</strong>tinamente, afectado por el cambio climático y calentamiento global <strong>de</strong>l<br />
medio ambiente, por lo que en años veni<strong>de</strong>ros se generaría el déficit <strong>de</strong>l recurso hídrico en<br />
<strong>la</strong>s cuencas y es <strong>de</strong> suma importancia realizar el represamiento <strong>de</strong> agua en embalses en<br />
épocas <strong>de</strong> avenida para suplir el déficit hídrico en épocas <strong>de</strong> estiaje, y así garantizar el<br />
suministro <strong>de</strong>l recurso preciado para uso agríco<strong>la</strong>, pob<strong>la</strong>cional, pecuario, etc.<br />
Bajo este contexto, en el presente estudio se ha p<strong>la</strong>nteado realizar <strong>la</strong> propuesta <strong>de</strong><br />
represamiento <strong>de</strong> agua, en embalses <strong>de</strong> regu<strong>la</strong>ción en <strong>la</strong>s subcuencas con <strong>la</strong>s condiciones<br />
topográficas y geológicas favorables para el almacenamiento <strong>de</strong> agua.<br />
12.2 PROPUESTA DE EMBALSES DE REGULACIÓN DEL RECURSO<br />
HÍDRICO EN LA CUENCA<br />
Mediante los trabajos <strong>de</strong> campo realizados en <strong>la</strong>s cuencas Huancané y Suches, se ha<br />
i<strong>de</strong>ntificado dos (2) vasos con condiciones topográficas y geológicas favorables para el<br />
almacenamiento <strong>de</strong> agua. Estos vasos se encuentran ubicadas en <strong>la</strong>s subcuencas <strong>de</strong>l <strong>río</strong><br />
Muñani y Tuyto, correspondientes a <strong>la</strong> cuenca Huancané.<br />
Las coor<strong>de</strong>nadas (UTM WGS 84) <strong>de</strong> ubicación <strong>de</strong>l eje <strong>de</strong> los vasos, es <strong>la</strong> siguiente:<br />
Vaso Cal<strong>la</strong>tomaza: Este : 394889<br />
Norte : 8381226<br />
Altitud : 4154.0 msnm<br />
Río : Guanaco<br />
Vaso Yaputira: Este : 449094<br />
Norte : 8327251<br />
Altitud : 3980.0 m<br />
Río : Yaputira<br />
Los parámetros físicos <strong>de</strong> <strong>la</strong>s subcuencas <strong>de</strong>l <strong>río</strong> Guanaco y Yaputira, se presentaron en el<br />
Capítulo 3, ítem 3.5.3.<br />
Los Vasos Cal<strong>la</strong>tomaza y Yaputira, se ha priorizado para realizar estudios <strong>de</strong><br />
almacenamiento <strong>de</strong> agua, que consiste en <strong>de</strong>terminar <strong>la</strong> capacidad <strong>de</strong> embalse <strong>de</strong>s<strong>de</strong> el<br />
punto <strong>de</strong> vista hidrológico y topográfico. Ver Mapas Nº 12.2 y 12.3.<br />
MINAG-ANA-DCPRH-AGUAS SUPERFICIALES Pág.375
<strong>Estudio</strong> <strong>Hidrológico</strong> <strong>de</strong> <strong>la</strong>s <strong>Cuenca</strong>s Huancané y Suches 2010<br />
Mapa Nº 12.1 Ubicación <strong>de</strong> <strong>la</strong>s subcuencas <strong>de</strong>l <strong>río</strong> Guanaco y Yaputira en <strong>la</strong> cuenca Huancané<br />
MINAG-ANA-DCPRH-AGUAS SUPERFICIALES Pág.376
<strong>Estudio</strong> <strong>Hidrológico</strong> <strong>de</strong> <strong>la</strong>s <strong>Cuenca</strong>s Huancané y Suches 2010<br />
Mapa Nº 12.2 Ubicación <strong>de</strong>l embalse Cal<strong>la</strong>tomaza en <strong>la</strong> subcuenca <strong>de</strong>l <strong>río</strong> Guanaco<br />
Mapa Nº 12.3 Ubicación <strong>de</strong>l embalse Yaputira en <strong>la</strong> subcuenca <strong>de</strong>l <strong>río</strong> Yaputira<br />
MINAG-ANA-DCPRH-AGUAS SUPERFICIALES Pág.377
<strong>Estudio</strong> <strong>Hidrológico</strong> <strong>de</strong> <strong>la</strong>s <strong>Cuenca</strong>s Huancané y Suches 2010<br />
12.3 DETERMINACIÓN DE LA CAPACIDAD DE EMBALSE<br />
En realidad, un problema general en <strong>la</strong> p<strong>la</strong>nificación <strong>de</strong> los recursos hídricos es <strong>la</strong><br />
<strong>de</strong>terminación <strong>de</strong> <strong>la</strong>s capacida<strong>de</strong>s <strong>de</strong> almacenamiento <strong>de</strong> los embalses que lo componen.<br />
Des<strong>de</strong> el punto <strong>de</strong> vista hidrológico, <strong>la</strong> <strong>de</strong>terminación <strong>de</strong> <strong>la</strong> capacidad <strong>de</strong> embalse, no<br />
incluye los aspectos <strong>de</strong> topografía, geología, selección <strong>de</strong>l tipo <strong>de</strong> presa (<strong>de</strong> tierra, gravedad,<br />
arco, etc.), ni el cálculo estructural <strong>de</strong> <strong>la</strong> misma; es <strong>de</strong>cir, <strong>la</strong> función principal es almacenar<br />
el agua en épocas o pe<strong>río</strong>dos que se presentan excesos (en que no hay <strong>de</strong>mandas), para<br />
entregar en épocas <strong>de</strong> alta necesidad.<br />
El método a<strong>de</strong>cuado es el método experimental - rango ajustado, que a continuación se<br />
<strong>de</strong>tal<strong>la</strong> en forma breve.<br />
12.3.1 Método experimental - Rango ajustado<br />
El método experimental ó generación <strong>de</strong> series sintéticas, trata <strong>de</strong> resolver el problema <strong>de</strong><br />
embalses por medio <strong>de</strong> <strong>la</strong> generación <strong>de</strong> varias muestras <strong>de</strong> secuencias <strong>de</strong> caudales<br />
estadísticamente semejantes a los registros históricos y a partir <strong>de</strong> <strong>la</strong>s cuales se <strong>de</strong>terminan<br />
los momentos (media, <strong>de</strong>sviación estándar, etc) y <strong>la</strong>s funciones <strong>de</strong> distribución <strong>de</strong><br />
probabilida<strong>de</strong>s <strong>de</strong> <strong>la</strong>s variables re<strong>la</strong>cionadas con <strong>la</strong> <strong>de</strong>terminación <strong>de</strong> <strong>la</strong> capacidad óptima<br />
<strong>de</strong> un embalse. Estadísticamente es l<strong>la</strong>mado el Método <strong>de</strong> Monte Carlo e hidrológicamente<br />
se conoce como hidrología sintética o generación <strong>de</strong> datos, y como simu<strong>la</strong>ción estocástica.<br />
A.- Características <strong>de</strong>l método experimental<br />
Según Aliaga [1985], <strong>la</strong>s características <strong>de</strong>l método experimental es <strong>la</strong> siguiente:<br />
1. Se basa en <strong>la</strong> generación <strong>de</strong> series sintéticas.<br />
2. Usa cualquier ecuación diferencial <strong>de</strong> almacenamiento.<br />
3. Se <strong>de</strong>termina experimentalmente el valor esperado y <strong>la</strong> varianza <strong>de</strong> <strong>la</strong><br />
capacidad <strong>de</strong> almacenamiento.<br />
4. Se <strong>de</strong>termina m capacida<strong>de</strong>s <strong>de</strong> embalse como series generadas se dispone.<br />
5. Se <strong>de</strong>termina <strong>la</strong> capacidad <strong>de</strong> almacenamiento para una longitud igual a <strong>la</strong><br />
vida útil <strong>de</strong>l proyecto.<br />
6. Los procesos <strong>de</strong> entrada son tratados como proceso periódico -estocástico.<br />
7. Permite <strong>la</strong> extracción regional óptima <strong>de</strong> información con los mo<strong>de</strong>los<br />
matemáticos y análisis regional <strong>de</strong> parámetros.<br />
8. Permite una mayor con<strong>de</strong>nsación <strong>de</strong> <strong>la</strong> información:<br />
- Por un conjunto <strong>de</strong> ecuaciones matemáticas <strong>de</strong>l proceso.<br />
- Conservación <strong>de</strong>l índice <strong>de</strong> parsimonia en el número <strong>de</strong> parámetros.<br />
- Mo<strong>de</strong>los regionales para los parámetros.<br />
B.- Ventajas <strong>de</strong>l método<br />
La principal ventaja <strong>de</strong>l método experimental es que se obtienen varias capacida<strong>de</strong>s <strong>de</strong><br />
almacenamiento, lo cual permite una mayor flexibilidad en <strong>la</strong> toma <strong>de</strong> <strong>de</strong>cisiones y se<br />
MINAG-ANA-DCPRH-AGUAS SUPERFICIALES Pág.378
<strong>Estudio</strong> <strong>Hidrológico</strong> <strong>de</strong> <strong>la</strong>s <strong>Cuenca</strong>s Huancané y Suches 2010<br />
pue<strong>de</strong> optimizar dicha capacidad combinándolo con los <strong>de</strong>más aspectos <strong>de</strong> ingeniería y con<br />
los costos y beneficios respectivos.<br />
C.- Definición <strong>de</strong> términos<br />
El método experimental <strong>de</strong>nominado también método <strong>de</strong>l “RANGE”, se presenta para<br />
<strong>de</strong>terminar <strong>la</strong> capacidad <strong>de</strong> un embalse <strong>de</strong> regu<strong>la</strong>ción no anual, el cual está <strong>de</strong>finido por <strong>la</strong>s<br />
variables Rango o Rango Ajustado que a continuación se <strong>de</strong>finen.<br />
En un almacenamiento el problema físico que se genera pue<strong>de</strong> representarse<br />
esquemáticamente como:<br />
Entradas Sistema Salidas<br />
Esquema Nº 1<br />
La re<strong>la</strong>ción básica entre el caudal <strong>de</strong> entrada, <strong>la</strong> salida y el almacenamiento es expresada<br />
por <strong>la</strong> ecuación matemática <strong>de</strong> almacenamiento (ecuación <strong>de</strong> diferencias):<br />
X<br />
t<br />
*<br />
ΔS<br />
Yt<br />
<br />
(1)<br />
Δt<br />
Don<strong>de</strong>:<br />
X = Caudal <strong>de</strong> entrada neta (secuencia <strong>de</strong> gastos disponibles).<br />
t<br />
t<br />
Xt<br />
Y = Caudal <strong>de</strong> salida (secuencia <strong>de</strong> <strong>de</strong>manda).<br />
*<br />
S = Capacidad <strong>de</strong> almacenamiento <strong>de</strong>l embalse.<br />
t = Tiempo.<br />
Si el incremento <strong>de</strong> tiempo Δt 1,<br />
en este caso un mes, <strong>la</strong> Ec.(1), pue<strong>de</strong> ser expresada<br />
como:<br />
* * *<br />
Xt Yt<br />
ΔS ΔSt<br />
ΔSt1<br />
ó (2)<br />
*<br />
S<br />
*<br />
S X Y<br />
t t<br />
1<br />
<br />
t<br />
t<br />
S * Yt<br />
La Ec.(2), constituye <strong>la</strong> ecuación general estocástica <strong>de</strong> almacenamiento.<br />
Como se trata <strong>de</strong> una regu<strong>la</strong>ción no anual (mensual), X t es una secuencia <strong>de</strong> caudales<br />
mensuales e t Y pue<strong>de</strong> ser valores medios <strong>de</strong> X t , esto significa que se va entregar cada<br />
mes una cantidad periódica <strong>de</strong> igual a <strong>la</strong> media pob<strong>la</strong>cional μ x o media muestral δ n .<br />
La<br />
forma general <strong>de</strong> Y t , se pue<strong>de</strong> escribirse como:<br />
MINAG-ANA-DCPRH-AGUAS SUPERFICIALES Pág.379
<strong>Estudio</strong> <strong>Hidrológico</strong> <strong>de</strong> <strong>la</strong>s <strong>Cuenca</strong>s Huancané y Suches 2010<br />
Yt α.δ n<br />
Don<strong>de</strong>:<br />
(3)<br />
Y = Variable <strong>de</strong> salida <strong>de</strong>l sistema.<br />
t<br />
δ t = Promedio <strong>de</strong> <strong>la</strong>s entradas al sistema.<br />
α<br />
α 1<br />
= Factor <strong>de</strong> regu<strong>la</strong>ción.<br />
Si α 1,<br />
entonces es una regu<strong>la</strong>ción total.<br />
Si α 1,<br />
entonces es una regu<strong>la</strong>ción parcial.<br />
Si t δn<br />
α , los<br />
términos son expresados con asteriscos (*) y se <strong>de</strong>nominan variables ajustadas, en caso<br />
*<br />
contrario se nombra en forma simple, así S representa <strong>la</strong> suma parcial ajustada y S<br />
representa <strong>la</strong> suma parcial. Para este caso <strong>la</strong> Ec.(2) se pue<strong>de</strong> representar por:<br />
Y , es <strong>de</strong>cir, se disponen <strong>de</strong> datos <strong>de</strong> una muestra y es regu<strong>la</strong>ción total 1<br />
*<br />
t<br />
*<br />
t 1<br />
X Xn<br />
<br />
S S <br />
(4)<br />
t<br />
Don<strong>de</strong>:<br />
S = Capacidad <strong>de</strong>l embalse ó suma parcial ajustada en el tiempo t .<br />
*<br />
t<br />
X = Entradas al sistema.<br />
t<br />
X n = Salidas <strong>de</strong>l sistema.<br />
t = 1, 2,…..., n<br />
*<br />
El valor <strong>de</strong>l Rango Ajustado R se <strong>de</strong>termina según:<br />
R M m<br />
(5)<br />
*<br />
n<br />
*<br />
n<br />
*<br />
n<br />
Don<strong>de</strong>:<br />
*<br />
R = Rango ajustado.<br />
n<br />
*<br />
n<br />
*<br />
n<br />
M = Valor máximo <strong>de</strong> <strong>la</strong>s sumas parciales ajustadas (máximo exceso).<br />
M máx<br />
*<br />
n<br />
*<br />
n<br />
* * *<br />
*<br />
S , S , S ,......... ., S <br />
0<br />
1<br />
2<br />
n<br />
m = Valor mínimo <strong>de</strong> <strong>la</strong>s sumas parciales ajustadas (máximo déficit).<br />
m mín<br />
* * *<br />
*<br />
S , S , S ,......... ., S <br />
0<br />
1<br />
2<br />
n<br />
*<br />
La variable R n se <strong>de</strong>nomina el "Rango Ajustado" y representa <strong>la</strong> mínima capacidad <strong>de</strong><br />
almacenamiento requerida <strong>de</strong> manera que el embalse no se rebalse ni se queda seco durante<br />
el pe<strong>río</strong>do <strong>de</strong> n años.<br />
Por lo tanto <strong>la</strong> capacidad <strong>de</strong> embalse, en una regu<strong>la</strong>ción total no anual (mensual) es igual al<br />
Rango Ajustado, esta variable proporciona o mi<strong>de</strong> <strong>la</strong> capacidad <strong>de</strong>l embalse necesario y el<br />
valor <strong>de</strong> <strong>la</strong>s salidas es igual al promedio <strong>de</strong> <strong>la</strong>s entradas.<br />
t n X X , 1<br />
α (regu<strong>la</strong>ción total).<br />
MINAG-ANA-DCPRH-AGUAS SUPERFICIALES Pág.380
<strong>Estudio</strong> <strong>Hidrológico</strong> <strong>de</strong> <strong>la</strong>s <strong>Cuenca</strong>s Huancané y Suches 2010<br />
Entonces <strong>la</strong> capacidad <strong>de</strong> embalse es:<br />
CAP.EMB. R<br />
(6)<br />
*<br />
n<br />
En <strong>la</strong> Figura Nº 12.1, se presenta gráficamente los términos <strong>de</strong>l Rango Ajustado en caso <strong>de</strong><br />
regu<strong>la</strong>ciones totales.<br />
D.- Valor esperado y varianza <strong>de</strong> <strong>la</strong> capacidad <strong>de</strong> un embalse<br />
Debido a que hay infinitas posibles secuencias <strong>de</strong> caudales X 1,<br />
X2<br />
, X3,........,<br />
Xn<br />
; entonces<br />
* * *<br />
*<br />
hay infinitas posibles secuencias <strong>de</strong> S , S , S ,......... ..S , <strong>la</strong>s cuales producen infinitos<br />
1<br />
2<br />
posibles valores <strong>de</strong> <strong>la</strong> capacidad <strong>de</strong> almacenamiento *<br />
R . Por lo tanto se necesita consi<strong>de</strong>rar<br />
<strong>la</strong> distribución <strong>de</strong> probabilidad <strong>de</strong> <strong>la</strong> variable<br />
*<br />
*<br />
diseño. El valor esperado E R y <strong>la</strong> varianza R <br />
MINAG-ANA-DCPRH-AGUAS SUPERFICIALES Pág.381<br />
3<br />
*<br />
n<br />
n<br />
n<br />
R <strong>de</strong> manera que se pueda usar para el<br />
n<br />
VAR n han sido obtenidos en forma<br />
exacta y aproximada con <strong>la</strong>s siguientes expresiones:<br />
m<br />
* 1 R n m i<br />
E R<br />
(7)<br />
1<br />
*<br />
i<br />
m<br />
* 1<br />
* *<br />
R R ER<br />
<br />
<br />
i1<br />
VAR n<br />
i n<br />
(8)<br />
m 1<br />
Don<strong>de</strong>:<br />
*<br />
E R n <br />
*<br />
VAR R n <br />
=<br />
=<br />
Valor esperado <strong>de</strong> <strong>la</strong> capacidad <strong>de</strong>l embalse.<br />
Varianza <strong>de</strong> <strong>la</strong> capacidad <strong>de</strong>l embalse.<br />
i = 1, 2,…..., m<br />
m = Total <strong>de</strong> valores <strong>de</strong>l rango ajustado.<br />
El método experimental es el más a<strong>de</strong>cuado para el cálculo <strong>de</strong> <strong>la</strong> capacidad <strong>de</strong><br />
almacenamiento y es el que se ha utilizado fundamentalmente en este trabajo. También<br />
pue<strong>de</strong> usarse en forma combinada el método experimental con el analítico.<br />
2
<strong>Estudio</strong> <strong>Hidrológico</strong> <strong>de</strong> <strong>la</strong>s <strong>Cuenca</strong>s Huancané y Suches 2010<br />
Figura N° 12.1 Método <strong>de</strong>l rango ajustado para <strong>de</strong>terminar <strong>la</strong> capacidad <strong>de</strong> embalse<br />
en regu<strong>la</strong>ción total<br />
S* t<br />
0 1 2 3 4 5 6 7 8 9 10 11 12 13 14<br />
CAP.EMB. =<br />
R *<br />
n<br />
M* R*<br />
n<br />
MINAG-ANA-DCPRH-AGUAS SUPERFICIALES Pág.382<br />
m*<br />
n<br />
S* n<br />
n t<br />
En este caso, teniendo <strong>la</strong> serie mensual <strong>de</strong> <strong>de</strong>scargas X P, τ , generadas por un mo<strong>de</strong>lo<br />
hidrológico; <strong>la</strong> expresión <strong>de</strong> almacenamiento <strong>de</strong>l embalse es el siguiente:<br />
X<br />
t<br />
*<br />
ΔS<br />
Yt<br />
<br />
(9)<br />
Δt<br />
Don<strong>de</strong>:<br />
X = Gasto <strong>de</strong> entrada (secuencia <strong>de</strong> gastos disponibles).<br />
t<br />
t<br />
Y = Gasto <strong>de</strong> salida (secuencia <strong>de</strong> <strong>de</strong>mandas).<br />
*<br />
S = Almacenamiento <strong>de</strong>l embalse.<br />
t = Tiempo.<br />
Consi<strong>de</strong>rando el incremento <strong>de</strong> tiempo Δt 1,<br />
<strong>la</strong> Ec.(9) toma <strong>la</strong> forma:<br />
A<strong>de</strong>más:<br />
* *<br />
Xt Yt<br />
S S<br />
t1<br />
ó (10)<br />
*<br />
S<br />
*<br />
S X Y<br />
t<br />
1<br />
*<br />
n<br />
<br />
t<br />
t<br />
* *<br />
*<br />
0, S , S ,......... ....S <br />
M máx<br />
(11)<br />
*<br />
n<br />
1<br />
2<br />
* *<br />
*<br />
0, S , S ,......... ....S <br />
1<br />
2<br />
n<br />
n<br />
m mín<br />
(12)<br />
R M m<br />
(13)<br />
*<br />
n<br />
*<br />
n<br />
*<br />
n
<strong>Estudio</strong> <strong>Hidrológico</strong> <strong>de</strong> <strong>la</strong>s <strong>Cuenca</strong>s Huancané y Suches 2010<br />
Don<strong>de</strong>:<br />
S = 0<br />
*<br />
0<br />
*<br />
R n = Rango ajustado y representa <strong>la</strong> mínima capacidad <strong>de</strong><br />
*<br />
S =<br />
almacenamiento requerida <strong>de</strong> manera que el embalse no se rebalse ni<br />
queda seco durante el pe<strong>río</strong>do <strong>de</strong> n años <strong>de</strong> análisis proporcionando<br />
<strong>la</strong> <strong>de</strong>manda requerida.<br />
Sumas parciales ajustadas.<br />
n<br />
*<br />
n<br />
*<br />
n<br />
M = Valor máximo <strong>de</strong> <strong>la</strong>s sumas parciales ajustadas.<br />
m = Valor mínimo <strong>de</strong> <strong>la</strong>s sumas parciales ajustadas.<br />
En <strong>la</strong> Figura Nº 12.1 se muestra éstas variables.<br />
El procedimiento <strong>de</strong> cálculo es el siguiente:<br />
1° Disponer <strong>de</strong> <strong>la</strong>s series generadas o históricas P, τ<br />
X , P 1,2, ,......, n , con n<br />
igual al número total <strong>de</strong> años; τ 1,2,...... ...., w , con w igual a los 12 meses<br />
<strong>de</strong>l año.<br />
2° Consi<strong>de</strong>rar <strong>la</strong> regu<strong>la</strong>ción total no anual y que <strong>la</strong>s salidas son iguales al<br />
promedio <strong>de</strong> <strong>la</strong>s entradas, es <strong>de</strong>cir, Yt δn<br />
.<br />
3° Calcu<strong>la</strong>r <strong>la</strong>s diferencias t t Y X ó X t δn<br />
.<br />
4° Calcu<strong>la</strong>r <strong>la</strong>s sumas parciales ajustadas <strong>de</strong> <strong>la</strong> serie, según.<br />
S 0<br />
*<br />
0 <br />
*<br />
S<br />
*<br />
S X <br />
1<br />
*<br />
2<br />
*<br />
3<br />
0<br />
*<br />
1<br />
*<br />
2<br />
1 δn<br />
<br />
X 2 δn<br />
<br />
X δ <br />
S S <br />
S<br />
S<br />
*<br />
n<br />
S<br />
S<br />
<br />
*<br />
n1<br />
<br />
3<br />
X δ <br />
n<br />
n<br />
(14)<br />
n<br />
5° Hal<strong>la</strong>r los valores máximos y mínimos <strong>de</strong> <strong>la</strong>s sumas parciales ajustadas:<br />
*<br />
y m n .<br />
6° Calcu<strong>la</strong>r el rango ajustado para ésta serie según:<br />
*<br />
R<br />
* *<br />
M m<br />
n<br />
*<br />
t<br />
n<br />
n<br />
7° Graficar S vs t .<br />
8° Repetir los pasos <strong>de</strong>s<strong>de</strong> (1°) hasta (6°) para todas <strong>la</strong>s m series generadas,<br />
obteniendo m valores <strong>de</strong>l rango ajustado, es <strong>de</strong>cir:<br />
* * *<br />
*<br />
R , R , R ,......... ......., R<br />
1<br />
2<br />
3<br />
9° Encontrar <strong>la</strong> distribución <strong>de</strong> probabilida<strong>de</strong>s <strong>de</strong><br />
MINAG-ANA-DCPRH-AGUAS SUPERFICIALES Pág.383<br />
m<br />
R .<br />
10° Determinar el valor esperado y <strong>la</strong> varianza <strong>de</strong>l R con <strong>la</strong>s Ecs.(7) y (8).<br />
*<br />
m<br />
*<br />
m<br />
*<br />
M n
<strong>Estudio</strong> <strong>Hidrológico</strong> <strong>de</strong> <strong>la</strong>s <strong>Cuenca</strong>s Huancané y Suches 2010<br />
12.3.2 Resultados <strong>de</strong> <strong>la</strong> capacidad <strong>de</strong> embalse – Método experimental<br />
En este caso, <strong>la</strong> capacidad <strong>de</strong> embalse <strong>de</strong>s<strong>de</strong> el punto <strong>de</strong> vista hidrológico se ha calcu<strong>la</strong>do<br />
empleando el Método experimental – Rango ajustado, utilizando <strong>la</strong>s series <strong>de</strong> caudales<br />
generados por el mo<strong>de</strong>lo hidrológico <strong>de</strong> Lutz Scholz y mo<strong>de</strong>lo estocástico Markoviano <strong>de</strong><br />
series mensuales <strong>de</strong>l <strong>río</strong> Guanaco (Embalse Cal<strong>la</strong>tomaza) y <strong>río</strong> Yaputira (Embalse<br />
Yaputira).<br />
La capacidad <strong>de</strong> embalse <strong>de</strong>s<strong>de</strong> el punto <strong>de</strong> vista hidrológico calcu<strong>la</strong>do, significa que es <strong>la</strong><br />
cantidad total <strong>de</strong> agua que respon<strong>de</strong> <strong>la</strong> cuenca en términos <strong>de</strong> escorrentía directa.<br />
La capacidad <strong>de</strong> embalse se ha calcu<strong>la</strong>do utilizando el criterio <strong>de</strong> <strong>la</strong> regu<strong>la</strong>ción total <strong>de</strong> <strong>la</strong><br />
cuenca, con el objeto <strong>de</strong> conocer <strong>la</strong> cantidad total <strong>de</strong> agua que respon<strong>de</strong> <strong>la</strong> cuenca en<br />
términos <strong>de</strong> escorrentía.<br />
En a<strong>de</strong><strong>la</strong>nte se muestran el resumen <strong>de</strong> cálculo <strong>de</strong> <strong>la</strong> capacidad <strong>de</strong> embalse <strong>de</strong>s<strong>de</strong> el punto<br />
<strong>de</strong> vista hidrológico, obtenido mediante el método experimental – rango ajustado, para los<br />
Embalses Cal<strong>la</strong>tomaza e Yaputira.<br />
Las sumas parciales y el rango ajustado <strong>de</strong> <strong>la</strong> capacidad <strong>de</strong> embalse, para <strong>la</strong> serie 1 <strong>de</strong> 48<br />
años <strong>de</strong> información <strong>de</strong> <strong>la</strong>s <strong>de</strong>scargas medias en volúmenes generadas con el mo<strong>de</strong>lo<br />
hidrológico <strong>de</strong> Lutz Scholz, se muestra en el Cuadro Nº 12.1 para el Embalse Cal<strong>la</strong>tomaza.<br />
Cuadro Nº 12.1 Sumas parciales y el rango ajustado, serie generada - mo<strong>de</strong>lo hidrológico <strong>de</strong> Lutz Scholz<br />
Método experimental - Rango ajustado (R*) – Embalse Cal<strong>la</strong>tomaza<br />
Serie-1<br />
m<br />
Qprom.<br />
(hm 3 )<br />
Sumas parciales<br />
Máx Mín<br />
Rango ajustado<br />
(R*)<br />
1 2.50 15.95 -0.62 16.57<br />
2 1.57 10.09 -0.72 10.82<br />
3 3.01 22.63 -1.46 24.09<br />
4 3.66 49.87 0.00 49.87<br />
5 4.23 24.19 -50.63 74.81<br />
6 4.74 26.70 -19.96 46.66<br />
7 3.71 26.74 -5.69 32.43<br />
8 3.87 13.60 -29.65 43.25<br />
9 5.14 64.79 0.00 64.79<br />
10 3.03 21.52 -2.66 24.19<br />
11 4.49 33.02 -8.57 41.59<br />
12 4.17 25.26 -23.24 48.50<br />
13 1.99 8.55 -2.41 10.96<br />
14 3.27 20.65 -7.81 28.46<br />
15 3.11 21.63 -0.15 21.78<br />
16 1.78 9.45 -1.49 10.95<br />
Promedio 3.39 34.36<br />
MINAG-ANA-DCPRH-AGUAS SUPERFICIALES Pág.384
<strong>Estudio</strong> <strong>Hidrológico</strong> <strong>de</strong> <strong>la</strong>s <strong>Cuenca</strong>s Huancané y Suches 2010<br />
Volumen (hm 3 )<br />
Figura Nº 12.2 Diagrama <strong>de</strong> volúmenes acumu<strong>la</strong>dos <strong>de</strong>l rango ajustado - Embalse Cal<strong>la</strong>tomaza<br />
(Serie generada con mo<strong>de</strong>lo hidrológico <strong>de</strong> Lutz Scholz)<br />
17<br />
15<br />
13<br />
11<br />
9<br />
7<br />
5<br />
3<br />
1<br />
-1<br />
R* = 16.57 hm3<br />
Ene Mar May Jul Sep Nov Ene Mar May Jul Sep Nov Ene Mar May Jul Sep Nov<br />
Tiempo (meses <strong>de</strong>l año 1-3)<br />
Series1<br />
En el Cuadro Nº 12.2 se muestran el resumen <strong>de</strong> capacida<strong>de</strong>s <strong>de</strong> embalse calcu<strong>la</strong>dos por el<br />
método experimental – rango ajustado, empleando <strong>la</strong>s series <strong>de</strong> caudales medios mensuales<br />
generados por el mo<strong>de</strong>lo hidrológico <strong>de</strong> Lutz Scholz y el mo<strong>de</strong>lo estocástico Markoviano<br />
<strong>de</strong> series mensuales, en el <strong>río</strong> Guanaco (Embalse Cal<strong>la</strong>tomaza) y <strong>río</strong> Yaputira (Embalse<br />
Yaputira).<br />
Con <strong>la</strong> información <strong>de</strong> capacida<strong>de</strong>s <strong>de</strong> embalse obtenidas en el Cuadro Nº 12.2, se ha<br />
<strong>de</strong>sarrol<strong>la</strong>do el análisis <strong>de</strong> persistencia al 75 % <strong>de</strong> probabilidad <strong>de</strong> <strong>la</strong>s capacida<strong>de</strong>s <strong>de</strong><br />
embalse, empleando el método <strong>de</strong> análisis <strong>de</strong> frecuencia con <strong>la</strong> fórmu<strong>la</strong> <strong>de</strong> Weibull;<br />
a<strong>de</strong>más se muestra <strong>la</strong> capacidad <strong>de</strong> embalse máxima y mínima, valor esperado (promedio)<br />
y varianza <strong>de</strong>l rango ajustado (R*), tal como se muestra en el Cuadro Nº 12.3.<br />
En <strong>la</strong>s Figuras N° 12.3 y 12.4 se muestra <strong>la</strong> curva <strong>de</strong> frecuencia <strong>de</strong> <strong>la</strong>s capacida<strong>de</strong>s <strong>de</strong><br />
embalse y el volumen al 75% <strong>de</strong> persistencia para los Embalses Cal<strong>la</strong>tomaza e Yaputira.<br />
MINAG-ANA-DCPRH-AGUAS SUPERFICIALES Pág.385
<strong>Estudio</strong> <strong>Hidrológico</strong> <strong>de</strong> <strong>la</strong>s <strong>Cuenca</strong>s Huancané y Suches 2010<br />
Cuadro Nº 12.2 Resumen <strong>de</strong> capacidad <strong>de</strong> embalse - Método Experimental - Rango Ajustado<br />
Nº Serie<br />
generada<br />
EMBALSE CALLATOMAZA<br />
Capacidad <strong>de</strong> embalse (hm3)<br />
Descargas generadas<br />
Mo<strong>de</strong>lo <strong>Hidrológico</strong><br />
<strong>de</strong> Lutz Scholz<br />
Mo<strong>de</strong>lo Estocástico<br />
Markoviano <strong>de</strong> primer<br />
or<strong>de</strong>n<br />
Nº Serie<br />
generada<br />
EMBALSE YAPUTIRA<br />
Capacidad <strong>de</strong> embalse (hm3)<br />
Mo<strong>de</strong>lo <strong>Hidrológico</strong><br />
<strong>de</strong> Lutz Scholz<br />
Descargas generadas<br />
Mo<strong>de</strong>lo Estocástico<br />
Markoviano <strong>de</strong> primer<br />
or<strong>de</strong>n<br />
1 34.36 34.56 1 33.45 33.05<br />
2 29.80 2 38.32<br />
3 31.51 3 34.30<br />
4 27.58 4 38.52<br />
5 31.58 5 32.35<br />
6 29.88 6 36.76<br />
7 33.04 7 29.68<br />
8 27.75 8 39.26<br />
9 32.59 9 41.51<br />
10 37.42 10 35.10<br />
11 35.60 11 40.52<br />
12 31.66 12 40.49<br />
13 35.38 13 33.24<br />
14 32.44 14 34.00<br />
15 30.86 15 39.44<br />
16 37.59 16 33.32<br />
17 34.47 17 37.83<br />
18 31.75 18 31.44<br />
19 34.08 19 38.02<br />
20 34.55 20 33.92<br />
21 31.41 21 35.16<br />
22 31.76 22 35.31<br />
23 31.54 23 33.58<br />
24 30.98 24 37.55<br />
25 31.03 25 32.29<br />
26 33.31 26 39.25<br />
27 33.55 27 37.35<br />
28 38.19 28 31.13<br />
29 31.00 29 34.82<br />
30 30.49 30 39.36<br />
31 35.07 31 39.59<br />
32 35.85 32 32.66<br />
33 32.62 33 34.94<br />
34 32.43 34 35.58<br />
35 36.16 35 37.51<br />
36 29.32 36 38.26<br />
37 29.10 37 37.52<br />
38 34.70 38 36.91<br />
39 30.51 39 36.19<br />
40 32.46 40 37.44<br />
41 33.25 41 35.63<br />
42 28.53 42 37.46<br />
43 32.86 43 36.83<br />
44 32.82 44 36.44<br />
45 33.33 45 34.75<br />
46 33.43 46 36.59<br />
47 35.45 47 34.74<br />
48 32.88 48 38.33<br />
49 30.83 49 37.29<br />
50 34.94 50 35.65<br />
MINAG-ANA-DCPRH-AGUAS SUPERFICIALES Pág.386
<strong>Estudio</strong> <strong>Hidrológico</strong> <strong>de</strong> <strong>la</strong>s <strong>Cuenca</strong>s Huancané y Suches 2010<br />
m<br />
Cuadro Nº 12.3 Análisis <strong>de</strong> persistencia <strong>de</strong> <strong>la</strong>s capacida<strong>de</strong>s <strong>de</strong> embalse<br />
EMBALSE CALLATOMAZA EMBALSE YAPUTIRA<br />
Volumen<br />
(hm3)<br />
1 34.36 38.19 1.90 1 33.45 41.51 1.90<br />
2 34.56 37.59 3.80 2 33.05 40.52 3.80<br />
3 29.80 37.42 5.80 3 38.32 40.49 5.80<br />
4 31.51 36.16 7.70 4 34.30 39.59 7.70<br />
5 27.58 35.85 9.60 5 38.52 39.44 9.60<br />
6 31.58 35.60 11.50 6 32.35 39.36 11.50<br />
7 29.88 35.45 13.50 7 36.76 39.26 13.50<br />
8 33.04 35.38 15.40 8 29.68 39.25 15.40<br />
9 27.75 35.07 17.30 9 39.26 38.52 17.30<br />
10 32.59 34.94 19.20 10 41.51 38.33 19.20<br />
11 37.42 34.70 21.20 11 35.10 38.32 21.20<br />
12 35.60 34.56 23.10 12 40.52 38.26 23.10<br />
13 31.66 34.55 25.00 13 40.49 38.02 25.00<br />
14 35.38 34.47 26.90 14 33.24 37.83 26.90<br />
15 32.44 34.36 28.80 15 34.00 37.55 28.80<br />
16 30.86 34.08 30.80 16 39.44 37.52 30.80<br />
17 37.59 33.55 32.70 17 33.32 37.51 32.70<br />
18 34.47 33.43 34.60 18 37.83 37.46 34.60<br />
19 31.75 33.33 36.50 19 31.44 37.44 36.50<br />
20 34.08 33.31 38.50 20 38.02 37.35 38.50<br />
21 34.55 33.25 40.40 21 33.92 37.29 40.40<br />
22 31.41 33.04 42.30 22 35.16 36.91 42.30<br />
23 31.76 32.88 44.20 23 35.31 36.83 44.20<br />
24 31.54 32.86 46.20 24 33.58 36.76 46.20<br />
25 30.98 32.82 48.10 25 37.55 36.59 48.10<br />
26 31.03 32.62 50.00 26 32.29 36.44 50.00<br />
27 33.31 32.59 51.90 27 39.25 36.19 51.90<br />
28 33.55 32.46 53.80 28 37.35 35.65 53.80<br />
29 38.19 32.44 55.80 29 31.13 35.63 55.80<br />
30 31.00 32.43 57.70 30 34.82 35.58 57.70<br />
31 30.49 31.76 59.60 31 39.36 35.31 59.60<br />
32 35.07 31.75 61.50 32 39.59 35.16 61.50<br />
33 35.85 31.66 63.50 33 32.66 35.10 63.50<br />
34 32.62 31.58 65.40 34 34.94 34.94 65.40<br />
35 32.43 31.54 67.30 35 35.58 34.82 67.30<br />
36 36.16 31.51 69.20 36 37.51 34.75 69.20<br />
37 29.32 31.41 71.20 37 38.26 34.74 71.20<br />
38 29.10 31.03 73.10 38 37.52 34.30 73.10<br />
39 34.70 31.00 75.00 39 36.91 34.00 75.00<br />
40 30.51 30.98 76.90 40 36.19 33.92 76.90<br />
41 32.46 30.86 78.80 41 37.44 33.58 78.80<br />
42 33.25 30.83 80.80 42 35.63 33.45 80.80<br />
43 28.53 30.51 82.70 43 37.46 33.32 82.70<br />
44 32.86 30.49 84.60 44 36.83 33.24 84.60<br />
45 32.82 29.88 86.50 45 36.44 33.05 86.50<br />
46 33.33 29.80 88.50 46 34.75 32.66 88.50<br />
47 33.43 29.32 90.40 47 36.59 32.35 90.40<br />
48 35.45 29.10 92.30 48 34.74 32.29 92.30<br />
49 32.88 28.53 94.20 49 38.33 31.44 94.20<br />
50 30.83 27.75 96.20 50 37.29 31.13 96.20<br />
51 34.94 27.58 98.10 51 35.65 29.68 98.10<br />
Promedio E[R * ] 32.71 Promedio E[R * n<br />
n]<br />
36.09<br />
VAR [R * ] 5.92 VAR [R * n<br />
n]<br />
7.05<br />
Máx 38.19 Máx 41.51<br />
Mín 27.58 Mín 29.68<br />
Persistencia al 75 % <strong>de</strong> probabilidad<br />
V 75% =<br />
Volumen<br />
or<strong>de</strong>nado en<br />
forma <strong>de</strong>creciente<br />
Probabilidad<br />
(Weibull)<br />
%<br />
31.00 hm 3 34.00 hm 3<br />
V75% =<br />
MINAG-ANA-DCPRH-AGUAS SUPERFICIALES Pág.387<br />
m<br />
Volumen<br />
(hm3)<br />
Volumen<br />
or<strong>de</strong>nado en<br />
forma <strong>de</strong>creciente<br />
Persistencia al 75 % <strong>de</strong> probabilidad<br />
Probabilidad<br />
(Weibull)<br />
%
<strong>Estudio</strong> <strong>Hidrológico</strong> <strong>de</strong> <strong>la</strong>s <strong>Cuenca</strong>s Huancané y Suches 2010<br />
Volumen (hm 3 )<br />
Volumen (hm 3 )<br />
Figura Nº 12.3 Curva <strong>de</strong> frecuencia <strong>de</strong> <strong>la</strong>s capacida<strong>de</strong>s <strong>de</strong> embalse - Embalse Cal<strong>la</strong>tomaza<br />
40.0<br />
38.0<br />
36.0<br />
34.0<br />
32.0<br />
30.0<br />
28.0<br />
26.0<br />
31.0 hm3<br />
0 10 20 30 40 50 60 70 75 80 90 100<br />
Probabilidad (%)<br />
Figura Nº 12.4 Curva <strong>de</strong> frecuencia <strong>de</strong> <strong>la</strong>s capacida<strong>de</strong>s <strong>de</strong> embalse - Embalse Yaputira<br />
44.0<br />
42.0<br />
40.0<br />
38.0<br />
36.0<br />
34.0<br />
32.0<br />
30.0<br />
28.0<br />
34.0 hm3<br />
0 10 20 30 40 50 60 70 75 80 90 100<br />
Probabilidad (%)<br />
MINAG-ANA-DCPRH-AGUAS SUPERFICIALES Pág.388
<strong>Estudio</strong> <strong>Hidrológico</strong> <strong>de</strong> <strong>la</strong>s <strong>Cuenca</strong>s Huancané y Suches 2010<br />
Del Cuadro Nº 12.3 se obtiene resultados <strong>de</strong> los valores <strong>de</strong> <strong>la</strong> capacidad <strong>de</strong> embalse<br />
mínima y máxima, valor esperado y varianza <strong>de</strong>l rango ajustado, y al 75% <strong>de</strong> persistencia.<br />
Cuadro Nº 12.4 Capacida<strong>de</strong>s <strong>de</strong> embalse (hm 3 ) – Embalses Cal<strong>la</strong>tomaza e Yaputira<br />
Capacidad <strong>de</strong> embalse<br />
Embalse<br />
Cal<strong>la</strong>tomaza Yaputira<br />
Mínima 27.58 29.68<br />
Valor esperado E(R*) 32.71 36.09<br />
Máxima 38.19 41.51<br />
75% <strong>de</strong> persistencia 31.00 34.00<br />
Varianza (R*) 5.92 7.05<br />
En resumen, <strong>la</strong> capacidad <strong>de</strong> embalse para una regu<strong>la</strong>ción total <strong>de</strong> <strong>la</strong>s subcuencas <strong>de</strong>l <strong>río</strong><br />
Guanaco e Yaputira, correspon<strong>de</strong> al valor calcu<strong>la</strong>do al 75% <strong>de</strong> persistencia.<br />
Embalse Cal<strong>la</strong>tomaza = 31.0 hm 3<br />
Embalse Yaputira = 34.0 hm 3<br />
12.3.3 Cálculo <strong>de</strong>l volumen útil <strong>de</strong>l embalse<br />
El volumen útil es el necesario para suministrar <strong>la</strong>s <strong>de</strong>mandas y <strong>la</strong>s pérdidas <strong>de</strong> aguas<br />
durante el funcionamiento <strong>de</strong>l embalse.<br />
Para el cálculo <strong>de</strong>l volumen útil <strong>de</strong>l embalse, generalmente es necesario conocer el<br />
volumen total y el transporte <strong>de</strong> sedimentos. Para <strong>de</strong>terminar el volumen <strong>de</strong>l suministro <strong>de</strong><br />
<strong>la</strong>s <strong>de</strong>mandas hídricas, es necesario calcu<strong>la</strong>r el volumen <strong>de</strong> precipitación, <strong>la</strong>s pérdidas por<br />
evaporación e infiltración en el embalse.<br />
A.- Volumen total <strong>de</strong>l embalse<br />
Des<strong>de</strong> el punto <strong>de</strong> vista topográfico, <strong>la</strong> capacidad máxima <strong>de</strong> los embalses Cal<strong>la</strong>tomaza e<br />
Yaputira, son menores a los volúmenes <strong>de</strong> agua calcu<strong>la</strong>dos al 75% <strong>de</strong> persistencia como<br />
rendimiento <strong>de</strong> <strong>la</strong> cuenca, hidrológicamente.<br />
Por lo tanto, en el presente estudio se ha consi<strong>de</strong>rado los siguientes volúmenes totales <strong>de</strong><br />
almacenamiento <strong>de</strong> agua para cada embalse.<br />
Embalse Cal<strong>la</strong>tomaza = 16.0 hm 3<br />
Embalse Yaputira = 17.0 hm 3<br />
La información <strong>de</strong> <strong>la</strong> re<strong>la</strong>ción Altura-Área-Volumen para los embalses Cal<strong>la</strong>tomaza e<br />
Yaputira se muestran en los Cuadros Nº 12.5 y 12.6, y en <strong>la</strong>s Figuras Nº 12.5 y 12.6. Esta<br />
información se ha obtenido a partir <strong>de</strong> los trabajos topográficos <strong>de</strong> <strong>la</strong> batimetría <strong>de</strong> los<br />
embalses en estudio.<br />
MINAG-ANA-DCPRH-AGUAS SUPERFICIALES Pág.389
<strong>Estudio</strong> <strong>Hidrológico</strong> <strong>de</strong> <strong>la</strong>s <strong>Cuenca</strong>s Huancané y Suches 2010<br />
En <strong>la</strong>s Figuras Nº 12.7 y 12.8 se muestran <strong>la</strong>s secciones transversales <strong>de</strong>l eje <strong>de</strong> presa<br />
Cal<strong>la</strong>tomaza e Yaputira.<br />
Cota<br />
Cuadro Nº 12.5 Altura-Área-Volumen – Embalse Cal<strong>la</strong>tomaza<br />
Área<br />
(m 2 )<br />
Área<br />
(ha)<br />
Área<br />
(km 2 )<br />
Volumen<br />
Parcial<br />
MINAG-ANA-DCPRH-AGUAS SUPERFICIALES Pág.390<br />
(hm 3 )<br />
Volumen<br />
Acumu<strong>la</strong>do<br />
(hm 3 )<br />
4154.15 0.0 0.0 0.000 0.000 0.000<br />
4155.00 466.4 0.0 0.000 0.000 0.000<br />
4156.00 2003.2 0.2 0.002 0.001 0.001<br />
4157.00 3632.5 0.4 0.004 0.003 0.004<br />
4158.00 7226.4 0.7 0.007 0.005 0.010<br />
4159.00 10622.1 1.1 0.011 0.009 0.019<br />
4160.00 14011.6 1.4 0.014 0.012 0.031<br />
4161.00 19192.3 1.9 0.019 0.017 0.048<br />
4162.00 22613.5 2.3 0.023 0.021 0.068<br />
4163.00 27962.3 2.8 0.028 0.025 0.094<br />
4164.00 36015.1 3.6 0.036 0.032 0.126<br />
4165.00 45802.5 4.6 0.046 0.041 0.167<br />
4166.00 56434.3 5.6 0.056 0.051 0.218<br />
4167.00 66729.3 6.7 0.067 0.062 0.279<br />
4168.00 81085.0 8.1 0.081 0.074 0.353<br />
4169.00 96867.1 9.7 0.097 0.089 0.442<br />
4170.00 118996.6 11.9 0.119 0.108 0.550<br />
4171.00 145079.4 14.5 0.145 0.132 0.682<br />
4172.00 172818.0 17.3 0.173 0.159 0.841<br />
4173.00 199508.7 20.0 0.200 0.186 1.027<br />
4174.00 225757.4 22.6 0.226 0.213 1.240<br />
4175.00 254362.1 25.4 0.254 0.240 1.480<br />
4176.00 280854.6 28.1 0.281 0.268 1.748<br />
4177.00 301224.4 30.1 0.301 0.291 2.039<br />
4178.00 329271.3 32.9 0.329 0.315 2.354<br />
4179.00 350311.2 35.0 0.350 0.340 2.694<br />
4180.00 366762.1 36.7 0.367 0.359 3.052<br />
4181.00 382660.0 38.3 0.383 0.375 3.427<br />
4182.00 400140.5 40.0 0.400 0.391 3.818<br />
4183.00 423580.8 42.4 0.424 0.412 4.230<br />
4184.00 455119.0 45.5 0.455 0.439 4.670<br />
4185.00 490944.6 49.1 0.491 0.473 5.143<br />
4186.00 527015.7 52.7 0.527 0.509 5.652<br />
4187.00 560543.1 56.1 0.561 0.544 6.195<br />
4188.00 596259.3 59.6 0.596 0.578 6.774<br />
4189.00 628303.5 62.8 0.628 0.612 7.386<br />
4190.00 658720.6 65.9 0.659 0.644 8.030<br />
4191.00 695041.0 69.5 0.695 0.677 8.706<br />
4192.00 732379.9 73.2 0.732 0.714 9.420<br />
4193.00 772314.0 77.2 0.772 0.752 10.172<br />
4194.00 823677.1 82.4 0.824 0.798 10.970<br />
4195.00 864790.5 86.5 0.865 0.844 11.815<br />
4196.00 904950.8 90.5 0.905 0.885 12.700<br />
4197.00 943848.9 94.4 0.944 0.924 13.624<br />
4198.00 988762.7 98.9 0.989 0.966 14.590<br />
4199.00 1036539.9 103.7 1.037 1.013 15.603<br />
4200.00 1089847.7 109.0 1.090 1.063 16.666<br />
Observaciones
<strong>Estudio</strong> <strong>Hidrológico</strong> <strong>de</strong> <strong>la</strong>s <strong>Cuenca</strong>s Huancané y Suches 2010<br />
Altura - Área - Volumen<br />
Embalse Cal<strong>la</strong>tomaza<br />
Volumen (hm<br />
0 1 2 3 4 5 6 7 8 9 10 11 12 13 14 15 16 17<br />
3 )<br />
4202<br />
4202<br />
Figura Nº 12.5 Curva Altura-Área-Volumen – Embalse Cal<strong>la</strong>tomaza<br />
4198<br />
4198<br />
4194<br />
4194<br />
4190<br />
4190<br />
4186<br />
4186<br />
Altitud (msnm) - Área<br />
4182<br />
4182<br />
MINAG-ANA-DCPRH-AGUAS SUPERFICIALES Pág.391<br />
4178<br />
4178<br />
Altitud (msnm)-Volumen<br />
4174<br />
4174<br />
4170<br />
4170<br />
4166<br />
4166<br />
4162<br />
4162<br />
4158<br />
4158<br />
Área Volumen<br />
4154<br />
4154<br />
0.0<br />
0.1<br />
0.2<br />
0.3<br />
0.4<br />
0.5<br />
0.6<br />
0.7<br />
0.8<br />
0.9<br />
1.0<br />
1.1<br />
Área (km 2 )
<strong>Estudio</strong> <strong>Hidrológico</strong> <strong>de</strong> <strong>la</strong>s <strong>Cuenca</strong>s Huancané y Suches 2010<br />
Cota<br />
Cuadro Nº 12.6 Altura-Área-Volumen – Embalse Yaputira<br />
Área<br />
(m 2 )<br />
Área<br />
(ha)<br />
Área<br />
(km 2 )<br />
Volumen<br />
Parcial<br />
MINAG-ANA-DCPRH-AGUAS SUPERFICIALES Pág.392<br />
(hm 3 )<br />
Volumen<br />
Acumu<strong>la</strong>do<br />
(hm 3 )<br />
3979.96 0.0 0.0 0.000 0.000 0.000<br />
3980.00 188.6 0.0 0.000 0.000 0.000<br />
3981.00 4633.2 0.5 0.005 0.002 0.002<br />
3982.00 25120.0 2.5 0.025 0.015 0.017<br />
3983.00 45895.4 4.6 0.046 0.036 0.053<br />
3984.00 71796.5 7.2 0.072 0.059 0.112<br />
3985.00 97301.9 9.7 0.097 0.085 0.196<br />
3986.00 123197.9 12.3 0.123 0.110 0.306<br />
3987.00 148128.6 14.8 0.148 0.136 0.442<br />
3988.00 177669.3 17.8 0.178 0.163 0.605<br />
3989.00 219640.3 22.0 0.220 0.199 0.804<br />
3990.00 257975.1 25.8 0.258 0.239 1.042<br />
3991.00 300844.1 30.1 0.301 0.279 1.322<br />
3992.00 352255.0 35.2 0.352 0.327 1.648<br />
3993.00 406155.1 40.6 0.406 0.379 2.028<br />
3994.00 459511.8 46.0 0.460 0.433 2.460<br />
3995.00 504633.0 50.5 0.505 0.482 2.943<br />
3996.00 561974.1 56.2 0.562 0.533 3.476<br />
3997.00 621823.2 62.2 0.622 0.592 4.068<br />
3998.00 675335.2 67.5 0.675 0.649 4.716<br />
3999.00 743784.1 74.4 0.744 0.710 5.426<br />
4000.00 818541.9 81.9 0.819 0.781 6.207<br />
4001.00 881405.7 88.1 0.881 0.850 7.057<br />
4002.00 950550.4 95.1 0.951 0.916 7.973<br />
4003.00 1003878.1 100.4 1.004 0.977 8.950<br />
4004.00 1056545.7 105.7 1.057 1.030 9.980<br />
4005.00 1107240.3 110.7 1.107 1.082 11.062<br />
4006.00 1154125.3 115.4 1.154 1.131 12.193<br />
4007.00 1197721.8 119.8 1.198 1.176 13.369<br />
4008.00 1238430.1 123.8 1.238 1.218 14.587<br />
4009.00 1282410.4 128.2 1.282 1.260 15.847<br />
4010.00 1332843.1 133.3 1.333 1.308 17.155<br />
Observaciones
<strong>Estudio</strong> <strong>Hidrológico</strong> <strong>de</strong> <strong>la</strong>s <strong>Cuenca</strong>s Huancané y Suches 2010<br />
Altura - Área - Volumen<br />
Embalse Yaputira<br />
Volumen (hm<br />
0 1 2 3 4 5 6 7 8 9 10 11 12 13 14 15 16 17 18<br />
3 )<br />
4011<br />
4011<br />
Figura Nº 12.6 Curva Altura-Área-Volumen – Embalse Yaputira<br />
4007<br />
4007<br />
4003<br />
4003<br />
3999<br />
3999<br />
Altitud (msnm) - Área<br />
MINAG-ANA-DCPRH-AGUAS SUPERFICIALES Pág.393<br />
3995<br />
3995<br />
Altitud (msnm) - Volumen<br />
3991<br />
3991<br />
3987<br />
3987<br />
3983<br />
3983<br />
Área Volumen<br />
3979<br />
3979<br />
0.0<br />
0.1<br />
0.2<br />
0.3<br />
0.4<br />
0.5<br />
0.6<br />
0.7<br />
0.8<br />
0.9<br />
1.0<br />
1.1<br />
1.2<br />
1.3<br />
1.4<br />
Área (km 2 )
<strong>Estudio</strong> <strong>Hidrológico</strong> <strong>de</strong> <strong>la</strong>s <strong>Cuenca</strong>s Huancané y Suches 2010<br />
V-A<br />
EJE PRESA RIO HUANACO MAYO<br />
Figura Nº 12.7 Sección transversal <strong>de</strong>l eje <strong>de</strong> presa Cal<strong>la</strong>tomaza<br />
L=57.71 (4170.00)<br />
L=27.66 (4160.00)<br />
L=9.86 (4154.15)<br />
L = 228 m<br />
L=216.95 (4200)<br />
L=158.58 (4190.00)<br />
L=128.53 (4180.00)<br />
Figura Nº 12.8 Sección transversal <strong>de</strong>l eje <strong>de</strong> presa Yaputira<br />
V-A<br />
L=196.97 (4010.00)<br />
L=161.20 (4005.00)<br />
L=125.93 (4000.00)<br />
L=96.80 (3995.00)<br />
L=67.11 (3990.00)<br />
L=45.49 (3985.00)<br />
L=9.41 (3980.00)<br />
MINAG-ANA-DCPRH-AGUAS SUPERFICIALES Pág.394<br />
V-B<br />
EJE PRESA RIO YAPUTIRA<br />
L = 212 m<br />
V-B
<strong>Estudio</strong> <strong>Hidrológico</strong> <strong>de</strong> <strong>la</strong>s <strong>Cuenca</strong>s Huancané y Suches 2010<br />
B.- Transporte <strong>de</strong> sedimentos<br />
El estudio <strong>de</strong>l transporte <strong>de</strong> sólidos resulta muy importante para <strong>la</strong> a<strong>de</strong>cuación <strong>de</strong> los<br />
diseños <strong>de</strong> estructuras <strong>de</strong> regu<strong>la</strong>ción, captación y <strong>de</strong>sarenamiento en proyectos hidráulicos.<br />
En el presente estudio se ha analizado el transporte <strong>de</strong> sedimentos para calcu<strong>la</strong>r el volumen<br />
<strong>de</strong> sedimentos en el embalse que durante <strong>la</strong> vida útil <strong>de</strong>l proyecto podría sedimentarse, al<br />
cual se consi<strong>de</strong>ra como el volumen muerto <strong>de</strong>l embalse.<br />
La teoría general <strong>de</strong> sedimentos fluviales involucra los procesos <strong>de</strong> erosión, iniciación <strong>de</strong>l<br />
movimiento, transporte, <strong>de</strong>pósitos y compactación <strong>de</strong> <strong>la</strong>s partícu<strong>la</strong>s sólidas.<br />
Los sedimentos se originan por <strong>la</strong> erosión <strong>de</strong> <strong>la</strong> cuenca. La erosión es un proceso que se<br />
<strong>de</strong>sarrol<strong>la</strong> continuamente <strong>de</strong>s<strong>de</strong> los tiempos geológicos, <strong>de</strong>termina y mo<strong>de</strong><strong>la</strong> <strong>la</strong> forma <strong>de</strong> <strong>la</strong><br />
corteza terrestre. La erosión se <strong>de</strong>be a <strong>la</strong> acción producida <strong>de</strong> los agentes externos, como el<br />
agua es uno <strong>de</strong> los principales agentes <strong>de</strong> erosión y el vehículo principal <strong>de</strong> transporte <strong>de</strong>l<br />
material erosionado. Entre otros factores que contro<strong>la</strong>n <strong>la</strong> tasa <strong>de</strong> erosión están como el<br />
régimen <strong>de</strong> <strong>la</strong>s lluvias, <strong>la</strong> cobertura vegetal, el tipo <strong>de</strong> suelo y <strong>la</strong> pendiente <strong>de</strong>l terreno.<br />
Las partícu<strong>la</strong>s son transportadas fundamentalmente <strong>de</strong> dos maneras diferentes: <strong>la</strong>s <strong>de</strong><br />
mayor tamaño ruedan sobre el fondo constituyendo el transporte <strong>de</strong> sólido <strong>de</strong> fondo; <strong>la</strong>s<br />
más finas van en suspensión. Es posible que ciertas partícu<strong>la</strong>s se transporten <strong>de</strong> un modo<br />
especial: a saltos, no constituyen propiamente material <strong>de</strong> fondo ni material en suspensión,<br />
a esta modalidad se le <strong>de</strong>nomina transporte por saltación.<br />
El transporte total <strong>de</strong> sedimentos, es <strong>la</strong> suma <strong>de</strong> sedimentos <strong>de</strong> arrastre y suspensión.<br />
La información básica para el cálculo <strong>de</strong> transporte <strong>de</strong> sedimentos, es <strong>la</strong> granulometría <strong>de</strong>l<br />
lecho <strong>de</strong>l <strong>río</strong> <strong>de</strong> <strong>la</strong> cuenca estudiada, en el presente no se cuenta con esta información, sin<br />
embargo para calcu<strong>la</strong>r el volumen <strong>de</strong> sedimentos se ha utilizado un método empírico<br />
re<strong>la</strong>cionado al área <strong>de</strong> <strong>la</strong> cuenca, a continuación se <strong>de</strong>scribe el método correspondiente.<br />
Criterio <strong>de</strong>l área <strong>de</strong> <strong>la</strong> cuenca<br />
La re<strong>la</strong>ción establecida por el U.S. Bureau of Rec<strong>la</strong>mation y ajustada en base a los<br />
registros <strong>de</strong> <strong>la</strong> cuenca <strong>de</strong>l <strong>río</strong> Mantaro, permite aproximar <strong>la</strong> siguiente re<strong>la</strong>ción:<br />
Qs 780.7 A<br />
-0.26<br />
Don<strong>de</strong>:<br />
Qs = Transporte <strong>de</strong> sedimentos (m 3 /km 2 /año).<br />
A = Área <strong>de</strong> <strong>la</strong> cuenca (km 2 ).<br />
Aplicando <strong>la</strong> ecuación anterior, se obtiene los volúmenes <strong>de</strong> sedimentos para los embalses<br />
Cal<strong>la</strong>tomaza e Yaputira, ver Cuadro N° 12.7.<br />
MINAG-ANA-DCPRH-AGUAS SUPERFICIALES Pág.395
<strong>Estudio</strong> <strong>Hidrológico</strong> <strong>de</strong> <strong>la</strong>s <strong>Cuenca</strong>s Huancané y Suches 2010<br />
Parámetros<br />
Cuadro N° 12.7 Cálculo <strong>de</strong> volumen <strong>de</strong> sedimentos<br />
Unidad <strong>de</strong> medida<br />
Embalse<br />
Cal<strong>la</strong>tomaza Yaputira<br />
Área cuenca (km2) 216.75 228.24<br />
Caudal sólido Qs (m3/km2/año) 192.81 190.24<br />
Caudal sólido Qs (m3/año) 41792.07 43420.43<br />
Vida util embalse (años) 50.00 50.00<br />
Caudal sólido Qs (m3) 2089603.67 2171021.30<br />
Caudal sólido Qs (hm3) 2.09 2.17<br />
Los volúmenes <strong>de</strong> sedimentos calcu<strong>la</strong>dos en el Cuadro N° 12.7, representa transporte total<br />
<strong>de</strong> sedimentos.<br />
En el presente estudio, se asume 2 hm 3 <strong>de</strong> volumen <strong>de</strong> sedimentos como <strong>la</strong> primera<br />
aproximación, para ser consi<strong>de</strong>rado como volumen muerto en los embalses Cal<strong>la</strong>tomaza e<br />
Yaputira. El volumen <strong>de</strong> sedimentos asumido, podría reajustarse con los resultados<br />
recalcu<strong>la</strong>dos en base a <strong>la</strong> información <strong>de</strong> <strong>la</strong> granulometría <strong>de</strong>l lecho <strong>de</strong>l <strong>río</strong> <strong>de</strong> <strong>la</strong>s cuencas<br />
en estudio.<br />
C.- Volumen <strong>de</strong> precipitación en el embalse<br />
El volumen <strong>de</strong> precipitación en los embalses Cal<strong>la</strong>tomaza e Yaputira, se ha calcu<strong>la</strong>do con<br />
<strong>la</strong> información <strong>de</strong> precipitación areal <strong>de</strong> <strong>la</strong>s subcuencas y el área promedio <strong>de</strong> los embalses<br />
en estudio. Los resultados se muestran en el Cuadro N° 12.8.<br />
Cuadro N° 12.8 Volumen <strong>de</strong> precipitación en el embalse<br />
Area promedio <strong>de</strong>l embalse: Cal<strong>la</strong>tomaza = 0.624 km2 e Yaputira = 0.863 km2<br />
Mes<br />
Nº<br />
Cal<strong>la</strong>tomaza<br />
días<br />
Pp (mm) Vol. (hm3)<br />
Embalse<br />
Yaputira<br />
Pp (mm) Vol. (hm3)<br />
Enero 31 146.3 0.09 145.7 0.13<br />
Febrero 28 120.1 0.07 118.2 0.10<br />
Marzo 31 100.0 0.06 107.3 0.09<br />
Abril 30 49.0 0.03 57.1 0.05<br />
Mayo 31 13.2 0.01 17.3 0.01<br />
Junio 30 4.9 0.00 8.8 0.01<br />
Julio 31 3.3 0.00 6.5 0.01<br />
Agosto 31 8.4 0.01 16.9 0.01<br />
Septiembre 30 28.6 0.02 37.1 0.03<br />
Octubre 31 46.9 0.03 57.3 0.05<br />
Noviembre 30 69.2 0.04 67.8 0.06<br />
Diciembre 31 110.2 0.07 103.6 0.09<br />
Total anual<br />
700.1 0.43 743.6 0.64<br />
Asumido: Volumen <strong>de</strong> Precipitación (hm3) =<br />
D.- Volumen <strong>de</strong> evaporación en el embalse<br />
0.40 0.60<br />
El volumen <strong>de</strong> evaporación en los embalses Cal<strong>la</strong>tomaza e Yaputira, se ha calcu<strong>la</strong>do con <strong>la</strong><br />
información <strong>de</strong> evaporación areal <strong>de</strong> <strong>la</strong>s subcuencas y el área promedio <strong>de</strong> los embalses en<br />
estudio. Los resultados se muestran en el Cuadro N° 12.9.<br />
MINAG-ANA-DCPRH-AGUAS SUPERFICIALES Pág.396<br />
ASUMIDO PARA<br />
EMBALSES = 2.
<strong>Estudio</strong> <strong>Hidrológico</strong> <strong>de</strong> <strong>la</strong>s <strong>Cuenca</strong>s Huancané y Suches 2010<br />
Cuadro N° 12.9 Volumen <strong>de</strong> evaporación en el embalse<br />
Area promedio <strong>de</strong>l embalse: Cal<strong>la</strong>tomaza = 0.624 km2 e Yaputira = 0.863 km2<br />
Mes<br />
Nº<br />
Cal<strong>la</strong>tomaza<br />
días<br />
Ev (mm) Vol. (hm3)<br />
Embalse<br />
Yaputira<br />
Ev (mm) Vol. (hm3)<br />
Enero 31 74.9 0.05 64.50 0.06<br />
Febrero 28 68.7 0.04 60.00 0.05<br />
Marzo 31 70.3 0.04 63.80 0.06<br />
Abril 30 75.2 0.05 63.80 0.06<br />
Mayo 31 73.0 0.05 70.50 0.06<br />
Junio 30 67.8 0.04 64.50 0.06<br />
Julio 31 73.1 0.05 68.30 0.06<br />
Agosto 31 83.9 0.05 75.00 0.06<br />
Septiembre 30 89.9 0.06 78.00 0.07<br />
Octubre 31 86.9 0.05 76.50 0.07<br />
Noviembre 30 89.0 0.06 74.30 0.06<br />
Diciembre 31 81.7 0.05 68.30 0.06<br />
TOTAL ANUAL<br />
934.4 0.59 827.50 0.73<br />
Asumido: Volumen <strong>de</strong> Evaporación (hm3) =<br />
E.- Volumen <strong>de</strong> infiltración en el embalse<br />
0.60 0.70<br />
En el presente estudio, el volumen <strong>de</strong> infiltración se ha asumido el 5% <strong>de</strong>l volumen total<br />
<strong>de</strong>l embalse, cuyos respectivos valores son: embalse Cal<strong>la</strong>tomaza 0.80 hm 3 y embalse<br />
Yaputira 0.90 hm 3 .<br />
F.- Volumen útil <strong>de</strong>l embalse<br />
VU VT VM<br />
Don<strong>de</strong>: VU = Volumen útil.<br />
VT = Volumen total.<br />
VM = Volumen muerto (volumen <strong>de</strong> sedimentos).<br />
Con <strong>la</strong> información disponible <strong>de</strong>l volumen total y volumen muerto, se ha calcu<strong>la</strong>do el<br />
volumen útil para los embalses Cal<strong>la</strong>tomaza e Yaputira. Ver el Cuadro Nº 12.10.<br />
Cuadro Nº 12.10 Volumen útil (hm 3 ) - Embalses Cal<strong>la</strong>tomaza e Yaputira<br />
Variables<br />
Embalse<br />
Cal<strong>la</strong>tomaza Yaputira<br />
Volumen total <strong>de</strong>l embalse (VT) 16.00 17.00<br />
Volumen <strong>de</strong> sedimentos o volumen muerto (VM) 2.00 2.00<br />
Volumen útil <strong>de</strong>l embalse (VU) 14.00 15.00<br />
Los volúmenes útiles obtenidos en el Cuadro Nº 12.10, incluye <strong>la</strong>s cantida<strong>de</strong>s <strong>de</strong> agua para<br />
el suministro <strong>de</strong> <strong>la</strong>s <strong>de</strong>mandas y <strong>la</strong>s pérdidas durante el funcionamiento <strong>de</strong> los embalses.<br />
Bajo este contexto, se ha calcu<strong>la</strong>do el volumen <strong>de</strong> agua que serán utilizadas para <strong>la</strong><br />
<strong>de</strong>manda hídrica <strong>de</strong> <strong>la</strong>s subcuencas en estudio, consi<strong>de</strong>rando los volúmenes <strong>de</strong> <strong>la</strong><br />
precipitación, evaporación e infiltración <strong>de</strong>l embalse, cuyos resultados se muestran en el<br />
Cuadro Nº 12.11.<br />
MINAG-ANA-DCPRH-AGUAS SUPERFICIALES Pág.397
<strong>Estudio</strong> <strong>Hidrológico</strong> <strong>de</strong> <strong>la</strong>s <strong>Cuenca</strong>s Huancané y Suches 2010<br />
Cuadro Nº 12.11 Volumen <strong>de</strong> agua para <strong>la</strong> <strong>de</strong>manda hídrica (hm 3 ) – Embalses Cal<strong>la</strong>tomaza e Yaputira<br />
Variables<br />
Embalse<br />
Cal<strong>la</strong>tomaza Yaputira<br />
Volumen útil <strong>de</strong>l embalse (VU) 14.00 15.00<br />
Volumen <strong>de</strong> precipitación sobre el embalse (VP) 0.40 0.60<br />
Volumen <strong>de</strong> evaporación <strong>de</strong>l embalse (VEv) 0.60 0.70<br />
Volumen <strong>de</strong> infiltración <strong>de</strong>l embalse (VI) 0.80 0.90<br />
Volumen <strong>de</strong> agua para <strong>la</strong> <strong>de</strong>manda hídrica: VD = VU+VP-VEv-VI 13.00 14.00<br />
12.3.4 Parámetros hidráulicos <strong>de</strong> <strong>la</strong> presa<br />
Algunos parámetros <strong>de</strong>l embalse ya están <strong>de</strong>finidos en los cálculos anteriores, lo que<br />
faltaría es el caudal máximo <strong>de</strong> salida <strong>de</strong>l embalse, longitud <strong>de</strong> <strong>la</strong> cresta <strong>de</strong>l verte<strong>de</strong>ro,<br />
altura <strong>de</strong> <strong>la</strong> lámina vertiente, bor<strong>de</strong> libre y el ancho <strong>de</strong> <strong>la</strong> corona <strong>de</strong> <strong>la</strong> presa.<br />
A.- Tránsito <strong>de</strong> avenida en el embalse<br />
El tránsito <strong>de</strong> caudales es un procedimiento para <strong>de</strong>terminar el tiempo y <strong>la</strong> magnitud <strong>de</strong>l<br />
caudal <strong>de</strong> salida (vale <strong>de</strong>cir, el hidrograma <strong>de</strong> caudal) en un embalse <strong>de</strong> <strong>de</strong>tención,<br />
utilizando hidrogramas conocidos o supuestos <strong>de</strong> entrada al embalse.<br />
Cuando el embalse se encuentra lleno, los excesos <strong>de</strong>l hidrograma <strong>de</strong> entrada al embalse<br />
<strong>de</strong>ben ser evacuadas por el alivia<strong>de</strong>ro o el verte<strong>de</strong>ro <strong>de</strong> <strong>de</strong>masías, en un tiempo<br />
<strong>de</strong>terminado <strong>de</strong>l tránsito <strong>de</strong> avenidas. Para este efecto se diseñan <strong>la</strong>s estructuras <strong>de</strong><br />
vertimiento, <strong>la</strong>s cuales <strong>de</strong>ben tener capacidad para conducir los picos <strong>de</strong> <strong>la</strong>s crecientes<br />
extraordinarias en forma segura hasta entregarlos aguas abajo <strong>de</strong> <strong>la</strong> presa.<br />
Tránsito <strong>de</strong> Piscina Nive<strong>la</strong>da<br />
El tránsito <strong>de</strong> piscina nive<strong>la</strong>da es un procedimiento para calcu<strong>la</strong>r el hidrograma <strong>de</strong> flujo <strong>de</strong><br />
salida <strong>de</strong>s<strong>de</strong> un embalse con una superficie <strong>de</strong> agua horizontal, dado su hidrograma <strong>de</strong><br />
entrada y sus características <strong>de</strong> almacenamiento – caudal <strong>de</strong> salida.<br />
El horizonte <strong>de</strong> tiempo se divi<strong>de</strong> en intervalos <strong>de</strong> duración Δ t , in<strong>de</strong>xados por j , es <strong>de</strong>cir,<br />
t 0, Dt,<br />
2Dt,.....,<br />
jDt,<br />
j 1<br />
Dt,.....,<br />
y <strong>la</strong> ecuación <strong>de</strong> continuidad dS dt I(<br />
t)<br />
Q(<br />
t)<br />
,<br />
don<strong>de</strong> : I ( t)<br />
<strong>la</strong> entrada, Q(<br />
t)<br />
<strong>la</strong> salida y S(<br />
t)<br />
almacenami ento <strong>de</strong> un sistema hidrológic o<br />
se integra<br />
sobre cada intervalo <strong>de</strong> tiempo, como se muestra en <strong>la</strong> Figura N° 12.9. Para el j-ésimo<br />
intervalo <strong>de</strong> tiempo.<br />
<br />
S<br />
S<br />
j 1<br />
j<br />
dS <br />
<br />
j1Dt<br />
j1<br />
jDt<br />
I(<br />
t)<br />
dt <br />
<br />
jDt<br />
Dt<br />
Q(<br />
t)<br />
dt<br />
MINAG-ANA-DCPRH-AGUAS SUPERFICIALES Pág.398<br />
(1)
<strong>Estudio</strong> <strong>Hidrológico</strong> <strong>de</strong> <strong>la</strong>s <strong>Cuenca</strong>s Huancané y Suches 2010<br />
Los valores <strong>de</strong>l flujo <strong>de</strong> entrada al inicio y al final <strong>de</strong>l j-ésimo intervalo son I j e I j1<br />
,<br />
respectivamente, y los correspondientes valores <strong>de</strong>l caudal <strong>de</strong> salida son j Q y Q j1<br />
. Aquí,<br />
tanto el caudal <strong>de</strong> entrada como el caudal se salida son tasas <strong>de</strong> flujo medidas como<br />
información por muestra, en lugar <strong>de</strong> que el caudal <strong>de</strong> entrada sea información por pulso y<br />
el caudal <strong>de</strong> salida sea información por muestra como ocurría con el hidrograma unitario.<br />
Si <strong>la</strong> variación <strong>de</strong> los caudales <strong>de</strong> entrada y <strong>de</strong> salida a lo <strong>la</strong>rgo <strong>de</strong>l intervalo es<br />
aproximadamente lineal, el cambio en el almacenamiento en el intervalo S j1<br />
S j , pue<strong>de</strong><br />
encontrarse reescribiendo (1) como:<br />
S<br />
j<br />
I j I j1<br />
Q j Q j1<br />
1 S j Dt<br />
Dt<br />
(2)<br />
2<br />
2<br />
Los valores <strong>de</strong> I j e I j1<br />
se conocen <strong>de</strong>bido a que han pre especificados. Los valores <strong>de</strong> j Q<br />
y S j se conocen en el intervalo <strong>de</strong> tiempo j-ésimo a partir <strong>de</strong> los cálculos hechos durante el<br />
intervalo <strong>de</strong> tiempo previo. Por consiguiente, <strong>la</strong> ecuación (2) contiene dos incógnitas Q j1<br />
S , <strong>la</strong>s cuales pue<strong>de</strong>n ais<strong>la</strong>rse multiplicando (2) por 2 Dt<br />
, y reor<strong>de</strong>nando el resultado<br />
y j1<br />
para producir:<br />
2S<br />
j1<br />
<br />
2<br />
<br />
Q<br />
<br />
j1<br />
<br />
Dt<br />
<br />
S J <br />
I j I j1<br />
Q j <br />
Dt<br />
<br />
Con el fin <strong>de</strong> calcu<strong>la</strong>r el caudal <strong>de</strong> salida Q j1<br />
, a partir <strong>de</strong> <strong>la</strong> ecuación (3), se necesita una<br />
función almacenamiento-caudal <strong>de</strong> salida que re<strong>la</strong>cione 2 S Dt<br />
Q y Q . El método para<br />
<strong>de</strong>sarrol<strong>la</strong>r esta función utilizando <strong>la</strong>s re<strong>la</strong>ciones elevación-almacenamiento y elevacióncaudal<br />
<strong>de</strong> salida se muestra en <strong>la</strong> Figura N° 12.10. La re<strong>la</strong>ción entre <strong>la</strong> elevación <strong>de</strong> <strong>la</strong><br />
superficie <strong>de</strong> agua y el almacenamiento en el embalse pue<strong>de</strong> <strong>de</strong>terminarse p<strong>la</strong>nimetrando<br />
mapas topográficos o mediante estudios topográficos <strong>de</strong> campo. La re<strong>la</strong>ción elevacióncaudal<br />
se <strong>de</strong>duce <strong>de</strong> <strong>la</strong>s ecuaciones hidráulicas que re<strong>la</strong>cionan cabeza y caudal, como <strong>la</strong>s<br />
que se muestran en <strong>la</strong> Tab<strong>la</strong> Nº 12.1 para varios tipos <strong>de</strong> verte<strong>de</strong>ros y <strong>de</strong> estructuras <strong>de</strong><br />
salida. El valor <strong>de</strong> D t se toma como el intervalo <strong>de</strong> tiempo <strong>de</strong>l hidrograma <strong>de</strong> caudal <strong>de</strong><br />
entrada. Para un valor dado <strong>de</strong> <strong>la</strong> elevación <strong>de</strong> <strong>la</strong> superficie <strong>de</strong> agua, se <strong>de</strong>terminan los<br />
valores <strong>de</strong> almacenamiento S y <strong>de</strong>l caudal <strong>de</strong> salida Q [partes a) y b) <strong>de</strong> <strong>la</strong> Figura Nº<br />
12.10], luego se calcu<strong>la</strong> el valor <strong>de</strong> 2 S Dt<br />
Q y se dibuja en el eje horizontal <strong>de</strong> una<br />
gráfica con el valor <strong>de</strong>l caudal <strong>de</strong> salida Q en el vertical [parte c) <strong>de</strong> <strong>la</strong> Figura Nº 12.10].<br />
MINAG-ANA-DCPRH-AGUAS SUPERFICIALES Pág.399<br />
(3)
<strong>Estudio</strong> <strong>Hidrológico</strong> <strong>de</strong> <strong>la</strong>s <strong>Cuenca</strong>s Huancané y Suches 2010<br />
Caudal<br />
Almacenamiento<br />
I j1<br />
I j<br />
Q<br />
Q<br />
S<br />
S<br />
j1<br />
j<br />
j1<br />
j<br />
Sj<br />
jDt<br />
Dt<br />
S S <br />
Flujo <strong>de</strong> entrada<br />
Flujo <strong>de</strong> salida<br />
Figura N° 12.9: Cambio <strong>de</strong> almacenamiento durante un pe<strong>río</strong>do <strong>de</strong> tránsito D t .<br />
a)<br />
S<br />
Almacenamiento<br />
H<br />
j1<br />
( j 1)<br />
Dt<br />
j<br />
Tiempo<br />
Tiempo<br />
Caudal <strong>de</strong> salida<br />
b) c)<br />
Q<br />
H<br />
Elevación <strong>de</strong> <strong>la</strong><br />
superficie <strong>de</strong> agua<br />
Elevación <strong>de</strong> <strong>la</strong><br />
superficie <strong>de</strong> agua<br />
Figura N° 12.10 Desarrollo <strong>de</strong> una función almacenamiento-caudal <strong>de</strong> salida para tránsito <strong>de</strong> piscina<br />
nive<strong>la</strong>da con base en <strong>la</strong>s curvas almacenamiento-elevación y elevación-caudal <strong>de</strong> salida.<br />
MINAG-ANA-DCPRH-AGUAS SUPERFICIALES Pág.400<br />
Q<br />
Caudal <strong>de</strong> salida<br />
.<br />
Función<br />
almacenamiento<br />
-caudal <strong>de</strong> salida<br />
<br />
2S<br />
Q<br />
Dt
<strong>Estudio</strong> <strong>Hidrológico</strong> <strong>de</strong> <strong>la</strong>s <strong>Cuenca</strong>s Huancané y Suches 2010<br />
Durante el tránsito <strong>de</strong> flujo a través <strong>de</strong>l intervalo <strong>de</strong> tiempo j , todos los términos <strong>de</strong> <strong>la</strong><br />
parte <strong>de</strong>recha <strong>de</strong> <strong>la</strong> ecuación (3) se conocen, luego el valor <strong>de</strong> 2S j1<br />
Dt Q j1<br />
pue<strong>de</strong><br />
calcu<strong>la</strong>rse. El valor correspondiente <strong>de</strong> Q j1<br />
pue<strong>de</strong> <strong>de</strong>terminarse a partir <strong>de</strong> <strong>la</strong> función<br />
almacenamiento-caudal <strong>de</strong> salida 2 S Dt<br />
Q versus Q , ya sea gráficamente o por<br />
interpo<strong>la</strong>ción lineal <strong>de</strong> unos valores dados en forma tabu<strong>la</strong>r, el valor <strong>de</strong> 2S j1<br />
Dt Q j1<br />
se<br />
calcu<strong>la</strong> utilizando <strong>la</strong> siguiente ecuación.<br />
2S<br />
<br />
<br />
Dt<br />
j1<br />
Q<br />
j1<br />
2S<br />
<br />
<br />
<br />
<br />
Dt<br />
j1<br />
Q<br />
j1<br />
<br />
<br />
2Q<br />
<br />
Este cálculo se repite para los subsiguientes pe<strong>río</strong>dos <strong>de</strong> tránsito.<br />
Tab<strong>la</strong> N° 12.1 Ecuación <strong>de</strong> caudal <strong>de</strong> salida <strong>de</strong>l verte<strong>de</strong>ro<br />
Tipo <strong>de</strong> verte<strong>de</strong>ro Ecuación Notación<br />
Cresta Libre<br />
MINAG-ANA-DCPRH-AGUAS SUPERFICIALES Pág.401<br />
j1<br />
3 2<br />
Q C.<br />
L.<br />
H Q = caudal <strong>de</strong>l verte<strong>de</strong>ro (m 3 /s).<br />
no contro<strong>la</strong>da C = coeficiente <strong>de</strong> <strong>de</strong>scarga.<br />
L = longitud <strong>de</strong> <strong>la</strong> cresta vertedora (m).<br />
H = altura <strong>de</strong> <strong>la</strong> lámina vertiente (m).<br />
a.2.- Resultados <strong>de</strong> tránsito <strong>de</strong> avenida en los embalses Cal<strong>la</strong>tomaza e Yaputira<br />
Los caudales transitados utilizando el Método <strong>de</strong> Piscina Nive<strong>la</strong>da, han permitido <strong>de</strong>finir<br />
los caudales necesarios para ser evacuados por el verte<strong>de</strong>ro <strong>de</strong> <strong>de</strong>masías en cada uno <strong>de</strong> los<br />
embalses en estudio.<br />
Los valores asumidos para el cálculo son: C = 2.5, longitud <strong>de</strong> cresta <strong>de</strong>l verte<strong>de</strong>ro L= 50<br />
m y <strong>la</strong> altura <strong>de</strong> <strong>la</strong> lámina vertiente es variable.<br />
En los Cuadros Nº 12.12 al 12.16 y en <strong>la</strong>s Figuras Nº 12.11 y 12.12, se presentan los<br />
cálculos y sus hidrogramas <strong>de</strong> entrada y salida <strong>de</strong> los embalses Cal<strong>la</strong>tomaza e Yaputira,<br />
para una avenida <strong>de</strong> 10,000 años <strong>de</strong> pe<strong>río</strong>do <strong>de</strong> retorno.<br />
Cabe recalcar que el pe<strong>río</strong>do <strong>de</strong> retorno seleccionado, se <strong>de</strong>be a que <strong>la</strong> estructura <strong>de</strong><br />
vertimiento <strong>de</strong> avenidas evacue con seguridad sin riesgo <strong>de</strong> fal<strong>la</strong>, don<strong>de</strong> en aguas abajo <strong>de</strong><br />
<strong>la</strong> represa se encuentran asentadas <strong>la</strong> pob<strong>la</strong>ción rural, centros educativos, postas <strong>de</strong> salud,<br />
áreas agríco<strong>la</strong>s y entre otras.<br />
(4)
<strong>Estudio</strong> <strong>Hidrológico</strong> <strong>de</strong> <strong>la</strong>s <strong>Cuenca</strong>s Huancané y Suches 2010<br />
Elevación<br />
H<br />
(m)<br />
0.00<br />
0.63<br />
1.13<br />
1.63<br />
Cuadro Nº 12.12 Valores <strong>de</strong> elevación, área, almacenamiento y caudal <strong>de</strong> salida<br />
Embalse Cal<strong>la</strong>tomaza<br />
Y X<br />
Area<br />
Almacenamiento<br />
A<br />
S<br />
Caudal<br />
(2S/Dt) + Q<br />
Q<br />
(km2) (hm3) (m3) (m3/s) (m3/s)<br />
1.060 0.000 0.00 0.0 0.0<br />
1.090 0.666 666,000.00 62.5 257.2<br />
1.114 1.195 1,195,000.00 150.2 499.6<br />
1.138 1.723 1,723,000.00 260.1 763.9<br />
Cuadro Nº 12.13 Tránsito <strong>de</strong> avenida a través <strong>de</strong>l embalse Cal<strong>la</strong>tomaza - Método <strong>de</strong> Piscina Nive<strong>la</strong>da<br />
Pe<strong>río</strong>do <strong>de</strong> retorno <strong>de</strong> 10000 años<br />
Pe<strong>río</strong>do <strong>de</strong><br />
Tránsito<br />
j(h)<br />
Caudal <strong>de</strong><br />
entrada al<br />
embalse (m3/sg)<br />
I j I j1<br />
2S j<br />
Q j<br />
Δt<br />
2S j1<br />
Q j1<br />
Δt<br />
(m3/sg) (m3/sg) (m3/sg)<br />
Caudal <strong>de</strong> salida<br />
<strong>de</strong>l embalse<br />
(m3/sg)<br />
1 0.0 0.0 0.0 0.0<br />
2 1.9 0.0 0.0 0.0 0.0 0.0<br />
3 3.8 1.4 1.4 0.8 1.4 0.3<br />
4 5.7 59.8 61.2 32.2 62.0 14.9<br />
5 7.6 158.8 218.6 144.6 250.8 53.1<br />
6 9.5 267.8 426.6 323.6 571.2 123.8<br />
7 11.4 293.1 560.9 533.1 884.5 175.7<br />
8 13.3 262.6 555.7 741.8 1088.8 173.5<br />
9 15.2 217.3 479.9 935.5 1221.7 143.1<br />
10 17.1 162.8 380.1 1101.6 1315.6 107.0<br />
11 19.0 99.8 262.6 1236.6 1364.2 63.8<br />
12 20.9 62.2 162.0 1319.8 1398.6 39.4<br />
13 22.8 40.3 102.5 1372.5 1422.3 24.9<br />
14 24.7 23.6 63.9 1405.4 1436.4 15.5<br />
15 26.6 12.2 35.8 1423.8 1441.2 8.7<br />
16 28.5 4.9 17.1 1432.5 1440.9 4.2<br />
17 30.4 1.0 5.9 1435.6 1438.4 1.4<br />
18 32.3 0.0 1.0 1436.2 1436.6 0.2<br />
19 0.0 1436.2 1436.2 0.0<br />
Figura Nº 12.11 Hidrograma <strong>de</strong> entrada y salida <strong>de</strong>l embalse Cal<strong>la</strong>tomaza (TR=10000 años)<br />
Caudal (m 3 /s)<br />
350<br />
300<br />
250<br />
200<br />
150<br />
100<br />
50<br />
0<br />
0.0 5.0 10.0 15.0 20.0 25.0 30.0 35.0<br />
Tiempo (horas)<br />
Series1 Series2<br />
MINAG-ANA-DCPRH-AGUAS SUPERFICIALES Pág.402
<strong>Estudio</strong> <strong>Hidrológico</strong> <strong>de</strong> <strong>la</strong>s <strong>Cuenca</strong>s Huancané y Suches 2010<br />
Elevación<br />
H<br />
(m)<br />
0.00<br />
0.12<br />
0.62<br />
1.12<br />
Cuadro Nº 12.14 Valores <strong>de</strong> elevación, área, almacenamiento y caudal <strong>de</strong> salida<br />
Embalse Yaputira<br />
Y X<br />
Area<br />
Almacenamiento<br />
A<br />
S<br />
Caudal<br />
(2S/Dt) + Q<br />
Q<br />
(km2) (hm3) (m3) (m3/s) (m3/s)<br />
1.330 0.000 0.00 0.0 0.0<br />
1.333 0.155 155,000.00 5.2 33.0<br />
1.335 0.801 801,000.00 61.0 204.5<br />
1.338 1.447 1,447,000.00 148.2 407.5<br />
Cuadro Nº 12.15 Tránsito <strong>de</strong> avenida a través <strong>de</strong>l embalse Yaputira - Método <strong>de</strong> Piscina Nive<strong>la</strong>da<br />
Pe<strong>río</strong>do <strong>de</strong> retorno <strong>de</strong> 10000 años<br />
Pe<strong>río</strong>do <strong>de</strong><br />
Tránsito<br />
j(h)<br />
Caudal <strong>de</strong><br />
entrada al<br />
embalse (m3/sg)<br />
I j I j1<br />
2S j<br />
Q j<br />
Δt<br />
2S j1<br />
Q j1<br />
Δt<br />
(m3/sg) (m3/sg) (m3/sg)<br />
Caudal <strong>de</strong> salida<br />
<strong>de</strong>l embalse<br />
(m3/sg)<br />
1 0.0 0.0 0.0 0.0<br />
2 3.1 0.0 0.0 0.0 0.0 0.0<br />
3 6.2 4.8 4.8 3.2 4.8 0.8<br />
4 9.3 66.1 70.9 39.1 74.1 17.5<br />
5 12.5 138.6 204.7 121.6 243.8 61.1<br />
6 15.6 208.3 346.9 224.1 468.5 122.2<br />
7 18.7 192.1 400.4 334.1 624.5 145.2<br />
8 21.8 160.6 352.7 437.4 686.8 124.7<br />
9 24.9 118.8 279.4 530.4 716.8 93.2<br />
10 28.0 69.3 188.1 607.1 718.5 55.7<br />
11 31.1 22.5 91.8 650.3 698.9 24.3<br />
12 34.3 9.9 32.4 672.5 682.7 5.1<br />
13 37.4 3.0 12.9 681.4 685.4 2.0<br />
14 40.5 0.1 3.1 683.5 684.5 0.5<br />
15 43.6 0.0 0.1 683.6 683.6 0.0<br />
Figura Nº 12.12 Hidrograma <strong>de</strong> entrada y salida <strong>de</strong>l embalse Yaputira (TR=10000 años)<br />
Caudal (m 3 /s)<br />
250<br />
200<br />
150<br />
100<br />
50<br />
0<br />
0.0 5.0 10.0 15.0 20.0 25.0 30.0 35.0 40.0 45.0 50.0<br />
Tiempo (horas)<br />
Series1 Series2<br />
MINAG-ANA-DCPRH-AGUAS SUPERFICIALES Pág.403
<strong>Estudio</strong> <strong>Hidrológico</strong> <strong>de</strong> <strong>la</strong>s <strong>Cuenca</strong>s Huancané y Suches 2010<br />
Los caudales transitados, utilizando el Método <strong>de</strong> Piscina Nive<strong>la</strong>da, han permitido <strong>de</strong>finir<br />
los caudales necesarios para ser evacuados por el verte<strong>de</strong>ro <strong>de</strong> <strong>de</strong>masías, en cada una <strong>de</strong> los<br />
embalses en estudio para <strong>la</strong>s máximas avenidas <strong>de</strong> 100, 1000 y 10000 años <strong>de</strong> pe<strong>río</strong>do <strong>de</strong><br />
retorno.<br />
Los caudales máximos <strong>de</strong> entrada y salida <strong>de</strong>l embalse se muestran en el siguiente cuadro.<br />
Cuadro Nº 12.16 Caudales máximos instantáneos <strong>de</strong> entrada y salida<br />
<strong>de</strong> los embalses Cal<strong>la</strong>tomaza e Yaputira<br />
TR<br />
(años) Qentrada<br />
(m3/s)<br />
Embalse Cal<strong>la</strong>tomaza Embalse Yaputira<br />
Qsalida<br />
(m3/s)<br />
Qentrada<br />
(m3/s)<br />
Qsalida<br />
(m3/s)<br />
100 127.60 60.30 87.50 50.90<br />
1,000 216.40 122.20 135.10 87.50<br />
10,000 293.10 175.70 208.30 145.20<br />
B.- Longitud <strong>de</strong> <strong>la</strong> cresta <strong>de</strong>l verte<strong>de</strong>ro<br />
Para <strong>la</strong> <strong>de</strong>terminación <strong>de</strong> <strong>la</strong> longitud <strong>de</strong> <strong>la</strong> cresta <strong>de</strong>l verte<strong>de</strong>ro se hará uso <strong>de</strong> <strong>la</strong> siguiente<br />
ecuación:<br />
3 2<br />
Q C.<br />
L.<br />
H<br />
(a)<br />
Don<strong>de</strong>:<br />
Q = Caudal <strong>de</strong>l verte<strong>de</strong>ro (m 3 /s).<br />
C = Coeficiente <strong>de</strong> <strong>de</strong>scarga.<br />
L = Longitud <strong>de</strong> <strong>la</strong> cresta vertedora (m).<br />
H = Altura <strong>de</strong> <strong>la</strong> lámina vertiente (m).<br />
Los valores <strong>de</strong> altura <strong>de</strong> <strong>la</strong> lámina para cada longitud <strong>de</strong> cresta, se muestran en el Cuadro<br />
Nº 12.17 siguiente:<br />
H<br />
(m)<br />
Cuadro Nº 12.17 Descarga <strong>de</strong> <strong>la</strong> presa vertedora<br />
Caudal máximo 10000 años: Cal<strong>la</strong>tomaza = 293.1 m 3 /s, Yaputira = 208.3 m 3 /s<br />
Caudal <strong>de</strong>l verte<strong>de</strong>ro: Cal<strong>la</strong>tomaza = 175 m 3 /s, Yaputira = 145 m 3 /s<br />
Longitud <strong>de</strong> <strong>la</strong> Cresta (m) , C = 2.50<br />
30 40 50 60 70 80 90 100<br />
0.10 2.4 3.2 4.0 4.7 5.5 6.3 7.1 7.9<br />
0.25 9.4 12.5 15.6 18.8 21.9 25.0 28.1 31.3<br />
0.50 26.5 35.4 44.2 53.0 61.9 70.7 79.5 88.4<br />
0.75 48.7 65.0 81.2 97.4 113.7 129.9 146.1 162.4<br />
1.00 75.0 100.0 125.0 150.0 175.0 200.0 225.0 250.0<br />
1.25 104.8 139.8 174.7 209.6 244.6 279.5 314.4 349.4<br />
1.50 137.8 183.7 229.6 275.6 321.5 367.4 413.4 459.3<br />
En el presente estudio se ha seleccionado <strong>la</strong> longitud <strong>de</strong>l verte<strong>de</strong>ro <strong>de</strong> 50 m para los<br />
embalses Cal<strong>la</strong>tomaza e Yaputira.<br />
MINAG-ANA-DCPRH-AGUAS SUPERFICIALES Pág.404
<strong>Estudio</strong> <strong>Hidrológico</strong> <strong>de</strong> <strong>la</strong>s <strong>Cuenca</strong>s Huancané y Suches 2010<br />
C.- Altura <strong>de</strong> <strong>la</strong> lámina vertiente<br />
Despejando <strong>de</strong> <strong>la</strong> ecuación (a) se obtiene <strong>la</strong> altura <strong>de</strong> <strong>la</strong> lámina vertiente.<br />
2<br />
3<br />
Q <br />
H <br />
(b)<br />
C.<br />
L <br />
Con <strong>la</strong> información disponible se calcu<strong>la</strong> <strong>la</strong> lámina vertiente para los embalses Cal<strong>la</strong>tomaza<br />
e Yaputira.<br />
Cuadro Nº 12.18 Altura <strong>de</strong> <strong>la</strong> lámina vertiente <strong>de</strong> los embalses Cal<strong>la</strong>tomaza e Yaputira<br />
Descripción<br />
Embalse<br />
Cal<strong>la</strong>tomaza Yaputira<br />
Caudal máxima <strong>de</strong> salida (Q) 175.0 145.0<br />
Longitud <strong>de</strong>l verte<strong>de</strong>ro (L) 50.0 50.0<br />
Coeficiente <strong>de</strong> <strong>de</strong>scarga (C) 2.5 2.5<br />
Altura <strong>de</strong> <strong>la</strong> lámina vertiente (H) 1.25 1.10<br />
Para fines <strong>de</strong> diseño se adopta 1.50 m <strong>de</strong> altura <strong>de</strong> <strong>la</strong> lámina vertiente para ambos<br />
embalses.<br />
D.- Bor<strong>de</strong> libre<br />
El bor<strong>de</strong> libre o distancia vertical entre <strong>la</strong> coronación y el nivel <strong>de</strong> aguas máximas<br />
extraordinarias, es <strong>de</strong>cir, el nivel <strong>de</strong>l embalse cuando el vertedor trabaja a su máxima<br />
capacidad, será calcu<strong>la</strong>do siguiendo <strong>la</strong> recomendación <strong>de</strong> <strong>la</strong> Instrucción Españo<strong>la</strong>, cuya<br />
expresión es <strong>la</strong> siguiente:<br />
25 0<br />
5 0.<br />
.<br />
Fe 0.<br />
26 Fe<br />
a 0.<br />
76 0.<br />
34 <br />
(c)<br />
Don<strong>de</strong>:<br />
a = altura <strong>de</strong> <strong>la</strong> o<strong>la</strong> (m).<br />
Fe = Fetch efectivo (longitud <strong>de</strong>l espejo <strong>de</strong> agua <strong>de</strong>l embalse (km).<br />
Cuadro Nº 12.19 Altura <strong>de</strong> <strong>la</strong> o<strong>la</strong> en los embalses Cal<strong>la</strong>tomaza e Yaputira<br />
Descripción<br />
Embalse<br />
Cal<strong>la</strong>tomaza Yaputira<br />
Longitud <strong>de</strong>l espejo <strong>de</strong> agua <strong>de</strong>l embalse (Fe) 3.188 4.85<br />
Altura <strong>de</strong> <strong>la</strong> o<strong>la</strong> (a) 1.02 1.12<br />
Para fines <strong>de</strong> diseño se adopta el bor<strong>de</strong> libre <strong>de</strong> 1.50 m para ambos embalses.<br />
MINAG-ANA-DCPRH-AGUAS SUPERFICIALES Pág.405
<strong>Estudio</strong> <strong>Hidrológico</strong> <strong>de</strong> <strong>la</strong>s <strong>Cuenca</strong>s Huancané y Suches 2010<br />
E.- Ancho <strong>de</strong> corona <strong>de</strong> <strong>la</strong> presa<br />
Existen diversas expresiones empíricas para <strong>de</strong>terminar el ancho <strong>de</strong> <strong>la</strong> corona en función<br />
<strong>de</strong> <strong>la</strong> altura “H” <strong>de</strong> <strong>la</strong> presa. La expresión Mexicana es <strong>la</strong> siguiente:<br />
5 0.<br />
H<br />
B 0.<br />
5<br />
(d)<br />
Los resultados son: Presa Cal<strong>la</strong>tomaza B = 3.47 m y Presa Yaputira B = 2.87 m.<br />
Consi<strong>de</strong>rando que el dimensionamiento <strong>de</strong>l ancho <strong>de</strong> <strong>la</strong> corona <strong>de</strong>berá tener en cuenta entre<br />
otros factores, <strong>la</strong> sismicidad <strong>de</strong> <strong>la</strong> zona y <strong>la</strong> posibilidad <strong>de</strong> uso <strong>de</strong> ésta como una vía para el<br />
paso <strong>de</strong> vehículos, se adopta: B = 4 m para <strong>la</strong>s presas Cal<strong>la</strong>tomaza y Yaputira.<br />
E.- Parámetros hidráulicos <strong>de</strong> <strong>la</strong> represa<br />
Embalse Cal<strong>la</strong>tomaza:<br />
- Nivel <strong>de</strong> aguas máximas extraordinarias (NAME) = 4200.87 msnm<br />
- Nivel <strong>de</strong> aguas máximas ordinarias o <strong>de</strong> operación (NAMO) = 4199.37 msnm<br />
- Nivel <strong>de</strong> aguas mínimas <strong>de</strong> operación (NAMI) = 4176.87 msnm<br />
- Cota <strong>de</strong>l lecho <strong>de</strong>l <strong>río</strong> = 4154.15 msnm<br />
- Cota <strong>de</strong> <strong>la</strong> corona <strong>de</strong> <strong>la</strong> presa = 4202.37 msnm<br />
- Bor<strong>de</strong> libre (BL) = 1.50 m<br />
- Altura <strong>de</strong> <strong>la</strong> presa (H) = 48.22 m<br />
- Volumen útil <strong>de</strong>l embalse (VU) = 14.00 hm 3<br />
- Volumen muerto <strong>de</strong>l embalse (VM) = 2.00 hm 3<br />
- Volumen total <strong>de</strong>l embalse (VT) = 16.00 hm 3<br />
- Longitud <strong>de</strong> coronación = 228.00 m<br />
- Longitud <strong>de</strong> <strong>la</strong> cresta <strong>de</strong>l verte<strong>de</strong>ro = 50.00 m<br />
- Ancho <strong>de</strong> <strong>la</strong> corona <strong>de</strong> <strong>la</strong> presa = 4.00 m<br />
- Área <strong>de</strong>l embalse = 1.06 km 2<br />
NAME 4200.87 msnm<br />
NAMO 4199.37 msnm<br />
VT = 16 hm 3<br />
Cota <strong>de</strong>l lecho <strong>de</strong>l <strong>río</strong><br />
4154.15 msnm<br />
BL = 1.5 m<br />
VU = 14 hm 3<br />
NAMI<br />
4176.87 msnm<br />
VM = 2 hm 3<br />
Corona <strong>de</strong> <strong>la</strong> presa<br />
4202.37 msnm<br />
Cresta <strong>de</strong>l verte<strong>de</strong>ro<br />
Canal <strong>de</strong> Descarga<br />
H = 48.22 m<br />
MINAG-ANA-DCPRH-AGUAS SUPERFICIALES Pág.406
<strong>Estudio</strong> <strong>Hidrológico</strong> <strong>de</strong> <strong>la</strong>s <strong>Cuenca</strong>s Huancané y Suches 2010<br />
Embalse Yaputira:<br />
- Nivel <strong>de</strong> aguas máximas extraordinarias (NAME) = 4011.38 msnm<br />
- Nivel <strong>de</strong> aguas máximas ordinarias o <strong>de</strong> operación (NAMO) = 4009.88 msnm<br />
- Nivel <strong>de</strong> aguas mínimas <strong>de</strong> operación (NAMI) = 3992.93 msnm<br />
- Cota <strong>de</strong>l lecho <strong>de</strong>l <strong>río</strong> = 3979.96 msnm<br />
- Cota <strong>de</strong> <strong>la</strong> corona <strong>de</strong> <strong>la</strong> presa = 4012.88 msnm<br />
- Bor<strong>de</strong> libre (BL) = 1.50 m<br />
- Altura <strong>de</strong> <strong>la</strong> presa (H) = 32.92 m<br />
- Volumen útil <strong>de</strong>l embalse (VU) = 15.00 hm 3<br />
- Volumen muerto <strong>de</strong>l embalse (VM) = 2.00 hm 3<br />
- Volumen total <strong>de</strong>l embalse (VT) = 17.00 hm 3<br />
- Longitud <strong>de</strong> coronación = 212.00 m<br />
- Longitud <strong>de</strong> <strong>la</strong> cresta <strong>de</strong>l verte<strong>de</strong>ro = 50.00 m<br />
- Ancho <strong>de</strong> <strong>la</strong> corona <strong>de</strong> <strong>la</strong> presa = 4.00 m<br />
- Área <strong>de</strong>l embalse = 1.33 km 2<br />
NAME 4011.38 msnm<br />
NAMO 4009.88 msnm<br />
VT = 17 hm 3<br />
Cota <strong>de</strong>l lecho <strong>de</strong>l <strong>río</strong><br />
3979.96 msnm<br />
BL = 1.5 m<br />
VU = 15 hm 3<br />
NAMI<br />
3992.93 msnm<br />
VM = 2 hm 3<br />
Corona <strong>de</strong> <strong>la</strong> presa<br />
4012.88 msnm<br />
Cresta <strong>de</strong>l verte<strong>de</strong>ro<br />
Canal <strong>de</strong> Descarga<br />
H = 32.92 m<br />
En presas <strong>de</strong> regu<strong>la</strong>ción <strong>de</strong> agua para irrigaciones, el NAMI (nivel <strong>de</strong> aguas mínimas <strong>de</strong><br />
operación) es el nivel más bajo con el que pue<strong>de</strong> operar <strong>la</strong> presa y coinci<strong>de</strong> con el nivel al<br />
que se encuentra <strong>la</strong> entrada <strong>de</strong>l canal <strong>de</strong> <strong>de</strong>scarga (toma). En el caso <strong>de</strong> presas para<br />
generación <strong>de</strong> energía eléctrica, el NAMI vendría ser NAMINO (nivel <strong>de</strong> aguas mínimas<br />
<strong>de</strong> operación) se fija <strong>de</strong> acuerdo con <strong>la</strong> carga mínima necesaria para que <strong>la</strong>s turbinas operen<br />
en condiciones óptimas.<br />
MINAG-ANA-DCPRH-AGUAS SUPERFICIALES Pág.407
<strong>Estudio</strong> <strong>Hidrológico</strong> <strong>de</strong> <strong>la</strong>s <strong>Cuenca</strong>s Huancané y Suches 2010<br />
13.1 CONCLUSIONES<br />
CAPÍTULO XIII<br />
CONCLUSIONES Y RECOMENDACIONES<br />
Se ha sistematizado <strong>la</strong> información cartográfica <strong>de</strong> <strong>la</strong>s cuencas Huancané y<br />
Suches (Perú), en el Sistema <strong>de</strong> Información Geográfica (SIG), para <strong>la</strong><br />
e<strong>la</strong>boración <strong>de</strong> los mapas <strong>de</strong> ubicación geográfica, hidrográfica, política,<br />
mapas temáticos <strong>de</strong> <strong>la</strong> geomorfología, ecología, geología y suelos.<br />
Las características geomorfológicas <strong>de</strong> <strong>la</strong>s cuencas Huancané y Suches, se<br />
ha <strong>de</strong>terminado con los parámetros <strong>de</strong> forma, relieve y red hidrográfica <strong>de</strong> <strong>la</strong><br />
cuenca. Las áreas <strong>de</strong> <strong>la</strong> cuencas Huancané y Suches son <strong>de</strong> 3631.19 km 2 y<br />
2930.73 km 2 (1160.75 km 2 correspon<strong>de</strong> al territorio peruano).<br />
La i<strong>de</strong>ntificación y evaluación <strong>de</strong> <strong>la</strong>s fuentes <strong>de</strong> agua superficiales, se ha<br />
obtenido a través <strong>de</strong> los trabajos <strong>de</strong> inventario realizados en el campo; en<br />
total existen 1695 fuentes <strong>de</strong> agua en <strong>la</strong> cuenca Huancané y 482 fuentes <strong>de</strong><br />
agua en <strong>la</strong> cuenca Suches (Perú), distribuidas en <strong>río</strong>s, quebradas,<br />
manantiales, <strong>la</strong>gunas, bofedales y nevados.<br />
Las variables climatológicas evaluadas en el presente estudio, son <strong>la</strong><br />
precipitación, temperatura (media, máxima y mínima), humedad re<strong>la</strong>tiva,<br />
evaporación, horas <strong>de</strong> sol, velocidad y dirección <strong>de</strong>l viento, y <strong>la</strong><br />
evapotranspiración potencial. Según <strong>la</strong> c<strong>la</strong>sificación climática <strong>la</strong>s cuencas<br />
Huancané y Suches correspon<strong>de</strong>n a <strong>la</strong> región <strong>de</strong> humedad <strong>de</strong> sub-húmedo a<br />
húmedo y a <strong>la</strong> región <strong>de</strong> temperatura <strong>de</strong> taiga a microtérmico.<br />
La evaluación <strong>de</strong>l comportamiento pluviométrico <strong>de</strong> <strong>la</strong>s cuencas Huancané<br />
y Suches, se ha analizado <strong>la</strong> consistencia y completación <strong>de</strong> <strong>la</strong> información<br />
<strong>de</strong> precipitaciones mensuales <strong>de</strong> <strong>la</strong>s 16 estaciones meteorológicas ubicadas<br />
en el ámbito <strong>de</strong> <strong>la</strong>s cuencas <strong>de</strong> estudio. A<strong>de</strong>más, con <strong>la</strong> información<br />
pluviométrica consistente y tratada, se ha calcu<strong>la</strong>do <strong>la</strong> serie mensual <strong>de</strong> <strong>la</strong>s<br />
precipitaciones areales <strong>de</strong>l pe<strong>río</strong>do 1956-2009 para <strong>la</strong>s subcuencas <strong>de</strong><br />
interés.<br />
La evaluación <strong>de</strong>l comportamiento hidrológico <strong>de</strong> <strong>la</strong>s cuencas Huancané y<br />
Suches, se ha analizado <strong>la</strong> consistencia y completación <strong>de</strong> <strong>la</strong> información <strong>de</strong><br />
<strong>la</strong>s <strong>de</strong>scargas medias mensuales <strong>de</strong> los <strong>río</strong>s Huancané, Suches y Ramis. Con<br />
<strong>la</strong> información consistente y tratada <strong>de</strong>l pe<strong>río</strong>do 1956-2009, se ha calcu<strong>la</strong>do<br />
<strong>la</strong> persistencia <strong>de</strong> caudales medios al 75% <strong>de</strong> persistencia para los <strong>río</strong>s en<br />
estudio.<br />
La mo<strong>de</strong><strong>la</strong>ción hidrológica <strong>de</strong> precipitación-escorrentía en <strong>la</strong>s cuencas<br />
Huancané y Suches, se ha realizado para <strong>la</strong> generación <strong>de</strong> <strong>la</strong>s <strong>de</strong>scargas<br />
medias en <strong>la</strong>s subcuencas <strong>de</strong> interés. Para ello se ha calibrado el mo<strong>de</strong>lo en<br />
los <strong>río</strong>s Huancané (estación hidrométrica Puente Huancané) y Suches<br />
(estación hidrométrica Puente Escoma), con los parámetros calibrados en<br />
MINAG-ANA-DCPRH-AGUAS SUPERFICIALES Pág.408
<strong>Estudio</strong> <strong>Hidrológico</strong> <strong>de</strong> <strong>la</strong>s <strong>Cuenca</strong>s Huancané y Suches 2010<br />
ambos <strong>río</strong>s, se ha <strong>de</strong>sarrol<strong>la</strong>do el mo<strong>de</strong><strong>la</strong>miento hidrológico con <strong>la</strong><br />
información <strong>de</strong> serie mensual <strong>de</strong> <strong>la</strong>s precipitaciones areales y generación <strong>de</strong><br />
caudales para <strong>la</strong>s subcuencas <strong>de</strong> interés. A<strong>de</strong>más, se ha <strong>de</strong>sarrol<strong>la</strong>do <strong>la</strong><br />
mo<strong>de</strong><strong>la</strong>ción estocástica para <strong>la</strong> generación <strong>de</strong> series sintéticas <strong>de</strong> caudales<br />
medios mensuales en <strong>la</strong>s subcuencas <strong>de</strong>l <strong>río</strong> Guanaco e Yaputira para el<br />
análisis <strong>de</strong> capacidad <strong>de</strong> almacenamiento <strong>de</strong> agua <strong>de</strong> los embalses<br />
propuestos en ambas subcuencas.<br />
La disponibilidad hídrica <strong>de</strong> <strong>la</strong>s cuencas Huancané y Suches, se ha obtenido<br />
a partir <strong>de</strong>l análisis <strong>de</strong> frecuencia <strong>de</strong> caudales al 75% <strong>de</strong> persistencia, para<br />
cada una <strong>de</strong> <strong>la</strong>s subcuencas <strong>de</strong> interés. La fuente hídrica principal y único<br />
existente son aguas superficiales provenientes <strong>de</strong> los <strong>río</strong>s <strong>de</strong> <strong>la</strong>s cuencas<br />
Huancané y Suches.<br />
La <strong>de</strong>manda hídrica total actual en <strong>la</strong> cuenca Huancané es <strong>de</strong> 35.87 hm 3 /año<br />
(33.83 hm 3 <strong>de</strong> uso agríco<strong>la</strong> <strong>de</strong> una superficie <strong>de</strong> 2345.62 ha bajo riego y<br />
2.04 hm 3 <strong>de</strong> uso pob<strong>la</strong>cional) y el caudal ecológico estimado es <strong>de</strong> 31.67<br />
hm 3 . Mientras en <strong>la</strong> cuenca Suches (Perú) el uso actual es <strong>de</strong> 16.09 hm 3 /año<br />
(uso agríco<strong>la</strong> 14.55 hm 3 cuya área es <strong>de</strong> 1358.43 ha, uso pob<strong>la</strong>cional 0.23<br />
hm 3 y uso minero 1.31 hm 3 ). La <strong>de</strong>manda hídrica futura solo existe<br />
proyectado en <strong>la</strong> cuenca Huancané para uso agríco<strong>la</strong> <strong>de</strong> 10.66 hm 3 . El uso<br />
agríco<strong>la</strong> es <strong>de</strong> mayor significancia en <strong>la</strong>s cuencas <strong>de</strong> estudio.<br />
El ba<strong>la</strong>nce hídrico se ha <strong>de</strong>sarrol<strong>la</strong>do a nivel <strong>de</strong> subcuencas, con el propósito<br />
<strong>de</strong> conocer el déficit y exceso <strong>de</strong>l recurso hídrico existente en <strong>la</strong>s cuencas.<br />
Según el análisis <strong>de</strong> ba<strong>la</strong>nce hídrico en situación actual los resultados son:<br />
subcuenca L<strong>la</strong>che muestra déficit hídrico en los meses <strong>de</strong> agosto a octubre<br />
con ligera variación y el superávit en los meses <strong>de</strong> noviembre a julio con<br />
<strong>de</strong>manda atendida al 100%; en <strong>la</strong>s subcuencas Tuyto, Muñani y Alto<br />
Huancané (<strong>río</strong> Puncune) existen superávit hídrico en todo el año y <strong>la</strong>s<br />
<strong>de</strong>mandas están atendidas al 100%; en <strong>la</strong> subcuenca Pistune existe el déficit<br />
hídrico en los meses <strong>de</strong> agosto y setiembre con ligera variación y el<br />
superávit en los meses <strong>de</strong> octubre a julio con <strong>de</strong>manda atendida al 100%; a<br />
nivel <strong>de</strong> <strong>la</strong> cuenca Huancané no existe déficit hídrico y <strong>la</strong>s <strong>de</strong>mandas están<br />
suministradas al 100%, cuyo superávit anual es <strong>de</strong> 341.78 hm 3 <strong>de</strong> <strong>la</strong><br />
diferencia existente entre <strong>la</strong> oferta hídrica total <strong>de</strong> 409.32 hm 3 y <strong>la</strong> <strong>de</strong>manda<br />
hídrica total <strong>de</strong> 67.54 hm 3 . En <strong>la</strong> cuenca Suches (Perú) el ba<strong>la</strong>nce hídrico se<br />
ha <strong>de</strong>sarrol<strong>la</strong>do en tres subcuencas que disponen <strong>de</strong> información básica, los<br />
resultados muestran que en <strong>la</strong> subcuenca Chueña Huata Jahuira no existe<br />
déficit hídrico y <strong>la</strong>s <strong>de</strong>mandas están satisfechas al 100%, en <strong>la</strong> subcuenca<br />
Caylloma el déficit hídrico existe en los meses <strong>de</strong> agosto y setiembre con<br />
ligera variación y exceso hídrico en los meses <strong>de</strong> octubre a julio con<br />
cobertura <strong>de</strong> <strong>la</strong>s <strong>de</strong>mandas al 100%, en <strong>la</strong> subcuenca Trapiche el déficit<br />
hídrico existe en los meses <strong>de</strong> agosto a octubre y el superávit en los meses<br />
<strong>de</strong> noviembre a julio con <strong>la</strong>s <strong>de</strong>mandas atendidas al 100%; el ba<strong>la</strong>nce<br />
hídrico a nivel <strong>de</strong> <strong>la</strong> cuenca Suches (Perú-Bolivia) no se ha realizado por<br />
falta <strong>de</strong> <strong>la</strong> información <strong>de</strong> <strong>la</strong>s <strong>de</strong>mandas hídricas correspondiente a <strong>la</strong> zona<br />
<strong>de</strong> Bolivia. El ba<strong>la</strong>nce hídrico en situación futura se ha <strong>de</strong>sarrol<strong>la</strong>do en <strong>la</strong>s<br />
unida<strong>de</strong>s hidrográficas con <strong>de</strong>mandas hídricas proyectadas, y los resultados<br />
son: en <strong>la</strong> subcuenca Muñani muestra el déficit hídrico en los meses <strong>de</strong><br />
agosto a octubre y superávit en los meses <strong>de</strong> noviembre a julio con<br />
MINAG-ANA-DCPRH-AGUAS SUPERFICIALES Pág.409
<strong>Estudio</strong> <strong>Hidrológico</strong> <strong>de</strong> <strong>la</strong>s <strong>Cuenca</strong>s Huancané y Suches 2010<br />
cobertura <strong>de</strong> <strong>la</strong>s <strong>de</strong>mandas al 100%; mientras en <strong>la</strong> cuenca Huancané<br />
(cuenca total) muestra el déficit hídrico en los meses <strong>de</strong> agosto y setiembre<br />
con ligera variación y el exceso hídrico en los meses <strong>de</strong> octubre a julio con<br />
cobertura <strong>de</strong> <strong>la</strong>s <strong>de</strong>mandas al 100%, cuyo superávit anual es <strong>de</strong> 331.12 hm 3<br />
<strong>de</strong> <strong>la</strong> diferencia existente entre <strong>la</strong> oferta hídrica total anual <strong>de</strong> 409.32 hm 3 y<br />
<strong>la</strong> <strong>de</strong>manda hídrica total anual <strong>de</strong> 78.20 hm 3 .<br />
La evaluación <strong>de</strong> los eventos hidrológicos extremos, se ha analizado y<br />
evaluado <strong>la</strong>s máximas avenidas y sequías, cuyos resultados obtenidos son<br />
los caudales máximos instantáneos para diferentes pe<strong>río</strong>dos <strong>de</strong> retorno para<br />
<strong>la</strong>s subcuencas <strong>de</strong> interés y <strong>la</strong> sequía meteorológica e hidrológica a nivel <strong>de</strong><br />
<strong>la</strong>s cuencas Huancané y Suches.<br />
Los volúmenes <strong>de</strong> agua necesarios a ser almacenados en los embalses<br />
propuestos es <strong>la</strong> siguiente: Embalse Cal<strong>la</strong>tomaza 16 hm 3 <strong>de</strong> volumen total,<br />
14 hm 3 <strong>de</strong> volumen útil y 48.22 m <strong>de</strong> altura <strong>de</strong> <strong>la</strong> presa; Embalse Yaputira<br />
17 hm 3 <strong>de</strong> volumen total, 15 hm 3 <strong>de</strong> volumen útil y 32.92 m <strong>de</strong> altura <strong>de</strong> <strong>la</strong><br />
presa.<br />
13.2 RECOMENDACIONES<br />
Para <strong>la</strong> e<strong>la</strong>boración <strong>de</strong>l estudio hidrológico <strong>de</strong> <strong>la</strong>s cuencas Huancané y<br />
Suches, se ha utilizado 16 estaciones meteorológicas, <strong>de</strong> los cuales<br />
so<strong>la</strong>mente 4 estaciones están ubicados <strong>de</strong>ntro <strong>de</strong> <strong>la</strong>s cuencas <strong>de</strong> estudio. Esta<br />
cantidad <strong>de</strong> observatorios es insuficiente para <strong>la</strong> magnitud <strong>de</strong> <strong>la</strong> cuenca. Se<br />
recomienda implementar <strong>la</strong>s estaciones meteorológicas en <strong>la</strong>s subcuencas<br />
Guanaco, Alto Huancané (<strong>río</strong> Puncune), Pistune, Tuyto, L<strong>la</strong>che, Trapiche y<br />
Caylloma.<br />
Se <strong>de</strong>be insta<strong>la</strong>r <strong>la</strong>s estaciones hidrométricas a nivel <strong>de</strong> subcuencas con<br />
equipos hidrológicos mo<strong>de</strong>rnos (limnimétro y limnígrafo), información que<br />
servirá posteriormente para reajustar los caudales medios mensuales<br />
generados con el mo<strong>de</strong>lo hidrológico <strong>de</strong> precipitación-escorrentía.<br />
En <strong>la</strong> entrada <strong>de</strong> los embalses proyectados se <strong>de</strong>be insta<strong>la</strong>r una estación<br />
hidrométrica (limnimétro y limnígrafo) para reajustar los cálculos realizados<br />
<strong>de</strong>l análisis <strong>de</strong> <strong>la</strong> capacidad <strong>de</strong> embalse y <strong>la</strong>s máximas avenidas.<br />
La Administración Local <strong>de</strong> Agua Huancané, <strong>de</strong>be realizar <strong>la</strong> campaña <strong>de</strong><br />
aforo <strong>de</strong> caudales a nivel <strong>de</strong> subcuencas y cabeceras <strong>de</strong> riego en <strong>la</strong>s cuencas<br />
Huancané y Suches. A<strong>de</strong>más, realizar <strong>la</strong> campaña <strong>de</strong> muestreo <strong>de</strong><br />
sedimentos en suspensión en épocas <strong>de</strong> avenida en los embalses propuestos<br />
para reajustar el volumen <strong>de</strong> sedimentos estimados.<br />
MINAG-ANA-DCPRH-AGUAS SUPERFICIALES Pág.410
<strong>Estudio</strong> <strong>Hidrológico</strong> <strong>de</strong> <strong>la</strong>s <strong>Cuenca</strong>s Huancané y Suches 2010<br />
CAPÍTULO XIV<br />
BIBLIOGRAFÍA<br />
1. Aliaga A., Segundo Vito “Tratamiento <strong>de</strong> datos hidrometeorológicos”, Lima-Perú, 1983.<br />
2. _____________________ “Hidrología Estadística”, Lima-Perú, 1985.<br />
3. _____________________ “Elementos <strong>de</strong> Econometría Aplicada”, Primera Edición,<br />
Cuajone-Perú, 1993.<br />
4. ALA Huancané “P<strong>la</strong>n <strong>de</strong> Cultivo y Riego 2010-2011”, Huancané-Puno, 2010.<br />
5. ALT (<strong>Autoridad</strong> Binacional Autónoma <strong>de</strong>l Sistema Hídrico TDPS): “Disponibilidad<br />
hídrica <strong>de</strong> <strong>la</strong>s cuencas afluentes al <strong>la</strong>go Titicaca”, 2005.<br />
6. Aparicio M., Francisco Javier “Fundamentos <strong>de</strong> Hidrología <strong>de</strong> Superficie”, Editorial<br />
Limusa, México, 1997.<br />
7. ATDR Huancané “Inventario <strong>de</strong> infraestructura <strong>de</strong> riego y padrón <strong>de</strong> usuarios <strong>de</strong>l distrito <strong>de</strong><br />
riego Huancané, 2006.<br />
8. Bae, Deg-Hyo; Georgakako, Konstantine P. and Nanda, S.K. “Operational Forecasting<br />
With Real-Databases”, Journal of Hydraulic Engineering, ASCE, Vol. 121, paper No 5388,<br />
1995.<br />
9. Chereque M., Wendor “Hidrología para Estudiantes <strong>de</strong> Ingeniería Civil”, Pontificia<br />
Universidad Católica <strong>de</strong>l Perú, Lima-Perú, 1989.<br />
10. Chow, Ven Te; Maidment, David R. and Mays, Larry W. “Hidrología Aplicada”,<br />
Editorial McGraw-Hill, Interamericana S.A.(Traduc). Impreso D'vinni Editorial Ltda.<br />
Santafé <strong>de</strong> Bogotá, Colombia, 1994.<br />
11. FAO “<strong>Estudio</strong> <strong>de</strong> Riego y Drenaje – Evapotranspiración <strong>de</strong>l Cultivo”, Manual Nº 56.<br />
12. Fontaine, Thomas A. “Rainfall-Runoff Mo<strong>de</strong>l Accuracy for an Extreme Flood”, Journal<br />
of Hydraulic Engineering, ASCE, paper No 4723, 1995.<br />
13. Guevara Pérez, Edilberto y Cartaya Di Lena, Humberto “Hidrología Ambiental”,<br />
Facultad <strong>de</strong> Ingeniería <strong>de</strong> <strong>la</strong> Universidad <strong>de</strong> Carabobo, Venezue<strong>la</strong>, 2004.<br />
14. Haan, Charles J. “Statistical Methods in Hydrology”, Iowa State University Press. USA,<br />
1977.<br />
15. Hotchkiss, Rollin H. and McCallum, Brain E. “Peak Discharge for Small Agricultural<br />
Watersheds”, Journal of Hydraulic Engineering, ASCE, Vol. 121, paper No 5502, 1995.<br />
16. Infante G., Said “Métodos Estadísticos”, Editorial Tril<strong>la</strong>s, S.A. <strong>de</strong> C.V. México, 1984.<br />
17. Kite, G.W. “Frequency and Risk Analyses in Hydrology”, Water Resources Publications.<br />
Fort Collins Colorado, USA, 1977.<br />
18. Linsley, Kohler y Paulhus “Hidrología para Ingenieros”, Editorial McGraw-Hill,<br />
Interamericana <strong>de</strong> México, S.A. <strong>de</strong> C.V., Segunda Edición, 1988.<br />
19. Lujano Laura, Efraín “<strong>Estudio</strong> hidrológico <strong>de</strong> <strong>la</strong> cuenca <strong>de</strong>l <strong>río</strong> Huancané”,<br />
Informe <strong>de</strong> prácticas pre-profesionales, Administración Local <strong>de</strong> Agua Huancané,<br />
Facultad <strong>de</strong> Ingeniería Agríco<strong>la</strong> - UNA - Puno, 2010.<br />
20. Lutz Scholz "Generación <strong>de</strong> Caudales Mensuales en <strong>la</strong> Sierra Peruana", Programa<br />
Nacional <strong>de</strong> Pequeñas y Medianas Irrigaciones- P<strong>la</strong>n Meris II, 1980.<br />
21. Mejía M., Abel “Métodos Estadísticos en Hidrología”, UNA La Molina, Concytec, Lima-<br />
Perú, 1991.<br />
22. Mejía M., Abel “Hidrología Aplicada”, UNA La Molina, CIP-FIA, Lima-Perú, 2001.<br />
MINAG-ANA-DCPRH-AGUAS SUPERFICIALES Pág.411
<strong>Estudio</strong> <strong>Hidrológico</strong> <strong>de</strong> <strong>la</strong>s <strong>Cuenca</strong>s Huancané y Suches 2010<br />
23. Monsalve S., Germán “Hidrología en <strong>la</strong> Ingeniería”, Segunda Edición, Editorial Escue<strong>la</strong><br />
Colombiana <strong>de</strong> Ingeniería - Alfaomega, Colombia, 1999.<br />
24. Nina Castro, Carlos “Ba<strong>la</strong>nce Hídrico <strong>de</strong> <strong>la</strong> <strong>Cuenca</strong> <strong>de</strong>l Rio Huancané”, Tesis <strong>de</strong> Grado,<br />
Facultad <strong>de</strong> Ingeniería Agríco<strong>la</strong>, Universidad Nacional <strong>de</strong>l Altip<strong>la</strong>no- Puno, <strong>2008</strong>.<br />
25. Organización Meteorológica Mundial - OMM “Guía <strong>de</strong> Prácticas Hidrológicas”, No 168,<br />
Quinta Edición, 1994.<br />
26. PELT (Proyecto Especial Lago Titicaca) - Puno, “P<strong>la</strong>n Director Binacional <strong>de</strong> Protección,<br />
Prevención <strong>de</strong> Inundaciones y Aprovechamiento <strong>de</strong> Recursos <strong>de</strong>l Lago Titicaca, Río<br />
Desagua<strong>de</strong>ro, Lago Poopó y Lago Sa<strong>la</strong>r <strong>de</strong> Coipasa (Sistema TDPS)”, 1993.<br />
27. PELT (Proyecto Especial Lago Titicaca) - Puno: “<strong>Estudio</strong> <strong>Hidrológico</strong> <strong>de</strong>l Sistema<br />
Hídrico Huancané-Suches, 2001.<br />
28. ONERN (Oficina Nacional <strong>de</strong> Evaluación <strong>de</strong> Recursos Naturales): “Inventario y<br />
evaluación <strong>de</strong> los recursos naturales alto andinos”, cuenca <strong>de</strong>l <strong>río</strong> Huancané, 1992.<br />
29. PRORRIDRE (Programa Regional <strong>de</strong> Riego y Drenaje) “<strong>Estudio</strong> hidrológico <strong>de</strong>l<br />
perfil <strong>de</strong>l proyecto <strong>de</strong> irrigación Muñani”, Gobierno Regional <strong>de</strong> Puno, 2009.<br />
30. Remenieras, G. “Tratado <strong>de</strong> Hidrología Aplicada”, Segunda Edición, Editores Técnicos<br />
Asociados S.A., Barcelona-España, 1974.<br />
31. Serruto C., A.R. "Ba<strong>la</strong>nce <strong>Hidrológico</strong> <strong>de</strong>l Lago Titicaca", Tesis presentada para optar el<br />
Grado <strong>de</strong> Magister Scientiae, UNA - La Molina, Lima-Perú, 1984.<br />
32. Titmarsh, G.W.; Cor<strong>de</strong>ry, I. and Pilgrim, D.H. “Calibration Procedures for Rational and<br />
USSCS Design Flood Methods”, Journal of Hydraulic Engineering, ASCE, paper No 5023,<br />
1995.<br />
33. US Army Corps of Engineers “HEC-HMS Hydrologic Mo<strong>de</strong>ling System”, Technical<br />
Reference Manual, Hydrologic Engineering Center, Davis, CA-USA, 2000.<br />
34. Varas C., Eduardo y Bois, Philippe “Hidrología Probabilística”, Ediciones Universidad<br />
Católica <strong>de</strong> Chile, 2002.<br />
35. Vásquez V., Absalón “Manejo <strong>de</strong> <strong>Cuenca</strong>s Altoandinas”, Tomo I y II, UNA La Molina,<br />
Lima-Perú, 2000.<br />
36. Villón B., Máximo “Hidrología Estadística”, Escue<strong>la</strong> <strong>de</strong> Ingeniería Agríco<strong>la</strong>, Instituto<br />
Tecnológico <strong>de</strong> Costa Rica, Segunda Edición, Editorial Villón, Lima-Perú, 2002.<br />
37. Villón B., Máximo “Hidrología”, Escue<strong>la</strong> <strong>de</strong> Ingeniería Agríco<strong>la</strong>, Instituto Tecnológico <strong>de</strong><br />
Costa Rica, Segunda Edición, Editorial Villón, Lima-Perú, 2002.<br />
38. Yevjevich, V. “Probability and Statistics in Hydrology”, Water Resources Publications,<br />
Fort Collins, Colorado, USA, 1972.<br />
MINAG-ANA-DCPRH-AGUAS SUPERFICIALES Pág.412
<strong>Estudio</strong> <strong>Hidrológico</strong> <strong>de</strong> <strong>la</strong>s <strong>Cuenca</strong>s Huancané y Suches 2010<br />
VOLUMEN II - ANEXO 1<br />
ANEXOS<br />
Información hidrometeorológica y cálculos justificatorios.<br />
CAPÍTULO IV<br />
CLIMATOLOGÍA DE LA CUENCA<br />
4.1 Registro histórico completado <strong>de</strong> <strong>la</strong> temperatura media, máxima y mínima.<br />
4.2 Registro histórico completado <strong>de</strong> <strong>la</strong> humedad re<strong>la</strong>tiva.<br />
4.3 Registro histórico completado <strong>de</strong> <strong>la</strong> evaporación.<br />
4.4 Registro histórico completado <strong>de</strong> horas <strong>de</strong> sol.<br />
4.5 Registro histórico completado <strong>de</strong> <strong>la</strong> velocidad <strong>de</strong>l viento.<br />
4.6 Registro histórico <strong>de</strong> <strong>la</strong> dirección <strong>de</strong>l viento.<br />
4.7 Resultados <strong>de</strong> cálculo <strong>de</strong> evapotranspiración potencial – Software CropWat.<br />
CAPÍTULO V<br />
PLUVIOMETRÍA<br />
5.1 Registro histórico completado y extendido <strong>de</strong> <strong>la</strong> precipitación mensual.<br />
5.2 Precipitación areal <strong>de</strong> <strong>la</strong> cuenca.<br />
CAPÍTULO VI<br />
HIDROMETRÍA<br />
6.1 Registro histórico completado y extendido <strong>de</strong> <strong>la</strong>s <strong>de</strong>scargas medias mensuales.<br />
CAPÍTULO VII<br />
MODELACIÓN HIDROLÓGICA-GENERACIÓN DE DESCARGAS MEDIAS MENSUALES<br />
7.1 Cuadros <strong>de</strong> mo<strong>de</strong><strong>la</strong>miento hidrológico <strong>de</strong> Lutz Scholz <strong>de</strong> <strong>la</strong>s <strong>de</strong>scargas medias mensuales.<br />
7.2 Descargas medias mensuales generadas con mo<strong>de</strong>lo hidrológico <strong>de</strong> Lutz Scholz.<br />
7.3 Persistencia <strong>de</strong> <strong>la</strong>s <strong>de</strong>scargas medias mensuales generadas.<br />
7.4 Series sintéticas generadas <strong>de</strong> <strong>la</strong>s <strong>de</strong>scargas medias mensuales – Mo<strong>de</strong>lo Estocástico.<br />
CAPÍTULO XI<br />
EVENTOS HIDROLÓGICOS EXTREMOS<br />
11.1 Registro histórico completado <strong>de</strong> caudales máximos <strong>de</strong>l <strong>río</strong> Huancané.<br />
11.2 Registro histórico completado y extendido <strong>de</strong> <strong>la</strong>s precipitaciones máximas en 24 horas.<br />
11.3 Resultados <strong>de</strong>l análisis <strong>de</strong> frecuencia <strong>de</strong> <strong>la</strong>s precipitaciones máximas en 24 horas.<br />
11.4 Resultados <strong>de</strong>l análisis <strong>de</strong> máximas avenidas – Método SCS.<br />
CAPÍTULO XII<br />
PROPUESTA DE REPRESAMIENTO HÍDRICO EN LA CUENCA<br />
12.1 Resultados <strong>de</strong>l tránsito <strong>de</strong> avenida en el embalse.<br />
VOLUMEN III - ANEXO 2<br />
Mapas temáticos <strong>de</strong>l estudio hidrológico <strong>de</strong> <strong>la</strong>s cuencas Huancané y Suches.<br />
VOLUMEN IV - ANEXO 3<br />
Inventario <strong>de</strong> fuentes <strong>de</strong> aguas superficiales <strong>de</strong> <strong>la</strong>s cuencas Huancané y Suches.<br />
Volumen IV - Anexo 3.1 Fichas <strong>de</strong> Campo.<br />
Volumen IV - Anexo 3.2 Álbum <strong>de</strong> Fotos y Mapas.<br />
MINAG-ANA-DCPRH-AGUAS SUPERFICIALES Pág.413