“Las instituciones terciarias de formación docente en la Argentina”
“Las instituciones terciarias de formación docente en la Argentina”
“Las instituciones terciarias de formación docente en la Argentina”

You also want an ePaper? Increase the reach of your titles
YUMPU automatically turns print PDFs into web optimized ePapers that Google loves.
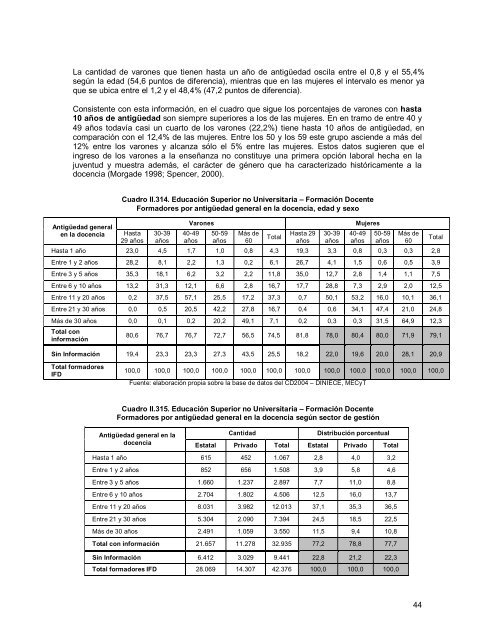
La cantidad <strong>de</strong> varones que ti<strong>en</strong><strong>en</strong> hasta un año <strong>de</strong> antigüedad osci<strong>la</strong> <strong>en</strong>tre el 0,8 y el 55,4%<br />
según <strong>la</strong> edad (54,6 puntos <strong>de</strong> difer<strong>en</strong>cia), mi<strong>en</strong>tras que <strong>en</strong> <strong>la</strong>s mujeres el intervalo es m<strong>en</strong>or ya<br />
que se ubica <strong>en</strong>tre el 1,2 y el 48,4% (47,2 puntos <strong>de</strong> difer<strong>en</strong>cia).<br />
Consist<strong>en</strong>te con esta in<strong>formación</strong>, <strong>en</strong> el cuadro que sigue los porc<strong>en</strong>tajes <strong>de</strong> varones con hasta<br />
10 años <strong>de</strong> antigüedad son siempre superiores a los <strong>de</strong> <strong>la</strong>s mujeres. En <strong>en</strong> tramo <strong>de</strong> <strong>en</strong>tre 40 y<br />
49 años todavía casi un cuarto <strong>de</strong> los varones (22,2%) ti<strong>en</strong>e hasta 10 años <strong>de</strong> antigüedad, <strong>en</strong><br />
comparación con el 12,4% <strong>de</strong> <strong>la</strong>s mujeres. Entre los 50 y los 59 este grupo asci<strong>en</strong><strong>de</strong> a más <strong>de</strong>l<br />
12% <strong>en</strong>tre los varones y alcanza sólo el 5% <strong>en</strong>tre <strong>la</strong>s mujeres. Estos datos sugier<strong>en</strong> que el<br />
ingreso <strong>de</strong> los varones a <strong>la</strong> <strong>en</strong>señanza no constituye una primera opción <strong>la</strong>boral hecha <strong>en</strong> <strong>la</strong><br />
juv<strong>en</strong>tud y muestra a<strong>de</strong>más, el carácter <strong>de</strong> género que ha caracterizado históricam<strong>en</strong>te a <strong>la</strong><br />
doc<strong>en</strong>cia (Morga<strong>de</strong> 1998; Sp<strong>en</strong>cer, 2000).<br />
Antigüedad g<strong>en</strong>eral<br />
<strong>en</strong> <strong>la</strong> doc<strong>en</strong>cia<br />
Cuadro II.314. Educación Superior no Universitaria – Formación Doc<strong>en</strong>te<br />
Formadores por antigüedad g<strong>en</strong>eral <strong>en</strong> <strong>la</strong> doc<strong>en</strong>cia, edad y sexo<br />
Hasta<br />
29 años<br />
30-39<br />
años<br />
Varones Mujeres<br />
40-49<br />
años<br />
50-59<br />
años<br />
Más <strong>de</strong><br />
60<br />
Total<br />
Hasta 29<br />
años<br />
30-39<br />
años<br />
40-49<br />
años<br />
50-59<br />
años<br />
Más <strong>de</strong><br />
60<br />
Hasta 1 año 23,0 4,5 1,7 1,0 0,8 4,3 19,3 3,3 0,8 0,3 0,3 2,8<br />
Entre 1 y 2 años 28,2 8,1 2,2 1,3 0,2 6,1 26,7 4,1 1,5 0,6 0,5 3,9<br />
Entre 3 y 5 años 35,3 18,1 6,2 3,2 2,2 11,8 35,0 12,7 2,8 1,4 1,1 7,5<br />
Entre 6 y 10 años 13,2 31,3 12,1 6,6 2,8 16,7 17,7 28,8 7,3 2,9 2,0 12,5<br />
Entre 11 y 20 años 0,2 37,5 57,1 25,5 17,2 37,3 0,7 50,1 53,2 16,0 10,1 36,1<br />
Entre 21 y 30 años 0,0 0,5 20,5 42,2 27,8 16,7 0,4 0,6 34,1 47,4 21,0 24,8<br />
Más <strong>de</strong> 30 años 0,0 0,1 0,2 20,2 49,1 7,1 0,2 0,3 0,3 31,5 64,9 12,3<br />
Total con<br />
in<strong>formación</strong><br />
Sin In<strong>formación</strong><br />
Total formadores<br />
IFD<br />
80,6<br />
19,4<br />
100,0<br />
76,7<br />
23,3<br />
100,0<br />
76,7<br />
23,3<br />
100,0<br />
72,7<br />
27,3<br />
100,0<br />
56,5<br />
43,5<br />
100,0<br />
74,5<br />
25,5<br />
100,0<br />
81,8<br />
18,2<br />
100,0<br />
78,0<br />
22,0<br />
100,0<br />
80,4<br />
19,6<br />
100,0<br />
Fu<strong>en</strong>te: e<strong>la</strong>boración propia sobre <strong>la</strong> base <strong>de</strong> datos <strong>de</strong>l CD2004 – DINIECE, MECyT<br />
Cuadro II.315. Educación Superior no Universitaria – Formación Doc<strong>en</strong>te<br />
Formadores por antigüedad g<strong>en</strong>eral <strong>en</strong> <strong>la</strong> doc<strong>en</strong>cia según sector <strong>de</strong> gestión<br />
80,0<br />
20,0<br />
100,0<br />
Antigüedad g<strong>en</strong>eral <strong>en</strong> <strong>la</strong><br />
Cantidad Distribución porc<strong>en</strong>tual<br />
doc<strong>en</strong>cia Estatal Privado Total Estatal Privado Total<br />
Hasta 1 año 615 452 1.067 2,8 4,0 3,2<br />
Entre 1 y 2 años 852 656 1.508 3,9 5,8 4,6<br />
Entre 3 y 5 años 1.660 1.237 2.897 7,7 11,0 8,8<br />
Entre 6 y 10 años 2.704 1.802 4.506 12,5 16,0 13,7<br />
Entre 11 y 20 años 8.031 3.982 12.013 37,1 35,3 36,5<br />
Entre 21 y 30 años 5.304 2.090 7.394 24,5 18,5 22,5<br />
Más <strong>de</strong> 30 años 2.491 1.059 3.550 11,5 9,4 10,8<br />
Total con in<strong>formación</strong> 21.657 11.278 32.935 77,2 78,8 77,7<br />
Sin In<strong>formación</strong> 6.412 3.029 9.441 22,8 21,2 22,3<br />
Total formadores IFD 28.069 14.307 42.376 100,0 100,0 100,0<br />
71,9<br />
28,1<br />
100,0<br />
44<br />
Total<br />
79,1<br />
20,9<br />
100,0