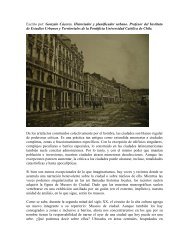
“Efectos de las Normas de Excepción sobre la Planificación Urbana ...
“Efectos de las Normas de Excepción sobre la Planificación Urbana ...
“Efectos de las Normas de Excepción sobre la Planificación Urbana ...

You also want an ePaper? Increase the reach of your titles
YUMPU automatically turns print PDFs into web optimized ePapers that Google loves.
Efectos <strong>de</strong> <strong><strong>la</strong>s</strong> <strong>Normas</strong> <strong>de</strong> <strong>Excepción</strong> <strong>sobre</strong> <strong>la</strong> P<strong>la</strong>nificación <strong>Urbana</strong> Comunal y <strong>sobre</strong> los Conflictos Urbanos<br />
Gráfico 6 Superficie Acogida a Conjunto Armónico, respecto <strong>de</strong>l total comunal (%)<br />
100%<br />
80%<br />
60%<br />
40%<br />
20%<br />
0%<br />
CERRILLOS<br />
CERRO NAVIA<br />
CONCHALÍ<br />
EL BOSQUE (**)<br />
ESTACIÓN CENTRAL<br />
HUECHURABA (*)<br />
INDEPENDENCIA<br />
LA CISTERNA<br />
LA FLORIDA<br />
LA GRANJA<br />
LA PINTANA<br />
LA REINA<br />
LAS CONDES<br />
TESIS JORGE ALCAÍNO VARGAS 108<br />
LO BARNECHEA<br />
LO ESPEJO<br />
LO PRADO<br />
MACUL<br />
1 2 3 4 5 6 7 8 9 10 11 12 13 14 15 16 17 18 19 20 21 22 23 24 25 26 27 28 29 30 31 32 33 34<br />
MAIPÚ<br />
Superficie Acogida a Conjunto Armónico Resto <strong>de</strong> Superficie Aprobada<br />
Fuente: E<strong>la</strong>boración Propia, <strong>sobre</strong> <strong>la</strong> base <strong>de</strong> datos INE y MINVU, año 2006<br />
En el caso <strong>de</strong> los Conjuntos Armónicos, <strong><strong>la</strong>s</strong> comunas que <strong>de</strong>stacan –en cuanto a <strong>la</strong><br />
enorme inci<strong>de</strong>ncia <strong>de</strong> <strong>la</strong> superficie <strong>de</strong> unos pocos permisos (por comparación <strong>de</strong><br />
gráficos 6 y 7)-, son Estación Central (19,05%-59,21%), Las Con<strong>de</strong>s (15,38% -<br />
50,17%), Lo Barnechea (0,91% - 23,98%), Recoleta (7,41% - 67,22%), y Vitacura<br />
(8,89% - 47,55%)<br />
Gráfico 7 Permisos Acogidos a Fusión <strong>de</strong> Terrenos, respecto <strong>de</strong>l total comunal<br />
(%)<br />
100%<br />
80%<br />
60%<br />
40%<br />
20%<br />
0%<br />
1 2 3 4 5 6 7 8 9 10 11 12 13 14 15 16 17 18 19 20 21 22 23 24 25 26 27 28 29 30 31 32 33 34<br />
Permisos Acogidos a Fusión <strong>de</strong> Terrenos Resto <strong>de</strong> Permisos<br />
Fuente: E<strong>la</strong>boración Propia, <strong>sobre</strong> <strong>la</strong> base <strong>de</strong> datos INE y MINVU, año 2006<br />
ÑUÑOA<br />
P. AGUIRRE CERDA (**)<br />
PEÑALOLÉN<br />
PROVIDENCIA<br />
PUDAHUEL<br />
PUENTE ALTO<br />
QUILICURA<br />
QUINTA NORMAL<br />
RECOLETA (**)<br />
RENCA<br />
SAN BERNARDO<br />
SAN JOAQUÍN<br />
SAN MIGUEL (**)<br />
SAN RAMÓN<br />
SANTIAGO<br />
VITACURA