estadísticas históricas de población de la región de murcia
estadísticas históricas de población de la región de murcia
estadísticas históricas de población de la región de murcia

You also want an ePaper? Increase the reach of your titles
YUMPU automatically turns print PDFs into web optimized ePapers that Google loves.
ESTADÍSTICAS HISTÓRICAS<br />
DE POBLACIÓN<br />
DE LA REGIÓN DE MURCIA
Edita: Consejería <strong>de</strong> Economía y Hacienda<br />
Comunidad Autónoma <strong>de</strong> <strong>la</strong> Región <strong>de</strong> Murcia<br />
E<strong>la</strong>bora: Dirección General <strong>de</strong> Economía y P<strong>la</strong>nificación<br />
Centro Regional <strong>de</strong> Estadística <strong>de</strong> Murcia<br />
C/ Alejandro Seiquer, 11-2º<br />
30001-MURCIA<br />
Tfnos.: (968) 362050 / 362051<br />
Fax: (968) 362052<br />
Imprime: Imprenta Regional <strong>de</strong> Murcia<br />
I.S.B.N.: 84-89578-07-9<br />
Depósito Legal:<br />
Equipo <strong>de</strong> trabajo:<br />
Coordianación y selección <strong>de</strong> datos: Marisa Ballesta Gómez.<br />
Hoja <strong>de</strong> Cálculo, fotocomposición y grabación: Eugenio Blesa Pedreño, Magdalena Carreño López, Beatriz López Capil<strong>la</strong>.<br />
© Copyright/Derechos reservados. (Se autoriza <strong>la</strong> reproducción parcial citando <strong>la</strong> fuente)
PRESENTACIÓN<br />
El conocimiento <strong>de</strong>l pasado <strong>de</strong>mográfico <strong>de</strong> nuestra Región es ineludible para<br />
evaluar y analizar <strong>la</strong>s causas que han motivado su evolución hasta <strong>la</strong> realidad<br />
presente, y aporta información sustantiva para que mejor p<strong>la</strong>nifiquemos su futuro.<br />
Un <strong>de</strong>tal<strong>la</strong>do examen <strong>de</strong> <strong>la</strong>s cifras proporcionadas por <strong>la</strong>s <strong>estadísticas</strong> <strong>de</strong> <strong>pob<strong>la</strong>ción</strong>,<br />
a menudo reve<strong>la</strong> o proporciona indicios sobre aspectos económicos y sociológicos<br />
muy significativos que, en última instancia, <strong>la</strong>s justifican.<br />
La obra que, con el título ESTADÍSTICAS HISTÓRICAS DE POBLACIÓN DE LA<br />
REGIÓN DE MURCIA, me comp<strong>la</strong>zco en presentar, es un compendio <strong>de</strong> toda <strong>la</strong><br />
información <strong>de</strong>mográfica existente sobre <strong>la</strong> provincia <strong>de</strong> Murcia, que se remonta al<br />
Censo <strong>de</strong> Floridab<strong>la</strong>nca <strong>de</strong> 1787. En su e<strong>la</strong>boración, por el Centro Regional <strong>de</strong><br />
Estadística, perteneciente a <strong>la</strong> Dirección General <strong>de</strong> Economía y P<strong>la</strong>nifación <strong>de</strong> mi<br />
Departamento, ha sido preciso conseguir y consultar múltiples publicaciones, y<br />
<strong>de</strong>dicar buenas dosis <strong>de</strong> ilusión y esfuerzo a extraer <strong>la</strong> información <strong>de</strong> interés y<br />
presentar<strong>la</strong> <strong>de</strong> forma or<strong>de</strong>nada.<br />
Con esta publicación, a<strong>de</strong>más <strong>de</strong> contribuir a <strong>la</strong> difusión estadística, se pone en<br />
manos <strong>de</strong> los investigadores <strong>de</strong> <strong>la</strong> <strong>de</strong>mografía <strong>de</strong> nuestra Región una valiosa<br />
herramienta que, a buen seguro, ahorrará gran cantidad <strong>de</strong> tiempo y esfuerzos que<br />
<strong>de</strong> otra forma se <strong>de</strong>berían invertir en conseguir <strong>la</strong> información recopi<strong>la</strong>da.<br />
JUAN BERNAL ROLDÁN<br />
Consejero <strong>de</strong> Economía y<br />
Hacienda<br />
3
INTRODUCCIÓN<br />
Des<strong>de</strong> el siglo XVII hasta finales <strong>de</strong> los años cuarenta <strong>de</strong> nuestro siglo, <strong>la</strong>s <strong>estadísticas</strong> <strong>de</strong><br />
<strong>pob<strong>la</strong>ción</strong> en nuestro país han sufrido notables altibajos en calidad y cantidad, aspectos que han ido<br />
asociados a <strong>la</strong> fortaleza <strong>de</strong> los distintos gobiernos encargados <strong>de</strong> su e<strong>la</strong>boración, pues<br />
tradicionalmente ciertos sectores <strong>de</strong> <strong>la</strong> <strong>pob<strong>la</strong>ción</strong> han visto en estas operaciones un instrumento para<br />
aumentar <strong>la</strong>s contribuciones o <strong>la</strong>s cargas fiscales, por lo que siempre encontraron <strong>la</strong> resistencia <strong>de</strong><br />
quienes, con <strong>la</strong> ocultación, pretendían perpetuar el frau<strong>de</strong>. A pesar <strong>de</strong> estas limitaciones, es posible<br />
encontrar información <strong>de</strong>mográfica muy variada y proce<strong>de</strong>nte <strong>de</strong> diversas fuentes sobre <strong>la</strong> provincia<br />
<strong>de</strong> Murcia, que se remonta al Censo <strong>de</strong> 1787 <strong>de</strong> Floridab<strong>la</strong>nca y al Movimiento Natural <strong>de</strong> <strong>la</strong> Pob<strong>la</strong>ción<br />
1858-1861.<br />
En esta publicación se incluye toda <strong>la</strong> información <strong>de</strong>mográfica <strong>de</strong> interés obre <strong>la</strong> Región <strong>de</strong><br />
Murcia que nos ha sido posible compi<strong>la</strong>r, a pesar <strong>de</strong> <strong>la</strong> carencia <strong>de</strong> datos en algunos años intermedios<br />
y <strong>de</strong> los cambios que se han ido produciendo en los conceptos y c<strong>la</strong>sificaciones. Así mismo, se<br />
ofrecen cifras municipales a pesar <strong>de</strong> los diferentes criterios en re<strong>la</strong>ción a los municipios elegidos en<br />
función <strong>de</strong> su tamaño. Conviene reseñar que no se ha incluido <strong>la</strong> información que sobre <strong>pob<strong>la</strong>ción</strong> y<br />
<strong>de</strong>mografía proporciona el Diccionario Geográfico-Estadístico-Histórico <strong>de</strong> Pascual Madoz, pues esta<br />
Dirección General ya publicó un volumen conteniendo los artículos o voces referentes a <strong>la</strong> Región <strong>de</strong><br />
Murcia incluidos en dicho Diccionario.<br />
Las fuentes <strong>de</strong> información utilizadas han sido los Censos <strong>de</strong> Pob<strong>la</strong>ción, Rectificaciones<br />
Padronales y los Movimientos Naturales <strong>de</strong> <strong>la</strong> Pob<strong>la</strong>ción <strong>de</strong>l INE, bien en publicaciones, bien en<br />
microfichas. El Censo <strong>de</strong> 1991 y el Movimiento Natural <strong>de</strong> <strong>la</strong> Pob<strong>la</strong>ción <strong>de</strong> 1993 son datos <strong>de</strong>l Centro<br />
Regional <strong>de</strong> Estadística. La información sobre Migraciones se ha obtenido <strong>de</strong>l Anuario Estadístico <strong>de</strong><br />
España, y a partir <strong>de</strong> 1983 <strong>de</strong> <strong>la</strong> publicación específica sobre migraciones, ambas también <strong>de</strong>l INE.<br />
La publicación se estructura en cinco capítulos. El primero ofrece <strong>la</strong> evolución <strong>de</strong> <strong>la</strong> <strong>pob<strong>la</strong>ción</strong><br />
<strong>de</strong>s<strong>de</strong> 1787, así como <strong>la</strong> estructura por sexo y edad c<strong>la</strong>sificada en distintos intervalos según el Censo<br />
correspondiente.<br />
El capítulo segundo ofrece <strong>la</strong> misma información que el primero, pero <strong>de</strong>sagregada a nivel<br />
municipal. La estructura por sexo y edad no se explota para todos los municipios hasta el Censo <strong>de</strong><br />
1981, aunque sólo en tres gran<strong>de</strong>s grupos <strong>de</strong> edad y en datos porcentuales. Del Censo <strong>de</strong> Pob<strong>la</strong>ción<br />
<strong>de</strong> 1991 si disponemos <strong>de</strong> los datos <strong>de</strong> los cuarenta y cinco municipios y <strong>de</strong> <strong>la</strong>s entida<strong>de</strong>s <strong>de</strong><br />
<strong>pob<strong>la</strong>ción</strong> a los más elevados niveles <strong>de</strong> <strong>de</strong>sagregación, merced a <strong>la</strong> explotación <strong>de</strong> los datos<br />
censales realizada por el CREM.<br />
El tercer y cuarto capítulo presentan datos <strong>de</strong>l MNP <strong>de</strong> toda <strong>la</strong> provincia y <strong>de</strong> <strong>la</strong> capital, y a nivel<br />
municipal, respectivamente. Los sucesos se reflejan por lugar <strong>de</strong> inscripción, y a partir <strong>de</strong> 1975 por<br />
lugar <strong>de</strong> resi<strong>de</strong>ncia. Es también a partir <strong>de</strong> este año cuando tenemos <strong>la</strong> información para todos los<br />
municipios.<br />
En el quinto capítulo se recogen los Movimientos Migratorios tanto interiores como exteriores, así<br />
como los extranjeros resi<strong>de</strong>ntes.<br />
Por último, me atrevo a aventurar una buena acogida a esta publicación entre los estudiosos <strong>de</strong><br />
<strong>la</strong> historia regional, y <strong>de</strong>seo expresar mi reconocimiento a los profesionales <strong>de</strong>l CREM que han<br />
participado en su e<strong>la</strong>boración.<br />
LUIS MARTÍNEZ DE SALAS Y GARRIGUES<br />
Director General <strong>de</strong> Economía y P<strong>la</strong>nificación<br />
5
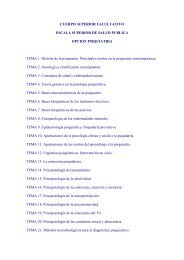
ÍNDICE<br />
Página<br />
PRESENTACIÓN. ............................................................................................................................................ 3<br />
INTRODUCCIÓN.. ............................................................................................................................................ 5<br />
UN POCO DE HISTORIA................................................................................................................................ 13<br />
ACLARACIONES Y CONCEPTOS.. ............................................................................................................. 15<br />
CAPÍTULO 1: CENSOS. DATOS REGIONALES....................................................................................... 19<br />
1.1. Evolución <strong>de</strong> <strong>la</strong> <strong>pob<strong>la</strong>ción</strong> <strong>de</strong> <strong>de</strong>recho y <strong>de</strong> hecho según los censos oficiales. 1787-1991. ............. 21<br />
1.2. Estructuras por sexo y edad <strong>de</strong> <strong>la</strong> <strong>pob<strong>la</strong>ción</strong> según los censos oficiales. 1787-1991.<br />
1.2.1. Estructuras por sexo y edad <strong>de</strong> <strong>la</strong> <strong>pob<strong>la</strong>ción</strong> <strong>de</strong> hecho según los censos oficiales. 1787..... 21<br />
1.2.2. Estructuras por sexo y edad <strong>de</strong> <strong>la</strong> <strong>pob<strong>la</strong>ción</strong> <strong>de</strong> hecho según los censos oficiales. 1857..... 22<br />
1.2.3. Estructuras por sexo y edad <strong>de</strong> <strong>la</strong> <strong>pob<strong>la</strong>ción</strong> <strong>de</strong> hecho según los censos oficiales. 1860..... 22<br />
1.2.4. Estructuras por sexo y edad <strong>de</strong> <strong>la</strong> <strong>pob<strong>la</strong>ción</strong> <strong>de</strong> hecho según los censos oficiales.<br />
1877 y 1887............................................................................................................................ 23<br />
1.2.5. Estructuras por sexo y edad <strong>de</strong> <strong>la</strong> <strong>pob<strong>la</strong>ción</strong> <strong>de</strong> hecho según los censos oficiales.<br />
1900-1940. ............................................................................................................................. 24<br />
1.2.6. Estructuras por sexo y edad <strong>de</strong> <strong>la</strong> <strong>pob<strong>la</strong>ción</strong> <strong>de</strong> hecho según los censos oficiales. 1950..... 28<br />
1.2.7. Estructuras por sexo y edad <strong>de</strong> <strong>la</strong> <strong>pob<strong>la</strong>ción</strong> <strong>de</strong> <strong>de</strong>recho según los censos oficiales.<br />
1960-1991. ............................................................................................................................. 29<br />
1.3. Evolución <strong>de</strong> <strong>la</strong> <strong>pob<strong>la</strong>ción</strong> <strong>de</strong> <strong>de</strong>recho por sexo según rectificaciones <strong>de</strong>l padrón municipal<br />
<strong>de</strong> habitantes. 1940-1995. ................................................................................................................. 33<br />
CAPÍTULO 2: CENSOS. DATOS MUNICIPALES...................................................................................... 35<br />
2.1. Evolución <strong>de</strong> <strong>la</strong> <strong>pob<strong>la</strong>ción</strong> <strong>de</strong> hecho según los censos oficiales. 1787-1991.<br />
2.1.1. Evolución <strong>de</strong> <strong>la</strong> <strong>pob<strong>la</strong>ción</strong> <strong>de</strong> hecho según los censos oficiales. 1787-1991.<br />
Ambos sexos.......................................................................................................................... 37<br />
2.1.2. Evolución <strong>de</strong> <strong>la</strong> <strong>pob<strong>la</strong>ción</strong> <strong>de</strong> hecho según los censos oficiales. 1787-1991.<br />
Hombres................................................................................................................................. 39<br />
2.1.3. Evolución <strong>de</strong> <strong>la</strong> <strong>pob<strong>la</strong>ción</strong> <strong>de</strong> hecho según los censos oficiales. 1787-1991.<br />
Mujeres................................................................................................................................... 41<br />
2.2. Evolución <strong>de</strong> <strong>la</strong> <strong>pob<strong>la</strong>ción</strong> <strong>de</strong> <strong>de</strong>recho según los censos oficiales. 1877-1991.<br />
2.2.1. Evolución <strong>de</strong> <strong>la</strong> <strong>pob<strong>la</strong>ción</strong> <strong>de</strong> <strong>de</strong>recho según los censos oficiales. 1877-1991.<br />
Ambos sexos.......................................................................................................................... 43<br />
2.2.2. Evolución <strong>de</strong> <strong>la</strong> <strong>pob<strong>la</strong>ción</strong> <strong>de</strong> <strong>de</strong>recho según los censos oficiales. 1877-1991. Hombres..... 45<br />
2.2.3. Evolución <strong>de</strong> <strong>la</strong> <strong>pob<strong>la</strong>ción</strong> <strong>de</strong> <strong>de</strong>recho según los censos oficiales. 1877-1991. Mujeres....... 47<br />
2.3. Evolución <strong>de</strong> <strong>la</strong> <strong>pob<strong>la</strong>ción</strong> <strong>de</strong> <strong>de</strong>recho según rectificaciones <strong>de</strong>l padrón municipal <strong>de</strong> habitantes.<br />
1940-1995.<br />
2.3.1. Evolución <strong>de</strong> <strong>la</strong> <strong>pob<strong>la</strong>ción</strong> <strong>de</strong> <strong>de</strong>recho según rectificaciones <strong>de</strong>l padrón municipal <strong>de</strong><br />
habitantes. 1940-1995. Ambos sexos.................................................................................... 49<br />
2.3.2. Evolución <strong>de</strong> <strong>la</strong> <strong>pob<strong>la</strong>ción</strong> <strong>de</strong> <strong>de</strong>recho según rectificaciones <strong>de</strong>l padrón municipal <strong>de</strong><br />
habitantes. 1940-1995. Hombres........................................................................................... 56<br />
2.3.3. Evolución <strong>de</strong> <strong>la</strong> <strong>pob<strong>la</strong>ción</strong> <strong>de</strong> <strong>de</strong>recho según rectificaciones <strong>de</strong>l padrón municipal <strong>de</strong><br />
habitantes. 1940-1995. Mujeres............................................................................................. 63<br />
Estadísticas Históricas <strong>de</strong> Pob<strong>la</strong>ción <strong>de</strong> <strong>la</strong> Región <strong>de</strong> Murcia. 7
2.4. Estructura por sexo y grupos <strong>de</strong> edad <strong>de</strong> <strong>la</strong> <strong>pob<strong>la</strong>ción</strong> <strong>de</strong> hecho según el censo <strong>de</strong> 1900.<br />
2.4.1. Estructura por sexo y grupos <strong>de</strong> edad <strong>de</strong> <strong>la</strong> <strong>pob<strong>la</strong>ción</strong> <strong>de</strong> hecho según el censo <strong>de</strong> 1900.<br />
Ambos sexos. ......................................................................................................................... 70<br />
2.4.2. Estructura por sexo y grupos <strong>de</strong> edad <strong>de</strong> <strong>la</strong> <strong>pob<strong>la</strong>ción</strong> <strong>de</strong> hecho según el censo <strong>de</strong> 1900.<br />
Hombres. ................................................................................................................................ 71<br />
2.4.3. Estructura por sexo y grupos <strong>de</strong> edad <strong>de</strong> <strong>la</strong> <strong>pob<strong>la</strong>ción</strong> <strong>de</strong> hecho según el censo <strong>de</strong> 1900.<br />
Mujeres................................................................................................................................... 72<br />
2.5. Estructura por sexo y grupos <strong>de</strong> edad <strong>de</strong> <strong>la</strong> <strong>pob<strong>la</strong>ción</strong> <strong>de</strong> hecho según el censo <strong>de</strong> 1910.<br />
2.5.1. Estructura por sexo y grupos <strong>de</strong> edad <strong>de</strong> <strong>la</strong> <strong>pob<strong>la</strong>ción</strong> <strong>de</strong> hecho según el censo <strong>de</strong> 1910.<br />
Ambos sexos. ......................................................................................................................... 73<br />
2.5.2. Estructura por sexo y grupos <strong>de</strong> edad <strong>de</strong> <strong>la</strong> <strong>pob<strong>la</strong>ción</strong> <strong>de</strong> hecho según el censo <strong>de</strong> 1910.<br />
Hombres. ................................................................................................................................ 74<br />
2.5.3. Estructura por sexo y grupos <strong>de</strong> edad <strong>de</strong> <strong>la</strong> <strong>pob<strong>la</strong>ción</strong> <strong>de</strong> hecho según el censo <strong>de</strong> 1910.<br />
Mujeres................................................................................................................................... 75<br />
2.6. Estructura por sexo y grupos <strong>de</strong> edad <strong>de</strong> <strong>la</strong> <strong>pob<strong>la</strong>ción</strong> <strong>de</strong> hecho según el censo <strong>de</strong> 1920.<br />
2.6.1. Estructura por sexo y grupos <strong>de</strong> edad <strong>de</strong> <strong>la</strong> <strong>pob<strong>la</strong>ción</strong> <strong>de</strong> hecho según el censo <strong>de</strong> 1920.<br />
Ambos sexos. ......................................................................................................................... 76<br />
2.6.2. Estructura por sexo y grupos <strong>de</strong> edad <strong>de</strong> <strong>la</strong> <strong>pob<strong>la</strong>ción</strong> <strong>de</strong> hecho según el censo <strong>de</strong> 1920.<br />
Hombres. ................................................................................................................................ 77<br />
2.6.3. Estructura por sexo y grupos <strong>de</strong> edad <strong>de</strong> <strong>la</strong> <strong>pob<strong>la</strong>ción</strong> <strong>de</strong> hecho según el censo <strong>de</strong> 1920.<br />
Mujeres................................................................................................................................... 78<br />
2.7. Estructura por sexo y grupos <strong>de</strong> edad <strong>de</strong> <strong>la</strong> <strong>pob<strong>la</strong>ción</strong> <strong>de</strong> hecho <strong>de</strong>l municipio <strong>de</strong> Murcia según<br />
el censo <strong>de</strong> 1930................................................................................................................................ 79<br />
2.8. Estructura por sexo y grupos <strong>de</strong> edad <strong>de</strong> <strong>la</strong> <strong>pob<strong>la</strong>ción</strong> <strong>de</strong> hecho según el censo <strong>de</strong> 1940.<br />
2.8.1. Estructura por sexo y grupos <strong>de</strong> edad <strong>de</strong> <strong>la</strong> <strong>pob<strong>la</strong>ción</strong> <strong>de</strong> hecho según el censo <strong>de</strong> 1940.<br />
Ambos sexos. ......................................................................................................................... 80<br />
2.8.2. Estructura por sexo y grupos <strong>de</strong> edad <strong>de</strong> <strong>la</strong> <strong>pob<strong>la</strong>ción</strong> <strong>de</strong> hecho según el censo <strong>de</strong> 1940.<br />
Hombres. ................................................................................................................................ 80<br />
2.8.3. Estructura por sexo y grupos <strong>de</strong> edad <strong>de</strong> <strong>la</strong> <strong>pob<strong>la</strong>ción</strong> <strong>de</strong> hecho según el censo <strong>de</strong> 1940.<br />
Mujeres................................................................................................................................... 81<br />
2.9. Estructura por sexo y grupos <strong>de</strong> edad <strong>de</strong> <strong>la</strong> <strong>pob<strong>la</strong>ción</strong> <strong>de</strong> hecho según el censo <strong>de</strong> 1950.<br />
2.9.1. Estructura por sexo y grupos <strong>de</strong> edad <strong>de</strong> <strong>la</strong> <strong>pob<strong>la</strong>ción</strong> <strong>de</strong> hecho según el censo <strong>de</strong> 1950.<br />
Ambos sexos. ......................................................................................................................... 82<br />
2.9.2. Estructura por sexo y grupos <strong>de</strong> edad <strong>de</strong> <strong>la</strong> <strong>pob<strong>la</strong>ción</strong> <strong>de</strong> hecho según el censo <strong>de</strong> 1950.<br />
Hombres. ................................................................................................................................ 82<br />
2.9.3. Estructura por sexo y grupos <strong>de</strong> edad <strong>de</strong> <strong>la</strong> <strong>pob<strong>la</strong>ción</strong> <strong>de</strong> hecho según el censo <strong>de</strong> 1950.<br />
Mujeres................................................................................................................................... 83<br />
2.10. Estructura por sexo y grupos <strong>de</strong> edad <strong>de</strong> <strong>la</strong> <strong>pob<strong>la</strong>ción</strong> <strong>de</strong> <strong>de</strong>recho según el censo <strong>de</strong> 1960.<br />
2.10.1. Estructura por sexo y grupos <strong>de</strong> edad <strong>de</strong> <strong>la</strong> <strong>pob<strong>la</strong>ción</strong> <strong>de</strong> <strong>de</strong>recho según el censo <strong>de</strong> 1960.<br />
Ambos sexos. ......................................................................................................................... 84<br />
2.10.2. Estructura por sexo y grupos <strong>de</strong> edad <strong>de</strong> <strong>la</strong> <strong>pob<strong>la</strong>ción</strong> <strong>de</strong> <strong>de</strong>recho según el censo <strong>de</strong> 1960.<br />
Hombres................................................................................................................................... 85<br />
2.10.3. Estructura por sexo y grupos <strong>de</strong> edad <strong>de</strong> <strong>la</strong> <strong>pob<strong>la</strong>ción</strong> <strong>de</strong> <strong>de</strong>recho según el censo <strong>de</strong> 1960.<br />
Mujeres................................................................................................................................... 86<br />
2.11. Estructura por sexo y grupos <strong>de</strong> edad <strong>de</strong> <strong>la</strong> <strong>pob<strong>la</strong>ción</strong> <strong>de</strong> <strong>de</strong>recho según el censo <strong>de</strong> 1970.<br />
2.11.1. Estructura por sexo y grupos <strong>de</strong> edad <strong>de</strong> <strong>la</strong> <strong>pob<strong>la</strong>ción</strong> <strong>de</strong> <strong>de</strong>recho según el censo <strong>de</strong> 1970.<br />
Ambos sexos. ......................................................................................................................... 87<br />
2.11.2. Estructura por sexo y grupos <strong>de</strong> edad <strong>de</strong> <strong>la</strong> <strong>pob<strong>la</strong>ción</strong> <strong>de</strong> <strong>de</strong>recho según el censo <strong>de</strong> 1970.<br />
Hombres. ................................................................................................................................ 88<br />
2.11.3. Estructura por sexo y grupos <strong>de</strong> edad <strong>de</strong> <strong>la</strong> <strong>pob<strong>la</strong>ción</strong> <strong>de</strong> <strong>de</strong>recho según el censo <strong>de</strong> 1970.<br />
Mujeres................................................................................................................................... 89<br />
2.12. Estructura por sexo y grupos <strong>de</strong> edad <strong>de</strong> <strong>la</strong> <strong>pob<strong>la</strong>ción</strong> <strong>de</strong> <strong>de</strong>recho según el censo <strong>de</strong> 1981. Datos<br />
porcentuales.. .................................................................................................................................... 90<br />
8 Estadísticas Históricas <strong>de</strong> Pob<strong>la</strong>ción <strong>de</strong> <strong>la</strong> Región <strong>de</strong> Murcia.
2.13. Estructura por sexo y grupos <strong>de</strong> edad <strong>de</strong> <strong>la</strong> <strong>pob<strong>la</strong>ción</strong> <strong>de</strong> <strong>de</strong>recho según el censo <strong>de</strong> 1991.<br />
2.13.1. Estructura por sexo y grupos <strong>de</strong> edad <strong>de</strong> <strong>la</strong> <strong>pob<strong>la</strong>ción</strong> <strong>de</strong> <strong>de</strong>recho según el censo <strong>de</strong> 1991.<br />
Ambos sexos.......................................................................................................................... 91<br />
2.13.2. Estructura por sexo y grupos <strong>de</strong> edad <strong>de</strong> <strong>la</strong> <strong>pob<strong>la</strong>ción</strong> <strong>de</strong> <strong>de</strong>recho según el censo <strong>de</strong> 1991.<br />
Hombres................................................................................................................................. 93<br />
2.13.3. Estructura por sexo y grupos <strong>de</strong> edad <strong>de</strong> <strong>la</strong> <strong>pob<strong>la</strong>ción</strong> <strong>de</strong> <strong>de</strong>recho según el censo <strong>de</strong> 1991.<br />
Mujeres.................................................................................................................................. 95<br />
CAPÍTULO 3: MOVIMIENTO NATURAL DE LA POBLACIÓN. DATOS REGIONALES.................... 97<br />
NACIMIENTOS Y DEFUNCIONES.<br />
PARTOS.<br />
3.1. Evolución <strong>de</strong> los nacimientos y <strong>de</strong>funciones por sexo y lugar <strong>de</strong> inscripción.<br />
3.1.1. Evolución <strong>de</strong> los nacimientos y <strong>de</strong>funciones por sexo y lugar <strong>de</strong> inscripción.<br />
1858-1993. Provincia.............................................................................................................. 99<br />
3.1.2. Evolución <strong>de</strong> los nacimientos y <strong>de</strong>funciones por sexo y lugar <strong>de</strong> inscripción.<br />
1861-1993. Capital................................................................................................................... 102<br />
3.2. Evolución <strong>de</strong> los nacimientos y <strong>de</strong>funciones por sexo y lugar <strong>de</strong> resi<strong>de</strong>ncia 1975-1993<br />
3.2.1. Evolución <strong>de</strong> los nacimientos y <strong>de</strong>funciones por sexo y lugar <strong>de</strong> resi<strong>de</strong>ncia. 1975-1993.<br />
Provincia................................................................................................................................. 104<br />
3.2.2. Evolución <strong>de</strong> los nacimientos y <strong>de</strong>funciones por sexo y lugar <strong>de</strong> resi<strong>de</strong>ncia. 1975-1993.<br />
Capital. ................................................................................................................................... 105<br />
3.3. Evolución <strong>de</strong> los nacimientos por edad y estado civil <strong>de</strong> <strong>la</strong> madre. 1975-1993.<br />
3.3.1. Evolución <strong>de</strong> los nacimientos por edad y estado civil <strong>de</strong> <strong>la</strong> madre. 1975-1993. Provincia. ... 106<br />
3.3.2. Evolución <strong>de</strong> los nacimientos por edad y estado civil <strong>de</strong> <strong>la</strong> madre. 1975-1993. Capital........ 112<br />
3.4. Evolución <strong>de</strong> los nacimientos por meses. 1975-1993. Provincia. ..................................................... 118<br />
3.5. Evolución <strong>de</strong> <strong>la</strong>s <strong>de</strong>funciones por edad y sexo. Provincia.<br />
3.5.1. Evolución <strong>de</strong> <strong>la</strong>s <strong>de</strong>funciones por edad y sexo. Provincia. 1861-1870. ................................. 119<br />
3.5.2. Evolución <strong>de</strong> <strong>la</strong>s <strong>de</strong>funciones por edad y sexo. Provincia. 1900-1993. ................................. 121<br />
3.6. Evolución <strong>de</strong> <strong>la</strong>s <strong>de</strong>funciones por meses. 1975-1993. Provincia. ..................................................... 124<br />
3.7. Evolución <strong>de</strong>l crecimiento vegetativo. 1861-1993. Provincia y capital............................................... 125<br />
3.8. Alumbramientos por multiplicidad según lugar <strong>de</strong> inscripción. 1863-1974.<br />
3.8.1. Alumbramientos por multiplicidad según lugar <strong>de</strong> inscripción. 1863-1974. Provincia. .......... 127<br />
3.8.2. Alumbramientos por multiplicidad según lugar <strong>de</strong> inscripción. 1863-1974. Capital. .............. 129<br />
3.9. Partos por multiplicidad según lugar <strong>de</strong> resi<strong>de</strong>ncia <strong>de</strong> <strong>la</strong> madre. 1975-1993.<br />
3.9.1. Partos por multiplicidad según lugar <strong>de</strong> resi<strong>de</strong>ncia <strong>de</strong> <strong>la</strong> madre. 1975-1993. Provincia........ 130<br />
3.9.2. Partos por multiplicidad según lugar <strong>de</strong> resi<strong>de</strong>ncia <strong>de</strong> <strong>la</strong> madre. 1975-1993. Capital. .......... 131<br />
ABORTOS Y MUERTES FETALES TARDÍAS.<br />
3.10. Evolución <strong>de</strong> los abortos por lugar <strong>de</strong> inscripción. 1861-1974.<br />
3.10.1. Evolución <strong>de</strong> los abortos por lugar <strong>de</strong> inscripción. 1861-1974. Provincia.<br />
3.10.1.1. Evolución <strong>de</strong> los abortos por lugar <strong>de</strong> inscripción. 1861-1974. Provincia.<br />
1861-1870............................................................................................................... 132<br />
3.10.1.2. Evolución <strong>de</strong> los abortos por lugar <strong>de</strong> inscripción. 1861-1974. Provincia.<br />
1900-1974............................................................................................................... 133<br />
3.10.2. Evolución <strong>de</strong> los abortos por lugar <strong>de</strong> inscripción. 1861-1974. Capital.<br />
3.10.2.1. Evolución <strong>de</strong> los abortos por lugar <strong>de</strong> inscripción. 1861-1974. Capital.<br />
1861-1870............................................................................................................... 134<br />
3.10.2.2. Evolución <strong>de</strong> los abortos por lugar <strong>de</strong> inscripción. 1861-1974. Capital.<br />
1900-1974............................................................................................................... 135<br />
Estadísticas Históricas <strong>de</strong> Pob<strong>la</strong>ción <strong>de</strong> <strong>la</strong> Región <strong>de</strong> Murcia. 9
3.11. Evolución <strong>de</strong> <strong>la</strong>s muertes fetales tardías por lugar <strong>de</strong> inscripción. 1975-1993. Provincia y capital... 136<br />
3.12. Evolución <strong>de</strong> <strong>la</strong>s muertes fetales tardías por lugar <strong>de</strong> resi<strong>de</strong>ncia <strong>de</strong> <strong>la</strong> madre. 1975-1993.<br />
Provincia y capital. ............................................................................................................................. 137<br />
MATRIMONIOS.<br />
3.13. Evolución <strong>de</strong> los matrimonios según el estado civil anterior <strong>de</strong> cada cónyuge, por lugar <strong>de</strong><br />
celebración.<br />
3.13.1. Evolución <strong>de</strong> los matrimonios según el estado civil anterior <strong>de</strong> cada cónyuge, por lugar <strong>de</strong><br />
celebración. 1858-1974. Provincia. ........................................................................................ 138<br />
3.13.2. Evolución <strong>de</strong> los matrimonios según el estado civil anterior <strong>de</strong> cada cónyuge, por lugar <strong>de</strong><br />
celebración. 1861-1974. Capital. ............................................................................................ 140<br />
3.14. Evolución <strong>de</strong> los matrimonios por lugar <strong>de</strong> celebración. 1975-1993. Provincia y capital. ................. 142<br />
3.15. Evolución <strong>de</strong> los matrimonios según el estado civil anterior <strong>de</strong> cada cónyuge por lugar <strong>de</strong><br />
resi<strong>de</strong>ncia. 1975-1992.<br />
3.15.1. Evolución <strong>de</strong> los matrimonios según el estado civil anterior <strong>de</strong> cada cónyuge por lugar <strong>de</strong><br />
resi<strong>de</strong>ncia. 1975-1992. Provincia. ......................................................................................... 143<br />
3.15.2. Evolución <strong>de</strong> los matrimonios según el estado civil anterior <strong>de</strong> cada cónyuge por lugar <strong>de</strong><br />
resi<strong>de</strong>ncia. 1975-1992. Capital.............................................................................................. 144<br />
3.16. Evolución <strong>de</strong> los matrimonios por sexo y edad, por lugar <strong>de</strong> celebración. 1863-1974.<br />
3.16.1. Evolución <strong>de</strong> los matrimonios por sexo y edad, por lugar <strong>de</strong> celebración. 1863-1974.<br />
Provincia.<br />
3.16.1.1. Evolución <strong>de</strong> los matrimonios por sexo y edad, por lugar <strong>de</strong> celebración.<br />
1863-1870. Provincia. .............................................................................................. 144<br />
3.16.1.2. Evolución <strong>de</strong> los matrimonios por sexo y edad, por lugar <strong>de</strong> celebración.<br />
1900-1931. Provincia ............................................................................................... 145<br />
3.16.1.3. Evolución <strong>de</strong> los matrimonios por sexo y edad, por lugar <strong>de</strong> celebración.<br />
1932-1974. Provincia ............................................................................................... 146<br />
3.16.2. Evolución <strong>de</strong> los matrimonios por sexo y edad, por lugar <strong>de</strong> celebración. 1863-1974.<br />
Capital.<br />
3.16.2.1. Evolución <strong>de</strong> los matrimonios por sexo y edad, por lugar <strong>de</strong> celebración.<br />
1863-1870. Capital ................................................................................................... 148<br />
3.16.2.2. Evolución <strong>de</strong> los matrimonios por sexo y edad, por lugar <strong>de</strong> celebración.<br />
1900-1931. Capital ................................................................................................... 149<br />
3.16.2.3. Evolución <strong>de</strong> los matrimonios por sexo y edad, por lugar <strong>de</strong> celebración.<br />
1932-1974. Capital ................................................................................................... 150<br />
3.17. Evolución <strong>de</strong> los matrimonios por sexo y edad, por lugar <strong>de</strong> resi<strong>de</strong>ncia. 1975-1992.<br />
3.17.1. Evolución <strong>de</strong> los matrimonios por sexo y edad, por lugar <strong>de</strong> resi<strong>de</strong>ncia. 1975-1992.<br />
Provincia. ................................................................................................................................ 153<br />
3.17.2. Evolución <strong>de</strong> los matrimonios por sexo y edad, por lugar <strong>de</strong> resi<strong>de</strong>ncia. 1975-1992.<br />
Capital..................................................................................................................................... 157<br />
TASAS Y POBLACIÓN CALCULADA.<br />
3.18. Evolución <strong>de</strong> <strong>la</strong> nupcialidad, natalidad, mortalidad y mortalidad infantil. Provincia. 1900-1993. ....... 161<br />
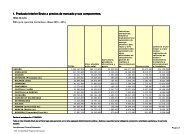
3.19. Pob<strong>la</strong>ción Calcu<strong>la</strong>da. Provincia y capital. 1900-1994. ....................................................................... 163<br />
CAPÍTULO 4: MOVIMIENTO NATURAL DE LA POBLACIÓN. DATOS MUNICIPALES.................... 165<br />
NACIMIENTOS Y DEFUNCIONES.<br />
4.1. Evolución <strong>de</strong> los nacimientos por lugar <strong>de</strong> inscripción. 1886-1992.<br />
4.1.1. Evolución <strong>de</strong> los nacimientos por lugar <strong>de</strong> inscripción. 1886-1892........................................ 167<br />
4.1.2. Evolución <strong>de</strong> los nacimientos por lugar <strong>de</strong> inscripción. 1900-1933........................................ 168<br />
4.1.3. Evolución <strong>de</strong> los nacimientos por lugar <strong>de</strong> inscripción. 1941-1974........................................ 170<br />
10 Estadísticas Históricas <strong>de</strong> Pob<strong>la</strong>ción <strong>de</strong> <strong>la</strong> Región <strong>de</strong> Murcia.
PARTOS.<br />
4.1.4. Evolución <strong>de</strong> los nacimientos por lugar <strong>de</strong> inscripción. 1975-1992........................................ 171<br />
4.2. Evolución <strong>de</strong> los nacimientos por lugar <strong>de</strong> resi<strong>de</strong>ncia <strong>de</strong> <strong>la</strong> madre. 1975-1993. .............................. 173<br />
4.3. Evolución <strong>de</strong> <strong>la</strong>s <strong>de</strong>funciones por lugar <strong>de</strong> inscripción. 1886-1992.<br />
4.3.1. Evolución <strong>de</strong> <strong>la</strong>s <strong>de</strong>funciones por lugar <strong>de</strong> inscripción. 1886-1892. ...................................... 175<br />
4.3.2. Evolución <strong>de</strong> <strong>la</strong>s <strong>de</strong>funciones por lugar <strong>de</strong> inscripción. 1900-1933. ...................................... 176<br />
4.3.3. Evolución <strong>de</strong> <strong>la</strong>s <strong>de</strong>funciones por lugar <strong>de</strong> inscripción. 1941-1974. ...................................... 178<br />
4.3.4. Evolución <strong>de</strong> <strong>la</strong>s <strong>de</strong>funciones por lugar <strong>de</strong> inscripción. 1975-1992. ...................................... 179<br />
4.4. Evolución <strong>de</strong> <strong>la</strong>s <strong>de</strong>funciones por lugar <strong>de</strong> resi<strong>de</strong>ncia <strong>de</strong>l fallecido. 1975-1993. .............................. 181<br />
4.5. Evolución <strong>de</strong>l crecimiento vegetativo. 1975-1993. ............................................................................ 183<br />
4.6. Evolución <strong>de</strong> los partos por lugar <strong>de</strong> resi<strong>de</strong>ncia <strong>de</strong> <strong>la</strong> madre. 1975-1993......................................... 185<br />
MUERTES FETALES TARDÍAS.<br />
4.7. Evolución <strong>de</strong> <strong>la</strong>s muertes fetales tardías por lugar <strong>de</strong> resi<strong>de</strong>ncia <strong>de</strong> <strong>la</strong> madre. 1975-1993.............. 187<br />
MATRIMONIOS.<br />
TASAS.<br />
4.8. Evolución <strong>de</strong> los matrimonios por lugar <strong>de</strong> celebración. 1886-1992.<br />
4.8.1. Evolución <strong>de</strong> los matrimonios por lugar <strong>de</strong> celebración. 1886-1892...................................... 189<br />
4.8.2. Evolución <strong>de</strong> los matrimonios por lugar <strong>de</strong> celebración. 1900-1933...................................... 190<br />
4.8.3. Evolución <strong>de</strong> los matrimonios por lugar <strong>de</strong> celebración. 1941-1974...................................... 192<br />
4.8.4. Evolución <strong>de</strong> los matrimonios por lugar <strong>de</strong> celebración. 1975-1992...................................... 193<br />
4.9. Evolución <strong>de</strong> los matrimonios por lugar <strong>de</strong> resi<strong>de</strong>ncia. 1975-1992. .................................................. 195<br />
4.10. Evolución <strong>de</strong> <strong>la</strong> natalidad. 1976-1992................................................................................................ 197<br />
4.11. Evolución <strong>de</strong> <strong>la</strong> mortalidad. 1976-1992. ............................................................................................ 199<br />
4.12. Evolución <strong>de</strong> <strong>la</strong> nupcialidad. 1976-1992. ........................................................................................... 201<br />
CAPITULO 5: MIGRACIONES....................................................................................................................... 203<br />
MIGRACIONES INTERIORES.<br />
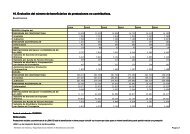
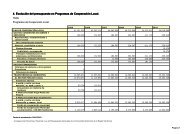
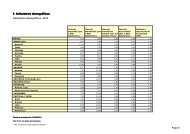
5.1. Evolución <strong>de</strong> los inmigrantes, emigrantes y saldo migratorio por sexo. 1949-1993.......................... 205<br />
5.2. Evolución <strong>de</strong> los inmigrantes por provincias <strong>de</strong> proce<strong>de</strong>ncia. 1962-1993......................................... 206<br />
5.3. Evolución <strong>de</strong> los emigrantes por provincias <strong>de</strong> <strong>de</strong>stino. 1962-1993. ................................................ 209<br />
5.4. Evolución <strong>de</strong> los inmigrantes por sexo, edad y estado civil. 1962-1993. .......................................... 212<br />
5.5. Evolución <strong>de</strong> los emigrantes por sexo, edad y estado civil. 1962-1993. ........................................... 213<br />
5.6. Evolución <strong>de</strong> los inmigrantes por tipo <strong>de</strong> actividad.<br />
5.6.1. Evolución <strong>de</strong> los inmigrantes por tipo <strong>de</strong> actividad. 1962-1968. ............................................ 214<br />
5.6.2. Evolución <strong>de</strong> los inmigrantes por tipo <strong>de</strong> actividad. 1969-1986. ............................................ 214<br />
5.7. Evolución <strong>de</strong> los emigrantes por tipo <strong>de</strong> actividad.<br />
5.7.1. Evolución <strong>de</strong> los emigrantes por tipo <strong>de</strong> actividad. 1962-1968. ............................................. 215<br />
5.7.2. Evolución <strong>de</strong> los emigrantes por tipo <strong>de</strong> actividad. 1969-1986. ............................................. 215<br />
Estadísticas Históricas <strong>de</strong> Pob<strong>la</strong>ción <strong>de</strong> <strong>la</strong> Región <strong>de</strong> Murcia. 11
5.8. Evolución <strong>de</strong> los inmigrantes por titu<strong>la</strong>ción académica. 1988-1993. ................................................. 216<br />
5.9. Evolución <strong>de</strong> los emigrantes por titu<strong>la</strong>ción académica. 1988-1993................................................... 216<br />
MIGRACIONES EXTERIORES.<br />
5.10. Evolución <strong>de</strong> los inmigrantes proce<strong>de</strong>ntes <strong>de</strong>l extranjero por sexo, grupos <strong>de</strong> edad y estado civil.<br />
Españoles y extranjeros. 1983-1993. ................................................................................................ 217<br />
5.11. Evolución <strong>de</strong> los inmigrantes proce<strong>de</strong>ntes <strong>de</strong>l extranjero por país <strong>de</strong> proce<strong>de</strong>ncia. 1983-1993....... 218<br />
5.12. Evolución <strong>de</strong> <strong>la</strong> emigración asistida a países europeos por país <strong>de</strong> <strong>de</strong>stino. 1964-1993. ................ 222<br />
5.13. Evolución <strong>de</strong> <strong>la</strong>s migraciones asistidas a países no europeos por sexo y medio <strong>de</strong> transporte.<br />
1962-1984.......................................................................................................................................... 224<br />
5.14. Evolución <strong>de</strong> <strong>la</strong> emigración asistida a países no europeos por país <strong>de</strong> <strong>de</strong>stino.<br />
1985-1993.......................................................................................................................................... 224<br />
EXTRANJEROS RESIDENTES.<br />
5.15. Evolución <strong>de</strong> los extranjeros resi<strong>de</strong>ntes por nacionalidad. 1945-1993.............................................. 225<br />
12 Estadísticas Históricas <strong>de</strong> Pob<strong>la</strong>ción <strong>de</strong> <strong>la</strong> Región <strong>de</strong> Murcia.
UN POCO DE HISTORIA<br />
LOS CENSOS DE POBLACIÓN.<br />
Aunque existen anteriores recuentos <strong>de</strong> <strong>la</strong> <strong>pob<strong>la</strong>ción</strong> con fines fiscales, el primer Censo que se pue<strong>de</strong><br />
consi<strong>de</strong>rar mo<strong>de</strong>rno es el <strong>de</strong> Aranda <strong>de</strong> 1768, ya que <strong>la</strong> unidad básica es <strong>la</strong> persona recogiéndose distintas<br />
características <strong>de</strong> éstas, pero respetando su anonimato. También con fines estadísticos se realizan el Censo <strong>de</strong><br />
Floridab<strong>la</strong>nca <strong>de</strong> 1787 y el Censo <strong>de</strong> Godoy <strong>de</strong> 1797.<br />
Estos Censos <strong>de</strong>l siglo XVIII presentan <strong>de</strong>fectos, como el no realizarse un empadronamiento simultáneo y<br />
otros <strong>de</strong> cobertura quedando c<strong>la</strong>ramente reflejado en <strong>la</strong>s Advertencias <strong>de</strong>l Censo <strong>de</strong> Godoy:<br />
“Aunque el Censo actual comprehen<strong>de</strong> muchos mas artículos que el anterior, no por eso presenta un<br />
resultado completo <strong>de</strong> <strong>la</strong> <strong>pob<strong>la</strong>ción</strong> <strong>de</strong>l Reyno, porque los Pueblos no han dado <strong>la</strong>s razones con <strong>la</strong> exâctitud<br />
que se <strong>de</strong>sea, por creer<strong>la</strong>s dirigidas á aumentar sus contribuciones.<br />
Estas serían seguramente menores en cantidad y en entidad, si se tuvieran noticias circunstanciales<br />
<strong>de</strong>l número <strong>de</strong> vecinos y <strong>de</strong> sus haberes; unas semejantes preocupaciones solo se pue<strong>de</strong>n vencer con <strong>la</strong><br />
repetición <strong>de</strong> los Censos, pues que con ellos verán los mismos Pueblos, que <strong>la</strong>s i<strong>de</strong>as <strong>de</strong>l Gobierno son muy<br />
diferentes <strong>de</strong> <strong>la</strong>s que el error ó <strong>la</strong> pasión les hacen concebir”.<br />
El Instituto Nacional <strong>de</strong> Estadística ha publicado <strong>la</strong> información <strong>de</strong>l Censo <strong>de</strong> Floridab<strong>la</strong>nca en fascículos<br />
provinciales según <strong>la</strong>s provincias actuales, <strong>de</strong>spués <strong>de</strong> hacer una importante <strong>la</strong>bor <strong>de</strong> c<strong>la</strong>sificación <strong>de</strong> todos los<br />
pueblos pertenecientes a <strong>la</strong>s antiguas inten<strong>de</strong>ncias (provincias en 1787). También ha publicado una preciosa<br />
edición facsímil <strong>de</strong>l Censo <strong>de</strong> Godoy reflejando, por tanto, <strong>la</strong>s unida<strong>de</strong>s administrativas que regían entonces y que<br />
no permiten obtener datos para <strong>la</strong> actual provincia <strong>de</strong> Murcia.<br />
El primer Censo <strong>de</strong> Pob<strong>la</strong>ción que se consi<strong>de</strong>ra oficial es el <strong>de</strong> 1857, verificado el 21 <strong>de</strong> Mayo por <strong>la</strong> Comisión<br />
<strong>de</strong> Estadística General <strong>de</strong>l Reino, primer organismo oficial <strong>de</strong> carácter estadístico. También en este Censo se<br />
<strong>de</strong>staca el siguiente comentario en re<strong>la</strong>ción a <strong>la</strong>s dificulta<strong>de</strong>s que encontraron en su realización:<br />
“...En <strong>la</strong>s Pob<strong>la</strong>ciones pequeñas se ha encontrado ordinariamente mas sinceridad que inteligencia; en<br />
<strong>la</strong>s gran<strong>de</strong>s se ha echado <strong>de</strong> ver menos fervor y no siempre bastante or<strong>de</strong>namiento; y en <strong>la</strong>s c<strong>la</strong>ses <strong>de</strong> <strong>la</strong><br />
medianas es don<strong>de</strong> recaen mayores sospechas <strong>de</strong> casos <strong>de</strong> ocultación intencional y maliciosa, porque el<br />
interés les avisa y les recuerda que al crecimiento sigue <strong>la</strong> elevación <strong>de</strong> categoría, con aumentos <strong>de</strong> cuotas en<br />
el pago <strong>de</strong> ciertos impuestos y cargos.”<br />
Al Censo <strong>de</strong> 1857 le siguió el <strong>de</strong> 1860, realizado por <strong>la</strong> Junta General <strong>de</strong> Estadística. Los siguientes Censos<br />
fueron los <strong>de</strong> 1877, 1887, y 1897, realizados por <strong>la</strong> Dirección General <strong>de</strong>l Instituto Geográfico y Estadístico y con<br />
fechas <strong>de</strong> referencia al 31 <strong>de</strong> Diciembre.<br />
El Censo <strong>de</strong> 1887 es el primero que se efectúa en cumplimiento <strong>de</strong> <strong>la</strong> Ley sobre el Estudio <strong>de</strong> <strong>la</strong> Pob<strong>la</strong>ción <strong>de</strong><br />
18 <strong>de</strong> Junio <strong>de</strong> 1887, en <strong>la</strong> que se establece <strong>la</strong> realización <strong>de</strong> los Censos cada diez años. Si bien, el 3 <strong>de</strong> Abril <strong>de</strong><br />
1900 se sanciona una Ley que modifica <strong>la</strong> anterior or<strong>de</strong>nado que los Censos han <strong>de</strong> realizarse en los años<br />
terminados en cero con referencia también al 31 <strong>de</strong> Diciembre. A<strong>de</strong>más en 1900 se celebró <strong>la</strong> Conferencia<br />
Internacional <strong>de</strong> Estadística en Berna promoviéndose celebrar <strong>de</strong> forma simultánea en diferentes países un Censo<br />
General en 1900, así como adoptar un lenguaje común para facilitar <strong>la</strong>s comparaciones <strong>de</strong> los datos censales.<br />
El Instituto Nacional <strong>de</strong> Estadística, creado por Ley <strong>de</strong> 31 <strong>de</strong> Diciembre <strong>de</strong> 1945, cambia <strong>la</strong> operación censal a<br />
los años terminados en uno a partir <strong>de</strong>l Censo <strong>de</strong> 1981 y <strong>la</strong> nueva fecha <strong>de</strong> referencia será el 1 <strong>de</strong> Marzo. Las<br />
razones apuntadas por el Instituto Nacional <strong>de</strong> Estadística son <strong>la</strong>s siguientes: movilidad pob<strong>la</strong>cional a finales <strong>de</strong><br />
año, periodo poco a<strong>de</strong>cuado para los datos <strong>de</strong> actividad económica, climatología adversa, corta duración <strong>de</strong>l día y<br />
dificulta<strong>de</strong>s administrativas. A<strong>de</strong>más <strong>la</strong> nueva fecha se adapta a <strong>la</strong> normativa comanditaria.<br />
Estadísticas Históricas <strong>de</strong> Pob<strong>la</strong>ción <strong>de</strong> <strong>la</strong> Región <strong>de</strong> Murcia. 13
EL MOVIMIENTO NATURAL DE LA POBLACIÓN (M.N.P).<br />
El primer volumen se publicó en 1863 por <strong>la</strong> Junta General <strong>de</strong> Estadística <strong>de</strong>l Reino conteniendo datos<br />
re<strong>la</strong>tivos al periodo 1858-1861. Hasta 1870 los datos re<strong>la</strong>tivos a los nacimientos, matrimonios y <strong>de</strong>funciones son<br />
los suministrados por los Registros Parroquiales. A partir <strong>de</strong> 1870 comienza a organizarse el Registro Civil en virtud<br />
<strong>de</strong> <strong>la</strong> Ley <strong>de</strong> 17 <strong>de</strong> Junio <strong>de</strong> 1870. Se empieza a requerir información, pero los Registros ya establecidos, no <strong>la</strong><br />
mandan o bien <strong>la</strong> envían incompleta por no contar con personal suficiente y por otras razones como se apunta en<br />
el Prólogo <strong>de</strong>l Movimiento Natural <strong>de</strong> 1861-1870:<br />
“...hasta tanto que entre <strong>la</strong>s costumbres <strong>de</strong> nuestro pueblo se cuente <strong>la</strong> <strong>de</strong> <strong>la</strong> rigurosa inscripción en el<br />
Registro Civil <strong>de</strong> los actos <strong>de</strong>l nacimiento y <strong>de</strong>l matrimonio, son insuficientes para los estudios estadísticos los<br />
datos para esta institución adquiridos en razón <strong>de</strong> <strong>la</strong>s numerosas ocultaciones que tienen lugar y que no<br />
pue<strong>de</strong>n ocurrir en <strong>la</strong> inscripción <strong>de</strong> <strong>la</strong>s <strong>de</strong>funciones, por no consentirlo <strong>la</strong>s prácticas observadas en los<br />
enterramientos.”<br />
Pero en <strong>la</strong> misma introducción se refiere a los estragos que hacen en <strong>la</strong> <strong>pob<strong>la</strong>ción</strong> el cólera morbo <strong>de</strong> 1865 y<br />
<strong>la</strong>s epi<strong>de</strong>mias <strong>de</strong> virue<strong>la</strong> y fiebre tifoi<strong>de</strong>a, y también a que <strong>la</strong> estadística <strong>de</strong> <strong>de</strong>funciones se ve muy afectada por<br />
<strong>de</strong>fectos en los recuentos.<br />
No será hasta 1886 cuando se empiece a publicar <strong>de</strong> forma regu<strong>la</strong>r el Registro Civil. Aún así, no mejora <strong>la</strong><br />
calidad <strong>de</strong> <strong>la</strong>s <strong>estadísticas</strong> hasta bien entrado el siglo XX, <strong>de</strong>bido sobre todo al subrregistro <strong>de</strong> los nacimientos. En<br />
cuanto a los matrimonios a partir <strong>de</strong> <strong>la</strong> Ley <strong>de</strong> 26 <strong>de</strong> Mayo <strong>de</strong> 1889 se establece no celebrar matrimonios sin <strong>la</strong><br />
presencia <strong>de</strong>l Juez municipal.<br />
En 1975 se produce una reforma muy importante <strong>de</strong>l Movimiento Natural <strong>de</strong> <strong>la</strong> Pob<strong>la</strong>ción. Los datos se<br />
refieren ya no sólo al lugar <strong>de</strong> inscripción, sino también y fundamentalmente al lugar <strong>de</strong> resi<strong>de</strong>ncia. También se<br />
incluye <strong>la</strong> c<strong>la</strong>sificación por provincias <strong>de</strong> los nacimientos por edad <strong>de</strong> <strong>la</strong> madre (aunque para España ya se<br />
publicaban <strong>de</strong>s<strong>de</strong> 1922). Así mismo, se incluyen en los nacimientos y <strong>la</strong>s <strong>de</strong>funciones a los nacidos vivos fallecidos<br />
antes <strong>de</strong> <strong>la</strong>s 24 horas y se publican <strong>de</strong>terminados datos para todos los municipios.<br />
MIGRACIONES<br />
Los Anuarios Estadísticos <strong>de</strong> España publican datos anuales sobre migraciones interiores por provincias sin<br />
cruzar con otras variables <strong>de</strong>s<strong>de</strong> 1949, ya que el Instituto Nacional <strong>de</strong> Estadística no incluye hasta 1962 <strong>la</strong>s<br />
provincias <strong>de</strong> proce<strong>de</strong>ncia y <strong>de</strong>stino a partir <strong>de</strong> <strong>la</strong>s altas y bajas <strong>de</strong> los padrones municipales. En cuanto a <strong>la</strong>s<br />
migraciones exteriores, a partir <strong>de</strong> 1909 existen <strong>estadísticas</strong> <strong>de</strong> migraciones transoceánicas que se refieren al<br />
pasajero que en c<strong>la</strong>se tercera o equivalente vaya en dirección a América, Asia u Oceanía o bien inmigren <strong>de</strong> estos<br />
continentes (<strong>de</strong>s<strong>de</strong> 1916 a 1971) y no será hasta 1960-1961 cuando se añada <strong>la</strong> emigración a Europa información<br />
que suministra el Instituto Español <strong>de</strong> Emigración (IEE), creado en 1956. A partir <strong>de</strong> 1985 <strong>la</strong> estadística es<br />
e<strong>la</strong>borada por <strong>la</strong> Dirección General <strong>de</strong> Informática y Estadística <strong>de</strong>l Ministerio <strong>de</strong> Trabajo a partir <strong>de</strong> los datos<br />
suministrados por <strong>la</strong> Dirección General <strong>de</strong>l Instituto Español <strong>de</strong> Migración, creado en 1985 en sustitución <strong>de</strong>l<br />
antiguo IEE. En 1991 se crea <strong>la</strong> Dirección General <strong>de</strong> Migraciones que asume <strong>la</strong>s competencias <strong>de</strong> <strong>la</strong> Dirección<br />
General <strong>de</strong>l Instituto Español <strong>de</strong> Migración. A partir <strong>de</strong> este año los datos provienen <strong>de</strong> el<strong>la</strong> y <strong>de</strong> <strong>la</strong>s Direcciones<br />
Provinciales <strong>de</strong> Trabajo y Seguridad Social.<br />
En 1983 comienza una publicación específica sobre migraciones, don<strong>de</strong> se van a recoger también datos<br />
sobre inmigración exterior, diferenciando entre el retorno <strong>de</strong> los españoles que vivían en el extranjero y el <strong>de</strong> los<br />
extranjeros que vienen a residir a España. En 1985 se enriquece notablemente en cuanto a cuadros y cruces <strong>de</strong><br />
variables. La c<strong>la</strong>sificación por actividad económica se interrumpe en 1986, apareciendo una nueva c<strong>la</strong>sificación por<br />
titu<strong>la</strong>ción académica a partir <strong>de</strong> 1988.<br />
La estadística <strong>de</strong> extranjeros resi<strong>de</strong>ntes se e<strong>la</strong>bora a partir <strong>de</strong> los datos proporcionados por el registro <strong>de</strong><br />
extranjeros resi<strong>de</strong>ntes <strong>de</strong> <strong>la</strong> Dirección General <strong>de</strong> <strong>la</strong> Policía <strong>de</strong>l Ministerio <strong>de</strong>l Interior. Son datos referidos a<br />
Diciembre <strong>de</strong>l año <strong>de</strong> referencia.<br />
14 Estadísticas Históricas <strong>de</strong> Pob<strong>la</strong>ción <strong>de</strong> <strong>la</strong> Región <strong>de</strong> Murcia.
ACLARACIONES Y CONCEPTOS<br />
Ac<strong>la</strong>raciones:<br />
A <strong>la</strong> hora <strong>de</strong> consultar esta publicación <strong>de</strong>ben tenerse en cuenta los siguientes aspectos generales:<br />
- Algunos conceptos y c<strong>la</strong>sificaciones varían a lo <strong>la</strong>rgo <strong>de</strong>l tiempo y se han homogeneizado según se<br />
<strong>de</strong>tal<strong>la</strong> posteriormente.<br />
- Se publican <strong>la</strong>s series a pesar <strong>de</strong> <strong>la</strong> carencia <strong>de</strong> datos en algunos años intermedios y, en el caso <strong>de</strong> los<br />
municipios, a pesar <strong>de</strong> <strong>la</strong> variabilidad en <strong>la</strong> disposición <strong>de</strong> información por los diferentes criterios<br />
seguidos en re<strong>la</strong>ción a su tamaño.<br />
- En el Censo <strong>de</strong> 1787 (Floridab<strong>la</strong>nca) <strong>la</strong>s unida<strong>de</strong>s administrativas que regían no coincidían con <strong>la</strong>s<br />
actuales provincias y municipios, y los datos se han obtenido agregando <strong>la</strong>s pob<strong>la</strong>ciones según <strong>la</strong><br />
asignación hecha por el INE a los municipios actuales. Las dificulta<strong>de</strong>s aparecidas con algunos<br />
ayuntamientos se <strong>de</strong>tal<strong>la</strong>n en <strong>la</strong> tab<strong>la</strong> correspondiente.<br />
En el Censo <strong>de</strong> 1857 <strong>la</strong> provincia ya se correspon<strong>de</strong> con <strong>la</strong> actual y existían 41 municipios, los mismos<br />
que en 1995 excepto <strong>la</strong> Unión, Puerto Lumbreras, Santomera y los Alcazares. La Unión pertenecía a<br />
Cartagena hasta el 1-1-1860 en que se constituye como ayuntamiento in<strong>de</strong>pendiente con el nombre <strong>de</strong><br />
Vil<strong>la</strong> <strong>de</strong>l Garbanzal, nombre que sustituye por el actual 8 años <strong>de</strong>spués.<br />
Puerto Lumbreras formó parte <strong>de</strong> Lorca hasta el 7-7-1958, Santomera estuvo incluída en Murcia hasta<br />
el 29-9-1978 y Los Alcázares en San Javier y Torre Pacheco hasta el 13-10-1983. Todo ésto <strong>de</strong>be<br />
tenerse en cuenta en los datos a nivel municipal tanto <strong>de</strong> los diferentes censos como <strong>de</strong>l M.N.P.<br />
- Las discrepancias que aparecen entre <strong>la</strong>s pob<strong>la</strong>ciones regionales y municipales, y los totales <strong>de</strong> <strong>la</strong>s<br />
tab<strong>la</strong>s <strong>de</strong> estructura por sexo y edad para los censos <strong>de</strong> 1960, 1970 y 1981 se han mantenido por existir<br />
en <strong>la</strong> fuente. En los Censos <strong>de</strong> 1970 y 1981 se explícita <strong>la</strong> existencia <strong>de</strong> pequeñas diferencias <strong>de</strong> unas<br />
tab<strong>la</strong>s a otras por <strong>la</strong> utilización <strong>de</strong> muestreo y factores <strong>de</strong> elevación no enteros.<br />
- Hasta 1950, inclusive, los Censos utilizan <strong>la</strong> <strong>pob<strong>la</strong>ción</strong> <strong>de</strong> hecho en <strong>la</strong>s tabu<strong>la</strong>ciones <strong>de</strong> <strong>la</strong> <strong>pob<strong>la</strong>ción</strong> por<br />
distintas características y a partir <strong>de</strong> esa fecha pasan a trabajar con <strong>la</strong> <strong>pob<strong>la</strong>ción</strong> <strong>de</strong> <strong>de</strong>recho.<br />
- En el periodo consi<strong>de</strong>rado no existe una correspon<strong>de</strong>ncia exacta <strong>de</strong> los países con los actuales<br />
pudiendo en algunos casos no existir como tales, no tener los mismos límites, etc.<br />
- En el capítulo 3 se incluyen datos <strong>de</strong> <strong>la</strong> capital <strong>de</strong> <strong>la</strong> provincia que permiten ampliar <strong>la</strong> información<br />
contenida en el capítulo 4 sobre el municipio <strong>de</strong> Murcia.<br />
A continuación se incluyen los principales conceptos:<br />
Pob<strong>la</strong>ción <strong>de</strong> hecho y <strong>de</strong> <strong>de</strong>recho:<br />
Se l<strong>la</strong>ma resi<strong>de</strong>ntes presentes a <strong>la</strong>s personas que resi<strong>de</strong>n en un municipio y en <strong>la</strong> fecha censal están<br />
presentes en él; resi<strong>de</strong>ntes ausentes a los resi<strong>de</strong>ntes en un municipio que en <strong>la</strong> fecha censal están ausentes <strong>de</strong> él;<br />
y transeúntes a <strong>la</strong>s personas que no son resi<strong>de</strong>ntes en un municipio, pero que en <strong>la</strong> fecha censal se encuentran en<br />
él.<br />
La POBLACIÓN DE HECHO <strong>de</strong> un municipio esta formada por los resi<strong>de</strong>ntes presentes y los transeúntes <strong>de</strong>l<br />
mismo. El total <strong>de</strong> resi<strong>de</strong>ntes presentes y ausentes constituye <strong>la</strong> POBLACIÓN DE DERECHO <strong>de</strong>l municipio. La<br />
suma <strong>de</strong> <strong>la</strong>s pob<strong>la</strong>ciones <strong>de</strong> hecho o <strong>de</strong> <strong>de</strong>recho <strong>de</strong> los municipios correspondientes, constituye <strong>la</strong> <strong>pob<strong>la</strong>ción</strong> <strong>de</strong><br />
hecho o <strong>de</strong> <strong>de</strong>recho <strong>de</strong> <strong>la</strong>s Provincias, Comunida<strong>de</strong>s Autónomas o <strong>de</strong>l Estado.<br />
Estadísticas Históricas <strong>de</strong> Pob<strong>la</strong>ción <strong>de</strong> <strong>la</strong> Región <strong>de</strong> Murcia. 15
Fechas <strong>de</strong> referencias <strong>de</strong> los censos <strong>de</strong> <strong>pob<strong>la</strong>ción</strong> y <strong>de</strong> <strong>la</strong>s renovaciones y rectificaciones padronales.<br />
CENSOS DE POBLACIÓN:<br />
De 1857: 21 <strong>de</strong> Mayo.<br />
De 1860 a 1970: 31 <strong>de</strong> Diciembre.<br />
De 1981 y 1991: 1 <strong>de</strong> Marzo.<br />
RENOVACIONES Y RECTIFICACIONES PADRONALES:<br />
De 1940 a 1980: 31 <strong>de</strong> Diciembre.<br />
De 1981: 1 <strong>de</strong> Marzo.<br />
De 1982 a 1985: 31 <strong>de</strong> Marzo.<br />
De 1991: 1 <strong>de</strong> Marzo.<br />
De 1987 a 1994: 1 <strong>de</strong> Enero.<br />
Las renovaciones padronales, <strong>la</strong>s cuales se realizan cada cinco años, cuando coinci<strong>de</strong>n con <strong>la</strong> realización <strong>de</strong>l<br />
Censo <strong>de</strong> Pob<strong>la</strong>ción se hacen <strong>de</strong> forma simultánea a <strong>la</strong> operación censal.<br />
Nacimientos:<br />
Antes <strong>de</strong> 1900 los nacimientos se refieren a los nacidos vivos que hubieran sido bautizados, formando parte<br />
<strong>de</strong> <strong>la</strong> estadística <strong>de</strong> abortos si fallecían antes <strong>de</strong>l bautismo.<br />
Los nacimientos naturales <strong>de</strong> 1900 a 1974, recogen el concepto <strong>de</strong>l Código Civil “sólo se reputará nacido el<br />
feto que tuviere figura humana y viviere veinticuatro horas enteramente <strong>de</strong>sprendido <strong>de</strong>l seno materno”. Por tanto<br />
aquellos nacidos con vida que fallecieran antes <strong>de</strong> cumplir 24 horas engrosan <strong>la</strong>s <strong>estadísticas</strong> <strong>de</strong> abortos. Como<br />
disponemos <strong>de</strong> estos datos <strong>de</strong> 1932 a 1974 se han sumado a los nacimientos los muertos al nacer y los muertos<br />
antes <strong>de</strong> <strong>la</strong>s 24 horas, obteniendo por tanto <strong>la</strong> estadística correcta <strong>de</strong> los nacidos con vida.<br />
A partir <strong>de</strong> 1975 ya el Movimiento Natural <strong>de</strong> <strong>la</strong> Pob<strong>la</strong>ción i<strong>de</strong>ntifica el nacimiento con el nacido con vida, con<br />
<strong>la</strong> correspondiente repercusión en el concepto <strong>de</strong> <strong>de</strong>función.<br />
Defunciones:<br />
Al igual que ocurre con los nacimientos hasta 1900, <strong>la</strong>s <strong>de</strong>funciones no incluyen a los fallecidos antes <strong>de</strong> ser<br />
bautizados.<br />
De 1900 a 1974, tampoco se incluían en esta estadística los fallecidos antes <strong>de</strong> <strong>la</strong>s 24 horas, ya que no se<br />
contabilizaban como nacidos vivos, sino como abortos. De 1932 a 1974 se han sumado a <strong>la</strong>s <strong>de</strong>funciones los<br />
fallecidos al nacer y antes <strong>de</strong> <strong>la</strong>s 24 horas.<br />
Abortos y muertes fetales tardías:<br />
La muerte fetal tardía es el fallecimiento, antes <strong>de</strong> su completa expulsión o extracción <strong>de</strong>l cuerpo <strong>de</strong> <strong>la</strong> madre,<br />
<strong>de</strong> un producto <strong>de</strong> <strong>la</strong> concepción viable, es <strong>de</strong>cir el feto muerto con seis o más meses <strong>de</strong> gestación, ya que en<br />
España sólo existe <strong>la</strong> obligación <strong>de</strong> comunicar al Registro Civil <strong>la</strong>s muertes fetales <strong>de</strong> más <strong>de</strong> 180 días <strong>de</strong><br />
gestación. Este carácter <strong>de</strong> viabilidad es el que sirve para diferenciar actualmente <strong>la</strong>s muertes fetales tardías y los<br />
abortos.<br />
La Estadística <strong>de</strong> Muertes Fetales Tardías viene a ser <strong>la</strong> continuación, a partir <strong>de</strong> 1975, <strong>de</strong> <strong>la</strong> Estadística <strong>de</strong><br />
Abortos, si bien en ésta última se incluían los nacidos vivos fallecidos durante <strong>la</strong>s primeras 24 horas <strong>de</strong> vida y todas<br />
<strong>la</strong>s muertes fetales <strong>de</strong>c<strong>la</strong>radas con in<strong>de</strong>pen<strong>de</strong>ncia <strong>de</strong> su tiempo gestación.<br />
Hasta 1900 incluye a todas <strong>la</strong>s muertes fetales, así como a los fallecidos antes <strong>de</strong> ser bautizados. El<br />
Movimiento Natural <strong>de</strong> <strong>la</strong> Pob<strong>la</strong>ción <strong>de</strong> 1863-1870 hace referencia a <strong>la</strong> inexactitud <strong>de</strong> estas cifras, ya que no son<br />
hechos bien registrados, sino el resultado <strong>de</strong> investigaciones administrativas.<br />
16 Estadísticas Históricas <strong>de</strong> Pob<strong>la</strong>ción <strong>de</strong> <strong>la</strong> Región <strong>de</strong> Murcia.
Alumbramientos y partos:<br />
El concepto <strong>de</strong> alumbramiento engloba antes <strong>de</strong> 1975 a los nacimientos y a los abortos (nacidos muertos y<br />
muertos antes <strong>de</strong> ser bautizados antes <strong>de</strong> 1900 y nacidos muertos, muertos al nacer y muertos antes <strong>de</strong> 24 horas<br />
a partir <strong>de</strong> 1900 y hasta 1974). Excepcionalmente en el Movimiento Natural <strong>de</strong> <strong>la</strong> Pob<strong>la</strong>ción <strong>de</strong> 1900 el dato <strong>de</strong>l<br />
número <strong>de</strong> alumbramientos no incluye a los abortos, sino sólo a los nacidos que han vivido más <strong>de</strong> 24 horas.<br />
La estadística <strong>de</strong> Partos viene a ser <strong>la</strong> continuación, a partir <strong>de</strong> 1975, <strong>de</strong> <strong>la</strong> <strong>de</strong> alumbramientos. Por tanto los<br />
partos incluyen a los nacimientos y a <strong>la</strong>s muerte fetales tardías, es <strong>de</strong>cir, cualquier nacido vivo o muerto con más<br />
<strong>de</strong> 180 días <strong>de</strong> gestación o producto <strong>de</strong> <strong>la</strong> concepción viable.<br />
Crecimiento vegetativo:<br />
El crecimiento vegetativo refleja el aumento o <strong>de</strong>scenso <strong>de</strong> <strong>la</strong> <strong>pob<strong>la</strong>ción</strong>, como resultado <strong>de</strong> <strong>la</strong> diferencia entre<br />
los nacimientos y <strong>la</strong>s <strong>de</strong>funciones.<br />
Tasas <strong>de</strong> natalidad, nupcialidad y mortalidad:<br />
RESULTADOS REGIONALES:<br />
Las tasas <strong>de</strong> natalidad, nupcialidad y mortalidad: son el resultado <strong>de</strong>l cociente entre el número total <strong>de</strong><br />
nacimientos, matrimonios o <strong>de</strong>funciones en un año y <strong>la</strong> <strong>pob<strong>la</strong>ción</strong> estimada a 30 <strong>de</strong> Junio o 1 <strong>de</strong> Julio <strong>de</strong> ese año.<br />
Como <strong>de</strong> 1919 a 1934 no disponemos <strong>de</strong> <strong>la</strong> <strong>pob<strong>la</strong>ción</strong> calcu<strong>la</strong>da a mediados <strong>de</strong> año se ha utilizado <strong>la</strong><br />
<strong>pob<strong>la</strong>ción</strong> a 31 <strong>de</strong> diciembre <strong>de</strong>l año anterior (lo que sería lo mismo consi<strong>de</strong>rar que es <strong>la</strong> <strong>pob<strong>la</strong>ción</strong> a principios <strong>de</strong><br />
cada año). Estas tasas son igualmente significativas en <strong>la</strong> evolución <strong>de</strong> <strong>la</strong> natalidad, nupcialidad y mortalidad, ya<br />
que apenas variarían si se utilizara <strong>la</strong> <strong>pob<strong>la</strong>ción</strong> a 1 <strong>de</strong> Julio.<br />
La mortalidad infantil: es el resultado <strong>de</strong>l cociente entre <strong>la</strong>s <strong>de</strong>funciones <strong>de</strong> los menores <strong>de</strong> 1 año y los nacidos<br />
vivos en el mismo año. Antes <strong>de</strong> 1932 estas <strong>de</strong>funciones no incluían a los fallecidos antes <strong>de</strong> <strong>la</strong>s 24 horas, por lo<br />
que el resultado <strong>de</strong> <strong>la</strong>s tasas es inferior a su valor real.<br />
RESULTADOS MUNICIPALES:<br />
Las tasas <strong>de</strong> natalidad, nupcialidad y mortalidad <strong>de</strong> un año son el cociente entre <strong>la</strong> media <strong>de</strong> los nacimientos,<br />
los matrimonios o <strong>la</strong>s <strong>de</strong>funciones <strong>de</strong> ese año y el anterior y <strong>la</strong> <strong>pob<strong>la</strong>ción</strong> a 31 <strong>de</strong> Diciembre <strong>de</strong>l primer año o a 1 <strong>de</strong><br />
Enero <strong>de</strong>l segundo.<br />
Como se ha indicado en <strong>la</strong>s fechas <strong>de</strong> <strong>la</strong>s rectificaciones y renovaciones padronales, <strong>de</strong> los años 1981 a1986<br />
y 1991 <strong>la</strong> <strong>pob<strong>la</strong>ción</strong> esta referida a Marzo o Abril. Por tanto se ha retrotraído a 1 <strong>de</strong> Enero <strong>de</strong> cada uno <strong>de</strong> estos<br />
años. Para ello se han consi<strong>de</strong>rado <strong>la</strong> proporción <strong>de</strong> nacimientos y <strong>de</strong>funciones ocurridas en esos meses en <strong>la</strong><br />
Región <strong>de</strong> Murcia en los años indicados.<br />
Se han aplicado estos porcentajes a cada uno <strong>de</strong> los municipios para conocer los nacimientos y <strong>la</strong>s<br />
<strong>de</strong>funciones ocurridas. Se han restado los nacimientos y sumado <strong>la</strong>s <strong>de</strong>funciones a <strong>la</strong>s pob<strong>la</strong>ciones<br />
correspondientes y así obtener <strong>la</strong> <strong>pob<strong>la</strong>ción</strong> a 1 <strong>de</strong> Enero.<br />
Migraciones:<br />
Migraciones interiores: En este apartado se reflejan los flujos <strong>de</strong> personas entre <strong>la</strong> Región <strong>de</strong> Murcia y el resto<br />
<strong>de</strong>l Estado.<br />
Migraciones exteriores: Incluye los flujos <strong>de</strong> personas entre <strong>la</strong> Región <strong>de</strong> Murcia y el extranjero.<br />
Emigración asistida al extranjero: Españoles que se tras<strong>la</strong>dan a un país extranjero por causas <strong>de</strong> trabajo o<br />
actividad lucrativa, siempre que se observen disposiciones <strong>la</strong>borales que rijan dicho país o en España y que son<br />
asistidas por <strong>la</strong> Dirección General <strong>de</strong> Migraciones (o el organismo competente en cada momento).<br />
Estadísticas Históricas <strong>de</strong> Pob<strong>la</strong>ción <strong>de</strong> <strong>la</strong> Región <strong>de</strong> Murcia. 17
A partir <strong>de</strong> 1983, se c<strong>la</strong>sifican, según <strong>la</strong> duración <strong>de</strong> <strong>la</strong> estancia en el país <strong>de</strong> <strong>de</strong>stino, en permanente (igual o<br />
superior a un año), temporal (igual o superior a 3 meses y menos <strong>de</strong> un año) y <strong>de</strong> temporada (hasta 3 meses). Con<br />
anterioridad a dicha fecha sólo se diferenciaba <strong>la</strong> emigración a Francia en permanente y temporal (que incluía <strong>la</strong> <strong>de</strong><br />
temporada), consi<strong>de</strong>rándose <strong>la</strong> emigración a los <strong>de</strong>más países como permanente.<br />
Inmigrante: Persona que llega a un municipio, provincia o país para establecer su resi<strong>de</strong>ncia.<br />
Emigrante: Persona que <strong>de</strong>ja un municipio, provincia o país para establecer su resi<strong>de</strong>ncia en otro.<br />
Saldo migratorio: Diferencia entre <strong>la</strong>s inmigraciones y <strong>la</strong>s emigraciones.<br />
18 Estadísticas Históricas <strong>de</strong> Pob<strong>la</strong>ción <strong>de</strong> <strong>la</strong> Región <strong>de</strong> Murcia.
CENSOS.<br />
DATOS<br />
REGIONALES.
Censos <strong>de</strong> Pob<strong>la</strong>ción. Datos Regionales.<br />
1.1. EVOLUCIÓN DE LA POBLACIÓN DE DERECHO Y DE HECHO SEGÚN LOS CENSOS<br />
OFICIALES. 1787-1991.<br />
AÑOS POBLACIÓN DE DERECHO POBLACIÓN DE HECHO<br />
TOTAL Hombres Mujeres TOTAL Hombres Mujeres<br />
1787 ................................ .. .. .. 256.977 133.640 123.337<br />
1857 ................................ .. .. .. 380.969 191.654 189.315<br />
1860 ................................ .. .. .. 382.812 191.966 190.846<br />
1877 ................................ 452.082 225.426 226.656 451.611 224.361 227.250<br />
1887 ................................ 489.770 246.198 243.572 491.436 245.219 246.217<br />
1897 ................................ 535.901 267.931 267.970 534.802 266.566 268.236<br />
1900 ................................ 581.455 292.240 289.215 577.987 287.861 290.126<br />
1910 ................................ 620.926 309.286 311.640 615.105 304.570 310.535<br />
1920 ................................ 654.436 324.771 329.665 638.639 312.435 326.204<br />
1930 ................................ 651.979 324.570 327.409 645.449 318.876 326.573<br />
1940 ................................ 731.221 359.725 371.496 719.701 350.200 369.501<br />
1950 ................................ 755.850 367.276 388.574 756.721 368.044 388.677<br />
1960 ................................ 803.086 393.093 409.993 800.463 391.718 408.745<br />
1970 ................................ 832.004 407.587 424.417 832.261 408.487 423.774<br />
1981 ................................ 955.498 469.349 486.149 957.903 471.250 486.653<br />
1991 ................................ 1.045.601 514.527 531.074 1.059.612 522.682 536.930<br />
Nota: Hasta el Censo <strong>de</strong> 1877 no se recoge <strong>la</strong> <strong>pob<strong>la</strong>ción</strong> <strong>de</strong> <strong>de</strong>recho.<br />
Fuente: INE. Censos <strong>de</strong> Pob<strong>la</strong>ción.<br />
1.2.1. ESTRUCTURA POR SEXO Y EDAD DE LA POBLACIÓN DE HECHO (*) SEGÚN LOS CENSOS<br />
OFICIALES. 1787.<br />
EDAD TOTAL HOMBRES MUJERES<br />
TOTAL........................................... 253.102 130.753 122.349<br />
Menores <strong>de</strong> 7 años........................ 45.385 23.467 21.918<br />
De 7 a 16 años .............................. 44.090 23.320 20.770<br />
De 16 a 25 años ............................ 40.093 21.364 18.729<br />
De 25 a 40 años ............................ 57.041 29.335 27.706<br />
De 40 a 50 años ............................ 30.333 15.541 14.792<br />
De más <strong>de</strong> 50 años ....................... 36.160 17.726 18.434<br />
(*) Sólo se tiene <strong>la</strong> c<strong>la</strong>sificación por edad para <strong>la</strong>s personas resi<strong>de</strong>ntes en lo que actualmente l<strong>la</strong>mamos viviendas familiares.<br />
Nota: Se respetan los intervalos <strong>de</strong> <strong>la</strong> fuente original.<br />
Fuente: INE. Censo <strong>de</strong> 1787 “FLORIDABLANCA”.<br />
Estadísticas Históricas <strong>de</strong> Pob<strong>la</strong>ción <strong>de</strong> <strong>la</strong> Región <strong>de</strong> Murcia. 21
Censos <strong>de</strong> Pob<strong>la</strong>ción. Datos Regionales.<br />
1.2.2. ESTRUCTURA POR SEXO Y EDAD DE LA POBLACIÓN DE HECHO SEGÚN LOS CENSOS<br />
OFICIALES. 1857.<br />
EDAD TOTAL HOMBRES MUJERES<br />
TOTAL ........................................... 380.969 191.654 189.315<br />
Menores <strong>de</strong> 1 año.......................... 10.822 5.602 5.220<br />
De 1 a 7 años ................................ 64.899 33.036 31.863<br />
De 8 a 15 años .............................. 62.456 32.081 30.375<br />
De 16 a 20 años ............................ 37.848 18.494 19.354<br />
De 21 a 25 años ............................ 33.166 16.392 16.774<br />
De 26 a 30 años ............................ 35.879 18.433 17.446<br />
De 31 a 40 años ............................ 53.674 27.611 26.063<br />
De 41 a 50 años ............................ 37.611 18.826 18.785<br />
De 51 a 60 años ............................ 26.052 12.614 13.438<br />
De 61 a 70 años ............................ 12.665 5.946 6.719<br />
De 71 a 80 años ............................ 4.598 2.060 2.538<br />
De 81 a 85 años ............................ 732 335 397<br />
De 86 a 90 años ............................ 394 163 231<br />
De 91 a 95 años ............................ 93 36 57<br />
De 96 a 100 años .......................... 61 21 40<br />
De más <strong>de</strong> 100 años ..................... 19 4 15<br />
Fuente: INE. Censos <strong>de</strong> Pob<strong>la</strong>ción.<br />
1.2.3. ESTRUCTURA POR SEXO Y EDAD DE LA POBLACIÓN DE HECHO SEGÚN LOS CENSOS<br />
OFICIALES. 1860.<br />
EDAD TOTAL HOMBRES MUJERES<br />
TOTAL ........................................... 382.812 191.966 190.846<br />
Menores <strong>de</strong> 1 año.......................... 9.145 4.646 4.499<br />
De 1 a 5 años ................................ 51.594 26.578 25.016<br />
De 6 a 10 años .............................. 40.821 20.781 20.040<br />
De 11 a 15 años ............................ 37.518 19.314 18.204<br />
De 16 a 19 años ............................ 26.775 12.864 13.911<br />
De 20 años .................................... 8.807 3.975 4.832<br />
De 21 años .................................... 5.676 3.175 2.501<br />
De 22 años .................................... 7.662 3.652 4.010<br />
De 23 años .................................... 6.596 3.575 3.021<br />
De 24 años .................................... 7.921 3.820 4.101<br />
De 25 años .................................... 7.510 3.921 3.589<br />
De 26 a 30 años ............................ 35.895 17.823 18.072<br />
De 31 a 40 años ............................ 52.015 26.575 25.440<br />
De 41 a 50 años ............................ 39.035 19.477 19.558<br />
De 51 a 60 años ............................ 26.210 12.632 13.578<br />
De 61 a 70 años ............................ 13.644 6.524 7.120<br />
De 71 a 80 años ............................ 4.665 2.072 2.593<br />
De 81 a 85 años ............................ 751 321 430<br />
De 86 a 90 años ............................ 387 156 231<br />
De 91 a 95 años ............................ 95 50 45<br />
De 96 a 100 años .......................... 74 29 45<br />
De más <strong>de</strong> 100 años ..................... 16 6 10<br />
Fuente: INE. Censos <strong>de</strong> Pob<strong>la</strong>ción.<br />
22 Estadísticas Históricas <strong>de</strong> Pob<strong>la</strong>ción <strong>de</strong> <strong>la</strong> Región <strong>de</strong> Murcia.
Censos <strong>de</strong> Pob<strong>la</strong>ción. Datos Regionales.<br />
1.2.4. ESTRUCTURA POR SEXO Y EDAD DE LA POBLACIÓN DE HECHO SEGÚN LOS CENSOS<br />
OFICIALES. 1877 Y 1887.<br />
EDAD 1877 1887<br />
TOTAL Hombres Mujeres TOTAL Hombres Mujeres<br />
TOTAL............................. 451.611 224.361 227.250 491.436 245.219 246.217<br />
Menores <strong>de</strong> 6 meses....... 6.083 3.164 2.919 6.061 3.107 2.954<br />
De 6 a 12 meses ............. 5.854 3.010 2.844 6.013 3.019 2.994<br />
De 1 año.......................... 11.871 6.065 5.806 12.772 6.518 6.254<br />
De 2 años ........................ 11.747 6.009 5.738 12.495 6.313 6.182<br />
De 3 años ........................ 11.451 5.800 5.651 11.629 5.990 5.639<br />
De 4 años ........................ 11.307 5.653 5.654 11.043 5.610 5.433<br />
De 5 años ........................ 10.794 5.523 5.271 11.128 5.838 5.290<br />
De 6 años ........................ 11.218 5.686 5.532 11.558 5.901 5.657<br />
De 7 años ........................ 10.590 5.457 5.133 10.554 5.458 5.096<br />
De 8 años ........................ 10.644 5.379 5.265 11.128 5.613 5.515<br />
De 9 años ........................ 8.844 4.522 4.322 9.622 4.945 4.677<br />
De 10 años ...................... 10.721 5.480 5.241 11.043 5.606 5.437<br />
De 11 años ...................... 9.339 4.804 4.535 9.197 4.619 4.578<br />
De 12 años ...................... 11.505 5.915 5.590 11.320 5.757 5.563<br />
De 13 años ...................... 9.762 5.000 4.762 9.922 5.121 4.801<br />
De 14 años ...................... 10.231 5.225 5.006 10.855 5.616 5.239<br />
De 15 años ...................... 9.141 4.391 4.750 10.287 4.986 5.301<br />
De 16 años ...................... 9.369 4.466 4.903 9.935 4.794 5.141<br />
De 17 años ...................... 9.050 4.368 4.682 9.519 4.827 4.692<br />
De 18 años ...................... 9.353 4.445 4.908 10.076 4.722 5.354<br />
De 19 años ...................... 7.805 3.706 4.099 7.367 3.330 4.037<br />
De 20 años ...................... 8.926 3.827 5.099 10.976 5.095 5.881<br />
De 21 años ...................... 6.862 3.721 3.141 7.856 4.229 3.627<br />
De 22 años ...................... 8.266 3.926 4.340 10.163 4.897 5.266<br />
De 23 años ...................... 7.165 3.696 3.469 8.690 4.602 4.088<br />
De 24 años ...................... 7.526 3.605 3.921 9.367 4.515 4.852<br />
De 25 años ...................... 6.959 3.346 3.613 9.272 4.569 4.703<br />
De 26 a 30 años .............. 24.268 11.928 12.340 44.256 22.011 22.245<br />
De 31 a 35 años .............. 32.027 15.548 16.479 29.323 14.971 14.352<br />
De 36 a 40 años .............. 25.168 12.818 12.350 32.521 15.913 16.608<br />
De 41 a 45 años .............. 29.592 14.708 14.884 22.783 11.505 11.278<br />
De 46 a 50 años .............. 19.168 9.697 9.471 27.568 13.356 14.212<br />
De 51 a 60 años .............. 35.366 17.472 17.894 36.042 17.517 18.525<br />
De 61 a 70 años .............. 22.987 11.153 11.834 20.131 10.140 9.991<br />
De 71 a 80 años .............. 8.074 3.797 4.277 7.132 3.428 3.704<br />
De 81 a 90 años .............. 2.209 915 1.294 1.566 679 887<br />
De 91 a 100 años ............ 321 119 202 161 54 107<br />
De 100 y más años ......... 33 2 31 16 5 11<br />
No consta ........................ 15 15 - 89 43 46<br />
Fuente: INE. Censos <strong>de</strong> Pob<strong>la</strong>ción.<br />
Estadísticas Históricas <strong>de</strong> Pob<strong>la</strong>ción <strong>de</strong> <strong>la</strong> Región <strong>de</strong> Murcia. 23
Censos <strong>de</strong> Pob<strong>la</strong>ción. Datos Regionales.<br />
1.2.5. ESTRUCTURA POR SEXO Y EDAD DE LA POBLACIÓN DE HECHO SEGÚN LOS CENSOS<br />
OFICIALES. 1900-1940. (Continúa)<br />
EDAD 1900 1910 1920<br />
TOTAL Hombres Mujeres TOTAL Hombres Mujeres TOTAL Hombres Mujeres<br />
TOTAL ............................... 577.987 287.861 290.126 615.105 304.570 310.535 638.639 312.435 326.204<br />
Menores <strong>de</strong> 1 año.............. 9.339 4.644 4.695 12.479 6.596 5.883 15.022 7.538 7.484<br />
De 1 año ............................ 16.905 8.624 8.281 14.512 7.497 7.015 13.741 7.052 6.689<br />
De 2 años .......................... 16.222 8.123 8.099 16.682 8.502 8.180 14.961 7.672 7.289<br />
De 3 años .......................... 15.219 7.719 7.500 16.020 8.057 7.963 14.771 7.309 7.462<br />
De 4 años .......................... 15.497 7.813 7.684 15.069 7.593 7.476 14.592 7.451 7.141<br />
De 5 años .......................... 15.682 8.229 7.453 15.121 7.625 7.496 15.029 7.629 7.400<br />
De 6 años .......................... 15.089 7.605 7.484 15.548 7.695 7.853 14.511 7.339 7.172<br />
De 7 años .......................... 15.085 7.780 7.305 15.486 7.733 7.753 14.260 7.238 7.022<br />
De 8 años .......................... 15.354 7.903 7.451 16.025 7.911 8.114 14.624 7.404 7.220<br />
De 9 años .......................... 13.516 6.899 6.617 13.866 6.869 6.997 13.623 6.884 6.739<br />
De 10 años ........................ 14.329 7.582 6.747 15.893 7.971 7.922 15.136 7.514 7.622<br />
De 11 años ........................ 11.180 5.825 5.355 13.288 6.521 6.767 13.427 6.636 6.791<br />
De 12 años ........................ 13.689 7.035 6.654 15.429 7.714 7.715 15.388 7.591 7.797<br />
De 13 años ........................ 11.300 5.803 5.497 12.679 6.410 6.269 14.022 6.837 7.185<br />
De 14 años ........................ 11.854 6.199 5.655 14.304 7.276 7.028 14.408 6.977 7.431<br />
De 15 años ........................ 11.090 5.418 5.672 13.816 6.722 7.094 14.021 6.670 7.351<br />
De 16 años ........................ 10.138 5.034 5.104 13.289 6.359 6.930 13.687 6.351 7.336<br />
De 17 años ........................ 9.710 4.846 4.864 12.844 6.317 6.527 13.782 6.475 7.307<br />
De 18 años ........................ 10.875 5.152 5.723 14.757 7.254 7.503 14.818 6.844 7.974<br />
De 19 años ........................ 9.070 4.310 4.760 10.956 5.566 5.390 11.556 5.421 6.135<br />
De 20 años ........................ 11.015 4.424 6.591 12.783 5.830 6.953 15.716 7.005 8.711<br />
De 21 años ........................ 7.611 3.901 3.710 8.350 4.330 4.020 11.200 5.885 5.315<br />
De 22 años ........................ 10.839 5.672 5.167 10.796 5.256 5.540 12.764 6.718 6.046<br />
De 23 años ........................ 9.246 4.829 4.417 9.427 4.900 4.527 11.098 5.334 5.764<br />
De 24 años ........................ 9.941 4.897 5.044 9.056 4.298 4.758 11.324 5.164 6.160<br />
De 25 años ........................ 10.316 5.125 5.191 9.654 4.717 4.937 11.838 5.696 6.142<br />
De 26 años ........................ 9.373 4.644 4.729 8.838 4.394 4.444 10.847 5.196 5.651<br />
De 27 años ........................ 7.732 3.924 3.808 7.788 4.012 3.776 10.024 5.041 4.983<br />
De 28 años ........................ 10.638 5.177 5.461 9.705 4.687 5.018 11.037 5.320 5.717<br />
De 29 años ........................ 6.507 3.340 3.167 6.439 3.238 3.201 7.590 3.817 3.773<br />
De 30 años ........................ 16.222 7.702 8.520 13.999 6.491 7.508 13.871 6.732 7.139<br />
De 31 años ........................ 4.441 2.229 2.212 4.514 2.301 2.213 6.050 3.102 2.948<br />
De 32 años ........................ 7.776 3.911 3.865 7.759 3.856 3.903 7.883 3.933 3.950<br />
De 33 años ........................ 6.581 3.391 3.190 6.412 3.246 3.166 6.967 3.425 3.542<br />
De 34 años ........................ 7.893 4.026 3.867 6.816 3.275 3.541 6.519 3.138 3.381<br />
De 35 años ........................ 8.644 4.463 4.181 8.054 4.116 3.938 8.111 3.997 4.114<br />
De 36 años ........................ 7.906 3.777 4.129 7.482 3.536 3.946 6.210 2.979 3.231<br />
De 37 años ........................ 5.163 2.504 2.659 5.483 2.714 2.769 5.449 2.574 2.875<br />
De 38 años ........................ 7.636 3.577 4.059 7.979 3.816 4.163 6.614 3.224 3.390<br />
De 39 años ........................ 4.711 2.308 2.403 5.048 2.526 2.522 5.603 2.729 2.874<br />
De 40 años ........................ 16.698 8.144 8.554 16.023 7.747 8.276 13.620 6.664 6.956<br />
De 41 años ........................ 3.364 1.697 1.667 3.545 1.744 1.801 4.626 2.208 2.418<br />
De 42 años ........................ 6.236 3.152 3.084 6.670 3.364 3.306 6.487 3.141 3.346<br />
De 43 años ........................ 4.289 2.128 2.161 4.819 2.350 2.469 4.618 2.144 2.474<br />
De 44 años ........................ 5.478 2.670 2.808 6.326 3.172 3.154 5.936 2.768 3.168<br />
De 45 años ........................ 7.204 3.711 3.493 8.295 4.350 3.945 7.818 3.927 3.891<br />
De 46 años ........................ 5.202 2.569 2.633 6.141 2.985 3.156 5.463 2.598 2.865<br />
De 47 años ........................ 3.645 1.790 1.855 4.403 2.148 2.255 4.505 2.181 2.324<br />
De 48 años ........................ 5.630 2.720 2.910 6.947 3.313 3.634 6.134 2.912 3.222<br />
De 49 años ........................ 2.990 1.508 1.482 3.856 1.968 1.888 4.651 2.306 2.345<br />
24 Estadísticas Históricas <strong>de</strong> Pob<strong>la</strong>ción <strong>de</strong> <strong>la</strong> Región <strong>de</strong> Murcia.
Censos <strong>de</strong> Pob<strong>la</strong>ción. Datos Regionales.<br />
1.2.5. ESTRUCTURA POR SEXO Y EDAD DE LA POBLACIÓN DE HECHO SEGÚN LOS CENSOS<br />
OFICIALES. 1900-1940. (Continúa)<br />
EDAD 1900 1910 1920<br />
TOTAL Hombres Mujeres TOTAL Hombres Mujeres TOTAL Hombres Mujeres<br />
De 50 años ........................ 12.496 5.992 6.504 13.093 6.377 6.716 12.454 6.192 6.262<br />
De 51 años ........................ 2.211 1.139 1.072 2.690 1.413 1.277 3.594 1.777 1.817<br />
De 52 años ........................ 3.880 2.001 1.879 4.819 2.453 2.366 4.901 2.406 2.495<br />
De 53 años ........................ 2.629 1.297 1.332 3.249 1.647 1.602 3.702 1.777 1.925<br />
De 54 años ........................ 4.064 1.938 2.126 4.391 2.090 2.301 4.583 2.200 2.383<br />
De 55 años ........................ 4.346 2.213 2.133 4.999 2.514 2.485 6.100 3.119 2.981<br />
De 56 años ........................ 3.937 1.881 2.056 4.531 2.201 2.330 4.450 2.175 2.275<br />
De 57 años ........................ 2.552 1.271 1.281 2.770 1.406 1.364 3.522 1.721 1.801<br />
De 58 años ........................ 3.960 1.875 2.085 4.125 1.930 2.195 4.365 2.152 2.213<br />
De 59 años ........................ 1.957 1.014 943 2.327 1.173 1.154 3.392 1.590 1.802<br />
De 60 años ........................ 10.687 4.756 5.931 9.374 4.186 5.188 10.378 4.740 5.638<br />
De 61 años ........................ 1.653 861 792 1.709 899 810 2.774 1.416 1.358<br />
De 62 años ........................ 2.652 1.325 1.327 2.830 1.444 1.386 3.452 1.707 1.745<br />
De 63 años ........................ 2.174 1.095 1.079 2.128 1.112 1.016 2.879 1.430 1.449<br />
De 64 años ........................ 2.661 1.360 1.301 2.723 1.392 1.331 3.042 1.445 1.597<br />
De 65 años ........................ 3.043 1.507 1.536 3.335 1.671 1.664 3.688 1.849 1.839<br />
De 66 años ........................ 2.255 1.154 1.101 2.400 1.232 1.168 2.521 1.313 1.208<br />
De 67 años ........................ 1.544 776 768 1.748 917 831 1.814 876 938<br />
De 68 años ........................ 1.935 913 1.022 2.098 995 1.103 2.057 1.010 1.047<br />
De 69 años ........................ 941 454 487 1.143 547 596 1.406 648 758<br />
De 70 años ........................ 4.281 1.949 2.332 4.684 2.138 2.546 4.417 1.972 2.445<br />
De 71 años ........................ 592 296 296 783 432 351 913 459 454<br />
De 72 años ........................ 867 433 434 1.191 610 581 1.173 595 578<br />
De 73 años ........................ 626 313 313 826 465 361 915 456 459<br />
De 74 años ........................ 746 403 343 1.039 511 528 957 477 480<br />
De 75 años ........................ 1.021 485 536 1.335 658 677 1.383 673 710<br />
De 76 años ........................ 748 349 399 931 486 445 810 408 402<br />
De 77 años ........................ 536 260 276 640 346 294 662 317 345<br />
De 78 años ........................ 681 339 342 813 392 421 724 362 362<br />
De 79 años ........................ 310 165 145 419 212 207 549 286 263<br />
De 80 años ........................ 1.827 701 1.126 1.849 707 1.142 1.960 760 1.200<br />
De 81 años ........................ 213 97 116 265 123 142 245 116 129<br />
De 82 años ........................ 286 116 170 328 166 162 315 149 166<br />
De 83 años ........................ 180 84 96 202 93 109 190 95 95<br />
De 84 años ........................ 272 137 135 275 125 150 238 101 137<br />
De 85 años ........................ 259 105 154 258 102 156 307 128 179<br />
De 86 años ........................ 158 62 96 189 82 107 193 96 97<br />
De 87 años ........................ 104 50 54 108 50 58 111 53 58<br />
De 88 años ........................ 139 60 79 161 65 96 123 55 68<br />
De 89 años ........................ 65 27 38 102 43 59 73 32 41<br />
De 90 años ........................ 221 86 135 213 67 146 240 82 158<br />
De 91 años ........................ 23 12 11 19 8 11 36 11 25<br />
De 92 años ........................ 21 11 10 33 9 24 44 20 24<br />
De 93 años ........................ 21 10 11 24 10 14 29 14 15<br />
De 94 años ........................ 18 7 11 17 10 7 26 8 18<br />
De 95 años ........................ 23 7 16 33 8 25 24 8 16<br />
De 96 años ........................ 21 6 15 23 7 16 17 7 10<br />
De 97 años ........................ 11 2 9 11 6 5 14 7 7<br />
De 98 años ........................ 26 1 25 31 14 17 18 7 11<br />
De 99 años ........................ 7 1 6 8 2 6 11 5 6<br />
De 100 años ...................... 20 6 14 21 2 19 20 9 11<br />
De más <strong>de</strong> 100 años ......... 17 6 11 12 4 8 7 1 6<br />
No consta .......................... - - - 310 150 160 869 433 436<br />
Estadísticas Históricas <strong>de</strong> Pob<strong>la</strong>ción <strong>de</strong> <strong>la</strong> Región <strong>de</strong> Murcia. 25
Censos <strong>de</strong> Pob<strong>la</strong>ción. Datos Regionales.<br />
1.2.5. ESTRUCTURA POR SEXO Y EDAD DE LA POBLACIÓN DE HECHO SEGÚN LOS CENSOS<br />
OFICIALES. 1900-1940. (Continúa)<br />
EDAD 1930 1940<br />
TOTAL Hombres Mujeres TOTAL Hombres Mujeres<br />
TOTAL ............................... 645.449 318.876 326.573 719.701 350.200 369.501<br />
Menores <strong>de</strong> 1 año.............. 14.682 7.495 7.187 12.335 6.046 6.289<br />
De 1 año ............................ 13.170 6.672 6.498 11.645 5.906 5.739<br />
De 2 años .......................... 16.120 8.341 7.779 13.199 6.750 6.449<br />
De 3 años .......................... 15.796 8.079 7.717 14.742 7.399 7.343<br />
De 4 años .......................... 16.078 8.096 7.982 14.482 7.176 7.306<br />
De 5 años .......................... 15.887 8.194 7.693 15.180 7.519 7.661<br />
De 6 años .......................... 16.355 8.216 8.139 15.443 7.507 7.936<br />
De 7 años .......................... 15.427 7.900 7.527 15.463 7.665 7.798<br />
De 8 años .......................... 15.565 7.852 7.713 15.323 7.364 7.959<br />
De 9 años .......................... 14.516 7.415 7.101 14.517 7.112 7.405<br />
De 10 años ........................ 14.424 7.360 7.064 15.724 7.760 7.964<br />
De 11 años ........................ 11.970 6.088 5.882 14.880 7.281 7.599<br />
De 12 años ........................ 13.562 6.778 6.784 16.365 7.962 8.403<br />
De 13 años ........................ 11.841 6.011 5.830 14.585 7.160 7.425<br />
De 14 años ........................ 12.618 6.501 6.117 15.794 7.679 8.115<br />
De 15 años ........................ 12.057 5.908 6.149 14.564 6.971 7.593<br />
De 16 años ........................ 11.444 5.499 5.945 14.469 6.800 7.669<br />
De 17 años ........................ 11.447 5.467 5.980 15.010 7.210 7.800<br />
De 18 años ........................ 13.145 6.281 6.864 15.581 7.544 8.037<br />
De 19 años ........................ 10.471 5.158 5.313 12.923 6.207 6.716<br />
De 20 años ........................ 14.131 6.963 7.168 17.062 8.914 8.148<br />
De 21 años ........................ 10.913 5.973 4.940 11.533 6.079 5.454<br />
De 22 años ........................ 12.669 6.304 6.365 13.609 6.991 6.618<br />
De 23 años ........................ 12.043 6.136 5.907 11.649 5.791 5.858<br />
De 24 años ........................ 10.887 5.178 5.709 11.819 5.557 6.262<br />
De 25 años ........................ 11.179 5.245 5.934 12.281 5.751 6.530<br />
De 26 años ........................ 10.923 5.405 5.518 11.721 5.736 5.985<br />
De 27 años ........................ 10.339 5.095 5.244 10.712 5.081 5.631<br />
De 28 años ........................ 11.583 5.440 6.143 12.140 5.450 6.690<br />
De 29 años ........................ 8.414 4.103 4.311 8.976 4.347 4.629<br />
De 30 años ........................ 14.751 7.017 7.734 14.545 6.472 8.073<br />
De 31 años ........................ 6.575 3.453 3.122 8.612 4.321 4.291<br />
De 32 años ........................ 8.246 4.069 4.177 10.334 5.187 5.147<br />
De 33 años ........................ 8.097 4.001 4.096 10.067 5.068 4.999<br />
De 34 años ........................ 7.667 3.727 3.940 8.775 4.209 4.566<br />
De 35 años ........................ 8.781 4.292 4.489 9.697 4.707 4.990<br />
De 36 años ........................ 7.930 3.724 4.206 9.415 4.471 4.944<br />
De 37 años ........................ 6.957 3.361 3.596 8.614 4.135 4.479<br />
De 38 años ........................ 8.451 4.108 4.343 9.745 4.626 5.119<br />
De 39 años ........................ 6.339 3.268 3.071 7.755 3.753 4.002<br />
De 40 años ........................ 12.237 5.898 6.339 13.735 6.388 7.347<br />
De 41 años ........................ 4.714 2.469 2.245 6.969 3.619 3.350<br />
De 42 años ........................ 6.700 3.334 3.366 8.155 4.017 4.138<br />
De 43 años ........................ 5.278 2.534 2.744 7.565 3.550 4.015<br />
De 44 años ........................ 5.193 2.454 2.739 7.271 3.533 3.738<br />
De 45 años ........................ 6.871 3.401 3.470 8.902 4.581 4.321<br />
De 46 años ........................ 5.487 2.643 2.844 7.382 3.892 3.490<br />
De 47 años ........................ 4.460 2.190 2.270 6.951 3.425 3.526<br />
De 48 años ........................ 6.117 2.892 3.225 7.865 3.673 4.192<br />
De 49 años ........................ 4.278 2.138 2.140 6.049 2.937 3.112<br />
26 Estadísticas Históricas <strong>de</strong> Pob<strong>la</strong>ción <strong>de</strong> <strong>la</strong> Región <strong>de</strong> Murcia.
Censos <strong>de</strong> Pob<strong>la</strong>ción. Datos Regionales.<br />
1.2.5. ESTRUCTURA POR SEXO Y EDAD DE LA POBLACIÓN DE HECHO SEGÚN LOS CENSOS<br />
OFICIALES. 1900-1940. (Conclusión)<br />
EDAD 1930 1940<br />
TOTAL Hombres Mujeres TOTAL Hombres Mujeres<br />
De 50 años ........................ 10.346 4.922 5.424 11.553 5.959 5.594<br />
De 51 años ........................ 3.543 1.823 1.720 4.990 2.687 2.303<br />
De 52 años ........................ 4.868 2.415 2.453 6.071 3.147 2.924<br />
De 53 años ........................ 3.925 1.874 2.051 5.439 2.884 2.555<br />
De 54 años ........................ 4.472 2.076 2.396 5.066 2.497 2.569<br />
De 55 años ........................ 5.240 2.490 2.750 5.934 2.986 2.948<br />
De 56 años ........................ 5.020 2.329 2.691 5.369 2.615 2.754<br />
De 57 años ........................ 3.587 1.680 1.907 4.362 2.248 2.114<br />
De 58 años ........................ 4.857 2.259 2.598 5.236 2.496 2.740<br />
De 59 años ........................ 3.433 1.723 1.710 4.246 2.201 2.045<br />
De 60 años ........................ 9.296 4.117 5.179 8.845 3.645 5.200<br />
De 61 años ........................ 2.703 1.405 1.298 3.396 1.544 1.852<br />
De 62 años ........................ 3.721 1.796 1.925 4.171 1.950 2.221<br />
De 63 años ........................ 3.279 1.602 1.677 3.694 1.858 1.836<br />
De 64 años ........................ 3.505 1.697 1.808 3.715 1.774 1.941<br />
De 65 años ........................ 4.852 2.402 2.450 4.609 2.108 2.501<br />
De 66 años ........................ 3.554 1.743 1.811 3.835 1.803 2.032<br />
De 67 años ........................ 2.743 1.328 1.415 3.307 1.615 1.692<br />
De 68 años ........................ 2.978 1.334 1.644 3.401 1.635 1.766<br />
De 69 años ........................ 1.750 842 908 2.299 1.065 1.234<br />
De 70 años ........................ 4.800 2.122 2.678 4.879 2.147 2.732<br />
De 71 años ........................ 1.348 720 628 1.748 845 903<br />
De 72 años ........................ 1.804 897 907 2.342 1.083 1.259<br />
De 73 años ........................ 1.439 691 748 2.016 889 1.127<br />
De 74 años ........................ 1.373 680 693 1.774 852 922<br />
De 75 años ........................ 1.822 815 1.007 2.293 1.093 1.200<br />
De 76 años ........................ 1.291 657 634 1.763 837 926<br />
De 77 años ........................ 985 495 490 1.736 862 874<br />
De 78 años ........................ 1.081 502 579 1.526 687 839<br />
De 79 años ........................ 540 253 287 1.149 560 589<br />
De 80 años ........................ 1.805 644 1.161 2.246 907 1.339<br />
De 81 años ........................ 383 178 205 528 212 316<br />
De 82 años ........................ 531 251 280 711 252 459<br />
De 83 años ........................ 346 137 209 486 159 327<br />
De 84 años ........................ 384 158 226 502 143 359<br />
De 85 años ........................ 452 165 287 548 163 385<br />
De 86 años ........................ 291 125 166 371 125 246<br />
De 87 años ........................ 198 78 120 295 83 212<br />
De 88 años ........................ 212 80 132 290 106 184<br />
De 89 años ........................ 145 58 87 227 71 156<br />
De 90 años ........................ 222 61 161 238 62 176<br />
De 91 años ........................ 51 24 27 60 8 52<br />
De 92 años ........................ 47 18 29 55 10 45<br />
De 93 años ........................ 50 24 26 46 7 39<br />
De 94 años ........................ 24 9 15 34 10 24<br />
De 95 años ........................ 49 12 37 49 12 37<br />
De 96 años ........................ 31 6 25 42 1 41<br />
De 97 años ........................ 19 7 12 18 - 18<br />
De 98 años ........................ 23 6 17 30 5 25<br />
De 99 años ........................ 25 16 9 29 11 18<br />
De 100 años ...................... 15 2 13 2 2 -<br />
De más <strong>de</strong> 100 años ......... 11 3 8 1 - 1<br />
No consta .......................... 1.195 999 196 - - -<br />
Fuente: INE. Censos <strong>de</strong> Pob<strong>la</strong>ción.<br />
Estadísticas Históricas <strong>de</strong> Pob<strong>la</strong>ción <strong>de</strong> <strong>la</strong> Región <strong>de</strong> Murcia. 27
Censos <strong>de</strong> Pob<strong>la</strong>ción. Datos Regionales.<br />
1.2.6. ESTRUCTURA POR SEXO Y EDAD DE LA POBLACIÓN DE HECHO SEGÚN LOS CENSOS<br />
OFICIALES. 1950.<br />
EDAD TOTAL HOMBRES MUJERES<br />
TOTAL ........................................... 756.721 368.044 386.677<br />
Menores <strong>de</strong> 5 años........................ 73.959 38.203 35.756<br />
De 5 a 9 años ................................ 69.320 34.852 34.468<br />
De 10 a 14 años ............................ 71.225 36.060 35.165<br />
De 15 a 24 años ............................ 156.552 78.771 77.781<br />
De 25 a 34 años ............................ 111.793 53.938 57.855<br />
De 35 a 44 años ............................ 88.905 41.602 47.303<br />
De 45 a 54 años ............................ 78.751 37.543 41.208<br />
De 55 a 64 años ............................ 55.311 25.739 29.572<br />
De 65 y más años.......................... 50.672 21.266 29.406<br />
No consta ...................................... 233 70 163<br />
Fuente: INE. Censos <strong>de</strong> Pob<strong>la</strong>ción.<br />
28 Estadísticas Históricas <strong>de</strong> Pob<strong>la</strong>ción <strong>de</strong> <strong>la</strong> Región <strong>de</strong> Murcia.
Censos <strong>de</strong> Pob<strong>la</strong>ción. Datos Regionales.<br />
1.2.7. ESTRUCTURA POR SEXO Y EDAD DE LA POBLACIÓN DE DERECHO SEGÚN LOS CENSOS<br />
OFICIALES. 1960-1991. (Continúa)<br />
EDAD 1960 1970<br />
TOTAL Hombres Mujeres TOTAL Hombres Mujeres<br />
TOTAL............................. 801.656 393.008 408.648 832.017 407.595 424.422<br />
Menores <strong>de</strong> 1 año ........... 15.179 7.590 7.589 18.149 9.336 8.813<br />
De 1 año.......................... 18.563 9.381 9.182 17.451 8.902 8.549<br />
De 2 años ........................ 17.971 8.990 8.981 17.678 9.114 8.564<br />
De 3 años ........................ 17.979 9.089 8.890 18.145 9.328 8.817<br />
De 4 años ........................ 15.537 7.727 7.810 18.352 9.392 8.960<br />
De 5 años ........................ 15.965 8.083 7.882 18.286 9.135 9.151<br />
De 6 años ........................ 15.195 7.671 7.524 17.871 9.092 8.779<br />
De 7 años ........................ 15.060 7.780 7.280 17.287 8.814 8.473<br />
De 8 años ........................ 15.410 8.010 7.400 16.558 8.520 8.038<br />
De 9 años ........................ 14.374 7.301 7.073 16.079 8.129 7.950<br />
De 10 años ...................... 15.101 7.766 7.335 16.730 8.340 8.390<br />
De 11 años ...................... 13.997 7.214 6.783 16.219 8.337 7.882<br />
De 12 años ...................... 15.946 8.373 7.573 15.880 7.896 7.984<br />
De 13 años ...................... 14.324 7.329 6.995 15.762 7.964 7.798<br />
De 14 años ...................... 13.953 7.160 6.793 13.417 6.869 6.548<br />
De 15 años ...................... 14.637 7.083 7.554 13.679 7.214 6.465<br />
De 16 años ...................... 13.477 6.493 6.984 12.891 6.508 6.383<br />
De 17 años ...................... 12.693 6.308 6.385 13.521 6.905 6.616<br />
De 18 años ...................... 11.833 5.844 5.989 13.457 6.690 6.767<br />
De 19 años ...................... 10.910 5.683 5.227 12.910 6.638 6.272<br />
De 20 años ...................... 17.104 9.503 7.601 12.341 6.368 5.973<br />
De 21 años ...................... 11.391 6.783 4.608 11.564 6.091 5.473<br />
De 22 años ...................... 14.537 8.334 6.203 12.950 6.791 6.159<br />
De 23 años ...................... 12.402 6.162 6.240 11.596 6.017 5.579<br />
De 24 años ...................... 13.145 6.466 6.679 10.548 5.319 5.229<br />
De 25 años ...................... 12.443 6.099 6.344 12.097 6.020 6.077<br />
De 26 años ...................... 12.676 6.105 6.571 10.440 5.028 5.412<br />
De 27 años ...................... 13.622 6.803 6.819 10.060 4.919 5.141<br />
De 28 años ...................... 13.547 6.485 7.062 8.897 4.400 4.497<br />
De 29 años ...................... 12.399 6.187 6.212 8.532 4.343 4.189<br />
De 30 años ...................... 15.110 7.450 7.660 12.278 5.877 6.401<br />
De 31 años ...................... 11.115 5.508 5.607 7.451 3.627 3.824<br />
De 32 años ...................... 12.530 6.082 6.448 10.438 4.983 5.455<br />
De 33 años ...................... 12.311 6.104 6.207 10.478 5.229 5.249<br />
De 34 años ...................... 11.249 5.558 5.691 11.096 5.358 5.738<br />
De 35 años ...................... 11.834 5.652 6.182 11.269 5.572 5.697<br />
De 36 años ...................... 12.037 5.987 6.050 10.953 5.397 5.556<br />
De 37 años ...................... 10.143 5.179 4.964 12.096 6.057 6.039<br />
De 38 años ...................... 11.660 5.467 6.193 11.475 5.574 5.901<br />
De 39 años ...................... 9.870 5.123 4.747 11.501 5.772 5.729<br />
De 40 años ...................... 11.199 5.252 5.947 12.388 6.129 6.259<br />
De 41 años ...................... 7.619 3.672 3.947 10.555 4.989 5.566<br />
De 42 años ...................... 8.873 4.284 4.589 11.538 5.765 5.773<br />
De 43 años ...................... 7.605 3.507 4.098 10.602 5.271 5.331<br />
De 44 años ...................... 7.544 3.650 3.894 11.015 5.491 5.524<br />
De 45 años ...................... 8.738 4.202 4.536 10.923 5.301 5.622<br />
De 46 años ...................... 7.883 3.645 4.238 10.687 5.320 5.367<br />
De 47 años ...................... 7.375 3.422 3.953 9.425 4.758 4.667<br />
De 48 años ...................... 8.153 3.824 4.329 9.876 4.770 5.106<br />
De 49 años ...................... 7.283 3.371 3.912 9.067 4.333 4.734<br />
De 50 años ...................... 9.145 4.263 4.882 8.791 4.242 4.549<br />
De 51 años ...................... 7.011 3.409 3.602 7.255 3.345 3.910<br />
De 52 años ...................... 7.922 3.887 4.035 7.293 3.466 3.827<br />
De 53 años ...................... 7.259 3.465 3.794 7.208 3.276 3.932<br />
De 54 años ...................... 7.157 3.274 3.883 6.913 3.167 3.746<br />
De 55 años ...................... 7.833 3.586 4.247 7.594 3.677 3.917<br />
De 56 años ...................... 7.234 3.359 3.875 7.013 3.235 3.778<br />
De 57 años ...................... 6.781 3.085 3.696 6.735 3.078 3.657<br />
De 58 años ...................... 7.290 3.394 3.896 7.038 3.106 3.932<br />
Estadísticas Históricas <strong>de</strong> Pob<strong>la</strong>ción <strong>de</strong> <strong>la</strong> Región <strong>de</strong> Murcia. 29
Censos <strong>de</strong> Pob<strong>la</strong>ción. Datos Regionales.<br />
1.2.7. ESTRUCTURA POR SEXO Y EDAD DE LA POBLACIÓN DE DERECHO SEGÚN LOS CENSOS<br />
OFICIALES. 1960-1991. (Continúa)<br />
EDAD 1960 1970<br />
TOTAL Hombres Mujeres TOTAL Hombres Mujeres<br />
De 59 años ...................... 6.615 3.051 3.564 6.639 3.204 3.435<br />
De 60 años ...................... 8.660 3.759 4.901 8.126 3.540 4.586<br />
De 61 años ...................... 5.592 2.657 2.935 6.628 3.171 3.457<br />
De 62 años ...................... 5.791 2.550 3.241 6.584 3.026 3.558<br />
De 63 años ...................... 5.784 2.619 3.165 6.878 3.206 3.672<br />
De 64 años ...................... 5.723 2.500 3.223 6.522 3.086 3.436<br />
De 65 años ...................... 6.372 2.859 3.513 6.725 2.910 3.815<br />
De 66 años ...................... 5.450 2.349 3.101 6.259 2.720 3.539<br />
De 67 años ...................... 5.613 2.383 3.230 6.148 2.665 3.483<br />
De 68 años ...................... 5.146 2.256 2.890 6.187 2.649 3.538<br />
De 69 años ...................... 3.941 1.826 2.115 5.042 2.378 2.664<br />
De 70 años ...................... 4.761 2.098 2.663 6.318 2.617 3.701<br />
De 71 años ...................... 2.910 1.361 1.549 4.463 2.013 2.450<br />
De 72 años ...................... 3.883 1.701 2.182 4.066 1.662 2.404<br />
De 73 años ...................... 3.150 1.402 1.748 3.982 1.761 2.221<br />
De 74 años ...................... 2.535 1.109 1.426 4.004 1.858 2.146<br />
De 75 años ...................... 2.656 1.095 1.561 4.015 1.682 2.333<br />
De 76 años ...................... 2.243 951 1.292 3.180 1.226 1.954<br />
De 77 años ...................... 2.036 922 1.114 3.062 1.258 1.804<br />
De 78 años ...................... 2.010 785 1.225 2.744 1.051 1.693<br />
De 79 años ...................... 1.414 648 766 2.065 856 1.209<br />
De 80 años (1)................. 9.783 3.589 6.194 2.376 962 1.414<br />
De 81 años ...................... .. .. .. 1.594 609 985<br />
De 82 años ...................... .. .. .. 1.594 625 969<br />
De 83 años ...................... .. .. .. 1.136 485 651<br />
De 84 años ...................... .. .. .. 1.138 390 748<br />
De 85 y más años............ .. .. .. 4.244 1.401 2.843<br />
No consta ........................ 455 75 380 - - -<br />
(1) En el censo <strong>de</strong> 1960 los datos <strong>de</strong> 80 años se refieren a 80 y más años.<br />
30 Estadísticas Históricas <strong>de</strong> Pob<strong>la</strong>ción <strong>de</strong> <strong>la</strong> Región <strong>de</strong> Murcia.
Censos <strong>de</strong> Pob<strong>la</strong>ción. Datos Regionales.<br />
1.2.7. ESTRUCTURA POR SEXO Y EDAD DE LA POBLACIÓN DE DERECHO SEGÚN LOS CENSOS<br />
OFICIALES. 1960-1991. (Continúa)<br />
EDAD 1981 1991<br />
TOTAL Hombres Mujeres TOTAL Hombres Mujeres<br />
TOTAL............................. 955.492 469.346 486.146 1.045.601 514.527 531.074<br />
Menores <strong>de</strong> 1 año ........... 17.722 9.265 8.457 13.629 6.985 6.644<br />
De 1 año.......................... 18.078 9.407 8.671 13.635 7.013 6.622<br />
De 2 años ........................ 18.391 9.854 8.537 13.171 6.853 6.318<br />
De 3 años ........................ 18.067 9.326 8.741 13.492 7.013 6.479<br />
De 4 años ........................ 18.204 9.355 8.849 13.561 6.990 6.571<br />
De 5 años ........................ 19.002 9.603 9.399 14.078 7.266 6.812<br />
De 6 años ........................ 18.720 9.434 9.286 14.262 7.313 6.949<br />
De 7 años ........................ 18.853 9.608 9.245 15.023 7.747 7.276<br />
De 8 años ........................ 18.217 9.511 8.706 16.054 8.215 7.839<br />
De 9 años ........................ 18.112 9.220 8.892 16.845 8.622 8.223<br />
De 10 años ...................... 18.772 9.539 9.233 17.939 9.300 8.639<br />
De 11 años ...................... 18.439 9.437 9.002 18.555 9.623 8.932<br />
De 12 años ...................... 18.153 9.448 8.705 19.216 9.840 9.376<br />
De 13 años ...................... 18.962 9.909 9.053 18.780 9.739 9.041<br />
De 14 años ...................... 19.232 9.974 9.258 19.412 9.985 9.427<br />
De 15 años ...................... 18.925 9.780 9.146 19.603 10.026 9.577<br />
De 16 años ...................... 18.561 9.363 9.198 19.546 9.955 9.591<br />
De 17 años ...................... 17.849 8.942 8.907 19.453 10.017 9.436<br />
De 18 años ...................... 16.321 8.118 8.202 18.951 9.593 9.358<br />
De 19 años ...................... 16.351 8.253 8.098 18.584 9.498 9.086<br />
De 20 años ...................... 16.119 8.138 7.981 18.899 9.636 9.263<br />
De 21 años ...................... 15.694 8.028 7.666 18.616 9.520 9.096<br />
De 22 años ...................... 15.393 7.803 7.590 18.658 9.577 9.081<br />
De 23 años ...................... 14.671 7.365 7.306 18.876 9.612 9.264<br />
De 24 años ...................... 12.889 6.390 6.499 18.408 9.280 9.128<br />
De 25 años ...................... 12.747 6.654 6.093 17.996 9.144 8.852<br />
De 26 años ...................... 11.921 5.880 6.041 17.820 9.048 8.772<br />
De 27 años ...................... 11.977 5.920 6.057 17.400 8.748 8.652<br />
De 28 años ...................... 12.064 5.844 6.220 15.991 7.995 7.996<br />
De 29 años ...................... 11.487 5.650 5.837 15.508 7.714 7.794<br />
De 30 años ...................... 11.381 5.636 5.745 16.126 8.034 8.092<br />
De 31 años ...................... 11.265 5.606 5.659 15.728 7.815 7.913<br />
De 32 años ...................... 11.899 5.823 6.076 15.587 7.662 7.925<br />
De 33 años ...................... 11.778 5.730 6.049 15.242 7.684 7.558<br />
De 34 años ...................... 10.400 5.238 5.163 13.111 6.447 6.664<br />
De 35 años ...................... 12.073 5.897 6.176 13.181 6.566 6.615<br />
De 36 años ...................... 10.425 5.068 5.357 12.635 6.310 6.325<br />
De 37 años ...................... 10.223 5.086 5.137 12.618 6.300 6.318<br />
De 38 años ...................... 9.554 4.724 4.830 12.604 6.227 6.377<br />
De 39 años ...................... 9.004 4.603 4.401 12.043 5.961 6.082<br />
De 40 años ...................... 11.581 5.382 6.199 12.056 5.934 6.122<br />
De 41 años ...................... 8.772 4.482 4.290 11.715 5.796 5.919<br />
De 42 años ...................... 10.136 4.780 5.356 12.363 6.121 6.242<br />
De 43 años ...................... 10.885 5.492 5.393 12.074 5.992 6.082<br />
De 44 años ...................... 11.106 5.324 5.781 10.850 5.281 5.569<br />
De 45 años ...................... 11.323 5.601 5.722 12.308 6.037 6.271<br />
De 46 años ...................... 11.237 5.533 5.704 10.985 5.328 5.657<br />
De 47 años ...................... 11.701 5.794 5.906 10.258 5.100 5.158<br />
De 48 años ...................... 11.407 5.634 5.773 9.451 4.625 4.826<br />
De 49 años ...................... 11.555 5.814 5.742 8.795 4.413 4.382<br />
De 50 años ...................... 12.039 5.720 6.319 11.612 5.548 6.064<br />
De 51 años ...................... 11.032 5.154 5.877 8.482 4.154 4.328<br />
De 52 años ...................... 11.661 5.906 5.755 10.074 4.783 5.291<br />
De 53 años ...................... 10.544 5.310 5.234 10.745 5.230 5.515<br />
De 54 años ...................... 11.128 5.359 5.769 10.836 5.288 5.548<br />
De 55 años ...................... 10.579 4.963 5.616 10.927 5.289 5.638<br />
De 56 años ...................... 10.893 5.417 5.475 10.961 5.291 5.670<br />
De 57 años ...................... 9.064 4.591 4.472 11.294 5.579 5.715<br />
De 58 años ...................... 9.689 4.657 5.031 10.972 5.289 5.683<br />
Estadísticas Históricas <strong>de</strong> Pob<strong>la</strong>ción <strong>de</strong> <strong>la</strong> Región <strong>de</strong> Murcia. 31
Censos <strong>de</strong> Pob<strong>la</strong>ción. Datos Regionales.<br />
1.2.7. ESTRUCTURA POR SEXO Y EDAD DE LA POBLACIÓN DE DERECHO SEGÚN LOS CENSOS<br />
OFICIALES. 1960-1991. (Conclusión)<br />
EDAD 1981 1991<br />
TOTAL Hombres Mujeres TOTAL Hombres Mujeres<br />
De 59 años ...................... 8.908 4.588 4.320 10.995 5.360 5.635<br />
De 60 años ...................... 7.792 3.559 4.232 11.673 5.645 6.028<br />
De 61 años ...................... 7.492 3.379 4.113 10.488 4.890 5.598<br />
De 62 años ...................... 6.993 3.211 3.782 10.785 5.258 5.527<br />
De 63 años ...................... 6.302 2.801 3.501 10.016 4.750 5.266<br />
De 64 años ...................... 6.222 2.747 3.474 10.205 4.778 5.427<br />
De 65 años ...................... 6.748 3.000 3.748 9.754 4.534 5.220<br />
De 66 años ...................... 6.518 2.812 3.706 9.974 4.736 5.238<br />
De 67 años ...................... 6.208 2.615 3.593 8.373 3.954 4.419<br />
De 68 años ...................... 6.306 2.812 3.494 8.679 3.857 4.822<br />
De 69 años ...................... 5.672 2.523 3.149 8.259 3.867 4.392<br />
De 70 años ...................... 5.865 2.478 3.388 6.957 3.099 3.858<br />
De 71 años ...................... 5.956 2.538 3.417 6.478 2.845 3.633<br />
De 72 años ...................... 5.637 2.361 3.276 5.902 2.555 3.347<br />
De 73 años ...................... 5.565 2.502 3.063 5.600 2.315 3.285<br />
De 74 años ...................... 4.836 1.939 2.897 5.308 2.168 3.140<br />
De 75 años ...................... 4.626 1.871 2.755 5.210 2.176 3.034<br />
De 76 años ...................... 4.453 1.662 2.791 4.828 1.908 2.920<br />
De 77 años ...................... 3.877 1.519 2.358 4.494 1.762 2.732<br />
De 78 años ...................... 3.798 1.436 2.362 4.376 1.697 2.679<br />
De 79 años ...................... 3.389 1.389 2.000 3.956 1.549 2.407<br />
De 80 años ...................... 3.487 1.195 2.291 3.849 1.404 2.445<br />
De 81 años ...................... 2.660 934 1.726 3.567 1.344 2.223<br />
De 82 años ...................... 1.985 733 1.252 3.183 1.179 2.004<br />
De 83 años ...................... 1.759 679 1.081 2.798 985 1.813<br />
De 84 años ...................... 1.655 610 1.045 2.270 799 1.471<br />
De 85 y más años............ 6.562 2.111 4.450 10.030 3.162 6.868<br />
No consta ........................ .. .. .. .. .. ..<br />
Fuente: INE. Censos <strong>de</strong> Pob<strong>la</strong>ción.<br />
Consejería <strong>de</strong> Economía y Hacienda. Centro Regional <strong>de</strong> Estadística. Censo <strong>de</strong> Pob<strong>la</strong>ción <strong>de</strong> 1991 <strong>de</strong> <strong>la</strong> Región <strong>de</strong> Murcia. Resultados Regionales.<br />
32 Estadísticas Históricas <strong>de</strong> Pob<strong>la</strong>ción <strong>de</strong> <strong>la</strong> Región <strong>de</strong> Murcia.
Censos <strong>de</strong> Pob<strong>la</strong>ción. Datos Regionales.<br />
1.3. EVOLUCIÓN DE LA POBLACIÓN DE DERECHO POR SEXO SEGÚN RECTIFICACIONES DEL<br />
PADRÓN MUNICIPAL DE HABITANTES. 1940-1995.<br />
EDAD TOTAL HOMBRES MUJERES<br />
1940(1) .................................... 731.221 359.711 371.510<br />
1941 ........................................ 738.142 363.054 375.088<br />
1942 ........................................ 745.193 366.349 378.844<br />
1943 ........................................ 747.345 367.187 380.158<br />
1944 ........................................ 755.939 371.420 384.519<br />
1945 ........................................ 740.258 360.164 380.094<br />
1946 ........................................ 751.566 366.920 384.646<br />
1947 ........................................ 762.070 372.104 389.966<br />
1948 ........................................ 778.514 380.515 397.999<br />
1949 ........................................ 790.994 386.758 404.236<br />
1950(1) .................................... 755.850 367.276 388.574<br />
1951 ........................................ 771.138 376.758 394.380<br />
1952 ........................................ 779.679 379.741 399.938<br />
1953 ........................................ 788.970 384.792 404.178<br />
1954 ........................................ 797.418 389.203 408.215<br />
1955 ........................................ 784.825 383.260 401.565<br />
1956 ........................................ 793.594 387.539 406.055<br />
1957 ........................................ 803.716 392.621 411.095<br />
1958 ........................................ 816.071 399.563 416.508<br />
1959 ........................................ 826.056 404.950 421.106<br />
1960(1) .................................... 803.086 393.093 409.993<br />
1961 ........................................ 815.103 399.185 415.918<br />
1962 ........................................ 827.547 405.431 422.116<br />
1963 ........................................ 838.858 410.986 427.872<br />
1964 ........................................ 843.580 414.393 429.187<br />
1965 ........................................ 808.355 396.745 411.610<br />
1966 ........................................ 839.690 412.326 427.364<br />
1967 ........................................ 851.330 418.130 433.200<br />
1968 ........................................ 864.640 425.519 439.121<br />
1969 ........................................ 879.779 433.852 445.927<br />
1970(1) .................................... 832.047 407.613 424.434<br />
1971 ........................................ 845.198 414.333 430.865<br />
1972 ........................................ 861.481 422.486 438.995<br />
1973 ........................................ 875.114 429.433 445.681<br />
1974 ........................................ 889.321 436.711 452.610<br />
1975 ........................................ 881.340 431.493 449.847<br />
1976 ........................................ 911.824 446.894 464.930<br />
1977 ........................................ 938.815 460.603 478.212<br />
1978 ........................................ 957.010 469.990 487.020<br />
1979(2) .................................... 972.344 468.273 484.834<br />
1981(1) .................................... 955.487 469.339 486.148<br />
1982 ........................................ 970.157 476.606 493.551<br />
1983 ........................................ 998.272 490.796 507.476<br />
1984 ........................................ 1.011.098 497.256 513.842<br />
1985 ........................................ 1.023.901 503.739 520.162<br />
1986 ........................................ 1.006.788 495.779 511.009<br />
1987 ........................................ 1.013.166 499.115 514.051<br />
1988 ........................................ 1.035.736 510.291 525.445<br />
1989 ........................................ 1.048.029 516.456 531.573<br />
1990 ........................................ 1.062.066 523.635 538.431<br />
1991(1) .................................... 1.045.601 514.527 531.074<br />
1992 ........................................ 1.053.386 519.053 534.333<br />
1993 ........................................ 1.080.986 533.168 547.818<br />
1994 ........................................ 1.099.651 542.701 556.950<br />
1995 ........................................ 1.109.977 548.185 561.792<br />
(1) Datos <strong>de</strong> los Censos <strong>de</strong> Pob<strong>la</strong>ción.<br />
(2) Para 1979 no se dispone <strong>de</strong> <strong>la</strong>s pob<strong>la</strong>ciones <strong>de</strong> San Pedro <strong>de</strong>l Pinatar y Las Torres <strong>de</strong> Cotil<strong>la</strong>s diferenciadas por sexo.<br />
Fuente: Delegación Provincial <strong>de</strong>l INE en Murcia.<br />
Estadísticas Históricas <strong>de</strong> Pob<strong>la</strong>ción <strong>de</strong> <strong>la</strong> Región <strong>de</strong> Murcia. 33
CENSOS.<br />
DATOS<br />
MUNICIPALES.
Censos <strong>de</strong> Pob<strong>la</strong>ción. Datos Municipales.<br />
2.1.1. EVOLUCIÓN DE LA POBLACIÓN DE HECHO SEGÚN LOS CENSOS OFICIALES. 1787-1991.<br />
AMBOS SEXOS. (Continúa)<br />
MUNICIPIOS 1787 (*) 1857 1860 1877 1887 1897(1) 1900 1910<br />
TOTAL............................................... 256.977 380.969 382.812 451.611 491.436 518.263 577.987 615.105<br />
Abanil<strong>la</strong>.............................................. 2.644 4.324 4.650 5.689 5.617 6.121 6.634 7.451<br />
Abarán............................................... 905 2.652 2.651 3.379 3.460 3.570 3.834 4.130<br />
Águi<strong>la</strong>s............................................... 1.618 8.449 8.010 8.947 10.042 12.381 15.868 15.967<br />
Albu<strong>de</strong>ite ........................................... 1.681 1.209 1.253 1.199 1.300 1.255 1.331 1.560<br />
Alcantaril<strong>la</strong>......................................... 3.855 4.083 4.061 4.167 4.606 4.778 4.972 5.680<br />
Alcázares (Los) ................................. .. .. .. .. .. .. .. ..<br />
Aledo ................................................. 1.521 1.485 1.541 1.369 1.471 1.380 970 948<br />
Alguazas............................................ 1.216 1.963 2.014 2.193 2.276 2.407 2.559 2.872<br />
Alhama <strong>de</strong> Murcia ............................. 3.103 5.763 5.571 6.298 7.203 7.901 8.461 9.184<br />
Archena ............................................. 813 3.374 2.786 3.533 3.761 4.492 4.590 5.740<br />
Beniel ................................................ 1.438 2.010 1.945 1.400 1.291 1.523 1.621 2.125<br />
B<strong>la</strong>nca ............................................... 1.378 2.458 2.446 3.067 3.461 3.862 3.842 4.317<br />
Bul<strong>la</strong>s................................................. 2.729 5.072 5.279 6.326 6.727 7.147 7.722 4.414<br />
Ca<strong>la</strong>sparra......................................... 2.353 3.614 3.797 4.907 5.175 6.232 6.442 7.502<br />
Campos <strong>de</strong>l Río................................. .. 1.180 1.214 1.360 1.286 1.492 1.491 1.690<br />
Caravaca <strong>de</strong> <strong>la</strong> Cruz.......................... 10.990 14.326 14.359 15.017 15.053 15.128 15.846 17.349<br />
Cartagena.......................................... 45.939 59.618 54.315 75.908 84.230 86.245 99.871 102.542<br />
Cehegín............................................. 5.950 8.710 8.890 9.760 10.417 11.360 11.601 13.313<br />
Ceutí.................................................. 449 1.369 1.489 1.694 1.952 2.113 2.286 2.480<br />
Cieza ................................................. 5.582 9.516 9.578 10.910 10.905 11.877 13.626 14.393<br />
Fortuna .............................................. 3.441 5.490 5.615 5.605 5.690 5.288 5.615 6.502<br />
Fuente-Á<strong>la</strong>mo.................................... 1.702 7.685 6.861 7.901 8.922 9.380 9.969 10.879<br />
Jumil<strong>la</strong> ............................................... 6.577 10.611 10.466 13.886 14.334 16.023 16.446 17.467<br />
Libril<strong>la</strong>................................................ 2.332 2.242 2.399 2.516 2.722 2.930 2.465 3.379<br />
Lorca ................................................. 33.103 47.918 48.158 52.934 58.327 59.624 69.836 70.807<br />
Lorquí ................................................ 573 1.094 1.131 1.279 1.315 1.418 1.439 1.776<br />
Mazarrón ........................................... 5.832 8.086 8.367 11.002 16.445 17.047 23.284 22.660<br />
Molina <strong>de</strong> Segura .............................. 2.635 6.370 6.243 6.807 7.667 8.188 8.615 10.465<br />
Moratal<strong>la</strong>............................................ 6.337 10.319 10.467 11.216 11.926 11.729 12.689 13.500<br />
Mu<strong>la</strong>................................................... 6.491 9.634 9.764 10.597 10.768 10.341 12.731 11.922<br />
Murcia................................................ 67.473 89.314 87.803 91.805 98.538 108.408 111.539 125.057<br />
Ojós ................................................... 550 950 991 1.144 1.168 1.266 1.277 1.323<br />
Pliego ................................................ 2.606 2.579 2.823 2.416 2.803 2.822 2.745 2.771<br />
Puerto Lumbreras.............................. 1.959 .. .. .. .. .. .. ..<br />
Ricote ................................................ 1.094 1.594 1.717 2.025 2.280 2.490 2.597 2.999<br />
San Javier ......................................... .. 3.208 3.213 3.421 4.209 4.298 4.489 4.941<br />
San Pedro <strong>de</strong> Pinatar ........................ .. 1.650 1.715 2.012 2.306 2.489 2.647 3.061<br />
Santomera......................................... .. .. .. .. .. .. .. ..<br />
Torre Pacheco................................... .. 7.181 6.472 7.006 8.074 8.296 8.549 9.777<br />
Torres <strong>de</strong> Cotil<strong>la</strong>s (Las) ..................... 1.379 1.841 2.011 2.063 2.185 2.516 2.606 2.922<br />
Totana ............................................... 8.667 8.765 8.851 9.648 11.021 11.634 13.703 13.591<br />
Ulea ................................................... 663 788 819 911 947 1.151 1.198 1.407<br />
Unión (La).......................................... 369 .. 8.001 22.122 20.966 21.594 30.275 30.249<br />
Vil<strong>la</strong>nueva <strong>de</strong>l Río Segura................. 649 806 848 896 884 982 963 1.110<br />
Yec<strong>la</strong> ................................................. 8.381 11.669 12.228 15.276 17.706 17.085 18.743 22.883<br />
(*) Los datos se han obtenido agregando <strong>la</strong>s pob<strong>la</strong>ciones según <strong>la</strong> asignación hecha por el I.N.E. a los municipios actuales. Los datos <strong>de</strong> Murcia incluyen San Javier,<br />
Torre Pacheco, Santomera, parte <strong>de</strong> Fuente A<strong>la</strong>mo y <strong>de</strong> Alhama <strong>de</strong> Murcia. Campos <strong>de</strong>l Río y San Pedro <strong>de</strong>l Pinatar aparecen en el Nomenc<strong>la</strong>tor pero no se tiene<br />
el dato <strong>de</strong> Pob<strong>la</strong>ción para ellos. Para el pueblo Pinatar no se i<strong>de</strong>ntifica el municipio actual y su <strong>pob<strong>la</strong>ción</strong> aparece <strong>de</strong>ntro <strong>de</strong> Murcia.<br />
(1) Del Censo <strong>de</strong> 1897 sólo se publicaron datos provisionales, ya que el siguiente Censo se realizaría en 1900.<br />
Estadísticas Históricas <strong>de</strong> Pob<strong>la</strong>ción <strong>de</strong> <strong>la</strong> Región <strong>de</strong> Murcia<br />
37
Censos <strong>de</strong> Pob<strong>la</strong>ción. Datos Municipales..<br />
2.1.1. EVOLUCIÓN DE LA POBLACIÓN DE HECHO SEGÚN LOS CENSOS OFICIALES. 1787-1991.<br />
AMBOS SEXOS. (Conclusión)<br />
38<br />
MUNICIPIOS 1920 1930 1940 1950 1960 1970 1981 1991<br />
TOTAL .......................................... 638.639 645.449 719.701 756.721 800.463 832.313 957.903 1.059.612<br />
Abanil<strong>la</strong>......................................... 7.641 8.179 8.220 8.620 8.594 8.675 7.049 5.827<br />
Abarán .......................................... 5.260 6.634 7.876 8.422 8.808 10.153 11.097 11.810<br />
Águi<strong>la</strong>s.......................................... 17.078 15.745 15.166 15.225 15.250 17.389 20.595 24.610<br />
Albu<strong>de</strong>ite....................................... 1.560 1.599 1.709 1.695 1.804 1.701 1.560 1.400<br />
Alcantaril<strong>la</strong> .................................... 6.411 7.837 10.744 13.229 15.748 19.895 24.406 30.070<br />
Alcázares (Los)............................. .. .. .. .. .. .. .. 4.052<br />
Aledo ............................................ 1.306 1.210 1.261 1.368 1.233 1.057 1.030 953<br />
Alguazas....................................... 3.164 3.412 3.931 4.160 5.015 4.770 5.759 6.937<br />
Alhama <strong>de</strong> Murcia......................... 9.597 9.860 10.740 11.560 11.736 11.557 13.085 14.131<br />
Archena ........................................ 6.174 6.983 8.006 7.567 8.829 10.058 11.876 13.852<br />
Beniel............................................ 2.461 3.057 4.058 4.379 4.568 5.007 5.991 6.975<br />
B<strong>la</strong>nca........................................... 4.327 5.083 4.964 5.632 6.101 6.136 6.382 5.623<br />
Bul<strong>la</strong>s............................................ 7.928 9.031 8.936 9.734 9.441 9.064 9.498 9.529<br />
Ca<strong>la</strong>sparra .................................... 8.001 8.701 10.342 10.371 9.597 8.289 8.423 8.428<br />
Campos <strong>de</strong>l Río............................ 1.695 1.918 1.868 2.254 2.155 2.012 2.046 1.949<br />
Caravaca <strong>de</strong> <strong>la</strong> Cruz..................... 18.753 21.306 20.645 21.700 20.735 18.415 20.231 21.238<br />
Cartagena..................................... 96.891 102.518 113.468 113.160 123.630 146.904 172.751 173.061<br />
Cehegín ........................................ 13.684 15.043 17.316 15.830 15.928 12.489 13.365 13.271<br />
Ceutí ............................................. 2.851 3.453 4.025 3.931 4.640 5.337 5.631 6.342<br />
Cieza............................................. 16.140 17.889 23.499 23.328 22.438 25.359 29.932 30.306<br />
Fortuna ......................................... 6.131 6.442 5.831 5.888 5.630 5.564 5.709 6.081<br />
Fuente-Á<strong>la</strong>mo ............................... 11.303 8.772 9.270 9.769 9.506 8.914 8.464 8.298<br />
Jumil<strong>la</strong> .......................................... 20.303 20.456 21.165 20.851 21.590 20.103 20.492 19.825<br />
Libril<strong>la</strong> ........................................... 3.035 2.886 2.807 2.981 2.826 3.111 3.512 3.735<br />
Lorca............................................. 74.696 60.300 69.639 70.998 58.641 60.609 60.627 67.024<br />
Lorquí ........................................... 2.262 2.712 3.472 3.197 3.982 4.150 4.966 5.309<br />
Mazarrón....................................... 17.630 13.604 11.569 9.281 9.865 9.096 10.262 15.250<br />
Molina <strong>de</strong> Segura.......................... 10.991 12.289 13.721 14.683 16.308 23.178 31.322 37.792<br />
Moratal<strong>la</strong>....................................... 13.412 13.692 14.536 14.117 14.029 10.549 9.083 8.625<br />
Mu<strong>la</strong>.............................................. 12.319 13.034 14.312 15.127 14.721 13.922 13.608 12.930<br />
Murcia........................................... 141.175 158.724 193.731 218.375 249.738 243.759 288.631 338.250<br />
Ojós .............................................. 1.228 1.190 1.346 1.151 1.159 894 629 653<br />
Pliego............................................ 2.615 2.472 2.472 3.238 3.409 3.404 3.331 3.187<br />
Puerto Lumbreras......................... .. .. .. .. 7.080 7.986 8.495 9.824<br />
Ricote ........................................... 2.786 2.956 2.874 2.915 2.726 2.304 1.774 1.679<br />
San Javier..................................... 4.967 5.641 6.889 9.268 10.284 10.500 12.500 15.277<br />
San Pedro <strong>de</strong>l Pinatar................... 3.259 3.299 4.261 5.006 5.436 6.520 8.959 12.221<br />
Santomera .................................... .. .. .. .. .. .. 7.303 8.488<br />
Torre-Pacheco.............................. 9.247 8.934 9.541 10.409 11.184 13.087 15.896 16.710<br />
Torres <strong>de</strong> Cotil<strong>la</strong>s (Las) ................ 3.511 3.970 4.664 5.266 5.960 7.223 11.157 14.014<br />
Totana........................................... 14.072 13.608 15.264 14.763 14.281 16.107 18.394 20.288<br />
Ulea .............................................. 1.459 1.515 1.591 1.559 1.461 1.342 1.113 1.026<br />
Unión (La)..................................... 24.837 11.776 10.079 10.131 11.687 13.145 14.097 13.732<br />
Vil<strong>la</strong>nueva <strong>de</strong>l Río Segura ............ 1.148 1.309 1.522 1.537 1.711 1.855 1.726 1.543<br />
Yec<strong>la</strong>............................................. 25.331 26.410 22.371 24.046 20.999 20.724 25.146 27.487<br />
Fuente: INE. Censos <strong>de</strong> Pob<strong>la</strong>ción.<br />
Consejería <strong>de</strong> Economía y Hacienda. Centro Regional <strong>de</strong> Estadística. Censo <strong>de</strong> Pob<strong>la</strong>ción <strong>de</strong> 1991 <strong>de</strong> <strong>la</strong> Región <strong>de</strong> Murcia. Resultados Municipales.<br />
Estadísticas Históricas <strong>de</strong> Pob<strong>la</strong>ción <strong>de</strong> <strong>la</strong> Región <strong>de</strong> Murcia.
Censos <strong>de</strong> Pob<strong>la</strong>ción. Datos Municipales.<br />
2.1.2. EVOLUCIÓN DE LA POBLACIÓN DE HECHO SEGÚN LOS CENSOS OFICIALES. 1787-1991.<br />
HOMBRES. (Continúa)<br />
MUNICIPIOS 1787 (*) 1857 1860 1877 1887 1897(1) 1900 1910<br />
TOTAL............................................... 133.640 191.654 191.966 224.361 245.219 257.635 287.861 304.570<br />
Abanil<strong>la</strong>.............................................. 1.343 2.129 2.270 2.745 2.725 3.065 3.268 3.590<br />
Abarán............................................... 428 1.315 1.328 1.690 1.690 1.775 1.935 2.078<br />
Águi<strong>la</strong>s............................................... 856 4.249 3.810 4.354 4.958 5.997 7.859 7.709<br />
Albu<strong>de</strong>ite ........................................... 834 605 609 598 649 620 661 775<br />
Alcantaril<strong>la</strong>......................................... 1.769 1.941 1.933 1.987 2.222 2.267 2.414 2.691<br />
Alcázares (Los) ................................. .. .. .. .. .. .. .. ..<br />
Aledo ................................................. 730 758 768 657 752 696 489 521<br />
Alguazas............................................ 605 956 984 1.063 1.138 1.194 1.295 1.451<br />
Alhama <strong>de</strong> Murcia ............................. 1.538 2.812 2.728 3.091 3.615 3.926 4.231 4.622<br />
Archena ............................................. 413 1.745 1.454 1.718 1.891 2.220 2.262 2.810<br />
Beniel ................................................ 723 970 955 690 647 764 801 1.068<br />
B<strong>la</strong>nca ............................................... 722 1.195 1.184 1.493 1.658 1.841 1.802 2.084<br />
Bul<strong>la</strong>s................................................. 1.353 2.549 2.672 3.233 3.437 3.601 3.930 2.301<br />
Ca<strong>la</strong>sparra......................................... 1.261 1.821 1.907 2.473 2.582 3.107 3.246 3.753<br />
Campos <strong>de</strong>l Río................................. .. 559 569 651 645 760 779 866<br />
Caravaca <strong>de</strong> <strong>la</strong> Cruz.......................... 5.608 7.119 7.093 7.476 7.474 7.401 7.860 8.470<br />
Cartagena.......................................... 27.822 32.773 29.789 40.338 43.838 45.637 50.898 51.380<br />
Cehegín............................................. 2.947 4.313 4.346 4.757 5.190 5.628 5.889 6.684<br />
Ceutí.................................................. 240 692 747 838 980 1.072 1.162 1.238<br />
Cieza ................................................. 2.766 4.844 4.801 5.435 5.367 5.819 6.738 7.083<br />
Fortuna .............................................. 1.714 2.362 2.468 2.491 2.578 2.355 2.239 3.037<br />
Fuente Á<strong>la</strong>mo .................................... 880 3.907 3.511 3.901 4.401 4.709 5.074 5.460<br />
Jumil<strong>la</strong> ............................................... 3.369 5.378 5.266 6.967 7.249 8.167 8.435 8.746<br />
Libril<strong>la</strong>................................................ 1.186 1.104 1.191 1.223 1.326 1.460 1.090 1.647<br />
Lorca ................................................. 16.303 23.811 23.608 26.085 28.786 29.121 34.687 35.272<br />
Lorquí ................................................ 279 527 563 630 652 706 711 863<br />
Mazarrón ........................................... 3.051 4.160 4.264 5.513 8.324 8.519 11.715 11.390<br />
Molina <strong>de</strong> Segura .............................. 1.345 3.122 3.101 3.411 3.825 4.013 4.259 5.117<br />
Moratal<strong>la</strong>............................................ 3.236 5.263 5.309 5.610 6.124 6.189 6.578 6.953<br />
Mu<strong>la</strong>................................................... 3.252 4.838 4.848 5.208 5.401 5.036 6.389 5.975<br />
Murcia................................................ 33.766 43.303 42.603 43.872 47.963 52.166 54.564 60.953<br />
Ojós ................................................... 276 492 513 556 577 626 629 637<br />
Pliego ................................................ 1.317 1.215 1.376 1.176 1.411 1.377 1.317 1.338<br />
Puerto Lumbreras.............................. 990 .. .. .. .. .. .. ..<br />
Ricote ................................................ 558 807 888 999 1.106 1.176 1.265 1.471<br />
San Javier ......................................... .. 1.652 1.650 1.591 2.097 2.121 2.188 2.417<br />
San Pedro <strong>de</strong> Pinatar ........................ .. 816 839 981 1.153 1.202 1.277 1.482<br />
Santomera......................................... .. .. .. .. .. .. .. ..<br />
Torre Pacheco................................... .. 3.688 3.264 3.453 3.966 4.003 4.169 5.026<br />
Torres <strong>de</strong> Cotil<strong>la</strong>s (Las) ..................... 716 901 1.027 1.037 1.084 1.243 1.310 1.460<br />
Totana ............................................... 4.317 4.337 4.329 4.700 5.382 5.740 6.706 6.447<br />
Ulea ................................................... 360 413 409 444 458 560 569 676<br />
Unión (La).......................................... 184 .. 4.408 11.138 10.530 10.794 15.246 15.081<br />
Vil<strong>la</strong>nueva <strong>de</strong>l Río Segura................. 325 404 425 435 431 478 475 532<br />
Yec<strong>la</strong> ................................................. 4.258 5.809 6.159 7.653 8.937 8.484 9.450 11.416<br />
(*) Los datos se han obtenido agregando <strong>la</strong>s pob<strong>la</strong>ciones según <strong>la</strong> asignación hecha por el I.N.E. a los municipios actuales. Los datos <strong>de</strong> Murcia incluyen San Javier,<br />
Torre Pacheco, Santomera, parte <strong>de</strong> Fuente A<strong>la</strong>mo y <strong>de</strong> Alhama <strong>de</strong> Murcia. Campos <strong>de</strong>l Río y San Pedro <strong>de</strong>l Pinatar aparecen en el Nomenc<strong>la</strong>tor pero no se tiene<br />
el dato <strong>de</strong> Pob<strong>la</strong>ción para ellos. Para el pueblo Pinatar no se i<strong>de</strong>ntifica el municipio actual y su <strong>pob<strong>la</strong>ción</strong> aparece <strong>de</strong>ntro <strong>de</strong> Murcia.<br />
(1) Del Censo <strong>de</strong> 1897 sólo se publicaron datos provisionales, ya que el siguiente Censo se realizaría en 1900.<br />
Estadísticas Históricas <strong>de</strong> Pob<strong>la</strong>ción <strong>de</strong> <strong>la</strong> Región <strong>de</strong> Murcia<br />
39
Censos <strong>de</strong> Pob<strong>la</strong>ción. Datos Municipales..<br />
2.1.2. EVOLUCIÓN DE LA POBLACIÓN DE HECHO SEGÚN LOS CENSOS OFICIALES. 1787-1991.<br />
HOMBRES. (Conclusión)<br />
40<br />
MUNICIPIOS 1920 1930 1940 1950 1960 1970 1981 1991<br />
TOTAL .......................................... 312.435 318.876 350.200 368.044 391.718 408.510 471.250 522.682<br />
Abanil<strong>la</strong>......................................... 3.658 3.861 3.825 4.126 4.140 4.295 3.472 2.826<br />
Abarán .......................................... 2.627 3.300 3.772 4.027 4.214 4.918 5.454 5.837<br />
Águi<strong>la</strong>s.......................................... 8.286 7.628 7.201 7.328 7.289 8.441 10.077 12.238<br />
Albu<strong>de</strong>ite....................................... 757 772 814 843 894 837 761 699<br />
Alcantaril<strong>la</strong> .................................... 3.100 3.735 4.963 6.288 7.481 9.505 11.729 14.551<br />
Alcázares (Los)............................. .. .. .. .. .. .. .. 2.102<br />
Aledo ............................................ 643 604 595 652 604 503 511 489<br />
Alguazas....................................... 1.553 1.660 1.846 1.993 2.453 2.320 2.835 3.417<br />
Alhama <strong>de</strong> Murcia......................... 4.695 4.824 5.119 5.514 5.721 5.637 6.395 6.950<br />
Archena ........................................ 3.014 3.344 3.772 3.688 4.344 4.901 5.821 6.843<br />
Beniel............................................ 1.222 1.537 1.941 2.133 2.263 2.470 2.959 3.452<br />
B<strong>la</strong>nca........................................... 2.037 2.433 2.320 2.674 2.913 2.940 3.029 2.724<br />
Bul<strong>la</strong>s............................................ 3.973 4.540 4.380 4.849 4.741 4.533 4.705 4.662<br />
Ca<strong>la</strong>sparra .................................... 4.107 4.364 4.970 5.107 4.715 4.031 4.194 4.184<br />
Campos <strong>de</strong>l Río............................ 849 977 940 1.095 1.046 980 1.025 963<br />
Caravaca <strong>de</strong> <strong>la</strong> Cruz..................... 9.237 10.392 10.137 10.793 10.255 9.119 9.898 10.459<br />
Cartagena..................................... 48.797 52.918 56.448 55.627 61.478 73.960 87.522 87.694<br />
Cehegín ........................................ 6.829 7.508 8.508 7.970 7.960 6.148 6.574 6.531<br />
Ceutí ............................................. 1.415 1.693 1.915 1.956 2.344 2.680 2.827 3.175<br />
Cieza............................................. 7.885 8.670 11.400 11.122 10.859 12.292 14.502 14.646<br />
Fortuna ......................................... 2.848 3.000 2.753 2.900 2.771 2.717 2.829 3.062<br />
Fuente-Á<strong>la</strong>mo ............................... 5.506 4.271 4.557 4.794 4.677 4.433 4.214 4.111<br />
Jumil<strong>la</strong> .......................................... 10.078 10.300 10.355 10.227 10.660 9.950 10.174 9.800<br />
Libril<strong>la</strong> ........................................... 1.463 1.370 1.298 1.434 1.360 1.525 1.722 1.809<br />
Lorca............................................. 36.864 29.471 33.943 34.471 28.525 30.329 29.597 33.638<br />
Lorquí ........................................... 1.110 1.326 1.641 1.555 1.910 2.004 2.433 2.605<br />
Mazarrón....................................... 8.530 6.743 5.492 4.458 4.840 4.450 5.134 7.688<br />
Molina <strong>de</strong> Segura.......................... 5.326 6.068 6.678 7.058 7.947 11.158 15.334 18.497<br />
Moratal<strong>la</strong>....................................... 6.828 6.975 7.198 7.221 7.192 5.370 4.553 4.326<br />
Mu<strong>la</strong>.............................................. 6.112 6.574 6.996 7.507 7.280 6.800 6.720 6.397<br />
Murcia........................................... 67.696 76.928 93.788 104.972 120.649 117.543 139.659 163.759<br />
Ojós .............................................. 580 578 646 557 564 426 296 322<br />
Pliego............................................ 1.262 1.187 1.202 1.571 1.693 1.697 1.647 1.603<br />
Puerto Lumbreras......................... .. .. .. .. 3.377 3.924 4.136 4.770<br />
Ricote ........................................... 1.358 1.463 1.396 1.433 1.303 1.088 853 812<br />
San Javier..................................... 2.436 2.835 3.476 4.897 5.601 5.301 6.274 7.560<br />
San Pedro <strong>de</strong>l Pinatar................... 1.577 1.604 2.072 2.395 2.657 3.211 4.423 6.043<br />
Santomera .................................... .. .. .. .. .. .. 3.671 4.217<br />
Torre-Pacheco.............................. 4.662 4.470 4.687 5.205 5.680 6.637 8.106 8.436<br />
Torres <strong>de</strong> Cotil<strong>la</strong>s (Las) ................ 1.749 1.957 2.212 2.560 2.907 3.525 5.478 6.994<br />
Totana........................................... 6.909 6.622 8.007 7.144 6.860 7.830 9.053 10.072<br />
Ulea .............................................. 712 747 797 756 710 645 537 516<br />
Unión (La)..................................... 11.313 5.729 4.813 4.821 5.768 6.423 6.858 6.786<br />
Vil<strong>la</strong>nueva <strong>de</strong>l Río Segura ............ 530 614 715 736 829 895 852 772<br />
Yec<strong>la</strong>............................................. 12.302 13.284 10.612 11.587 10.244 10.119 12.407 13.645<br />
Fuente: INE. Censos <strong>de</strong> Pob<strong>la</strong>ción.<br />
Consejería <strong>de</strong> Economía y Hacienda. Centro Regional <strong>de</strong> Estadística. Censo <strong>de</strong> Pob<strong>la</strong>ción <strong>de</strong> 1991 <strong>de</strong> <strong>la</strong> Región <strong>de</strong> Murcia. Resultados Municipales.<br />
Estadísticas Históricas <strong>de</strong> Pob<strong>la</strong>ción <strong>de</strong> <strong>la</strong> Región <strong>de</strong> Murcia.
Censos <strong>de</strong> Pob<strong>la</strong>ción. Datos Municipales.<br />
2.1.3. EVOLUCIÓN DE LA POBLACIÓN DE HECHO SEGÚN LOS CENSOS OFICIALES. 1787-1991.<br />
MUJERES. (Continúa)<br />
MUNICIPIOS 1787 (*) 1857 1860 1877 1887 1897(1) 1900 1910<br />
TOTAL............................................... 123.337 189.315 190.846 227.250 246.217 260.628 290.126 310.535<br />
Abanil<strong>la</strong>.............................................. 1.301 2.195 2.380 2.944 2.892 3.056 3.366 3.861<br />
Abarán............................................... 477 1.337 1.323 1.689 1.770 1.795 1.899 2.052<br />
Águi<strong>la</strong>s............................................... 762 4.200 4.200 4.593 5.084 6.384 8.009 8.258<br />
Albu<strong>de</strong>ite ........................................... 847 604 644 601 651 635 670 785<br />
Alcantaril<strong>la</strong>......................................... 2.086 2.142 2.128 2.180 2.384 2.511 2.558 2.989<br />
Alcázares (Los) ................................. .. .. .. .. .. .. .. ..<br />
Aledo ................................................. 791 727 773 712 719 684 481 427<br />
Alguazas............................................ 611 1.007 1.030 1.130 1.138 1.213 1.264 1.421<br />
Alhama <strong>de</strong> Murcia ............................. 1.565 2.951 2.843 3.207 3.588 3.975 4.230 4.562<br />
Archena ............................................. 400 1.629 1.322 1.815 1.870 2.272 2.328 2.930<br />
Beniel ................................................ 715 1.040 990 710 644 759 820 1.057<br />
B<strong>la</strong>nca ............................................... 656 1.263 1.262 1.574 1.803 2.021 2.040 2.233<br />
Bul<strong>la</strong>s................................................. 1.376 2.523 2.607 3.093 3.290 3.546 3.792 2.113<br />
Ca<strong>la</strong>sparra......................................... 1.092 1.793 1.890 2.434 2.593 3.125 3.196 3.749<br />
Campos <strong>de</strong>l Río................................. .. 621 645 709 641 732 712 824<br />
Caravaca <strong>de</strong> <strong>la</strong> Cruz.......................... 5.382 7.207 7.266 7.541 7.579 7.727 7.986 8.879<br />
Cartagena.......................................... 18.117 26.845 24.526 35.570 40.392 40.608 48.973 51.162<br />
Cehegín............................................. 3.003 4.397 4.544 5.003 5.227 5.732 5.712 6.629<br />
Ceutí.................................................. 209 677 742 856 972 1.041 1.124 1.242<br />
Cieza ................................................. 2.816 4.672 4.777 5.475 5.538 6.058 6.888 7.310<br />
Fortuna .............................................. 1.727 3.128 3.147 3.114 3.112 2.933 3.376 3.465<br />
Fuente Á<strong>la</strong>mo .................................... 822 3.778 3.350 4.000 4.521 4.671 4.895 5.419<br />
Jumil<strong>la</strong> ............................................... 3.208 5.233 5.200 6.919 7.085 7.856 8.011 8.721<br />
Libril<strong>la</strong>................................................ 1.146 1.138 1.208 1.293 1.396 1.470 1.375 1.732<br />
Lorca ................................................. 16.800 24.107 24.550 26.849 29.541 30.503 35.149 35.535<br />
Lorquí ................................................ 294 567 568 649 663 712 728 913<br />
Mazarron ........................................... 2.781 3.926 4.103 5.489 8.121 8.528 11.569 11.270<br />
Molina <strong>de</strong> Segura .............................. 1.290 3.248 3.142 3.396 3.842 4.175 4.356 5.348<br />
Moratal<strong>la</strong>............................................ 3.101 5.056 5.158 5.606 5.802 5.540 6.111 6.547<br />
Mu<strong>la</strong>................................................... 3.239 4.796 4.916 5.389 5.367 5.305 6.342 5.947<br />
Murcia................................................ 33.707 46.011 45.200 47.933 50.575 56.242 56.975 64.104<br />
Ojós ................................................... 274 458 478 588 591 640 648 686<br />
Pliego ................................................ 1.289 1.364 1.447 1.240 1.392 1.445 1.428 1.433<br />
Puerto Lumbreras.............................. 969 .. .. .. .. .. .. ..<br />
Ricote ................................................ 536 787 829 1.026 1.174 1.314 1.332 1.528<br />
San Javier ......................................... .. 1.556 1.563 1.830 2.112 2.177 2.301 2.524<br />
San Pedro <strong>de</strong> Pinatar ........................ .. 834 876 1.031 1.153 1.287 1.370 1.579<br />
Santomera......................................... .. .. .. .. .. .. .. ..<br />
Torre Pacheco................................... .. 3.493 3.208 3.553 4.108 4.293 4.380 4.751<br />
Torres <strong>de</strong> Cotil<strong>la</strong>s (Las) ..................... 663 940 984 1.026 1.101 1.273 1.296 1.462<br />
Totana ............................................... 4.350 4.428 4.522 4.948 5.639 5.894 6.997 7.144<br />
Ulea ................................................... 303 375 410 467 489 591 629 731<br />
Unión (La).......................................... 185 .. 3.593 10.984 10.436 10.800 15.029 15.168<br />
Vil<strong>la</strong>nueva <strong>de</strong>l Rio Segura ................. 324 402 423 461 453 504 488 578<br />
Yec<strong>la</strong> ................................................. 4.123 5.860 6.069 7.623 8.769 8.601 9.293 11.467<br />
(*) Los datos se han obtenido agregando <strong>la</strong>s pob<strong>la</strong>ciones según <strong>la</strong> asignación hecha por el I.N.E. a los municipios actuales. Los datos <strong>de</strong> Murcia incluyen San Javier,<br />
Torre Pacheco, Santomera, parte <strong>de</strong> Fuente A<strong>la</strong>mo y <strong>de</strong> Alhama <strong>de</strong> Murcia. Campos <strong>de</strong>l Río y San Pedro <strong>de</strong>l Pinatar aparecen en el Nomenc<strong>la</strong>tor pero no se tiene<br />
el dato <strong>de</strong> Pob<strong>la</strong>ción para ellos. Para el pueblo Pinatar no se i<strong>de</strong>ntifica el municipio actual y su <strong>pob<strong>la</strong>ción</strong> aparece <strong>de</strong>ntro <strong>de</strong> Murcia.<br />
(1) Del Censo <strong>de</strong> 1897 sólo se publicaron datos provisionales, ya que el siguiente Censo se realizaría en 1900.<br />
Estadísticas Históricas <strong>de</strong> Pob<strong>la</strong>ción <strong>de</strong> <strong>la</strong> Región <strong>de</strong> Murcia<br />
41
Censos <strong>de</strong> Pob<strong>la</strong>ción. Datos Municipales..<br />
2.1.3. EVOLUCIÓN DE LA POBLACIÓN DE HECHO SEGÚN LOS CENSOS OFICIALES. 1787-1991.<br />
MUJERES. (Conclusión)<br />
42<br />
MUNICIPIOS 1920 1930 1940 1950 1960 1970 1981 1991<br />
TOTAL .......................................... 326.204 326.573 369.501 388.677 408.745 423.803 486.653 536.930<br />
Abanil<strong>la</strong>......................................... 3.983 4.318 4.395 4.494 4.454 4.380 3.577 3.001<br />
Abarán .......................................... 2.633 3.334 4.104 4.395 4.594 5.235 5.643 5.973<br />
Águi<strong>la</strong>s.......................................... 8.792 8.117 7.965 7.897 7.961 8.948 10.518 12.372<br />
Albu<strong>de</strong>ite....................................... 803 827 895 852 910 864 799 701<br />
Alcantaril<strong>la</strong> .................................... 3.311 4.102 5.781 6.941 8.267 10.390 12.677 15.519<br />
Alcázares (Los)............................. .. .. .. .. .. .. .. 1.950<br />
Aledo ............................................ 663 606 666 716 629 554 519 464<br />
Alguazas....................................... 1.611 1.752 2.085 2.167 2.562 2.450 2.924 3.520<br />
Alhama <strong>de</strong> Murcia......................... 4.902 5.036 5.621 6.046 6.015 5.920 6.690 7.181<br />
Archena ........................................ 3.160 3.639 4.234 3.879 4.485 5.157 6.055 7.009<br />
Beniel............................................ 1.239 1.520 2.117 2.246 2.305 2.537 3.032 3.523<br />
B<strong>la</strong>nca........................................... 2.290 2.650 2.644 2.958 3.188 3.196 3.353 2.899<br />
Bul<strong>la</strong>s............................................ 3.955 4.491 4.556 4.885 4.700 4.531 4.793 4.867<br />
Ca<strong>la</strong>sparra .................................... 3.894 4.337 5.372 5.264 4.882 4.258 4.229 4.244<br />
Campos <strong>de</strong>l Río............................ 846 941 928 1.159 1.109 1.032 1.021 986<br />
Caravaca <strong>de</strong> <strong>la</strong> Cruz..................... 9.516 10.914 10.508 10.907 10.480 9.296 10.333 10.779<br />
Cartagena..................................... 48.094 49.600 57.020 57.533 62.152 72.944 85.229 85.367<br />
Cehegín ........................................ 6.855 7.535 8.808 7.860 7.968 6.341 6.791 6.740<br />
Ceutí ............................................. 1.436 1.760 2.110 1.975 2.296 2.657 2.804 3.167<br />
Cieza............................................. 8.255 9.219 12.099 12.206 11.579 13.067 15.430 15.660<br />
Fortuna ......................................... 3.283 3.442 3.078 2.988 2.859 2.847 2.880 3.019<br />
Fuente-Á<strong>la</strong>mo ............................... 5.797 4.501 4.713 4.975 4.829 4.481 4.250 4.187<br />
Jumil<strong>la</strong> .......................................... 10.225 10.156 10.810 10.624 10.930 10.153 10.318 10.025<br />
Libril<strong>la</strong> ........................................... 1.572 1.516 1.509 1.547 1.466 1.586 1.790 1.926<br />
Lorca............................................. 37.832 30.829 35.696 36.527 30.116 30.280 31.030 33.386<br />
Lorquí ........................................... 1.152 1.386 1.831 1.642 2.072 2.146 2.533 2.704<br />
Mazarrón....................................... 9.100 6.861 6.077 4.823 5.025 4.646 5.128 7.562<br />
Molina <strong>de</strong> Segura.......................... 5.665 6.221 7.043 7.625 8.361 12.020 15.988 19.295<br />
Moratal<strong>la</strong>....................................... 6.584 6.717 7.338 6.896 6.837 5.179 4.530 4.299<br />
Mu<strong>la</strong>.............................................. 6.207 6.460 7.316 7.620 7.441 7.122 6.888 6.533<br />
Murcia........................................... 73.479 81.796 99.943 113.403 129.089 126.216 148.972 174.491<br />
Ojós .............................................. 648 612 700 594 595 468 333 331<br />
Pliego............................................ 1.353 1.285 1.270 1.667 1.716 1.707 1.684 1.584<br />
Puerto Lumbreras......................... .. .. .. .. 3.703 4.062 4.359 5.054<br />
Ricote ........................................... 1.428 1.493 1.478 1.482 1.423 1.216 921 867<br />
San Javier..................................... 2.531 2.806 3.413 4.371 4.683 5.199 6.226 7.717<br />
San Pedro <strong>de</strong>l Pinatar................... 1.682 1.695 2.189 2.611 2.779 3.309 4.536 6.178<br />
Santomera .................................... .. .. .. .. .. .. 3.632 4.271<br />
Torre-Pacheco.............................. 4.585 4.464 4.854 5.204 5.504 6.450 7.790 8.274<br />
Torres <strong>de</strong> Cotil<strong>la</strong>s (Las) ................ 1.762 2.013 2.452 2.706 3.053 3.698 5.679 7.020<br />
Totana........................................... 7.163 6.986 7.257 7.619 7.421 8.277 9.341 10.216<br />
Ulea .............................................. 747 768 794 803 751 697 576 510<br />
Unión (La)..................................... 13.524 6.047 5.266 5.310 5.919 6.722 7.239 6.946<br />
Vil<strong>la</strong>nueva <strong>de</strong>l Río Segura ............ 618 695 807 801 882 960 874 771<br />
Yec<strong>la</strong>............................................. 13.029 13.126 11.759 12.459 10.755 10.605 12.739 13.842<br />
Fuente: INE. Censos <strong>de</strong> Pob<strong>la</strong>ción.<br />
Consejería <strong>de</strong> Economía y Hacienda. Centro Regional <strong>de</strong> Estadística. Censo <strong>de</strong> Pob<strong>la</strong>ción <strong>de</strong> 1991 <strong>de</strong> <strong>la</strong> Región <strong>de</strong> Murcia. Resultados Municipales.<br />
Estadísticas Históricas <strong>de</strong> Pob<strong>la</strong>ción <strong>de</strong> <strong>la</strong> Región <strong>de</strong> Murcia.
Censos <strong>de</strong> Pob<strong>la</strong>ción. Datos Municipales.<br />
2.2.1. EVOLUCIÓN DE LA POBLACIÓN DE DERECHO SEGÚN LOS CENSOS OFICIALES. 1877-<br />
1991. AMBOS SEXOS. (Continúa)<br />
MUNICIPIOS 1877 1887 1897 (1) 1900 1910 1920<br />
TOTAL.............................................. 452.082 489.770 519.149 581.455 620.926 654.436<br />
Abanil<strong>la</strong>............................................. 5.866 5.740 6.131 6.723 7.635 8.096<br />
Abarán.............................................. 3.348 3.478 3.693 3.925 4.161 5.393<br />
Águi<strong>la</strong>s.............................................. 8.908 9.883 12.331 15.753 16.037 17.315<br />
Albu<strong>de</strong>ite .......................................... 1.245 1.284 1.260 1.339 1.560 1.604<br />
Alcantaril<strong>la</strong>........................................ 4.172 4.622 4.813 4.986 5.752 6.399<br />
Alcázares (Los) ................................ .. .. .. .. .. ..<br />
Aledo ................................................ 1.392 1.480 1.382 973 958 1.335<br />
Alguazas........................................... 2.220 2.276 2.419 2.579 2.910 3.169<br />
Alhama <strong>de</strong> Murcia ............................ 6.526 7.356 7.903 8.410 9.207 9.743<br />
Archena ............................................ 3.498 3.761 4.512 4.510 5.827 6.238<br />
Beniel ............................................... 1.401 1.284 1.535 1.617 2.111 2.497<br />
B<strong>la</strong>nca .............................................. 3.061 3.465 3.896 4.024 4.352 4.390<br />
Bul<strong>la</strong>s................................................ 6.308 6.698 7.136 7.704 5.021 7.974<br />
Ca<strong>la</strong>sparra........................................ 4.796 5.100 6.196 6.428 7.464 7.851<br />
Campos <strong>de</strong>l Río................................ 1.375 1.247 1.505 1.517 1.690 1.743<br />
Caravaca <strong>de</strong> <strong>la</strong> Cruz......................... 14.902 14.992 14.964 15.804 17.520 18.854<br />
Cartagena......................................... 75.901 86.004 86.424 103.373 102.519 101.613<br />
Cehegín............................................ 9.807 10.389 11.365 11.523 13.411 13.801<br />
Ceutí................................................. 1.663 1.955 2.163 2.303 2.642 2.891<br />
Cieza ................................................ 10.870 10.892 11.717 13.590 14.337 16.026<br />
Fortuna ............................................. 6.090 5.948 5.651 6.552 6.770 6.306<br />
Fuente Á<strong>la</strong>mo ................................... 8.160 9.164 9.578 9.964 10.917 11.505<br />
Jumil<strong>la</strong> .............................................. 13.619 14.064 15.633 15.868 17.513 20.340<br />
Libril<strong>la</strong>............................................... 2.567 2.733 3.060 3.076 3.498 3.184<br />
Lorca ................................................ 53.057 58.239 59.806 69.910 72.795 75.802<br />
Lorquí ............................................... 1.302 1.328 1.420 1.439 1.777 2.275<br />
Mazarrón .......................................... 11.022 14.370 17.022 23.362 22.878 18.206<br />
Molina <strong>de</strong> Segura ............................. 6.801 7.658 8.272 8.654 10.494 11.082<br />
Moratal<strong>la</strong>........................................... 11.225 11.952 11.848 12.816 13.497 13.477<br />
Mu<strong>la</strong>.................................................. 10.601 10.735 10.298 12.733 12.878 12.407<br />
Murcia............................................... 91.509 98.507 108.476 111.693 125.243 142.480<br />
Ojós .................................................. 1.191 1.194 1.280 1.266 1.374 1.308<br />
Pliego ............................................... 2.586 2.817 2.920 2.913 3.007 2.706<br />
Puerto Lumbreras............................. .. .. .. .. .. ..<br />
Ricote ............................................... 2.097 2.300 2.503 2.604 3.022 2.819<br />
San Javier ........................................ 3.774 4.195 4.276 4.326 4.940 5.026<br />
San Pedro <strong>de</strong> Pinatar ....................... 2.006 2.346 2.490 2.637 3.076 3.276<br />
Santomera........................................ .. .. .. .. .. ..<br />
Torre Pacheco.................................. 7.152 8.175 8.669 8.858 9.782 9.400<br />
Torres <strong>de</strong> Cotil<strong>la</strong>s (Las) .................... 2.063 2.193 2.524 2.616 2.964 3.557<br />
Totana .............................................. 9.648 11.055 11.641 13.714 14.235 14.211<br />
Ulea .................................................. 943 949 1.127 1.194 1.420 1.481<br />
Unión (La)......................................... 21.332 20.096 21.260 28.479 29.599 30.016<br />
Vil<strong>la</strong>nueva <strong>de</strong>l Río Segura................ 895 895 1.043 983 1.087 1.154<br />
Yec<strong>la</strong> ................................................ 15.183 16.951 17.007 18.717 23.046 25.486<br />
(1) Del Censo <strong>de</strong> 1897 sólo se publicaron datos provisionales, ya que el siguiente Censo se realizaría en 1900.<br />
Estadísticas Históricas <strong>de</strong> Pob<strong>la</strong>ción <strong>de</strong> <strong>la</strong> Región <strong>de</strong> Murcia<br />
43
Censos <strong>de</strong> Pob<strong>la</strong>ción. Datos Municipales..<br />
2.2.1. EVOLUCIÓN DE LA POBLACIÓN DE DERECHO SEGÚN LOS CENSOS OFICIALES. 1877-<br />
1991. AMBOS SEXOS. (Conclusión)<br />
44<br />
MUNICIPIOS 1930 1940 1950 1960 1970 1981 1991<br />
TOTAL ............................................. 651.979 731.221 755.850 803.086 832.047 955.487 1.045.601<br />
Abanil<strong>la</strong>............................................ 8.452 8.769 8.646 8.681 8.740 7.146 6.074<br />
Abarán ............................................. 6.647 7.980 8.461 8.878 10.200 11.183 11.865<br />
Águi<strong>la</strong>s............................................. 15.903 15.466 15.427 15.535 17.187 20.809 24.894<br />
Albu<strong>de</strong>ite.......................................... 1.640 1.737 1.719 1.831 1.701 1.658 1.411<br />
Alcantaril<strong>la</strong> ....................................... 7.879 10.966 13.294 15.959 20.070 24.617 30.144<br />
Alcázares (Los)................................ .. .. .. .. .. .. 3.683<br />
Aledo ............................................... 1.233 1.297 1.384 1.237 1.067 1.081 985<br />
Alguazas.......................................... 3.349 4.063 4.226 5.079 4.886 5.782 6.931<br />
Alhama <strong>de</strong> Murcia............................ 10.042 11.083 11.344 11.786 11.600 13.132 14.175<br />
Archena ........................................... 7.071 8.269 7.608 8.935 10.110 11.944 13.487<br />
Beniel............................................... 3.058 4.183 4.381 4.572 5.041 6.043 7.220<br />
B<strong>la</strong>nca.............................................. 5.098 5.109 5.683 6.156 6.173 6.486 5.768<br />
Bul<strong>la</strong>s............................................... 9.182 9.363 9.883 9.594 9.132 9.666 10.009<br />
Ca<strong>la</strong>sparra ....................................... 8.673 10.627 10.416 9.707 8.357 8.678 8.745<br />
Campos <strong>de</strong>l Río............................... 1.942 1.971 2.274 2.222 2.021 2.046 1.949<br />
Caravaca <strong>de</strong> <strong>la</strong> Cruz........................ 21.560 20.550 21.752 20.943 18.782 20.455 21.296<br />
Cartagena........................................ 102.705 115.468 110.979 122.387 143.466 167.936 168.023<br />
Cehegín ........................................... 15.258 17.684 15.833 16.109 12.722 13.648 13.614<br />
Ceutí ................................................ 3.504 4.127 3.933 4.649 5.396 5.664 6.411<br />
Cieza................................................ 17.667 23.866 23.433 22.619 26.089 30.327 30.875<br />
Fortuna ............................................ 6.681 6.248 5.964 5.707 5.612 5.792 6.004<br />
Fuente-Á<strong>la</strong>mo .................................. 9.073 9.597 9.873 9.596 8.977 8.538 8.279<br />
Jumil<strong>la</strong> ............................................. 20.564 21.582 20.988 21.847 20.268 20.663 20.092<br />
Libril<strong>la</strong> .............................................. 2.981 3.049 3.032 3.079 3.194 3.516 3.764<br />
Lorca................................................ 61.392 69.517 71.269 59.316 60.286 61.879 65.919<br />
Lorquí .............................................. 2.734 3.600 3.220 4.066 4.200 5.049 5.328<br />
Mazarrón.......................................... 14.120 11.928 9.501 9.998 9.191 10.270 14.591<br />
Molina <strong>de</strong> Segura............................. 12.374 13.887 14.861 16.415 23.579 31.515 37.806<br />
Moratal<strong>la</strong>.......................................... 13.815 15.013 14.136 14.205 10.664 9.374 8.976<br />
Mu<strong>la</strong>................................................. 13.088 14.293 15.040 14.913 14.122 14.738 13.053<br />
Murcia.............................................. 159.825 195.658 217.934 249.771 243.687 284.585 328.100<br />
Ojós ................................................. 1.227 1.384 1.173 1.193 888 647 678<br />
Pliego............................................... 2.535 2.691 3.290 3.477 3.528 3.378 3.327<br />
Puerto Lumbreras............................ .. .. .. 7.205 8.046 8.560 9.961<br />
Ricote .............................................. 2.956 2.929 2.928 2.743 2.320 1.774 1.689<br />
San Javier........................................ 5.656 6.652 9.008 9.734 10.286 12.675 14.696<br />
San Pedro <strong>de</strong>l Pinatar...................... 3.380 4.377 5.074 5.449 6.518 8.866 12.057<br />
Santomera ....................................... .. .. .. .. .. 7.346 8.518<br />
Torre-Pacheco................................. 9.255 9.610 10.260 11.005 13.006 15.654 16.568<br />
Torres <strong>de</strong> Cotil<strong>la</strong>s (Las) ................... 3.954 4.806 5.327 6.010 7.259 11.349 14.132<br />
Totana.............................................. 13.842 15.453 14.718 14.424 16.300 18.537 20.466<br />
Ulea ................................................. 1.559 1.619 1.581 1.550 1.461 1.174 1.073<br />
Unión (La)........................................ 12.280 10.604 10.156 11.679 13.227 14.262 13.940<br />
Vil<strong>la</strong>nueva <strong>de</strong>l Río Segura ............... 1.300 1.545 1.547 1.711 1.872 1.738 1.663<br />
Yec<strong>la</strong>................................................ 26.525 22.601 24.294 21.114 20.816 25.307 27.362<br />
Fuente: INE. Censos <strong>de</strong> Pob<strong>la</strong>ción.<br />
Consejería <strong>de</strong> Economía y Hacienda. Centro Regional <strong>de</strong> Estadística. Censo <strong>de</strong> Pob<strong>la</strong>ción <strong>de</strong> 1991 <strong>de</strong> <strong>la</strong> Región <strong>de</strong> Murcia. Resultados Municipales.<br />
Estadísticas Históricas <strong>de</strong> Pob<strong>la</strong>ción <strong>de</strong> <strong>la</strong> Región <strong>de</strong> Murcia.
Censos <strong>de</strong> Pob<strong>la</strong>ción. Datos Municipales.<br />
2.2.2. EVOLUCIÓN DE LA POBLACIÓN DE DERECHO SEGÚN LOS CENSOS OFICIALES. 1877-<br />
1991. HOMBRES. (Continúa)<br />
MUNICIPIOS 1877 1887 1897 (1) 1900 1910 1920<br />
TOTAL.............................................. 225.426 246.198 258.771 292.240 309.286 324.771<br />
Abanil<strong>la</strong>............................................. 2.914 2.829 3.079 3.361 3.778 3.986<br />
Abarán.............................................. 1.656 1.706 1.878 2.018 2.097 2.727<br />
Águi<strong>la</strong>s.............................................. 4.341 4.867 5.950 7.750 7.775 8.494<br />
Albu<strong>de</strong>ite .......................................... 626 648 625 668 767 777<br />
Alcantaril<strong>la</strong>........................................ 1.982 2.237 2.290 2.431 2.777 3.088<br />
Alcázares (Los) ................................ .. .. .. .. .. ..<br />
Aledo ................................................ 679 758 698 491 532 669<br />
Alguazas........................................... 1.063 1.137 1.208 1.305 1.474 1.572<br />
Alhama <strong>de</strong> Murcia ............................ 3.232 3.715 3.922 4.198 4.655 4.836<br />
Archena ............................................ 1.703 1.883 2.247 2.230 2.871 3.070<br />
Beniel ............................................... 691 646 775 800 1.062 1.251<br />
B<strong>la</strong>nca .............................................. 1.488 1.664 1.867 1.952 2.113 2.089<br />
Bul<strong>la</strong>s................................................ 3.214 3.411 3.591 3.913 2.614 4.006<br />
Ca<strong>la</strong>sparra........................................ 2.407 2.547 3.071 3.227 3.724 3.954<br />
Campos <strong>de</strong>l Río................................ 660 619 769 791 861 888<br />
Caravaca <strong>de</strong> <strong>la</strong> Cruz......................... 7.413 7.462 7.313 7.829 8.638 9.322<br />
Cartagena......................................... 40.699 46.045 45.863 54.473 51.610 53.047<br />
Cehegín............................................ 4.793 5.179 5.636 5.817 6.754 6.937<br />
Ceutí................................................. 818 983 1.094 1.176 1.351 1.442<br />
Cieza ................................................ 5.394 5.370 5.737 6.722 7.069 7.859<br />
Fortuna ............................................. 2.914 2.850 2.707 3.110 3.266 3.016<br />
Fuente Á<strong>la</strong>mo ................................... 4.105 4.594 4.853 5.077 5.505 5.715<br />
Jumil<strong>la</strong> .............................................. 6.820 7.093 7.875 8.069 8.796 10.104<br />
Libril<strong>la</strong>............................................... 1.272 1.342 1.524 1.536 1.745 1.597<br />
Lorca ................................................ 26.209 28.765 29.260 34.754 36.471 37.873<br />
Lorquí ............................................... 643 653 708 711 864 1.123<br />
Mazarrón .......................................... 5.521 7.238 8.511 11.782 11.529 9.134<br />
Molina <strong>de</strong> Segura ............................. 3.409 3.814 4.044 4.289 5.147 5.399<br />
Moratal<strong>la</strong>........................................... 5.615 6.147 6.279 6.685 6.961 6.882<br />
Mu<strong>la</strong>.................................................. 5.212 5.384 5.013 6.394 6.511 6.191<br />
Murcia............................................... 43.747 48.147 52.371 54.690 61.175 68.977<br />
Ojós .................................................. 593 588 635 624 676 645<br />
Pliego ............................................... 1.301 1.421 1.437 1.448 1.476 1.343<br />
Puerto Lumbreras............................. .. .. .. .. .. ..<br />
Ricote ............................................... 1.045 1.120 1.189 1.274 1.490 1.383<br />
San Javier ........................................ 1.936 2.091 2.118 2.126 2.444 2.493<br />
San Pedro <strong>de</strong> Pinatar ....................... 998 1.190 1.204 1.280 1.500 1.587<br />
Santomera........................................ .. .. .. .. .. ..<br />
Torre Pacheco.................................. 3.577 4.050 4.305 4.482 5.037 4.794<br />
Torres <strong>de</strong> Cotil<strong>la</strong>s (Las) .................... 1.040 1.084 1.249 1.312 1.484 1.791<br />
Totana .............................................. 4.703 5.417 5.754 6.721 7.052 7.035<br />
Ulea .................................................. 467 462 547 573 687 731<br />
Unión (La)......................................... 10.543 10.077 10.623 14.241 14.835 13.952<br />
Vil<strong>la</strong>nueva <strong>de</strong>l Río Segura................ 435 432 515 487 515 531<br />
Yec<strong>la</strong> ................................................ 7.548 8.533 8.437 9.423 11.598 12.461<br />
(1) Del Censo <strong>de</strong> 1897 sólo se publicaron datos provisionales, ya que el siguiente Censo se realizaría en 1900.<br />
Estadísticas Históricas <strong>de</strong> Pob<strong>la</strong>ción <strong>de</strong> <strong>la</strong> Región <strong>de</strong> Murcia<br />
45
Censos <strong>de</strong> Pob<strong>la</strong>ción. Datos Municipales..<br />
2.2.2. EVOLUCIÓN DE LA POBLACIÓN DE DERECHO SEGÚN LOS CENSOS OFICIALES. 1877-<br />
1991. HOMBRES. (Conclusión)<br />
46<br />
MUNICIPIOS 1930 1940 1950 1960 1970 1981 1991<br />
TOTAL ............................................. 324.570 359.725 367.276 393.093 407.613 469.339 514.527<br />
Abanil<strong>la</strong>............................................ 4.064 4.204 4.147 4.211 4.334 3.524 2.989<br />
Abarán ............................................. 3.314 3.874 4.060 4.277 4.964 5.538 5.879<br />
Águi<strong>la</strong>s............................................. 7.772 7.456 7.487 7.553 8.396 10.251 12.441<br />
Albu<strong>de</strong>ite.......................................... 801 837 867 915 837 821 707<br />
Alcantaril<strong>la</strong> ....................................... 3.773 5.135 6.344 7.656 9.644 11.920 14.628<br />
Alcázares (Los)................................ .. .. .. .. .. .. 1.792<br />
Aledo ............................................... 619 625 667 607 513 535 512<br />
Alguazas.......................................... 1.643 1.993 2.061 2.515 2.395 2.848 3.430<br />
Alhama <strong>de</strong> Murcia............................ 4.979 5.420 5.519 5.808 5.673 6.455 6.986<br />
Archena ........................................... 3.416 4.008 3.728 4.453 4.955 5.916 6.704<br />
Beniel............................................... 1.547 2.049 2.135 2.264 2.495 2.981 3.591<br />
B<strong>la</strong>nca.............................................. 2.449 2.455 2.715 2.952 2.967 3.095 2.815<br />
Bul<strong>la</strong>s............................................... 4.631 4.702 4.971 4.827 4.590 4.848 5.045<br />
Ca<strong>la</strong>sparra ....................................... 4.361 5.232 5.157 4.809 4.102 4.366 4.372<br />
Campos <strong>de</strong>l Río............................... 996 1.003 1.106 1.091 992 1.027 964<br />
Caravaca <strong>de</strong> <strong>la</strong> Cruz........................ 10.619 9.975 10.845 10.428 9.405 10.118 10.551<br />
Cartagena........................................ 53.093 58.132 53.274 59.914 70.439 82.585 82.880<br />
Cehegín ........................................... 7.674 8.816 7.970 8.089 6.334 6.785 6.779<br />
Ceutí ................................................ 1.727 2.013 1.956 2.351 2.720 2.855 3.226<br />
Cieza................................................ 8.597 11.725 11.209 11.019 12.704 14.763 15.067<br />
Fortuna ............................................ 3.198 3.021 2.941 2.829 2.764 2.889 3.029<br />
Fuente-Á<strong>la</strong>mo .................................. 4.527 4.836 4.900 4.747 4.481 4.286 4.120<br />
Jumil<strong>la</strong> ............................................. 10.353 10.718 10.359 10.821 10.072 10.277 9.967<br />
Libril<strong>la</strong> .............................................. 1.477 1.477 1.471 1.510 1.583 1.724 1.835<br />
Lorca................................................ 30.494 33.656 34.753 29.098 29.778 30.467 32.477<br />
Lorquí .............................................. 1.344 1.757 1.574 1.972 2.047 2.497 2.625<br />
Mazarrón.......................................... 7.107 5.802 4.630 4.931 4.540 5.147 7.320<br />
Molina <strong>de</strong> Segura............................. 6.126 6.819 7.196 8.031 11.518 15.532 18.595<br />
Moratal<strong>la</strong>.......................................... 7.086 7.639 7.240 7.336 5.457 4.759 4.545<br />
Mu<strong>la</strong>................................................. 6.668 7.013 7.503 7.424 6.946 7.353 6.489<br />
Murcia.............................................. 78.018 95.780 104.798 120.705 117.955 138.024 159.454<br />
Ojós ................................................. 603 679 569 582 434 307 333<br />
Pliego............................................... 1.234 1.351 1.611 1.740 1.774 1.690 1.689<br />
Puerto Lumbreras............................ .. .. .. 3.487 3.962 4.190 4.844<br />
Ricote .............................................. 1.463 1.450 1.446 1.319 1.100 853 822<br />
San Javier........................................ 2.850 3.226 4.592 4.990 5.090 6.385 7.304<br />
San Pedro <strong>de</strong>l Pinatar...................... 1.655 2.160 2.470 2.665 3.223 4.373 5.965<br />
Santomera ....................................... .. .. .. .. .. 3.710 4.243<br />
Torre-Pacheco................................. 4.722 4.728 5.088 5.496 6.576 7.889 8.338<br />
Torres <strong>de</strong> Cotil<strong>la</strong>s (Las) ................... 1.960 2.339 2.604 2.955 3.553 5.636 7.098<br />
Totana.............................................. 6.815 8.136 7.193 6.986 8.004 9.183 10.160<br />
Ulea ................................................. 777 829 769 772 710 567 542<br />
Unión (La)........................................ 6.020 5.126 4.839 5.788 6.488 6.983 6.932<br />
Vil<strong>la</strong>nueva <strong>de</strong>l Río Segura ............... 614 740 738 829 906 857 838<br />
Yec<strong>la</strong>................................................ 13.384 10.789 11.774 10.341 10.193 12.530 13.605<br />
Fuente: INE. Censos <strong>de</strong> Pob<strong>la</strong>ción.<br />
Consejería <strong>de</strong> Economía y Hacienda. Centro Regional <strong>de</strong> Estadística. Censo <strong>de</strong> Pob<strong>la</strong>ción <strong>de</strong> 1991 <strong>de</strong> <strong>la</strong> Región <strong>de</strong> Murcia. Resultados Municipales.<br />
Estadísticas Históricas <strong>de</strong> Pob<strong>la</strong>ción <strong>de</strong> <strong>la</strong> Región <strong>de</strong> Murcia.
Censos <strong>de</strong> Pob<strong>la</strong>ción. Datos Municipales.<br />
2.2.3. EVOLUCIÓN DE LA POBLACIÓN DE DERECHO SEGÚN LOS CENSOS OFICIALES. 1877-<br />
1991. MUJERES. (Continúa)<br />
MUNICIPIOS 1877 1887 1897 (1) 1900 1910 1920<br />
TOTAL.............................................. 226.656 243.572 260.378 289.215 311.640 329.665<br />
Abanil<strong>la</strong>............................................. 2.952 2.911 3.052 3.362 3.857 4.110<br />
Abarán.............................................. 1.692 1.772 1.815 1.907 2.064 2.666<br />
Águi<strong>la</strong>s.............................................. 4.567 5.016 6.381 8.003 8.262 8.821<br />
Albu<strong>de</strong>ite .......................................... 619 636 635 671 793 827<br />
Alcantaril<strong>la</strong>........................................ 2.190 2.385 2.523 2.555 2.975 3.311<br />
Alcázares (Los) ................................ .. .. .. .. .. ..<br />
Aledo ................................................ 713 722 684 482 426 666<br />
Alguazas........................................... 1.157 1.139 1.211 1.274 1.436 1.597<br />
Alhama <strong>de</strong> Murcia ............................ 3.294 3.641 3.981 4.212 4.552 4.907<br />
Archena ............................................ 1.795 1.878 2.265 2.280 2.956 3.168<br />
Beniel ............................................... 710 638 760 817 1.049 1.246<br />
B<strong>la</strong>nca .............................................. 1.573 1.801 2.029 2.072 2.239 2.301<br />
Bul<strong>la</strong>s................................................ 3.094 3.287 3.545 3.791 2.407 3.968<br />
Ca<strong>la</strong>sparra........................................ 2.389 2.553 3.125 3.201 3.740 3.897<br />
Campos <strong>de</strong>l Río................................ 715 628 736 726 829 855<br />
Caravaca <strong>de</strong> <strong>la</strong> Cruz......................... 7.489 7.530 7.651 7.975 8.882 9.532<br />
Cartagena......................................... 35.202 39.959 40.561 48.900 50.909 48.566<br />
Cehegín............................................ 5.014 5.210 5.729 5.706 6.657 6.864<br />
Ceutí................................................. 845 972 1.069 1.127 1.291 1.449<br />
Cieza ................................................ 5.476 5.522 5.980 6.868 7.268 8.167<br />
Fortuna ............................................. 3.176 3.098 2.944 3.442 3.504 3.290<br />
Fuente Á<strong>la</strong>mo ................................... 4.055 4.570 4.725 4.887 5.412 5.790<br />
Jumil<strong>la</strong> .............................................. 6.799 6.971 7.758 7.799 8.717 10.236<br />
Libril<strong>la</strong>............................................... 1.295 1.391 1.536 1.540 1.753 1.587<br />
Lorca ................................................ 26.848 29.474 30.546 35.156 36.324 37.929<br />
Lorquí ............................................... 659 675 712 728 913 1.152<br />
Mazarrón .......................................... 5.501 7.132 8.511 11.580 11.349 9.072<br />
Molina <strong>de</strong> Segura ............................. 3.392 3.844 4.228 4.365 5.347 5.683<br />
Moratal<strong>la</strong>........................................... 5.610 5.805 5.569 6.131 6.536 6.595<br />
Mu<strong>la</strong>.................................................. 5.389 5.351 5.285 6.339 6.367 6.216<br />
Murcia............................................... 47.762 50.360 56.105 57.003 64.068 73.503<br />
Ojós .................................................. 598 606 645 642 698 663<br />
Pliego ............................................... 1.285 1.396 1.483 1.465 1.531 1.363<br />
Puerto Lumbreras............................. .. .. .. .. .. ..<br />
Ricote ............................................... 1.052 1.180 1.314 1.330 1.532 1.436<br />
San Javier ........................................ 1.838 2.104 2.158 2.200 2.496 2.533<br />
San Pedro <strong>de</strong> Pinatar ....................... 1.008 1.156 1.286 1.357 1.576 1.689<br />
Santomera........................................ .. .. .. .. .. ..<br />
Torre Pacheco.................................. 3.575 4.125 4.364 4.376 4.745 4.606<br />
Torres <strong>de</strong> Cotil<strong>la</strong>s (Las) .................... 1.023 1.109 1.275 1.304 1.480 1.766<br />
Totana .............................................. 4.945 5.638 5.887 6.993 7.183 7.176<br />
Ulea .................................................. 476 487 580 621 733 750<br />
Unión (La)......................................... 10.789 10.019 10.637 14.238 14.764 16.064<br />
Vil<strong>la</strong>nueva <strong>de</strong>l Río Segura................ 460 463 528 496 572 623<br />
Yec<strong>la</strong> ................................................ 7.635 8.418 8.570 9.294 11.448 13.025<br />
(1) Del Censo <strong>de</strong> 1897 sólo se publicaron datos provisionales, ya que el siguiente Censo se realizaría en 1900.<br />
Estadísticas Históricas <strong>de</strong> Pob<strong>la</strong>ción <strong>de</strong> <strong>la</strong> Región <strong>de</strong> Murcia<br />
47
Censos <strong>de</strong> Pob<strong>la</strong>ción. Datos Municipales..<br />
2.2.3. EVOLUCIÓN DE LA POBLACIÓN DE DERECHO SEGÚN LOS CENSOS OFICIALES. 1877-<br />
1991. MUJERES. (Conclusión)<br />
48<br />
MUNICIPIOS 1930 1940 1950 1960 1970 1981 1991<br />
TOTAL ............................................. 327.409 371.496 388.574 409.993 424.434 486.148 531.074<br />
Abanil<strong>la</strong>............................................ 4.388 4.565 4.499 4.470 4.406 3.622 3.085<br />
Abarán ............................................. 3.333 4.106 4.401 4.601 5.236 5.645 5.986<br />
Águi<strong>la</strong>s............................................. 8.131 8.010 7.940 7.982 8.791 10.558 12.453<br />
Albu<strong>de</strong>ite.......................................... 839 900 852 916 864 837 704<br />
Alcantaril<strong>la</strong> ....................................... 4.106 5.831 6.950 8.303 10.426 12.697 15.516<br />
Alcázares (Los)................................ .. .. .. .. .. .. 1.891<br />
Aledo ............................................... 614 672 717 630 554 546 473<br />
Alguazas.......................................... 1.706 2.070 2.165 2.564 2.491 2.934 3.501<br />
Alhama <strong>de</strong> Murcia............................ 5.063 5.663 5.825 5.978 5.927 6.677 7.189<br />
Archena ........................................... 3.655 4.261 3.880 4.482 5.155 6.028 6.783<br />
Beniel............................................... 1.511 2.134 2.246 2.308 2.546 3.062 3.629<br />
B<strong>la</strong>nca.............................................. 2.649 2.654 2.968 3.204 3.206 3.391 2.953<br />
Bul<strong>la</strong>s............................................... 4.551 4.661 4.912 4.767 4.542 4.818 4.964<br />
Ca<strong>la</strong>sparra ....................................... 4.312 5.395 5.259 4.898 4.255 4.312 4.373<br />
Campos <strong>de</strong>l Río............................... 946 968 1.168 1.131 1.029 1.019 985<br />
Caravaca <strong>de</strong> <strong>la</strong> Cruz........................ 10.941 10.575 10.907 10.515 9.377 10.337 10.745<br />
Cartagena........................................ 49.612 57.336 57.705 62.473 73.027 85.351 85.143<br />
Cehegín ........................................... 7.584 8.868 7.863 8.020 6.388 6.863 6.835<br />
Ceutí ................................................ 1.777 2.114 1.977 2.298 2.676 2.809 3.185<br />
Cieza................................................ 9.070 12.141 12.224 11.600 13.385 15.564 15.808<br />
Fortuna ............................................ 3.483 3.227 3.023 2.878 2.848 2.903 2.975<br />
Fuente-Á<strong>la</strong>mo .................................. 4.546 4.761 4.973 4.849 4.496 4.252 4.159<br />
Jumil<strong>la</strong> ............................................. 10.211 10.864 10.629 11.026 10.196 10.386 10.125<br />
Libril<strong>la</strong> .............................................. 1.504 1.572 1.561 1.569 1.611 1.792 1.929<br />
Lorca................................................ 30.898 35.861 36.516 30.218 30.508 31.412 33.442<br />
Lorquí .............................................. 1.390 1.843 1.646 2.094 2.153 2.552 2.703<br />
Mazarrón.......................................... 7.013 6.126 4.871 5.067 4.651 5.123 7.271<br />
Molina <strong>de</strong> Segura............................. 6.248 7.068 7.665 8.384 12.061 15.983 19.211<br />
Moratal<strong>la</strong>.......................................... 6.729 7.374 6.896 6.869 5.207 4.615 4.431<br />
Mu<strong>la</strong>................................................. 6.420 7.280 7.537 7.489 7.176 7.385 6.564<br />
Murcia.............................................. 81.807 99.878 113.136 129.066 125.732 146.561 168.646<br />
Ojós ................................................. 624 705 604 611 454 340 345<br />
Pliego............................................... 1.301 1.340 1.679 1.737 1.754 1.688 1.638<br />
Puerto Lumbreras............................ .. .. .. 3.718 4.084 4.370 5.117<br />
Ricote .............................................. 1.493 1.479 1.482 1.424 1.220 921 867<br />
San Javier........................................ 2.806 3.426 4.416 4.744 5.196 6.290 7.392<br />
San Pedro <strong>de</strong>l Pinatar...................... 1.725 2.217 2.604 2.784 3.295 4.493 6.092<br />
Santomera ....................................... .. .. .. .. .. 3.636 4.275<br />
Torre-Pacheco................................. 4.533 4.882 5.172 5.509 6.430 7.765 8.230<br />
Torres <strong>de</strong> Cotil<strong>la</strong>s (Las) ................... 1.994 2.467 2.723 3.055 3.706 5.713 7.034<br />
Totana.............................................. 7.027 7.317 7.525 7.438 8.296 9.354 10.306<br />
Ulea ................................................. 782 790 812 778 751 607 531<br />
Unión (La)........................................ 6.260 5.478 5.317 5.891 6.739 7.279 7.008<br />
Vil<strong>la</strong>nueva <strong>de</strong>l Río Segura ............... 686 805 809 882 966 881 825<br />
Yec<strong>la</strong>................................................ 13.141 11.812 12.520 10.773 10.623 12.777 13.757<br />
Fuente: INE. Censos <strong>de</strong> Pob<strong>la</strong>ción.<br />
Consejería <strong>de</strong> Economía y Hacienda. Centro Regional <strong>de</strong> Estadística. Censo <strong>de</strong> Pob<strong>la</strong>ción <strong>de</strong> 1991 <strong>de</strong> <strong>la</strong> Región <strong>de</strong> Murcia. Resultados Municipales.<br />
Estadísticas Históricas <strong>de</strong> Pob<strong>la</strong>ción <strong>de</strong> <strong>la</strong> Región <strong>de</strong> Murcia.
Censos <strong>de</strong> Pob<strong>la</strong>ción. Datos Municipales.<br />
2.3.1. EVOLUCIÓN DE LA POBLACIÓN DE DERECHO SEGÚN RECTIFICACIONES DEL PADRÓN<br />
MUNICIPAL DE HABITANTES. 1940-1995. AMBOS SEXOS. (Continúa)<br />
MUNICIPIOS 1940 (1) 1941 1942 1943 1944 1945 1946 1947<br />
TOTAL............................................... 731.221 738.142 745.193 747.345 755.939 740.258 751.566 762.070<br />
Abanil<strong>la</strong>.............................................. 8.769 8.778 8.574 8.548 8.570 8.485 8.521 8.608<br />
Abarán............................................... 7.980 7.994 8.035 8.085 8.111 7.889 8.013 8.208<br />
Agui<strong>la</strong>s............................................... 15.466 15.458 15.484 15.526 15.617 15.597 15.844 16.023<br />
Albu<strong>de</strong>ite ........................................... 1.737 1.717 1.716 1.728 1.731 1.671 1.671 1.708<br />
Alcantaril<strong>la</strong>......................................... 10.966 11.073 11.173 11.269 11.425 12.196 12.202 12.414<br />
Alcázares (Los) ................................. .. .. .. .. .. .. .. ..<br />
Aledo ................................................. 1.297 1.331 1.358 1.302 1.323 1.252 1.299 1.326<br />
Alguazas............................................ 4.063 4.089 4.137 4.209 4.284 4.259 4.307 4.351<br />
Alhama <strong>de</strong> Murcia ............................. 11.083 11.112 11.603 11.646 11.688 10.964 10.999 11.124<br />
Archena ............................................. 8.269 8.305 8.316 8.366 8.515 8.354 8.485 7.982<br />
Beniel ................................................ 4.183 4.162 4.140 4.152 4.211 4.226 4.267 4.313<br />
B<strong>la</strong>nca ............................................... 5.109 5.149 5.229 5.203 5.292 5.355 5.409 5.453<br />
Bul<strong>la</strong>s................................................. 9.363 9.492 9.686 9.809 9.957 9.775 9.808 9.838<br />
Ca<strong>la</strong>sparra......................................... 10.627 10.287 10.351 10.243 10.358 10.322 10.616 10.801<br />
Campos <strong>de</strong>l Río................................. 1.971 1.975 1.976 1.997 2.019 2.134 2.156 2.172<br />
Caravaca <strong>de</strong> <strong>la</strong> Cruz.......................... 20.550 20.645 21.151 21.127 21.253 21.992 23.389 22.717<br />
Cartagena.......................................... 115.468 115.590 115.672 115.820 117.015 114.647 116.112 117.093<br />
Cehegín............................................. 17.684 18.073 18.278 18.210 19.395 16.315 16.646 16.889<br />
Ceutí.................................................. 4.127 4.197 4.216 4.166 4.248 4.098 4.187 4.272<br />
Cieza ................................................. 23.866 23.991 23.834 24.265 24.257 23.042 24.183 24.543<br />
Fortuna .............................................. 6.248 6.555 6.533 6.643 6.762 6.277 6.424 6.545<br />
Fuente Á<strong>la</strong>mo .................................... 9.597 9.777 9.794 9.935 10.027 9.504 9.685 9.844<br />
Jumil<strong>la</strong> ............................................... 21.582 21.811 22.011 22.253 22.450 21.145 21.510 21.813<br />
Libril<strong>la</strong>................................................ 3.049 3.143 3.070 3.148 3.157 2.802 2.798 2.887<br />
Lorca ................................................. 69.517 69.517 70.101 69.491 69.850 72.219 73.215 74.518<br />
Lorquí ................................................ 3.600 3.596 3.598 3.629 3.673 3.644 3.666 3.693<br />
Mazarrón ........................................... 11.928 11.635 11.562 11.371 10.924 9.101 9.212 9.238<br />
Molina <strong>de</strong> Segura .............................. 13.887 4.038 14.145 14.322 14.524 14.654 14.827 15.024<br />
Moratal<strong>la</strong>............................................ 15.013 15.154 15.258 15.348 15.547 15.384 15.607 15.840<br />
Mu<strong>la</strong>................................................... 14.293 14.729 14.878 14.853 15.337 13.684 13.837 14.245<br />
Murcia................................................ 195.658 200.361 203.869 205.003 207.563 202.301 204.739 209.557<br />
Ojós ................................................... 1.384 1.367 1.363 1.262 1.267 1.274 1.183 1.188<br />
Pliego ................................................ 2.691 2.721 2.762 2.812 2.915 2.856 2.922 3.009<br />
Puerto Lumbreras.............................. .. .. .. .. .. .. .. ..<br />
Ricote ................................................ 2.929 2.975 2.975 3.020 3.056 2.925 2.950 2.975<br />
San Javier ......................................... 6.652 6.722 6.763 6.791 7.155 7.955 8.225 8.289<br />
San Pedro <strong>de</strong> Pinatar ........................ 4.377 4.434 4.518 4.637 4.729 4.617 4.754 4.855<br />
Santomera......................................... .. .. .. .. .. .. .. ..<br />
Torre Pacheco................................... 9.610 9.682 9.756 9.924 10.051 9.799 9.919 10.086<br />
Torres <strong>de</strong> Cotil<strong>la</strong>s (Las) ..................... 4.806 4.830 4.851 4.918 5.039 5.048 5.193 5.316<br />
Totana ............................................... 15.453 15.280 15.844 15.491 15.560 15.701 15.720 15.729<br />
Ulea ................................................... 1.619 1.627 1.641 1.665 1.692 1.654 1.635 1.640<br />
Union (La).......................................... 10.604 10.635 10.620 10.617 10.692 10.494 10.636 10.760<br />
Vil<strong>la</strong>nueva <strong>de</strong>l Río Segura................. 1.545 1.530 1.529 1.514 1.528 1.495 1.506 1.604<br />
Yec<strong>la</strong> ................................................. 22.601 22.605 22.823 23.027 23.172 23.152 23.289 23.580<br />
Estadísticas Históricas <strong>de</strong> Pob<strong>la</strong>ción <strong>de</strong> <strong>la</strong> Región <strong>de</strong> Murcia<br />
49
Censos <strong>de</strong> Pob<strong>la</strong>ción. Datos Municipales..<br />
2.3.1. EVOLUCIÓN DE LA POBLACIÓN DE DERECHO SEGÚN RECTIFICACIONES DEL PADRÓN<br />
MUNICIPAL DE HABITANTES. 1940-1995. AMBOS SEXOS. (Continúa)<br />
50<br />
MUNICIPIOS 1948 1949 1950 (1) 1951 1952 1953 1954 1955<br />
TOTAL ............................................... 778.514 790.994 755.850 771.138 779.679 788.970 797.418 784.825<br />
Abanil<strong>la</strong>.............................................. 8.658 8.753 8.646 8.699 8.779 8.794 8.875 8.806<br />
Abarán ............................................... 8.486 8.650 8.461 8.538 8.657 8.800 8.898 8.631<br />
Agui<strong>la</strong>s............................................... 16.108 16.339 15.427 15.776 15.950 16.244 16.498 15.554<br />
Albu<strong>de</strong>ite............................................ 1.724 1.774 1.719 1.768 1.814 1.843 1.888 1.755<br />
Alcantaril<strong>la</strong> ......................................... 12.682 12.775 13.294 13.272 13.407 13.434 13.469 15.179<br />
Alcázares (Los).................................. .. .. .. .. .. .. .. ..<br />
Aledo ................................................. 1.346 1.368 1.384 1.388 1.406 1.403 1.418 1.359<br />
Alguazas............................................ 4.393 4.413 4.226 4.255 4.499 4.545 4.604 4.333<br />
Alhama <strong>de</strong> Murcia.............................. 11.335 11.431 11.344 11.587 11.701 11.844 11.958 11.713<br />
Archena ............................................. 7.975 7.915 7.608 7.684 7.845 7.950 8.014 7.999<br />
Beniel................................................. 4.367 4.374 4.381 7.388 4.400 4.431 4.504 4.507<br />
B<strong>la</strong>nca................................................ 5.540 5.618 5.683 5.754 5.833 5.906 5.991 5.948<br />
Bul<strong>la</strong>s................................................. 9.897 10.222 9.883 10.006 10.068 10.239 10.333 9.331<br />
Ca<strong>la</strong>sparra ......................................... 11.347 11.296 10.416 10.507 10.750 10.985 11.140 10.634<br />
Campos <strong>de</strong>l Río................................. 2.207 2.257 2.274 2.268 2.305 2.314 2.352 2.318<br />
Caravaca <strong>de</strong> <strong>la</strong> Cruz.......................... 23.012 24.138 21.752 22.138 22.747 22.911 22.956 21.154<br />
Cartagena.......................................... 118.873 120.030 110.979 112.371 113.400 115.260 116.601 116.477<br />
Cehegín ............................................. 17.202 17.209 15.833 15.998 16.206 16.518 16.625 15.565<br />
Ceutí .................................................. 4.387 4.431 3.933 3.975 4.054 4.140 4.235 4.090<br />
Cieza.................................................. 25.647 26.151 23.433 23.778 24.162 24.577 24.908 23.344<br />
Fortuna .............................................. 6.699 6.794 5.964 6.111 6.191 6.303 6.422 6.029<br />
Fuente Á<strong>la</strong>mo .................................... 9.831 9.899 9.873 9.960 9.990 10.072 10.080 9.468<br />
Jumil<strong>la</strong> ............................................... 22.082 22.224 20.988 21.303 21.509 21.638 21.820 22.443<br />
Libril<strong>la</strong> ................................................ 2.939 2.905 3.032 3.044 3.078 3.135 3.168 3.108<br />
Lorca.................................................. 76.981 78.300 71.269 72.416 73.197 73.326 72.955 68.491<br />
Lorquí ................................................ 3.741 3.746 3.220 3.237 3.281 3.347 3.401 3.461<br />
Mazarrón............................................ 9.285 9.434 9.501 9.661 9.957 10.124 10.168 9.556<br />
Molina <strong>de</strong> Segura............................... 15.252 15.454 14.861 14.959 15.070 15.154 15.320 15.110<br />
Moratal<strong>la</strong>............................................ 16.024 16.208 14.136 14.386 14.659 14.891 15.089 14.377<br />
Mu<strong>la</strong>................................................... 14.573 14.953 15.040 15.278 15.453 15.567 15.714 15.153<br />
Murcia................................................ 215.735 220.663 217.934 223.546 228.100 231.128 234.657 238.176<br />
Ojós ................................................... 1.201 1.192 1.173 1.175 1.186 1.205 1.228 1.198<br />
Pliego................................................. 3.054 3.106 3.290 3.343 3.401 3.408 3.442 3.218<br />
Puerto Lumbreras.............................. .. .. .. .. .. .. .. ..<br />
Ricote ................................................ 2.994 3.057 2.928 2.959 2.991 3.042 3.061 2.876<br />
San Javier.......................................... 8.550 8.713 9.008 9.176 9.223 9.385 9.502 8.890<br />
San Pedro <strong>de</strong> Pinatar ........................ 4.972 5.033 5.074 5.129 5.243 5.162 5.161 5.187<br />
Santomera ......................................... .. .. .. .. .. .. .. ..<br />
Torre Pacheco ................................... 10.273 10.375 10.260 10.362 10.490 10.564 10.593 10.417<br />
Torres <strong>de</strong> Cotil<strong>la</strong>s (Las) ..................... 5.378 5.356 5.327 5.390 5.470 5.490 5.572 5.467<br />
Totana................................................ 15.844 15.896 14.718 14.737 14.925 15.033 15.041 14.476<br />
Ulea ................................................... 1.674 1.687 1.581 1.579 1.616 1.655 1.693 1.621<br />
Union (La).......................................... 10.870 10.962 10.156 10.335 10.501 10.848 11.376 10.591<br />
Vil<strong>la</strong>nueva <strong>de</strong>l Río Segura ................. 1.635 1.656 1.547 1.568 1.586 1.607 1.627 1.672<br />
Yec<strong>la</strong>.................................................. 23.741 24.237 24.294 24.334 24.579 24.748 25.061 25.143<br />
Estadísticas Históricas <strong>de</strong> Pob<strong>la</strong>ción <strong>de</strong> <strong>la</strong> Región <strong>de</strong> Murcia.
Censos <strong>de</strong> Pob<strong>la</strong>ción. Datos Municipales.<br />
2.3.1. EVOLUCIÓN DE LA POBLACIÓN DE DERECHO SEGÚN RECTIFICACIONES DEL PADRÓN<br />
MUNICIPAL DE HABITANTES. 1940-1995. AMBOS SEXOS. (Continúa)<br />
MUNICIPIOS 1956 1957 1958 1959 1960 (1) 1961 1962 1963<br />
TOTAL............................................... 793.594 803.716 816.071 826.056 803.086 815.103 827.547 838.858<br />
Abanil<strong>la</strong>.............................................. 8.850 8.905 8.937 8.971 8.681 8.730 8.715 8.745<br />
Abarán............................................... 8.750 8.845 9.016 9.214 8.878 9.118 9.338 10.086<br />
Agui<strong>la</strong>s............................................... 15.695 16.134 16.578 16.695 15.535 15.865 16.124 16.483<br />
Albu<strong>de</strong>ite ........................................... 1.787 1.837 1.884 1.912 1.831 1.868 1.909 1.960<br />
Alcantaril<strong>la</strong>......................................... 15.408 15.465 15.653 15.912 15.959 15.945 16.208 16.476<br />
Alcázares (Los) ................................. .. .. .. .. .. .. .. ..<br />
Aledo ................................................. 1.382 1.380 1.361 1.434 1.237 1.250 1.261 1.303<br />
Alguazas............................................ 4.369 4.406 4.466 4.544 5.079 5.139 5.149 5.212<br />
Alhama <strong>de</strong> Murcia ............................. 11.971 11.995 12.101 12.211 11.786 11.940 12.048 12.163<br />
Archena ............................................. 8.282 8.391 8.587 8.780 8.935 9.102 9.241 9.365<br />
Beniel ................................................ 4.516 4.556 4.613 4.660 4.572 4.654 4.707 4.776<br />
B<strong>la</strong>nca ............................................... 6.020 6.087 6.168 6.228 6.156 6.229 6.231 6.277<br />
Bul<strong>la</strong>s................................................. 9.503 9.667 9.888 10.012 9.594 9.777 9.884 10.076<br />
Ca<strong>la</strong>sparra......................................... 10.774 11.012 11.282 11.419 9.707 9.924 10.056 10.267<br />
Campos <strong>de</strong>l Río................................. 2.337 2.376 2.417 2.446 2.222 2.264 2.258 2.287<br />
Caravaca <strong>de</strong> <strong>la</strong> Cruz.......................... 21.306 21.483 21.966 22.440 20.943 21.164 21.753 21.815<br />
Cartagena.......................................... 118.203 120.004 122.415 123.316 122.387 124.611 127.272 129.652<br />
Cehegín............................................. 15.713 15.789 16.512 16.680 16.109 16.393 16.583 16.647<br />
Ceutí.................................................. 4.166 4.254 4.353 4.442 4.649 4.717 4.765 4.787<br />
Cieza ................................................. 23.683 24.145 24.620 25.073 22.619 22.989 23.829 24.361<br />
Fortuna .............................................. 6.113 6.228 6.329 6.373 5.707 5.827 5.891 5.949<br />
Fuente Á<strong>la</strong>mo .................................... 9.550 9.622 9.694 9.785 9.596 9.691 9.704 9.816<br />
Jumil<strong>la</strong> ............................................... 22.696 22.380 23.066 23.449 21.847 22.249 22.737 23.056<br />
Libril<strong>la</strong>................................................ 3.143 3.178 3.211 3.248 3.079 3.125 3.158 3.190<br />
Lorca ................................................. 69.429 70.472 63.899 63.970 59.316 60.622 61.672 62.830<br />
Lorquí ................................................ 3.525 3.578 3.616 3.710 4.066 4.152 4.213 4.271<br />
Mazarrón ........................................... 9.770 9.857 9.891 9.949 9.998 10.032 9.965 10.029<br />
Molina <strong>de</strong> Segura .............................. 15.221 15.477 15.772 16.102 16.415 16.687 16.993 17.294<br />
Moratal<strong>la</strong>............................................ 14.527 14.644 14.849 14.913 14.205 14.210 14.276 14.257<br />
Mu<strong>la</strong>................................................... 15.314 15.496 15.700 15.969 14.913 15.110 15.264 15.467<br />
Murcia................................................ 239.686 242.823 245.058 247.631 249.771 253.132 256.337 258.327<br />
Ojós ................................................... 1.207 1.240 1.260 1.287 1.193 1.204 1.205 1.242<br />
Pliego ................................................ 3.248 3.282 3.321 3.343 3.477 3.537 3.596 3.659<br />
Puerto Lumbreras.............................. .. .. 7.857 7.933 7.205 7.291 7.375 7.525<br />
Ricote ................................................ 2.908 2.929 2.926 2.926 2.743 2.779 2.801 2.803<br />
San Javier ......................................... 9.083 9.257 9.391 9.566 9.734 9.868 10.044 10.129<br />
San Pedro <strong>de</strong> Pinatar ........................ 5.242 5.341 5.497 5.596 5.449 5.549 5.633 5.764<br />
Santomera......................................... .. .. .. .. .. .. .. ..<br />
Torre Pacheco................................... 10.530 10.671 10.850 11.000 11.005 11.128 11.306 11.444<br />
Torres <strong>de</strong> Cotil<strong>la</strong>s (Las) ..................... 5.561 5.638 5.691 5.793 6.010 6.117 6.211 6.346<br />
Totana ............................................... 14.703 14.874 15.037 15.228 14.424 14.580 14.739 14.882<br />
Ulea ................................................... 1.638 1.676 1.688 1.696 1.550 1.554 1.555 1.589<br />
Union (La).......................................... 11.026 11.333 11.422 12.789 11.679 11.924 12.306 12.690<br />
Vil<strong>la</strong>nueva <strong>de</strong>l Río Segura................. 1.683 1.690 1.723 1.737 1.711 1.720 1.732 1.751<br />
Yec<strong>la</strong> ................................................. 25.076 25.299 25.506 25.674 21.114 21.336 21.503 21.810<br />
Estadísticas Históricas <strong>de</strong> Pob<strong>la</strong>ción <strong>de</strong> <strong>la</strong> Región <strong>de</strong> Murcia<br />
51
Censos <strong>de</strong> Pob<strong>la</strong>ción. Datos Municipales..<br />
2.3.1. EVOLUCIÓN DE LA POBLACIÓN DE DERECHO SEGÚN RECTIFICACIONES DEL PADRÓN<br />
MUNICIPAL DE HABITANTES. 1940-1995. AMBOS SEXOS. (Continúa)<br />
52<br />
MUNICIPIOS 1964 1965 1966 1967 1968 1969 1970 (1) 1971<br />
TOTAL ............................................... 843.580 808.355 839.690 851.330 864.640 879.779 832.047 845.198<br />
Abanil<strong>la</strong>.............................................. 8.718 8.820 8.846 8.907 8.906 8.926 8.740 8.743<br />
Abarán ............................................... 10.234 9.658 10.252 10.412 10.558 10.769 10.200 10.404<br />
Agui<strong>la</strong>s............................................... 16.811 16.349 17.088 17.352 17.372 17.645 17.187 17.453<br />
Albu<strong>de</strong>ite............................................ 2.008 1.744 1.766 1.781 1.748 1.769 1.701 1.716<br />
Alcantaril<strong>la</strong> ......................................... 16.739 16.481 17.643 17.957 18.378 18.673 20.070 20.468<br />
Alcázares (Los).................................. .. .. .. .. .. .. .. ..<br />
Aledo ................................................. 1.312 1.208 1.212 1.236 1.229 1.240 1.067 1.074<br />
Alguazas............................................ 5.297 4.828 4.886 4.927 4.963 5.010 4.886 4.929<br />
Alhama <strong>de</strong> Murcia.............................. 12.379 11.800 12.027 12.173 12.303 12.463 11.600 11.752<br />
Archena ............................................. 9.478 9.438 9.852 9.994 10.154 10.388 10.110 10.263<br />
Beniel................................................. 4.835 4.543 4.647 4.717 4.829 4.940 5.041 5.104<br />
B<strong>la</strong>nca................................................ 6.363 6.021 6.120 6.217 6.293 6.362 6.173 6.245<br />
Bul<strong>la</strong>s................................................. 10.241 8.866 9.266 9.362 9.512 9.609 9.132 9.226<br />
Ca<strong>la</strong>sparra ......................................... 10.454 8.333 8.561 8.734 8.898 9.058 8.357 8.420<br />
Campos <strong>de</strong>l Río................................. 2.316 2.044 2.043 2.067 2.096 2.124 2.021 2.039<br />
Caravaca <strong>de</strong> <strong>la</strong> Cruz.......................... 21.711 18.261 19.985 20.196 20.542 20.888 18.782 20.257<br />
Cartagena.......................................... 130.536 127.253 132.978 136.473 139.672 142.852 143.466 145.843<br />
Cehegín ............................................. 16.478 13.148 14.615 14.713 14.816 14.804 12.722 12.792<br />
Ceutí .................................................. 4.862 5.028 5.140 5.231 5.334 5.412 5.396 5.503<br />
Cieza.................................................. 24.946 23.084 25.778 26.568 26.924 27.396 26.089 26.431<br />
Fortuna .............................................. 6.029 5.568 5.710 5.810 5.907 5.968 5.612 5.662<br />
Fuente Á<strong>la</strong>mo .................................... 9.880 9.064 9.293 9.492 9.579 9.621 8.977 9.062<br />
Jumil<strong>la</strong> ............................................... 23.033 20.430 20.677 20.617 20.691 20.758 20.268 20.330<br />
Libril<strong>la</strong> ................................................ 3.273 3.065 3.161 3.210 3.266 3.309 3.194 3.227<br />
Lorca.................................................. 63.526 58.792 61.790 62.702 63.686 64.712 60.286 61.458<br />
Lorquí ................................................ 4.372 4.089 4.128 4.159 4.243 4.292 4.200 4.252<br />
Mazarrón............................................ 10.105 8.357 9.295 9.409 9.434 9.462 9.191 9.251<br />
Molina <strong>de</strong> Segura............................... 17.677 19.039 21.034 22.120 22.959 23.825 23.579 23.909<br />
Moratal<strong>la</strong>............................................ 14.507 12.025 12.806 12.668 12.619 12.606 10.664 10.716<br />
Mu<strong>la</strong>................................................... 15.607 14.969 15.240 15.358 15.571 15.755 14.122 14.143<br />
Murcia................................................ 256.933 257.824 261.515 263.431 268.432 272.982 243.687 247.871<br />
Ojós ................................................... 1.258 1.045 1.052 1.061 1.061 1.046 888 885<br />
Pliego................................................. 3.633 3.286 3.386 3.437 3.482 3.554 3.528 3.557<br />
Puerto Lumbreras.............................. 7.710 6.787 6.863 6.935 7.044 7.117 8.046 8.104<br />
Ricote ................................................ 2.791 2.522 2.563 2.542 2.542 2.543 2.320 2.323<br />
San Javier.......................................... 10.220 9.877 10.146 10.064 10.230 10.394 10.286 10.559<br />
San Pedro <strong>de</strong> Pinatar ........................ 5.931 5.888 6.359 6.479 6.572 6.737 6.518 6.637<br />
Santomera ......................................... .. .. .. .. .. .. .. ..<br />
Torre Pacheco ................................... 11.551 11.731 12.140 12.412 12.796 13.086 13.006 13.212<br />
Torres <strong>de</strong> Cotil<strong>la</strong>s (Las) ..................... 6.456 6.471 6.620 6.721 6.836 6.972 7.259 7.365<br />
Totana................................................ 15.011 14.335 15.547 15.669 14.808 15.914 16.300 16.418<br />
Ulea ................................................... 1.588 1.548 1.541 1.562 1.594 1.609 1.461 1.468<br />
Union (La).......................................... 12.779 12.782 13.081 13.026 13.106 13.143 13.227 13.239<br />
Vil<strong>la</strong>nueva <strong>de</strong>l Río Segura ................. 1.792 1.866 1.894 1.897 1.902 1.910 1.872 1.890<br />
Yec<strong>la</strong>.................................................. 22.200 20.088 21.144 21.532 21.753 22.136 20.816 20.998<br />
Estadísticas Históricas <strong>de</strong> Pob<strong>la</strong>ción <strong>de</strong> <strong>la</strong> Región <strong>de</strong> Murcia.
Censos <strong>de</strong> Pob<strong>la</strong>ción. Datos Municipales.<br />
2.3.1. EVOLUCIÓN DE LA POBLACIÓN DE DERECHO SEGÚN RECTIFICACIONES DEL PADRÓN<br />
MUNICIPAL DE HABITANTES. 1940-1995. AMBOS SEXOS. (Continúa)<br />
MUNICIPIOS 1972 1973 1974 1975 1976 1977 1978 1979<br />
TOTAL............................................... 861.481 875.114 889.321 881.340 911.824 938.815 957.010 972.344<br />
Abanil<strong>la</strong>.............................................. 8.636 8.630 8.619 8.753 8.816 8.906 8.954 8.927<br />
Abarán............................................... 10.553 10.754 10.989 10.640 10.990 11.156 11.338 11.455<br />
Agui<strong>la</strong>s............................................... 17.724 18.120 18.298 18.788 19.449 20.050 20.441 20.868<br />
Albu<strong>de</strong>ite ........................................... 1.723 1.763 1.781 1.662 1.693 1.701 1.719 1.743<br />
Alcantaril<strong>la</strong>......................................... 20.666 21.006 21.441 21.877 22.994 23.771 24.321 24.661<br />
Alcázares (Los) ................................. .. .. .. .. .. .. .. ..<br />
Aledo ................................................. 1.086 1.077 1.077 1.072 1.091 1.103 1.077 1.084<br />
Alguazas............................................ 5.030 5.115 5.208 5.236 5.376 5.493 5.605 5.747<br />
Alhama <strong>de</strong> Murcia ............................. 12.008 12.202 12.346 12.108 12.601 12.866 13.012 13.223<br />
Archena ............................................. 10.406 10.621 10.855 11.045 11.686 11.958 12.242 12.476<br />
Beniel ................................................ 5.173 5.235 5.293 5.385 5.464 5.566 5.707 5.826<br />
B<strong>la</strong>nca ............................................... 6.278 6.341 6.374 6.594 6.637 6.708 6.750 6.757<br />
Bul<strong>la</strong>s................................................. 9.269 9.379 9.442 9.322 9.512 9.652 9.809 9.951<br />
Ca<strong>la</strong>sparra......................................... 8.442 8.458 8.461 8.333 8.471 8.561 8.627 8.720<br />
Campos <strong>de</strong>l Río................................. 2.053 2.028 2.033 2.028 2.026 2.018 2.042 2.064<br />
Caravaca <strong>de</strong> <strong>la</strong> Cruz.......................... 20.354 20.359 20.518 20.152 20.700 21.219 21.561 21.767<br />
Cartagena.......................................... 148.276 149.678 151.889 155.178 158.776 162.630 165.557 168.040<br />
Cehegín............................................. 12.945 13.066 13.150 12.378 13.372 13.632 13.929 14.181<br />
Ceutí.................................................. 5.585 5.628 5.719 5.440 5.606 5.688 5.779 5.894<br />
Cieza ................................................. 26.997 27.544 28.280 29.309 29.457 30.325 30.728 31.099<br />
Fortuna .............................................. 5.731 5.762 5.771 5.646 5.773 5.902 5.978 6.029<br />
Fuente Á<strong>la</strong>mo .................................... 9.053 9.085 9.088 8.797 8.920 9.006 9.039 9.013<br />
Jumil<strong>la</strong> ............................................... 20.448 20.463 20.557 20.202 20.556 20.799 20.872 21.099<br />
Libril<strong>la</strong>................................................ 3.305 3.384 3.389 3.343 3.432 3.493 3.534 3.617<br />
Lorca ................................................. 62.515 63.463 64.315 59.342 63.018 64.711 65.806 66.872<br />
Lorquí ................................................ 4.332 4.394 4.461 4.531 4.614 4.729 4.817 4.926<br />
Mazarrón ........................................... 9.310 9.343 9.396 9.951 10.161 10.351 10.433 10.694<br />
Molina <strong>de</strong> Segura .............................. 24.388 25.220 26.099 25.579 26.986 28.419 29.465 30.480<br />
Moratal<strong>la</strong>............................................ 10.756 10.729 10.644 10.270 10.377 10.423 10.450 10.426<br />
Mu<strong>la</strong>................................................... 14.431 14.635 14.759 14.421 14.878 15.239 15.421 15.641<br />
Murcia................................................ 255.917 262.040 267.916 262.071 272.223 283.552 290.414 295.083<br />
Ojós ................................................... 888 894 914 907 906 887 886 892<br />
Pliego ................................................ 3.569 3.571 3.574 3.544 3.562 3.573 3.595 3.616<br />
Puerto Lumbreras.............................. 8.209 8.220 8.285 8.014 8.249 8.496 8.610 8.773<br />
Ricote ................................................ 2.311 2.270 2.261 2.358 2.370 2.349 2.333 2.297<br />
San Javier ......................................... 10.813 11.041 11.152 10.920 11.474 11.907 12.214 12.328<br />
San Pedro <strong>de</strong> Pinatar ........................ 6.784 7.034 7.209 7.447 7.926 8.289 8.484 8.706<br />
Santomera......................................... .. .. .. .. .. .. .. ..<br />
Torre Pacheco................................... 13.440 13.671 13.843 13.134 14.218 14.654 15.024 15.325<br />
Torres <strong>de</strong> Cotil<strong>la</strong>s (Las) ..................... 7.491 7.738 8.163 9.034 9.330 9.740 10.079 10.531<br />
Totana ............................................... 16.615 16.810 17.045 16.865 17.593 18.072 18.498 18.754<br />
Ulea ................................................... 1.472 1.484 1.453 1.505 1.509 1.511 1.516 1.512<br />
Union (La).......................................... 13.237 13.199 13.173 12.897 13.287 13.566 13.769 14.045<br />
Vil<strong>la</strong>nueva <strong>de</strong>l Río Segura................. 1.890 1.875 1.885 1.928 1.963 1.983 2.011 2.025<br />
Yec<strong>la</strong> ................................................. 21.372 21.785 22.196 23.334 23.782 24.161 24.564 25.177<br />
Estadísticas Históricas <strong>de</strong> Pob<strong>la</strong>ción <strong>de</strong> <strong>la</strong> Región <strong>de</strong> Murcia<br />
53
Censos <strong>de</strong> Pob<strong>la</strong>ción. Datos Municipales..<br />
2.3.1. EVOLUCIÓN DE LA POBLACIÓN DE DERECHO SEGÚN RECTIFICACIONES DEL PADRÓN<br />
MUNICIPAL DE HABITANTES. 1940-1995. AMBOS SEXOS. (Continúa)<br />
54<br />
MUNICIPIOS 1981 (1) 1982 1983 1984 1985 1986 1987<br />
TOTAL ................................................. 955.487 970.157 998.272 1.011.098 1.023.901 1.006.788 1.013.166<br />
Abanil<strong>la</strong>................................................ 7.146 7.182 7.270 7.281 7.339 6.968 7.004<br />
Abarán ................................................. 11.183 11.380 11.712 11.795 11.927 11.572 11.623<br />
Agui<strong>la</strong>s................................................. 20.809 21.273 21.810 22.170 22.620 22.926 23.162<br />
Albu<strong>de</strong>ite.............................................. 1.658 1.681 1.719 1.740 1.744 1.522 1.527<br />
Alcantaril<strong>la</strong> ........................................... 24.617 25.061 25.937 26.404 26.789 26.991 27.454<br />
Alcázares (Los).................................... .. .. .. .. 2.480 2.847 2.927<br />
Aledo ................................................... 1.081 1.086 1.096 1.103 1.085 1.050 1.051<br />
Alguazas.............................................. 5.782 5.875 6.139 6.244 6.343 6.451 6.513<br />
Alhama <strong>de</strong> Murcia................................ 13.132 13.304 13.609 13.820 14.010 13.807 13.872<br />
Archena ............................................... 11.944 12.111 12.763 12.912 13.022 12.994 13.195<br />
Beniel................................................... 6.043 6.165 6.236 6.345 6.501 6.390 6.479<br />
B<strong>la</strong>nca.................................................. 6.486 6.515 6.592 6.644 6.719 6.055 6.059<br />
Bul<strong>la</strong>s................................................... 9.666 9.822 10.017 10.080 10.118 10.080 10.145<br />
Ca<strong>la</strong>sparra ........................................... 8.678 8.738 8.904 8.982 9.077 8.887 8.909<br />
Campos <strong>de</strong>l Río................................... 2.046 2.080 2.108 2.151 2.203 2.044 2.046<br />
Caravaca <strong>de</strong> <strong>la</strong> Cruz............................ 20.455 20.565 20.968 21.180 21.364 22.622 22.285<br />
Cartagena............................................ 167.936 169.872 172.428 174.195 175.597 168.596 169.036<br />
Cehegín ............................................... 13.648 13.915 14.534 14.724 14.975 15.047 15.099<br />
Ceutí .................................................... 5.664 5.775 5.872 5.967 6.026 5.916 6.032<br />
Cieza.................................................... 30.327 30.751 31.208 31.440 31.593 30.166 30.419<br />
Fortuna ................................................ 5.792 5.896 6.052 6.165 6.219 6.089 6.114<br />
Fuente Á<strong>la</strong>mo ...................................... 8.538 8.645 8.778 8.897 8.927 8.778 8.806<br />
Jumil<strong>la</strong> ................................................. 20.663 20.791 21.166 21.214 21.355 20.743 20.840<br />
Libril<strong>la</strong> .................................................. 3.516 3.557 3.587 3.597 3.642 3.716 3.737<br />
Lorca.................................................... 61.879 62.491 64.300 65.162 65.767 65.458 65.617<br />
Lorquí .................................................. 5.049 5.140 5.230 5.326 5.396 5.249 5.301<br />
Mazarrón.............................................. 10.270 10.518 11.081 11.387 11.873 13.160 13.292<br />
Molina <strong>de</strong> Segura................................. 31.515 32.444 33.847 34.580 35.390 34.917 35.402<br />
Moratal<strong>la</strong>.............................................. 9.374 9.459 9.497 9.527 10.127 10.103 10.130<br />
Mu<strong>la</strong>..................................................... 14.738 14.960 15.459 15.558 15.581 13.026 13.070<br />
Murcia.................................................. 284.585 289.624 301.260 305.221 309.481 303.257 305.278<br />
Ojós ..................................................... 647 657 654 649 636 651 651<br />
Pliego................................................... 3.378 3.429 3.477 3.495 3.527 3.424 3.441<br />
Puerto Lumbreras................................ 8.560 8.678 8.842 9.007 9.158 9.406 9.471<br />
Ricote .................................................. 1.774 1.784 1.849 1.839 1.829 1.754 1.667<br />
San Javier............................................ 12.675 12.861 13.418 13.688 13.081 13.482 13.859<br />
San Pedro <strong>de</strong> Pinatar .......................... 8.866 9.000 9.657 9.916 10.197 10.902 11.096<br />
Santomera ........................................... 7.346 7.430 7.529 7.635 7.736 7.788 7.841<br />
Torre Pacheco ..................................... 15.654 15.851 16.138 16.322 14.955 15.549 15.729<br />
Torres <strong>de</strong> Cotil<strong>la</strong>s (Las) ....................... 11.349 11.718 12.144 12.547 12.722 12.844 13.012<br />
Totana.................................................. 18.537 18.924 19.404 19.578 19.817 19.653 19.810<br />
Ulea ..................................................... 1.174 1.190 1.202 1.209 1.210 1.120 1.126<br />
Union (La)............................................ 14.262 14.591 14.957 15.126 15.201 14.637 14.734<br />
Vil<strong>la</strong>nueva <strong>de</strong>l Río Segura ................... 1.738 1.802 1.841 1.983 2.086 1.728 1.731<br />
Yec<strong>la</strong>.................................................... 25.307 25.566 25.981 26.293 26.456 26.423 26.574<br />
Estadísticas Históricas <strong>de</strong> Pob<strong>la</strong>ción <strong>de</strong> <strong>la</strong> Región <strong>de</strong> Murcia.
Censos <strong>de</strong> Pob<strong>la</strong>ción. Datos Municipales.<br />
2.3.1. EVOLUCIÓN DE LA POBLACIÓN DE DERECHO SEGÚN RECTIFICACIONES DEL PADRÓN<br />
MUNICIPAL DE HABITANTES. 1940-1995. AMBOS SEXOS. (Conclusión)<br />
MUNICIPIOS 1988 1989 1990 1991 (1) 1992 1993 1994 1995<br />
TOTAL..................................................1.035.736 1.048.029 1.062.066 1.045.601 1.053.386 1.080.986 1.099.651 1.109.977<br />
Abanil<strong>la</strong>................................................. 6.989 7.021 6.984 6.074 6.107 6.249 6.323 6.321<br />
Abarán.................................................. 11.809 11.873 11.941 11.865 11.884 12.007 12.103 12.132<br />
Agui<strong>la</strong>s.................................................. 23.853 24.303 24.796 24.894 25.110 25.551 26.007 26.232<br />
Albu<strong>de</strong>ite .............................................. 1.529 1.533 1.532 1.411 1.401 1.417 1.410 1.383<br />
Alcantaril<strong>la</strong>............................................ 28.279 29.290 30.141 30.144 30.621 31.412 31.854 32.455<br />
Alcázares (Los) .................................... 3.450 3.675 3.852 3.683 3.827 4.183 4.456 4.779<br />
Aledo .................................................... 1.046 1.041 1.041 985 984 989 996 1.007<br />
Alguazas............................................... 6.670 6.756 6.857 6.931 6.961 7.068 7.121 7.107<br />
Alhama <strong>de</strong> Murcia ................................ 14.117 14.232 14.401 14.175 14.318 14.602 14.852 15.022<br />
Archena ................................................ 13.299 13.441 13.553 13.487 13.550 13.934 14.054 14.033<br />
Beniel ................................................... 6.718 6.879 7.063 7.220 7.339 7.521 7.680 7.861<br />
B<strong>la</strong>nca .................................................. 6.073 6.100 6.091 5.768 5.802 5.785 5.768 5.765<br />
Bul<strong>la</strong>s.................................................... 10.209 10.262 10.340 10.009 10.073 10.275 10.405 10.521<br />
Ca<strong>la</strong>sparra............................................ 8.913 8.919 8.888 8.745 8.805 8.914 9.007 9.024<br />
Campos <strong>de</strong>l Río.................................... 2.054 2.063 2.076 1.949 1.981 2.032 2.030 2.058<br />
Caravaca <strong>de</strong> <strong>la</strong> Cruz............................. 23.078 23.104 23.241 21.296 21.346 21.612 21.781 21.941<br />
Cartagena............................................. 172.710 173.788 175.966 168.023 169.536 176.139 179.659 180.553<br />
Cehegín................................................ 15.181 15.231 15.319 13.614 13.670 13.933 14.119 14.197<br />
Ceutí..................................................... 6.143 6.239 6.378 6.411 6.536 6.703 6.779 6.854<br />
Cieza .................................................... 30.904 31.085 31.284 30.875 31.485 31.927 32.165 32.210<br />
Fortuna ................................................. 6.225 6.221 6.280 6.004 6.072 6.224 6.295 6.413<br />
Fuente Á<strong>la</strong>mo ....................................... 8.938 8.950 9.049 8.279 8.311 8.909 9.080 9.146<br />
Jumil<strong>la</strong> .................................................. 20.961 20.948 21.125 20.092 20.236 20.593 20.834 20.887<br />
Libril<strong>la</strong>................................................... 3.742 3.746 3.769 3.764 3.758 3.766 3.801 3.854<br />
Lorca .................................................... 66.437 66.784 67.338 65.919 66.555 68.545 69.355 69.651<br />
Lorquí ................................................... 5.400 5.416 5.447 5.328 5.412 5.489 5.520 5.533<br />
Mazarrón .............................................. 13.797 14.039 14.275 14.591 14.729 15.144 15.447 15.753<br />
Molina <strong>de</strong> Segura ................................. 36.429 37.289 38.293 37.806 38.714 40.210 41.139 41.519<br />
Moratal<strong>la</strong>............................................... 10.146 10.153 10.090 8.976 8.906 9.002 8.975 9.005<br />
Mu<strong>la</strong>...................................................... 13.249 13.343 13.439 13.053 13.171 13.429 13.534 13.685<br />
Murcia................................................... 314.124 318.688 322.911 328.100 328.408 335.055 341.531 344.904<br />
Ojós ...................................................... 654 640 647 678 669 633 628 634<br />
Pliego ................................................... 3.459 3.457 3.477 3.327 3.334 3.367 3.401 3.427<br />
Puerto Lumbreras................................. 9.513 9.592 9.709 9.961 10.070 10.310 10.411 10.511<br />
Ricote ................................................... 1.792 1.776 1.758 1.689 1.705 1.676 1.653 1.667<br />
San Javier ............................................ 14.496 14.861 15.467 14.696 14.947 16.120 16.816 17.282<br />
San Pedro <strong>de</strong> Pinatar ........................... 11.623 12.252 12.661 12.057 12.220 13.076 13.597 13.916<br />
Santomera............................................ 7.943 8.181 8.400 8.518 8.681 9.118 9.432 9.607<br />
Torre Pacheco...................................... 16.009 16.395 16.794 16.568 16.820 17.738 18.563 19.586<br />
Torres <strong>de</strong> Cotil<strong>la</strong>s (Las) ........................ 13.266 13.507 13.802 14.132 14.342 14.722 15.002 15.137<br />
Totana .................................................. 19.959 20.121 20.339 20.466 20.816 21.117 21.246 21.386<br />
Ulea ...................................................... 1.115 1.098 1.077 1.073 1.065 1.050 1.046 1.049<br />
Union (La)............................................. 14.869 15.002 15.144 13.940 14.072 14.201 14.433 14.475<br />
Vil<strong>la</strong>nueva <strong>de</strong>l Río Segura.................... 1.719 1.732 1.747 1.663 1.646 1.650 1.614 1.618<br />
Yec<strong>la</strong> .................................................... 26.847 27.003 27.284 27.362 27.391 27.589 27.729 27.877<br />
Nota: Falta el año 1980, dado que hasta 1979 <strong>la</strong>s rectificaciones padronales se hacían el 31 <strong>de</strong> Diciembre, cambiando en 1981 al 1 <strong>de</strong> Marzo <strong>la</strong> fecha <strong>de</strong> referencia.<br />
(1) Datos <strong>de</strong> los Censos <strong>de</strong> Pob<strong>la</strong>ción.<br />
Fuente: Delegación Provincial <strong>de</strong>l INE en Murcia.<br />
Estadísticas Históricas <strong>de</strong> Pob<strong>la</strong>ción <strong>de</strong> <strong>la</strong> Región <strong>de</strong> Murcia. 55
Censos <strong>de</strong> Pob<strong>la</strong>ción. Datos Municipales.<br />
2.3.2. EVOLUCIÓN DE LA POBLACIÓN DE DERECHO SEGÚN RECTIFICACIONES DEL PADRÓN<br />
MUNICIPAL DE HABITANTES. 1940-1995. HOMBRES. (Continúa)<br />
MUNICIPIOS 1940 (1) 1941 1942 1943 1944 1945 1946 1947<br />
TOTAL ............................................... 359.711 363.054 366.349 367.187 371.420 360.164 366.920 372.104<br />
Abanil<strong>la</strong>.............................................. 4.204 4.216 4.075 4.080 4.088 4.026 4.061 4.107<br />
Abarán ............................................... 3.874 3.876 3.882 3.915 3.909 3.800 3.854 3.952<br />
Agui<strong>la</strong>s............................................... 7.456 7.442 7.470 7.493 7.537 7.594 7.740 7.816<br />
Albu<strong>de</strong>ite............................................ 837 816 802 812 820 824 824 845<br />
Alcantaril<strong>la</strong> ......................................... 5.135 5.207 5.257 5.304 5.383 5.762 5.865 5.947<br />
Alcázares (Los).................................. .. .. .. .. .. .. .. ..<br />
Aledo ................................................. 625 637 656 621 633 590 620 636<br />
Alguazas............................................ 1.993 2.019 2.041 2.067 2.115 2.119 2.135 2.168<br />
Alhama <strong>de</strong> Murcia.............................. 5.420 5.462 5.701 5.771 5.805 5.256 5.285 5.366<br />
Archena ............................................. 4.008 4.018 4.041 4.051 4.141 4.085 4.155 3.914<br />
Beniel................................................. 2.049 2.043 2.029 2.031 2.057 2.083 2.108 2.139<br />
B<strong>la</strong>nca................................................ 2.455 2.471 2.509 2.458 2.509 2.489 2.497 2.522<br />
Bul<strong>la</strong>s................................................. 4.702 4.750 4.854 4.909 4.989 4.900 4.919 4.936<br />
Ca<strong>la</strong>sparra ......................................... 5.232 5.098 5.077 6.049 6.119 5.097 5.251 5.362<br />
Campos <strong>de</strong>l Río................................. 1.003 996 1.002 1.010 1.019 1.058 1.060 1.064<br />
Caravaca <strong>de</strong> <strong>la</strong> Cruz.......................... 9.975 10.030 10.270 10.222 10.269 10.780 11.931 11.134<br />
Cartagena.......................................... 58.132 58.199 58.196 57.903 58.458 56.252 57.402 57.948<br />
Cehegín ............................................. 8.816 9.008 9.084 9.094 9.575 8.159 8.318 8.437<br />
Ceutí .................................................. 2.013 2.052 2.056 2.025 2.072 2.006 2.046 2.089<br />
Cieza.................................................. 11.725 11.817 11.660 11.892 11.852 10.911 11.452 11.627<br />
Fortuna .............................................. 3.021 3.281 3.252 3.324 3.392 3.028 3.095 3.158<br />
Fuente Á<strong>la</strong>mo .................................... 4.761 4.926 4.914 4.968 5.019 4.653 4.733 4.843<br />
Jumil<strong>la</strong> ............................................... 10.718 10.831 10.931 11.073 11.181 10.405 10.515 10.676<br />
Libril<strong>la</strong> ................................................ 1.477 1.536 1.512 1.560 1.569 1.347 1.350 1.392<br />
Lorca.................................................. 33.656 33.656 33.934 33.286 33.446 35.102 35.628 36.297<br />
Lorquí ................................................ 1.757 1.758 1.737 1.750 1.775 1.773 1.774 1.792<br />
Mazarrón............................................ 5.802 5.661 5.640 5.564 5.329 4.475 4.533 4.550<br />
Molina <strong>de</strong> Segura............................... 6.819 6.913 6.987 7.083 7.164 7.263 7.361 7.484<br />
Moratal<strong>la</strong>............................................ 7.639 7.710 7.778 7.808 7.917 7.852 7.942 8.075<br />
Mu<strong>la</strong>................................................... 7.013 7.059 7.148 7.049 7.396 6.636 6.696 6.973<br />
Murcia................................................ 95.780 98.082 99.912 100.231 101.496 97.317 98.672 101.136<br />
Ojós ................................................... 679 671 666 619 620 617 566 576<br />
Pliego................................................. 1.351 1.363 1.377 1.397 1.438 1.364 1.391 1.432<br />
Puerto Lumbreras.............................. .. .. .. .. .. .. .. ..<br />
Ricote ................................................ 1.450 1.474 1.461 1.481 1.497 1.432 1.456 1.482<br />
San Javier.......................................... 3.232 3.264 3.288 3.299 3.626 4.272 4.496 4.487<br />
San Pedro <strong>de</strong> Pinatar ........................ 2.160 2.184 2.232 2.276 2.320 2.275 2.339 2.392<br />
Santomera ......................................... .. .. .. .. .. .. .. ..<br />
Torre Pacheco ................................... 4.728 4.765 4.812 4.899 5.021 5.077 5.147 5.219<br />
Torres <strong>de</strong> Cotil<strong>la</strong>s (Las) ..................... 2.339 2.350 2.358 2.389 2.451 2.472 2.539 2.597<br />
Totana................................................ 8.136 7.893 8.127 7.714 7.611 7.495 7.532 7.533<br />
Ulea ................................................... 829 828 828 839 848 797 784 798<br />
Unión (La).......................................... 5.175 5.170 5.177 5.175 5.205 5.057 5.122 5.174<br />
Vil<strong>la</strong>nueva <strong>de</strong>l Río Segura ................. 746 722 723 728 732 712 722 769<br />
Yec<strong>la</strong>.................................................. 10.789 10.800 10.893 10.968 11.017 10.952 11.004 11.260<br />
56 Estadísticas Históricas <strong>de</strong> Pob<strong>la</strong>ción <strong>de</strong> <strong>la</strong> Región <strong>de</strong> Murcia.
Censos <strong>de</strong> Pob<strong>la</strong>ción. Datos Municipales.<br />
2.3.2. EVOLUCIÓN DE LA POBLACIÓN DE DERECHO SEGÚN RECTIFICACIONES DEL PADRÓN<br />
MUNICIPAL DE HABITANTES. 1940-1995. HOMBRES. (Continúa)<br />
MUNICIPIOS 1948 1949 1950 (1) 1951 1952 1953 1954 1955<br />
TOTAL............................................... 380.515 386.758 367.276 376.758 379.741 384.792 389.203 383.260<br />
Abanil<strong>la</strong>.............................................. 4.142 4.195 4.147 4.192 4.253 4.269 4.309 4.269<br />
Abarán............................................... 4.095 4.177 4.060 4.102 4.176 4.261 4.312 4.173<br />
Agui<strong>la</strong>s............................................... 7.861 7.981 7.487 7.724 7.796 7.951 8.073 7.529<br />
Albu<strong>de</strong>ite ........................................... 858 893 867 892 922 935 963 873<br />
Alcantaril<strong>la</strong>......................................... 6.060 6.115 6.344 6.346 6.436 6.449 6.480 7.220<br />
Alcázares (Los) ................................. .. .. .. .. .. .. .. ..<br />
Aledo ................................................. 644 653 667 671 683 682 693 671<br />
Alguazas............................................ 2.198 2.215 2.061 2.070 2.208 2.235 2.275 2.157<br />
Alhama <strong>de</strong> Murcia ............................. 5.500 5.543 5.519 5.634 5.692 5.770 5.837 5.725<br />
Archena ............................................. 3.924 3.890 3.728 3.774 3.841 3.889 3.921 3.962<br />
Beniel ................................................ 2.165 2.172 2.135 5.150 2.170 2.191 2.230 2.247<br />
B<strong>la</strong>nca ............................................... 2.577 2.611 2.715 2.756 2.799 2.838 2.882 2.799<br />
Bul<strong>la</strong>s................................................. 4.974 5.143 4.971 5.054 5.081 5.184 5.236 4.714<br />
Ca<strong>la</strong>sparra......................................... 5.613 5.574 5.157 5.202 5.330 5.434 5.498 5.239<br />
Campos <strong>de</strong>l Río................................. 1.084 1.106 1.106 1.118 1.142 1.148 1.168 1.139<br />
Caravaca <strong>de</strong> <strong>la</strong> Cruz.......................... 11.337 11.894 10.845 11.058 11.371 11.454 11.486 10.443<br />
Cartagena.......................................... 58.935 59.631 53.274 54.050 54.643 55.683 56.421 56.726<br />
Cehegín............................................. 8.571 8.545 7.970 8.043 8.140 8.288 8.337 7.848<br />
Ceutí.................................................. 2.159 2.179 1.956 1.980 2.019 2.076 2.121 2.070<br />
Cieza ................................................. 12.179 12.424 11.209 11.410 11.627 11.866 12.019 11.332<br />
Fortuna .............................................. 3.251 3.305 2.941 3.014 3.054 3.119 3.190 3.000<br />
Fuente Á<strong>la</strong>mo .................................... 4.811 4.841 4.900 4.951 4.947 4.984 4.993 4.723<br />
Jumil<strong>la</strong> ............................................... 10.795 10.845 10.359 10.504 10.595 10.666 10.739 11.106<br />
Libril<strong>la</strong>................................................ 1.419 1.406 1.471 1.492 1.518 1.552 1.569 1.529<br />
Lorca ................................................. 37.512 38.222 34.753 35.337 35.753 35.873 35.622 33.569<br />
Lorquí ................................................ 1.821 1.819 1.574 1.576 1.597 1.632 1.664 1.704<br />
Mazarrón ........................................... 4.573 4.634 4.630 4.769 4.914 5.010 5.021 4.730<br />
Molina <strong>de</strong> Segura .............................. 7.601 7.676 7.196 7.258 7.308 7.342 7.436 7.350<br />
Moratal<strong>la</strong>............................................ 8.162 8.264 7.240 7.369 7.528 7.669 7.782 7.439<br />
Mu<strong>la</strong>................................................... 7.197 7.372 7.503 7.625 7.710 7.761 7.853 7.581<br />
Murcia................................................ 104.202 106.696 104.798 107.605 109.778 111.341 113.218 114.672<br />
Ojós ................................................... 592 580 569 570 576 584 597 588<br />
Pliego ................................................ 1.461 1.489 1.611 1.636 1.663 1.666 1.689 1.590<br />
Puerto Lumbreras.............................. .. .. .. .. .. .. .. ..<br />
Ricote ................................................ 1.498 1.526 1.446 1.461 1.478 1.507 1.517 1.405<br />
San Javier ......................................... 4.601 4.500 4.592 4.695 4.774 4.853 4.917 4.490<br />
San Pedro <strong>de</strong> Pinatar ........................ 2.448 2.456 2.470 2.495 2.564 2.532 2.537 2.554<br />
Santomera......................................... .. .. .. .. .. .. .. ..<br />
Torre Pacheco................................... 5.319 5.358 5.088 5.143 5.217 5.262 5.300 5.176<br />
Torres <strong>de</strong> Cotil<strong>la</strong>s (Las) ..................... 2.628 2.612 2.604 2.643 2.682 2.689 2.728 2.670<br />
Totana ............................................... 7.601 7.692 7.193 7.202 7.287 7.356 7.348 7.034<br />
Ulea ................................................... 813 822 769 766 793 812 825 793<br />
Unión (La).......................................... 5.244 5.283 4.839 4.955 5.040 5.211 5.497 5.193<br />
Vil<strong>la</strong>nueva <strong>de</strong>l Río Segura................. 784 797 738 749 768 777 786 808<br />
Yec<strong>la</strong> ................................................. 11.306 11.622 11.774 11.717 11.868 11.991 12.114 12.420<br />
Estadísticas Históricas <strong>de</strong> Pob<strong>la</strong>ción <strong>de</strong> <strong>la</strong> Región <strong>de</strong> Murcia. 57
Censos <strong>de</strong> Pob<strong>la</strong>ción. Datos Municipales.<br />
2.3.2. EVOLUCIÓN DE LA POBLACIÓN DE DERECHO SEGÚN RECTIFICACIONES DEL PADRÓN<br />
MUNICIPAL DE HABITANTES. 1940-1995. HOMBRES. (Continúa)<br />
MUNICIPIOS 1956 1957 1958 1959 1960 (1) 1961 1962 1963<br />
TOTAL ............................................... 387.539 392.621 399.563 404.950 393.093 399.185 405.431 410.986<br />
Abanil<strong>la</strong>.............................................. 4.304 4.337 4.361 4.386 4.211 4.242 4.254 4.265<br />
Abarán ............................................... 4.218 4.276 4.357 4.462 4.277 4.408 4.524 4.880<br />
Agui<strong>la</strong>s............................................... 7.605 7.840 8.089 8.142 7.553 7.705 7.850 8.037<br />
Albu<strong>de</strong>ite............................................ 894 922 946 958 915 941 958 987<br />
Alcantaril<strong>la</strong> ......................................... 7.325 7.346 7.419 7.541 7.656 7.595 7.732 7.873<br />
Alcázares (Los).................................. .. .. .. .. .. .. .. ..<br />
Aledo ................................................. 680 677 668 744 607 614 615 628<br />
Alguazas............................................ 2.170 2.196 2.238 2.296 2.515 2.544 2.548 2.596<br />
Alhama <strong>de</strong> Murcia.............................. 5.871 5.898 5.960 6.031 5.808 5.881 5.949 6.030<br />
Archena ............................................. 4.105 4.180 4.278 4.376 4.453 4.541 4.622 4.674<br />
Beniel................................................. 2.246 2.263 2.292 2.312 2.264 2.300 2.329 2.360<br />
B<strong>la</strong>nca................................................ 2.844 2.881 2.917 2.947 2.952 2.991 2.988 3.014<br />
Bul<strong>la</strong>s................................................. 4.795 4.890 4.996 5.053 4.827 4.900 4.951 5.038<br />
Ca<strong>la</strong>sparra ......................................... 5.314 5.430 5.555 5.695 4.809 4.918 4.993 5.084<br />
Campos <strong>de</strong>l Río................................. 1.153 1.181 1.200 1.212 1.091 1.109 1.106 1.119<br />
Caravaca <strong>de</strong> <strong>la</strong> Cruz.......................... 10.527 10.610 10.844 11.101 10.428 10.554 10.874 10.929<br />
Cartagena.......................................... 57.615 58.576 59.845 60.157 59.914 61.081 62.468 63.758<br />
Cehegín ............................................. 7.915 7.952 8.331 8.368 8.089 8.209 8.314 8.339<br />
Ceutí .................................................. 2.112 2.147 2.204 2.241 2.351 2.376 2.396 2.402<br />
Cieza.................................................. 11.515 11.760 12.009 12.263 11.019 11.219 11.671 11.926<br />
Fortuna .............................................. 3.040 3.097 3.157 3.180 2.829 2.894 2.926 2.960<br />
Fuente Á<strong>la</strong>mo .................................... 4.766 4.809 4.845 4.886 4.747 4.791 4.803 4.862<br />
Jumil<strong>la</strong> ............................................... 11.246 11.060 11.418 11.640 10.821 11.036 11.290 11.459<br />
Libril<strong>la</strong> ................................................ 1.548 1.565 1.580 1.601 1.510 1.534 1.545 1.562<br />
Lorca.................................................. 34.047 34.555 31.414 31.448 29.098 29.774 30.333 30.889<br />
Lorquí ................................................ 1.738 1.764 1.785 1.827 1.972 2.010 2.043 2.066<br />
Mazarrón............................................ 4.840 4.889 4.902 4.917 4.931 4.954 4.912 4.926<br />
Molina <strong>de</strong> Segura............................... 7.357 7.547 7.686 7.853 8.031 8.165 8.335 8.507<br />
Moratal<strong>la</strong>............................................ 7.508 7.549 7.666 7.721 7.336 7.326 7.348 7.355<br />
Mu<strong>la</strong>................................................... 7.662 7.748 7.859 7.983 7.424 7.525 7.597 7.726<br />
Murcia................................................ 115.294 116.682 118.344 119.847 120.705 122.472 123.807 124.642<br />
Ojós ................................................... 586 599 610 625 582 591 590 603<br />
Pliego................................................. 1.602 1.619 1.646 1.664 1.740 1.772 1.805 1.837<br />
Puerto Lumbreras.............................. .. .. 3.831 3.870 3.487 3.531 3.579 3.656<br />
Ricote ................................................ 1.416 1.420 1.413 1.413 1.319 1.338 1.355 1.348<br />
San Javier.......................................... 4.619 4.695 4.743 4.876 4.990 5.027 5.143 5.184<br />
San Pedro <strong>de</strong> Pinatar ........................ 2.577 2.639 2.723 2.772 2.665 2.716 2.770 2.841<br />
Santomera ......................................... .. .. .. .. .. .. .. ..<br />
Torre Pacheco ................................... 5.228 5.294 5.387 5.464 5.496 5.552 5.646 5.721<br />
Torres <strong>de</strong> Cotil<strong>la</strong>s (Las) ..................... 2.712 2.764 2.803 2.874 2.955 3.006 3.053 3.121<br />
Totana................................................ 7.137 7.210 7.303 7.400 6.986 7.064 7.166 7.255<br />
Ulea ................................................... 806 826 836 839 772 778 780 795<br />
Unión (La).......................................... 5.408 5.586 5.607 6.313 5.788 5.913 6.114 6.302<br />
Vil<strong>la</strong>nueva <strong>de</strong>l Río Segura ................. 815 819 835 842 829 838 847 857<br />
Yec<strong>la</strong>.................................................. 12.379 12.523 12.661 12.810 10.341 10.450 10.502 10.573<br />
58 Estadísticas Históricas <strong>de</strong> Pob<strong>la</strong>ción <strong>de</strong> <strong>la</strong> Región <strong>de</strong> Murcia.
Censos <strong>de</strong> Pob<strong>la</strong>ción. Datos Municipales.<br />
2.3.2. EVOLUCIÓN DE LA POBLACIÓN DE DERECHO SEGÚN RECTIFICACIONES DEL PADRÓN<br />
MUNICIPAL DE HABITANTES. 1940-1995. HOMBRES. (Continúa)<br />
MUNICIPIOS 1964 1965 1966 1967 1968 1969 1970 (1) 1971<br />
TOTAL............................................... 414.393 396.745 412.326 418.130 425.519 433.852 407.613 414.333<br />
Abanil<strong>la</strong>.............................................. 4.259 4.350 4.376 4.435 4.436 4.445 4.334 4.342<br />
Abarán............................................... 4.950 4.686 4.980 5.064 5.128 5.243 4.964 5.075<br />
Agui<strong>la</strong>s............................................... 8.230 8.030 8.393 8.540 8.558 8.684 8.396 8.543<br />
Albu<strong>de</strong>ite ........................................... 1.018 868 874 880 870 877 837 847<br />
Alcantaril<strong>la</strong>......................................... 8.029 7.920 8.465 8.655 8.861 8.985 9.644 9.864<br />
Alcázares (Los) ................................. .. .. .. .. .. .. .. ..<br />
Aledo ................................................. 629 586 585 596 597 605 513 518<br />
Alguazas............................................ 2.631 2.400 2.429 2.442 2.457 2.480 2.395 2.419<br />
Alhama <strong>de</strong> Murcia ............................. 6.128 5.829 5.995 6.065 6.130 6.223 5.673 5.766<br />
Archena ............................................. 4.730 4.672 4.854 4.936 5.016 5.114 4.955 5.051<br />
Beniel ................................................ 2.384 2.259 2.313 2.346 2.402 2.443 2.495 2.533<br />
B<strong>la</strong>nca ............................................... 3.056 2.867 2.912 2.970 3.012 3.044 2.967 3.007<br />
Bul<strong>la</strong>s................................................. 5.124 4.433 4.635 4.675 4.766 4.813 4.590 4.635<br />
Ca<strong>la</strong>sparra......................................... 5.186 4.106 4.219 4.301 4.392 4.485 4.102 4.128<br />
Campos <strong>de</strong>l Río................................. 1.136 1.018 1.008 1.026 1.034 1.044 992 1.001<br />
Caravaca <strong>de</strong> <strong>la</strong> Cruz.......................... 10.828 9.110 9.948 10.071 10.206 10.367 9.405 10.157<br />
Cartagena.......................................... 65.110 62.730 65.619 67.369 69.003 70.607 70.439 71.654<br />
Cehegín............................................. 8.234 6.606 7.302 7.342 7.382 7.368 6.334 6.351<br />
Ceutí.................................................. 2.426 2.540 2.590 2.635 2.692 2.749 2.720 2.774<br />
Cieza ................................................. 12.225 11.262 12.592 13.014 13.199 13.457 12.704 12.854<br />
Fortuna .............................................. 3.007 2.766 2.837 2.900 2.934 2.964 2.764 2.788<br />
Fuente Á<strong>la</strong>mo .................................... 4.895 4.571 4.674 4.785 4.836 4.862 4.481 4.535<br />
Jumil<strong>la</strong> ............................................... 11.440 10.225 10.357 10.341 10.398 10.437 10.072 10.112<br />
Libril<strong>la</strong>................................................ 1.595 1.494 1.548 1.565 1.591 1.608 1.583 1.596<br />
Lorca ................................................. 31.222 28.993 30.495 30.985 31.498 32.091 29.778 30.370<br />
Lorquí ................................................ 2.115 1.989 2.005 2.017 2.051 2.080 2.047 2.073<br />
Mazarrón ........................................... 4.971 4.148 4.652 4.689 4.684 4.705 4.540 4.575<br />
Molina <strong>de</strong> Segura .............................. 8.712 9.272 10.240 10.569 11.018 11.489 11.518 11.683<br />
Moratal<strong>la</strong>............................................ 7.392 6.344 6.730 6.607 6.578 6.563 5.457 5.487<br />
Mu<strong>la</strong>................................................... 7.800 7.495 7.681 7.738 7.850 7.951 6.946 6.983<br />
Murcia................................................ 124.183 124.670 126.494 127.598 130.249 132.653 117.955 119.911<br />
Ojós ................................................... 612 506 512 515 519 505 434 427<br />
Pliego ................................................ 1.818 1.623 1.676 1.712 1.725 1.763 1.774 1.792<br />
Puerto Lumbreras.............................. 3.778 3.340 3.382 3.407 3.471 3.508 3.962 4.002<br />
Ricote ................................................ 1.344 1.208 1.234 1.223 1.227 1.227 1.100 1.102<br />
San Javier ......................................... 5.232 5.094 5.164 5.086 5.168 5.245 5.090 5.285<br />
San Pedro <strong>de</strong> Pinatar ........................ 2.920 2.923 3.158 3.206 3.264 3.357 3.223 3.287<br />
Santomera......................................... .. .. .. .. .. .. .. ..<br />
Torre Pacheco................................... 5.754 5.880 6.101 6.229 6.438 6.581 6.576 6.679<br />
Torres <strong>de</strong> Cotil<strong>la</strong>s (Las) ..................... 3.199 3.173 3.249 3.311 3.358 3.441 3.553 3.617<br />
Totana ............................................... 7.322 7.046 7.646 7.699 7.777 8.827 8.004 8.070<br />
Ulea ................................................... 782 775 774 784 796 798 710 715<br />
Unión (La).......................................... 6.342 6.317 6.452 6.409 6.443 6.459 6.488 6.504<br />
Vil<strong>la</strong>nueva <strong>de</strong>l Río Segura................. 878 908 924 928 927 937 906 924<br />
Yec<strong>la</strong> ................................................. 10.767 9.713 10.252 10.465 10.578 10.768 10.193 10.297<br />
Estadísticas Históricas <strong>de</strong> Pob<strong>la</strong>ción <strong>de</strong> <strong>la</strong> Región <strong>de</strong> Murcia. 59
Censos <strong>de</strong> Pob<strong>la</strong>ción. Datos Municipales.<br />
2.3.2. EVOLUCIÓN DE LA POBLACIÓN DE DERECHO SEGÚN RECTIFICACIONES DEL PADRÓN<br />
MUNICIPAL DE HABITANTES. 1940-1995. HOMBRES. (Continúa)<br />
MUNICIPIOS 1972 1973 1974 1975 1976 1977 1978 1979 (2)<br />
TOTAL ............................................... 422.486 429.433 436.711 431.493 446.894 460.603 469.990 468.273<br />
Abanil<strong>la</strong>.............................................. 4.271 4.272 4.261 4.368 4.401 4.437 4.458 4.440<br />
Abarán ............................................... 5.170 5.265 5.382 5.224 5.403 5.478 5.562 5.610<br />
Agui<strong>la</strong>s............................................... 8.666 8.842 8.940 9.135 9.489 9.798 10.004 10.240<br />
Albu<strong>de</strong>ite............................................ 848 872 881 820 840 846 857 868<br />
Alcantaril<strong>la</strong> ......................................... 9.960 10.142 10.356 10.544 11.096 11.454 11.708 11.874<br />
Alcázares (Los).................................. .. .. .. .. .. .. .. ..<br />
Aledo ................................................. 520 518 518 513 520 528 517 520<br />
Alguazas............................................ 2.477 2.526 2.580 2.550 2.610 2.668 2.733 2.796<br />
Alhama <strong>de</strong> Murcia.............................. 5.891 5.997 6.069 5.969 6.221 6.357 6.427 6.515<br />
Archena ............................................. 5.115 5.232 5.349 5.425 5.759 5.906 6.058 6.180<br />
Beniel................................................. 2.575 2.597 2.632 2.674 2.703 2.759 2.832 2.895<br />
B<strong>la</strong>nca................................................ 3.017 3.046 3.063 3.159 3.183 3.215 3.225 3.242<br />
Bul<strong>la</strong>s................................................. 4.658 4.724 4.746 4.636 4.728 4.806 4.880 4.969<br />
Ca<strong>la</strong>sparra ......................................... 4.141 4.161 4.160 4.175 4.250 4.296 4.320 4.385<br />
Campos <strong>de</strong>l Río................................. 1.008 995 1.000 987 994 997 1.007 1.024<br />
Caravaca <strong>de</strong> <strong>la</strong> Cruz.......................... 10.186 10.182 10.282 9.997 10.301 10.581 10.740 10.806<br />
Cartagena.......................................... 72.977 73.642 74.787 76.105 77.974 79.978 81.519 82.757<br />
Cehegín ............................................. 6.420 6.498 6.553 6.142 6.667 6.802 6.952 7.071<br />
Ceutí .................................................. 2.814 2.839 2.879 2.748 2.832 2.873 2.925 2.983<br />
Cieza.................................................. 13.137 13.391 13.778 14.239 14.333 14.780 14.987 15.196<br />
Fortuna .............................................. 2.826 2.842 2.840 2.805 2.865 2.943 2.986 3.006<br />
Fuente Á<strong>la</strong>mo .................................... 4.527 4.573 4.562 4.406 4.485 4.523 4.532 4.513<br />
Jumil<strong>la</strong> ............................................... 10.174 10.169 10.203 9.962 10.144 10.283 10.296 10.428<br />
Libril<strong>la</strong> ................................................ 1.622 1.660 1.674 1.640 1.684 1.722 1.742 1.782<br />
Lorca.................................................. 30.865 31.322 31.748 29.272 31.131 31.973 32.546 33.083<br />
Lorquí ................................................ 2.116 2.147 2.196 2.246 2.283 2.342 2.385 2.435<br />
Mazarrón............................................ 4.607 4.634 4.666 4.934 5.044 5.137 5.184 5.307<br />
Molina <strong>de</strong> Segura............................... 11.945 12.380 12.810 12.509 13.207 13.932 14.468 15.006<br />
Moratal<strong>la</strong>............................................ 5.518 5.483 5.454 5.205 5.256 5.283 5.289 5.282<br />
Mu<strong>la</strong>................................................... 7.130 7.252 7.316 7.146 7.384 7.571 7.680 7.801<br />
Murcia................................................ 123.827 126.954 129.938 126.612 131.646 137.344 140.944 143.345<br />
Ojós ................................................... 427 431 442 437 440 432 434 434<br />
Pliego................................................. 1.792 1.795 1.795 1.774 1.789 1.790 1.797 1.806<br />
Puerto Lumbreras.............................. 4.062 4.083 4.118 3.959 4.069 4.188 4.240 4.309<br />
Ricote ................................................ 1.099 1.087 1.089 1.132 1.135 1.120 1.117 1.104<br />
San Javier.......................................... 5.457 5.569 5.627 5.508 5.788 6.007 6.177 6.224<br />
San Pedro <strong>de</strong> Pinatar ........................ 3.357 3.492 3.570 3.695 3.929 4.108 4.219 ..<br />
Santomera ......................................... .. .. .. .. .. .. .. ..<br />
Torre Pacheco ................................... 6.803 6.922 7.019 6.658 7.217 7.424 7.595 7.735<br />
Torres <strong>de</strong> Cotil<strong>la</strong>s (Las) ..................... 3.685 3.809 4.029 4.433 4.572 4.792 4.952 ..<br />
Totana................................................ 8.180 8.302 8.419 8.292 8.646 8.901 9.138 9.293<br />
Ulea ................................................... 718 722 704 746 746 750 751 753<br />
Unión (La).......................................... 6.489 6.450 6.434 6.324 6.513 6.654 6.773 6.885<br />
Vil<strong>la</strong>nueva <strong>de</strong>l Río Segura ................. 930 920 922 940 952 960 974 980<br />
Yec<strong>la</strong>.................................................. 10.479 10.694 10.920 11.448 11.665 11.865 12.060 12.391<br />
(2) Para 1979 no se dispone <strong>de</strong> <strong>la</strong>s pob<strong>la</strong>ciones <strong>de</strong> San Pedro <strong>de</strong>l Pinatar y <strong>la</strong>s Torres <strong>de</strong> Cotil<strong>la</strong>s <strong>de</strong>sagregadas por sexo.<br />
60 Estadísticas Históricas <strong>de</strong> Pob<strong>la</strong>ción <strong>de</strong> <strong>la</strong> Región <strong>de</strong> Murcia.
Censos <strong>de</strong> Pob<strong>la</strong>ción. Datos Municipales.<br />
2.3.2. EVOLUCIÓN DE LA POBLACIÓN DE DERECHO SEGÚN RECTIFICACIONES DEL PADRÓN<br />
MUNICIPAL DE HABITANTES. 1940-1995. HOMBRES. (Continúa)<br />
MUNICIPIOS 1981 (1) 1982 1983 1984 1985 1986 1987<br />
TOTAL.................................................. 469.339 476.606 490.796 497.256 503.739 495.779 499.115<br />
Abanil<strong>la</strong>................................................. 3.524 3.551 3.586 3.581 3.615 3.415 3.434<br />
Abarán.................................................. 5.538 5.656 5.829 5.865 5.925 5.695 5.737<br />
Agui<strong>la</strong>s.................................................. 10.251 10.493 10.771 10.988 11.234 11.455 11.577<br />
Albu<strong>de</strong>ite .............................................. 821 835 854 865 865 753 754<br />
Alcantaril<strong>la</strong>............................................ 11.920 12.134 12.576 12.836 13.067 13.079 13.325<br />
Alcázares (Los) .................................... .. .. .. .. 1.201 1.364 1.402<br />
Aledo .................................................... 535 538 545 550 544 527 532<br />
Alguazas............................................... 2.848 2.896 3.022 3.073 3.136 3.176 3.208<br />
Alhama <strong>de</strong> Murcia ................................ 6.455 6.543 6.690 6.804 6.885 6.757 6.783<br />
Archena ................................................ 5.916 6.008 6.327 6.390 6.427 6.432 6.538<br />
Beniel ................................................... 2.981 3.048 3.088 3.139 3.217 3.193 3.228<br />
B<strong>la</strong>nca .................................................. 3.095 3.116 3.153 3.182 3.224 2.921 2.917<br />
Bul<strong>la</strong>s.................................................... 4.848 4.927 5.026 5.052 5.081 5.081 5.103<br />
Ca<strong>la</strong>sparra............................................ 4.366 4.394 4.474 4.519 4.566 4.451 4.459<br />
Campos <strong>de</strong>l Río.................................... 1.027 1.042 1.055 1.067 1.094 1.012 1.012<br />
Caravaca <strong>de</strong> <strong>la</strong> Cruz............................. 10.118 10.171 10.357 10.463 10.556 11.189 11.293<br />
Cartagena............................................. 82.585 83.541 84.888 85.763 86.476 83.112 83.324<br />
Cehegín................................................ 6.785 6.937 7.262 7.340 7.467 7.509 7.511<br />
Ceutí..................................................... 2.855 2.915 2.956 3.008 3.031 3.003 3.053<br />
Cieza .................................................... 14.763 14.997 15.220 15.331 15.422 14.697 14.839<br />
Fortuna ................................................. 2.889 2.942 3.036 3.106 3.129 3.068 3.074<br />
Fuente Á<strong>la</strong>mo ....................................... 4.286 4.340 4.413 4.480 4.501 4.410 4.420<br />
Jumil<strong>la</strong> .................................................. 10.277 10.344 10.556 10.572 10.641 10.339 10.383<br />
Libril<strong>la</strong>................................................... 1.724 1.752 1.765 1.772 1.790 1.826 1.845<br />
Lorca .................................................... 30.467 30.756 31.621 32.073 32.400 32.201 32.325<br />
Lorquí ................................................... 2.497 2.546 2.594 2.650 2.680 2.614 2.644<br />
Mazarrón .............................................. 5.147 5.309 5.607 5.787 6.023 6.596 6.673<br />
Molina <strong>de</strong> Segura ................................. 15.532 15.895 16.590 16.938 17.338 17.286 17.527<br />
Moratal<strong>la</strong>............................................... 4.759 4.795 4.798 4.813 5.124 5.120 5.126<br />
Mu<strong>la</strong>...................................................... 7.353 7.449 7.702 7.755 7.769 6.464 6.488<br />
Murcia................................................... 138.024 140.468 146.334 148.273 150.345 147.678 148.455<br />
Ojós ...................................................... 307 309 306 304 297 316 316<br />
Pliego ................................................... 1.690 1.713 1.745 1.747 1.766 1.711 1.721<br />
Puerto Lumbreras................................. 4.190 4.247 4.323 4.420 4.474 4.575 4.605<br />
Ricote ................................................... 853 856 880 874 877 841 853<br />
San Javier ............................................ 6.385 6.472 6.762 6.899 6.639 6.774 6.952<br />
San Pedro <strong>de</strong> Pinatar ........................... 4.373 4.446 4.787 4.915 5.052 5.384 5.472<br />
Santomera............................................ 3.710 3.744 3.797 3.848 3.905 3.901 3.931<br />
Torre Pacheco...................................... 7.889 8.000 8.142 8.242 7.587 7.869 7.971<br />
Torres <strong>de</strong> Cotil<strong>la</strong>s (Las) ........................ 5.636 5.822 6.028 6.250 6.348 6.455 6.550<br />
Totana .................................................. 9.183 9.389 9.636 9.714 9.862 9.759 9.847<br />
Ulea ...................................................... 567 577 585 592 598 563 569<br />
Unión (La)............................................. 6.983 7.153 7.331 7.416 7.451 7.261 7.321<br />
Vil<strong>la</strong>nueva <strong>de</strong>l Río Segura.................... 857 889 904 968 1.012 860 863<br />
Yec<strong>la</strong> .................................................... 12.530 12.651 12.875 13.032 13.098 13.087 13.155<br />
Estadísticas Históricas <strong>de</strong> Pob<strong>la</strong>ción <strong>de</strong> <strong>la</strong> Región <strong>de</strong> Murcia. 61
Censos <strong>de</strong> Pob<strong>la</strong>ción. Datos Municipales.<br />
2.3.2. EVOLUCIÓN DE LA POBLACIÓN DE DERECHO SEGÚN RECTIFICACIONES DEL PADRÓN<br />
MUNICIPAL DE HABITANTES. 1940-1995. HOMBRES. (Conclusión)<br />
MUNICIPIOS 1988 1989 1990 1991 (1) 1992 1993 1994 1995<br />
TOTAL ................................................. 510.291 516.456 523.635 514.527 519.053 533.168 542.701 548.185<br />
Abanil<strong>la</strong>................................................ 3.432 3.442 3.421 2.989 3.018 3.087 3.126 3.144<br />
Abarán ................................................. 5.828 5.861 5.904 5.879 5.883 5.952 6.002 6.033<br />
Agui<strong>la</strong>s................................................. 11.902 12.161 12.398 12.441 12.578 12.793 13.038 13.145<br />
Albu<strong>de</strong>ite.............................................. 753 754 757 707 705 714 701 690<br />
Alcantaril<strong>la</strong> ........................................... 13.767 14.293 14.730 14.628 14.933 15.343 15.576 15.903<br />
Alcázares (Los).................................... 1.686 1.801 1.879 1.792 1.869 2.036 2.181 2.344<br />
Aledo ................................................... 531 525 528 512 510 513 513 520<br />
Alguazas.............................................. 3.296 3.337 3.398 3.430 3.448 3.510 3.541 3.527<br />
Alhama <strong>de</strong> Murcia................................ 6.932 6.992 7.081 6.986 7.059 7.210 7.360 7.453<br />
Archena ............................................... 6.576 6.652 6.717 6.704 6.742 6.918 6.978 6.963<br />
Beniel................................................... 3.354 3.437 3.518 3.591 3.646 3.733 3.829 3.910<br />
B<strong>la</strong>nca.................................................. 2.927 2.944 2.941 2.815 2.832 2.823 2.816 2.822<br />
Bul<strong>la</strong>s................................................... 5.124 5.149 5.197 5.045 5.064 5.180 5.250 5.298<br />
Ca<strong>la</strong>sparra ........................................... 4.473 4.467 4.437 4.372 4.402 4.443 4.510 4.537<br />
Campos <strong>de</strong>l Río................................... 1.016 1.022 1.031 964 983 1.011 1.007 1.018<br />
Caravaca <strong>de</strong> <strong>la</strong> Cruz............................ 11.429 11.451 11.501 10.551 10.558 10.708 10.816 10.893<br />
Cartagena............................................ 85.179 85.751 86.935 82.880 84.000 87.353 89.121 89.471<br />
Cehegín ............................................... 7.552 7.603 7.643 6.779 6.806 6.940 7.050 7.095<br />
Ceutí .................................................... 3.097 3.141 3.207 3.226 3.291 3.369 3.395 3.437<br />
Cieza.................................................... 15.109 15.186 15.286 15.067 15.330 15.574 15.684 15.732<br />
Fortuna ................................................ 3.132 3.140 3.168 3.029 3.062 3.154 3.224 3.275<br />
Fuente Á<strong>la</strong>mo ...................................... 4.486 4.491 4.537 4.120 4.145 4.454 4.536 4.548<br />
Jumil<strong>la</strong> ................................................. 10.416 10.416 10.504 9.967 10.045 10.224 10.355 10.385<br />
Libril<strong>la</strong> .................................................. 1.843 1.842 1.854 1.835 1.829 1.846 1.860 1.884<br />
Lorca.................................................... 32.748 32.899 33.223 32.477 32.842 33.871 34.274 34.456<br />
Lorquí .................................................. 2.717 2.711 2.726 2.625 2.673 2.706 2.726 2.738<br />
Mazarrón.............................................. 6.955 7.057 7.165 7.320 7.389 7.607 7.754 7.936<br />
Molina <strong>de</strong> Segura................................. 18.021 18.474 18.999 18.595 19.014 19.814 20.302 20.498<br />
Moratal<strong>la</strong>.............................................. 5.147 5.136 5.102 4.545 4.507 4.564 4.550 4.560<br />
Mu<strong>la</strong>..................................................... 6.579 6.633 6.687 6.489 6.553 6.683 6.735 6.803<br />
Murcia.................................................. 152.891 155.105 157.184 159.454 159.822 163.151 166.259 167.921<br />
Ojós ..................................................... 319 312 316 333 329 314 316 320<br />
Pliego................................................... 1.734 1.732 1.747 1.689 1.697 1.715 1.733 1.751<br />
Puerto Lumbreras................................ 4.643 4.691 4.745 4.844 4.891 5.016 5.066 5.121<br />
Ricote .................................................. 863 855 846 822 824 813 808 820<br />
San Javier............................................ 7.265 7.406 7.706 7.304 7.432 8.011 8.345 8.573<br />
San Pedro <strong>de</strong> Pinatar .......................... 5.773 6.105 6.312 5.965 6.041 6.481 6.771 6.918<br />
Santomera ........................................... 3.985 4.084 4.195 4.243 4.326 4.528 4.697 4.777<br />
Torre Pacheco ..................................... 8.115 8.334 8.548 8.338 8.475 8.963 9.448 10.234<br />
Torres <strong>de</strong> Cotil<strong>la</strong>s (Las) ....................... 6.670 6.787 6.940 7.098 7.195 7.377 7.500 7.584<br />
Totana.................................................. 9.929 10.014 10.136 10.160 10.321 10.517 10.625 10.696<br />
Ulea ..................................................... 563 554 545 542 536 529 520 522<br />
Unión (La)............................................ 7.375 7.440 7.495 6.932 6.982 7.035 7.159 7.182<br />
Vil<strong>la</strong>nueva <strong>de</strong>l Río Segura ................... 867 873 878 838 827 826 804 808<br />
Yec<strong>la</strong>.................................................... 13.292 13.396 13.568 13.605 13.639 13.759 13.840 13.940<br />
Nota: Falta el año 1980, dado que hasta 1979 <strong>la</strong>s rectificaciones padronales se hacían el 31 <strong>de</strong> Diciembre, cambiando en 1981 al 1 <strong>de</strong> Marzo <strong>la</strong> fecha <strong>de</strong> referencia.<br />
(1) Datos <strong>de</strong> los Censos <strong>de</strong> Pob<strong>la</strong>ción.<br />
Fuente: Delegación Provincial <strong>de</strong>l INE en Murcia.<br />
62 Estadísticas Históricas <strong>de</strong> Pob<strong>la</strong>ción <strong>de</strong> <strong>la</strong> Región <strong>de</strong> Murcia.
Censos <strong>de</strong> Pob<strong>la</strong>ción. Datos Municipales.<br />
2.3.3. EVOLUCIÓN DE LA POBLACIÓN DE DERECHO SEGÚN RECTIFICACIONES DEL PADRÓN<br />
MUNICIPAL DE HABITANTES. 1940-1995. MUJERES. (Continúa)<br />
MUNICIPIOS 1940 (1) 1941 1942 1943 1944 1945 1946 1947<br />
TOTAL............................................... 371.410 375.088 378.844 380.158 384.519 380.094 384.646 389.966<br />
Abanil<strong>la</strong>.............................................. 4.565 4.562 4.499 4.468 4.482 4.459 4.460 4.501<br />
Abarán............................................... 4.106 4.118 4.153 4.170 4.202 4.089 4.159 4.256<br />
Agui<strong>la</strong>s............................................... 8.010 8.016 8.014 8.033 8.080 8.003 8.104 8.207<br />
Albu<strong>de</strong>ite ........................................... 900 901 914 916 911 847 847 863<br />
Alcantaril<strong>la</strong>......................................... 5.831 5.866 5.916 5.965 6.042 6.434 6.337 6.467<br />
Alcázares (Los) ................................. .. .. .. .. .. .. .. ..<br />
Aledo ................................................. 672 694 702 681 690 662 679 690<br />
Alguazas............................................ 2.070 2.070 2.096 2.142 2.169 2.140 2.172 2.183<br />
Alhama <strong>de</strong> Murcia ............................. 5.663 5.650 5.902 5.875 5.883 5.708 5.714 5.758<br />
Archena ............................................. 4.261 4.287 4.275 4.315 4.374 4.269 4.330 4.068<br />
Beniel ................................................ 2.134 2.119 2.111 2.121 2.154 2.143 2.159 2.174<br />
B<strong>la</strong>nca ............................................... 2.654 2.678 2.720 2.745 2.783 2.866 2.912 2.931<br />
Bul<strong>la</strong>s................................................. 4.661 4.742 4.832 4.900 4.968 4.875 4.889 4.902<br />
Ca<strong>la</strong>sparra......................................... 5.395 5.189 5.274 4.194 4.239 5.225 5.365 5.439<br />
Campos <strong>de</strong>l Río................................. 968 979 974 987 1.000 1.076 1.096 1.108<br />
Caravaca <strong>de</strong> <strong>la</strong> Cruz.......................... 10.575 10.615 10.881 10.905 10.984 11.212 11.458 11.583<br />
Cartagena.......................................... 57.336 57.391 57.476 57.917 58.557 58.395 58.710 59.145<br />
Cehegín............................................. 8.868 9.065 9.194 9.116 9.820 8.156 8.328 8.452<br />
Ceutí.................................................. 2.114 2.145 2.160 2.141 2.176 2.092 2.141 2.183<br />
Cieza ................................................. 12.141 12.174 12.174 12.373 12.405 12.131 12.731 12.916<br />
Fortuna .............................................. 3.227 3.274 3.281 3.319 3.370 3.249 3.329 3.387<br />
Fuente Á<strong>la</strong>mo .................................... 4.836 4.851 4.880 4.967 5.008 4.851 4.952 5.001<br />
Jumil<strong>la</strong> ............................................... 10.864 10.980 11.080 11.180 11.269 10.740 10.995 11.137<br />
Libril<strong>la</strong>................................................ 1.572 1.607 1.558 1.588 1.588 1.455 1.448 1.495<br />
Lorca ................................................. 35.861 35.861 36.167 36.205 36.404 37.117 37.587 38.221<br />
Lorquí ................................................ 1.843 1.838 1.861 1.879 1.898 1.871 1.892 1.901<br />
Mazarrón ........................................... 6.126 5.974 5.922 5.807 5.595 4.626 4.679 4.688<br />
Molina <strong>de</strong> Segura .............................. 7.068 7.125 7.158 7.239 7.360 7.391 7.466 7.540<br />
Moratal<strong>la</strong>............................................ 7.374 7.444 7.480 7.540 7.630 7.532 7.665 7.765<br />
Mu<strong>la</strong>................................................... 7.280 7.670 7.730 7.804 7.941 7.048 7.141 7.272<br />
Murcia................................................ 99.878 102.279 103.957 104.772 106.067 104.984 106.067 108.421<br />
Ojós ................................................... 705 696 697 643 647 657 617 612<br />
Pliego ................................................ 1.340 1.358 1.385 1.415 1.477 1.492 1.531 1.577<br />
Puerto Lumbreras.............................. .. .. .. .. .. .. .. ..<br />
Ricote ................................................ 1.479 1.501 1.514 1.539 1.559 1.493 1.494 1.493<br />
San Javier ......................................... 3.420 3.458 3.475 3.492 3.529 3.683 3.729 3.802<br />
San Pedro <strong>de</strong> Pinatar ........................ 2.217 2.250 2.286 2.361 2.409 2.342 2.415 2.463<br />
Santomera......................................... .. .. .. .. .. .. .. ..<br />
Torre Pacheco................................... 4.882 4.917 4.944 5.025 5.030 4.722 4.772 4.867<br />
Torres <strong>de</strong> Cotil<strong>la</strong>s (Las) ..................... 2.467 2.480 2.493 2.529 2.588 2.576 2.654 2.719<br />
Totana ............................................... 7.317 7.387 7.717 7.777 7.949 8.206 8.188 8.196<br />
Ulea ................................................... 790 799 813 826 844 857 851 842<br />
Unión (La).......................................... 5.429 5.465 5.443 5.442 5.487 5.437 5.514 5.586<br />
Vil<strong>la</strong>nueva <strong>de</strong>l Río Segura................. 799 808 806 786 796 783 784 835<br />
Yec<strong>la</strong> ................................................. 11.812 11.805 11.930 12.059 12.155 12.200 12.285 12.320<br />
Estadísticas Históricas <strong>de</strong> Pob<strong>la</strong>ción <strong>de</strong> <strong>la</strong> Región <strong>de</strong> Murcia. 63
Censos <strong>de</strong> Pob<strong>la</strong>ción. Datos Municipales.<br />
2.3.3. EVOLUCIÓN DE LA POBLACIÓN DE DERECHO SEGÚN RECTIFICACIONES DEL PADRÓN<br />
MUNICIPAL DE HABITANTES. 1940-1995. MUJERES. (Continúa)<br />
MUNICIPIOS 1948 1949 1950 (1) 1951 1952 1953 1954 1955<br />
TOTAL ............................................... 397.999 404.236 388.574 394.380 399.938 404.178 408.215 401.565<br />
Abanil<strong>la</strong>.............................................. 4.516 4.558 4.499 4.507 4.526 4.525 4.566 4.537<br />
Abarán ............................................... 4.391 4.473 4.401 4.436 4.481 4.539 4.586 4.458<br />
Agui<strong>la</strong>s............................................... 8.247 8.358 7.940 8.052 8.154 8.293 8.425 8.025<br />
Albu<strong>de</strong>ite............................................ 866 881 852 876 892 908 925 882<br />
Alcantaril<strong>la</strong> ......................................... 6.622 6.660 6.950 6.926 6.971 6.985 6.989 7.959<br />
Alcázares (Los).................................. .. .. .. .. .. .. .. ..<br />
Aledo ................................................. 702 715 717 717 723 721 725 688<br />
Alguazas............................................ 2.195 2.198 2.165 2.185 2.291 2.310 2.329 2.176<br />
Alhama <strong>de</strong> Murcia.............................. 5.835 5.888 5.825 5.953 6.009 6.074 6.121 5.988<br />
Archena ............................................. 4.051 4.025 3.880 3.910 4.004 4.061 4.093 4.037<br />
Beniel................................................. 2.202 2.202 2.246 2.238 2.230 2.240 2.274 2.260<br />
B<strong>la</strong>nca................................................ 2.963 3.007 2.968 2.998 3.034 3.068 3.109 3.149<br />
Bul<strong>la</strong>s................................................. 4.923 5.079 4.912 4.952 4.987 5.055 5.097 4.617<br />
Ca<strong>la</strong>sparra ......................................... 5.734 5.722 5.259 5.305 5.420 5.551 5.642 5.395<br />
Campos <strong>de</strong>l Río................................. 1.123 1.151 1.168 1.150 1.163 1.166 1.184 1.179<br />
Caravaca <strong>de</strong> <strong>la</strong> Cruz.......................... 11.675 12.244 10.907 11.080 11.376 11.457 11.470 10.711<br />
Cartagena.......................................... 59.938 60.399 57.705 58.321 58.757 59.577 60.180 59.751<br />
Cehegín ............................................. 8.631 8.664 7.863 7.955 8.066 8.230 8.288 7.717<br />
Ceutí .................................................. 2.228 2.252 1.977 1.995 2.035 2.064 2.114 2.020<br />
Cieza.................................................. 13.468 13.727 12.224 12.368 12.535 12.711 12.889 12.012<br />
Fortuna .............................................. 3.448 3.489 3.023 3.097 3.137 3.184 3.232 3.029<br />
Fuente Á<strong>la</strong>mo .................................... 5.020 5.058 4.973 5.009 5.043 5.088 5.087 4.745<br />
Jumil<strong>la</strong> ............................................... 11.287 11.379 10.629 10.799 10.914 10.972 11.081 11.337<br />
Libril<strong>la</strong> ................................................ 1.520 1.499 1.561 1.552 1.560 1.583 1.599 1.579<br />
Lorca.................................................. 39.469 40.078 36.516 37.079 37.444 37.453 37.333 34.922<br />
Lorquí ................................................ 1.920 1.927 1.646 1.661 1.684 1.715 1.737 1.757<br />
Mazarrón............................................ 4.712 4.800 4.871 4.892 5.043 5.114 5.147 4.826<br />
Molina <strong>de</strong> Segura............................... 7.651 7.778 7.665 7.701 7.762 7.812 7.884 7.760<br />
Moratal<strong>la</strong>............................................ 7.862 7.944 6.896 7.017 7.131 7.222 7.307 6.938<br />
Mu<strong>la</strong>................................................... 7.376 7.581 7.537 7.653 7.743 7.806 7.861 7.572<br />
Murcia................................................ 111.533 113.967 113.136 115.941 118.322 119.787 121.439 123.504<br />
Ojós ................................................... 609 612 604 605 610 621 631 610<br />
Pliego................................................. 1.593 1.617 1.679 1.707 1.738 1.742 1.753 1.628<br />
Puerto Lumbreras.............................. .. .. .. .. .. .. .. ..<br />
Ricote ................................................ 1.496 1.531 1.482 1.498 1.513 1.535 1.544 1.471<br />
San Javier.......................................... 3.949 4.213 4.416 4.481 4.449 4.532 4.585 4.400<br />
San Pedro <strong>de</strong> Pinatar ........................ 2.524 2.577 2.604 2.634 2.679 2.630 2.624 2.633<br />
Santomera ......................................... .. .. .. .. .. .. .. ..<br />
Torre Pacheco ................................... 4.954 5.017 5.172 5.219 5.273 5.302 5.293 5.241<br />
Torres <strong>de</strong> Cotil<strong>la</strong>s (Las) ..................... 2.750 2.744 2.723 2.747 2.788 2.801 2.844 2.797<br />
Totana................................................ 8.243 8.204 7.525 7.535 7.638 7.677 7.693 7.442<br />
Ulea ................................................... 861 865 812 813 823 843 868 828<br />
Unión (La).......................................... 5.626 5.679 5.317 5.380 5.461 5.637 5.879 5.398<br />
Vil<strong>la</strong>nueva <strong>de</strong>l Río Segura ................. 851 859 809 819 818 830 841 864<br />
Yec<strong>la</strong>.................................................. 12.435 12.615 12.520 12.617 12.711 12.757 12.947 12.723<br />
64 Estadísticas Históricas <strong>de</strong> Pob<strong>la</strong>ción <strong>de</strong> <strong>la</strong> Región <strong>de</strong> Murcia.
Censos <strong>de</strong> Pob<strong>la</strong>ción. Datos Municipales.<br />
2.3.3. EVOLUCIÓN DE LA POBLACIÓN DE DERECHO SEGÚN RECTIFICACIONES DEL PADRÓN<br />
MUNICIPAL DE HABITANTES. 1940-1995. MUJERES. (Continúa)<br />
MUNICIPIOS 1956 1957 1958 1959 1960 (1) 1961 1962 1963<br />
TOTAL............................................... 406.055 411.095 416.508 421.106 409.993 415.918 422.116 427.872<br />
Abanil<strong>la</strong>.............................................. 4.546 4.568 4.576 4.585 4.470 4.488 4.461 4.480<br />
Abarán............................................... 4.532 4.569 4.659 4.752 4.601 4.710 4.814 5.206<br />
Agui<strong>la</strong>s............................................... 8.090 8.294 8.489 8.553 7.982 8.160 8.274 8.446<br />
Albu<strong>de</strong>ite ........................................... 893 915 938 954 916 927 951 973<br />
Alcantaril<strong>la</strong>......................................... 8.083 8.119 8.234 8.371 8.303 8.350 8.476 8.603<br />
Alcázares (Los) ................................. .. .. .. .. .. .. .. ..<br />
Aledo ................................................. 702 703 693 690 630 636 646 675<br />
Alguazas............................................ 2.199 2.210 2.228 2.248 2.564 2.595 2.601 2.616<br />
Alhama <strong>de</strong> Murcia ............................. 6.100 6.097 6.141 6.180 5.978 6.059 6.099 6.133<br />
Archena ............................................. 4.177 4.211 4.309 4.404 4.482 4.561 4.619 4.691<br />
Beniel ................................................ 2.270 2.293 2.321 2.348 2.308 2.354 2.378 2.416<br />
B<strong>la</strong>nca ............................................... 3.176 3.206 3.251 3.281 3.204 3.238 3.243 3.263<br />
Bul<strong>la</strong>s................................................. 4.708 4.777 4.892 4.959 4.767 4.877 4.933 5.038<br />
Ca<strong>la</strong>sparra......................................... 5.460 5.582 5.727 5.724 4.898 5.006 5.063 5.183<br />
Campos <strong>de</strong>l Río................................. 1.184 1.195 1.217 1.234 1.131 1.155 1.152 1.168<br />
Caravaca <strong>de</strong> <strong>la</strong> Cruz.......................... 10.779 10.873 11.122 11.339 10.515 10.610 10.879 10.886<br />
Cartagena.......................................... 60.588 61.428 62.570 63.159 62.473 63.530 64.804 65.894<br />
Cehegín............................................. 7.798 7.837 8.181 8.312 8.020 8.184 8.269 8.308<br />
Ceutí.................................................. 2.054 2.107 2.149 2.201 2.298 2.341 2.369 2.385<br />
Cieza ................................................. 12.168 12.385 12.611 12.810 11.600 11.770 12.158 12.435<br />
Fortuna .............................................. 3.073 3.131 3.172 3.193 2.878 2.933 2.965 2.989<br />
Fuente Á<strong>la</strong>mo .................................... 4.784 4.813 4.849 4.899 4.849 4.900 4.901 4.954<br />
Jumil<strong>la</strong> ............................................... 11.450 11.320 11.648 11.809 11.026 11.213 11.447 11.597<br />
Libril<strong>la</strong>................................................ 1.595 1.613 1.631 1.647 1.569 1.591 1.613 1.628<br />
Lorca ................................................. 35.382 35.917 32.485 32.522 30.218 30.848 31.339 31.941<br />
Lorquí ................................................ 1.787 1.814 1.831 1.883 2.094 2.142 2.170 2.205<br />
Mazarrón ........................................... 4.930 4.968 4.989 5.032 5.067 5.078 5.053 5.103<br />
Molina <strong>de</strong> Segura .............................. 7.864 7.930 8.086 8.249 8.384 8.522 8.658 8.787<br />
Moratal<strong>la</strong>............................................ 7.019 7.095 7.183 7.192 6.869 6.884 6.928 6.902<br />
Mu<strong>la</strong>................................................... 7.652 7.748 7.841 7.986 7.489 7.585 7.667 7.741<br />
Murcia................................................ 124.392 126.141 126.714 127.784 129.066 130.660 132.530 133.685<br />
Ojós ................................................... 621 641 650 662 611 613 615 639<br />
Pliego ................................................ 1.646 1.663 1.675 1.679 1.737 1.765 1.791 1.822<br />
Puerto Lumbreras.............................. .. .. 4.026 4.063 3.718 3.760 3.796 3.869<br />
Ricote ................................................ 1.492 1.509 1.513 1.513 1.424 1.441 1.446 1.455<br />
San Javier ......................................... 4.464 4.562 4.648 4.690 4.744 4.841 4.901 4.945<br />
San Pedro <strong>de</strong> Pinatar ........................ 2.665 2.702 2.774 2.824 2.784 2.833 2.863 2.923<br />
Santomera......................................... .. .. .. .. .. .. .. ..<br />
Torre Pacheco................................... 5.302 5.377 5.463 5.536 5.509 5.576 5.660 5.723<br />
Torres <strong>de</strong> Cotil<strong>la</strong>s (Las) ..................... 2.849 2.874 2.888 2.919 3.055 3.111 3.158 3.225<br />
Totana ............................................... 7.566 7.664 7.734 7.828 7.438 7.516 7.573 7.627<br />
Ulea ................................................... 832 850 852 857 778 776 775 794<br />
Unión (La).......................................... 5.618 5.747 5.815 6.476 5.891 6.011 6.192 6.388<br />
Vil<strong>la</strong>nueva <strong>de</strong>l Río Segura................. 868 871 888 895 882 882 885 894<br />
Yec<strong>la</strong> ................................................. 12.697 12.776 12.845 12.864 10.773 10.886 11.001 11.237<br />
Estadísticas Históricas <strong>de</strong> Pob<strong>la</strong>ción <strong>de</strong> <strong>la</strong> Región <strong>de</strong> Murcia. 65
Censos <strong>de</strong> Pob<strong>la</strong>ción. Datos Municipales.<br />
2.3.3. EVOLUCIÓN DE LA POBLACIÓN DE DERECHO SEGÚN RECTIFICACIONES DEL PADRÓN<br />
MUNICIPAL DE HABITANTES. 1940-1995. MUJERES. (Continúa)<br />
MUNICIPIOS 1964 1965 1966 1967 1968 1969 1970 (1) 1971<br />
TOTAL ............................................... 429.187 411.610 427.364 433.200 439.121 445.927 424.434 430.865<br />
Abanil<strong>la</strong>.............................................. 4.459 4.470 4.470 4.472 4.470 4.481 4.406 4.401<br />
Abarán ............................................... 5.284 4.972 5.272 5.348 5.430 5.526 5.236 5.329<br />
Agui<strong>la</strong>s............................................... 8.581 8.319 8.695 8.812 8.814 8.961 8.791 8.910<br />
Albu<strong>de</strong>ite............................................ 990 876 892 901 878 892 864 869<br />
Alcantaril<strong>la</strong> ......................................... 8.710 8.561 9.178 9.302 9.517 9.688 10.426 10.604<br />
Alcázares (Los).................................. .. .. .. .. .. .. .. ..<br />
Aledo ................................................. 683 622 627 640 632 635 554 556<br />
Alguazas............................................ 2.666 2.428 2.457 2.485 2.506 2.530 2.491 2.510<br />
Alhama <strong>de</strong> Murcia.............................. 6.251 5.971 6.032 6.108 6.173 6.240 5.927 5.986<br />
Archena ............................................. 4.748 4.766 4.998 5.058 5.138 5.274 5.155 5.212<br />
Beniel................................................. 2.451 2.284 2.334 2.371 2.427 2.497 2.546 2.571<br />
B<strong>la</strong>nca................................................ 3.307 3.154 3.208 3.247 3.281 3.318 3.206 3.238<br />
Bul<strong>la</strong>s................................................. 5.117 4.433 4.631 4.687 4.746 4.796 4.542 4.591<br />
Ca<strong>la</strong>sparra ......................................... 5.268 4.227 4.342 4.433 4.506 4.573 4.255 4.292<br />
Campos <strong>de</strong>l Río................................. 1.180 1.026 1.035 1.041 1.062 1.080 1.029 1.038<br />
Caravaca <strong>de</strong> <strong>la</strong> Cruz.......................... 10.883 9.151 10.037 10.125 10.336 10.521 9.377 10.100<br />
Cartagena.......................................... 65.426 64.523 67.359 69.104 70.669 72.245 73.027 74.189<br />
Cehegín ............................................. 8.244 6.542 7.313 7.371 7.434 7.436 6.388 6.441<br />
Ceutí .................................................. 2.436 2.488 2.550 2.596 2.642 2.663 2.676 2.729<br />
Cieza.................................................. 12.721 11.822 13.186 13.554 13.725 13.939 13.385 13.577<br />
Fortuna .............................................. 3.022 2.802 2.873 2.910 2.973 3.004 2.848 2.874<br />
Fuente Á<strong>la</strong>mo .................................... 4.985 4.493 4.619 4.707 4.743 4.759 4.496 4.527<br />
Jumil<strong>la</strong> ............................................... 11.593 10.205 10.320 10.276 10.293 10.321 10.196 10.218<br />
Libril<strong>la</strong> ................................................ 1.678 1.571 1.613 1.645 1.675 1.701 1.611 1.631<br />
Lorca.................................................. 32.304 29.799 31.295 31.717 32.188 32.621 30.508 31.088<br />
Lorquí ................................................ 2.257 2.100 2.123 2.142 2.192 2.212 2.153 2.179<br />
Mazarrón............................................ 5.134 4.209 4.643 4.720 4.750 4.757 4.651 4.676<br />
Molina <strong>de</strong> Segura............................... 8.965 9.767 10.794 11.551 11.941 12.336 12.061 12.226<br />
Moratal<strong>la</strong>............................................ 7.115 5.681 6.076 6.061 6.041 6.043 5.207 5.229<br />
Mu<strong>la</strong>................................................... 7.807 7.474 7.559 7.620 7.721 7.804 7.176 7.160<br />
Murcia................................................ 132.750 133.154 135.021 135.833 138.183 140.329 125.732 127.960<br />
Ojós ................................................... 646 539 540 546 542 541 454 458<br />
Pliego................................................. 1.815 1.663 1.710 1.725 1.757 1.791 1.754 1.765<br />
Puerto Lumbreras.............................. 3.932 3.447 3.481 3.528 3.573 3.609 4.084 4.102<br />
Ricote ................................................ 1.447 1.314 1.329 1.319 1.315 1.316 1.220 1.221<br />
San Javier.......................................... 4.988 4.783 4.982 4.978 5.062 5.149 5.196 5.274<br />
San Pedro <strong>de</strong> Pinatar ........................ 3.011 2.965 3.201 3.273 3.308 3.380 3.295 3.350<br />
Santomera ......................................... .. .. .. .. .. .. .. ..<br />
Torre Pacheco ................................... 5.797 5.851 6.039 6.183 6.358 6.505 6.430 6.533<br />
Torres <strong>de</strong> Cotil<strong>la</strong>s (Las) ..................... 3.257 3.298 3.371 3.410 3.478 3.531 3.706 3.748<br />
Totana................................................ 7.689 7.289 7.901 7.970 7.031 7.087 8.296 8.348<br />
Ulea ................................................... 806 773 767 778 798 811 751 753<br />
Unión (La).......................................... 6.437 6.465 6.629 6.617 6.663 6.684 6.739 6.735<br />
Vil<strong>la</strong>nueva <strong>de</strong>l Río Segura ................. 914 958 970 969 975 973 966 966<br />
Yec<strong>la</strong>.................................................. 11.433 10.375 10.892 11.067 11.175 11.368 10.623 10.701<br />
66 Estadísticas Históricas <strong>de</strong> Pob<strong>la</strong>ción <strong>de</strong> <strong>la</strong> Región <strong>de</strong> Murcia.
Censos <strong>de</strong> Pob<strong>la</strong>ción. Datos Municipales.<br />
2.3.3. EVOLUCIÓN DE LA POBLACIÓN DE DERECHO SEGÚN RECTIFICACIONES DEL PADRÓN<br />
MUNICIPAL DE HABITANTES. 1940-1995. MUJERES. (Continúa)<br />
MUNICIPIOS 1972 1973 1974 1975 1976 1977 1978 1979 (2)<br />
TOTAL............................................... 438.995 445.681 452.610 449.847 464.930 478.212 487.020 484.834<br />
Abanil<strong>la</strong>.............................................. 4.365 4.358 4.358 4.385 4.415 4.469 4.496 4.487<br />
Abarán............................................... 5.383 5.489 5.607 5.416 5.587 5.678 5.776 5.845<br />
Agui<strong>la</strong>s............................................... 9.058 9.278 9.358 9.653 9.960 10.252 10.437 10.628<br />
Albu<strong>de</strong>ite ........................................... 875 891 900 842 853 855 862 875<br />
Alcantaril<strong>la</strong>......................................... 10.706 10.864 11.085 11.333 11.898 12.317 12.613 12.787<br />
Alcázares (Los) ................................. .. .. .. .. .. .. .. ..<br />
Aledo ................................................. 566 559 559 559 571 575 560 564<br />
Alguazas............................................ 2.553 2.589 2.628 2.686 2.766 2.825 2.872 2.951<br />
Alhama <strong>de</strong> Murcia ............................. 6.117 6.205 6.277 6.139 6.380 6.509 6.585 6.708<br />
Archena ............................................. 5.291 5.389 5.506 5.620 5.927 6.052 6.184 6.296<br />
Beniel ................................................ 2.598 2.638 2.661 2.711 2.761 2.807 2.875 2.931<br />
B<strong>la</strong>nca ............................................... 3.261 3.295 3.311 3.435 3.454 3.493 3.525 3.515<br />
Bul<strong>la</strong>s................................................. 4.611 4.655 4.696 4.686 4.784 4.846 4.929 4.982<br />
Ca<strong>la</strong>sparra......................................... 4.301 4.297 4.301 4.158 4.221 4.265 4.307 4.335<br />
Campos <strong>de</strong>l Río................................. 1.045 1.033 1.033 1.041 1.032 1.021 1.035 1.040<br />
Caravaca <strong>de</strong> <strong>la</strong> Cruz.......................... 10.168 10.177 10.236 10.155 10.399 10.638 10.821 10.961<br />
Cartagena.......................................... 75.299 76.036 77.102 79.073 80.802 82.652 84.038 85.283<br />
Cehegín............................................. 6.525 6.568 6.597 6.236 6.705 6.830 6.977 7.110<br />
Ceutí.................................................. 2.771 2.789 2.840 2.692 2.774 2.815 2.854 2.911<br />
Cieza ................................................. 13.860 14.153 14.502 15.070 15.124 15.545 15.741 15.903<br />
Fortuna .............................................. 2.905 2.920 2.931 2.841 2.908 2.959 2.992 3.023<br />
Fuente Á<strong>la</strong>mo .................................... 4.526 4.512 4.526 4.391 4.435 4.483 4.507 4.500<br />
Jumil<strong>la</strong> ............................................... 10.274 10.294 10.354 10.240 10.412 10.516 10.576 10.671<br />
Libril<strong>la</strong>................................................ 1.683 1.724 1.715 1.703 1.748 1.771 1.792 1.835<br />
Lorca ................................................. 31.650 32.141 32.567 30.070 31.887 32.738 33.260 33.789<br />
Lorquí ................................................ 2.216 2.247 2.265 2.285 2.331 2.387 2.432 2.491<br />
Mazarrón ........................................... 4.703 4.709 4.730 5.017 5.117 5.214 5.249 5.387<br />
Molina <strong>de</strong> Segura .............................. 12.443 12.840 13.289 13.070 13.779 14.487 14.997 15.474<br />
Moratal<strong>la</strong>............................................ 5.238 5.246 5.190 5.065 5.121 5.140 5.161 5.144<br />
Mu<strong>la</strong>................................................... 7.301 7.383 7.443 7.275 7.494 7.668 7.741 7.840<br />
Murcia................................................ 132.090 135.086 137.978 135.459 140.577 146.208 149.470 151.738<br />
Ojós ................................................... 461 463 472 470 466 455 452 458<br />
Pliego ................................................ 1.777 1.776 1.779 1.770 1.773 1.783 1.798 1.810<br />
Puerto Lumbreras.............................. 4.147 4.137 4.167 4.055 4.180 4.308 4.370 4.464<br />
Ricote ................................................ 1.212 1.183 1.172 1.226 1.235 1.229 1.216 1.193<br />
San Javier ......................................... 5.356 5.472 5.525 5.412 5.686 5.900 6.037 6.104<br />
San Pedro <strong>de</strong> Pinatar ........................ 3.427 3.542 3.639 3.752 3.997 4.181 4.265 ..<br />
Santomera......................................... .. .. .. .. .. .. .. ..<br />
Torre Pacheco................................... 6.637 6.749 6.824 6.476 7.001 7.230 7.429 7.590<br />
Torres <strong>de</strong> Cotil<strong>la</strong>s (Las) ..................... 3.806 3.929 4.134 4.601 4.758 4.948 5.127 ..<br />
Totana ............................................... 8.435 8.508 8.626 8.573 8.947 9.171 9.360 9.461<br />
Ulea ................................................... 754 762 749 759 763 761 765 759<br />
Unión (La).......................................... 6.748 6.749 6.739 6.573 6.774 6.912 6.996 7.160<br />
Vil<strong>la</strong>nueva <strong>de</strong>l Río Segura................. 960 955 963 988 1.011 1.023 1.037 1.045<br />
Yec<strong>la</strong> ................................................. 10.893 11.091 11.276 11.886 12.117 12.296 12.504 12.786<br />
(2) Para 1979 no se dispone <strong>de</strong> <strong>la</strong>s pob<strong>la</strong>ciones <strong>de</strong> San Pedro <strong>de</strong>l Pinatar y <strong>la</strong>s Torres <strong>de</strong> Cotil<strong>la</strong>s <strong>de</strong>sagregadas por sexo.<br />
Estadísticas Históricas <strong>de</strong> Pob<strong>la</strong>ción <strong>de</strong> <strong>la</strong> Región <strong>de</strong> Murcia. 67
Censos <strong>de</strong> Pob<strong>la</strong>ción. Datos Municipales.<br />
2.3.3. EVOLUCIÓN DE LA POBLACIÓN DE DERECHO SEGÚN RECTIFICACIONES DEL PADRÓN<br />
MUNICIPAL DE HABITANTES 1940-1995. MUJERES. (Continúa)<br />
MUNICIPIOS 1981 (1) 1982 1983 1984 1985 1986 1987<br />
TOTAL ................................................. 486.148 493.551 507.476 513.842 520.162 511.009 514.051<br />
Abanil<strong>la</strong>................................................ 3.622 3.631 3.684 3.700 3.724 3.553 3.570<br />
Abarán ................................................. 5.645 5.724 5.883 5.930 6.002 5.877 5.886<br />
Agui<strong>la</strong>s................................................. 10.558 10.780 11.039 11.182 11.386 11.471 11.585<br />
Albu<strong>de</strong>ite.............................................. 837 846 865 875 879 769 773<br />
Alcantaril<strong>la</strong> ........................................... 12.697 12.927 13.361 13.568 13.722 13.912 14.129<br />
Alcázares (Los).................................... .. .. .. .. 1.279 1.483 1.525<br />
Aledo ................................................... 546 548 551 553 541 523 519<br />
Alguazas.............................................. 2.934 2.979 3.117 3.171 3.207 3.275 3.305<br />
Alhama <strong>de</strong> Murcia................................ 6.677 6.761 6.919 7.016 7.125 7.050 7.089<br />
Archena ............................................... 6.028 6.103 6.436 6.522 6.595 6.562 6.657<br />
Beniel................................................... 3.062 3.117 3.148 3.206 3.284 3.197 3.251<br />
B<strong>la</strong>nca.................................................. 3.391 3.399 3.439 3.462 3.495 3.134 3.142<br />
Bul<strong>la</strong>s................................................... 4.818 4.895 4.991 5.028 5.037 4.999 5.042<br />
Ca<strong>la</strong>sparra ........................................... 4.312 4.344 4.430 4.463 4.511 4.436 4.450<br />
Campos <strong>de</strong>l Río................................... 1.019 1.038 1.053 1.084 1.109 1.032 1.034<br />
Caravaca <strong>de</strong> <strong>la</strong> Cruz............................ 10.337 10.394 10.611 10.717 10.808 11.433 10.992<br />
Cartagena............................................ 85.351 86.331 87.540 88.432 89.121 85.484 85.712<br />
Cehegín ............................................... 6.863 6.978 7.272 7.384 7.508 7.538 7.588<br />
Ceutí .................................................... 2.809 2.860 2.916 2.959 2.995 2.913 2.979<br />
Cieza.................................................... 15.564 15.754 15.988 16.109 16.171 15.469 15.580<br />
Fortuna ................................................ 2.903 2.954 3.016 3.059 3.090 3.021 3.040<br />
Fuente Á<strong>la</strong>mo ...................................... 4.252 4.305 4.365 4.417 4.426 4.368 4.386<br />
Jumil<strong>la</strong> ................................................. 10.386 10.447 10.610 10.642 10.714 10.404 10.457<br />
Libril<strong>la</strong> .................................................. 1.792 1.805 1.822 1.825 1.852 1.890 1.892<br />
Lorca.................................................... 31.412 31.735 32.679 33.089 33.367 33.257 33.292<br />
Lorquí .................................................. 2.552 2.594 2.636 2.676 2.716 2.635 2.657<br />
Mazarrón.............................................. 5.123 5.209 5.474 5.600 5.850 6.564 6.619<br />
Molina <strong>de</strong> Segura................................. 15.983 16.549 17.257 17.642 18.052 17.631 17.875<br />
Moratal<strong>la</strong>.............................................. 4.615 4.664 4.699 4.714 5.003 4.983 5.004<br />
Mu<strong>la</strong>..................................................... 7.385 7.511 7.757 7.803 7.812 6.562 6.582<br />
Murcia.................................................. 146.561 149.156 154.926 156.948 159.136 155.579 156.823<br />
Ojós ..................................................... 340 348 348 345 339 335 335<br />
Pliego................................................... 1.688 1.716 1.732 1.748 1.761 1.713 1.720<br />
Puerto Lumbreras................................ 4.370 4.431 4.519 4.587 4.684 4.831 4.866<br />
Ricote .................................................. 921 928 969 965 952 913 814<br />
San Javier............................................ 6.290 6.389 6.656 6.789 6.442 6.708 6.907<br />
San Pedro <strong>de</strong> Pinatar .......................... 4.493 4.554 4.870 5.001 5.145 5.518 5.624<br />
Santomera ........................................... 3.636 3.686 3.732 3.787 3.831 3.887 3.910<br />
Torre Pacheco ..................................... 7.765 7.851 7.996 8.080 7.368 7.680 7.758<br />
Torres <strong>de</strong> Cotil<strong>la</strong>s (Las) ....................... 5.713 5.896 6.116 6.297 6.374 6.389 6.462<br />
Totana.................................................. 9.354 9.535 9.768 9.864 9.955 9.894 9.963<br />
Ulea ..................................................... 607 613 617 617 612 557 557<br />
Unión (La)............................................ 7.279 7.438 7.626 7.710 7.750 7.376 7.413<br />
Vil<strong>la</strong>nueva <strong>de</strong>l Río Segura ................... 881 913 937 1.015 1.074 868 868<br />
Yec<strong>la</strong>.................................................... 12.777 12.915 13.106 13.261 13.358 13.336 13.419<br />
68 Estadísticas Históricas <strong>de</strong> Pob<strong>la</strong>ción <strong>de</strong> <strong>la</strong> Región <strong>de</strong> Murcia.
Censos <strong>de</strong> Pob<strong>la</strong>ción. Datos Municipales.<br />
2.3.3. EVOLUCIÓN DE LA POBLACIÓN DE DERECHO SEGÚN RECTIFICACIONES DEL PADRÓN<br />
MUNICIPAL DE HABITANTES. 1940-1995. MUJERES. (Conclusión)<br />
MUNICIPIOS 1988 1989 1990 1991 (1) 1992 1993 1994 1995<br />
TOTAL.................................................. 525.445 531.573 538.431 531.074 534.333 547.818 556.950 561.792<br />
Abanil<strong>la</strong>................................................. 3.557 3.579 3.563 3.085 3.089 3.162 3.197 3.177<br />
Abarán.................................................. 5.981 6.012 6.037 5.986 6.001 6.055 6.101 6.099<br />
Agui<strong>la</strong>s.................................................. 11.951 12.142 12.398 12.453 12.532 12.758 12.969 13.087<br />
Albu<strong>de</strong>ite .............................................. 776 779 775 704 696 703 709 693<br />
Alcantaril<strong>la</strong>............................................ 14.512 14.997 15.411 15.516 15.688 16.069 16.278 16.552<br />
Alcázares (Los) .................................... 1.764 1.874 1.973 1.891 1.958 2.147 2.275 2.435<br />
Aledo .................................................... 515 516 513 473 474 476 483 487<br />
Alguazas............................................... 3.374 3.419 3.459 3.501 3.513 3.558 3.580 3.580<br />
Alhama <strong>de</strong> Murcia ................................ 7.185 7.240 7.320 7.189 7.259 7.392 7.492 7.569<br />
Archena ................................................ 6.723 6.789 6.836 6.783 6.808 7.016 7.076 7.070<br />
Beniel ................................................... 3.364 3.442 3.545 3.629 3.693 3.788 3.851 3.951<br />
B<strong>la</strong>nca .................................................. 3.146 3.156 3.150 2.953 2.970 2.962 2.952 2.943<br />
Bul<strong>la</strong>s.................................................... 5.085 5.113 5.143 4.964 5.009 5.095 5.155 5.223<br />
Ca<strong>la</strong>sparra............................................ 4.440 4.452 4.451 4.373 4.403 4.471 4.497 4.487<br />
Campos <strong>de</strong>l Río.................................... 1.038 1.041 1.045 985 998 1.021 1.023 1.040<br />
Caravaca <strong>de</strong> <strong>la</strong> Cruz............................. 11.649 11.653 11.740 10.745 10.788 10.904 10.965 11.048<br />
Cartagena............................................. 87.531 88.037 89.031 85.143 85.536 88.786 90.538 91.082<br />
Cehegín................................................ 7.629 7.628 7.676 6.835 6.864 6.993 7.069 7.102<br />
Ceutí..................................................... 3.046 3.098 3.171 3.185 3.245 3.334 3.384 3.417<br />
Cieza .................................................... 15.795 15.899 15.998 15.808 16.155 16.353 16.481 16.478<br />
Fortuna ................................................. 3.093 3.081 3.112 2.975 3.010 3.070 3.071 3.138<br />
Fuente Á<strong>la</strong>mo ....................................... 4.452 4.459 4.512 4.159 4.166 4.455 4.544 4.598<br />
Jumil<strong>la</strong> .................................................. 10.545 10.532 10.621 10.125 10.191 10.369 10.479 10.502<br />
Libril<strong>la</strong>................................................... 1.899 1.904 1.915 1.929 1.929 1.920 1.941 1.970<br />
Lorca .................................................... 33.689 33.885 34.115 33.442 33.713 34.674 35.081 35.195<br />
Lorquí ................................................... 2.683 2.705 2.721 2.703 2.739 2.783 2.794 2.795<br />
Mazarrón .............................................. 6.842 6.982 7.110 7.271 7.340 7.537 7.693 7.817<br />
Molina <strong>de</strong> Segura ................................. 18.408 18.815 19.294 19.211 19.700 20.396 20.837 21.021<br />
Moratal<strong>la</strong>............................................... 4.999 5.017 4.988 4.431 4.399 4.438 4.425 4.445<br />
Mu<strong>la</strong>...................................................... 6.670 6.710 6.752 6.564 6.618 6.746 6.799 6.882<br />
Murcia................................................... 161.233 163.583 165.727 168.646 168.586 171.904 175.272 176.983<br />
Ojós ...................................................... 335 328 331 345 340 319 312 314<br />
Pliego ................................................... 1.725 1.725 1.730 1.638 1.637 1.652 1.668 1.676<br />
Puerto Lumbreras................................. 4.870 4.901 4.964 5.117 5.179 5.294 5.345 5.390<br />
Ricote ................................................... 929 921 912 867 881 863 845 847<br />
San Javier ............................................ 7.231 7.455 7.761 7.392 7.515 8.109 8.471 8.709<br />
San Pedro <strong>de</strong> Pinatar ........................... 5.850 6.147 6.349 6.092 6.179 6.595 6.826 6.998<br />
Santomera............................................ 3.958 4.097 4.205 4.275 4.355 4.590 4.735 4.830<br />
Torre Pacheco...................................... 7.894 8.061 8.246 8.230 8.345 8.775 9.115 9.352<br />
Torres <strong>de</strong> Cotil<strong>la</strong>s (Las) ........................ 6.596 6.720 6.862 7.034 7.147 7.345 7.502 7.553<br />
Totana .................................................. 10.030 10.107 10.203 10.306 10.495 10.600 10.621 10.690<br />
Ulea ...................................................... 552 544 532 531 529 521 526 527<br />
Unión (La)............................................. 7.494 7.562 7.649 7.008 7.090 7.166 7.274 7.293<br />
Vil<strong>la</strong>nueva <strong>de</strong>l Río Segura.................... 852 859 869 825 819 824 810 810<br />
Yec<strong>la</strong> .................................................... 13.555 13.607 13.716 13.757 13.752 13.830 13.889 13.937<br />
Nota: Falta el año 1980, dado que hasta 1979 <strong>la</strong>s rectificaciones padronales se hacían el 31 <strong>de</strong> Diciembre, cambiando en 1981 al 1 <strong>de</strong> Marzo <strong>la</strong> fecha <strong>de</strong> referencia.<br />
(1) Datos <strong>de</strong> los Censos <strong>de</strong> Pob<strong>la</strong>ción.<br />
Fuente: Delegación Provincial <strong>de</strong>l INE en Murcia.<br />
Estadísticas Históricas <strong>de</strong> Pob<strong>la</strong>ción <strong>de</strong> <strong>la</strong> Región <strong>de</strong> Murcia. 69
Censos <strong>de</strong> Pob<strong>la</strong>ción. Datos Municipales.<br />
2.4.1. ESTRUCTURA POR SEXO Y GRUPOS DE EDAD DE LA POBLACIÓN DE HECHO SEGÚN EL<br />
CENSO DE 1900. AMBOS SEXOS. (Continúa)<br />
MUNICIPIOS TOTAL Menos<br />
<strong>de</strong> 5<br />
70 Estadísticas Históricas <strong>de</strong> Pob<strong>la</strong>ción <strong>de</strong> <strong>la</strong> Región <strong>de</strong> Murcia.<br />
EDAD<br />
5-10 11-15 16-20 21-25 26-30 31-35<br />
Águi<strong>la</strong>s............................................... 15.868 2.103 2.436 1.705 1.540 1.368 1.498 962<br />
Caravaca ........................................... 15.846 1.933 2.299 1.561 1.350 1.245 1.391 908<br />
Cartagena.......................................... 99.871 11.287 13.884 9.151 8.812 10.714 9.354 6.689<br />
Cehegín ............................................. 11.601 1.475 1.669 1.130 1.004 977 1.023 703<br />
Cieza.................................................. 13.626 1.551 1.976 1.432 1.175 969 1.227 871<br />
Jumil<strong>la</strong> ............................................... 16.446 2.089 2.391 1.650 1.227 1.254 1.339 1.044<br />
Lorca.................................................. 69.836 8.372 11.559 7.909 6.422 5.150 6.263 3.910<br />
Mazarrón............................................ 23.284 3.175 3.840 2.417 2.152 2.000 2.273 1.496<br />
Moratal<strong>la</strong>............................................ 12.689 1.112 1.860 1.361 1.207 1.024 992 847<br />
Mu<strong>la</strong>................................................... 12.731 1.765 1.983 1.355 1.130 919 1.089 793<br />
Murcia................................................ 111.539 14.326 17.746 11.807 10.066 8.604 9.237 6.373<br />
Totana................................................ 13.703 1.672 2.133 1.450 1.228 997 1.140 826<br />
Unión (La).......................................... 30.275 4.284 4.458 2.864 2.483 2.576 3.087 2.142<br />
Yec<strong>la</strong>.................................................. 18.743 2.725 2.456 1.840 1.444 1.465 1.625 1.207<br />
2.4.1. ESTRUCTURA POR SEXO Y GRUPOS DE EDAD DE LA POBLACIÓN DE HECHO SEGÚN EL<br />
CENSO DE 1900. AMBOS SEXOS. (Conclusión)<br />
MUNICIPIOS<br />
EDAD<br />
36-40 41-45 46-50 51-60 61-70 71-80 81 y más<br />
No<br />
consta<br />
Águi<strong>la</strong>s............................................... 1.027 668 811 987 515 194 54 -<br />
Caravaca ........................................... 1.141 744 996 1.276 735 203 64 -<br />
Cartagena.......................................... 8.217 5.036 5.336 6.612 3.394 1.136 249 -<br />
Cehegín ............................................. 780 606 648 814 488 234 50 -<br />
Cieza.................................................. 1.131 607 825 983 615 209 55 -<br />
Jumil<strong>la</strong> ............................................... 1.209 740 861 1.332 816 369 125 -<br />
Lorca.................................................. 5.074 2.850 3.543 4.763 2.852 962 207 -<br />
Mazarrón............................................ 1.746 941 975 1.339 676 208 46 -<br />
Moratal<strong>la</strong>............................................ 760 730 625 1.092 748 265 66 -<br />
Mu<strong>la</strong>................................................... 939 598 609 778 562 159 52 -<br />
Murcia................................................ 7.964 5.001 6.030 8.131 4.288 1.507 459 -<br />
Totana................................................ 982 638 653 1.008 693 231 52 -<br />
Unión (La).......................................... 2.442 1.470 1.669 1.717 789 221 73 -<br />
Yec<strong>la</strong>.................................................. 1.263 929 953 1.383 804 315 78 -<br />
Nota: Sólo hay datos para los municipios mayores <strong>de</strong> 10.000 habitantes.<br />
Fuente: INE. Censos <strong>de</strong> Pob<strong>la</strong>ción.
Censos <strong>de</strong> Pob<strong>la</strong>ción. Datos Municipales.<br />
2.4.2. ESTRUCTURA POR SEXO Y GRUPOS DE EDAD DE LA POBLACIÓN DE HECHO SEGÚN EL<br />
CENSO DE 1900. HOMBRES. (Continúa)<br />
MUNICIPIOS TOTAL Menos<br />
<strong>de</strong> 5<br />
Estadísticas Históricas <strong>de</strong> Pob<strong>la</strong>ción <strong>de</strong> <strong>la</strong> Región <strong>de</strong> Murcia.<br />
EDAD<br />
5-10 11-15 16-20 21-25 26-30 31-35<br />
Águi<strong>la</strong>s............................................... 7.859 1.069 1.209 879 747 665 749 518<br />
Caravaca ........................................... 7.860 947 1.172 757 602 626 705 480<br />
Cartagena.......................................... 50.898 5.584 7.087 4.653 4.112 6.469 4.726 3.394<br />
Cehegín............................................. 5.889 766 874 577 497 507 539 360<br />
Cieza ................................................. 6.738 792 1.018 705 538 458 611 458<br />
Jumil<strong>la</strong> ............................................... 8.435 1.116 1.277 821 570 632 709 542<br />
Lorca ................................................. 34.687 4.377 6.399 4.553 2.862 2.330 2.945 1.951<br />
Mazarrón ........................................... 11.715 1.634 1.939 1.236 1.051 942 1.201 812<br />
Moratal<strong>la</strong>............................................ 6.578 570 1.032 715 601 497 526 431<br />
Mu<strong>la</strong>................................................... 6.389 930 1.030 659 532 454 511 424<br />
Murcia................................................ 54.564 7.176 8.984 5.942 4.732 4.155 4.362 3.168<br />
Totana ............................................... 6.706 823 1.018 699 574 447 589 426<br />
Unión (La).......................................... 15.246 2.219 2.314 1.450 1.203 1.289 1.535 1.127<br />
Yec<strong>la</strong> ................................................. 9.450 1.323 1.393 942 707 739 801 639<br />
2.4.2. ESTRUCTURA POR SEXO Y GRUPOS DE EDAD DE LA POBLACIÓN DE HECHO SEGÚN EL<br />
CENSO DE 1900. HOMBRES. (Conclusión)<br />
MUNICIPIOS<br />
EDAD<br />
36-40 41-45 46-50 51-60 61-70 71-80 81 y más<br />
Águi<strong>la</strong>s............................................... 501 314 375 491 243 72 27 -<br />
Caravaca ........................................... 581 371 483 624 388 101 23 -<br />
Cartagena.......................................... 4.049 2.657 2.634 3.276 1.630 530 97 -<br />
Cehegín............................................. 385 312 332 391 232 98 19 -<br />
Cieza ................................................. 544 316 430 451 298 102 17 -<br />
Jumil<strong>la</strong> ............................................... 613 394 446 666 404 179 66 -<br />
Lorca ................................................. 2.269 1.336 1.599 2.208 1.334 442 82 -<br />
Mazarrón ........................................... 893 452 451 653 329 105 17 -<br />
Moratal<strong>la</strong>............................................ 369 359 333 566 393 147 39 -<br />
Mu<strong>la</strong>................................................... 449 322 313 375 285 79 26 -<br />
Murcia................................................ 3.750 2.441 2.879 3.925 2.156 699 195 -<br />
Totana ............................................... 479 338 330 477 349 129 28 -<br />
Unión (La).......................................... 1.255 789 812 806 358 73 16 -<br />
Yec<strong>la</strong> ................................................. 643 474 501 694 411 156 27 -<br />
Nota: Sólo hay datos para los municipios mayores <strong>de</strong> 10.000 habitantes.<br />
Fuente: INE. Censos <strong>de</strong> Pob<strong>la</strong>ción.<br />
No<br />
consta<br />
71
Censos <strong>de</strong> Pob<strong>la</strong>ción. Datos Municipales.<br />
2.4.3. ESTRUCTURA POR SEXO Y GRUPOS DE EDAD DE LA POBLACIÓN DE HECHO SEGÚN EL<br />
CENSO DE 1900. MUJERES. (Continúa)<br />
72<br />
MUNICIPIOS TOTAL Menos<br />
<strong>de</strong> 5<br />
EDAD<br />
5-10 11-15 16-20 21-25 26-30 31-35<br />
Águi<strong>la</strong>s............................................... 8.009 1.034 1.227 826 793 703 749 444<br />
Caravaca ........................................... 7.986 986 1.127 804 748 619 686 428<br />
Cartagena.......................................... 48.973 5.703 6.797 4.498 4.700 4.245 4.628 3.295<br />
Cehegín ............................................. 5.712 709 795 553 507 470 484 343<br />
Cieza.................................................. 6.888 759 958 727 637 511 616 413<br />
Jumil<strong>la</strong> ............................................... 8.011 973 1.114 829 657 622 630 502<br />
Lorca.................................................. 35.149 3.995 5.160 3.356 3.560 2.820 3.318 1.959<br />
Mazarrón............................................ 11.569 1.541 1.901 1.181 1.101 1.058 1.072 684<br />
Moratal<strong>la</strong>............................................ 6.111 542 828 646 606 527 466 416<br />
Mu<strong>la</strong>................................................... 6.342 835 953 696 598 465 578 369<br />
Murcia................................................ 56.975 7.150 8.762 5.865 5.334 4.449 4.875 3.205<br />
Totana................................................ 6.997 849 1.115 751 654 550 551 400<br />
Unión (La).......................................... 15.029 2.065 2.144 1.414 1.280 1.287 1.552 1.015<br />
Yec<strong>la</strong>.................................................. 9.293 1.402 1.319 898 737 726 824 568<br />
2.4.3. ESTRUCTURA POR SEXO Y GRUPOS DE EDAD DE LA POBLACIÓN DE HECHO SEGÚN EL<br />
CENSO DE 1900. MUJERES. (Conclusión)<br />
MUNICIPIOS<br />
EDAD<br />
36-40 41-45 46-50 51-60 61-70 71-80 81 y más<br />
Águi<strong>la</strong>s............................................... 526 354 436 496 272 122 27 -<br />
Caravaca ........................................... 560 373 513 652 347 102 41 -<br />
Cartagena.......................................... 4.168 2.379 2.702 3.336 1.764 606 152 -<br />
Cehegín ............................................. 395 294 316 423 256 136 31 -<br />
Cieza.................................................. 587 291 395 532 317 107 38 -<br />
Jumil<strong>la</strong> ............................................... 596 346 415 666 412 190 59 -<br />
Lorca.................................................. 2.805 1.514 1.944 2.555 1.518 520 125 -<br />
Mazarrón............................................ 853 489 524 686 347 103 29 -<br />
Moratal<strong>la</strong>............................................ 391 371 292 526 355 118 27 -<br />
Mu<strong>la</strong>................................................... 490 276 296 403 277 80 26 -<br />
Murcia................................................ 4.214 2.560 3.151 4.206 2.132 808 264 -<br />
Totana................................................ 503 300 323 531 344 102 24 -<br />
Unión (La).......................................... 1.187 681 857 911 431 148 57 -<br />
Yec<strong>la</strong>.................................................. 620 455 452 689 393 159 51 -<br />
Nota: Sólo hay datos para los municipios mayores <strong>de</strong> 10.000 habitantes.<br />
Fuente: INE. Censos <strong>de</strong> Pob<strong>la</strong>ción.<br />
No<br />
consta<br />
Estadísticas Históricas <strong>de</strong> Pob<strong>la</strong>ción <strong>de</strong> <strong>la</strong> Región <strong>de</strong> Murcia.
Censos <strong>de</strong> Pob<strong>la</strong>ción. Datos Municipales.<br />
2.5.1. ESTRUCTURA POR SEXO Y GRUPOS DE EDAD DE LA POBLACIÓN DE HECHO SEGÚN EL<br />
CENSO DE 1910. AMBOS SEXOS. (Continúa)<br />
MUNICIPIOS TOTAL Menos<br />
<strong>de</strong> 5<br />
Estadísticas Históricas <strong>de</strong> Pob<strong>la</strong>ción <strong>de</strong> <strong>la</strong> Región <strong>de</strong> Murcia.<br />
EDAD<br />
5-10 11-15 16-20 21-25 26-30 31-35<br />
Águi<strong>la</strong>s............................................... 15.967 1.830 2.484 1.877 1.607 1.278 1.253 942<br />
Caravaca ........................................... 17.349 2.150 2.393 1.894 1.692 1.312 1.265 994<br />
Cartagena.......................................... 102.542 10.929 14.153 11.266 10.342 9.258 8.393 6.135<br />
Cehegín............................................. 13.313 1.819 1.999 1.422 1.304 913 975 759<br />
Cieza ................................................. 14.393 1.617 1.931 1.542 1.390 1.150 1.212 783<br />
Fuente Á<strong>la</strong>mo .................................... 10.879 1.285 1.677 1.351 1.164 811 816 485<br />
Jumil<strong>la</strong> ............................................... 17.467 1.855 2.461 1.971 1.882 1.390 1.152 958<br />
Lorca ................................................. 70.807 9.304 11.061 8.149 7.571 4.814 5.304 3.446<br />
Mazarrón ........................................... 22.660 2.715 3.559 2.680 2.594 1.716 1.770 1.244<br />
Molina <strong>de</strong> Segura .............................. 10.465 1.570 1.753 1.141 1.002 754 757 570<br />
Moratal<strong>la</strong>............................................ 13.500 1.652 2.050 1.381 1.298 1.028 1.123 700<br />
Mu<strong>la</strong>................................................... 11.922 1.388 1.848 1.319 1.240 990 839 630<br />
Murcia................................................ 125.057 16.037 18.921 14.134 13.998 9.376 9.369 6.581<br />
Totana ............................................... 13.591 1.483 2.019 1.641 1.393 873 1.006 682<br />
Unión (La).......................................... 30.249 3594 4372 3521 3116 2386 2603 1825<br />
Yec<strong>la</strong> ................................................. 22.883 2786 3430 2639 2415 1720 1637 1208<br />
Municipios < <strong>de</strong> 10.000 habitantes.... 102.061 12748 15828 11588 10621 7514 7295 5613<br />
2.5.1. ESTRUCTURA POR SEXO Y GRUPOS DE EDAD DE LA POBLACIÓN DE HECHO SEGÚN EL<br />
CENSO DE 1910. AMBOS SEXOS. (Conclusión)<br />
MUNICIPIOS<br />
EDAD<br />
36-40 41-45 46-50 51-60 61-70 71-80 81 y más<br />
No<br />
consta<br />
Águi<strong>la</strong>s............................................... 1.107 772 813 1.142 605 206 50 1<br />
Caravaca ........................................... 1.079 829 978 1.427 921 337 77 1<br />
Cartagena.......................................... 7.690 5.559 6.136 7.323 3.519 1.482 339 18<br />
Cehegín............................................. 840 697 675 1.011 627 223 48 1<br />
Cieza ................................................. 1.113 695 930 1.121 648 213 48 -<br />
Fuente Á<strong>la</strong>mo .................................... 727 481 656 703 499 186 38 -<br />
Jumil<strong>la</strong> ............................................... 1.326 856 1.059 1.215 855 385 94 8<br />
Lorca ................................................. 5.093 3.029 4.122 4.767 2.723 1.099 306 19<br />
Mazarrón ........................................... 1.580 1.099 1.237 1.420 658 275 89 24<br />
Molina <strong>de</strong> Segura .............................. 599 418 443 684 497 223 54 -<br />
Moratal<strong>la</strong>............................................ 886 635 769 1.028 647 260 42 1<br />
Mu<strong>la</strong>................................................... 745 607 665 882 508 209 51 1<br />
Murcia................................................ 8.067 5.725 6.731 8.688 4.978 1.841 426 185<br />
Totana ............................................... 868 742 795 1.001 652 336 74 26<br />
Unión (La).......................................... 2381 1581 1832 1881 851 247 59 -<br />
Yec<strong>la</strong> ................................................. 1620 1067 1285 1559 934 435 139 9<br />
Municipios < <strong>de</strong> 10.000 habitantes.... 6294 4863 5314 7423 4676 1869 399 16<br />
Nota: Sólo hay datos <strong>de</strong>sagregados para los municipios mayores <strong>de</strong> 10.000 habitantes.<br />
Fuente: INE. Censos <strong>de</strong> Pob<strong>la</strong>ción.<br />
73
Censos <strong>de</strong> Pob<strong>la</strong>ción. Datos Municipales.<br />
2.5.2. ESTRUCTURA POR SEXO Y GRUPOS DE EDAD DE LA POBLACIÓN DE HECHO SEGÚN EL<br />
CENSO DE 1910. HOMBRES. (Continúa)<br />
74<br />
MUNICIPIOS TOTAL Menos<br />
<strong>de</strong> 5<br />
EDAD<br />
5-10 11-15 16-20 21-25 26-30 31-35<br />
Águi<strong>la</strong>s............................................... 7.709 856 1.220 919 779 628 590 454<br />
Caravaca ........................................... 8.470 1.077 1.162 976 776 591 602 488<br />
Cartagena.......................................... 51.380 5.581 6.967 5.530 5.156 5.228 4.120 3.102<br />
Cehegín ............................................. 6.684 926 994 729 671 423 497 384<br />
Cieza.................................................. 7.083 821 984 773 626 546 574 358<br />
Fuente Á<strong>la</strong>mo .................................... 5.460 629 822 701 546 405 429 248<br />
Jumil<strong>la</strong> ............................................... 8.746 938 1.246 994 931 670 545 473<br />
Lorca.................................................. 35.272 4.883 5.419 4.129 3.622 2.370 2.621 1.701<br />
Mazarrón............................................ 11.390 1.424 1.807 1.362 1.344 817 876 625<br />
Molina <strong>de</strong> Segura............................... 5.117 803 836 560 487 338 369 300<br />
Moratal<strong>la</strong>............................................ 6.953 859 1.070 676 666 519 590 357<br />
Mu<strong>la</strong>................................................... 5.975 700 938 689 606 480 417 309<br />
Murcia................................................ 60.953 8.229 9.466 6.977 6.595 4.465 4.464 3.360<br />
Totana................................................ 6.447 783 1.022 806 582 325 458 329<br />
Unión (La).......................................... 15.081 1.863 2.204 1.757 1.583 1.174 1.318 924<br />
Yec<strong>la</strong>.................................................. 11.416 1.403 1.805 1.350 1.161 813 794 594<br />
Municipios < <strong>de</strong> 10.000 habitantes .... 50.434 6.470 7.842 5.715 5.195 3.709 3.558 2.788<br />
2.5.2. ESTRUCTURA POR SEXO Y GRUPOS DE EDAD DE LA POBLACIÓN DE HECHO SEGÚN EL<br />
CENSO DE 1910. HOMBRES. (Conclusión)<br />
MUNICIPIOS<br />
EDAD<br />
36-40 41-45 46-50 51-60 61-70 71-80 81 y más<br />
No<br />
consta<br />
Águi<strong>la</strong>s............................................... 538 382 399 551 284 89 19 1<br />
Caravaca ........................................... 548 422 468 690 459 177 33 1<br />
Cartagena.......................................... 3.709 2.796 3.078 3.533 1.743 679 151 7<br />
Cehegín ............................................. 437 361 330 485 297 124 25 1<br />
Cieza.................................................. 530 372 492 560 319 105 23 -<br />
Fuente Á<strong>la</strong>mo .................................... 370 253 315 363 249 113 17 -<br />
Jumil<strong>la</strong> ............................................... 698 459 521 607 438 187 34 5<br />
Lorca.................................................. 2.494 1.567 2.004 2.328 1.439 546 141 8<br />
Mazarrón............................................ 753 572 622 683 337 122 34 12<br />
Molina <strong>de</strong> Segura............................... 292 219 207 319 255 109 23 -<br />
Moratal<strong>la</strong>............................................ 449 340 386 523 345 147 26 -<br />
Mu<strong>la</strong>................................................... 365 303 334 437 272 100 24 1<br />
Murcia................................................ 3.749 2.828 3.157 4.111 2.410 884 168 90<br />
Totana................................................ 407 367 380 485 308 147 35 13<br />
Unión (La).......................................... 1.161 794 860 922 399 108 14 -<br />
Yec<strong>la</strong>.................................................. 813 515 662 771 458 211 62 4<br />
Municipios < <strong>de</strong> 10.000 habitantes .... 3.026 2.430 2.576 3.645 2.335 971 167 7<br />
Nota: Sólo hay datos <strong>de</strong>sagregados para los municipios mayores <strong>de</strong> 10.000 habitantes.<br />
Fuente: INE. Censos <strong>de</strong> Pob<strong>la</strong>ción.<br />
Estadísticas Históricas <strong>de</strong> Pob<strong>la</strong>ción <strong>de</strong> <strong>la</strong> Región <strong>de</strong> Murcia.
Censos <strong>de</strong> Pob<strong>la</strong>ción. Datos Municipales.<br />
2.5.3. ESTRUCTURA POR SEXO Y GRUPOS DE EDAD DE LA POBLACIÓN DE HECHO SEGÚN EL<br />
CENSO DE 1910. MUJERES. (Continúa)<br />
MUNICIPIOS TOTAL Menos<br />
<strong>de</strong> 5<br />
Estadísticas Históricas <strong>de</strong> Pob<strong>la</strong>ción <strong>de</strong> <strong>la</strong> Región <strong>de</strong> Murcia.<br />
EDAD<br />
5-10 11-15 16-20 21-25 26-30 31-35<br />
Águi<strong>la</strong>s............................................... 8.258 974 1.264 958 828 650 663 488<br />
Caravaca ........................................... 8.879 1.073 1.231 918 916 721 663 506<br />
Cartagena.......................................... 51.162 5.348 7.186 5.736 5.186 4.030 4.273 3.033<br />
Cehegín............................................. 6.629 893 1.005 693 633 490 478 375<br />
Cieza ................................................. 7.310 796 947 769 764 604 638 425<br />
Fuente Á<strong>la</strong>mo .................................... 5.419 656 855 650 618 406 387 237<br />
Jumil<strong>la</strong> ............................................... 8.721 917 1.215 977 951 720 607 485<br />
Lorca ................................................. 35.535 4.421 5.642 4.020 3.949 2.444 2.683 1.745<br />
Mazarrón ........................................... 11.270 1.291 1.752 1.318 1.250 899 894 619<br />
Molina <strong>de</strong> Segura .............................. 5.348 767 917 581 515 416 388 270<br />
Moratal<strong>la</strong>............................................ 6.547 793 980 705 632 509 533 343<br />
Mu<strong>la</strong>................................................... 5.947 688 910 630 634 510 422 321<br />
Murcia................................................ 64.104 7.808 9.455 7.157 7.403 4.911 4.905 3.221<br />
Totana ............................................... 7.144 700 997 835 811 548 548 353<br />
Unión (La).......................................... 15.168 1.731 2.168 1.764 1.533 1.212 1.285 901<br />
Yec<strong>la</strong> ................................................. 11.467 1.383 1.625 1.289 1.254 907 843 614<br />
Municipios < <strong>de</strong> 10.000 habitantes.... 51.627 6.278 7.986 5.873 5.426 3.805 3.737 2.825<br />
2.5.3. ESTRUCTURA POR SEXO Y GRUPOS DE EDAD DE LA POBLACIÓN DE HECHO SEGÚN EL<br />
CENSO DE 1910. MUJERES. (Conclusión)<br />
MUNICIPIOS<br />
EDAD<br />
36-40 41-45 46-50 51-60 61-70 71-80 81 y más<br />
No<br />
consta<br />
Águi<strong>la</strong>s............................................... 569 390 414 591 321 117 31 -<br />
Caravaca ........................................... 531 407 510 737 462 160 44 -<br />
Cartagena.......................................... 3.981 2.763 3.058 3.790 1.776 803 188 11<br />
Cehegín............................................. 403 336 345 526 330 99 23 -<br />
Cieza ................................................. 583 323 438 561 329 108 25 -<br />
Fuente Á<strong>la</strong>mo .................................... 357 228 341 340 250 73 21 -<br />
Jumil<strong>la</strong> ............................................... 628 397 538 608 417 198 60 3<br />
Lorca ................................................. 2.599 1.462 2.118 2.439 1.284 553 165 11<br />
Mazarrón ........................................... 827 527 615 737 321 153 55 12<br />
Molina <strong>de</strong> Segura .............................. 307 199 236 365 242 114 31 -<br />
Moratal<strong>la</strong>............................................ 437 295 383 505 302 113 16 1<br />
Mu<strong>la</strong>................................................... 380 304 331 445 236 109 27 -<br />
Murcia................................................ 4.318 2.897 3.574 4.577 2.568 957 258 95<br />
Totana ............................................... 461 375 415 516 344 189 39 13<br />
Unión (La).......................................... 1.220 787 972 959 452 139 45 -<br />
Yec<strong>la</strong> ................................................. 807 552 623 788 476 224 77 5<br />
Municipios < <strong>de</strong> 10.000 habitantes.... 3.268 2.433 2.738 3.778 2.341 898 232 9<br />
Nota: Sólo hay datos <strong>de</strong>sagregados para los municipios mayores <strong>de</strong> 10.000 habitantes.<br />
Fuente: INE. Censos <strong>de</strong> Pob<strong>la</strong>ción.<br />
75
Censos <strong>de</strong> Pob<strong>la</strong>ción. Datos Municipales.<br />
2.6.1. ESTRUCTURA POR SEXO Y GRUPOS DE EDAD DE LA POBLACIÓN DE HECHO SEGÚN EL<br />
CENSO DE 1920. AMBOS SEXOS. (Continúa)<br />
76<br />
MUNICIPIOS TOTAL Menos<br />
<strong>de</strong> 5<br />
EDAD<br />
5-10 11-15 16-20 21-25 26-30 31-35 36-40<br />
Cartagena.................................. 96.891 9.875 12.595 9.729 10.043 10.832 8.105 6.019 6.118<br />
Jumil<strong>la</strong> ....................................... 20.303 2.202 2.415 2.075 2.238 1.929 1.886 1.106 1.158<br />
Lorca.......................................... 74.696 9.514 10.266 8.610 7.939 7.173 6.284 4.056 4.149<br />
Murcia........................................ 141.175 16.905 20.264 16.164 15.683 12.319 11.934 7.653 8.127<br />
Unión (La).................................. 24.837 3.009 4.066 3.038 2.618 1.709 1.856 1.406 1.653<br />
Yec<strong>la</strong>.......................................... 25.331 2.572 3.277 2.845 2.865 2.385 2.063 1.398 1.303<br />
Municipios entre 5.000 y<br />
20.000 habitantes ...................... 211.772 23.836 28.234 23.900 23.478 18.239 17.806 11.418 12.551<br />
Municipios < <strong>de</strong> 5.000<br />
habitantes .................................. 43.634 5.174 6.066 4.905 4.695 3.638 3.435 2.474 2.437<br />
2.6.1. ESTRUCTURA POR SEXO Y GRUPOS DE EDAD DE LA POBLACIÓN DE HECHO SEGÚN EL<br />
CENSO DE 1920. AMBOS SEXOS. (Conclusión)<br />
MUNICIPIOS<br />
EDAD<br />
41-45 46-50 51-55 56-60 61-70 71-80 81-90 91-100<br />
Más <strong>de</strong><br />
100<br />
No<br />
consta<br />
Cartagena............................. 4.892 5.439 3.685 3.933 3.868 1.266 251 23 - 218<br />
Jumil<strong>la</strong> .................................. 823 1.201 812 941 926 421 98 9 - 63<br />
Lorca..................................... 3.072 3.808 2.333 2.954 3.013 1.125 216 37 1 146<br />
Murcia................................... 6.420 6.501 4.871 5.320 6.220 2.108 437 50 1 198<br />
Unión (La)............................. 1.374 1.454 862 881 713 164 25 1 - 8<br />
Yec<strong>la</strong>..................................... 1.297 1.419 1.105 991 1.176 500 104 15 1 15<br />
Municipios entre 5.000 y<br />
20.000 habitantes ................. 9.552 11.273 7.588 9.179 10.011 3.664 745 85 3 210<br />
Municipios < <strong>de</strong> 5.000<br />
habitantes ............................. 2.055 2.112 1.624 1.908 2.123 798 159 19 1 11<br />
Nota: Sólo hay datos <strong>de</strong>sagregados para los municipios mayores <strong>de</strong> 20.000 habitantes.<br />
Fuente: INE. Censos <strong>de</strong> Pob<strong>la</strong>ción.<br />
Estadísticas Históricas <strong>de</strong> Pob<strong>la</strong>ción <strong>de</strong> <strong>la</strong> Región <strong>de</strong> Murcia.
Censos <strong>de</strong> Pob<strong>la</strong>ción. Datos Municipales.<br />
2.6.2. ESTRUCTURA POR SEXO Y GRUPOS DE EDAD DE LA POBLACIÓN DE HECHO SEGÚN EL<br />
CENSO DE 1920. HOMBRES. (Continúa)<br />
MUNICIPIOS TOTAL Menos<br />
<strong>de</strong> 5<br />
Estadísticas Históricas <strong>de</strong> Pob<strong>la</strong>ción <strong>de</strong> <strong>la</strong> Región <strong>de</strong> Murcia.<br />
EDAD<br />
5-10 11-15 16-20 21-25 26-30 31-35 36-40<br />
Cartagena.................................. 48.797 5.144 6.468 4.799 4.666 6.423 3.852 3.117 2.910<br />
Jumil<strong>la</strong> ....................................... 10.078 1.124 1.233 997 1.032 935 1.017 548 556<br />
Lorca ......................................... 36.864 4.824 5.135 4.101 3.681 3.790 3.079 1.995 2.027<br />
Murcia........................................ 67.696 8.420 10.347 7.755 7.084 5.713 5.777 3.687 3.904<br />
Unión (La).................................. 11.313 1.518 1.848 1.259 1.043 720 908 641 811<br />
Yec<strong>la</strong> ......................................... 12.302 1.303 1.702 1.361 1.285 1.053 1.000 718 622<br />
Municipios entre 5.000 y<br />
20.000 habitantes...................... 104.132 12.033 14.265 12.057 11.141 8.457 8.838 5.672 6.145<br />
Municipios < <strong>de</strong> 5.000<br />
habitantes.................................. 21.253 2.656 3.010 2.382 2.164 1.706 1.635 1.217 1.195<br />
2.6.2. ESTRUCTURA POR SEXO Y GRUPOS DE EDAD DE LA POBLACIÓN DE HECHO SEGÚN EL<br />
CENSO DE 1920. HOMBRES. (Conclusión)<br />
MUNICIPIOS<br />
EDAD<br />
41-45 46-50 51-55 56-60 61-70 71-80 81-90 91-100<br />
Más <strong>de</strong><br />
100<br />
No<br />
consta<br />
Cartagena............................. 2.385 2.665 1.805 1.890 1.846 595 121 8 - 103<br />
Jumil<strong>la</strong> .................................. 407 582 427 482 466 205 37 2 - 28<br />
Lorca .................................... 1.484 1.883 1.201 1.426 1.473 595 100 16 - 54<br />
Murcia................................... 3.088 3.107 2.285 2.369 2.941 945 173 19 - 82<br />
Unión (La)............................. 652 700 407 386 337 68 7 1 - 7<br />
Yec<strong>la</strong> .................................... 620 709 543 505 577 247 43 7 - 7<br />
Municipios entre 5.000 y<br />
20.000 habitantes................. 4.533 5.528 3.797 4.395 4.964 1.771 352 38 - 146<br />
Municipios < <strong>de</strong> 5.000<br />
habitantes............................. 1.019 1.015 814 925 1.062 367 74 5 1 6<br />
Nota: Sólo hay datos <strong>de</strong>sagregados para los municipios mayores <strong>de</strong> 20.000 habitantes.<br />
Fuente: INE. Censos <strong>de</strong> Pob<strong>la</strong>ción.<br />
77
Censos <strong>de</strong> Pob<strong>la</strong>ción. Datos Municipales.<br />
2.6.3. ESTRUCTURA POR SEXO Y GRUPOS DE EDAD DE LA POBLACIÓN DE HECHO SEGÚN EL<br />
CENSO DE 1920. MUJERES. (Continúa)<br />
78<br />
MUNICIPIOS TOTAL Menos<br />
<strong>de</strong> 5<br />
EDAD<br />
5-10 11-15 16-20 21-25 26-30 31-35 36-40<br />
Cartagena.................................. 48.094 4.731 6.127 4.930 5.377 4.409 4.253 2.902 3.208<br />
Jumil<strong>la</strong> ....................................... 10.225 1.078 1.182 1.078 1.206 994 869 558 602<br />
Lorca.......................................... 37.832 4.690 5.131 4.509 4.258 3.383 3.205 2.061 2.122<br />
Murcia........................................ 73.479 8.485 9.917 8.409 8.599 6.606 6.157 3.966 4.223<br />
Unión (La).................................. 13.524 1.491 2.218 1.779 1.575 989 948 765 842<br />
Yec<strong>la</strong>.......................................... 13.029 1.269 1.575 1.484 1.580 1.332 1.063 680 681<br />
Municipios entre 5.000 y<br />
20.000 habitantes ...................... 107.640 11.803 13.969 11.843 12.337 9.782 8.968 5.746 6.406<br />
Municipios < <strong>de</strong> 5.000<br />
habitantes .................................. 22.381 2.518 3.056 2.523 2.531 1.932 1.800 1.257 1.242<br />
2.6.3. ESTRUCTURA POR SEXO Y GRUPOS DE EDAD DE LA POBLACIÓN DE HECHO SEGÚN EL<br />
CENSO DE 1920. MUJERES. (Conclusión)<br />
MUNICIPIOS<br />
EDAD<br />
41-45 46-50 51-55 56-60 61-70 71-80 81-90 91-100<br />
Más <strong>de</strong><br />
100<br />
No<br />
consta<br />
Cartagena............................. 2.507 2.774 1.880 2.043 2.022 671 130 15 - 115<br />
Jumil<strong>la</strong> .................................. 416 619 385 459 460 216 61 7 - 35<br />
Lorca..................................... 1.588 1.925 1.132 1.528 1.540 530 116 21 1 92<br />
Murcia................................... 3.332 3.394 2.586 2.951 3.279 1.163 264 31 1 116<br />
Unión (La)............................. 722 754 455 495 376 96 18 - - 1<br />
Yec<strong>la</strong>..................................... 677 710 562 486 599 253 61 8 1 8<br />
Municipios entre 5.000 y<br />
20.000 habitantes ................. 5.019 5.745 3.791 4.784 5.047 1.893 393 47 3 64<br />
Municipios < <strong>de</strong> 5.000<br />
habitantes ............................. 1.036 1.097 810 983 1.061 431 85 14 - 5<br />
Nota: Sólo hay datos <strong>de</strong>sagregados para los municipios mayores <strong>de</strong> 20.000 habitantes.<br />
Fuente: INE. Censos <strong>de</strong> Pob<strong>la</strong>ción.<br />
Estadísticas Históricas <strong>de</strong> Pob<strong>la</strong>ción <strong>de</strong> <strong>la</strong> Región <strong>de</strong> Murcia.
Censos <strong>de</strong> Pob<strong>la</strong>ción. Datos Municipales.<br />
2.7. ESTRUCTURA POR SEXO Y GRUPOS DE EDAD DE LA POBLACIÓN DE HECHO DEL<br />
MUNICIPIO DE MURCIA SEGÚN EL CENSO DE 1930.<br />
EDAD TOTAL HOMBRES MUJERES<br />
TOTAL........................................................ 158.724 76.928 81.796<br />
Menores <strong>de</strong> 5 años..................................... 18.483 9.383 9.100<br />
De 5 a 10 años ........................................... 23.405 11.779 11.626<br />
De 11 a 15 años ......................................... 15.615 7.800 7.815<br />
De 16 a 20 años ......................................... 15.667 7.310 8.357<br />
De 21 a 25 años ......................................... 14.394 6.542 7.852<br />
De 26 a 30 años ......................................... 14.169 6.804 7.365<br />
De 31 a 35 años ......................................... 9.688 4.794 4.894<br />
De 36 a 40 años ......................................... 10.184 4.771 5.413<br />
De 41 a 45 años ......................................... 6.942 3.377 3.565<br />
De 46 a 50 años ......................................... 7.348 3.439 3.909<br />
De 51 a 55 años ......................................... 5.204 2.497 2.707<br />
De 56 a 60 años ......................................... 5.642 2.452 3.190<br />
De 61 a 70 años ......................................... 7.375 3.432 3.943<br />
De 71 a 80 años ......................................... 2.887 1.369 1.518<br />
De 81 a 90 años ......................................... 743 316 427<br />
De 91 a 100 años ....................................... 90 41 49<br />
Más <strong>de</strong> 100 años........................................ 3 2 1<br />
No consta ................................................... 885 820 65<br />
Fuente: INE. Censos <strong>de</strong> Pob<strong>la</strong>ción.<br />
Estadísticas Históricas <strong>de</strong> Pob<strong>la</strong>ción <strong>de</strong> <strong>la</strong> Región <strong>de</strong> Murcia.<br />
79
Censos <strong>de</strong> Pob<strong>la</strong>ción. Datos Municipales.<br />
2.8.1. ESTRUCTURA POR SEXO Y GRUPOS DE EDAD DE LA POBLACIÓN DE HECHO SEGÚN EL<br />
CENSO DE 1940. AMBOS SEXOS. (Continúa)<br />
80<br />
EDAD<br />
MUNICIPIOS TOTAL < 5 5-9 10-14 15-19 20-24 25-29 30-34 35-49 40-44 45-49<br />
Caravaca .................................... 20.645 2.154 2.050 2.074 2.380 1.710 1.398 1.559 1.406 1.383 1.093<br />
Cieza........................................... 23.499 2.783 3.047 2.908 2.270 1.633 1.559 1.532 1.363 1.624 1.439<br />
Jumil<strong>la</strong> ........................................ 21.165 1.791 2.186 2.134 2.195 2.147 2.046 1.527 1.204 1.110 1.017<br />
Lorca........................................... 69.639 5.934 7.905 7.814 7.609 6.718 5.316 4.742 3.969 4.248 3.439<br />
Murcia......................................... 193.721 19.236 19.586 20.477 18.854 18.216 16.547 14.045 11.652 11.622 9.742<br />
Yec<strong>la</strong>........................................... 22.371 1.559 1.799 2.244 2.152 1.811 1.479 1.475 1.386 1.352 1.491<br />
2.8.1. ESTRUCTURA POR SEXO Y GRUPOS DE EDAD DE LA POBLACIÓN DE HECHO SEGÚN EL<br />
CENSO DE 1940. AMBOS SEXOS. (Conclusión)<br />
MUNICIPIOS<br />
EDAD<br />
50-54 55-59 60-64 65-69 70-74 75-79 80-84 85-89 90-94 95-99<br />
Caravaca ...................................... 967 655 789 398 268 205 98 39 14 5 -<br />
Cieza............................................. 1.214 803 722 289 188 64 43 11 6 1 -<br />
Jumil<strong>la</strong> .......................................... 1.005 835 826 442 345 170 114 61 8 2 -<br />
Lorca............................................. 3.637 2.020 1.978 1.560 1.317 707 550 152 24 - -<br />
Murcia........................................... 8.055 6.528 6.322 4.655 3.596 2.564 1.342 573 88 21 -<br />
Yec<strong>la</strong>............................................. 1.284 1.059 939 875 568 505 266 118 9 - -<br />
Nota: Sólo hay datos para los municipios mayores <strong>de</strong> 20.000 habitantes.<br />
Fuente: INE. Censos <strong>de</strong> Pob<strong>la</strong>ción.<br />
2.8.2. ESTRUCTURA POR SEXO Y GRUPOS DE EDAD DE LA POBLACIÓN DE HECHO SEGÚN EL<br />
CENSO DE 1940. HOMBRES. (Continúa)<br />
EDAD<br />
MUNICIPIOS TOTAL < 5 5-9 10-14 15-19 20-24 25-29 30-34 35-49 40-44 45-49<br />
Caravaca .................................... 10.137 1.084 1.039 986 1.111 846 815 804 659 730 587<br />
Cieza........................................... 11.400 1.392 1.505 1.352 1.014 777 841 767 659 818 705<br />
Jumil<strong>la</strong> ........................................ 10.355 895 970 1.018 1.126 1.069 1.019 822 607 492 483<br />
Lorca........................................... 33.943 2.808 3.772 3.977 3.607 3.763 2.516 2.076 1.921 1.916 1.634<br />
Murcia......................................... 93.778 9.945 9.706 10.093 8.686 8.909 7.749 6.628 5.571 5.833 4.862<br />
Yec<strong>la</strong>........................................... 10.612 756 873 1.172 1.065 887 694 667 618 677 758<br />
100 y<br />
más<br />
Estadísticas Históricas <strong>de</strong> Pob<strong>la</strong>ción <strong>de</strong> <strong>la</strong> Región <strong>de</strong> Murcia.
Censos <strong>de</strong> Pob<strong>la</strong>ción. Datos Municipales.<br />
2.8.2. ESTRUCTURA POR SEXO Y GRUPOS DE EDAD DE LA POBLACIÓN DE HECHO SEGÚN EL<br />
CENSO DE 1940. HOMBRES. (Conclusión)<br />
MUNICIPIOS<br />
Estadísticas Históricas <strong>de</strong> Pob<strong>la</strong>ción <strong>de</strong> <strong>la</strong> Región <strong>de</strong> Murcia.<br />
EDAD<br />
50-54 55-59 60-64 65-69 70-74 75-79 80-84 85-89 90-94 95-99<br />
Caravaca ...................................... 444 250 387 190 101 55 24 21 3 1 -<br />
Cieza ............................................ 606 360 342 118 89 28 18 6 2 1 -<br />
Jumil<strong>la</strong> .......................................... 467 436 399 237 150 90 54 21 - - -<br />
Lorca ............................................ 2.018 1.043 888 716 612 366 241 61 8 - -<br />
Murcia........................................... 4.050 3.176 2.834 2.252 1.617 1243 422 181 13 8 -<br />
Yec<strong>la</strong> ............................................ 594 436 437 365 288 214 92 17 2 - -<br />
Nota: Sólo hay datos para los municipios mayores <strong>de</strong> 20.000 habitantes.<br />
Fuente: INE. Censos <strong>de</strong> Pob<strong>la</strong>ción.<br />
2.8.3. ESTRUCTURA POR SEXO Y GRUPOS DE EDAD DE LA POBLACIÓN DE HECHO SEGÚN EL<br />
CENSO DE 1940. MUJERES. (Continúa)<br />
EDAD<br />
MUNICIPIOS TOTAL < 5 5-9 10-14 15-19 20-24 25-29 30-34 35-49 40-44 45-49<br />
Caravaca ..................................... 10.508 1.070 1.011 1.088 1.269 864 583 755 747 653 506<br />
Cieza ........................................... 12.099 1.391 1.542 1.556 1.256 856 718 765 704 806 734<br />
Jumil<strong>la</strong> ......................................... 10.810 896 1.216 1.116 1.069 1.078 1.027 705 597 618 534<br />
Lorca ........................................... 35.696 3.126 4.133 3.837 4.002 2.955 2.800 2.666 2.048 2.332 1.805<br />
Murcia.......................................... 99.943 9.291 9.880 10.384 10.168 9.307 8.798 7.417 6.081 5.789 4.880<br />
Yec<strong>la</strong> ........................................... 11.759 803 926 1.072 1.087 924 785 808 768 675 733<br />
2.8.3. ESTRUCTURA POR SEXO Y GRUPOS DE EDAD DE LA POBLACIÓN DE HECHO SEGÚN EL<br />
CENSO DE 1940. MUJERES. (Conclusión)<br />
MUNICIPIOS<br />
EDAD<br />
50-54 55-59 60-64 65-69 70-74 75-79 80-84 85-89 90-94 95-99<br />
Caravaca ...................................... 523 405 402 208 167 150 74 18 11 4 -<br />
Cieza ............................................ 608 443 380 171 99 36 25 5 4 - -<br />
Jumil<strong>la</strong> .......................................... 538 399 427 205 195 80 60 40 8 2 -<br />
Lorca ............................................ 1.619 977 1.090 844 705 341 309 91 16 - -<br />
Murcia........................................... 4.005 3.352 3.488 2.403 1.979 1321 920 392 75 13 -<br />
Yec<strong>la</strong> ............................................ 690 623 502 510 280 291 174 101 7 - -<br />
Nota: Sólo hay datos para los municipios mayores <strong>de</strong> 20.000 habitantes.<br />
Fuente: INE. Censos <strong>de</strong> Pob<strong>la</strong>ción.<br />
100 y<br />
más<br />
100 y<br />
más<br />
81
Censos <strong>de</strong> Pob<strong>la</strong>ción. Datos Municipales.<br />
2.9.1. ESTRUCTURA POR SEXO Y GRUPOS DE EDAD DE LA POBLACIÓN DE HECHO SEGÚN EL<br />
CENSO DE 1950. AMBOS SEXOS.<br />
82<br />
MUNICIPIOS TOTAL Menos<br />
<strong>de</strong> 5<br />
EDAD<br />
5-9 10-14 15-24 25-34 35-44 45-54 55-64<br />
65 y<br />
más<br />
No<br />
consta<br />
Águi<strong>la</strong>s.............................. 15.225 1.626 1.530 1.287 3.211 2.109 1.865 1.664 939 985 9<br />
Alcantaril<strong>la</strong> ........................ 13.229 1.131 984 1.350 2.952 1.746 1.921 1.358 899 867 21<br />
Alhama <strong>de</strong> Murcia............. 11.560 1.128 1.138 1.130 2.287 1.460 1.391 1.289 697 1.040 -<br />
Ca<strong>la</strong>sparra ........................ 10.371 1.181 1.151 895 1.945 1.517 1.374 936 661 711 -<br />
Caravaca .......................... 21.700 2.046 2.011 2.135 4.376 2.790 2.502 2.358 1.737 1.745 -<br />
Cartagena......................... 113.160 10.019 9.069 9.914 26.120 16.698 13.848 12.364 7.838 7.290 -<br />
Cehegín ............................ 15.830 1.486 1.554 1.680 3.019 2.466 1.719 1.535 1.224 1.137 10<br />
Cieza................................. 23.328 2.149 2.156 2.014 4.237 3.509 2.943 2.537 1.843 1.930 10<br />
Jumil<strong>la</strong> .............................. 20.851 2.162 1.946 1.575 4.061 3.451 2.040 2.116 1.907 1.593 -<br />
Lorca................................. 70.998 7.634 6.687 6.503 13.784 10.680 8.292 7.057 5.084 5.237 40<br />
Molina <strong>de</strong> Segura.............. 14.683 1.714 1.662 1.391 2.898 2.076 1.724 1.483 922 783 30<br />
Moratal<strong>la</strong>........................... 14.117 1.174 1.246 1.317 3.029 1.963 1.592 1.832 1.030 934 -<br />
Mu<strong>la</strong>.................................. 15.127 1.564 1.415 1.365 2.950 2.053 1.754 1.624 1.236 1.156 10<br />
Murcia............................... 218.375 20.117 18.948 22.000 45.129 34.613 26.210 22.512 15.977 12.847 22<br />
Torre Pacheco .................. 10.409 1.082 1.066 1.031 2.022 1.535 1.086 1.112 776 699 -<br />
Totana............................... 14.763 1.423 1.260 1.313 2.743 2.279 1.563 1.505 1.400 1.277 -<br />
Unión (La)......................... 10.131 945 1.117 1.148 1.983 1.300 1.413 803 722 690 10<br />
Yec<strong>la</strong>................................. 24.046 2.296 1.905 2.012 4.345 3.819 2.966 2.654 2.369 1.622 58<br />
Nota: Sólo hay datos para los municipios mayores <strong>de</strong> 10.000 habitantes.<br />
Fuente: INE. Censos <strong>de</strong> Pob<strong>la</strong>ción.<br />
2.9.2. ESTRUCTURA POR SEXO Y GRUPOS DE EDAD DE LA POBLACIÓN DE HECHO SEGÚN EL<br />
CENSO DE 1950. HOMBRES.<br />
MUNICIPIOS TOTAL Menos<br />
<strong>de</strong> 5<br />
EDAD<br />
5-9 10-14 15-24 25-34 35-44 45-54 55-64<br />
65 y<br />
más<br />
No<br />
consta<br />
Águi<strong>la</strong>s.............................. 7.328 820 810 663 1.551 1.054 800 781 488 361 -<br />
Alcantaril<strong>la</strong> ........................ 6.288 677 561 699 1.175 868 868 614 434 381 11<br />
Alhama <strong>de</strong> Murcia............. 5.514 537 577 518 1.145 726 677 647 269 418 -<br />
Ca<strong>la</strong>sparra ........................ 5.107 553 594 389 1.034 727 726 481 317 286 -<br />
Caravaca .......................... 10.793 1.183 1.041 1.098 2.263 1.326 1.174 1.117 767 824 -<br />
Cartagena......................... 55.627 5.132 4.673 5.282 14.590 7.886 6.302 5.544 3.530 2.688 -<br />
Cehegín ............................ 7.970 737 863 882 1.541 1.270 824 708 611 524 10<br />
Cieza................................. 11.122 1.189 1.046 974 1.988 1.620 1.374 1.158 933 840 -<br />
Jumil<strong>la</strong> .............................. 10.227 1.231 956 733 1.893 1.669 1.109 977 967 692 -<br />
Lorca................................. 34.471 4.065 3.219 3.307 6.595 5.256 3.947 3.367 2.382 2.323 10<br />
Molina <strong>de</strong> Segura.............. 7.058 825 905 755 1.322 915 795 746 447 328 20<br />
Moratal<strong>la</strong>........................... 7.221 538 670 657 1.638 1.064 777 909 478 490 -<br />
Mu<strong>la</strong>.................................. 7.507 872 703 683 1.486 1.010 822 852 644 435 -<br />
Murcia............................... 104.972 10.497 9.860 11.422 21.898 16.239 12.151 10.620 7.077 5.208 -<br />
Torre Pacheco .................. 5.205 613 496 613 973 710 516 593 389 302 -<br />
Totana............................... 7.144 729 606 749 1.334 1.222 677 780 575 472 -<br />
Unión (La)......................... 4.821 470 429 572 1.042 602 705 378 378 245 -<br />
Yec<strong>la</strong>................................. 11.587 1.023 941 961 2.117 1.861 1.452 1.227 1.289 706 10<br />
Nota: Sólo hay datos para los municipios mayores <strong>de</strong> 10.000 habitantes.<br />
Fuente: INE. Censos <strong>de</strong> Pob<strong>la</strong>ción.<br />
Estadísticas Históricas <strong>de</strong> Pob<strong>la</strong>ción <strong>de</strong> <strong>la</strong> Región <strong>de</strong> Murcia.
Censos <strong>de</strong> Pob<strong>la</strong>ción. Datos Municipales.<br />
2.9.3. ESTRUCTURA POR SEXO Y GRUPOS DE EDAD DE LA POBLACIÓN DE HECHO SEGÚN EL<br />
CENSO DE 1950. MUJERES.<br />
MUNICIPIOS TOTAL Menos<br />
<strong>de</strong> 5<br />
Estadísticas Históricas <strong>de</strong> Pob<strong>la</strong>ción <strong>de</strong> <strong>la</strong> Región <strong>de</strong> Murcia.<br />
EDAD<br />
5-9 10-14 15-24 25-34 35-44 45-54 55-64<br />
65 y<br />
más<br />
No<br />
consta<br />
Águi<strong>la</strong>s.............................. 7.897 806 720 624 1.660 1.055 1.065 883 451 624 9<br />
Alcantaril<strong>la</strong>........................ 6.941 454 423 651 1.777 878 1.053 744 465 486 10<br />
Alhama <strong>de</strong> Murcia ............ 6.046 591 561 612 1.142 734 714 642 428 622 -<br />
Ca<strong>la</strong>sparra........................ 5.264 628 557 506 911 790 648 455 344 425 -<br />
Caravaca .......................... 10.907 863 970 1.037 2.113 1.464 1.328 1.241 970 921 -<br />
Cartagena......................... 57.533 4.887 4.396 4.632 11.530 8.812 7.546 6.820 4.308 4.602 -<br />
Cehegín............................ 7.860 749 691 798 1.478 1.196 895 827 613 613 -<br />
Cieza ................................ 12.206 960 1.110 1.040 2.249 1.889 1.569 1.379 910 1.090 10<br />
Jumil<strong>la</strong> .............................. 10.624 931 990 842 2.168 1.782 931 1.139 940 901 -<br />
Lorca ................................ 36.527 3.569 3.468 3.196 7.189 5.424 4.345 3.690 2.702 2.914 30<br />
Molina <strong>de</strong> Segura ............. 7.625 889 757 636 1.576 1.161 929 737 475 455 10<br />
Moratal<strong>la</strong>........................... 6.896 636 576 660 1.391 899 815 923 552 444 -<br />
Mu<strong>la</strong>.................................. 7.620 692 712 682 1.464 1.043 932 772 592 721 10<br />
Murcia............................... 113.403 9.620 9.088 10.578 23.231 18.374 14.059 11.892 8.900 7.639 22<br />
Torre Pacheco.................. 5.204 469 570 418 1.049 825 570 519 387 397 -<br />
Totana .............................. 7.619 694 654 564 1.409 1.057 886 725 825 805 -<br />
Unión (La)......................... 5.310 475 688 576 941 698 708 425 344 445 10<br />
Yec<strong>la</strong> ................................ 12.459 1.273 964 1.051 2.228 1.958 1.514 1.427 1.080 916 48<br />
Nota: Sólo hay datos para los municipios mayores <strong>de</strong> 10.000 habitantes.<br />
Fuente: INE. Censos <strong>de</strong> Pob<strong>la</strong>ción.<br />
83
Censos <strong>de</strong> Pob<strong>la</strong>ción. Datos Municipales.<br />
2.10.1. ESTRUCTURA POR SEXO Y GRUPOS DE EDAD DE LA POBLACIÓN DE DERECHO<br />
SEGÚN EL CENSO DE 1960. AMBOS SEXOS. (Continúa)<br />
84<br />
MUNICIPIOS TOTAL Menos<br />
<strong>de</strong> 5<br />
EDAD<br />
5-9 10-14 15-19 20-24 25-29 30-34 35-39<br />
Águi<strong>la</strong>s....................................... 15.443 1.718 1.397 1.452 1.191 1.017 1.294 1.153 1.129<br />
Alcantaril<strong>la</strong> ................................. 15.725 1.802 1.552 1.445 1.268 1.147 1.404 1.311 1.158<br />
Alhama <strong>de</strong> Murcia...................... 11.713 1.087 904 970 885 823 1.094 954 769<br />
Caravaca ................................... 20.843 2.436 2.121 1.891 1.781 1.425 1.437 1.671 1.456<br />
Cartagena.................................. 123.953 12.909 10.548 9.784 9.006 12.429 10.298 9.863 8.846<br />
Cehegín ..................................... 15.926 1.612 1.569 1.431 1.359 1.094 1.229 1.240 1.036<br />
Cieza.......................................... 22.537 2.450 2.197 1.966 1.980 1.682 1.633 1.677 1.707<br />
Jumil<strong>la</strong> ....................................... 21.547 2.180 2.044 1.934 1.655 1.600 1.608 1.636 1.465<br />
Lorca.......................................... 58.958 5.478 5.310 5.815 4.750 4.937 4.731 4.446 3.994<br />
Molina <strong>de</strong> Segura....................... 16.308 1.888 1.442 1.510 1.454 1.248 1.438 1.086 990<br />
Moratal<strong>la</strong>.................................... 14.030 1.483 1.232 1.387 1.032 1.088 1.092 1.080 984<br />
Mu<strong>la</strong>........................................... 14.720 1.410 1.253 1.285 1.281 1.093 1.230 1.021 1.049<br />
Murcia........................................ 249.616 28.703 26.670 25.010 19.731 18.542 20.389 20.127 17.992<br />
San Javier.................................. 10.796 749 690 675 886 3.675 652 704 559<br />
Torre Pacheco ........................... 11.184 1.049 850 971 968 1.544 891 723 712<br />
Totana........................................ 14.275 1.273 1.177 1.284 1.241 1.075 1.127 916 960<br />
Unión (La).................................. 11.513 1.620 1.481 1.136 845 849 871 928 817<br />
Yec<strong>la</strong>.......................................... 20.982 2.131 1.719 1.652 1.510 1.367 1.589 1.779 1.446<br />
2.10.1. ESTRUCTURA POR SEXO Y GRUPOS DE EDAD DE LA POBLACIÓN DE DERECHO<br />
SEGÚN EL CENSO DE 1960. AMBOS SEXOS. (Conclusión)<br />
MUNICIPIOS<br />
EDAD<br />
40-44 45-49 50-54 55-59 60-64 65-69 70-74 75 y más<br />
No<br />
consta<br />
Águi<strong>la</strong>s........................................ 749 725 784 721 658 563 444 440 8<br />
Alcantaril<strong>la</strong> .................................. 792 869 748 591 584 414 270 346 24<br />
Alhama <strong>de</strong> Murcia....................... 629 621 769 675 555 384 287 295 12<br />
Caravaca .................................... 1.116 1.018 932 952 735 772 548 552 -<br />
Cartagena................................... 6.832 6.644 6.471 5.659 5.030 4.159 2.483 2.868 124<br />
Cehegín ...................................... 867 776 785 752 700 637 374 465 -<br />
Cieza........................................... 1.251 1.075 1.153 979 816 758 611 602 -<br />
Jumil<strong>la</strong> ........................................ 1.215 1.123 1.068 1.128 858 790 580 659 4<br />
Lorca........................................... 3.184 2.875 2.638 2.844 2.636 2.259 1.301 1.740 20<br />
Molina <strong>de</strong> Segura........................ 911 864 860 697 516 523 353 516 12<br />
Moratal<strong>la</strong>..................................... 785 606 730 690 562 502 323 438 16<br />
Mu<strong>la</strong>............................................ 806 739 730 823 661 549 383 403 4<br />
Murcia......................................... 13.327 12.002 11.026 9.859 9.125 7.392 4.503 5.096 122<br />
San Javier................................... 446 365 306 295 318 157 138 181 -<br />
Torre Pacheco ............................ 659 454 551 521 387 349 243 308 4<br />
Totana......................................... 806 801 725 673 650 672 434 457 4<br />
Unión (La)................................... 486 505 509 423 345 266 175 249 8<br />
Yec<strong>la</strong>........................................... 1.193 1.081 1.225 1.054 1.114 825 598 695 4<br />
Nota: Sólo hay datos para los municipios mayores <strong>de</strong> 10.000 habitantes.<br />
Fuente: INE. Censos <strong>de</strong> Pob<strong>la</strong>ción.<br />
Estadísticas Históricas <strong>de</strong> Pob<strong>la</strong>ción <strong>de</strong> <strong>la</strong> Región <strong>de</strong> Murcia.
Censos <strong>de</strong> Pob<strong>la</strong>ción. Datos Municipales.<br />
2.10.2. ESTRUCTURA POR SEXO Y GRUPOS DE EDAD DE LA POBLACIÓN DE DERECHO<br />
SEGÚN EL CENSO DE 1960. HOMBRES. (Continúa)<br />
MUNICIPIOS TOTAL Menos<br />
<strong>de</strong> 5<br />
Estadísticas Históricas <strong>de</strong> Pob<strong>la</strong>ción <strong>de</strong> <strong>la</strong> Región <strong>de</strong> Murcia.<br />
EDAD<br />
5-9 10-14 15-19 20-24 25-29 30-34 35-39<br />
Águi<strong>la</strong>s....................................... 7.450 800 717 812 603 449 654 572 564<br />
Alcantaril<strong>la</strong>................................. 7.467 893 809 721 540 504 656 596 608<br />
Alhama <strong>de</strong> Murcia ..................... 5.710 590 408 497 420 435 501 485 381<br />
Caravaca ................................... 10.349 1.278 1.098 946 966 646 701 829 783<br />
Cartagena.................................. 61.835 6.429 5.511 5.207 4.459 7.728 5.255 4.918 4.482<br />
Cehegín..................................... 7.959 780 808 768 692 491 571 692 555<br />
Cieza ......................................... 10.925 1.332 1.180 1.015 986 758 838 843 846<br />
Jumil<strong>la</strong> ....................................... 10.623 1.095 971 992 840 773 773 805 749<br />
Lorca ......................................... 28.808 2.762 2.723 3.100 2.300 2.656 2.325 2.157 1.973<br />
Molina <strong>de</strong> Segura ...................... 7.947 1.042 743 724 696 561 676 557 453<br />
Moratal<strong>la</strong>.................................... 7.193 722 654 718 534 534 542 582 546<br />
Mu<strong>la</strong>........................................... 7.280 735 623 671 643 556 608 464 520<br />
Murcia........................................ 120.611 14.503 13.903 12.970 9.686 8.233 9.783 9.770 8.737<br />
San Javier ................................. 6.049 251 253 227 527 3.340 293 225 181<br />
Torre Pacheco........................... 5.680 464 408 456 498 1.123 453 359 307<br />
Totana ....................................... 6.859 647 524 700 592 492 548 441 485<br />
Unión (La).................................. 5.684 792 743 600 446 385 426 483 467<br />
Yec<strong>la</strong> ......................................... 10.237 1.087 909 866 736 689 771 941 756<br />
2.10.2. ESTRUCTURA POR SEXO Y GRUPOS DE EDAD DE LA POBLACIÓN DE DERECHO<br />
SEGÚN EL CENSO DE 1960. HOMBRES. (Conclusión)<br />
MUNICIPIOS<br />
EDAD<br />
40-44 45-49 50-54 55-59 60-64 65-69 70-74 75 y más<br />
Águi<strong>la</strong>s........................................ 363 331 366 339 288 237 209 146 -<br />
Alcantaril<strong>la</strong>.................................. 400 404 340 276 244 200 124 152 -<br />
Alhama <strong>de</strong> Murcia ...................... 303 280 412 330 264 167 132 105 -<br />
Caravaca .................................... 537 502 436 440 385 339 257 206 -<br />
Cartagena................................... 3.214 3.198 3.067 2.475 2.151 1.774 983 984 -<br />
Cehegín...................................... 418 382 450 350 290 318 197 197 -<br />
Cieza .......................................... 554 506 530 449 313 341 241 193 -<br />
Jumil<strong>la</strong> ........................................ 613 502 510 562 438 390 307 303 -<br />
Lorca .......................................... 1.518 1.352 1.208 1.312 1.170 980 609 663 -<br />
Molina <strong>de</strong> Segura ....................... 402 418 441 326 251 231 179 247 -<br />
Moratal<strong>la</strong>..................................... 383 299 391 347 315 251 156 211 8<br />
Mu<strong>la</strong>............................................ 408 316 364 408 344 244 168 204 4<br />
Murcia......................................... 6.305 5.557 5.284 4.515 4.078 3.282 1.909 2072 24<br />
San Javier .................................. 173 155 107 81 92 48 48 48 -<br />
Torre Pacheco............................ 299 213 236 251 183 157 116 157 -<br />
Totana ........................................ 397 365 377 310 306 274 214 183 4<br />
Unión (La)................................... 239 239 247 183 162 118 53 97 4<br />
Yec<strong>la</strong> .......................................... 539 527 547 472 460 374 287 276 -<br />
Nota: Sólo hay datos para los municipios mayores <strong>de</strong> 10.000 habitantes.<br />
Fuente: INE. Censos <strong>de</strong> Pob<strong>la</strong>ción.<br />
No<br />
consta<br />
85
Censos <strong>de</strong> Pob<strong>la</strong>ción. Datos Municipales.<br />
2.10.3. ESTRUCTURA POR SEXO Y GRUPOS DE EDAD DE LA POBLACIÓN DE DERECHO<br />
SEGÚN EL CENSO DE 1960. MUJERES. (Continúa)<br />
86<br />
MUNICIPIOS TOTAL Menos<br />
<strong>de</strong> 5<br />
EDAD<br />
5-9 10-14 15-19 20-24 25-29 30-34 35-39<br />
Águi<strong>la</strong>s....................................... 7.993 918 680 640 588 568 640 581 565<br />
Alcantaril<strong>la</strong> ................................. 8.258 909 743 724 728 643 748 715 550<br />
Alhama <strong>de</strong> Murcia...................... 6.003 497 496 473 465 388 593 469 388<br />
Caravaca ................................... 10.494 1.158 1.023 945 815 779 736 842 673<br />
Cartagena.................................. 62.118 6.480 5.037 4.577 4.547 4.701 5.043 4.945 4.364<br />
Cehegín ..................................... 7.967 832 761 663 667 603 658 548 481<br />
Cieza.......................................... 11.612 1.118 1.017 951 994 924 795 834 861<br />
Jumil<strong>la</strong> ....................................... 10.924 1.085 1.073 942 815 827 835 831 716<br />
Lorca.......................................... 30.150 2.716 2.587 2.715 2.450 2.281 2.406 2.289 2.021<br />
Molina <strong>de</strong> Segura....................... 8.361 846 699 786 758 687 762 529 537<br />
Moratal<strong>la</strong>.................................... 6.837 761 578 669 498 554 550 498 438<br />
Mu<strong>la</strong>........................................... 7.440 675 630 614 638 537 622 557 529<br />
Murcia........................................ 129.005 14.200 12.767 12.040 10.045 10.309 10.606 10.357 9.255<br />
San Javier.................................. 4.747 498 437 448 359 335 359 479 378<br />
Torre Pacheco ........................... 5.504 585 442 515 470 421 438 364 405<br />
Totana........................................ 7.416 626 653 584 649 583 579 475 475<br />
Unión (La).................................. 5.829 828 738 536 399 464 445 445 350<br />
Yec<strong>la</strong>.......................................... 10.745 1.044 810 786 774 678 818 838 690<br />
2.10.3. ESTRUCTURA POR SEXO Y GRUPOS DE EDAD DE LA POBLACIÓN DE DERECHO<br />
SEGÚN EL CENSO DE 1960. MUJERES. (Conclusión)<br />
MUNICIPIOS<br />
EDAD<br />
40-44 45-49 50-54 55-59 60-64 65-69 70-74 75 y más<br />
Águi<strong>la</strong>s........................................ 386 394 418 382 370 326 235 294 8<br />
Alcantaril<strong>la</strong> .................................. 392 465 408 315 340 214 146 194 24<br />
Alhama <strong>de</strong> Murcia....................... 326 341 357 345 291 217 155 190 12<br />
Caravaca .................................... 579 516 496 512 350 433 291 346 -<br />
Cartagena................................... 3.618 3.446 3.404 3.184 2.879 2.385 1.500 1.884 124<br />
Cehegín ...................................... 449 394 335 402 410 319 177 268 -<br />
Cieza........................................... 697 569 623 530 503 417 370 409 -<br />
Jumil<strong>la</strong> ........................................ 602 621 558 566 420 400 273 356 4<br />
Lorca........................................... 1.666 1.523 1.430 1.532 1.466 1.279 692 1.077 20<br />
Molina <strong>de</strong> Segura........................ 509 446 419 371 265 292 174 269 12<br />
Moratal<strong>la</strong>..................................... 402 307 339 343 247 251 167 227 8<br />
Mu<strong>la</strong>............................................ 398 423 366 415 317 305 215 199 -<br />
Murcia......................................... 7.022 6.445 5.742 5.344 5.047 4.110 2.594 3.024 98<br />
San Javier................................... 273 210 199 214 226 109 90 133 -<br />
Torre Pacheco ............................ 360 241 315 270 204 192 127 151 4<br />
Totana......................................... 409 436 348 363 344 398 220 274 -<br />
Unión (La)................................... 247 266 262 240 183 148 122 152 4<br />
Yec<strong>la</strong>........................................... 654 554 678 582 654 451 311 419 4<br />
Nota: Sólo hay datos para los municipios mayores <strong>de</strong> 10.000 habitantes.<br />
Fuente: INE. Censos <strong>de</strong> Pob<strong>la</strong>ción.<br />
No<br />
consta<br />
Estadísticas Históricas <strong>de</strong> Pob<strong>la</strong>ción <strong>de</strong> <strong>la</strong> Región <strong>de</strong> Murcia.
Censos <strong>de</strong> Pob<strong>la</strong>ción. Datos Municipales.<br />
2.11.1. ESTRUCTURA POR SEXO Y GRUPOS DE EDAD DE LA POBLACIÓN DE DERECHO<br />
SEGÚN EL CENSO DE 1970. AMBOS SEXOS. (Continúa)<br />
MUNICIPIOS TOTAL<br />
(1)<br />
Menos<br />
<strong>de</strong> 5<br />
Estadísticas Históricas <strong>de</strong> Pob<strong>la</strong>ción <strong>de</strong> <strong>la</strong> Región <strong>de</strong> Murcia.<br />
EDAD<br />
5-9 10-14 15-19 20-24 25-29 30-34 35-39<br />
Abarán................................... 10.201 1.056 895 824 733 727 559 612 749<br />
Águi<strong>la</strong>s................................... 17.187 1.651 1.648 1.748 1.478 1.358 990 896 1.064<br />
Alcantaril<strong>la</strong>............................. 20.070 2.473 2.188 1.931 1.590 1.525 1.251 1.451 1.359<br />
Alhama <strong>de</strong> Murcia ................. 11.599 1.106 1.106 1.018 924 764 722 669 891<br />
Archena ................................. 10.108 1.196 1.204 980 755 696 526 768 705<br />
Caravaca ............................... 18.783 1.812 1.848 1.977 1.591 1.236 961 1.043 1.266<br />
Cartagena.............................. 143.472 16.324 15.121 13.399 11.152 9.855 8.741 9.148 10.473<br />
Cehegín................................. 12.721 1.252 1.368 1.278 962 845 709 713 840<br />
Cieza ..................................... 26.089 2.812 2.721 2.537 1.999 1.791 1.560 1.588 1.675<br />
Jumil<strong>la</strong> ................................... 20.268 2.247 1.971 1.912 1.724 1.370 1.162 1.017 1.210<br />
Lorca ..................................... 60.283 6.161 6.048 5.256 4.855 4.669 3.719 3.705 4.033<br />
Molina <strong>de</strong> Segura .................. 23.579 2.893 2.755 2.538 1.986 1.824 1.502 1.405 1.515<br />
Moratal<strong>la</strong>................................ 10.664 916 952 1.062 753 724 600 621 782<br />
Mu<strong>la</strong>....................................... 14.122 1.358 1.288 1.216 1.110 991 850 790 892<br />
Murcia.................................... 243.705 27.075 25.759 23.223 19.647 17.081 14.867 15.680 16.667<br />
San Javier ............................. 10.286 1.255 1.099 926 807 749 639 713 727<br />
Torre Pacheco....................... 13.007 1.491 1.352 1.151 995 947 853 902 921<br />
Totana ................................... 16.299 1.657 1.457 1.282 1.169 1.191 975 1.037 1.120<br />
Unión (La).............................. 13.226 1.648 1.580 1.428 1.237 964 803 862 902<br />
Yec<strong>la</strong> ..................................... 20.817 2.002 2.050 1.831 1.542 1.414 1.046 1.095 1.356<br />
2.11.1. ESTRUCTURA POR SEXO Y GRUPOS DE EDAD DE LA POBLACIÓN DE DERECHO<br />
SEGÚN EL CENSO DE 1970. AMBOS SEXOS. (Conclusión)<br />
MUNICIPIOS<br />
EDAD<br />
40-44 45-49 50-54 55-59 60-64 65-69 70-74 75 y más<br />
Abarán..................................... 744 635 458 469 485 479 368 434 -<br />
Águi<strong>la</strong>s..................................... 1.152 1.113 762 730 719 676 538 662 -<br />
Alcantaril<strong>la</strong>............................... 1.303 1.179 828 745 725 559 463 493 -<br />
Alhama <strong>de</strong> Murcia ................... 882 684 475 538 580 508 349 405 -<br />
Archena ................................... 666 469 425 437 425 374 272 229 -<br />
Caravaca ................................. 1.384 1.227 824 783 883 780 523 649 -<br />
Cartagena................................ 9.799 8.889 6.305 5.824 5.639 4.645 3.579 4.579 -<br />
Cehegín................................... 819 744 589 610 558 545 460 425 -<br />
Cieza ....................................... 1.763 1.673 1.200 1.033 1.020 951 806 975 -<br />
Jumil<strong>la</strong> ..................................... 1.303 1.282 1.042 911 832 873 632 790 -<br />
Lorca ....................................... 3.952 3.596 2.860 2.590 2.627 2.418 1.725 2.069 -<br />
Molina <strong>de</strong> Segura .................... 1.469 1.271 1.042 932 825 684 400 538 -<br />
Moratal<strong>la</strong>.................................. 779 620 542 440 591 488 362 403 -<br />
Mu<strong>la</strong>......................................... 943 884 759 622 715 688 447 570 -<br />
Murcia...................................... 16.730 14.582 10.973 10.391 9.929 7.955 5.909 7.237 -<br />
San Javier ............................... 745 584 372 422 386 306 284 276 -<br />
Torre Pacheco......................... 875 774 559 470 551 516 303 353 -<br />
Totana ..................................... 1.013 972 850 727 700 779 671 705 -<br />
Unión (La)................................ 807 668 536 473 420 332 303 256 -<br />
Yec<strong>la</strong> ....................................... 1.509 1.461 951 957 915 955 865 871 -<br />
Nota: Sólo hay datos para los municipios mayores <strong>de</strong> 10.000 habitantes.<br />
(1) Se han respetado los totales <strong>de</strong> <strong>la</strong> <strong>pob<strong>la</strong>ción</strong> que ofrece el Censo <strong>de</strong> 1970, aúnque en <strong>la</strong> mayoría <strong>de</strong> los casos no son el sumatorio <strong>de</strong> <strong>la</strong> estructura por edad.<br />
Fuente: INE. Censos <strong>de</strong> Pob<strong>la</strong>ción.<br />
No<br />
consta<br />
87
Censos <strong>de</strong> Pob<strong>la</strong>ción. Datos Municipales.<br />
2.11.2. ESTRUCTURA POR SEXO Y GRUPOS DE EDAD DE LA POBLACIÓN DE DERECHO<br />
SEGÚN EL CENSO DE 1970. HOMBRES. (Continúa)<br />
88<br />
MUNICIPIOS TOTAL<br />
(1)<br />
Menos<br />
<strong>de</strong> 5<br />
EDAD<br />
5-9 10-14 15-19 20-24 25-29 30-34 35-39<br />
Abarán ................................... 4.965 552 475 424 341 396 266 295 358<br />
Águi<strong>la</strong>s................................... 8.396 846 833 859 745 724 479 447 504<br />
Alcantaril<strong>la</strong> ............................. 9.644 1.190 1.123 980 750 745 588 700 690<br />
Alhama <strong>de</strong> Murcia.................. 5.673 551 553 504 472 375 357 356 435<br />
Archena ................................. 4.954 573 636 488 353 358 265 371 357<br />
Caravaca ............................... 9.405 972 1.007 993 795 676 525 464 645<br />
Cartagena.............................. 70.460 8.648 7.699 6.920 5.632 5.233 4.156 4.413 5.307<br />
Cehegín ................................. 6.333 640 748 681 476 409 383 327 431<br />
Cieza...................................... 12.705 1.431 1.345 1.368 1.066 879 764 781 830<br />
Jumil<strong>la</strong> ................................... 10.072 1.212 1.036 910 871 741 590 512 551<br />
Lorca...................................... 29.805 3.152 3.073 2.658 2.472 2.399 1.831 1.857 2.025<br />
Molina <strong>de</strong> Segura................... 11.518 1.458 1.400 1.300 991 919 753 654 744<br />
Moratal<strong>la</strong>................................ 5.457 471 464 525 437 369 325 312 414<br />
Mu<strong>la</strong>....................................... 6.946 664 633 612 564 530 411 406 420<br />
Murcia.................................... 117.960 13.681 13.065 11.767 10.106 8.648 7.579 7.347 7.957<br />
San Javier.............................. 5.089 666 586 428 469 415 298 367 344<br />
Torre Pacheco ....................... 6.576 800 717 589 512 452 453 444 463<br />
Totana.................................... 8.003 883 786 624 595 661 464 499 577<br />
Unión (La).............................. 6.488 852 789 675 644 521 356 415 464<br />
Yec<strong>la</strong>...................................... 10.194 995 1.043 937 800 724 489 554 677<br />
2.11.2. ESTRUCTURA POR SEXO Y GRUPOS DE EDAD DE LA POBLACIÓN DE DERECHO<br />
SEGÚN EL CENSO DE 1970. HOMBRES. (Conclusión)<br />
MUNICIPIOS<br />
EDAD<br />
40-44 45-49 50-54 55-59 60-64 65-69 70-74 75 y más<br />
No<br />
consta<br />
Abarán ..................................... 374 309 209 218 236 208 143 179 -<br />
Águi<strong>la</strong>s..................................... 573 581 374 332 335 284 221 256 -<br />
Alcantaril<strong>la</strong> ............................... 659 556 403 334 312 217 189 206 -<br />
Alhama <strong>de</strong> Murcia.................... 445 344 214 240 279 255 156 155 -<br />
Archena ................................... 339 238 184 229 204 146 139 72 -<br />
Caravaca ................................. 691 606 399 360 418 358 265 236 -<br />
Cartagena................................ 4.729 4.431 3.011 2.785 2.469 1.958 1.428 1.641 -<br />
Cehegín ................................... 407 382 239 286 293 231 214 184 -<br />
Cieza........................................ 896 809 562 435 450 416 314 363 -<br />
Jumil<strong>la</strong> ..................................... 641 650 508 406 402 390 290 367 -<br />
Lorca........................................ 1.972 1.798 1.353 1.289 1.179 1.106 790 851 -<br />
Molina <strong>de</strong> Segura..................... 724 603 466 448 395 275 174 212 -<br />
Moratal<strong>la</strong>.................................. 397 314 266 199 279 262 189 205 -<br />
Mu<strong>la</strong>......................................... 479 414 402 254 336 329 226 266 -<br />
Murcia...................................... 8.145 6.790 5.008 4.731 4.532 3.457 2.490 2.657 -<br />
San Javier................................ 346 271 205 190 174 130 93 107 -<br />
Torre Pacheco ......................... 456 385 280 239 241 254 155 139 -<br />
Totana...................................... 485 464 403 367 331 312 298 257 -<br />
Unión (La)................................ 405 338 255 205 224 131 123 90 -<br />
Yec<strong>la</strong>........................................ 759 776 452 454 417 399 364 356 -<br />
Nota: Sólo hay datos para los municipios mayores <strong>de</strong> 10.000 habitantes.<br />
(1) Se han respetado los totales <strong>de</strong> <strong>la</strong> <strong>pob<strong>la</strong>ción</strong> que ofrece el Censo <strong>de</strong> 1970, aúnque en <strong>la</strong> mayoría <strong>de</strong> los casos no son el sumatorio <strong>de</strong> <strong>la</strong> estructura por edad.<br />
Fuente: INE. Censos <strong>de</strong> Pob<strong>la</strong>ción.<br />
Estadísticas Históricas <strong>de</strong> Pob<strong>la</strong>ción <strong>de</strong> <strong>la</strong> Región <strong>de</strong> Murcia.
Censos <strong>de</strong> Pob<strong>la</strong>ción. Datos Municipales.<br />
2.11.3. ESTRUCTURA POR SEXO Y GRUPOS DE EDAD DE LA POBLACIÓN DE DERECHO<br />
SEGÚN EL CENSO DE 1970. MUJERES. (Continúa)<br />
MUNICIPIOS TOTAL Menos<br />
<strong>de</strong> 5<br />
Estadísticas Históricas <strong>de</strong> Pob<strong>la</strong>ción <strong>de</strong> <strong>la</strong> Región <strong>de</strong> Murcia.<br />
EDAD<br />
5-9 10-14 15-19 20-24 25-29 30-34 35-39<br />
Abarán................................... 5.236 504 420 400 392 331 293 317 391<br />
Águi<strong>la</strong>s................................... 8.791 805 815 889 733 634 511 449 560<br />
Alcantaril<strong>la</strong>............................. 10.426 1.283 1.065 951 840 780 663 751 669<br />
Alhama <strong>de</strong> Murcia ................. 5.926 555 553 514 452 389 365 313 456<br />
Archena ................................. 5.154 623 568 492 402 338 261 397 348<br />
Caravaca ............................... 9.378 840 841 984 796 560 436 579 621<br />
Cartagena.............................. 73.012 7.676 7.422 6.479 5.520 4.622 4.585 4.735 5.166<br />
Cehegín................................. 6.388 612 620 597 486 436 326 386 409<br />
Cieza ..................................... 13.384 1.381 1.376 1.169 933 912 796 807 845<br />
Jumil<strong>la</strong> ................................... 10.196 1.035 935 1.002 853 629 572 505 659<br />
Lorca ..................................... 30.478 3.009 2.975 2.598 2.383 2.270 1.888 1.848 2.008<br />
Molina <strong>de</strong> Segura .................. 12.061 1.435 1.355 1.238 995 905 749 751 771<br />
Moratal<strong>la</strong>................................ 5.207 445 488 537 316 355 275 309 368<br />
Mu<strong>la</strong>....................................... 7.176 694 655 604 546 461 439 384 472<br />
Murcia.................................... 125.745 13.394 12.694 11.456 9.541 8.433 7.288 8.333 8.710<br />
San Javier ............................. 5.197 589 513 498 338 334 341 346 383<br />
Torre Pacheco....................... 6.431 691 635 562 483 495 400 458 458<br />
Totana ................................... 8.296 774 671 658 574 530 511 538 543<br />
Unión (La).............................. 6.738 796 791 753 593 443 447 447 438<br />
Yec<strong>la</strong> ..................................... 10.623 1.007 1.007 894 742 690 557 541 679<br />
2.11.3. ESTRUCTURA POR SEXO Y GRUPOS DE EDAD DE LA POBLACIÓN DE DERECHO<br />
SEGÚN EL CENSO DE 1970. MUJERES. (Conclusión)<br />
MUNICIPIOS<br />
EDAD<br />
40-44 45-49 50-54 55-59 60-64 65-69 70-74 75 y más<br />
No<br />
consta<br />
Abarán..................................... 370 326 249 251 249 271 225 255 -<br />
Águi<strong>la</strong>s..................................... 579 532 388 398 384 392 317 406 -<br />
Alcantaril<strong>la</strong>............................... 644 623 425 411 413 342 274 287 -<br />
Alhama <strong>de</strong> Murcia ................... 437 340 261 298 301 253 193 250 -<br />
Archena ................................... 327 231 241 208 221 228 133 157 -<br />
Caravaca ................................. 693 621 425 423 465 422 258 413 -<br />
Cartagena................................ 5.070 4.458 3.294 3.039 3.170 2.687 2.151 2.938 -<br />
Cehegín................................... 412 362 350 324 265 314 246 241 -<br />
Cieza ....................................... 867 864 638 598 570 535 492 612 -<br />
Jumil<strong>la</strong> ..................................... 662 632 534 505 430 483 342 423 -<br />
Lorca ....................................... 1.980 1.798 1.507 1.301 1.448 1.312 935 1.218 -<br />
Molina <strong>de</strong> Segura .................... 745 668 576 484 430 409 226 326 -<br />
Moratal<strong>la</strong>.................................. 382 306 276 241 312 226 173 198 -<br />
Mu<strong>la</strong>......................................... 464 470 357 368 379 359 221 304 -<br />
Murcia...................................... 8.585 7.792 5.965 5.660 5.397 4.498 3.419 4.580 -<br />
San Javier ............................... 399 313 167 232 212 176 191 169 -<br />
Torre Pacheco......................... 419 389 279 231 310 262 148 214 -<br />
Totana ..................................... 528 508 447 360 369 467 373 448 -<br />
Unión (La)................................ 402 330 281 268 196 201 180 166 -<br />
Yec<strong>la</strong> ....................................... 750 685 499 503 498 556 501 515 -<br />
Nota: Sólo hay datos para los municipios mayores <strong>de</strong> 10.000 habitantes.<br />
(1) Se han respetado los totales <strong>de</strong> <strong>la</strong> <strong>pob<strong>la</strong>ción</strong> que ofrece el Censo <strong>de</strong> 1970, aúnque en <strong>la</strong> mayoría <strong>de</strong> los casos no son el sumatorio <strong>de</strong> <strong>la</strong> estructura por edad.<br />
Fuente: INE. Censos <strong>de</strong> Pob<strong>la</strong>ción.<br />
89
Censos <strong>de</strong> Pob<strong>la</strong>ción. Datos Municipales.<br />
2.12. ESTRUCTURA POR SEXO Y GRUPOS DE EDAD DE LA POBLACIÓN DE DERECHO SEGÚN<br />
EL CENSO DE 1981. DATOS PORCENTUALES.<br />
90<br />
MUNICIPIOS Menor<br />
16 años<br />
AMBOS SEXOS HOMBRES MUJERES<br />
De 16<br />
a 64<br />
De 65 y<br />
más<br />
Menor<br />
16 años<br />
De 16<br />
a 64<br />
De 65 y<br />
más<br />
Menor<br />
16 años<br />
De 16<br />
a 64<br />
De 65 y<br />
más<br />
TOTAL ...................................... 31,0 58,8 10,2 32,5 59,0 8,5 29,5 58,7 11,9<br />
Abanil<strong>la</strong>..................................... 24,1 59,5 16,4 24,6 61,7 13,7 23,5 57,4 19,1<br />
Abarán ...................................... 29,9 56,6 13,4 32,7 56,2 11,1 27,2 57,1 15,7<br />
Agui<strong>la</strong>s...................................... 29,7 58,9 11,4 31,6 59,5 9,0 27,9 58,3 13,8<br />
Albu<strong>de</strong>ite................................... 30,8 52,2 17,0 31,4 54,1 14,5 30,3 50,3 19,4<br />
Alcantaril<strong>la</strong> ................................ 32,9 58,3 8,9 33,9 59,1 7,1 31,9 57,5 10,5<br />
Aledo ........................................ 30,0 55,6 14,4 36,2 51,8 12,0 24,0 59,3 16,7<br />
Alguazas................................... 32,0 58,4 9,7 33,0 59,9 7,1 30,9 56,9 12,2<br />
Alhama <strong>de</strong> Murcia..................... 29,9 57,7 12,4 30,8 59,1 10,1 29,1 56,3 14,5<br />
Archena .................................... 32,7 57,7 9,6 34,0 57,1 8,9 31,4 58,3 10,4<br />
Beniel........................................ 35,6 56,7 7,7 37,3 55,9 6,8 34,0 57,4 8,6<br />
B<strong>la</strong>nca....................................... 28,2 57,3 14,5 34,7 53,7 11,6 22,3 60,6 17,1<br />
Bul<strong>la</strong>s........................................ 24,8 63,6 11,6 24,6 65,6 9,8 25,1 61,6 13,3<br />
Ca<strong>la</strong>sparra ................................ 27,4 59,5 13,1 28,6 59,4 11,9 26,1 59,6 14,3<br />
Campos <strong>de</strong>l Río........................ 27,2 56,4 16,4 24,9 56,6 18,5 29,5 56,3 14,2<br />
Caravaca <strong>de</strong> <strong>la</strong> Cruz................. 27,7 59,2 13,1 28,0 60,2 11,8 27,3 58,2 14,4<br />
Cartagena................................. 31,2 59,1 9,6 33,1 59,3 7,7 29,4 59,0 11,5<br />
Cehegín .................................... 29,8 57,7 12,6 29,6 59,1 11,4 30,0 56,3 13,7<br />
Ceutí ......................................... 32,1 59,0 8,9 31,6 60,8 7,6 32,6 57,3 10,2<br />
Cieza......................................... 31,7 58,0 10,3 33,3 58,3 8,4 30,2 57,7 12,1<br />
Fortuna ..................................... 33,7 55,9 10,4 34,6 57,1 8,3 32,8 54,8 12,5<br />
Fuente Á<strong>la</strong>mo ........................... 28,2 59,5 12,2 28,6 60,4 11,0 27,9 58,7 13,4<br />
Jumil<strong>la</strong> ...................................... 30,1 57,7 12,2 31,7 57,5 10,7 28,6 57,8 13,6<br />
Libril<strong>la</strong> ....................................... 30,7 55,7 13,6 34,8 53,0 12,2 26,8 58,3 15,0<br />
Lorca......................................... 29,8 59,3 10,9 30,9 59,7 9,4 28,7 59,0 12,3<br />
Lorquí ....................................... 31,0 60,9 8,1 31,7 61,0 7,4 30,3 60,8 8,9<br />
Mazarrón................................... 30,3 59,6 10,1 31,9 59,5 8,6 28,7 59,7 11,6<br />
Molina <strong>de</strong> Segura...................... 34,2 58,4 7,4 35,3 58,6 6,2 33,1 58,3 8,5<br />
Moratal<strong>la</strong>................................... 25,8 62,1 12,1 27,0 62,7 10,3 24,6 61,5 14,0<br />
Mu<strong>la</strong>.......................................... 30,0 58,1 11,9 31,3 58,5 10,2 28,6 57,7 13,7<br />
Murcia....................................... 31,6 59,1 9,3 33,8 58,7 7,5 29,6 59,5 11,0<br />
Ojós .......................................... 19,3 71,6 9,1 16,7 75,5 7,8 21,6 68,0 10,3<br />
Pliego........................................ 29,6 57,2 13,2 31,6 57,2 11,2 27,6 57,2 15,3<br />
Puerto Lumbreras..................... 27,4 59,7 12,9 29,9 59,8 10,3 25,1 59,6 15,3<br />
Ricote ....................................... 28,1 55,9 16,0 32,3 55,1 12,5 24,1 56,7 19,2<br />
San Javier................................. 31,9 59,5 8,6 31,9 61,6 5,5 31,9 57,3 10,8<br />
San Pedro <strong>de</strong>l Pinatar............... 32,0 57,8 10,2 32,6 58,7 8,7 31,3 56,9 11,8<br />
Santomera ................................ 28,7 60,8 10,5 30,0 60,7 9,3 27,3 60,9 11,8<br />
Torre Pacheco .......................... 31,4 59,6 9,0 32,1 69,9 8,0 30,8 59,2 10,0<br />
Torres <strong>de</strong> Cotil<strong>la</strong>s (Las) ............ 35,4 56,5 8,1 35,6 57,1 7,3 35,2 56,0 8,8<br />
Totana....................................... 30,0 58,1 11,9 30,5 60,0 9,5 29,5 56,2 14,3<br />
Ulea .......................................... 30,8 56,7 12,4 31,3 58,0 10,7 30,4 55,5 14,0<br />
Unión (La)................................. 34,4 57,3 8,2 36,2 57,5 6,3 32,7 57,2 10,1<br />
Vil<strong>la</strong>nueva <strong>de</strong>l Río Segura ........ 31,4 57,1 11,5 32,9 59,6 7,5 29,9 54,6 15,5<br />
Yec<strong>la</strong>......................................... 29,2 58,5 12,3 30,3 59,5 10,2 28,2 57,5 14,3<br />
Nota: Existen datos absolutos para Murcia, Cartagena y Lorca.<br />
Fuente: INE.Censos <strong>de</strong> Pob<strong>la</strong>ción.<br />
Estadísticas Históricas <strong>de</strong> Pob<strong>la</strong>ción <strong>de</strong> <strong>la</strong> Región <strong>de</strong> Murcia.
Censos <strong>de</strong> Pob<strong>la</strong>ción. Datos Municipales.<br />
2.13.1. ESTRUCTURA POR SEXO Y GRUPOS DE EDAD DE LA POBLACIÓN DE DERECHO<br />
SEGÚN EL CENSO DE 1991. AMBOS SEXOS. (Continúa)<br />
MUNICIPIOS TOTAL Menos<br />
<strong>de</strong> 5<br />
Estadísticas Históricas <strong>de</strong> Pob<strong>la</strong>ción <strong>de</strong> <strong>la</strong> Región <strong>de</strong> Murcia.<br />
EDAD<br />
5-9 10-14 15-19 20-24 25-29 30-34 35-39 40-44<br />
Abanil<strong>la</strong>.................................. 6.074 351 382 483 482 526 403 381 313 345<br />
Abarán................................... 11.865 730 858 1.046 1.087 1.037 898 802 656 611<br />
Agui<strong>la</strong>s................................... 24.894 1.728 2.029 2.364 2.303 1.997 1.928 1.910 1.593 1.510<br />
Albu<strong>de</strong>ite ............................... 1.411 91 96 127 141 133 122 90 65 71<br />
Alcantaril<strong>la</strong>............................. 30.144 2.232 2.427 2.908 2.875 2.731 2.663 2.301 1.931 1.715<br />
Alcázares (Los) ..................... 3.683 268 269 325 333 334 264 258 209 205<br />
Aledo ..................................... 985 38 42 77 93 111 80 57 52 55<br />
Alguazas................................ 6.931 465 587 685 653 616 529 535 434 378<br />
Alhama <strong>de</strong> Murcia ................. 14.175 768 989 1.225 1.278 1.269 1.155 1.013 798 776<br />
Archena ................................. 13.487 958 1.012 1.245 1.282 1.277 1.115 953 721 701<br />
Beniel .................................... 7.220 545 590 726 664 668 635 518 449 378<br />
B<strong>la</strong>nca ................................... 5.768 315 427 485 508 536 417 378 316 282<br />
Bul<strong>la</strong>s..................................... 10.009 594 626 778 810 930 835 749 561 471<br />
Ca<strong>la</strong>sparra............................. 8.745 515 566 649 764 785 714 598 499 469<br />
Campos <strong>de</strong>l Río..................... 1.949 141 145 163 169 200 164 144 96 84<br />
Caravaca <strong>de</strong> <strong>la</strong> Cruz.............. 21.296 1.328 1.369 1.655 1.734 1.739 1.730 1.608 1.203 1.106<br />
Cartagena.............................. 168.023 10.106 12.034 15.002 15.613 14.935 13.469 12.209 10.355 9.555<br />
Cehegín................................. 13.614 760 895 1.108 1.232 1.201 1.085 933 702 706<br />
Ceutí...................................... 6.411 471 498 636 612 647 562 497 348 312<br />
Cieza ..................................... 30.875 2.130 2.514 2.753 2.823 2.772 2.573 2.225 1.685 1.566<br />
Fortuna .................................. 6.004 443 502 563 600 557 484 440 322 300<br />
Fuente Á<strong>la</strong>mo ........................ 8.279 464 529 640 712 717 652 543 419 422<br />
Jumil<strong>la</strong> ................................... 20.092 1.893 1.473 1.784 1.743 1.573 1.463 1.443 1.137 1.032<br />
Libril<strong>la</strong>.................................... 3.764 195 267 296 357 334 300 216 215 211<br />
Lorca ..................................... 65.919 3.993 4.594 5.811 5.946 5.638 5.175 4.407 3.890 3.890<br />
Lorquí .................................... 5.328 362 426 528 459 515 436 387 331 276<br />
Mazarrón ............................... 14.591 1.129 1.250 1.292 1.158 1.197 1.279 1.203 923 775<br />
Molina <strong>de</strong> Segura .................. 37.806 2.692 3.086 3.741 3.453 3.495 3.248 3.147 2.558 2.354<br />
Moratal<strong>la</strong>................................ 8.976 474 570 645 759 732 640 613 456 462<br />
Mu<strong>la</strong>....................................... 13.053 825 916 1.123 1.130 1.135 1.002 947 754 695<br />
Murcia.................................... 328.100 20.617 23.338 29.853 31.285 30.203 26.626 23.584 20.144 19.189<br />
Ojós ....................................... 678 39 50 57 47 48 67 49 36 45<br />
Pliego .................................... 3.327 194 204 266 296 317 258 191 152 163<br />
Puerto Lumbreras.................. 9.961 587 690 788 775 802 715 641 584 601<br />
Ricote .................................... 1.689 73 93 129 132 178 133 96 61 75<br />
San Javier ............................. 14.696 1.078 1.179 1.310 1.290 1.482 1.244 1.097 931 826<br />
San Pedro <strong>de</strong>l Pinatar ........... 12.057 925 977 1.082 1.060 1.063 1.097 932 744 617<br />
Santomera............................. 8.518 606 591 708 690 802 758 607 538 443<br />
Torre Pacheco....................... 16.568 1.209 1.356 1.509 1.548 1.553 1.448 1.229 934 884<br />
Torres <strong>de</strong> Cotil<strong>la</strong>s (Las) ......... 14.132 1.034 1.181 1.494 1.363 1.207 1.084 1.104 972 874<br />
Totana ................................... 20.466 1.124 1.423 1.824 1.915 1.739 1.597 1.385 1.156 1.202<br />
Ulea ....................................... 1.073 44 54 82 104 123 82 70 30 62<br />
Unión (La).............................. 13.940 1.019 1.156 1.362 1.320 1.276 1.091 1.080 954 750<br />
Vil<strong>la</strong>nueva <strong>de</strong>l Río Segura..... 1.663 73 117 168 156 150 121 75 102 97<br />
Yec<strong>la</strong> ..................................... 27.362 1.862 1.885 2.407 2.383 2.177 2.374 2.149 1.752 1.517<br />
91
Censos <strong>de</strong> Pob<strong>la</strong>ción. Datos Municipales.<br />
2.13.1. ESTRUCTURA POR SEXO Y GRUPOS DE EDAD DE LA POBLACIÓN DE DERECHO<br />
SEGÚN EL CENSO DE 1991. AMBOS SEXOS. (Conclusión)<br />
92<br />
MUNICIPIOS<br />
EDAD<br />
45-49 50-54 55-59 60-64 65-69 70-74 75-79 80-84 85 y más<br />
No<br />
consta<br />
Abanil<strong>la</strong>.................................... 278 284 394 400 335 248 190 171 108 -<br />
Abarán ..................................... 569 648 664 631 580 362 296 224 166 -<br />
Agui<strong>la</strong>s..................................... 1.151 1.030 1.189 1.202 1.123 665 547 385 240 -<br />
Albu<strong>de</strong>ite.................................. 57 73 76 66 60 49 48 26 20 -<br />
Alcantaril<strong>la</strong> ............................... 1.460 1.376 1.384 1.242 1.073 715 540 364 207 -<br />
Alcázares (Los)........................ 189 196 183 187 168 115 94 62 24 -<br />
Aledo ....................................... 52 58 62 78 49 26 15 19 21 -<br />
Alguazas.................................. 327 336 323 328 293 163 157 70 52 -<br />
Alhama <strong>de</strong> Murcia.................... 699 698 880 795 607 453 343 258 171 -<br />
Archena ................................... 629 752 750 635 482 358 299 206 112 -<br />
Beniel....................................... 333 355 349 317 260 173 129 81 50 -<br />
B<strong>la</strong>nca...................................... 301 276 323 324 293 207 162 134 84 -<br />
Bul<strong>la</strong>s....................................... 527 508 599 672 501 336 210 202 100 -<br />
Ca<strong>la</strong>sparra ............................... 371 401 546 580 473 308 252 152 103 -<br />
Campos <strong>de</strong>l Río....................... 88 92 103 116 86 58 52 27 21 -<br />
Caravaca <strong>de</strong> <strong>la</strong> Cruz................ 995 1.044 1.214 1.349 1.105 783 604 443 287 -<br />
Cartagena................................ 8.515 8.698 9.323 8.620 7.302 4.723 3.649 2.407 1.508 -<br />
Cehegín ................................... 672 661 755 855 689 486 393 273 208 -<br />
Ceutí ........................................ 299 333 321 301 213 150 103 79 29 -<br />
Cieza........................................ 1.511 1.432 1.558 1.606 1.353 879 666 482 347 -<br />
Fortuna .................................... 271 263 329 274 242 160 109 85 60 -<br />
Fuente Á<strong>la</strong>mo .......................... 391 418 529 517 494 321 250 155 106 -<br />
Jumil<strong>la</strong> ..................................... 857 827 1.000 1.106 992 665 512 342 250 -<br />
Libril<strong>la</strong> ...................................... 188 213 249 208 192 124 84 76 39 -<br />
Lorca........................................ 3.428 3.289 3.606 3.570 3.145 2.109 1.595 1.095 738 -<br />
Lorquí ...................................... 228 257 287 293 204 143 106 52 38 -<br />
Mazarrón.................................. 673 690 754 715 553 369 271 224 136 -<br />
Molina <strong>de</strong> Segura..................... 1.861 1.594 1.703 1.458 1.238 881 609 433 255 -<br />
Moratal<strong>la</strong>.................................. 465 521 661 643 448 317 258 205 107 -<br />
Mu<strong>la</strong>......................................... 642 623 764 721 637 453 319 207 160 -<br />
Murcia...................................... 16.601 16.929 16.724 16.054 13.646 9.189 6.847 4.495 2.776 -<br />
Ojós ......................................... 24 32 41 40 34 22 20 15 12 -<br />
Pliego....................................... 179 183 227 211 168 129 90 59 40 -<br />
Puerto Lumbreras.................... 554 482 572 601 556 393 288 210 122 -<br />
Ricote ...................................... 82 82 145 123 86 72 46 50 33 -<br />
San Javier................................ 719 719 690 657 542 378 256 172 126 -<br />
San Pedro <strong>de</strong>l Pinatar.............. 585 615 594 539 437 306 208 166 110 -<br />
Santomera ............................... 415 388 477 475 375 243 191 112 99 -<br />
Torre Pacheco ......................... 806 790 776 778 674 434 317 200 123 -<br />
Torres <strong>de</strong> Cotil<strong>la</strong>s (Las) ........... 681 656 587 557 513 338 255 138 94 -<br />
Totana...................................... 1.047 1.078 1.167 996 960 695 507 383 268 -<br />
Ulea ......................................... 54 68 59 65 44 41 49 29 13 -<br />
Unión (La)................................ 693 587 683 676 483 311 238 163 98 -<br />
Vil<strong>la</strong>nueva <strong>de</strong>l Río Segura ....... 73 80 118 88 77 51 54 36 27 -<br />
Yec<strong>la</strong>........................................ 1.257 1.114 1.411 1.498 1.254 844 636 500 342 -<br />
Fuente: Consejería <strong>de</strong> Economía y Hacienda. Centro Regional <strong>de</strong> Estadística. Censo <strong>de</strong> Pob<strong>la</strong>ción <strong>de</strong> 1991 <strong>de</strong> <strong>la</strong> Región <strong>de</strong> Murcia. Resultados Municipales<br />
Estadísticas Históricas <strong>de</strong> Pob<strong>la</strong>ción <strong>de</strong> <strong>la</strong> Región <strong>de</strong> Murcia.
Censos <strong>de</strong> Pob<strong>la</strong>ción. Datos Municipales.<br />
2.13.2. ESTRUCTURA POR SEXO Y GRUPOS DE EDAD DE LA POBLACIÓN DE DERECHO<br />
SEGÚN EL CENSO DE 1991. HOMBRES. (Continúa)<br />
MUNICIPIOS TOTAL Menos<br />
<strong>de</strong> 5<br />
Estadísticas Históricas <strong>de</strong> Pob<strong>la</strong>ción <strong>de</strong> <strong>la</strong> Región <strong>de</strong> Murcia.<br />
EDAD<br />
5-9 10-14 15-19 20-24 25-29 30-34 35-39 40-44<br />
Abanil<strong>la</strong>.................................. 2.989 196 191 241 254 263 223 188 166 169<br />
Abarán................................... 5.879 375 432 534 574 543 448 415 322 306<br />
Agui<strong>la</strong>s................................... 12.441 903 1.028 1.245 1.213 1.039 967 949 817 783<br />
Albu<strong>de</strong>ite ............................... 707 51 50 70 68 72 58 52 32 38<br />
Alcantaril<strong>la</strong>............................. 14.628 1.127 1.217 1.444 1.426 1.335 1.321 1.154 957 864<br />
Alcázares (Los) ..................... 1.792 144 133 146 184 148 136 147 92 102<br />
Aledo ..................................... 512 19 21 43 49 67 49 30 25 30<br />
Alguazas................................ 3.430 250 298 351 343 307 268 264 216 190<br />
Alhama <strong>de</strong> Murcia ................. 6.986 413 507 637 650 631 578 516 406 376<br />
Archena ................................. 6.704 514 506 635 648 642 562 501 360 341<br />
Beniel .................................... 3.591 267 318 373 337 323 331 248 218 207<br />
B<strong>la</strong>nca ................................... 2.815 151 236 258 251 275 218 195 163 137<br />
Bul<strong>la</strong>s..................................... 5.045 318 316 397 426 481 428 394 284 242<br />
Ca<strong>la</strong>sparra............................. 4.372 271 297 319 405 403 356 333 250 228<br />
Campos <strong>de</strong>l Río..................... 964 76 61 79 76 95 90 78 56 37<br />
Caravaca <strong>de</strong> <strong>la</strong> Cruz.............. 10.551 710 685 837 868 858 891 818 613 521<br />
Cartagena.............................. 82.880 5.163 6.260 7.847 8.050 7.791 6.871 5.980 5.090 4.731<br />
Cehegín................................. 6.779 404 447 588 590 610 576 466 347 363<br />
Ceutí...................................... 3.226 253 256 337 318 346 264 260 176 165<br />
Cieza ..................................... 15.067 1.096 1.298 1.381 1.451 1.399 1.226 1.147 851 753<br />
Fortuna .................................. 3.029 232 270 294 313 292 233 236 166 166<br />
Fuente Á<strong>la</strong>mo ........................ 4.120 238 276 308 362 368 345 277 217 215<br />
Jumil<strong>la</strong> ................................... 9.967 969 745 942 876 812 742 710 568 529<br />
Libril<strong>la</strong>.................................... 1.835 102 120 142 171 184 143 116 113 104<br />
Lorca ..................................... 32.477 2.084 2.327 2.949 3.009 2.865 2.635 2.191 1.928 1.940<br />
Lorquí .................................... 2.625 169 214 256 248 261 237 194 167 139<br />
Mazarrón ............................... 7.320 579 663 650 645 559 647 591 507 411<br />
Molina <strong>de</strong> Segura .................. 18.595 1.337 1.570 1.932 1.754 1.713 1.604 1.563 1.308 1.149<br />
Moratal<strong>la</strong>................................ 4.545 254 296 336 381 379 336 296 249 228<br />
Mu<strong>la</strong>....................................... 6.489 429 460 568 593 577 515 484 403 341<br />
Murcia.................................... 159.454 10.656 12.046 15.486 15.865 15.411 13.206 11.438 9.695 9.176<br />
Ojós ....................................... 333 26 24 29 21 21 44 26 21 24<br />
Pliego .................................... 1.689 101 104 142 151 178 130 117 75 83<br />
Puerto Lumbreras.................. 4.844 298 330 396 397 391 369 333 270 312<br />
Ricote .................................... 822 36 51 66 71 94 72 49 30 29<br />
San Javier ............................. 7.304 528 563 697 644 838 590 554 485 408<br />
San Pedro <strong>de</strong>l Pinatar ........... 5.965 489 513 563 555 505 532 463 391 297<br />
Santomera............................. 4.243 325 306 379 369 386 412 303 268 219<br />
Torre Pacheco....................... 8.338 622 693 774 808 771 739 645 466 445<br />
Torres <strong>de</strong> Cotil<strong>la</strong>s (Las) ......... 7.098 548 629 789 704 585 539 525 509 440<br />
Totana ................................... 10.160 586 755 923 975 879 853 682 598 623<br />
Ulea ....................................... 542 18 32 46 52 70 42 39 20 32<br />
Unión (La).............................. 6.932 519 609 722 649 668 564 530 515 404<br />
Vil<strong>la</strong>nueva <strong>de</strong>l Río Segura..... 838 44 62 89 84 79 72 37 48 48<br />
Yec<strong>la</strong> ..................................... 13.605 964 948 1.247 1.211 1.111 1.187 1.108 906 779<br />
93
Censos <strong>de</strong> Pob<strong>la</strong>ción. Datos Municipales.<br />
2.13.2. ESTRUCTURA POR SEXO Y GRUPOS DE EDAD DE LA POBLACIÓN DE DERECHO<br />
SEGÚN EL CENSO DE 1991. HOMBRES. (Conclusión)<br />
94<br />
MUNICIPIOS<br />
EDAD<br />
45-49 50-54 55-59 60-64 65-69 70-74 75-79 80-84 85 y más<br />
No<br />
consta<br />
Abanil<strong>la</strong>.................................... 143 151 175 194 147 115 73 60 40 -<br />
Abarán ..................................... 273 316 328 315 276 151 124 81 66 -<br />
Agui<strong>la</strong>s..................................... 588 505 569 571 542 293 214 136 79 -<br />
Albu<strong>de</strong>ite.................................. 28 31 38 37 30 26 12 8 6 -<br />
Alcantaril<strong>la</strong> ............................... 720 667 666 573 489 298 207 109 54 -<br />
Alcázares (Los)........................ 94 102 86 84 80 53 36 18 7 -<br />
Aledo ....................................... 20 28 33 37 24 14 5 11 7 -<br />
Alguazas.................................. 160 160 154 165 131 69 63 26 15 -<br />
Alhama <strong>de</strong> Murcia.................... 360 327 427 386 286 196 132 107 51 -<br />
Archena ................................... 296 378 387 313 212 153 130 84 42 -<br />
Beniel....................................... 169 171 178 154 123 71 57 32 14 -<br />
B<strong>la</strong>nca...................................... 146 137 156 152 125 82 60 50 23 -<br />
Bul<strong>la</strong>s....................................... 253 255 280 338 263 159 97 74 40 -<br />
Ca<strong>la</strong>sparra ............................... 189 196 261 274 252 124 110 64 40 -<br />
Campos <strong>de</strong>l Río....................... 40 47 57 59 39 29 21 15 9 -<br />
Caravaca <strong>de</strong> <strong>la</strong> Cruz................ 508 481 618 668 556 361 268 184 106 -<br />
Cartagena................................ 4.113 4.191 4.586 4.108 3.419 1.999 1.436 842 403 -<br />
Cehegín ................................... 328 322 361 440 354 208 175 116 84 -<br />
Ceutí ........................................ 127 180 154 144 104 60 40 31 11 -<br />
Cieza........................................ 761 693 765 751 612 366 243 167 107 -<br />
Fortuna .................................... 126 138 152 125 120 70 39 33 24 -<br />
Fuente Á<strong>la</strong>mo .......................... 184 202 272 261 232 141 112 67 43 -<br />
Jumil<strong>la</strong> ..................................... 453 390 480 530 469 304 214 139 95 -<br />
Libril<strong>la</strong> ...................................... 97 100 121 115 87 51 29 31 9 -<br />
Lorca........................................ 1.691 1.624 1.812 1.641 1.531 939 668 402 241 -<br />
Lorquí ...................................... 103 124 125 137 105 70 41 24 11 -<br />
Mazarrón.................................. 335 335 379 373 266 162 107 72 39 -<br />
Molina <strong>de</strong> Segura..................... 937 794 806 725 546 369 251 155 82 -<br />
Moratal<strong>la</strong>.................................. 238 265 323 334 234 151 115 86 44 -<br />
Mu<strong>la</strong>......................................... 312 288 383 356 314 197 128 77 64 -<br />
Murcia...................................... 8.132 8.072 7.998 7.405 6.006 3.838 2.652 1.548 824 -<br />
Ojós ......................................... 9 17 21 13 12 12 9 3 1 -<br />
Pliego....................................... 76 96 107 107 84 65 32 24 17 -<br />
Puerto Lumbreras.................... 283 249 263 290 260 162 121 87 33 -<br />
Ricote ...................................... 40 30 75 61 44 23 16 19 16 -<br />
San Javier................................ 343 362 347 296 258 170 104 68 49 -<br />
San Pedro <strong>de</strong>l Pinatar.............. 299 272 298 271 203 137 68 74 35 -<br />
Santomera ............................... 212 188 214 236 184 109 59 46 28 -<br />
Torre Pacheco ......................... 431 388 393 387 325 197 124 81 49 -<br />
Torres <strong>de</strong> Cotil<strong>la</strong>s (Las) ........... 354 314 293 271 248 154 107 55 34 -<br />
Totana...................................... 520 527 578 467 460 306 206 143 79 -<br />
Ulea ......................................... 33 34 26 25 25 17 18 8 5 -<br />
Unión (La)................................ 318 293 317 318 217 116 89 59 25 -<br />
Vil<strong>la</strong>nueva <strong>de</strong>l Río Segura ....... 44 26 61 46 38 19 21 9 11 -<br />
Yec<strong>la</strong>........................................ 617 537 685 768 616 376 259 186 100 -<br />
Fuente: Consejería <strong>de</strong> Economía y Hacienda. Centro Regional <strong>de</strong> Estadística. Censo <strong>de</strong> Pob<strong>la</strong>ción <strong>de</strong> 1991 <strong>de</strong> <strong>la</strong> Región <strong>de</strong> Murcia. Resultados Municipales<br />
Estadísticas Históricas <strong>de</strong> Pob<strong>la</strong>ción <strong>de</strong> <strong>la</strong> Región <strong>de</strong> Murcia.
Censos <strong>de</strong> Pob<strong>la</strong>ción. Datos Municipales.<br />
2.13.3. ESTRUCTURA POR SEXO Y GRUPOS DE EDAD DE LA POBLACIÓN DE DERECHO<br />
SEGÚN EL CENSO DE 1991. MUJERES. (Continúa)<br />
MUNICIPIOS TOTAL Menos<br />
<strong>de</strong> 5<br />
Estadísticas Históricas <strong>de</strong> Pob<strong>la</strong>ción <strong>de</strong> <strong>la</strong> Región <strong>de</strong> Murcia.<br />
EDAD<br />
5-9 10-14 15-19 20-24 25-29 30-34 35-39 40-44<br />
Abanil<strong>la</strong>.................................. 3.085 155 191 242 228 263 180 193 147 176<br />
Abarán................................... 5.986 355 426 512 513 494 450 387 334 305<br />
Agui<strong>la</strong>s................................... 12.453 825 1.001 1.119 1.090 958 961 961 776 727<br />
Albu<strong>de</strong>ite ............................... 704 40 46 57 73 61 64 38 33 33<br />
Alcantaril<strong>la</strong>............................. 15.516 1.105 1.210 1.464 1.449 1.396 1.342 1.147 974 851<br />
Alcázares (Los) ..................... 1.891 124 136 179 149 186 128 111 117 103<br />
Aledo ..................................... 473 19 21 34 44 44 31 27 27 25<br />
Alguazas................................ 3.501 215 289 334 310 309 261 271 218 188<br />
Alhama <strong>de</strong> Murcia ................. 7.189 355 482 588 628 638 577 497 392 400<br />
Archena ................................. 6.783 444 506 610 634 635 553 452 361 360<br />
Beniel .................................... 3.629 278 272 353 327 345 304 270 231 171<br />
B<strong>la</strong>nca ................................... 2.953 164 191 227 257 261 199 183 153 145<br />
Bul<strong>la</strong>s..................................... 4.964 276 310 381 384 449 407 355 277 229<br />
Ca<strong>la</strong>sparra............................. 4.373 244 269 330 359 382 358 265 249 241<br />
Campos <strong>de</strong>l Río..................... 985 65 84 84 93 105 74 66 40 47<br />
Caravaca <strong>de</strong> <strong>la</strong> Cruz.............. 10.745 618 684 818 866 881 839 790 590 585<br />
Cartagena.............................. 85.143 4.943 5.774 7.155 7.563 7.144 6.598 6.229 5.265 4.824<br />
Cehegín................................. 6.835 356 448 520 642 591 509 467 355 343<br />
Ceutí...................................... 3.185 218 242 299 294 301 298 237 172 147<br />
Cieza ..................................... 15.808 1.034 1.216 1.372 1.372 1.373 1.347 1.078 834 813<br />
Fortuna .................................. 2.975 211 232 269 287 265 251 204 156 134<br />
Fuente Á<strong>la</strong>mo ........................ 4.159 226 253 332 350 349 307 266 202 207<br />
Jumil<strong>la</strong> ................................... 10.125 924 728 842 867 761 721 733 569 503<br />
Libril<strong>la</strong>.................................... 1.929 93 147 154 186 150 157 100 102 107<br />
Lorca ..................................... 33.442 1.909 2.267 2.862 2.937 2.773 2.540 2.216 1.962 1.950<br />
Lorquí .................................... 2.703 193 212 272 211 254 199 193 164 137<br />
Mazarrón ............................... 7.271 550 587 642 513 638 632 612 416 364<br />
Molina <strong>de</strong> Segura .................. 19.211 1.355 1.516 1.809 1.699 1.782 1.644 1.584 1.250 1.205<br />
Moratal<strong>la</strong>................................ 4.431 220 274 309 378 353 304 317 207 234<br />
Mu<strong>la</strong>....................................... 6.564 396 456 555 537 558 487 463 351 354<br />
Murcia.................................... 168.646 9.961 11.292 14.367 15.420 14.792 13.420 12.146 10.449 10.013<br />
Ojós ....................................... 345 13 26 28 26 27 23 23 15 21<br />
Pliego .................................... 1.638 93 100 124 145 139 128 74 77 80<br />
Puerto Lumbreras.................. 5.117 289 360 392 378 411 346 308 314 289<br />
Ricote .................................... 867 37 42 63 61 84 61 47 31 46<br />
San Javier ............................. 7.392 550 616 613 646 644 654 543 446 418<br />
San Pedro <strong>de</strong>l Pinatar ........... 6.092 436 464 519 505 558 565 469 353 320<br />
Santomera............................. 4.275 281 285 329 321 416 346 304 270 224<br />
Torre Pacheco....................... 8.230 587 663 735 740 782 709 584 468 439<br />
Torres <strong>de</strong> Cotil<strong>la</strong>s (Las) ......... 7.034 486 552 705 659 622 545 579 463 434<br />
Totana ................................... 10.306 538 668 901 940 860 744 703 558 579<br />
Ulea ....................................... 531 26 22 36 52 53 40 31 10 30<br />
Unión (La).............................. 7.008 500 547 640 671 608 527 550 439 346<br />
Vil<strong>la</strong>nueva <strong>de</strong>l Río Segura..... 825 29 55 79 72 71 49 38 54 49<br />
Yec<strong>la</strong> ..................................... 13.757 898 937 1.160 1.172 1.066 1.187 1.041 846 738<br />
95
Censos <strong>de</strong> Pob<strong>la</strong>ción. Datos Municipales.<br />
2.13.3. ESTRUCTURA POR SEXO Y GRUPOS DE EDAD DE LA POBLACIÓN DE DERECHO<br />
SEGÚN EL CENSO DE 1991. MUJERES. (Conclusión)<br />
96<br />
MUNICIPIOS<br />
EDAD<br />
45-49 50-54 55-59 60-64 65-69 70-74 75-79 80-84 85 y más<br />
No<br />
consta<br />
Abanil<strong>la</strong>.................................... 135 133 219 206 188 133 117 111 68 -<br />
Abarán ..................................... 296 332 336 316 304 211 172 143 100 -<br />
Agui<strong>la</strong>s..................................... 563 525 620 631 581 372 333 249 161 -<br />
Albu<strong>de</strong>ite.................................. 29 42 38 29 30 23 36 18 14 -<br />
Alcantaril<strong>la</strong> ............................... 740 709 718 669 584 417 333 255 153 -<br />
Alcázares (Los)........................ 95 94 97 103 88 62 58 44 17 -<br />
Aledo ....................................... 32 30 29 41 25 12 10 8 14 -<br />
Alguazas.................................. 167 176 169 163 162 94 94 44 37 -<br />
Alhama <strong>de</strong> Murcia.................... 339 371 453 409 321 257 211 151 120 -<br />
Archena ................................... 333 374 363 322 270 205 169 122 70 -<br />
Beniel....................................... 164 184 171 163 137 102 72 49 36 -<br />
B<strong>la</strong>nca...................................... 155 139 167 172 168 125 102 84 61 -<br />
Bul<strong>la</strong>s....................................... 274 253 319 334 238 177 113 128 60 -<br />
Ca<strong>la</strong>sparra ............................... 182 205 285 306 221 184 142 88 63 -<br />
Campos <strong>de</strong>l Río....................... 48 45 46 57 47 29 31 12 12 -<br />
Caravaca <strong>de</strong> <strong>la</strong> Cruz................ 487 563 596 681 549 422 336 259 181 -<br />
Cartagena................................ 4.402 4.507 4.737 4.512 3.883 2.724 2.213 1.565 1.105 -<br />
Cehegín ................................... 344 339 394 415 335 278 218 157 124 -<br />
Ceutí ........................................ 172 153 167 157 109 90 63 48 18 -<br />
Cieza........................................ 750 739 793 855 741 513 423 315 240 -<br />
Fortuna .................................... 145 125 177 149 122 90 70 52 36 -<br />
Fuente Á<strong>la</strong>mo .......................... 207 216 257 256 262 180 138 88 63 -<br />
Jumil<strong>la</strong> ..................................... 404 437 520 576 523 361 298 203 155 -<br />
Libril<strong>la</strong> ...................................... 91 113 128 93 105 73 55 45 30 -<br />
Lorca........................................ 1.737 1.665 1.794 1.929 1.614 1.170 927 693 497 -<br />
Lorquí ...................................... 125 133 162 156 99 73 65 28 27 -<br />
Mazarrón.................................. 338 355 375 342 287 207 164 152 97 -<br />
Molina <strong>de</strong> Segura..................... 924 800 897 733 692 512 358 278 173 -<br />
Moratal<strong>la</strong>.................................. 227 256 338 309 214 166 143 119 63 -<br />
Mu<strong>la</strong>......................................... 330 335 381 365 323 256 191 130 96 -<br />
Murcia...................................... 8.469 8.857 8.726 8.649 7.640 5.351 4.195 2.947 1.952 -<br />
Ojós ......................................... 15 15 20 27 22 10 11 12 11 -<br />
Pliego....................................... 103 87 120 104 84 64 58 35 23 -<br />
Puerto Lumbreras.................... 271 233 309 311 296 231 167 123 89 -<br />
Ricote ...................................... 42 52 70 62 42 49 30 31 17 -<br />
San Javier................................ 376 357 343 361 284 208 152 104 77 -<br />
San Pedro <strong>de</strong>l Pinatar.............. 286 343 296 268 234 169 140 92 75 -<br />
Santomera ............................... 203 200 263 239 191 134 132 66 71 -<br />
Torre Pacheco ......................... 375 402 383 391 349 237 193 119 74 -<br />
Torres <strong>de</strong> Cotil<strong>la</strong>s (Las) ........... 327 342 294 286 265 184 148 83 60 -<br />
Totana...................................... 527 551 589 529 500 389 301 240 189 -<br />
Ulea ......................................... 21 34 33 40 19 24 31 21 8 -<br />
Unión (La)................................ 375 294 366 358 266 195 149 104 73 -<br />
Vil<strong>la</strong>nueva <strong>de</strong>l Río Segura ....... 29 54 57 42 39 32 33 27 16 -<br />
Yec<strong>la</strong>........................................ 640 577 726 730 638 468 377 314 242 -<br />
Fuente: Consejería <strong>de</strong> Economía y Hacienda. Centro Regional <strong>de</strong> Estadística. Censo <strong>de</strong> Pob<strong>la</strong>ción <strong>de</strong> 1991 <strong>de</strong> <strong>la</strong> Región <strong>de</strong> Murcia. Resultados Municipales<br />
Estadísticas Históricas <strong>de</strong> Pob<strong>la</strong>ción <strong>de</strong> <strong>la</strong> Región <strong>de</strong> Murcia.
MOVIMIENTO<br />
NATURAL<br />
DE<br />
LA<br />
POBLACIÓN.<br />
DATOS<br />
REGIONALES.
MNP. Datos Regionales. Nacimientos y Defunciones.<br />
3.1.1. EVOLUCIÓN DE LOS NACIMIENTOS Y DEFUNCIONES POR SEXO Y LUGAR DE<br />
INSCRIPCIÓN. 1858-1993. PROVINCIA. (Continúa)<br />
AÑOS NACIMIENTOS DEFUNCIONES<br />
TOTAL Hombres Mujeres TOTAL Hombres Mujeres<br />
1858 ................................ 16.628 .. .. 9.131 .. ..<br />
1859 ................................ 16.838 .. .. 13.721 .. ..<br />
1860 ................................ 15.705 .. .. 10.373 .. ..<br />
1861 ................................ 15.842 8.132 7.710 9.639 4.965 4.674<br />
1862 ................................ 16.145 8.327 7.818 10.033 5.208 4.825<br />
1863 ................................ 17.380 8.897 8.483 10.306 5.358 4.948<br />
1864 ................................ 17.909 9.157 8.752 12.610 6.503 6.107<br />
1865 ................................ 18.384 9.474 8.910 14.248 7.246 7.002<br />
1866 ................................ 18.384 9.434 8.950 10.031 5.287 4.744<br />
1867 ................................ 18.311 9.493 8.818 11.032 5.685 5.347<br />
1868 ................................ 15.627 8.126 7.501 11.837 6.122 5.715<br />
1869 ................................ 18.727 9.596 9.131 15.341 7.865 7.476<br />
1870 ................................ 17.196 9.080 8.116 13.387 7.072 6.315<br />
1886 ................................ 17.844 .. .. 16.744 .. ..<br />
1887 ................................ 17.786 .. .. 22.475 .. ..<br />
1888 ................................ 19.027 .. .. 18.235 .. ..<br />
1889 ................................ 18.848 .. .. 17.144 .. ..<br />
1890 ................................ 18.753 .. .. 17.268 .. ..<br />
1891 ................................ 20.078 .. .. 17.951 .. ..<br />
1892 ................................ 21.074 .. .. 16.115 .. ..<br />
1893 ................................ 20.365 .. .. 15.980 .. ..<br />
1894 ................................ 19.069 .. .. 17.406 .. ..<br />
1895 ................................ 20.222 .. .. 15.164 .. ..<br />
1896 ................................ 19.573 .. .. 14.622 .. ..<br />
1897 ................................ 19.437 .. .. 16.671 .. ..<br />
1898 ................................ 16.929 .. .. 14.392 .. ..<br />
1899 ................................ 20.754 .. .. 15.248 .. ..<br />
1900 ................................ 19.806 10.826 8.980 16.687 8.756 7.931<br />
1901 ................................ 19.230 10.634 8.596 14.457 7.556 6.901<br />
1902 ................................ 21.069 11.690 9.379 14.686 7.752 6.934<br />
1903 ................................ 19.975 11.092 8.883 14.947 7.630 7.317<br />
1904 ................................ 19.628 11.144 8.484 14.506 7.471 7.035<br />
1905 ................................ 20.385 11.337 9.048 15.293 8.016 7.277<br />
1906 ................................ 18.577 10.353 8.224 15.898 8.253 7.645<br />
1907 ................................ 18.376 10.314 8.062 14.653 7.630 7.023<br />
1908 ................................ 19.986 11.151 8.835 13.811 7.239 6.572<br />
1909 ................................ 18.993 10.607 8.386 13.061 6.804 6.257<br />
1910 ................................ 18.182 10.250 7.932 15.663 8.274 7.389<br />
1911 ................................ 16.404 9.170 7.234 13.798 7.196 6.602<br />
1912 ................................ 17.694 9.824 7.870 13.639 6.953 6.686<br />
1913 ................................ 15.708 8.751 6.957 12.610 6.616 5.994<br />
1914 ................................ 16.174 8.994 7.180 12.775 6.673 6.102<br />
1915 ................................ 17.299 9.840 7.459 13.524 7.102 6.422<br />
1916 ................................ 16.019 9.032 6.987 11.913 6.195 5.718<br />
1917 ................................ 16.858 9.348 7.510 12.707 6.522 6.185<br />
1918 ................................ 17.647 9.855 7.792 21.206 10.662 10.544<br />
1919 ................................ 18.409 10.263 8.146 14.655 7.616 7.039<br />
1920 ................................ 17.138 9.718 7.420 14.892 7.621 7.271<br />
1921 ................................ 19.748 11.096 8.652 13.124 6.784 6.340<br />
1922 ................................ 20.211 11.261 8.950 12.250 6.508 5.742<br />
1923 ................................ 18.803 10.506 8.297 12.219 6.354 5.865<br />
Estadísticas Históricas <strong>de</strong> Pob<strong>la</strong>ción <strong>de</strong> <strong>la</strong> Región <strong>de</strong> Murcia. 99
MNP. Datos Regionales. Nacimientos y Defunciones.<br />
3.1.1. EVOLUCIÓN DE LOS NACIMIENTOS Y DEFUNCIONES POR SEXO Y LUGAR DE<br />
INSCRIPCIÓN. 1861-1993. PROVINCIA. (Continúa)<br />
AÑOS NACIMIENTOS DEFUNCIONES<br />
TOTAL Hombres Mujeres TOTAL Hombres Mujeres<br />
1924................................. 20.750 11.360 9.390 11.470 6.063 5.407<br />
1925................................. 21.012 11.483 9.529 12.368 6.353 6.015<br />
1926................................. 21.605 11.851 9.754 11.843 6.281 5.562<br />
1927................................. 20.017 10.949 9.068 11.717 6.170 5.547<br />
1928................................. 20.839 11.492 9.347 11.876 6.100 5.776<br />
1929................................. 19.459 10.569 8.890 10.652 5.539 5.113<br />
1930................................. 19.832 10.686 9.146 11.037 5.798 5.239<br />
1931................................. 18.214 9.851 8.363 10.918 5.593 5.325<br />
1932................................. 18.567 9.837 8.730 10.376 5.415 4.961<br />
1933................................. 20.649 10.813 9.836 10.606 5.338 5.268<br />
1934................................. 20.234 10.451 9.783 10.287 5.331 4.956<br />
1935................................. 19.782 10.256 9.526 10.638 5.414 5.224<br />
1936................................. 20.553 10.347 10.206 11.155 6.024 5.131<br />
1937................................. 23.333 11.668 11.665 14.340 7.588 6.752<br />
1938................................. 22.697 11.693 11.004 14.851 8.130 6.721<br />
1939................................. 13.186 7.072 6.114 16.300 9.077 7.223<br />
1940................................. 20.287 10.497 9.790 11.919 6.533 5.386<br />
1941................................. 15.714 8.116 7.598 12.780 7.124 5.656<br />
1942................................. 15.986 8.008 7.978 10.351 5.759 4.592<br />
1943................................. 17.161 8.711 8.450 9.130 4.857 4.273<br />
1944................................. 18.430 9.159 9.271 9.343 5.109 4.234<br />
1945................................. 20.123 10.130 9.993 7.870 4.176 3.694<br />
1946................................. 18.593 9.341 9.252 8.346 4.675 3.671<br />
1947................................. 18.237 9.186 9.051 7.931 4.115 3.816<br />
1948................................. 20.025 10.117 9.908 7.349 3.371 3.558<br />
1949................................. 18.053 9.041 9.012 7.652 4.025 3.627<br />
1950................................. 17.645 8.793 8.852 7.735 3.939 3.796<br />
1951................................. 17.902 9.020 8.882 8.101 4.165 3.936<br />
1952................................. 18.081 8.932 9.149 6.990 3.548 3.442<br />
1953................................. 18.057 9.013 9.044 6.549 3.323 3.226<br />
1954................................. 16.932 8.464 8.468 6.569 3.331 3.238<br />
1955................................. 17.602 8.858 8.744 6.747 3.338 3.409<br />
1956................................. 17.372 8.642 8.730 6.990 3.542 3.448<br />
1957................................. 19.698 9.920 9.778 7.142 3.621 3.521<br />
1958................................. 19.474 9.730 9.744 6.410 3.250 3.160<br />
1959................................. 19.280 9.960 9.320 6.498 3.347 3.151<br />
1960................................. 19.164 9.578 9.586 6.638 3.423 3.215<br />
1961................................. 18.921 9.539 9.382 6.502 3.236 3.266<br />
1962................................. 20.279 9.781 10.498 6.923 3.602 3.321<br />
1963................................. 21.319 10.386 10.933 6.782 3.492 3.290<br />
1964................................. 21.039 10530 10.509 6.885 3.624 3.261<br />
1965................................. 20.609 10.355 10.254 6.801 3.476 3.325<br />
1966................................. 20.399 10.255 10.144 6.971 3.620 3.351<br />
1967................................. 20.527 10.361 10.166 6.956 3.605 3.351<br />
1968................................. 20.257 10.159 10.098 7.060 3.615 3.445<br />
1969................................. 20.018 10.106 9.912 7.411 3.748 3.663<br />
1970................................. 19.606 9.842 9.764 7.182 3.774 3.408<br />
1971................................. 19.645 9.904 9.741 7.949 4.170 3.779<br />
1972................................. 19.579 9.808 9.771 7.124 3.665 3.459<br />
1973................................. 19.726 10.072 9.654 7.697 3.952 3.745<br />
1974................................. 20.383 10.379 10.004 7.637 4.012 3.625<br />
1975................................. 18.617 9.559 9.058 7.569 3.966 3.603<br />
100 Estadísticas Históricas <strong>de</strong> Pob<strong>la</strong>ción <strong>de</strong> <strong>la</strong> Región <strong>de</strong> Murcia.
MNP. Datos Regionales. Nacimientos y Defunciones.<br />
3.1.1. EVOLUCIÓN DE LOS NACIMIENTOS Y DEFUNCIONES POR SEXO Y LUGAR DE<br />
INSCRIPCIÓN. 1861-1993. PROVINCIA. (Conclusión)<br />
AÑOS NACIMIENTOS DEFUNCIONES<br />
TOTAL Hombres Mujeres TOTAL Hombres Mujeres<br />
1976 ................................ 19.876 10.275 9.601 7.403 3.820 3.583<br />
1977 ................................ 19.277 10.004 9.273 7.398 3.777 3.621<br />
1978 ................................ 19.096 9.839 9.257 7.794 3.966 3.828<br />
1979 ................................ 18.956 9.866 9.090 7.529 3.888 3.641<br />
1980 ................................ 18.333 9.609 8.724 7.522 3.920 3.602<br />
1981 ................................ 17.011 8.904 8.107 7.624 3.962 3.657<br />
1982 ................................ 16.838 8.622 8.216 7.474 3.845 3.629<br />
1983 ................................ 15.730 8.213 7.517 7.849 4.118 3.731<br />
1984 ................................ 15.214 7.803 7.411 7.631 3.889 3.742<br />
1985 ................................ 14.821 7.643 7.178 7.910 4.034 3.876<br />
1986 ................................ 14.282 7.437 6.845 7.911 4.189 3.722<br />
1987 ................................ 14.371 7.429 6.942 7.651 3.973 3.678<br />
1988 ................................ 14.280 7.467 6.813 7.991 4.189 3.802<br />
1989 ................................ 14.251 7.437 6.814 8.466 4.458 4.008<br />
1990 ................................ 14.071 7.221 6.850 8.617 4.579 4.038<br />
1991 ................................ 13.924 7.095 6.829 8.551 4.467 4.084<br />
1992 ................................ 13.814 7.167 6.647 8.329 4.405 3.924<br />
1993 (*)............................ 13.394 6.976 6.418 8.509 4.484 4.025<br />
Nota: Del año 1932 a 1974 ha sido posible sumar tanto a los nacimientos como a <strong>la</strong>s <strong>de</strong>funciones los muertos antes <strong>de</strong> <strong>la</strong>s 24 horas. A partir <strong>de</strong> 1975 <strong>la</strong> publicación<br />
<strong>de</strong>l INE ya ofrece los datos incluyendo a los muertos antes <strong>de</strong> <strong>la</strong>s 24 horas.<br />
(*) Datos Provisionales.<br />
Fuente: INE. Movimiento Natural <strong>de</strong> <strong>la</strong> Pob<strong>la</strong>ción.<br />
Consejería <strong>de</strong> Economía y Hacienda. Centro Regional <strong>de</strong> Estadística. Movimiento Natural <strong>de</strong> <strong>la</strong> Pob<strong>la</strong>ción <strong>de</strong> <strong>la</strong> Región <strong>de</strong> Murcia.<br />
Estadísticas Históricas <strong>de</strong> Pob<strong>la</strong>ción <strong>de</strong> <strong>la</strong> Región <strong>de</strong> Murcia. 101
MNP. Datos Regionales. Nacimientos y Defunciones.<br />
3.1.2. EVOLUCIÓN DE LOS NACIMIENTOS Y DEFUNCIONES POR SEXO Y LUGAR DE<br />
INSCRIPCIÓN. 1861-1993. CAPITAL. (Continúa)<br />
AÑOS NACIMIENTOS DEFUNCIONES<br />
TOTAL Hombres Mujeres TOTAL Hombres Mujeres<br />
1861................................. 3.717 1.912 1.805 2.190 1.105 1.085<br />
1862................................. 3.384 1.740 1.644 2.157 1.096 1.061<br />
1863................................. 3.630 1.816 1.814 2.360 1.215 1.145<br />
1864................................. 3.880 1.931 1.949 2.708 1.400 1.308<br />
1865................................. 3.831 1.986 1.845 3.415 1.658 1.757<br />
1866................................. 3.868 1.939 1.929 2.192 1.095 1.097<br />
1867................................. 3.855 1.993 1.862 2.563 1.282 1.281<br />
1868................................. 3.521 1.827 1.694 2.566 1.331 1.235<br />
1869................................. 3.997 2.050 1.947 3.382 1.770 1.612<br />
1870................................. 3.799 1.984 1.815 3.000 1.578 1.422<br />
1886................................. 3.416 .. .. 3.381 .. ..<br />
1887................................. 2.915 .. .. 4.330 .. ..<br />
1888................................. 3.405 .. .. 3.618 .. ..<br />
1889................................. 3.397 .. .. 3.370 .. ..<br />
1890................................. 3.367 .. .. 3.907 .. ..<br />
1891................................. 3.634 .. .. 3.274 .. ..<br />
1892................................. 3.560 .. .. 3.027 .. ..<br />
1900................................. 2.816 1.802 1.014 3.377 1.763 1.614<br />
1901................................. 2.858 1.793 1.065 2.773 1.479 1.294<br />
1902................................. 3.306 2.125 1.181 3.087 1.621 1.466<br />
1903................................. 2.965 1.893 1.072 2.710 1.405 1.305<br />
1904................................. 2.960 1.979 981 2.744 1.432 1.312<br />
1905................................. 3.225 2.043 1.182 3.188 1.702 1.486<br />
1906................................. 3.080 1.931 1.149 3.043 1.573 1.470<br />
1907................................. 2.586 1.651 935 3.014 1.580 1.434<br />
1908................................. 3.013 1.937 1.076 2.840 1.483 1.357<br />
1909................................. 2.763 1.781 982 2.704 1.443 1.261<br />
1910................................. 2.463 1.669 794 2.953 1.549 1.404<br />
1911................................. 2.381 1.563 818 3.051 1.622 1.429<br />
1912................................. 2.929 1.873 1.056 2.793 1.434 1.359<br />
1913................................. 2.748 1.765 983 2.694 1.424 1.270<br />
1914................................. 3.022 1.941 1.081 2.906 1.519 1.387<br />
1915................................. 2.884 1.921 963 3.282 1.743 1.539<br />
1916................................. 2.694 1.811 883 2.521 1.334 1.187<br />
1917................................. 2.949 1.894 1.055 2.652 1.376 1.276<br />
1918................................. 3.196 2.069 1.127 4.054 2.049 2.005<br />
1919................................. 3.289 2.143 1.146 3.148 1.664 1.484<br />
1920................................. 3.075 2.042 1.033 3.541 1.839 1.702<br />
1921................................. 3.810 2.441 1.369 2.897 1.535 1.362<br />
1922................................. 3.882 2.464 1.418 3.008 1.640 1.368<br />
1923................................. 3.844 2.392 1.452 2.679 1.423 1.256<br />
1924................................. 4.244 2.658 1.586 2.634 1.447 1.187<br />
1925................................. 4.714 2.837 1.877 3.065 1.566 1.499<br />
1926................................. 4.806 2.820 1.986 2.776 1.458 1.318<br />
1927................................. 5.589 2.768 2.821 2.654 1.410 1.244<br />
1928................................. 4.769 2.821 1.948 2.871 1.471 1.400<br />
1929................................. 4.894 2.837 2.057 2.600 1.353 1.247<br />
1930................................. 4.875 2.850 2.025 2.648 1.418 1.230<br />
1931................................. 4.554 2.607 1.947 2.634 1.370 1.264<br />
1932................................. 4.607 2.637 1.970 2.539 1.376 1.163<br />
1933................................. 5.225 2.911 2.314 2.636 1.332 1.304<br />
1934................................. 5.031 2.699 2.332 2.519 1.291 1.228<br />
1935................................. 4.961 2.639 2.322 2.653 1.382 1.271<br />
1936................................. 5.512 2.763 2.749 2.827 1.579 1.248<br />
1937................................. 6.783 3.259 3.524 4.068 2.178 1.890<br />
102 Estadísticas Históricas <strong>de</strong> Pob<strong>la</strong>ción <strong>de</strong> <strong>la</strong> Región <strong>de</strong> Murcia.
MNP. Datos Regionales. Nacimientos y Defunciones.<br />
3.1.2. EVOLUCIÓN DE LOS NACIMIENTOS Y DEFUNCIONES POR SEXO Y LUGAR DE<br />
INSCRIPCIÓN. 1861-1993. CAPITAL. (Conclusión)<br />
AÑOS NACIMIENTOS DEFUNCIONES<br />
TOTAL Hombres Mujeres TOTAL Hombres Mujeres<br />
1938 ................................ 6.934 3.591 3.343 3.924 2.162 1.762<br />
1939 ................................ 3.852 2.127 1.725 3.723 2.159 1.564<br />
1940 ................................ 6.076 3.195 2.881 3.064 1.741 1.323<br />
1941 ................................ 4.475 2.258 2.217 3.261 1.883 1.378<br />
1942 ................................ 5.079 2.424 2.655 2.939 1.645 1.294<br />
1943 ................................ 5.196 2.590 2.606 2.492 1.355 1.137<br />
1944 ................................ 5.933 2.917 3.016 2.614 1.418 1.196<br />
1945 ................................ 6.215 3.107 3.108 2.179 1.183 996<br />
1946 ................................ 5.783 2.748 3.035 2.177 1.213 964<br />
1947 ................................ 5.457 2.647 2.810 2.236 1.157 1.079<br />
1948 ................................ 6.090 3.058 3.032 1.911 1.009 902<br />
1949 ................................ 5.574 2.682 2.892 2.035 1.107 928<br />
1950 ................................ 5.371 2.566 2.805 2.112 1.084 1.028<br />
1951 ................................ 5.456 2.630 2.826 2.225 1.104 1.121<br />
1952 ................................ 5.319 2.464 2.855 1.840 971 869<br />
1953 ................................ 5.368 2.599 2.769 1.644 830 814<br />
1954 ................................ 5.057 2.473 2.584 1.760 888 862<br />
1955 ................................ 5.397 2.688 2.709 1.784 877 907<br />
1956 ................................ 4.957 2.428 2.529 1.911 974 937<br />
1957 ................................ 5.327 2.705 2.622 1.987 1.032 955<br />
1958 ................................ 5.281 2.614 2.667 1.800 915 885<br />
1959 ................................ 5.458 2.828 2.630 1.775 918 857<br />
1960 ................................ 5.893 2.909 2.984 1.810 947 863<br />
1961 ................................ 5.889 2.958 2.931 1.802 905 897<br />
1962 ................................ 7.020 3.120 3.900 2.053 1.073 980<br />
1963 ................................ 6.831 3.220 3.611 1.972 1.022 950<br />
1964 ................................ 6.766 3.342 3.424 1.948 1.032 916<br />
1965 ................................ 6.775 3.373 3.402 1.958 1.008 950<br />
1966 ................................ 6.870 3.420 3.450 2.095 1.161 934<br />
1967 ................................ 7.019 3.544 3.475 2.006 1.052 954<br />
1968 ................................ 6.863 3.380 3.483 2.193 1.133 1.060<br />
1969 ................................ 7.244 3.635 3.609 2.353 1.175 1.178<br />
1970 ................................ 7.368 3.698 3.670 2.350 1.266 1.084<br />
1971 ................................ 7.154 3.615 3.539 2.620 1.409 1.211<br />
1972 ................................ 7.092 3.509 3.583. 2.390 1.248 1.142<br />
1973 ................................ 6.937 3.569 3.368 2.591 1.373 1.218<br />
1974 ................................ 7.347 3.751 3.596 2.623 1.395 1.228<br />
1975 ................................ 6.688 3.391 3.297 2.672 1.414 1.258<br />
1976 ................................ 7.347 3.796 3.551 2.624 1.386 1.238<br />
1977 ................................ 7.377 3.799 3.578 2.744 1.470 1.274<br />
1978 ................................ 7.429 3.837 3.592 3.011 1.585 1.426<br />
1979 ................................ 7.349 3.851 3.498 2.788 1.501 1.287<br />
1980 ................................ 7.322 3.879 3.443 2.866 1.546 1.320<br />
1981 ................................ 6.686 3.446 3.240 2.800 1.513 1.287<br />
1982 ................................ 6.611 3.410 3.201 2.734 1.441 1.293<br />
1983 ................................ 5.679 2.974 2.705 2.806 1.532 1.274<br />
1984 ................................ 5.474 2.812 2.662 2.777 1.455 1.322<br />
1985 ................................ 5.324 2.758 2.566 2.786 1.518 1.268<br />
1986 ................................ 5.371 2.836 2.535 2.839 1.563 1.276<br />
1987 ................................ 5.328 2.726 2.602 2.879 1.568 1.311<br />
1988 ................................ 5.462 2.852 2.610 3.117 1.694 1.423<br />
1989 ................................ 5.546 2.900 2.646 3.319 1.859 1.460<br />
1990 ................................ 5.510 2.794 2.716 3.400 1.884 1.516<br />
1991 ................................ 5.413 2.782 2.631 3.342 1.854 1.488<br />
1992 ................................ 4.866 2.500 2.366 3.271 1.781 1.490<br />
1993 (*)............................ 4.634 2.431 2.203 3.349 1.825 1.524<br />
Nota: Del año 1932 a 1974 ha sido posible sumar tanto a los nacimientos como a <strong>la</strong>s <strong>de</strong>funciones los muertos antes <strong>de</strong> <strong>la</strong>s 24 horas. A partir <strong>de</strong> 1975 <strong>la</strong> publicación<br />
<strong>de</strong>l INE ya ofrece los datos incluyendo a los muertos antes <strong>de</strong> <strong>la</strong>s 24 horas.<br />
(*) Datos Provisionales.<br />
Fuente: INE. Movimiento Natural <strong>de</strong> <strong>la</strong> Pob<strong>la</strong>ción.<br />
Consejería <strong>de</strong> Economía y Hacienda. Centro Regional <strong>de</strong> Estadística. Movimiento Natural <strong>de</strong> <strong>la</strong> Pob<strong>la</strong>ción <strong>de</strong> <strong>la</strong> Región <strong>de</strong> Murcia.<br />
Estadísticas Históricas <strong>de</strong> Pob<strong>la</strong>ción <strong>de</strong> <strong>la</strong> Región <strong>de</strong> Murcia. 103
MNP. Datos Regionales. Nacimientos y Defunciones.<br />
3.2.1. EVOLUCIÓN DE LOS NACIMIENTOS Y DEFUNCIONES POR SEXO Y LUGAR DE<br />
RESIDENCIA. 1975-1993. PROVINCIA.<br />
AÑOS NACIMIENTOS DEFUNCIONES<br />
TOTAL Hombres Mujeres TOTAL Hombres Mujeres<br />
1975................................. 18.484 9.465 9.019 7.599 3.974 3.625<br />
1976................................. 19.649 10.130 9.519 7.443 3.848 3.595<br />
1977................................. 19.103 9.902 9.201 7.412 3.788 3.624<br />
1978................................. 18.942 9.771 9.171 7.771 3.959 3.812<br />
1979................................. 18.758 9.759 8.999 7.488 3.860 3.628<br />
1980................................. 18.204 9.544 8.660 7.561 3.949 3.612<br />
1981................................. 16.758 8.772 7.986 7.662 3.994 3.668<br />
1982................................. 16.575 8.499 8.076 7.487 3.849 3.638<br />
1983................................. 15.344 8.008 7.336 7.888 4.145 3.743<br />
1984................................. 14.862 7.638 7.224 7.668 3.909 3.759<br />
1985................................. 14.546 7.511 7.035 7.955 4.065 3.890<br />
1986................................. 13.958 7.284 6.674 7.779 4.074 3.705<br />
1987................................. 13.996 7.221 6.775 7.576 3.904 3.672<br />
1988................................. 13.979 7.284 6.695 7.841 4.085 3.756<br />
1989................................. 13.992 7.297 6.695 8.408 4.420 3.988<br />
1990................................. 13.869 7.121 6.748 8.552 4.542 4.010<br />
1991................................. 13.790 7.007 6.783 8.480 4.416 4.064<br />
1992................................. 13.770 7.163 6.607 8.264 4.349 3.915<br />
1993 (*)............................ 13.235 6.895 6.340 8.279 4.340 3.939<br />
(*) Datos Provisionales.<br />
Fuente: INE. Movimiento Natural <strong>de</strong> <strong>la</strong> Pob<strong>la</strong>ción.<br />
Consejería <strong>de</strong> Economía y Hacienda. Centro Regional <strong>de</strong> Estadística. Movimiento Natural <strong>de</strong> <strong>la</strong> Pob<strong>la</strong>ción <strong>de</strong> <strong>la</strong> Región <strong>de</strong> Murcia.<br />
104 Estadísticas Históricas <strong>de</strong> Pob<strong>la</strong>ción <strong>de</strong> <strong>la</strong> Región <strong>de</strong> Murcia.
MNP. Datos Regionales. Nacimientos y Defunciones.<br />
3.2.2. EVOLUCIÓN DE LOS NACIMIENTOS Y DEFUNCIONES POR SEXO Y LUGAR DE<br />
RESIDENCIA. 1975-1993. CAPITAL.<br />
AÑOS NACIMIENTOS DEFUNCIONES<br />
TOTAL Hombres Mujeres TOTAL Hombres Mujeres<br />
1975 ................................ 5.931 3.015 2.916 2.375 1.234 1.141<br />
1976 ................................ 6.376 3.300 3.076 2.219 1.141 1.078<br />
1977 ................................ 6.242 3.205 3.037 2.259 1.162 1.097<br />
1978 ................................ 6.106 3.135 2.971 2.371 1.197 1.174<br />
1979 ................................ 6.003 3.169 2.834 2.153 1.113 1.040<br />
1980 ................................ 5.818 3.096 2.722 2.307 1.184 1.123<br />
1981 ................................ 5.201 2.673 2.528 2.340 1.235 1.105<br />
1982 ................................ 5.262 2.726 2.536 2.322 1.207 1.115<br />
1983 ................................ 4.591 2.398 2.193 2.323 1.227 1.096<br />
1984 ................................ 4.600 2.355 2.245 2.347 1.205 1.142<br />
1985 ................................ 4.447 2.310 2.137 2.414 1.265 1.149<br />
1986 ................................ 4.374 2.306 2.068 2.235 1.177 1.058<br />
1987 ................................ 4.262 2.183 2.079 2.214 1.140 1.074<br />
1988 ................................ 4.337 2.280 2.057 2.291 1.169 1.122<br />
1989 ................................ 4.405 2.293 2.112 2.456 1.301 1.155<br />
1990 ................................ 4.414 2.260 2.154 2.519 1.340 1.179<br />
1991 ................................ 4.436 2.290 2.146 2.446 1.310 1.136<br />
1992 ................................ 4.494 2.326 2.168 2.443 1.257 1.186<br />
1993 (*)............................ 4.181 2.183 1.998 2.453 1.289 1.164<br />
(*) Datos Provisionales.<br />
Fuente: INE. Movimiento Natural <strong>de</strong> <strong>la</strong> Pob<strong>la</strong>ción.<br />
Consejería <strong>de</strong> Economía y Hacienda. Centro Regional <strong>de</strong> Estadística. Movimiento Natural <strong>de</strong> <strong>la</strong> Pob<strong>la</strong>ción <strong>de</strong> <strong>la</strong> Región <strong>de</strong> Murcia.<br />
Estadísticas Históricas <strong>de</strong> Pob<strong>la</strong>ción <strong>de</strong> <strong>la</strong> Región <strong>de</strong> Murcia. 105
MNP. Datos Regionales. Nacimientos y Defunciones.<br />
3.3.1. EVOLUCIÓN DE LOS NACIMIENTOS POR EDAD Y EL ESTADO CIVIL DE LA MADRE. 1975-<br />
1993. PROVINCIA. (Continúa)<br />
EDADES<br />
TOTAL<br />
1975 1976 1977<br />
Madre<br />
casada<br />
Madre<br />
no<br />
casada<br />
TOTAL<br />
Madre<br />
casada<br />
Madre<br />
no<br />
casada<br />
TOTAL<br />
Madre<br />
casada<br />
Madre<br />
no<br />
casada<br />
TOTAL ............................. 18.484 18.299 185 19.649 19.408 241 19.103 18.835 268<br />
Menores <strong>de</strong> 15 años........ 15 11 4 22 18 4 16 15 1<br />
De 15 años ...................... 39 33 6 68 63 5 70 65 5<br />
De 16 años ...................... 110 105 5 170 155 15 139 131 8<br />
De 17 años ...................... 257 242 15 273 261 12 272 254 18<br />
De 18 años ...................... 335 328 7 428 412 16 435 419 16<br />
De 19 años ...................... 511 498 13 500 486 14 609 590 19<br />
De 20 años ...................... 620 610 10 744 728 16 794 763 31<br />
De 21 años ...................... 789 774 15 901 882 19 941 923 18<br />
De 22 años ...................... 1.033 1.014 19 1.105 1.091 14 1.083 1.068 15<br />
De 23 años ...................... 1.184 1.171 13 1.367 1.348 19 1.186 1.169 17<br />
De 24 años ...................... 1.251 1.237 14 1.329 1.314 15 1.445 1.429 16<br />
De 25 años ...................... 1.287 1.282 5 1.424 1.410 14 1.319 1.310 9<br />
De 26 años ...................... 1.234 1.229 5 1.289 1.281 8 1.306 1.291 15<br />
De 27 años ...................... 1.271 1.266 5 1.222 1.211 11 1.127 1.117 10<br />
De 28 años ...................... 1.017 1.014 3 1.180 1.174 6 1.136 1.126 10<br />
De 29 años ...................... 1.079 1.075 4 1.012 1.008 4 1.135 1.123 12<br />
De 30 años ...................... 1.028 1.019 9 1.074 1.070 4 918 911 7<br />
De 31 años ...................... 772 766 6 843 835 8 783 774 9<br />
De 32 años ...................... 618 612 6 735 731 4 676 672 4<br />
De 33 años ...................... 567 562 5 592 588 4 598 596 2<br />
De 34 años ...................... 576 575 1 485 479 6 558 556 2<br />
De 35 años ...................... 489 487 2 527 523 4 391 388 3<br />
De 36 años ...................... 397 395 2 470 467 3 427 422 5<br />
De 37 años ...................... 453 451 2 387 384 3 350 350 -<br />
De 38 años ...................... 344 343 1 362 362 - 339 336 3<br />
De 39 años ...................... 343 340 3 308 305 3 311 306 5<br />
De 40 años ...................... 272 271 1 266 265 1 208 206 2<br />
De 41 años ...................... 185 185 - 193 192 1 163 163 -<br />
De 42 años ...................... 174 174 - 143 141 2 135 134 1<br />
De 43 años ...................... 101 100 1 101 98 3 103 103 -<br />
De 44 años ...................... 66 64 2 56 55 1 51 48 3<br />
De 45 años ...................... 32 32 - 35 33 2 36 35 1<br />
De 46 años ...................... 19 19 - 19 19 - 28 28 -<br />
De 47 años ...................... 10 10 - 10 10 - 6 6 -<br />
De 48 años ...................... 1 1 - 5 5 - 4 4 -<br />
De 49 años ...................... 1 1 - 2 2 - 1 1 -<br />
De 50 y más años............ 4 3 1 2 2 - 4 3 1<br />
106 Estadísticas Históricas <strong>de</strong> Pob<strong>la</strong>ción <strong>de</strong> <strong>la</strong> Región <strong>de</strong> Murcia.
MNP. Datos Regionales. Nacimientos y Defunciones.<br />
3.3.1. EVOLUCIÓN DE LOS NACIMIENTOS POR EDAD Y EL ESTADO CIVIL DE LA MADRE. 1975-<br />
1993. PROVINCIA. (Continúa)<br />
EDADES<br />
TOTAL<br />
1978 1979 1980<br />
Madre<br />
casada<br />
Madre<br />
no<br />
casada<br />
TOTAL<br />
Madre<br />
casada<br />
Madre<br />
no<br />
casada<br />
TOTAL<br />
Madre<br />
casada<br />
Madre<br />
no<br />
casada<br />
TOTAL............................. 18.942 18.647 295 18.758 18.400 358 18.204 17.834 370<br />
Menores <strong>de</strong> 15 años........ 26 21 5 22 15 7 21 15 6<br />
De 15 años ...................... 85 74 11 87 81 6 79 74 5<br />
De 16 años ...................... 166 163 3 160 148 12 190 177 13<br />
De 17 años ...................... 291 272 19 309 289 20 312 294 18<br />
De 18 años ...................... 424 395 29 419 400 19 426 398 28<br />
De 19 años ...................... 583 566 17 613 579 34 587 564 23<br />
De 20 años ...................... 791 755 36 865 835 30 794 765 29<br />
De 21 años ...................... 955 935 20 1.074 1.049 25 1.002 971 31<br />
De 22 años ...................... 1.145 1.122 23 1.169 1.141 28 1.218 1.190 28<br />
De 23 años ...................... 1.308 1.294 14 1.208 1.186 22 1.272 1.254 18<br />
De 24 años ...................... 1.285 1.270 15 1.307 1.285 22 1.189 1.163 26<br />
De 25 años ...................... 1.340 1.325 15 1.284 1.266 18 1.228 1.210 18<br />
De 26 años ...................... 1.334 1.321 13 1.278 1.263 15 1.206 1.188 18<br />
De 27 años ...................... 1.186 1.173 13 1.118 1.105 13 1.151 1.131 20<br />
De 28 años ...................... 1.091 1.083 8 1.049 1.040 9 985 970 15<br />
De 29 años ...................... 1.002 993 9 937 924 13 935 924 11<br />
De 30 años ...................... 955 947 8 886 880 6 784 779 5<br />
De 31 años ...................... 746 742 4 787 779 8 722 711 11<br />
De 32 años ...................... 737 730 7 656 647 9 753 748 5<br />
De 33 años ...................... 636 634 2 641 632 9 566 564 2<br />
De 34 años ...................... 511 507 4 555 551 4 567 558 9<br />
De 35 años ...................... 441 440 1 440 435 5 449 441 8<br />
De 36 años ...................... 344 342 2 403 396 7 400 397 3<br />
De 37 años ...................... 340 337 3 288 288 - 312 309 3<br />
De 38 años ...................... 293 288 5 305 300 5 243 239 4<br />
De 39 años ...................... 240 236 4 243 240 3 229 228 1<br />
De 40 años ...................... 228 227 1 201 198 3 188 183 5<br />
De 41 años ...................... 163 161 2 162 161 1 118 114 4<br />
De 42 años ...................... 126 126 - 97 96 1 103 103 -<br />
De 43 años ...................... 69 68 1 72 72 - 72 72 -<br />
De 44 años ...................... 46 45 1 58 55 3 44 42 2<br />
De 45 años ...................... 29 29 - 31 31 - 34 34 -<br />
De 46 años ...................... 16 16 - 14 14 - 15 15 -<br />
De 47 años ...................... 6 6 - 10 10 - 1 1 -<br />
De 48 años ...................... 1 1 - 2 2 - 6 6 -<br />
De 49 años ...................... 1 1 - 4 4 - - - -<br />
De 50 y más años ........... 2 2 - 4 3 1 3 2 1<br />
Estadísticas Históricas <strong>de</strong> Pob<strong>la</strong>ción <strong>de</strong> <strong>la</strong> Región <strong>de</strong> Murcia. 107
MNP. Datos Regionales. Nacimientos y Defunciones.<br />
3.3.1. EVOLUCIÓN DE LOS NACIMIENTOS POR EDAD Y EL ESTADO CIVIL DE LA MADRE. 1975-<br />
1993. PROVINCIA. (Continúa)<br />
EDADES<br />
TOTAL<br />
1981 1982 1983<br />
Madre<br />
casada<br />
Madre<br />
no<br />
casada<br />
TOTAL<br />
Madre<br />
casada<br />
Madre<br />
no<br />
casada<br />
TOTAL<br />
Madre<br />
casada<br />
Madre<br />
no<br />
casada<br />
TOTAL ............................. 16.758 16.361 397 16.575 16.099 476 15.344 14.822 522<br />
Menores <strong>de</strong> 15 años........ 26 22 4 15 11 4 19 9 10<br />
De 15 años ...................... 73 66 7 53 41 12 54 37 17<br />
De 16 años ...................... 191 178 13 131 116 15 138 107 31<br />
De 17 años ...................... 278 258 20 256 228 28 265 230 35<br />
De 18 años ...................... 385 363 22 385 352 33 340 298 42<br />
De 19 años ...................... 535 509 26 498 470 28 481 444 37<br />
De 20 años ...................... 678 644 34 636 603 33 571 537 34<br />
De 21 años ...................... 942 916 26 814 783 31 663 630 33<br />
De 22 años ...................... 1.143 1.121 22 1.062 1.028 34 877 838 39<br />
De 23 años ...................... 1.232 1.207 25 1.194 1.168 26 1.080 1.035 45<br />
De 24 años ...................... 1.224 1.191 33 1.293 1.254 39 1.192 1.166 26<br />
De 25 años ...................... 1.107 1.087 20 1.232 1.210 22 1.163 1.142 21<br />
De 26 años ...................... 1.123 1.105 18 1.120 1.095 25 1.051 1.033 18<br />
De 27 años ...................... 995 984 11 995 981 14 1.020 999 21<br />
De 28 años ...................... 950 941 9 962 942 20 856 843 13<br />
De 29 años ...................... 827 818 9 951 930 21 821 804 17<br />
De 30 años ...................... 776 762 14 802 790 12 724 715 9<br />
De 31 años ...................... 624 609 15 629 617 12 599 591 8<br />
De 32 años ...................... 581 571 10 573 560 13 545 532 13<br />
De 33 años ...................... 559 553 6 546 534 12 458 453 5<br />
De 34 años ...................... 485 479 6 496 492 4 461 449 12<br />
De 35 años ...................... 392 383 9 364 357 7 387 380 7<br />
De 36 años ...................... 375 367 8 386 381 5 333 327 6<br />
De 37 años ...................... 292 287 5 261 254 7 350 342 8<br />
De 38 años ...................... 259 253 6 247 242 5 246 240 6<br />
De 39 años ...................... 180 172 8 191 187 4 180 178 2<br />
De 40 años ...................... 177 174 3 146 143 3 145 141 4<br />
De 41 años ...................... 133 131 2 141 139 2 110 109 1<br />
De 42 años ...................... 64 62 2 74 73 1 91 90 1<br />
De 43 años ...................... 65 64 1 48 45 3 49 48 1<br />
De 44 años ...................... 36 36 - 38 38 - 28 28 -<br />
De 45 años ...................... 22 21 1 14 14 - 23 23 -<br />
De 46 años ...................... 7 7 - 11 10 1 9 9 -<br />
De 47 años ...................... 3 3 - 3 3 - 9 9 -<br />
De 48 años ...................... 8 8 - 2 2 - 3 3 -<br />
De 49 años ...................... 3 3 - 1 1 - - - -<br />
De 50 y más años............ 8 6 2 5 5 - 3 3 -<br />
108 Estadísticas Históricas <strong>de</strong> Pob<strong>la</strong>ción <strong>de</strong> <strong>la</strong> Región <strong>de</strong> Murcia.
MNP. Datos Regionales. Nacimientos y Defunciones.<br />
3.3.1. EVOLUCIÓN DE LOS NACIMIENTOS POR EDAD Y EL ESTADO CIVIL DE LA MADRE. 1975-<br />
1993. PROVINCIA. (Continúa)<br />
EDADES<br />
TOTAL<br />
1984 1985 1986<br />
Madre<br />
casada<br />
Madre<br />
no<br />
casada<br />
TOTAL<br />
Madre<br />
casada<br />
Madre<br />
no<br />
casada<br />
TOTAL<br />
Madre<br />
casada<br />
Madre<br />
no<br />
casada<br />
TOTAL............................. 14.862 14.233 629 14.546 13.803 743 13.958 13.283 675<br />
Menores <strong>de</strong> 15 años........ 16 8 8 9 4 5 5 1 4<br />
De 15 años ...................... 48 35 13 43 25 18 27 16 11<br />
De 16 años ...................... 143 115 28 113 87 26 123 83 40<br />
De 17 años ...................... 232 191 41 200 167 33 199 157 42<br />
De 18 años ...................... 330 274 56 333 293 40 339 290 49<br />
De 19 años ...................... 479 425 54 445 382 63 419 377 42<br />
De 20 años ...................... 592 542 50 547 489 58 463 424 39<br />
De 21 años ...................... 678 645 33 689 620 69 629 588 41<br />
De 22 años ...................... 809 780 29 708 670 38 753 718 35<br />
De 23 años ...................... 963 927 36 895 848 47 850 812 38<br />
De 24 años ...................... 1.118 1.080 38 1.042 1.001 41 930 895 35<br />
De 25 años ...................... 1.164 1.131 33 1.156 1.116 40 1.008 971 37<br />
De 26 años ...................... 1.138 1.114 24 1.179 1.151 28 1.135 1.100 35<br />
De 27 años ...................... 985 963 22 1.071 1.038 33 1.092 1.063 29<br />
De 28 años ...................... 879 860 19 890 869 21 1.005 978 27<br />
De 29 años ...................... 761 737 24 760 732 28 795 773 22<br />
De 30 años ...................... 685 671 14 683 652 31 740 719 21<br />
De 31 años ...................... 633 604 29 642 622 20 551 536 15<br />
De 32 años ...................... 581 568 13 531 516 15 517 501 16<br />
De 33 años ...................... 499 492 7 479 463 16 430 405 25<br />
De 34 años ...................... 406 391 15 376 357 19 398 387 11<br />
De 35 años ...................... 360 348 12 334 322 12 352 341 11<br />
De 36 años ...................... 329 322 7 328 319 9 286 277 9<br />
De 37 años ...................... 230 228 2 304 290 14 216 207 9<br />
De 38 años ...................... 228 219 9 213 213 - 192 185 7<br />
De 39 años ...................... 189 185 4 198 190 8 159 150 9<br />
De 40 años ...................... 131 128 3 136 130 6 121 115 6<br />
De 41 años ...................... 74 73 1 87 86 1 95 90 5<br />
De 42 años ...................... 60 60 - 76 76 - 51 50 1<br />
De 43 años ...................... 50 50 - 29 29 - 30 29 1<br />
De 44 años ...................... 35 32 3 31 28 3 14 13 1<br />
De 45 años ...................... 18 18 - 8 8 - 11 10 1<br />
De 46 años ...................... 8 8 - 4 3 1 13 12 1<br />
De 47 años ...................... 5 4 1 1 1 - 4 4 -<br />
De 48 años ...................... 1 1 - 1 1 - 3 3 -<br />
De 49 años ...................... 1 1 - 2 2 - 1 1 -<br />
De 50 y más años ........... 4 3 1 3 3 - 2 2 -<br />
Estadísticas Históricas <strong>de</strong> Pob<strong>la</strong>ción <strong>de</strong> <strong>la</strong> Región <strong>de</strong> Murcia. 109
MNP. Datos Regionales. Nacimientos y Defunciones.<br />
3.3.1. EVOLUCIÓN DE LOS NACIMIENTOS POR EDAD Y EL ESTADO CIVIL DE LA MADRE. 1975-<br />
1993. PROVINCIA. (Continúa)<br />
EDADES<br />
TOTAL<br />
1987 1988 1989<br />
Madre<br />
casada<br />
Madre<br />
no<br />
casada<br />
TOTAL<br />
Madre<br />
casada<br />
Madre<br />
no<br />
casada<br />
TOTAL<br />
Madre<br />
casada<br />
Madre<br />
no<br />
casada<br />
TOTAL ............................. 13.996 13.209 787 13.979 13.181 798 13.992 13.251 741<br />
Menores <strong>de</strong> 15 años........ 4 1 3 8 3 5 13 7 6<br />
De 15 años ...................... 44 22 22 34 16 18 33 18 15<br />
De 16 años ...................... 105 75 30 91 54 37 90 56 34<br />
De 17 años ...................... 203 150 53 204 157 47 196 147 49<br />
De 18 años ...................... 296 246 50 330 269 61 292 246 46<br />
De 19 años ...................... 410 333 77 419 352 67 354 300 54<br />
De 20 años ...................... 492 445 47 459 408 51 446 392 54<br />
De 21 años ...................... 564 520 44 559 497 62 520 476 44<br />
De 22 años ...................... 729 690 39 719 673 46 654 619 35<br />
De 23 años ...................... 850 816 34 771 729 42 758 715 43<br />
De 24 años ...................... 947 905 42 968 922 46 868 837 31<br />
De 25 años ...................... 1.051 1.011 40 1.020 980 40 1.108 1.070 38<br />
De 26 años ...................... 1.024 980 44 1.048 1.022 26 1.039 1.010 29<br />
De 27 años ...................... 1.086 1.045 41 1.054 1.029 25 1.046 1.014 32<br />
De 28 años ...................... 1.001 975 26 1.061 1.030 31 1.076 1.036 40<br />
De 29 años ...................... 933 897 36 933 903 30 964 938 26<br />
De 30 años ...................... 757 728 29 833 808 25 903 876 27<br />
De 31 años ...................... 620 601 19 684 662 22 740 715 25<br />
De 32 años ...................... 515 494 21 511 493 18 584 570 14<br />
De 33 años ...................... 438 422 16 435 424 11 452 440 12<br />
De 34 años ...................... 379 362 17 375 357 18 389 374 15<br />
De 35 años ...................... 334 319 15 333 320 13 317 299 18<br />
De 36 años ...................... 284 279 5 266 255 11 273 259 14<br />
De 37 años ...................... 230 224 6 235 222 13 211 205 6<br />
De 38 años ...................... 197 191 6 154 142 12 200 193 7<br />
De 39 años ...................... 161 154 7 141 137 4 132 126 6<br />
De 40 años ...................... 100 95 5 117 112 5 124 117 7<br />
De 41 años ...................... 94 89 5 85 80 5 81 77 4<br />
De 42 años ...................... 64 60 4 52 49 3 49 45 4<br />
De 43 años ...................... 35 32 3 36 35 1 32 30 2<br />
De 44 años ...................... 29 28 1 22 20 2 24 22 2<br />
De 45 años ...................... 8 8 - 15 15 - 11 11 -<br />
De 46 años ...................... 4 4 - 3 2 1 9 8 1<br />
De 47 años ...................... 4 4 - 1 1 - 2 2 -<br />
De 48 años ...................... 4 4 - 1 1 - 1 - 1<br />
De 49 años ...................... - - - 1 1 - 1 1 -<br />
De 50 y más años............ - - - 1 1 - - - -<br />
110 Estadísticas Históricas <strong>de</strong> Pob<strong>la</strong>ción <strong>de</strong> <strong>la</strong> Región <strong>de</strong> Murcia.
MNP. Datos Regionales. Nacimientos y Defunciones.<br />
3.3.1. EVOLUCIÓN DE LOS NACIMIENTOS POR EDAD Y EL ESTADO CIVIL DE LA MADRE. 1975-<br />
1993. PROVINCIA. (Conclusión)<br />
EDADES<br />
TOTAL Madre<br />
casada<br />
1990 1991 1992 1993 (*)<br />
Madre<br />
no<br />
casada<br />
TOTAL Madre<br />
casada<br />
Madre<br />
no<br />
casada<br />
TOTAL Madre<br />
casada<br />
Madre<br />
no<br />
casada<br />
TOTAL Madre<br />
casada<br />
Madre no<br />
casada<br />
(1)<br />
TOTAL............................. 13.869 13.018 851 13.790 12.881 909 13.770 12.763 1.007 13.235 12.234 1.001<br />
Menores <strong>de</strong> 15 años........ 8 2 6 12 3 9 7 4 3 11 4 7<br />
De 15 años ...................... 33 14 19 37 20 17 38 15 23 20 6 14<br />
De 16 años ...................... 97 59 38 86 52 34 74 43 31 66 36 30<br />
De 17 años ...................... 187 123 64 160 116 44 175 129 46 119 87 32<br />
De 18 años ...................... 247 194 53 266 194 72 183 138 45 199 147 52<br />
De 19 años ...................... 312 269 43 316 267 49 301 236 65 288 221 67<br />
De 20 años ...................... 380 336 44 424 372 52 333 264 69 293 233 60<br />
De 21 años ...................... 527 461 66 432 381 51 413 360 53 325 265 60<br />
De 22 años ...................... 644 585 59 542 479 63 466 426 40 432 380 52<br />
De 23 años ...................... 750 704 46 657 620 37 591 544 47 554 505 49<br />
De 24 años ...................... 850 812 38 825 776 49 760 705 55 656 607 49<br />
De 25 años ...................... 972 934 38 943 905 38 898 860 38 858 807 51<br />
De 26 años ...................... 1.106 1.065 41 1.153 1.099 54 1.104 1.045 59 1.010 966 44<br />
De 27 años ...................... 1.075 1.040 35 1.099 1.062 37 1.122 1.071 51 1.089 1.057 32<br />
De 28 años ...................... 1.007 977 30 1.052 1.019 33 1.197 1.151 46 1.147 1.082 65<br />
De 29 años ...................... 916 880 36 955 926 29 982 933 49 1.071 1.015 56<br />
De 30 años ...................... 943 914 29 916 880 36 1.001 952 49 971 947 24<br />
De 31 años ...................... 756 724 32 781 742 39 853 820 33 848 806 42<br />
De 32 años ...................... 656 634 22 714 685 29 752 712 40 722 686 36<br />
De 33 años ...................... 511 494 17 566 543 23 615 588 27 632 599 33<br />
De 34 años ...................... 430 413 17 421 401 20 483 456 27 448 411 37<br />
De 35 años ...................... 347 335 12 361 325 36 377 350 27 390 364 26<br />
De 36 años ...................... 278 256 22 283 268 15 311 295 16 301 283 18<br />
De 37 años ...................... 240 232 8 205 193 12 211 189 22 196 183 13<br />
De 38 años ...................... 180 170 10 169 157 12 149 137 12 170 159 11<br />
De 39 años ...................... 128 125 3 116 111 5 128 118 10 147 137 10<br />
De 40 años ...................... 111 103 8 109 103 6 88 75 13 95 79 16<br />
De 41 años ...................... 63 57 6 76 69 7 68 65 3 69 65 4<br />
De 42 años ...................... 47 44 3 43 43 - 41 37 4 49 44 5<br />
De 43 años ...................... 28 25 3 31 30 1 26 24 2 32 28 4<br />
De 44 años ...................... 18 17 1 21 21 - 13 11 2 10 10 -<br />
De 45 años ...................... 12 11 1 6 6 - 5 5 - 9 9 -<br />
De 46 años ...................... 5 5 - 6 6 - 4 4 - 4 4 -<br />
De 47 años ...................... 2 2 - 3 3 - 1 1 - 1 1 -<br />
De 48 años ...................... 1 1 - 1 1 - - - - 2 1 1<br />
De 49 años ...................... - - - 3 3 - - - - - - -<br />
De 50 y más años ........... 2 1 1 - - - - - - - - -<br />
Nota: Son nacimientos por lugar <strong>de</strong> resi<strong>de</strong>ncia <strong>de</strong> <strong>la</strong> madre.<br />
La c<strong>la</strong>sificación <strong>de</strong> los nacimientos por edad <strong>de</strong> <strong>la</strong> madre se inicia en 1922 a nivel nacional. Es a partir <strong>de</strong> 1975 cuando se ofrece también por provincias, año en<br />
el que se produce una importante modificación <strong>de</strong>l MNP.<br />
(*) Datos Provisionales.<br />
(1) Hay un nacimiento <strong>de</strong>l que no consta <strong>la</strong> edad <strong>de</strong> <strong>la</strong> madre.<br />
Fuente: INE. Movimiento Natural <strong>de</strong> <strong>la</strong> Pob<strong>la</strong>ción.<br />
Consejería <strong>de</strong> Economía y Hacienda. Centro Regional <strong>de</strong> Estadística. Movimiento Natural <strong>de</strong> <strong>la</strong> Pob<strong>la</strong>ción <strong>de</strong> <strong>la</strong> Región <strong>de</strong> Murcia.<br />
Estadísticas Históricas <strong>de</strong> Pob<strong>la</strong>ción <strong>de</strong> <strong>la</strong> Región <strong>de</strong> Murcia. 111
MNP. Datos Regionales. Nacimientos y Defunciones.<br />
3.3.2. EVOLUCIÓN DE LOS NACIMIENTOS POR EDAD Y EL ESTADO CIVIL DE LA MADRE. 1975-<br />
1993. CAPITAL. (Continúa)<br />
EDADES<br />
TOTAL<br />
1975 1976 1977<br />
Madre<br />
casada<br />
Madre<br />
no<br />
casada<br />
TOTAL<br />
Madre<br />
casada<br />
Madre<br />
no<br />
casada<br />
TOTAL<br />
Madre<br />
casada<br />
TOTAL ............................. 5.931 5.859 72 6.376 6.288 88 6.242 6.135 107<br />
Madre<br />
no<br />
casada<br />
Menores <strong>de</strong> 15 años........ 4 4 - 9 7 2 6 6 -<br />
De 15 años ...................... 14 14 - 23 21 2 18 15 3<br />
De 16 años ...................... 41 39 2 62 58 4 55 50 5<br />
De 17 años ...................... 87 84 3 87 84 3 105 102 3<br />
De 18 años ...................... 106 103 3 140 134 6 140 138 2<br />
De 19 años ...................... 145 140 5 148 143 5 188 181 7<br />
De 20 años ...................... 203 200 3 252 244 8 262 252 10<br />
De 21 años ...................... 255 247 8 296 286 10 298 291 7<br />
De 22 años ...................... 294 287 7 332 328 4 321 317 4<br />
De 23 años ...................... 349 341 8 435 426 9 360 356 4<br />
De 24 años ...................... 365 356 9 436 430 6 468 462 6<br />
De 25 años ...................... 424 423 1 452 446 6 394 389 5<br />
De 26 años ...................... 384 383 1 402 402 - 444 436 8<br />
De 27 años ...................... 405 402 3 378 374 4 377 370 7<br />
De 28 años ...................... 336 335 1 383 382 1 367 364 3<br />
De 29 años ...................... 352 350 2 366 365 1 405 399 6<br />
De 30 años ...................... 336 333 3 366 364 2 346 342 4<br />
De 31 años ...................... 241 240 1 243 243 - 249 244 5<br />
De 32 años ...................... 219 217 2 228 224 4 224 221 3<br />
De 33 años ...................... 191 188 3 201 200 1 201 200 1<br />
De 34 años ...................... 200 200 - 164 161 3 193 192 1<br />
De 35 años ...................... 181 181 - 168 167 1 130 128 2<br />
De 36 años ...................... 131 130 1 182 182 - 128 126 2<br />
De 37 años ...................... 157 155 2 147 146 1 123 123 -<br />
De 38 años ...................... 112 112 - 115 115 - 114 112 2<br />
De 39 años ...................... 111 109 2 104 104 - 109 106 3<br />
De 40 años ...................... 95 95 - 86 86 - 65 63 2<br />
De 41 años ...................... 62 62 - 55 55 - 48 48 -<br />
De 42 años ...................... 63 63 - 40 39 1 44 44 -<br />
De 43 años ...................... 28 27 1 35 32 3 27 27 -<br />
De 44 años ...................... 19 18 1 22 21 1 17 15 2<br />
De 45 años ...................... 9 9 - 11 11 - 8 8 -<br />
De 46 años ...................... 4 4 - 5 5 - 7 7 -<br />
De 47 años ...................... 5 5 - 1 1 - - - -<br />
De 48 años ...................... 1 1 - - - - - - -<br />
De 49 años ...................... - - - 1 1 - 1 1 -<br />
De 50 y más años............ 2 2 - 1 1 - - - -<br />
112 Estadísticas Históricas <strong>de</strong> Pob<strong>la</strong>ción <strong>de</strong> <strong>la</strong> Región <strong>de</strong> Murcia.
MNP. Datos Regionales. Nacimientos y Defunciones.<br />
3.3.2. EVOLUCIÓN DE LOS NACIMIENTOS POR EDAD Y EL ESTADO CIVIL DE LA MADRE. 1975-<br />
1993. CAPITAL. (Continúa)<br />
EDADES<br />
TOTAL<br />
1978 1979 1980<br />
Madre<br />
casada<br />
Madre<br />
no<br />
casada<br />
TOTAL<br />
Madre<br />
casada<br />
Madre<br />
no<br />
casada<br />
TOTAL<br />
Madre<br />
casada<br />
TOTAL............................. 6.106 5.996 110 6.003 5.851 152 5.818 5.669 149<br />
Madre<br />
no<br />
casada<br />
Menores <strong>de</strong> 15 años........ 7 4 3 3 3 - 6 5 1<br />
De 15 años ...................... 29 26 3 27 24 3 26 25 1<br />
De 16 años ...................... 65 64 1 37 33 4 63 58 5<br />
De 17 años ...................... 97 92 5 97 89 8 97 91 6<br />
De 18 años ...................... 127 118 9 148 141 7 130 121 9<br />
De 19 años ...................... 187 181 6 187 173 14 188 178 10<br />
De 20 años ...................... 247 234 13 245 235 10 248 231 17<br />
De 21 años ...................... 290 286 4 322 311 11 312 308 4<br />
De 22 años ...................... 336 327 9 373 358 15 360 348 12<br />
De 23 años ...................... 413 405 8 355 346 9 375 367 8<br />
De 24 años ...................... 390 382 8 409 402 7 370 357 13<br />
De 25 años ...................... 428 423 5 405 398 7 390 379 11<br />
De 26 años ...................... 437 430 7 398 389 9 374 367 7<br />
De 27 años ...................... 406 402 4 369 363 6 385 382 3<br />
De 28 años ...................... 384 381 3 342 336 6 326 319 7<br />
De 29 años ...................... 358 351 7 326 320 6 316 309 7<br />
De 30 años ...................... 307 304 3 300 298 2 254 252 2<br />
De 31 años ...................... 242 240 2 251 248 3 217 214 3<br />
De 32 años ...................... 222 220 2 225 219 6 242 241 1<br />
De 33 años ...................... 196 196 - 214 211 3 189 188 1<br />
De 34 años ...................... 176 176 - 189 188 1 190 185 5<br />
De 35 años ...................... 142 142 - 148 146 2 157 154 3<br />
De 36 años ...................... 103 102 1 136 132 4 128 126 2<br />
De 37 años ...................... 118 116 2 83 83 - 105 104 1<br />
De 38 años ...................... 97 95 2 96 93 3 86 84 2<br />
De 39 años ...................... 86 86 - 83 82 1 85 84 1<br />
De 40 años ...................... 77 76 1 70 68 2 63 60 3<br />
De 41 años ...................... 46 45 1 63 62 1 48 46 2<br />
De 42 años ...................... 44 44 - 29 29 - 33 33 -<br />
De 43 años ...................... 20 20 - 28 28 - 19 19 -<br />
De 44 años ...................... 9 8 1 23 21 2 10 9 1<br />
De 45 años ...................... 10 10 - 9 9 - 17 17 -<br />
De 46 años ...................... 4 4 - 3 3 - 6 6 -<br />
De 47 años ...................... 2 2 - 4 4 - 1 1 -<br />
De 48 años ...................... 1 1 - 1 1 - 1 1 -<br />
De 49 años ...................... 1 1 - 3 3 - - - -<br />
De 50 y más años ........... 2 2 - 2 2 - 1 - 1<br />
Estadísticas Históricas <strong>de</strong> Pob<strong>la</strong>ción <strong>de</strong> <strong>la</strong> Región <strong>de</strong> Murcia. 113
MNP. Datos Regionales. Nacimientos y Defunciones.<br />
3.3.2. EVOLUCIÓN DE LOS NACIMIENTOS POR EDAD Y EL ESTADO CIVIL DE LA MADRE. 1975-<br />
1993. CAPITAL. (Continúa)<br />
EDADES<br />
TOTAL<br />
1981 1982 1983<br />
Madre<br />
casada<br />
Madre<br />
no<br />
casada<br />
TOTAL<br />
Madre<br />
casada<br />
Madre<br />
no<br />
casada<br />
TOTAL<br />
Madre<br />
casada<br />
TOTAL ............................. 5.201 5.042 159 5.262 5.054 208 4.591 4.403 188<br />
Madre<br />
no<br />
casada<br />
Menores <strong>de</strong> 15 años........ 13 11 2 3 3 - 7 6 1<br />
De 15 años ...................... 23 22 1 18 14 4 14 9 5<br />
De 16 años ...................... 61 57 4 36 29 7 35 29 6<br />
De 17 años ...................... 86 83 3 80 69 11 74 63 11<br />
De 18 años ...................... 98 89 9 111 99 12 98 94 4<br />
De 19 años ...................... 173 163 10 159 149 10 169 151 18<br />
De 20 años ...................... 198 186 12 174 166 8 174 160 14<br />
De 21 años ...................... 287 280 7 248 236 12 180 171 9<br />
De 22 años ...................... 327 315 12 308 292 16 240 224 16<br />
De 23 años ...................... 358 346 12 394 384 10 296 275 21<br />
De 24 años ...................... 398 382 16 375 357 18 338 325 13<br />
De 25 años ...................... 318 306 12 394 381 13 316 307 9<br />
De 26 años ...................... 352 346 6 351 343 8 322 315 7<br />
De 27 años ...................... 342 339 3 313 306 7 304 297 7<br />
De 28 años ...................... 282 280 2 347 335 12 269 262 7<br />
De 29 años ...................... 263 258 5 319 313 6 263 258 5<br />
De 30 años ...................... 235 231 4 261 254 7 237 235 2<br />
De 31 años ...................... 207 199 8 202 193 9 182 178 4<br />
De 32 años ...................... 190 185 5 190 184 6 169 164 5<br />
De 33 años ...................... 181 179 2 162 157 5 157 156 1<br />
De 34 años ...................... 173 170 3 170 166 4 136 129 7<br />
De 35 años ...................... 126 123 3 107 102 5 120 114 6<br />
De 36 años ...................... 122 120 2 135 133 2 113 110 3<br />
De 37 años ...................... 89 86 3 83 80 3 100 97 3<br />
De 38 años ...................... 87 81 6 76 72 4 87 86 1<br />
De 39 años ...................... 55 51 4 68 66 2 52 51 1<br />
De 40 años ...................... 63 62 1 49 47 2 36 35 1<br />
De 41 años ...................... 47 46 1 54 52 2 34 34 -<br />
De 42 años ...................... 17 16 1 27 27 - 28 28 -<br />
De 43 años ...................... 18 18 - 18 16 2 15 14 1<br />
De 44 años ...................... 4 4 - 15 15 - 5 5 -<br />
De 45 años ...................... 4 4 - 7 7 - 12 12 -<br />
De 46 años ...................... 2 2 - 5 4 1 4 4 -<br />
De 47 años ...................... 1 1 - - - - 3 3 -<br />
De 48 años ...................... - - - - - - 2 2 -<br />
De 49 años ...................... - - - 1 1 - - - -<br />
De 50 y más años............ 1 1 - 2 2 - - - -<br />
114 Estadísticas Históricas <strong>de</strong> Pob<strong>la</strong>ción <strong>de</strong> <strong>la</strong> Región <strong>de</strong> Murcia.
MNP. Datos Regionales. Nacimientos y Defunciones.<br />
3.3.2. EVOLUCIÓN DE LOS NACIMIENTOS POR EDAD Y EL ESTADO CIVIL DE LA MADRE. 1975-<br />
1993. CAPITAL. (Continúa)<br />
EDADES<br />
TOTAL<br />
1984 1985 1986<br />
Madre<br />
casada<br />
Madre<br />
no<br />
casada<br />
TOTAL<br />
Madre<br />
casada<br />
Madre<br />
no<br />
casada<br />
TOTAL<br />
Madre<br />
casada<br />
TOTAL............................. 4.600 4.374 226 4.447 4.163 284 4.374 4.120 254<br />
Madre<br />
no<br />
casada<br />
Menores <strong>de</strong> 15 años........ 4 - 4 2 1 1 4 - 4<br />
De 15 años ...................... 13 10 3 15 11 4 5 4 1<br />
De 16 años ...................... 45 37 8 32 27 5 33 24 9<br />
De 17 años ...................... 56 47 9 61 50 11 63 47 16<br />
De 18 años ...................... 80 66 14 93 83 10 111 95 16<br />
De 19 años ...................... 136 120 16 142 115 27 130 119 11<br />
De 20 años ...................... 199 180 19 153 136 17 135 119 16<br />
De 21 años ...................... 192 176 16 200 180 20 184 172 12<br />
De 22 años ...................... 217 209 8 193 181 12 219 206 13<br />
De 23 años ...................... 262 251 11 263 247 16 224 215 9<br />
De 24 años ...................... 347 331 16 305 286 19 301 284 17<br />
De 25 años ...................... 356 343 13 312 299 13 289 274 15<br />
De 26 años ...................... 346 336 10 367 349 18 360 347 13<br />
De 27 años ...................... 318 311 7 337 323 14 335 324 11<br />
De 28 años ...................... 276 271 5 267 261 6 334 324 10<br />
De 29 años ...................... 254 244 10 235 220 15 256 244 12<br />
De 30 años ...................... 249 239 10 219 204 15 272 261 11<br />
De 31 años ...................... 218 207 11 234 224 10 183 177 6<br />
De 32 años ...................... 169 164 5 163 155 8 174 166 8<br />
De 33 años ...................... 160 155 5 180 171 9 136 128 8<br />
De 34 años ...................... 140 135 5 120 112 8 123 119 4<br />
De 35 años ...................... 116 112 4 110 106 4 103 96 7<br />
De 36 años ...................... 107 104 3 106 102 4 98 95 3<br />
De 37 años ...................... 72 71 1 97 89 8 72 67 5<br />
De 38 años ...................... 82 76 6 74 74 - 71 66 5<br />
De 39 años ...................... 65 64 1 49 46 3 41 36 5<br />
De 40 años ...................... 43 40 3 41 38 3 32 29 3<br />
De 41 años ...................... 22 21 1 30 30 - 36 34 2<br />
De 42 años ...................... 16 16 - 23 23 - 18 18 -<br />
De 43 años ...................... 16 16 - 9 9 - 13 12 1<br />
De 44 años ...................... 12 10 2 8 5 3 7 7 -<br />
De 45 años ...................... 5 5 - 3 3 - 4 4 -<br />
De 46 años ...................... 4 4 - 3 2 1 5 4 1<br />
De 47 años ...................... 2 2 - - - - 1 1 -<br />
De 48 años ...................... - - - - - - 1 1 -<br />
De 49 años ...................... - - - 1 1 - - - -<br />
De 50 y más años ........... 1 1 - - - - 1 1 -<br />
Estadísticas Históricas <strong>de</strong> Pob<strong>la</strong>ción <strong>de</strong> <strong>la</strong> Región <strong>de</strong> Murcia. 115
MNP. Datos Regionales. Nacimientos y Defunciones.<br />
3.3.2. EVOLUCIÓN DE LOS NACIMIENTOS POR EDAD Y ESTADO CIVIL DE LA MADRE. 1975-<br />
1993. CAPITAL. (Continúa)<br />
EDADES<br />
TOTAL<br />
1987 1988 1989<br />
Madre<br />
casada<br />
Madre<br />
no<br />
casada<br />
TOTAL<br />
Madre<br />
casada<br />
Madre<br />
no<br />
casada<br />
TOTAL<br />
Madre<br />
casada<br />
TOTAL ............................. 4.262 3.991 271 4.337 4.071 266 4.405 4.168 237<br />
Madre<br />
no<br />
casada<br />
Menores <strong>de</strong> 15 años........ 1 1 - 1 - 1 2 1 1<br />
De 15 años ...................... 8 5 3 10 5 5 8 4 4<br />
De 16 años ...................... 31 21 10 28 22 6 25 15 10<br />
De 17 años ...................... 49 38 11 58 49 9 68 60 8<br />
De 18 años ...................... 86 71 15 101 82 19 89 77 12<br />
De 19 años ...................... 111 87 24 111 93 18 108 90 18<br />
De 20 años ...................... 158 140 18 138 121 17 129 117 12<br />
De 21 años ...................... 177 163 14 160 144 16 155 138 17<br />
De 22 años ...................... 217 208 9 188 170 18 191 178 13<br />
De 23 años ...................... 268 257 11 227 214 13 241 226 15<br />
De 24 años ...................... 255 235 20 276 259 17 255 251 4<br />
De 25 años ...................... 281 269 12 324 308 16 325 316 9<br />
De 26 años ...................... 285 271 14 289 282 7 297 290 7<br />
De 27 años ...................... 314 295 19 322 308 14 309 295 14<br />
De 28 años ...................... 314 302 12 363 349 14 346 335 11<br />
De 29 años ...................... 314 300 14 300 290 10 311 300 11<br />
De 30 años ...................... 224 213 11 280 273 7 286 278 8<br />
De 31 años ...................... 216 210 6 232 222 10 255 247 8<br />
De 32 años ...................... 163 156 7 185 177 8 219 214 5<br />
De 33 años ...................... 137 131 6 150 145 5 162 157 5<br />
De 34 años ...................... 114 108 6 118 111 7 132 125 7<br />
De 35 años ...................... 125 120 5 121 117 4 110 103 7<br />
De 36 años ...................... 97 94 3 87 84 3 88 77 11<br />
De 37 años ...................... 70 67 3 66 63 3 67 64 3<br />
De 38 años ...................... 75 70 5 44 37 7 73 71 2<br />
De 39 años ...................... 54 50 4 43 41 2 40 38 2<br />
De 40 años ...................... 36 32 4 41 38 3 44 40 4<br />
De 41 años ...................... 33 31 2 29 26 3 36 32 4<br />
De 42 años ...................... 19 18 1 21 19 2 16 13 3<br />
De 43 años ...................... 11 10 1 9 9 - 3 3 -<br />
De 44 años ...................... 13 12 1 7 6 1 6 5 1<br />
De 45 años ...................... 3 3 - 5 5 - 4 4 -<br />
De 46 años ...................... 2 2 - 2 1 1 4 3 1<br />
De 47 años ...................... 1 1 - - - - 1 1 -<br />
De 48 años ...................... - - - 1 1 - - - -<br />
De 49 años ...................... - - - - - - - - -<br />
De 50 y más años............ - - - - - - - - -<br />
116 Estadísticas Históricas <strong>de</strong> Pob<strong>la</strong>ción <strong>de</strong> <strong>la</strong> Región <strong>de</strong> Murcia.
MNP. Datos Regionales. Nacimientos y Defunciones.<br />
3.3.2. EVOLUCIÓN DE LOS NACIMIENTOS POR EDAD Y ESTADO CIVIL DE LA MADRE. 1975-<br />
1993. CAPITAL. (Conclusión)<br />
EDADES<br />
TOTAL Madre<br />
casada<br />
1990 1991 1992 1993 (*)<br />
Madre<br />
no<br />
casada<br />
TOTAL Madre<br />
casada<br />
Madre<br />
no<br />
casada<br />
TOTAL Madre<br />
casada<br />
Madre<br />
no<br />
casada<br />
TOTAL Madre<br />
casada<br />
TOTAL............................. 4.414 4.138 276 4.436 4.092 344 4.494 4.143 351 4.181 3.866 315<br />
Menores <strong>de</strong> 15 años........ 5 2 3 2 - 2 2 1 1 2 - 2<br />
De 15 años ...................... 8 2 6 15 9 6 10 5 5 5 2 3<br />
De 16 años ...................... 35 21 14 28 16 12 23 17 6 21 11 10<br />
De 17 años ...................... 52 38 14 50 43 7 47 39 8 32 24 8<br />
De 18 años ...................... 81 62 19 98 70 28 52 40 12 66 51 15<br />
De 19 años ...................... 88 78 10 101 85 16 91 74 17 78 64 14<br />
De 20 años ...................... 105 97 8 112 101 11 103 78 25 90 72 18<br />
De 21 años ...................... 150 130 20 141 120 21 128 111 17 113 91 22<br />
De 22 años ...................... 186 172 14 168 140 28 136 127 9 137 125 12<br />
De 23 años ...................... 226 206 20 222 209 13 178 162 16 192 181 11<br />
De 24 años ...................... 268 253 15 229 212 17 235 216 19 179 165 14<br />
De 25 años ...................... 321 306 15 320 305 15 296 280 16 251 234 17<br />
De 26 años ...................... 325 311 14 353 333 20 354 335 19 282 263 19<br />
De 27 años ...................... 331 319 12 315 300 15 349 333 16 325 313 12<br />
De 28 años ...................... 308 300 8 354 333 21 372 350 22 333 315 18<br />
De 29 años ...................... 277 266 11 325 312 13 347 324 23 315 295 20<br />
De 30 años ...................... 309 297 12 286 273 13 345 328 17 340 329 11<br />
De 31 años ...................... 255 244 11 237 222 15 262 252 10 291 277 14<br />
De 32 años ...................... 234 225 9 225 218 7 271 255 16 245 231 14<br />
De 33 años ...................... 182 177 5 205 198 7 210 200 10 200 193 7<br />
De 34 años ...................... 163 154 9 150 139 11 162 148 14 163 148 15<br />
De 35 años ...................... 134 131 3 121 106 15 139 125 14 132 122 10<br />
De 36 años ...................... 96 87 9 95 85 10 122 115 7 119 111 8<br />
De 37 años ...................... 82 80 2 64 58 6 74 65 9 74 68 6<br />
De 38 años ...................... 54 50 4 71 64 7 56 49 7 61 58 3<br />
De 39 años ...................... 41 40 1 48 46 2 43 39 4 46 42 4<br />
De 40 años ...................... 42 38 4 31 29 2 32 25 7 34 32 2<br />
De 41 años ...................... 22 21 1 31 28 3 28 26 2 21 21 -<br />
De 42 años ...................... 13 13 - 15 15 - 12 11 1 14 11 3<br />
De 43 años ...................... 10 9 1 10 9 1 7 6 1 13 10 3<br />
De 44 años ...................... 3 2 1 8 8 - 5 4 1 5 5 -<br />
De 45 años ...................... 5 4 1 4 4 - 1 1 - 2 2 -<br />
De 46 años ...................... - - - 2 2 - 2 2 - - - -<br />
De 47 años ...................... 1 1 - - - - - - - - - -<br />
De 48 años ...................... 1 1 - - - - - - - - - -<br />
De 49 años ...................... - - - - - - - - - - - -<br />
De 50 y más años ........... 1 1 - - - - - - - - - -<br />
Madre<br />
no<br />
casada<br />
Nota: Son nacimientos por lugar <strong>de</strong> resi<strong>de</strong>ncia <strong>de</strong> <strong>la</strong> madre.<br />
La c<strong>la</strong>sificación <strong>de</strong> los nacimientos por edad <strong>de</strong> <strong>la</strong> madre se inicia en 1922 a nivel nacional. Es a partir <strong>de</strong> 1975 cuando se ofrece también por provincias, año en<br />
el que se produce una importante modificación <strong>de</strong>l MNP.<br />
(*) Datos Provisionales.<br />
Fuente: INE. Movimiento Natural <strong>de</strong> <strong>la</strong> Pob<strong>la</strong>ción.<br />
Consejería <strong>de</strong> Economía y Hacienda. Centro Regional <strong>de</strong> Estadística. Movimiento Natural <strong>de</strong> <strong>la</strong> Pob<strong>la</strong>ción <strong>de</strong> <strong>la</strong> Región <strong>de</strong> Murcia.<br />
Estadísticas Históricas <strong>de</strong> Pob<strong>la</strong>ción <strong>de</strong> <strong>la</strong> Región <strong>de</strong> Murcia. 117
MNP. Datos Regionales. Nacimientos y Defunciones.<br />
3.4. EVOLUCIÓN DE LOS NACIMIENTOS POR MESES. 1975-1993. PROVINCIA.<br />
AÑOS<br />
Meses<br />
TOTAL Enero Feb. Marzo Abril Mayo Junio Julio Agos. Sept. Oct. Nov. Dic.<br />
1975................... 18.484 1.514 1.479 1.432 1.608 1.519 1.562 1.558 1.455 1.674 1.650 1.569 1.464<br />
1976................... 19.649 1.851 1.497 1.568 1.672 1.470 1.517 1.646 1.637 1.787 1.730 1.595 1.679<br />
1977................... 19.103 1.627 1.430 1.640 1.545 1.469 1.443 1.577 1.664 1.755 1.724 1.589 1.640<br />
1978................... 18.942 1.540 1.369 1.671 1.624 1.714 1.490 1.743 1.600 1.641 1.542 1.535 1.473<br />
1979................... 18.758 1.753 1.386 1.557 1.565 1.533 1.506 1.618 1.444 1.647 1.701 1.522 1.526<br />
1980................... 18.204 1.588 1.422 1.516 1.468 1.486 1.440 1.611 1.510 1.587 1.628 1.418 1.530<br />
1981................... 16.758 1.487 1.364 1.424 1.443 1.343 1.334 1.472 1.552 1.305 1.470 1.299 1.265<br />
1982................... 16.575 1.440 1.190 1.415 1.398 1.446 1.398 1.289 1.317 1.440 1.514 1.328 1.400<br />
1983................... 15.344 1.296 1.175 1.240 1.226 1.310 1.235 1.383 1.317 1.254 1.332 1.258 1.318<br />
1984................... 14.862 1.298 1.179 1.247 1.146 1.229 1.191 1.202 1.196 1.331 1.381 1.223 1.239<br />
1985................... 14.546 1.230 1.105 1.274 1.206 1.201 1.232 1.226 1.159 1.368 1.227 1.117 1.201<br />
1986................... 13.958 1.124 1.050 1.108 1.161 1.153 1.090 1.194 1.157 1.287 1.239 1.202 1.193<br />
1987................... 13.996 1.164 984 1.191 1.107 1.094 1.072 1.194 1.279 1.269 1.272 1.164 1.206<br />
1988................... 13.979 1.114 1.130 1.219 1.039 1.092 1.019 1.144 1.244 1.292 1.273 1.226 1.187<br />
1989................... 13.992 1.127 1.055 1.149 1.143 1.094 1.097 1.171 1.210 1.242 1.277 1.213 1.214<br />
1990................... 13.869 1.236 1.054 1.130 1.135 1.117 1.058 1.206 1.219 1.204 1.205 1.128 1.177<br />
1991................... 13.790 1.158 1.029 1.110 1.119 1.118 1.082 1.127 1.166 1.310 1.265 1.175 1.131<br />
1992................... 13.770 1.221 1.099 1.136 1.143 1.094 1.002 1.172 1.200 1.254 1.206 1.134 1.109<br />
1993 (*).............. 13.235 1.133 1.025 1.128 1.023 1.075 1.067 1.125 1.147 1.164 1.135 1.105 1.108<br />
(*) Datos Provisionales.<br />
Fuente: INE. Movimiento Natural <strong>de</strong> <strong>la</strong> Pob<strong>la</strong>ción.<br />
Consejería <strong>de</strong> Economía y Hacienda. Centro Regional <strong>de</strong> Estadística. Movimiento Natural <strong>de</strong> <strong>la</strong> Pob<strong>la</strong>ción <strong>de</strong> <strong>la</strong> Región <strong>de</strong> Murcia.<br />
118 Estadísticas Históricas <strong>de</strong> Pob<strong>la</strong>ción <strong>de</strong> <strong>la</strong> Región <strong>de</strong> Murcia.
MNP. Datos Regionales. Nacimientos y Defunciones.<br />
3.5.1. EVOLUCIÓN DE LAS DEFUNCIONES REGISTRADAS POR GRUPOS DE EDAD Y SEXO.<br />
1861-1870. PROVINCIA. (Continúa)<br />
EDADES 1861 1862 1863 1864 1865 1866 1867 1868 1869 1870<br />
TOTAL AMBOS SEXOS..................... 9.639 10.033 10.306 12.610 14.248 10.031 11.032 11.837 15.341 13.387<br />
TOTAL HOMBRES ............................. .. .. 5.358 6.503 7.246 5.287 5.685 6.122 7.865 7.072<br />
TOTAL MUJERES.............................. .. .. 4.948 6.107 7.002 4.744 5.347 5.715 7.476 6.315<br />
Menores <strong>de</strong> 1 año .............................. 2.377 2.327 2.746 3.209 3.219 2.585 2.764 2.638 3.257 2.977<br />
Hombres ....................................... .. .. 1.509 1.752 1.736 1.441 1.475 1.470 1.779 1.605<br />
Mujeres ......................................... .. .. 1.237 1.457 1.483 1.144 1.289 1.168 1.478 1.372<br />
..<br />
De 1 a 5 años ..................................... 2.855 2.759 2.816 4.158 4.330 2.796 3.312 3.320 4.482 3.862<br />
Hombres ....................................... .. .. 1.494 2.141 2.189 1.501 1.715 1.716 2.305 1.994<br />
Mujeres ......................................... .. .. 1.322 2.017 2.141 1.295 1.597 1.604 2.177 1.868<br />
De 6 a 10 años ................................... 316 383 331 408 572 294 248 262 410 523<br />
Hombres ....................................... .. .. 166 213 278 150 128 133 207 249<br />
Mujeres ......................................... .. .. 165 195 294 144 120 129 203 274<br />
De 11 a 15 años ................................. 170 172 141 171 244 152 149 215 285 331<br />
Hombres ....................................... .. .. 67 98 121 71 69 107 141 189<br />
Mujeres ......................................... .. .. 74 73 123 81 80 108 144 142<br />
De 16 a 20 años ................................. 196 215 209 236 331 235 226 247 376 338<br />
Hombres ....................................... .. .. 116 112 175 107 104 114 174 132<br />
Mujeres ......................................... .. .. 93 124 156 128 122 133 202 206<br />
De 21 a 25 años ................................. 286 303 310 313 440 278 263 343 511 373<br />
Hombres ....................................... .. .. 169 163 237 141 146 188 291 169<br />
Mujeres ......................................... .. .. 141 150 203 137 117 155 220 204<br />
De 26 a 30 años ................................. 218 270 294 278 419 288 280 304 454 415<br />
Hombres ....................................... .. .. 131 136 178 147 131 159 214 192<br />
Mujeres ......................................... .. .. 163 142 241 141 149 145 240 223<br />
De 31 a 35 años ................................. 242 265 263 294 412 266 254 338 529 352<br />
Hombres ....................................... .. .. 125 136 210 112 121 176 255 182<br />
Mujeres ......................................... .. .. 138 158 202 154 133 162 274 170<br />
De 36 a 40 años ................................. 221 297 271 319 389 231 308 356 530 390<br />
Hombres ....................................... .. .. 131 159 197 121 156 155 261 205<br />
Mujeres ......................................... .. .. 140 160 192 110 152 201 269 185<br />
De 41 a 45 años ................................. 271 314 277 303 387 291 281 396 491 421<br />
Hombres ....................................... .. .. 155 162 203 158 161 228 247 262<br />
Mujeres ......................................... .. .. 122 141 184 133 120 168 244 159<br />
De 46 a 50 años ................................. 242 294 282 285 386 258 310 403 584 486<br />
Hombres ....................................... .. .. 160 171 221 149 169 198 310 282<br />
Mujeres ......................................... .. .. 122 114 165 109 141 205 274 204<br />
De 51 a 55 años ................................. 267 321 298 330 449 310 273 389 511 515<br />
Hombres ....................................... .. .. 159 177 252 173 167 202 295 337<br />
Mujeres ......................................... .. .. 139 153 197 137 106 187 216 178<br />
De 56 a 60 años ................................. 271 335 293 347 459 334 417 546 634 463<br />
Hombres ....................................... .. .. 154 188 240 178 225 309 315 260<br />
Mujeres ......................................... .. .. 139 159 219 156 192 237 319 203<br />
De 61 a 65 años ................................. 388 456 386 470 514 384 402 448 474 411<br />
Hombres ....................................... .. .. 198 246 261 231 209 228 253 226<br />
Mujeres ......................................... .. .. 188 224 253 153 193 220 221 185<br />
De 66 a 70 años ................................. 278 320 316 351 452 327 422 462 568 471<br />
Hombres ....................................... .. .. 156 175 217 165 207 228 272 250<br />
Mujeres ......................................... .. .. 160 176 235 162 215 234 296 221<br />
Estadísticas Históricas <strong>de</strong> Pob<strong>la</strong>ción <strong>de</strong> <strong>la</strong> Región <strong>de</strong> Murcia. 119
MNP. Datos Regionales. Nacimientos y Defunciones.<br />
3.5.1. EVOLUCIÓN DE LAS DEFUNCIONES REGISTRADAS POR GRUPOS DE EDAD Y SEXO.<br />
1861-1870. PROVINCIA. (Conclusión)<br />
EDADES 1861 1862 1863 1864 1865 1866 1867 1868 1869 1870<br />
De 71 a 75 años ................................. 331 329 340 370 408 324 355 389 396 320<br />
Hombres ....................................... .. .. 160 175 196 155 177 200 183 182<br />
Mujeres ......................................... .. .. 180 195 212 169 178 189 213 138<br />
De 76 a 80 años ................................. 274 272 291 297 321 269 357 366 396 345<br />
Hombres ....................................... .. .. 126 136 136 126 158 161 168 173<br />
Mujeres ......................................... .. .. 165 161 185 143 199 205 228 172<br />
De 81 a 85 años ................................. 241 221 233 257 289 228 225 213 246 188<br />
Hombres ....................................... .. .. 102 87 125 85 99 82 100 85<br />
Mujeres ......................................... .. .. 131 170 164 143 126 131 146 103<br />
De 86 a 90 años ................................. 124 116 133 155 153 131 121 127 130 113<br />
Hombres ....................................... .. .. 55 59 51 56 47 47 67 58<br />
Mujeres ......................................... .. .. 78 96 102 75 74 80 63 55<br />
De 91 a 95 años ................................. 40 31 43 33 42 31 40 45 41 74<br />
Hombres ....................................... .. .. 13 9 16 16 12 15 15 30<br />
Mujeres ......................................... .. .. 30 24 26 15 28 30 26 44<br />
De 96 y más años............................... 31 33 33 26 32 19 25 30 36 19<br />
Hombres ....................................... .. .. 12 8 7 4 9 6 13 10<br />
Mujeres ......................................... .. .. 21 18 25 15 16 24 23 9<br />
Fuente: INE. Movimiento Natural <strong>de</strong> <strong>la</strong> Pob<strong>la</strong>ción.<br />
120 Estadísticas Históricas <strong>de</strong> Pob<strong>la</strong>ción <strong>de</strong> <strong>la</strong> Región <strong>de</strong> Murcia.
MNP. Datos Regionales. Nacimientos y Defunciones.<br />
3.5.2. EVOLUCIÓN DE LAS DEFUNCIONES POR GRUPOS DE EDAD Y SEXO. 1900-1993.<br />
PROVINCIA. (Continúa)<br />
EDADES 1900 1901 1910 1911 1920 1921 1930 1931 1940 1941<br />
TOTAL AMBOS SEXOS......... 16.687 14.457 15.663 13.798 14.892 13.124 11.037 10.918 11.919 12.780<br />
TOTAL HOMBRES ................. 8.756 7.556 8.274 7.196 7.621 6.784 5.798 5.593 6.533 7.124<br />
TOTAL MUJERES.................. 7.931 6.901 7.389 6.602 7.271 6.340 5.239 5.325 5.386 5.656<br />
Menores <strong>de</strong> 1 año .................. 4.636 4.042 3.200 2.780 3.026 2.792 2.173 2.056 2.027 1.958<br />
Hombres................................. 2.532 2.261 1.797 1.616 1.694 1.591 1.206 1.129 1.100 1.068<br />
Mujeres................................... 2.104 1.781 1.403 1.164 1.332 1.210 967 927 927 890<br />
De 1 a 4 años ......................... 3.706 3.103 3.454 3.434 2.620 2.565 1.828 1.327 1.233 908<br />
Hombres................................. 1.882 1.612 1.850 1.682 1.354 1.310 956 706 623 482<br />
Mujeres................................... 1.824 1.491 1.604 1.572 1.266 1.255 872 621 610 426<br />
De 5 a 9 años ......................... 487 439 598 475 583 449 318 293 367 270<br />
Hombres................................. 254 213 316 243 297 232 162 161 189 157<br />
Mujeres................................... 233 226 282 232 286 217 156 132 178 113<br />
De 10 a 14 años ..................... 263 264 257 239 262 237 163 161 175 172<br />
Hombres................................. 136 122 135 120 116 111 85 80 101 82<br />
Mujeres................................... 127 142 122 119 146 126 78 81 74 90<br />
De 15 a 19 años ..................... 354 366 382 358 474 324 290 313 272 331<br />
Hombres................................. 178 176 185 181 222 138 142 157 145 177<br />
Mujeres................................... 176 190 197 177 252 186 148 156 127 154<br />
De 20 a 24 años ..................... 524 446 471 432 580 460 343 324 380 448<br />
Hombres................................. 301 240 243 229 269 236 163 156 241 303<br />
Mujeres................................... 223 206 228 203 311 224 180 168 139 145<br />
De 25 a 29 años ..................... 482 387 402 277 510 398 321 293 398 374<br />
Hombres................................. 223 178 195 143 231 177 160 142 265 255<br />
Mujeres................................... 259 209 207 134 279 221 161 151 133 119<br />
De 30 a 34 años ..................... 409 305 377 316 405 277 266 317 382 428<br />
Hombres................................. 209 156 201 149 187 132 150 140 259 287<br />
Mujeres................................... 200 149 176 167 218 145 116 177 123 141<br />
De 35 a 39 años ..................... 488 400 392 332 254 268 247 268 339 397<br />
Hombres................................. 274 226 210 183 176 142 126 134 232 248<br />
Mujeres................................... 214 174 182 149 178 126 121 134 107 149<br />
De 40 a 44 años ..................... 449 328 482 319 389 333 253 287 320 427<br />
Hombres................................. 260 190 265 163 206 186 151 169 192 268<br />
Mujeres................................... 189 138 217 156 183 147 102 118 128 159<br />
De 45 a 49 años ..................... 447 405 455 388 411 321 267 262 398 506<br />
Hombres................................. 254 222 275 226 238 190 153 148 265 335<br />
Mujeres................................... 193 183 180 162 173 131 114 114 133 171<br />
De 50 a 54 años ..................... 439 334 495 448 516 441 329 365 413 553<br />
Hombres................................. 267 187 290 236 273 247 187 202 269 378<br />
Mujeres................................... 172 147 205 212 243 194 142 163 144 175<br />
De 55 a 59 años ..................... 602 557 515 443 467 500 428 412 429 564<br />
Hombres................................. 308 293 302 257 270 287 246 241 271 364<br />
Mujeres................................... 294 264 213 186 197 213 182 171 158 200<br />
De 60 a 64 años ..................... 586 573 731 648 762 658 621 643 669 858<br />
Hombres................................. 358 316 383 332 411 357 368 356 384 516<br />
Mujeres................................... 228 257 348 316 351 301 253 287 285 342<br />
De 65 a 69 años ..................... 749 704 663 574 640 648 687 739 796 904<br />
Hombres................................. 356 259 340 317 344 334 383 386 463 507<br />
Mujeres................................... 393 345 323 257 296 314 304 353 333 397<br />
Estadísticas Históricas <strong>de</strong> Pob<strong>la</strong>ción <strong>de</strong> <strong>la</strong> Región <strong>de</strong> Murcia. 121
MNP. Datos Regionales. Nacimientos y Defunciones.<br />
3.5.2. EVOLUCIÓN DE LAS DEFUNCIONES POR GRUPOS DE EDAD Y SEXO. 1900-1993.<br />
PROVINCIA. (Continúa)<br />
EDADES 1900 1901 1910 1911 1920 1921 1930 1931 1940 1941<br />
De 70 a 74 años ..................... 572 456 803 733 828 646 747 844 879 1.037<br />
Hombres ................................. 284 239 388 321 399 303 373 424 441 530<br />
Mujeres................................... 288 217 415 412 429 343 374 420 438 507<br />
De 75 a 79 años ..................... 683 646 726 625 731 626 647 743 869 1.003<br />
Hombres ................................. 330 290 366 333 368 323 322 370 458 529<br />
Mujeres................................... 353 356 360 292 363 303 325 373 411 474<br />
De 80 y más años................... 789 683 1.260 1.157 1319 1.164 1.094 1.249 1.407 1.604<br />
Hombres ................................. 335 263 533 465 561 477 454 477 531 614<br />
Mujeres................................... 454 420 727 692 758 687 640 772 876 990<br />
Hombres no consta ................ 15 13 5 3 5 11 11 15 104 24<br />
Mujeres no consta .................. 7 6 1 2 10 6 4 7 62 14<br />
Fuente: INE. Movimiento Natural <strong>de</strong> <strong>la</strong> Pob<strong>la</strong>ción.<br />
Consejería <strong>de</strong> Economía y Hacienda. Centro Regional <strong>de</strong> Estadística. Movimiento Natural <strong>de</strong> <strong>la</strong> Pob<strong>la</strong>ción <strong>de</strong> <strong>la</strong> Región <strong>de</strong> Murcia.<br />
122 Estadísticas Históricas <strong>de</strong> Pob<strong>la</strong>ción <strong>de</strong> <strong>la</strong> Región <strong>de</strong> Murcia.
MNP. Datos Regionales. Nacimientos y Defunciones.<br />
3.5.2. EVOLUCIÓN DE LAS DEFUNCIONES POR GRUPOS DE EDAD Y SEXO. 1900-1993.<br />
PROVINCIA. (Continúa)<br />
EDADES 1950 1951 1960 1961 1970 1971 1980 1981 1990 1991 1992 1993 (*)<br />
TOTAL AMBOS SEXOS......... 7.735 8.101 6.638 6.502 7.182 7.949 7.561 7.662 8.552 8.480 8.264 8.279<br />
TOTAL HOMBRES ................. 3.939 4.165 3.423 3.236 3.774 4.170 3.949 3.994 4.542 4.416 4.349 4.340<br />
TOTAL MUJERES.................. 3.796 3.936 3.215 3.266 3.408 3.779 3.612 3.668 4.010 4.064 3.915 3.939<br />
Menores <strong>de</strong> 1 año .................. 1.040 974 798 779 591 494 263 152 95 126 127 72<br />
Hombres................................. 563 538 442 423 329 286 151 96 53 67 76 41<br />
Mujeres................................... 477 436 356 356 262 208 112 56 42 59 51 31<br />
De 1 a 4 años ......................... 527 475 150 128 60 59 71 57 27 19 20 19<br />
Hombres................................. 279 265 72 68 41 34 35 28 17 12 10 11<br />
Mujeres................................... 248 210 78 60 19 25 36 29 10 7 10 8<br />
De 5 a 9 años ......................... 151 151 46 56 39 39 28 27 21 16 15 8<br />
Hombres................................. 83 84 29 30 19 21 18 14 13 10 8 3<br />
Mujeres................................... 68 67 17 26 20 18 10 13 8 6 7 5<br />
De 10 a 14 años ..................... 78 93 29 35 23 22 32 35 30 31 16 15<br />
Hombres................................. 44 46 18 22 15 12 21 28 14 19 12 13<br />
Mujeres................................... 34 47 11 13 8 10 11 7 16 12 4 2<br />
De 15 a 19 años ..................... 152 150 45 32 31 55 49 45 79 60 51 53<br />
Hombres................................. 84 89 32 19 22 39 40 37 50 48 38 37<br />
Mujeres................................... 68 61 13 13 9 16 9 8 29 12 13 16<br />
De 20 a 24 años ..................... 237 209 56 59 49 77 47 55 92 92 72 58<br />
Hombres................................. 138 114 38 33 42 54 31 43 76 80 60 42<br />
Mujeres................................... 99 95 18 26 7 23 16 12 16 12 12 16<br />
De 25 a 29 años ..................... 227 220 63 63 45 48 52 48 83 83 87 70<br />
Hombres................................. 124 136 36 33 28 27 36 36 66 63 70 55<br />
Mujeres................................... 103 84 27 30 17 21 16 12 17 20 17 15<br />
De 30 a 34 años ..................... 145 165 96 91 45 51 67 49 84 90 81 61<br />
Hombres................................. 80 82 61 52 31 30 48 32 60 63 60 53<br />
Mujeres................................... 65 83 35 39 14 21 19 17 24 27 21 8<br />
De 35 a 39 años ..................... 190 154 103 119 109 84 76 68 97 83 86 80<br />
Hombres................................. 106 80 52 55 70 56 50 43 65 59 64 60<br />
Mujeres................................... 84 74 51 64 39 28 26 25 32 24 22 20<br />
De 40 a 44 años ..................... 199 194 96 105 152 138 110 92 116 104 100 97<br />
Hombres................................. 119 101 48 52 98 87 77 71 91 73 69 72<br />
Mujeres................................... 80 93 48 53 54 51 33 21 25 31 31 25<br />
De 45 a 49 años ..................... 275 256 153 141 184 186 191 188 130 129 155 135<br />
Hombres................................. 170 149 85 81 111 116 123 123 95 91 105 91<br />
Mujeres................................... 105 107 68 60 73 70 68 65 35 38 50 44<br />
De 50 a 54 años ..................... 353 343 230 242 201 237 298 291 242 206 190 179<br />
Hombres................................. 214 206 133 152 118 145 208 189 173 137 133 128<br />
Mujeres................................... 139 137 97 90 83 92 90 102 69 69 57 51<br />
De 55 a 59 años ..................... 394 381 367 355 322 320 430 391 415 394 380 304<br />
Hombres................................. 238 228 220 216 185 199 293 287 281 262 268 204<br />
Mujeres................................... 156 153 147 139 137 121 137 104 134 132 112 100<br />
De 60 a 64 años ..................... 485 572 488 521 515 568 420 466 608 587 576 546<br />
Hombres................................. 272 336 308 290 325 350 278 290 420 371 382 382<br />
Mujeres................................... 213 236 180 231 190 218 142 176 188 216 194 164<br />
De 65 a 69 años ..................... 549 620 657 697 829 829 655 725 780 852 806 764<br />
Hombres................................. 277 347 395 358 478 473 388 474 503 574 534 507<br />
Mujeres................................... 272 273 262 339 351 356 267 251 277 278 272 257<br />
Estadísticas Históricas <strong>de</strong> Pob<strong>la</strong>ción <strong>de</strong> <strong>la</strong> Región <strong>de</strong> Murcia. 123
MNP. Datos Regionales. Nacimientos y Defunciones.<br />
3.5.2. EVOLUCIÓN DE LAS DEFUNCIONES POR GRUPOS DE EDAD Y SEXO. 1900-1993.<br />
PROVINCIA. (Conclusión)<br />
EDADES 1950 1951 1960 1961 1970 1971 1980 1981 1990 1991 1992 1993 (*)<br />
De 70 a 74 años ..................... 699 818 775 749 958 1.037 962 1.011 934 892 896 1.027<br />
Hombres ................................. 333 411 383 365 506 565 534 531 544 504 520 614<br />
Mujeres................................... 366 407 392 384 452 472 428 480 390 388 376 413<br />
De 75 a 79 años ..................... 695 880 795 720 1.099 1.286 1.309 1.285 1.252 1.223 1.157 1.145<br />
Hombres ................................. 326 387 394 340 544 621 631 623 649 631 639 599<br />
Mujeres................................... 369 493 401 380 555 665 678 662 603 592 518 546<br />
De 80 y más años................... 1.331 1.442 1.623 1.508 1.896 2.192 2.501 2.677 3.467 3.493 3.449 3.646<br />
Hombres ................................. 483 563 643 594 792 887 987 1.049 1.372 1.352 1.301 1.428<br />
Mujeres................................... 848 879 980 914 1.104 1.305 1.514 1.628 2.095 2.141 2.148 2.218<br />
Hombres no consta ................ 6 3 34 53 20 168 - - - - - -<br />
Mujeres no consta .................. 2 1 34 49 14 59 - - - - - -<br />
Nota: Hasta 1974 son <strong>de</strong>funciones por lugar <strong>de</strong> inscripción. A partir <strong>de</strong> 1975 son <strong>de</strong>funciones por lugar <strong>de</strong> resi<strong>de</strong>ncia <strong>de</strong>l fallecido.<br />
(*) Datos Provisionales.<br />
Fuente: INE. Movimiento Natural <strong>de</strong> <strong>la</strong> Pob<strong>la</strong>ción.<br />
Consejería <strong>de</strong> Economía y Hacienda. Centro Regional <strong>de</strong> Estadística. Movimiento Natural <strong>de</strong> <strong>la</strong> Pob<strong>la</strong>ción <strong>de</strong> <strong>la</strong> Región <strong>de</strong> Murcia.<br />
3.6. EVOLUCIÓN DE LAS DEFUNCIONES POR MESES. 1975-1993. PROVINCIA.<br />
AÑOS<br />
Meses<br />
TOTAL Enero Feb. Marzo Abril Mayo Junio Julio Agos. Sept. Oct. Nov. Dic.<br />
1975................... 7.599 935 597 664 606 572 550 634 574 535 559 644 729<br />
1976................... 7.443 763 675 735 647 553 562 550 540 466 567 563 732<br />
1977................... 7.412 686 584 724 843 594 547 512 518 547 535 592 730<br />
1978................... 7.771 793 634 646 605 617 601 616 752 498 592 683 734<br />
1979................... 7.488 705 627 672 609 596 516 655 634 514 578 649 733<br />
1980................... 7.561 725 651 676 584 591 599 560 592 496 565 674 848<br />
1981................... 7.662 1.023 760 724 580 571 567 559 552 528 528 602 668<br />
1982................... 7.487 699 598 628 587 609 600 632 555 530 629 605 815<br />
1983................... 7.888 946 829 759 636 604 568 592 580 507 550 608 709<br />
1984................... 7.668 747 655 738 633 625 621 705 544 540 580 624 656<br />
1985................... 7.955 856 694 704 647 593 569 688 625 549 615 634 781<br />
1986................... 7.779 909 759 692 628 600 554 602 671 496 532 641 695<br />
1987................... 7.576 770 644 659 628 598 553 578 577 574 595 673 727<br />
1988................... 7.841 753 642 775 610 557 545 659 649 601 614 624 812<br />
1989................... 8.408 903 744 709 675 682 622 667 722 590 679 641 774<br />
1990................... 8.552 953 793 761 683 651 585 659 726 598 662 657 824<br />
1991................... 8.480 802 797 731 739 639 673 737 627 574 694 679 788<br />
1992................... 8.264 881 752 752 699 643 578 648 672 510 748 650 731<br />
1993 (*).............. 8.279 808 715 792 640 631 626 659 651 552 704 659 842<br />
(*) Datos Provisionales.<br />
Fuente: INE. Movimiento Natural <strong>de</strong> <strong>la</strong> Pob<strong>la</strong>ción.<br />
Consejería <strong>de</strong> Economía y Hacienda. Centro Regional <strong>de</strong> Estadística. Movimiento Natural <strong>de</strong> <strong>la</strong> Pob<strong>la</strong>ción <strong>de</strong> <strong>la</strong> Región <strong>de</strong> Murcia.<br />
124 Estadísticas Históricas <strong>de</strong> Pob<strong>la</strong>ción <strong>de</strong> <strong>la</strong> Región <strong>de</strong> Murcia.
MNP. Datos Regionales. Nacimientos y Defunciones.<br />
3.7. EVOLUCIÓN DEL CRECIMIENTO VEGETATIVO 1861-1993. PROVINCIA Y CAPITAL. (Continúa)<br />
AÑOS PROVINCIA CAPITAL<br />
1861 .............................................................. 6.203 1.527<br />
1862 .............................................................. 6.112 1.227<br />
1863 .............................................................. 7.074 1.270<br />
1864 .............................................................. 5.299 1.172<br />
1865 .............................................................. 4.136 416<br />
1866 .............................................................. 8.353 1.676<br />
1867 .............................................................. 7.279 1.292<br />
1868 .............................................................. 3.790 955<br />
1869 .............................................................. 3.386 615<br />
1870 .............................................................. 3.809 799<br />
1886 .............................................................. 1.100 35<br />
1887 .............................................................. -4.689 -1.415<br />
1888 .............................................................. 792 -213<br />
1889 .............................................................. 1.704 27<br />
1890 .............................................................. 1.485 -540<br />
1891 .............................................................. 2.127 360<br />
1892 .............................................................. 4.959 533<br />
1893 .............................................................. 4.385 ..<br />
1894 .............................................................. 1.663 ..<br />
1895 .............................................................. 5.058 ..<br />
1896 .............................................................. 4.951 ..<br />
1897 .............................................................. 2.766 ..<br />
1898 .............................................................. 2.537 ..<br />
1899 .............................................................. 5.506 ..<br />
1900 .............................................................. 3.119 -561<br />
1901 .............................................................. 4.773 85<br />
1902 .............................................................. 6.383 219<br />
1903 .............................................................. 5.028 255<br />
1904 .............................................................. 5.122 216<br />
1905 .............................................................. 5.092 37<br />
1906 .............................................................. 2.679 37<br />
1907 .............................................................. 3.723 -428<br />
1908 .............................................................. 6.175 173<br />
1909 .............................................................. 5.932 59<br />
1910 .............................................................. 2.519 -490<br />
1911 .............................................................. 2.606 -670<br />
1912 .............................................................. 4.055 136<br />
1913 .............................................................. 3.098 54<br />
1914 .............................................................. 3.399 116<br />
1915 .............................................................. 3.775 -398<br />
1916 .............................................................. 4.106 173<br />
1917 .............................................................. 4.151 297<br />
1918 .............................................................. -3.559 -858<br />
1919 .............................................................. 3.754 141<br />
1920 .............................................................. 2.246 -466<br />
1921 .............................................................. 6.624 913<br />
1922 .............................................................. 7.961 874<br />
1923 .............................................................. 6.584 1.165<br />
1924 .............................................................. 9.280 1.610<br />
1925 .............................................................. 8.644 1.649<br />
1926 .............................................................. 9.762 2.030<br />
1927 .............................................................. 8.300 2.935<br />
1928 .............................................................. 8.953 1.898<br />
1929 .............................................................. 8.807 2.294<br />
1930 .............................................................. 8.795 2.227<br />
1931 .............................................................. 7.296 1.920<br />
1932 .............................................................. 8.191 2.068<br />
1933 .............................................................. 10.043 2.589<br />
1934 .............................................................. 9.947 2.512<br />
1935 .............................................................. 9.144 2.308<br />
1936 .............................................................. 9.398 2.685<br />
Estadísticas Históricas <strong>de</strong> Pob<strong>la</strong>ción <strong>de</strong> <strong>la</strong> Región <strong>de</strong> Murcia. 125
MNP. Datos Regionales. Nacimientos y Defunciones.<br />
3.7. EVOLUCIÓN DEL CRECIMIENTO VEGETATIVO 1861-1993. PROVINCIA Y CAPITAL.<br />
(Conclusión)<br />
AÑOS PROVINCIA CAPITAL<br />
1937.............................................................. 8.993 2.715<br />
1938.............................................................. 7.846 3.010<br />
1939.............................................................. -3.114 129<br />
1940.............................................................. 8.368 3.012<br />
1941.............................................................. 2.934 1.214<br />
1942.............................................................. 5.635 2.140<br />
1943.............................................................. 8.031 2.704<br />
1944.............................................................. 9.087 3.319<br />
1945.............................................................. 12.253 4.036<br />
1946.............................................................. 10.247 3.606<br />
1947.............................................................. 10.306 3.221<br />
1948.............................................................. 12.676 4.179<br />
1949.............................................................. 10.401 3.539<br />
1950.............................................................. 9.910 3.259<br />
1951.............................................................. 9.801 3.231<br />
1952.............................................................. 11.091 3.479<br />
1953.............................................................. 11.508 3.724<br />
1954.............................................................. 10.363 3.297<br />
1955.............................................................. 10.855 3.613<br />
1956.............................................................. 10.382 3.046<br />
1957.............................................................. 12.556 3.340<br />
1958.............................................................. 13.064 3.481<br />
1959.............................................................. 12.782 3.683<br />
1960.............................................................. 12.526 4.083<br />
1961.............................................................. 12.419 4.087<br />
1962.............................................................. 13.356 4.967<br />
1963.............................................................. 14.537 4.859<br />
1964.............................................................. 14.154 4.818<br />
1965.............................................................. 13.808 4.817<br />
1966.............................................................. 13.428 4.775<br />
1967.............................................................. 13.571 5.013<br />
1968.............................................................. 13.197 4.670<br />
1969.............................................................. 12.607 4.891<br />
1970.............................................................. 12.424 5.018<br />
1971.............................................................. 11.696 4.534<br />
1972.............................................................. 12.455 4.702<br />
1973.............................................................. 12.029 4.346<br />
1974.............................................................. 12.746 4.724<br />
1975.............................................................. 10.885 3.556<br />
1976.............................................................. 12.206 4.157<br />
1977.............................................................. 11.691 3.983<br />
1978.............................................................. 11.171 3.735<br />
1979.............................................................. 11.270 3.850<br />
1980.............................................................. 10.643 3.511<br />
1981.............................................................. 9.096 2.861<br />
1982.............................................................. 9.088 2.940<br />
1983.............................................................. 7.456 2.268<br />
1984.............................................................. 7.194 2.253<br />
1985.............................................................. 6.591 2.033<br />
1986.............................................................. 6.179 2.139<br />
1987.............................................................. 6.420 2.048<br />
1988.............................................................. 6.138 2.046<br />
1989.............................................................. 5.584 1.949<br />
1990.............................................................. 5.317 1.895<br />
1991.............................................................. 5.310 1.990<br />
1992.............................................................. 5.506 2.051<br />
1993 (*)......................................................... 4.956 1.728<br />
Nota: Antes <strong>de</strong> 1975 el crecimiento vegetativo es el resultado <strong>de</strong> los nacimientos menos <strong>la</strong>s <strong>de</strong>funciones por lugar <strong>de</strong> inscripción. A partir <strong>de</strong> 1975 es por lugar <strong>de</strong><br />
resi<strong>de</strong>ncia.<br />
(*) Datos Provisionales.<br />
Fuente: Consejería <strong>de</strong> Economía y Hacienda. Centro Regional <strong>de</strong> Estadística.<br />
126 Estadísticas Históricas <strong>de</strong> Pob<strong>la</strong>ción <strong>de</strong> <strong>la</strong> Región <strong>de</strong> Murcia.
MNP. Datos Regionales. Partos.<br />
3.8.1. EVOLUCIÓN DE LOS ALUMBRAMIENTOS POR MULTIPLICIDAD SEGÚN LUGAR DE<br />
INSCRIPCIÓN. 1863-1974. PROVINCIA. (Continúa)<br />
AÑOS TOTAL SENCILLOS DOBLES TRIPLES<br />
1863 ................................ 17.322 17.167 152 3<br />
1864 ................................ 17.760 17.530 228 2<br />
1865 ................................ 18.341 18.224 117 -<br />
1866 ................................ 18.334 18.210 122 2<br />
1867 ................................ 18.148 17.987 159 2<br />
1868 ................................ 15.500 15.376 121 3<br />
1869 ................................ 18.575 18.425 148 2<br />
1870 ................................ 17.068 16.942 124 2<br />
1900 ................................ 19.831 19.497 150 3<br />
1901 ................................ 19.264 19.081 183 -<br />
1902 ................................ 21.154 21.001 152 1<br />
1903 ................................ 20.035 19.899 134 2<br />
1904 ................................ 19.696 19.557 139 -<br />
1905 ................................ 20.456 20.296 160 -<br />
1906 ................................ 18.646 18.513 132 1<br />
1907 ................................ 18.395 18.202 192 1<br />
1908 ................................ 20.046 19.870 171 5<br />
1909 ................................ 19.056 18.884 171 1<br />
1910 ................................ 18.224 18.049 168 7<br />
1911 ................................ 16.494 16.344 149 1<br />
1912 ................................ 17.760 17.590 167 3<br />
1913 ................................ 15.767 15.628 138 1<br />
1914 ................................ 16.343 16.224 118 1<br />
1915 ................................ 17.459 17.326 133 -<br />
1916 ................................ 16.159 16.035 122 2<br />
1917 ................................ 16.922 16.741 180 1<br />
1918 ................................ 17.710 17.541 168 1<br />
1919 ................................ 18.476 18.342 132 2<br />
1920 ................................ 17.265 17.149 114 2<br />
1921 ............................... 19.818 19.664 153 1<br />
1922 ................................ 20.201 20.043 157 1<br />
1923 ................................ 18.913 18.802 110 1<br />
1924 ................................ 20.890 20.706 182 2<br />
1925 ................................ 21.166 21.013 151 2<br />
1926 ................................ 21.871 21.694 175 2<br />
1927 ................................ 20.268 20.065 200 3<br />
1928 ................................ 21.071 20.847 223 1<br />
1929 ................................ 19.720 19.546 172 2<br />
1930 ............................... 20.180 19.964 212 4<br />
1931 ................................ 18.550 18.357 191 2<br />
1932 ................................ 18.854 18.683 169 2<br />
1933 ................................ 20.883 20.636 242 5<br />
1934 ................................ 20.478 20.262 215 1<br />
1935 ................................ 20.031 19.821 207 3<br />
1936 ................................ 20.849 20.673 174 2<br />
1937 ................................ 23.696 23.506 188 2<br />
1938 ................................ 23.024 22.827 195 2<br />
1939 ................................ 13.384 13.247 135 2<br />
1940 ................................ 20.604 20.465 139 -<br />
1941 ................................ 15.955 15.828 126 1<br />
1942 ................................ 16.230 16.129 100 1<br />
1943 ................................ 17.349 17.156 191 2<br />
1944 ................................ 18.686 18.557 126 3<br />
1945 ................................ 20.283 20.101 180 2<br />
1946 ................................ 18.630 18.440 188 2<br />
1947 ................................ 18.337 18.166 170 1<br />
1948 ................................ 20.243 20.038 205 -<br />
1949 ................................ 18.222 18.043 175 4<br />
1950 ................................ 17.808 17.621 184 3<br />
1951 ................................ 18.138 17.995 142 1<br />
Estadísticas Históricas <strong>de</strong> Pob<strong>la</strong>ción <strong>de</strong> <strong>la</strong> Región <strong>de</strong> Murcia.<br />
127
MNP. Datos Regionales. Partos.<br />
3.8.1. EVOLUCIÓN DE LOS ALUMBRAMIENTOS POR MULTIPLICIDAD SEGÚN LUGAR DE<br />
INSCRIPCIÓN. 1863-1974. PROVINCIA. (Conclusión)<br />
128<br />
AÑOS TOTAL SENCILLOS DOBLES TRIPLES<br />
1952................................. 18.308 18.164 142 2<br />
1953................................. 18.269 18.116 152 1<br />
1954................................. 17.214 17.070 140 4<br />
1955 ................................ 17.936 17.770 165 1<br />
1956................................. 17.675 17.508 166 1<br />
1957................................. 20.097 19.908 188 1<br />
1958................................. 19.814 19.646 168 -<br />
1959................................. 19.610 19.380 229 1<br />
1960................................. 19.539 19.386 152 1<br />
1961 ................................ 19.293 19.143 149 1<br />
1962................................. 20.577 20.409 165 3<br />
1963................................. 21.707 21.550 157 -<br />
1964................................. 21.351 21.170 179 2<br />
1965................................. 20.844 20.683 160 1<br />
1966................................. 20.629 20.469 157 3<br />
1967................................. 20.689 20.487 201 1<br />
1968................................. 20.402 20.212 187 3<br />
1969................................. 20.117 19.934 183 -<br />
1970................................. 19.731 19.567 161 3<br />
1971................................. 19.774 19.639 132 3<br />
1972................................. 19.719 19.562 157 -<br />
1973................................. 19.809 19.640 168 1<br />
1974................................. 20.468 20.295 171 2<br />
Fuente: INE. Movimiento Natural <strong>de</strong> <strong>la</strong> Pob<strong>la</strong>ción.<br />
Estadísticas Históricas <strong>de</strong> Pob<strong>la</strong>ción <strong>de</strong> <strong>la</strong> Región <strong>de</strong> Murcia.
MNP. Datos Regionales. Partos.<br />
3.8.2. EVOLUCIÓN DE LOS ALUMBRAMIENTOS POR MULTIPLICIDAD SEGÚN LUGAR DE<br />
INSCRIPCIÓN. 1863-1974. CAPITAL. (Continúa)<br />
AÑOS TOTAL SENCILLOS DOBLES TRIPLES<br />
1863 ................................ 3.620 3.595 25 -<br />
1864 ................................ 3.888 3.882 6 -<br />
1865 ................................ 3.836 3.819 17 -<br />
1866 ................................ 3.848 3.814 32 2<br />
1867 ................................ 3.814 3.773 41 -<br />
1868 ................................ 3.489 3.457 32 -<br />
1869 ................................ 3.956 3.915 41 -<br />
1870 ................................ 3.758 3.718 39 1<br />
1900 ................................ 2.854 2.776 20 -<br />
1901 ................................ 2.850 2.827 23 -<br />
1902 ................................ 3.295 3.275 20 -<br />
1903 ................................ 2.957 2.944 13 -<br />
1904 ................................ 2.946 2.931 15 -<br />
1905 ................................ 3.206 3.186 20 -<br />
1906 ................................ 3.059 3.034 25 -<br />
1907 ................................ 2.557 2.524 33 -<br />
1908 ................................ 2.991 2.960 31 -<br />
1909 ................................ 2.751 2.733 18 -<br />
1910 ................................ 2.450 2.434 15 1<br />
1911 ................................ 2.359 2.335 23 1<br />
1912 ................................ 2.901 2.869 32 -<br />
1913 ................................ 2.727 2.702 25 -<br />
1914 ................................ 3.033 3.025 8 -<br />
1915 ................................ 2.885 2.867 18 -<br />
1916 ................................ 2.697 2.677 20 -<br />
1917 ................................ 2.917 2.875 42 -<br />
1918 ................................ 3.169 3.133 35 1<br />
1919 ................................ 3.264 3.234 30 -<br />
1920 ................................ 3.076 3.056 19 1<br />
1921 ............................... 3.793 3.754 39 -<br />
1922 ................................ 3.865 3.826 39 -<br />
1923 ................................ 3.886 3.860 26 -<br />
1924 ................................ 4.250 4.204 46 -<br />
1925 ................................ 4.745 4.710 35 -<br />
1926 ................................ 4.854 4.803 51 -<br />
1927 ................................ 4.630 4.591 37 2<br />
1928 ................................ 4.814 4.753 61 -<br />
1929 ................................ 4.938 4.898 40 -<br />
1930 ................................ 4.905 4.839 64 2<br />
1931 ................................ 4.621 4.572 49 -<br />
1932 ................................ 4.683 4.661 21 1<br />
1933 ................................ 5.297 5.251 44 2<br />
1934 ................................ 5.097 5.056 41 -<br />
1935 ................................ 5.018 4.973 44 1<br />
1936 ................................ 5.608 5.565 43 -<br />
1937 ................................ 6.929 6.901 28 -<br />
1938 ................................ 7.048 7.014 33 1<br />
1939 ................................ 3.912 3.878 33 1<br />
1940 ................................ 6.163 6.123 40 -<br />
1941 ................................ 4.572 4.537 35 -<br />
1942 ................................ 5.127 5.102 25 -<br />
1943 ................................ 5.272 5.220 52 -<br />
1944 ................................ 5.995 5.965 30 -<br />
1945 ................................ 6.268 6.211 57 -<br />
1946 ................................ 5.817 5.750 66 1<br />
1947 ................................ 5.491 5.421 70 -<br />
1948 ................................ 6.106 6.024 82 -<br />
1949 ................................ 5.624 5.569 53 2<br />
1950 ................................ 5.405 5.345 58 2<br />
1951 ................................ 5.513 5.475 37 1<br />
Estadísticas Históricas <strong>de</strong> Pob<strong>la</strong>ción <strong>de</strong> <strong>la</strong> Región <strong>de</strong> Murcia.<br />
129
MNP. Datos Regionales. Partos.<br />
3.8.2. EVOLUCIÓN DE LOS ALUMBRAMIENTOS POR MULTIPLICIDAD SEGÚN LUGAR DE<br />
INSCRIPCIÓN. 1863-1974. CAPITAL. (Conclusión)<br />
130<br />
AÑOS TOTAL SENCILLOS DOBLES TRIPLES<br />
1952................................. 5.400 5.351 49 -<br />
1953................................. 5.444 5.398 46 -<br />
1954................................. 5.151 5.114 37 -<br />
1955 ................................ 5.497 5.441 56 -<br />
1956................................. 5.075 5.031 44 -<br />
1957................................. 5.463 5.411 51 1<br />
1958................................. 5.380 5.320 60 -<br />
1959................................. 5.596 5.524 72 -<br />
1960................................. 6.012 5.966 46 -<br />
1961 ................................ 6.023 5.965 57 1<br />
1962................................. 7.118 7.060 56 2<br />
1963................................. 7.000 6.961 39 -<br />
1964................................. 6.898 6.849 49 -<br />
1965................................. 6.854 6.801 53 -<br />
1966................................. 6.955 6.898 56 1<br />
1967................................. 7.080 7.006 74 -<br />
1968................................. 6.940 6.876 62 2<br />
1969................................. 7.300 7.247 53 -<br />
1970................................. 7.446 7.384 60 2<br />
1971................................. 7.239 7.198 40 1<br />
1972................................. 7.174 7.118 56 -<br />
1973................................. 7.004 6.946 58 -<br />
1974................................. 7.418 7.360 57 1<br />
Fuente: INE. Movimiento Natural <strong>de</strong> <strong>la</strong> Pob<strong>la</strong>ción.<br />
3.9.1. EVOLUCIÓN DE LOS PARTOS POR MULTIPLICIDAD SEGÚN LUGAR DE RESIDENCIA DE<br />
LA MADRE.1975-1993. PROVINCIA.<br />
AÑOS TOTAL SENCILLOS DOBLES TRIPLES O MÁS<br />
1975................................. 18.480 18.294 185 1<br />
1976................................. 19.666 19.492 172 2<br />
1977................................. 19.138 18.989 148 1<br />
1978................................. 18.966 18.818 148 -<br />
1979................................. 18.777 18.636 139 2<br />
1980................................. 18.151 17.986 163 2<br />
1981................................. 16.735 16.620 114 1<br />
1982................................. 16.463 16.280 173 10<br />
1983................................. 15.300 15.181 117 2<br />
1984................................. 14.876 14.787 86 3<br />
1985................................. 14.537 14.430 102 5<br />
1986................................. 13.926 13.811 114 1<br />
1987................................. 13.942 13.827 110 5<br />
1988................................. 13.976 13.892 83 1<br />
1989................................. 13.900 13.758 137 5<br />
1990................................. 13.826 13.712 108 6<br />
1991................................. 13.718 13.583 128 7<br />
1992................................. 13.688 13.549 135 4<br />
1993 (*)............................ 13.133 12.986 142 5<br />
(*) Datos Provisionales.<br />
Fuente: INE. Movimiento Natural <strong>de</strong> <strong>la</strong> Pob<strong>la</strong>ción.<br />
Consejería <strong>de</strong> Economía y Hacienda. Centro Regional <strong>de</strong> Estadística. Movimiento Natural <strong>de</strong> <strong>la</strong> Pob<strong>la</strong>ción <strong>de</strong> <strong>la</strong> Región <strong>de</strong> Murcia.<br />
Estadísticas Históricas <strong>de</strong> Pob<strong>la</strong>ción <strong>de</strong> <strong>la</strong> Región <strong>de</strong> Murcia.
MNP. Datos Regionales. Partos.<br />
3.9.2. EVOLUCIÓN DE LOS PARTOS POR MULTIPLICIDAD SEGÚN LUGAR DE RESIDENCIA DE<br />
LA MADRE.1975-1993. CAPITAL.<br />
AÑOS TOTAL SENCILLOS DOBLES TRIPLES O MÁS<br />
1975 ................................ 5.946 5.890 55 1<br />
1976 ................................ 6.372 6.316 56 -<br />
1977 ................................ 6.260 6.221 38 1<br />
1978 ................................ 6.097 6.044 53 -<br />
1979 ................................ 6.011 5.966 45 -<br />
1980 ................................ 5.800 5.746 53 1<br />
1981 ................................ 5.199 5.164 35 -<br />
1982 ................................ 5.205 5.129 71 5<br />
1983 ................................ 4.580 4.545 34 1<br />
1984 ................................ 4.600 4.568 30 2<br />
1985 ................................ 4.437 4.402 31 4<br />
1986 ................................ 4.365 4.321 44 -<br />
1987 ................................ 4.243 4.205 37 1<br />
1988 ................................ 4.323 4.286 41 -<br />
1989 ................................ 4.380 4.333 45 2<br />
1990 ................................ 4.397 4.355 40 2<br />
1991 ................................ 4.407 4.356 49 2<br />
1992 ................................ 4.465 4.414 49 2<br />
1993 (*)............................ 4.157 4.113 43 1<br />
(*) Datos Provisionales.<br />
Fuente: INE. Movimiento Natural <strong>de</strong> <strong>la</strong> Pob<strong>la</strong>ción.<br />
Consejería <strong>de</strong> Economía y Hacienda. Centro Regional <strong>de</strong> Estadística. Movimiento Natural <strong>de</strong> <strong>la</strong> Pob<strong>la</strong>ción <strong>de</strong> <strong>la</strong> Región <strong>de</strong> Murcia.<br />
Estadísticas Históricas <strong>de</strong> Pob<strong>la</strong>ción <strong>de</strong> <strong>la</strong> Región <strong>de</strong> Murcia.<br />
131
MNP. Datos Regionales. Abortos y Muertes Fetales Tardías.<br />
3.10.1.1. EVOLUCIÓN DE LOS ABORTOS POR LUGAR DE INSCRIPCIÓN.1861-1870. PROVINCIA.<br />
132<br />
AÑOS TOTAL NACIDOS MUERTOS<br />
MUERTOS ANTES DE SER<br />
BAUTIZADOS<br />
TOTAL Hombres Mujeres TOTAL Hombres Mujeres TOTAL Hombres Mujeres<br />
1861................................. 792 .. .. 528 .. .. 264 .. ..<br />
1862................................. 112 .. .. 87 .. .. 25 .. ..<br />
1863................................. 100 61 39 77 50 27 23 11 12<br />
1864................................. 83 32 51 67 41 26 16 10 6<br />
1865................................. 74 42 32 63 35 28 11 7 4<br />
1866................................. 76 46 30 64 36 28 12 10 2<br />
1867................................. 60 29 31 .. .. .. .. .. ..<br />
1868................................. 46 32 14 .. .. .. .. .. ..<br />
1869................................. 100 48 52 .. .. .. .. .. ..<br />
1870................................. 34 19 15 .. .. .. .. .. ..<br />
Fuente: INE. Movimiento Natural <strong>de</strong> <strong>la</strong> Pob<strong>la</strong>ción.<br />
Estadísticas Históricas <strong>de</strong> Pob<strong>la</strong>ción <strong>de</strong> <strong>la</strong> Región <strong>de</strong> Murcia.
MNP. Datos Regionales. Abortos y Muertes Fetales Tardías.<br />
3.10.1.2. EVOLUCIÓN DE LOS ABORTOS POR LUGAR DE INSCRIPCIÓN. 1900-1974. PROVINCIA.<br />
(Continúa)<br />
AÑOS<br />
TOTAL Hombres<br />
Estadísticas Históricas <strong>de</strong> Pob<strong>la</strong>ción <strong>de</strong> <strong>la</strong> Región <strong>de</strong> Murcia.<br />
TOTAL NACIDOS MUERTOS MUERTOS AL NACER<br />
Muje-<br />
res<br />
TOTAL Hombres <br />
Mujeres<br />
TOTAL Hombres <br />
Mujeres<br />
MUERTOS ANTES DE<br />
24 HORAS<br />
TOTAL HomMujebresres 1900 .......................... 181 97 84 .. .. .. .. .. .. .. .. ..<br />
1901 .......................... 217 134 83 .. .. .. .. .. .. .. .. ..<br />
1902 .......................... 239 148 91 .. .. .. .. .. .. .. .. ..<br />
1903 .......................... 198 127 71 .. .. .. .. .. .. .. .. ..<br />
1904 .......................... 207 125 82 .. .. .. .. .. .. .. .. ..<br />
1905 .......................... 231 138 93 .. .. .. .. .. .. .. .. ..<br />
1906 .......................... 203 126 77 .. .. .. .. .. .. .. .. ..<br />
1907 .......................... 213 126 87 .. .. .. .. .. .. .. .. ..<br />
1908 .......................... 241 144 97 .. .. .. .. .. .. .. .. ..<br />
1909 .......................... 236 130 106 .. .. .. .. .. .. .. .. ..<br />
1910 .......................... 225 126 99 .. .. .. .. .. .. .. .. ..<br />
1911 .......................... 241 139 102 .. .. .. .. .. .. .. .. ..<br />
1912 .......................... 239 164 93 .. .. .. .. .. .. .. .. ..<br />
1913 .......................... 199 162 73 .. .. .. .. .. .. .. .. ..<br />
1914 .......................... 289 166 123 .. .. .. .. .. .. .. .. ..<br />
1915 .......................... 293 165 128 .. .. .. .. .. .. .. .. ..<br />
1916 .......................... 266 161 105 .. .. .. .. .. .. .. .. ..<br />
1917 .......................... 246 145 101 .. .. .. .. .. .. .. .. ..<br />
1918 .......................... 233 127 106 .. .. .. .. .. .. .. .. ..<br />
1919 .......................... 203 102 101 .. .. .. .. .. .. .. .. ..<br />
1920 .......................... 245 147 98 .. .. .. .. .. .. .. .. ..<br />
1921 .......................... 225 127 98 .. .. .. .. .. .. .. .. ..<br />
1922 .......................... 149 85 64 .. .. .. .. .. .. .. .. ..<br />
1923 .......................... 222 142 80 .. .. .. .. .. .. .. .. ..<br />
1924 .......................... 326 202 124 .. .. .. .. .. .. .. .. ..<br />
1925 .......................... 309 188 121 .. .. .. .. .. .. .. .. ..<br />
1926 .......................... 445 272 173 .. .. .. .. .. .. .. .. ..<br />
1927 .......................... 457 226 191 .. .. .. .. .. .. .. .. ..<br />
1928 .......................... 457 283 174 .. .. .. .. .. .. .. .. ..<br />
1929 .......................... 437 254 183 .. .. .. .. .. .. .. .. ..<br />
1930 .......................... 568 345 223 486 .. .. 31 .. .. 51 .. ..<br />
1931 .......................... 531 322 209 453 .. .. 23 .. .. 55 .. ..<br />
1932 .......................... 537 331 206 460 278 182 21 14 7 56 39 17<br />
1933 .......................... 557 351 206 486 313 173 26 13 13 45 25 20<br />
1934 .......................... 525 340 185 461 303 158 18 10 8 46 27 19<br />
1935 .......................... 536 313 223 462 273 189 10 4 6 64 36 28<br />
1936 .......................... 536 308 228 474 273 201 16 7 9 46 28 18<br />
1937 .......................... 619 373 246 555 339 216 31 19 12 33 15 18<br />
1938 .......................... 565 322 243 526 299 227 18 11 7 21 12 9<br />
1939 .......................... 360 224 136 337 204 133 5 5 - 18 15 3<br />
1940 .......................... 496 297 199 456 276 180 24 11 13 16 10 6<br />
1941 .......................... 400 224 176 369 211 158 10 6 4 21 7 14<br />
1942 .......................... 346 216 130 325 202 123 4 3 1 17 11 6<br />
1943 .......................... 410 237 173 383 217 166 14 12 2 13 8 5<br />
1944 .......................... 406 239 167 388 230 158 10 4 6 8 5 3<br />
1945 .......................... 359 219 140 344 211 133 4 1 3 11 7 4<br />
1946 .......................... 236 135 101 229 131 98 2 2 - 5 2 3<br />
1947 .......................... 275 169 106 272 166 106 2 2 - 1 1 -<br />
1948 .......................... 452 267 185 423 248 175 9 5 4 20 14 6<br />
1949 .......................... 380 222 158 352 203 149 14 9 5 14 10 4<br />
1950 .......................... 397 233 164 353 205 148 17 8 9 27 20 7<br />
1951 .......................... 409 244 165 380 228 152 3 2 1 26 14 12<br />
1952 .......................... 410 249 161 373 231 142 12 8 4 25 10 15<br />
1953 .......................... 404 249 155 366 221 145 10 7 3 28 21 7<br />
1954 .......................... 478 280 198 430 258 172 10 7 3 38 15 23<br />
1955 .......................... 558 320 238 501 281 220 14 11 3 43 28 15<br />
1956 .......................... 523 325 198 471 288 183 5 4 1 47 33 14<br />
1957 .......................... 642 388 254 589 351 238 16 11 5 37 26 11<br />
1958 .......................... 570 340 230 508 308 200 18 8 10 44 24 20<br />
1959 .......................... 649 396 253 561 340 221 24 14 10 64 42 22<br />
133
MNP. Datos Regionales. Abortos y Muertes Fetales Tardías.<br />
3.10.1.2. EVOLUCIÓN DE LOS ABORTOS POR LUGAR DE INSCRIPCIÓN. 1900-1974. PROVINCIA.<br />
(Conclusión)<br />
134<br />
AÑOS<br />
TOTAL Hombres<br />
TOTAL NACIDOS MUERTOS MUERTOS AL NACER<br />
Muje-<br />
res<br />
TOTAL Hombres <br />
Mujeres<br />
TOTAL Hombres <br />
Mujeres<br />
MUERTOS ANTES DE<br />
24 HORAS<br />
TOTAL HomMujebresres 1960.......................... 649 406 243 529 334 195 25 19 6 95 53 42<br />
1961.......................... 648 387 261 523 320 203 39 19 20 86 48 38<br />
1962.......................... 611 356 255 469 273 196 39 19 20 103 64 39<br />
1963.......................... 662 371 291 545 307 238 41 23 18 76 41 35<br />
1964.......................... 643 373 270 495 275 220 34 21 13 114 77 37<br />
1965.......................... 560 340 220 397 241 156 48 24 24 115 75 40<br />
1966.......................... 527 325 202 393 240 153 53 33 20 81 52 29<br />
1967.......................... 483 282 201 365 207 158 25 13 12 93 62 31<br />
1968.......................... 436 263 173 338 204 134 25 12 13 73 47 26<br />
1969.......................... 392 226 166 282 162 120 37 22 15 73 42 31<br />
1970.......................... 419 248 171 292 171 121 31 19 12 96 58 38<br />
1971.......................... 353 204 149 267 155 112 14 8 6 72 41 31<br />
1972.......................... 398 240 158 297 175 122 30 17 13 71 48 23<br />
1973.......................... 340 194 146 253 141 112 20 10 10 67 43 24<br />
1974.......................... 344 210 134 260 153 107 22 16 6 62 41 21<br />
Fuente: INE. Movimiento Natural <strong>de</strong> <strong>la</strong> Pob<strong>la</strong>ción.<br />
3.10.2.1. EVOLUCIÓN DE LOS ABORTOS POR LUGAR DE INSCRIPCIÓN. 1861-1870. CAPITAL.<br />
AÑOS<br />
TOTAL NACIDOS MUERTOS<br />
MUERTOS ANTES DE SER<br />
BAUTIZADOS<br />
TOTAL Hombres Mujeres TOTAL Hombres Mujeres TOTAL Hombres Mujeres<br />
1861................................. .. .. .. .. .. .. .. .. ..<br />
1862................................. 15 12 3 .. .. .. .. .. ..<br />
1863................................. 14 12 2 12 9 3 3 3 -<br />
1864................................. 22 15 7 13 11 2 1 1 -<br />
1865................................. 16 13 3 19 12 7 3 3 -<br />
1865................................. 16 10 6 10 8 2 6 5 1<br />
1866................................. 19 15 4 .. .. .. .. .. ..<br />
1867................................. 14 11 3 .. .. .. .. .. ..<br />
1868................................. 8 6 2 .. .. .. .. .. ..<br />
1869................................. .. .. .. .. .. .. .. .. ..<br />
1870................................. .. .. .. .. .. .. .. .. ..<br />
Fuente: INE. Movimiento Natural <strong>de</strong> <strong>la</strong> Pob<strong>la</strong>ción.<br />
Estadísticas Históricas <strong>de</strong> Pob<strong>la</strong>ción <strong>de</strong> <strong>la</strong> Región <strong>de</strong> Murcia.
MNP. Datos Regionales. Abortos y Muertes Fetales Tardías.<br />
3.10.2.2. EVOLUCIÓN DE LOS ABORTOS POR LUGAR DE INSCRIPCIÓN.1900-1974. CAPITAL.<br />
(Continúa)<br />
AÑOS<br />
TOTAL Hombres<br />
Estadísticas Históricas <strong>de</strong> Pob<strong>la</strong>ción <strong>de</strong> <strong>la</strong> Región <strong>de</strong> Murcia.<br />
TOTAL NACIDOS MUERTOS MUERTOS AL NACER<br />
Muje-<br />
res<br />
TOTAL Hombres <br />
Mujeres<br />
TOTAL Hombres <br />
Mujeres<br />
MUERTOS ANTES DE<br />
24 HORAS<br />
TOTAL HomMujebresres 1900 .......................... 7 4 3 .. .. .. .. .. .. .. .. ..<br />
1901 .......................... 15 6 9 .. .. .. .. .. .. .. .. ..<br />
1902 .......................... 9 6 3 .. .. .. .. .. .. .. .. ..<br />
1903 .......................... 5 2 3 .. .. .. .. .. .. .. .. ..<br />
1904 .......................... 1 1 - .. .. .. .. .. .. .. .. ..<br />
1905 .......................... 1 1 - .. .. .. .. .. .. .. .. ..<br />
1906 .......................... 4 4 - .. .. .. .. .. .. .. .. ..<br />
1907 .......................... 4 2 2 .. .. .. .. .. .. .. .. ..<br />
1908 .......................... 9 8 1 .. .. .. .. .. .. .. .. ..<br />
1909 .......................... 6 4 2 .. .. .. .. .. .. .. .. ..<br />
1910 .......................... 4 2 2 .. .. .. .. .. .. .. .. ..<br />
1911 .......................... 3 3 - .. .. .. .. .. .. .. .. ..<br />
1912 .......................... 4 1 3 .. .. .. .. .. .. .. .. ..<br />
1913 .......................... 4 3 1 .. .. .. .. .. .. .. .. ..<br />
1914 .......................... 19 14 5 .. .. .. .. .. .. .. .. ..<br />
1915 .......................... 19 15 4 .. .. .. .. .. .. .. .. ..<br />
1916 .......................... 23 20 3 .. .. .. .. .. .. .. .. ..<br />
1917 .......................... 10 6 4 .. .. .. .. .. .. .. .. ..<br />
1918 .......................... 10 3 7 .. .. .. .. .. .. .. .. ..<br />
1919 .......................... 5 4 1 .. .. .. .. .. .. .. .. ..<br />
1920 .......................... 22 17 5 .. .. .. .. .. .. .. .. ..<br />
1921 .......................... 22 15 7 .. .. .. .. .. .. .. .. ..<br />
1922 .......................... 22 15 7 .. .. .. .. .. .. .. .. ..<br />
1923 .......................... 68 45 23 .. .. .. .. .. .. .. .. ..<br />
1924 .......................... 52 37 15 .. .. .. .. .. .. .. .. ..<br />
1925 .......................... 66 47 19 .. .. .. .. .. .. .. .. ..<br />
1926 .......................... 99 65 34 .. .. .. .. .. .. .. .. ..<br />
1927 .......................... 82 53 29 .. .. .. .. .. .. .. .. ..<br />
1928 .......................... 106 60 46 .. .. .. .. .. .. .. .. ..<br />
1929 .......................... 84 54 30 .. .. .. .. .. .. .. .. ..<br />
1930 .......................... 98 63 35 85 .. .. 6 .. .. 7 .. ..<br />
1931 .......................... 116 74 12 100 .. .. 8 .. .. 8 .. ..<br />
1932 .......................... 115 71 44 99 59 40 4 2 2 12 10 2<br />
1933 .......................... 130 84 46 120 78 42 3 2 1 7 4 3<br />
1934 .......................... 118 76 42 107 68 39 2 1 1 9 7 2<br />
1935 .......................... 116 70 46 103 62 41 - - - 13 8 5<br />
1936 .......................... 153 84 69 139 78 61 4 - 4 10 6 4<br />
1937 .......................... 177 103 74 174 103 71 1 - 1 2 - 2<br />
1938 .......................... 155 84 71 149 81 68 2 - 2 4 3 1<br />
1939 .......................... 97 65 32 95 63 32 1 1 - 1 1 -<br />
1940 .......................... 133 73 60 127 72 55 5 - 5 1 1 -<br />
1941 .......................... 133 83 50 132 82 50 - - - 1 1 -<br />
1942 .......................... 73 52 21 72 51 21 - - - 1 1 -<br />
1943 .......................... 131 84 47 128 82 46 2 2 - 1 - 1<br />
1944 .......................... 94 58 36 92 56 36 - - - 2 2 -<br />
1945 .......................... 114 71 43 110 68 42 - - - 4 3 1<br />
1946 .......................... 102 57 45 102 57 45 - - - - - -<br />
1947 .......................... 104 67 37 104 67 37 - - - - - -<br />
1948 .......................... 98 62 36 98 62 36 - - - - - -<br />
1949 .......................... 106 61 45 106 61 45 - - - - - -<br />
1950 .......................... 107 61 46 96 54 42 2 - 2 9 7 2<br />
1951 .......................... 98 63 35 96 62 34 - - - 2 1 1<br />
1952 .......................... 133 82 51 130 79 51 2 2 - 1 1 -<br />
1953 .......................... 125 74 51 122 71 51 - - - 3 3 -<br />
1954 .......................... 139 84 55 137 79 52 4 3 1 4 2 2<br />
1955 .......................... 164 93 71 156 87 69 3 2 1 5 4 1<br />
1956 .......................... 173 109 64 162 101 61 - - - 11 8 3<br />
1957 .......................... 200 120 80 189 112 77 1 1 - 10 7 3<br />
1958 .......................... 168 95 73 159 90 69 2 1 1 7 4 3<br />
1959 .......................... 223 131 92 210 123 87 1 - 1 12 8 4<br />
135
MNP. Datos Regionales. Abortos y Muertes Fetales Tardías.<br />
3.10.2.2. EVOLUCIÓN DE LOS ABORTOS POR LUGAR DE INSCRIPCIÓN.1900-1974. CAPITAL.<br />
(Conclusión)<br />
136<br />
AÑOS<br />
TOTAL Hombres<br />
TOTAL NACIDOS MUERTOS MUERTOS AL NACER<br />
Muje-<br />
res<br />
TOTAL Hombres <br />
Mujeres<br />
TOTAL Hombres <br />
Mujeres<br />
MUERTOS ANTES DE<br />
24 HORAS<br />
TOTAL HomMujebresres 1960.......................... 199 130 69 165 107 58 7 6 1 27 17 10<br />
1961.......................... 226 135 91 193 116 77 13 3 10 20 16 4<br />
1962.......................... 193 115 78 158 95 63 12 9 3 23 11 12<br />
1963.......................... 225 127 98 208 115 93 9 6 3 8 6 2<br />
1964.......................... 216 118 98 181 98 83 11 7 4 24 13 11<br />
1965.......................... 175 114 61 132 87 45 14 7 7 29 20 9<br />
1966.......................... 180 113 67 143 86 57 14 10 4 23 17 6<br />
1967.......................... 162 96 66 135 77 58 4 1 3 23 18 5<br />
1968.......................... 173 100 73 143 84 59 9 3 6 21 13 8<br />
1969.......................... 149 93 56 109 68 41 15 10 5 25 15 10<br />
1970.......................... 200 117 83 142 82 60 22 14 8 36 21 15<br />
1971.......................... 172 98 74 127 74 53 10 6 4 35 18 17<br />
1972.......................... 189 119 70 138 85 53 21 13 8 30 21 9<br />
1973.......................... 169 95 74 125 72 53 15 8 7 29 15 14<br />
1974.......................... 170 105 65 130 79 51 18 13 5 22 13 9<br />
Fuente: INE. Movimiento Natural <strong>de</strong> <strong>la</strong> Pob<strong>la</strong>ción.<br />
3.11. EVOLUCIÓN DE LAS MUERTES FETALES TARDÍAS POR LUGAR DE INSCRIPCIÓN. 1975-<br />
1993. PROVINCIA Y CAPITAL.<br />
AÑOS PROVINCIA CAPITAL<br />
TOTAL Hombres Mujeres TOTAL Hombres Mujeres<br />
1975................................. 191 99 92 103 52 51<br />
1976................................. 196 103 93 91 52 39<br />
1977................................. 192 95 97 99 42 57<br />
1978................................. 172 100 72 80 46 34<br />
1979................................. 169 79 90 92 42 50<br />
1980................................. 111 69 42 54 35 19<br />
1981................................. 95 48 47 59 29 30<br />
1982................................. 83 43 40 35 13 22<br />
1983................................. 77 50 27 40 27 13<br />
1984................................. 108 60 48 61 33 28<br />
1985................................. 103 57 46 51 25 26<br />
1986................................. 87 45 42 58 32 26<br />
1987................................. 74 48 26 39 26 13<br />
1988................................. 82 48 34 44 25 19<br />
1989................................. 61 31 30 48 24 24<br />
1990................................. 76 42 34 49 27 22<br />
1991................................. 71 44 27 40 23 17<br />
1992................................. 64 29 35 47 25 22<br />
1993 (*)............................ 51 (1) 25 25 29 (1) 15 13<br />
(*) Datos Provisionales.<br />
(1) No consta el sexo <strong>de</strong> una muerte fetal tardía.<br />
Fuente: INE. Movimiento Natural <strong>de</strong> <strong>la</strong> Pob<strong>la</strong>ción.<br />
Consejería <strong>de</strong> Economía y Hacienda. Centro Regional <strong>de</strong> Estadística. Movimiento Natural <strong>de</strong> <strong>la</strong> Pob<strong>la</strong>ción <strong>de</strong> <strong>la</strong> Región <strong>de</strong> Murcia.<br />
Estadísticas Históricas <strong>de</strong> Pob<strong>la</strong>ción <strong>de</strong> <strong>la</strong> Región <strong>de</strong> Murcia.
MNP. Datos Regionales. Abortos y Muertes Fetales Tardías.<br />
3.12. EVOLUCIÓN DE LAS MUERTES FETALES TARDÍAS POR LUGAR DE RESIDENCIA. 1975-<br />
1993. PROVINCIA Y CAPITAL.<br />
AÑOS PROVINCIA CAPITAL<br />
TOTAL Hombres Mujeres TOTAL Hombres Mujeres<br />
1975 ................................ 183 89 94 72 36 36<br />
1976 ................................ 193 102 91 52 26 26<br />
1977 ................................ 188 93 95 58 25 33<br />
1978 ................................ 172 99 73 44 23 21<br />
1979 ................................ 162 77 85 54 24 30<br />
1980 ................................ 114 71 43 37 24 13<br />
1981 ................................ 93 48 45 33 17 16<br />
1982 ................................ 81 42 39 24 7 17<br />
1983 ................................ 77 50 27 25 18 7<br />
1984 ................................ 106 58 48 34 14 20<br />
1985 ................................ 103 55 48 29 14 15<br />
1986 ................................ 84 45 39 35 16 19<br />
1987 ................................ 67 45 22 20 13 7<br />
1988 ................................ 82 47 35 27 17 10<br />
1989 ................................ 58 30 28 24 12 12<br />
1990 ................................ 77 42 35 27 16 11<br />
1991 ................................ 70 43 27 24 14 10<br />
1992 ................................ 63 30 33 26 14 12<br />
1993 (*)............................ 51 (1) 25 25 21 (1) 11 9<br />
(*) Datos Provisionales.<br />
(1) No consta el sexo <strong>de</strong> una muerte fetal tardía.<br />
Fuente: INE. Movimiento Natural <strong>de</strong> <strong>la</strong> Pob<strong>la</strong>ción.<br />
Consejería <strong>de</strong> Economía y Hacienda. Centro Regional <strong>de</strong> Estadística. Movimiento Natural <strong>de</strong> <strong>la</strong> Pob<strong>la</strong>ción <strong>de</strong> <strong>la</strong> Región <strong>de</strong> Murcia.<br />
Estadísticas Históricas <strong>de</strong> Pob<strong>la</strong>ción <strong>de</strong> <strong>la</strong> Región <strong>de</strong> Murcia.<br />
137
MNP. Datos Regionales. Matrimonios.<br />
3.13.1. EVOLUCIÓN DE LOS MATRIMONIOS SEGÚN EL ESTADO CIVIL ANTERIOR DE CADA<br />
CÓNYUGE, POR LUGAR DE CELEBRACIÓN.1858-1974. PROVINCIA. (Continúa)<br />
138<br />
AÑOS TOTAL HOMBRES MUJERES<br />
Solteros Viudos Solteras Viudas<br />
1858................................. 3.188 .. .. .. ..<br />
1859................................. 3.429 .. .. .. ..<br />
1860................................. 3.329 .. .. .. ..<br />
1861................................. 3.261 2.723 538 3.001 260<br />
1862................................. 3.598 3.117 481 3.302 296<br />
1863................................. 3.741 3.211 530 3.512 229<br />
1864................................. 3.498 3.028 470 3.261 237<br />
1865................................. 3.667 3.101 566 3.414 253<br />
1866................................. 3.686 3.099 587 3.400 286<br />
1867................................. 2.930 2.480 450 2.703 227<br />
1868................................. 2.954 2.537 417 2.709 245<br />
1869................................. 3.370 2.878 492 3.134 236<br />
1870................................. 2.365 1.991 374 2.141 224<br />
1886................................. 2.507 .. .. .. ..<br />
1887................................. 2.044 .. .. .. ..<br />
1888................................. 2.266 .. .. .. ..<br />
1889................................. 4.496 .. .. .. ..<br />
1890................................. 5.111 .. .. .. ..<br />
1891................................. 5.813 .. .. .. ..<br />
1892................................. 5.392 .. .. .. ..<br />
1893................................. 4.670 .. .. .. ..<br />
1894................................. 4.326 .. .. .. ..<br />
1895................................. 4.505 .. .. .. ..<br />
1896................................. 3.559 .. .. .. ..<br />
1897................................. 4.869 .. .. .. ..<br />
1898................................. 3.882 .. .. .. ..<br />
1899................................. 4.920 .. .. .. ..<br />
1900................................. 4.831 4.285 546 4.581 250<br />
1901................................. 4.908 4.409 499 4.631 277<br />
1902................................. 4.893 4.391 502 4.634 259<br />
1903................................. 4.457 3.949 508 4.207 250<br />
1904................................. 4.250 3.791 459 4.011 239<br />
1905................................. 4.167 3.663 504 3.901 266<br />
1906................................. 4.013 3.564 449 3.795 218<br />
1907................................. 4.387 3.898 489 4.162 225<br />
1908................................. 4.226 3.755 471 4.010 216<br />
1909................................. 4.067 3.604 463 3.870 197<br />
1910................................. 3.851 3.452 399 3.689 162<br />
1911................................. 4.131 3.703 428 3.943 188<br />
1912................................. 4.495 4.043 452 4.304 191<br />
1913................................. 4.658 4.218 440 4.473 185<br />
1914................................. 4.076 3.661 415 3.920 156<br />
1915................................. 3.872 3.508 364 3.721 151<br />
1916................................. 4.551 4.189 362 4.412 139<br />
1917................................. 4.905 4.497 408 4.755 150<br />
1918................................. 4.782 4.350 432 4.625 157<br />
1919................................. 5.437 4.707 730 5.222 215<br />
1920................................. 6.184 5.384 800 5.927 257<br />
1921................................. 5.527 4.917 610 5.300 227<br />
1922................................. 5.422 4.877 545 5.227 195<br />
1923................................. 5.224 4.727 497 5.023 201<br />
1924................................. 5.615 5.147 468 5.437 178<br />
Estadísticas Históricas <strong>de</strong> Pob<strong>la</strong>ción <strong>de</strong> <strong>la</strong> Región <strong>de</strong> Murcia.
MNP. Datos Regionales. Matrimonios.<br />
3.13.1. EVOLUCIÓN DE LOS MATRIMONIOS SEGÚN EL ESTADO CIVIL ANTERIOR DE CADA<br />
CÓNYUGE, POR LUGAR DE CELEBRACIÓN.1858-1974. PROVINCIA. (Conclusión)<br />
AÑOS TOTAL HOMBRES MUJERES<br />
Estadísticas Históricas <strong>de</strong> Pob<strong>la</strong>ción <strong>de</strong> <strong>la</strong> Región <strong>de</strong> Murcia.<br />
Solteros Viudos Solteras Viudas<br />
1925 ................................ 5.563 5.134 429 5.393 170<br />
1926 ................................ 5.288 4.897 391 5.152 136<br />
1927 ................................ 4.989 4.637 352 4.883 106<br />
1928 ................................ 5.107 4.713 394 4.971 136<br />
1929 ................................ 5.520 5.133 387 5.301 219<br />
1930 ................................ 5.303 4.907 396 5.149 154<br />
1931 ................................ 4.910 4.530 380 4.773 137<br />
1932 ................................ 3.948 3.673 275 3.852 96<br />
1933(1) ............................ 3.465 3.236 223 3.382 81<br />
1934 ................................ 3.781 3.548 233 3.706 75<br />
1935 ................................ 3.537 3.324 213 3.465 72<br />
1936 ................................ 6.274 5.971 303 6.189 85<br />
1937 ................................ 9.538 9.161 377 9.396 142<br />
1938 ................................ 5.396 5.090 306 5.287 109<br />
1939 ................................ 3.433 3.206 227 3.359 74<br />
1940 ................................ 5.399 5.042 357 5.258 141<br />
1941 ................................ 4.915 4.557 358 4.774 141<br />
1942 ................................ 4.754 4.381 373 4.577 177<br />
1943 ................................ 4.535 4.182 353 4.373 162<br />
1944 ................................ 5.218 4.852 366 5.063 155<br />
1945 ................................ 6.150 5.772 378 6.006 144<br />
1946 ................................ 6.218 5.870 348 6.076 142<br />
1947 ................................ 7.242 6.896 346 7.079 163<br />
1948 ................................ 6.590 6.253 337 6.438 152<br />
1949 ................................ 5.850 5.584 266 5.741 109<br />
1950 ................................ 6.565 6.291 274 6.461 104<br />
1951 ................................ 6.418 6.172 246 6.307 111<br />
1952 ................................ 6.826 6.570 256 6.711 115<br />
1953 ................................ 6.466 6.216 250 6.368 98<br />
1954 ................................ 6.848 6.621 227 6.754 94<br />
1955 ................................ 7.179 6.963 216 7.096 83<br />
1956 ................................ 7.958 7.678 280 7.861 97<br />
1957 ................................ 7.638 7.432 206 7.570 68<br />
1958 ................................ 7.601 7.371 230 7.528 73<br />
1959 ................................ 6.941 6.725 216 6.862 79<br />
1960 ................................ 6.588 6.401 187 6.514 74<br />
1961 ................................ 6.722 6.537 185 6.665 57<br />
1962 ................................ 6.871 6.678 193 6.806 65<br />
1963 ................................ 7.145 6.940 205 7.089 56<br />
1964 ................................ 6.830 6.645 185 6.774 56<br />
1965 ................................ 6.826 6.653 173 6.752 74<br />
1966 ................................ 6.578 6.411 167 6.524 54<br />
1967 ................................ 6.481 6.303 178 6.423 58<br />
1968 ................................ 6.219 6.060 159 6.160 59<br />
1969 ................................ 6.382 6.208 174 6.315 67<br />
1970 ................................ 6.606 6.435 171 6.540 66<br />
1971 ................................ 6.498 6.342 156 6.434 64<br />
1972 ................................ 6.703 6.560 143 6.663 40<br />
1973 ................................ 7.019 6.853 166 6.957 62<br />
1974 ................................ 6.851 6.681 170 6.800 51<br />
(1) El total <strong>de</strong> matrimonios <strong>de</strong> 1933 incluye a 6 divorciados y 2 divorciadas.<br />
Fuente: INE. Movimiento Natural <strong>de</strong> <strong>la</strong> Pob<strong>la</strong>ción.<br />
139
MNP. Datos Regionales. Matrimonios.<br />
3.13.2. EVOLUCIÓN DE LOS MATRIMONIOS SEGÚN EL ESTADO CIVIL ANTERIOR DE CADA<br />
CÓNYUGE, POR LUGAR DE CELEBRACIÓN.1861-1974. CAPITAL. (Continúa)<br />
140<br />
AÑOS TOTAL HOMBRES MUJERES<br />
Solteros Viudos Solteras Viudas<br />
1861................................. 768 598 170 694 74<br />
1862................................. 689 569 120 631 58<br />
1863................................. 803 669 134 756 47<br />
1864................................. 795 665 130 730 65<br />
1865................................. 796 647 149 741 55<br />
1866................................. 887 716 171 820 67<br />
1867................................. 741 606 135 678 63<br />
1868................................. 719 608 111 642 77<br />
1869................................. 905 763 142 829 76<br />
1870................................. 532 431 101 467 65<br />
1886................................. 357 .. .. .. ..<br />
1887................................. 204 .. .. .. ..<br />
1888................................. 247 .. .. .. ..<br />
1889................................. 768 .. .. .. ..<br />
1890................................. 836 .. .. .. ..<br />
1891................................. 791 .. .. .. ..<br />
1892................................. 790 .. .. .. ..<br />
1900................................. 586 519 67 553 33<br />
1901................................. 719 645 74 678 41<br />
1902................................. 672 608 64 635 37<br />
1903................................. 557 493 64 534 23<br />
1904................................. 597 534 63 568 29<br />
1905................................. 616 534 82 573 43<br />
1906................................. 552 482 70 516 36<br />
1907................................. 720 636 84 673 47<br />
1908................................. 629 568 61 598 31<br />
1909................................. 545 483 62 520 25<br />
1910................................. 519 474 45 503 16<br />
1911................................. 562 497 65 531 31<br />
1912................................. 814 730 84 781 33<br />
1913................................. 834 744 90 801 33<br />
1914................................. 776 700 76 745 31<br />
1915................................. 622 563 59 598 24<br />
1916................................. 731 678 53 708 23<br />
1917................................. 733 669 64 713 20<br />
1918................................. 855 772 83 820 35<br />
1919................................. 1.243 1.098 145 1.195 48<br />
1920................................. 1.439 1.260 179 1.391 48<br />
1921................................. 1.272 1.142 130 1.234 38<br />
1922................................. 1.314 1.186 128 1.274 40<br />
1923................................. 1.324 1.205 119 1.274 50<br />
1924................................. 1.290 1.169 121 1.239 51<br />
1925................................. 1.170 1.062 108 1.134 36<br />
1926................................. 1.190 1.102 88 1.160 30<br />
1927................................. 1.090 1.015 75 1.068 22<br />
1928................................. 1.113 1.010 103 1.078 35<br />
1929................................. 1.426 1.341 85 1.371 55<br />
1930................................. 1.287 1.183 104 1.244 43<br />
1931................................. 1.262 1.166 96 1.222 40<br />
Estadísticas Históricas <strong>de</strong> Pob<strong>la</strong>ción <strong>de</strong> <strong>la</strong> Región <strong>de</strong> Murcia.
MNP. Datos Regionales. Matrimonios.<br />
3.13.2. EVOLUCIÓN DE LOS MATRIMONIOS SEGÚN EL ESTADO CIVIL ANTERIOR DE CADA<br />
CÓNYUGE, POR LUGAR DE CELEBRACIÓN.1861-1974. CAPITAL. (Conclusión)<br />
AÑOS TOTAL HOMBRES MUJERES<br />
Estadísticas Históricas <strong>de</strong> Pob<strong>la</strong>ción <strong>de</strong> <strong>la</strong> Región <strong>de</strong> Murcia.<br />
Solteros Viudos Solteras Viudas<br />
1932 ................................ 1.037 960 77 1.003 34<br />
1933 ................................ 732 680 52 714 18<br />
1934 ................................ 841 782 59 823 18<br />
1935 ................................ 870 819 51 852 18<br />
1936 ................................ 1.548 1.467 81 1.527 21<br />
1937 ................................ 2.494 2.402 92 2.465 29<br />
1938 ................................ 1.555 1.475 80 1.533 22<br />
1939 ................................ 1.435 1.352 83 1.415 20<br />
1940 ................................ 2.036 1.920 116 2.008 28<br />
1941 ................................ 1.660 1.553 107 1.631 29<br />
1942 ................................ 1.551 1.425 126 1.515 36<br />
1943 ................................ 1.378 1.263 115 1.342 36<br />
1944 ................................ 1.693 1.581 112 1.652 41<br />
1945 ................................ 1.958 1.840 118 1.923 35<br />
1946 ................................ 1.811 1.704 107 1.783 28<br />
1947 ................................ 2.191 2.075 116 2.151 40<br />
1948 ................................ 2.031 1.930 101 1.985 46<br />
1949 ................................ 1.827 1.735 92 1.803 24<br />
1950 ................................ 1.906 1.813 93 1.873 33<br />
1951 ................................ 2.036 1.955 81 2.008 28<br />
1952 ................................ 2.063 1.980 83 2.027 36<br />
1953 ................................ 1.975 1.894 81 1.953 22<br />
1954 ................................ 1.981 1.905 76 1.958 23<br />
1955 ................................ 2.025 1.954 71 2.002 23<br />
1956 ................................ 2.227 2.133 94 2.200 27<br />
1957 ................................ 2.237 2.163 74 2.222 15<br />
1958 ................................ 2.236 2.159 77 2.224 12<br />
1959 ................................ 2.075 2.003 72 2.055 20<br />
1960 ................................ 1.916 1.856 60 1.898 18<br />
1961 ................................ 2.021 1.958 63 2.005 16<br />
1962 ................................ 2.085 2.008 77 2.067 18<br />
1963 ................................ 2.188 2.113 75 2.175 13<br />
1964 ................................ 2.143 2.083 60 2.135 8<br />
1965 ................................ 2.138 2.071 67 2.119 19<br />
1966 ................................ 2.048 1.991 57 2.035 13<br />
1967 ................................ 2.075 1.995 80 2.059 16<br />
1968 ................................ 2.002 1.945 57 1.985 17<br />
1969 ................................ 1.981 1.917 64 1.957 24<br />
1970 ................................ 2.024 1.952 72 2.006 18<br />
1971 ................................ 1.979 1.919 60 1.960 19<br />
1972 ................................ 2.062 2.007 55 2.053 9<br />
1973 ................................ 2.097 2.032 65 2.075 22<br />
1974 ................................ 2.097 2.027 70 2.082 15<br />
Fuente: INE. Movimiento Natural <strong>de</strong> <strong>la</strong> Pob<strong>la</strong>ción.<br />
141
MNP. Datos Regionales. Matrimonios.<br />
3.14. EVOLUCIÓN DE LOS MATRIMONIOS POR LUGAR DE CELEBRACIÓN.1975-1993.<br />
PROVINCIA Y CAPITAL.<br />
142<br />
AÑOS PROVINCIA CAPITAL<br />
1975..................................................................... 6.957 2.165<br />
1976..................................................................... 6.823 2.095<br />
1977..................................................................... 6.920 2.174<br />
1978..................................................................... 6.938 2.065<br />
1979..................................................................... 6.942 2.087<br />
1980..................................................................... 6.713 2.109<br />
1981..................................................................... 5.967 1.951<br />
1982..................................................................... 569 189<br />
1983..................................................................... 938 233<br />
1984..................................................................... 1.240 321<br />
1985..................................................................... 5.877 1.872<br />
1986..................................................................... 6.454 2.069<br />
1987..................................................................... 6.699 2.124<br />
1988..................................................................... 6.848 2.219<br />
1989..................................................................... 6.958 2.239<br />
1990..................................................................... 6.738 2.171<br />
1991..................................................................... 6.504 2.206<br />
1992..................................................................... 6.442 2.072<br />
1993 (*)................................................................ 5.962 1.864<br />
Nota: Los datos <strong>de</strong>l primer quinquenio <strong>de</strong> los 80, sobre todo 1982, 1983 y 1984 son tan bajos <strong>de</strong>bido a que no incluyen todos los matrimonios religiosos, por no<br />
suministrar los párrocos los correspondientes boletines..<br />
(*) Datos Provisionales.<br />
Fuente: INE. Movimiento Natural <strong>de</strong> <strong>la</strong> Pob<strong>la</strong>ción.<br />
Consejería <strong>de</strong> Economía y Hacienda. Centro Regional <strong>de</strong> Estadística. Movimiento Natural <strong>de</strong> <strong>la</strong> Pob<strong>la</strong>ción <strong>de</strong> <strong>la</strong> Región <strong>de</strong> Murcia.<br />
Estadísticas Históricas <strong>de</strong> Pob<strong>la</strong>ción <strong>de</strong> <strong>la</strong> Región <strong>de</strong> Murcia.
MNP. Datos Regionales. Matrimonios.<br />
3.15.1. EVOLUCIÓN DE LOS MATRIMONIOS SEGÚN EL ESTADO CIVIL ANTERIOR DE CADA<br />
CÓNYUGE POR LUGAR DE RESIDENCIA.1975-1992. PROVINCIA.<br />
AÑOS TOTAL HOMBRES MUJERES<br />
Solteros Viudos Divorciados Solteras Viudas Divorciadas<br />
TOTAL.......................... 93.408 84.690 1.440 1.106 85.973 611 552<br />
1975 ............................. 6.467 6.327 140 - 6.418 49 -<br />
1976 ............................. 6.355 6.217 138 - 6.286 69 -<br />
1977 ............................. 6.586 6.455 131 - 6.530 56 -<br />
1978 ............................. 6.595 6.509 86 - 6.548 47 -<br />
1979 ............................. 6.635 6.572 63 - 6.608 27 -<br />
1980 ............................. 6.432 6.343 89 - 6.384 48 -<br />
1981 ............................. 5.795 5.712 79 4 5.756 38 1<br />
1982 ............................. 782 675 48 59 738 28 16<br />
1983 ............................. 1.112 966 87 59 1.052 35 25<br />
1984 ............................. 1.461 1.300 54 107 1.388 22 51<br />
1985 ............................. 5.931 5.728 77 126 5.848 27 56<br />
1986 ............................. 6.435 6.221 87 127 6.335 41 59<br />
1987 ............................. 6.648 6.407 107 134 6.519 44 85<br />
1988 ............................. 6.728 6.493 83 152 6.582 47 99<br />
1989 ............................. 6.840 6.608 88 144 6.702 36 102<br />
1990 ............................. 6.688 6.476 67 145 6.555 27 106<br />
1991 ............................. 6.434 6.157 83 194 6.279 38 117<br />
1992 ............................. 6.372 6.103 73 196 6.212 28 132<br />
Nota: Los datos <strong>de</strong>l primer quinquenio <strong>de</strong> los 80, sobre todo 1982, 1983 y 1984 son tan bajos <strong>de</strong>bido a que no incluyen todos los matrimonios religiosos, por no<br />
suministrar los párrocos los correspondientes boletines..<br />
Fuente: INE. Movimiento Natural <strong>de</strong> <strong>la</strong> Pob<strong>la</strong>ción.<br />
Estadísticas Históricas <strong>de</strong> Pob<strong>la</strong>ción <strong>de</strong> <strong>la</strong> Región <strong>de</strong> Murcia.<br />
143
MNP. Datos Regionales. Matrimonios.<br />
3.15.2. EVOLUCIÓN DE LOS MATRIMONIOS SEGÚN EL ESTADO CIVIL ANTERIOR DE CADA<br />
CÓNYUGE POR LUGAR DE RESIDENCIA.1975-1992. CAPITAL.<br />
144<br />
AÑOS TOTAL HOMBRES MUJERES<br />
Solteros Viudos Divorciados Solteras Viudas Divorciadas<br />
TOTAL .......................... 32.074 26.762 551 516 27.393 200 236<br />
1975.............................. 2.118 2.069 49 - 2.103 15 -<br />
1976.............................. 2.003 1.955 48 - 1.988 15 -<br />
1977.............................. 2.149 2.091 58 - 2.128 21 -<br />
1978.............................. 2.051 2.024 27 - 2.043 8 -<br />
1979.............................. 2.056 2.040 16 - 2.052 4 -<br />
1980.............................. 2.035 1.998 37 - 2.022 13 -<br />
1981.............................. 1.890 1.861 29 - 1.876 14 -<br />
1982.............................. 270 222 29 19 257 9 4<br />
1983.............................. 304 244 41 19 283 16 5<br />
1984.............................. 423 336 30 57 384 11 28<br />
1985.............................. 1.884 1.803 21 60 1.854 8 22<br />
1986.............................. 2.045 1.951 28 66 2.005 18 22<br />
1987.............................. 2.092 1.996 41 55 2.047 16 29<br />
1988.............................. 2.164 2.061 30 73 2.111 12 41<br />
1989.............................. 2.165 2.066 30 69 2.116 10 39<br />
1990.............................. 2.175 2.078 24 73 2.127 8 40<br />
1991.............................. 2.180 2.045 37 98 2.124 10 46<br />
1992.............................. 2.128 2.008 29 91 2.059 8 61<br />
Nota: Los datos <strong>de</strong>l primer quinquenio <strong>de</strong> los 80, sobre todo 1982, 1983 y 1984 son tan bajos <strong>de</strong>bido a que no incluyen todos los matrimonios religiosos, por no<br />
suministrar los párrocos los correspondientes boletines..<br />
Fuente: INE. Movimiento Natural <strong>de</strong> <strong>la</strong> Pob<strong>la</strong>ción.<br />
3.16.1.1. EVOLUCIÓN DE LOS MATRIMONIOS POR SEXO Y EDAD, POR LUGAR DE<br />
CELEBRACIÓN. 1863-1870. PROVINCIA.<br />
EDAD 1863 1864 1865 1866 1867 1868 1869 1870<br />
TOTAL ............................................... 3.741 3.498 3.667 3.686 2.930 2.954 3.370 2.365<br />
Hombres <strong>de</strong> 14 a 25 años ................. 1.647 1.566 1.589 1.569 1.279 1.273 1.426 1.069<br />
Mujeres <strong>de</strong> 14 a 25 años ................... 2.727 2.571 2.615 2.662 2.130 2.142 2.441 1.628<br />
Hombres <strong>de</strong> 25 a 35 años ................. 1.623 1.505 1.612 1.604 1.247 1.312 1.491 982<br />
Mujeres <strong>de</strong> 25 a 35 años ................... 795 691 822 775 612 625 713 534<br />
Hombres <strong>de</strong> 35 a 50 años ................. 365 311 357 393 320 299 344 230<br />
Mujeres <strong>de</strong> 35 a 50 años ................... 189 214 197 216 170 166 178 152<br />
Hombres <strong>de</strong> más <strong>de</strong> 50 años ............ 106 116 109 120 84 70 109 84<br />
Mujeres <strong>de</strong> más <strong>de</strong> 50 años .............. 30 22 33 33 18 21 38 51<br />
Fuente: INE. Movimiento Natural <strong>de</strong> <strong>la</strong> Pob<strong>la</strong>ción.<br />
Estadísticas Históricas <strong>de</strong> Pob<strong>la</strong>ción <strong>de</strong> <strong>la</strong> Región <strong>de</strong> Murcia.
MNP. Datos Regionales. Matrimonios.<br />
3.16.1.2. EVOLUCIÓN DE LOS MATRIMONIOS POR SEXO Y EDAD, POR LUGAR DE<br />
CELEBRACIÓN. 1900-1931. PROVINCIA. (Continúa)<br />
EDADES 1900 1901 1902 1903 1904 1905 1906 1907 1908 1909 1910<br />
TOTAL................................................. 4.831 4.908 4.893 4.457 4.250 4.167 4.013 4.387 4.226 4.067 3.851<br />
Hombres menores <strong>de</strong> 20 años ............ 66 71 76 54 82 81 102 99 95 113 124<br />
Mujeres menores <strong>de</strong> 20 años.............. 1.094 1.078 1.116 1.073 984 916 966 1.032 950 844 786<br />
Hombres <strong>de</strong> 20 a 25 años ................... 2.351 2.399 2.371 2.221 2.051 1.939 1.946 2.100 1.973 1.826 1.637<br />
Mujeres <strong>de</strong> 20 a 25 años..................... 2.686 2.736 2.736 2.432 2.335 2.309 2.161 2.430 2.379 2.376 2.227<br />
Hombres <strong>de</strong> 26 a 30 años ................... 1.616 1.592 1.565 1.369 1.307 1.289 1.180 1.375 1.392 1.333 1.351<br />
Mujeres <strong>de</strong> 26 a 30 años..................... 659 668 619 538 541 528 495 557 506 474 500<br />
Hombres <strong>de</strong> 31 a 35 años ................... 362 393 385 356 405 398 337 347 308 340 324<br />
Mujeres <strong>de</strong> 31 a 35 años..................... 186 187 195 184 187 182 161 163 157 159 167<br />
Hombres <strong>de</strong> 36 a 40 años ................... 180 193 222 180 181 181 191 194 196 193 180<br />
Mujeres <strong>de</strong> 36 a 40 años..................... 100 112 115 102 103 113 114 96 101 91 82<br />
Hombres <strong>de</strong> 41 a 50 años ................... 157 158 184 163 135 175 173 174 160 159 162<br />
Mujeres <strong>de</strong> 41 a 50 años..................... 75 89 84 102 68 81 90 69 92 77 53<br />
Hombres <strong>de</strong> 51 a 60 años ................... 60 69 56 80 54 72 54 61 72 66 46<br />
Mujeres <strong>de</strong> 51 a 60 años..................... 24 23 24 20 19 28 17 29 29 36 19<br />
Hombres <strong>de</strong> más <strong>de</strong> 60 años .............. 37 26 32 34 33 26 28 32 22 34 14<br />
Mujeres <strong>de</strong> más <strong>de</strong> 60 años ................ 6 6 2 6 11 3 7 7 4 7 3<br />
Hombres no consta ............................. 2 7 2 - 2 6 2 5 8 3 13<br />
Mujeres no consta ............................... 1 9 2 - 2 7 2 4 8 3 14<br />
3.16.1.2. EVOLUCIÓN DE LOS MATRIMONIOS POR SEXO Y EDAD, POR LUGAR DE<br />
CELEBRACIÓN. 1900-1931. PROVINCIA. (Continúa)<br />
EDADES 1911 1912 1913 (1) 1914 1915 1916 1917 1918 1919 1920 1921<br />
TOTAL................................................ 4.131 4.495 4.658 4.076 3.872 4.551 4.905 4.782 5.437 6.184 5.527<br />
Hombres menores <strong>de</strong> 20 años ........... 92 119 123 96 95 98 86 70 104 107 89<br />
Mujeres menores <strong>de</strong> 20 años............. 750 762 779 607 540 324 615 634 693 803 721<br />
Hombres <strong>de</strong> 20 a 25 años .................. 1.824 1.856 1.949 1.609 1.480 1.846 1.966 1.838 1.932 2.436 2.228<br />
Mujeres <strong>de</strong> 20 a 25 años.................... 2.517 2.766 2.877 2.511 2.462 3.049 3.118 2.961 3.275 3.794 3.390<br />
Hombres <strong>de</strong> 26 a 30 años .................. 1.467 1.679 1.693 1.562 1.585 1.845 2.016 2.010 2.303 2.410 2.172<br />
Mujeres <strong>de</strong> 26 a 30 años.................... 545 572 590 589 567 667 821 769 1.007 1.028 923<br />
Hombres <strong>de</strong> 31 a 35 años .................. 327 380 406 350 350 390 406 391 496 528 469<br />
Mujeres <strong>de</strong> 31 a 35 años.................... 137 182 174 162 148 151 161 204 230 268 219<br />
Hombres <strong>de</strong> 36 a 40 años .................. 182 174 218 180 149 162 165 187 251 278 212<br />
Mujeres <strong>de</strong> 36 a 40 años.................... 83 98 118 84 62 67 82 87 88 106 112<br />
Hombres <strong>de</strong> 41 a 50 años .................. 161 183 178 171 136 138 167 179 198 243 190<br />
Mujeres <strong>de</strong> 41 a 50 años.................... 77 86 96 90 65 62 79 82 86 90 89<br />
Hombres <strong>de</strong> 51 a 60 años .................. 59 72 60 74 52 46 66 72 92 94 105<br />
Mujeres <strong>de</strong> 51 a 60 años.................... 21 23 16 26 19 23 26 33 26 44 38<br />
Hombres <strong>de</strong> más <strong>de</strong> 60 años ............. 19 31 31 32 25 23 33 31 36 48 37<br />
Mujeres <strong>de</strong> más <strong>de</strong> 60 años ............... 1 6 9 5 9 5 3 8 7 7 12<br />
Hombres no consta ............................ - 1 - 2 - 3 - 4 25 40 25<br />
Mujeres no consta .............................. - - - 2 - 3 - 4 25 44 23<br />
(1) El total <strong>de</strong> matrimonios <strong>de</strong> mujeres en 1913 suma 4.659 en vez <strong>de</strong> 4.658, si bien se respeta <strong>la</strong> fuente original.<br />
Estadísticas Históricas <strong>de</strong> Pob<strong>la</strong>ción <strong>de</strong> <strong>la</strong> Región <strong>de</strong> Murcia.<br />
145
MNP. Datos Regionales. Matrimonios.<br />
3.16.1.2. EVOLUCIÓN DE LOS MATRIMONIOS POR SEXO Y EDAD, POR LUGAR DE<br />
CELEBRACIÓN. 1900-1931. PROVINCIA. (Conclusión)<br />
146<br />
EDADES 1922 1923 1924 1925 1926 1927 1928 1929 1930 1931<br />
TOTAL ................................................. 5.422 5.224 5.615 5.563 5.288 4.989 5.107 5.520 5.303 5.910<br />
Hombres menores <strong>de</strong> 20 años ............ 78 82 81 84 74 83 92 96 94 67<br />
Mujeres menores <strong>de</strong> 20 años .............. 682 717 692 776 732 707 660 721 697 656<br />
Hombres <strong>de</strong> 20 a 25 años ................... 2.097 2.063 2.150 2.276 2.224 2.017 2.012 2.208 2.123 2.153<br />
Mujeres <strong>de</strong> 20 a 25 años ..................... 3.271 3.195 3.414 3.346 3.228 3.069 3.185 3.335 3.214 3.974<br />
Hombres <strong>de</strong> 26 a 30 años ................... 2.246 2.110 2.285 2.150 2.077 2.075 2.181 2.262 2.188 2.852<br />
Mujeres <strong>de</strong> 26 a 30 años ..................... 971 874 934 924 869 811 828 951 910 814<br />
Hombres <strong>de</strong> 31 a 35 años ................... 447 468 504 477 406 373 376 434 428 384<br />
Mujeres <strong>de</strong> 31 a 35 años ..................... 241 202 280 238 221 171 202 208 222 206<br />
Hombres <strong>de</strong> 36 a 40 años ................... 203 207 214 211 187 174 164 202 175 152<br />
Mujeres <strong>de</strong> 36 a 40 años ..................... 101 83 116 87 94 83 84 123 96 122<br />
Hombres <strong>de</strong> 41 a 50 años ................... 199 162 196 187 169 134 150 171 150 169<br />
Mujeres <strong>de</strong> 41 a 50 años ..................... 81 81 87 83 62 54 67 80 80 79<br />
Hombres <strong>de</strong> 51 a 60 años ................... 85 70 102 84 67 54 63 74 72 71<br />
Mujeres <strong>de</strong> 51 a 60 años ..................... 28 32 39 39 16 21 21 36 33 24<br />
Hombres <strong>de</strong> más <strong>de</strong> 60 años .............. 35 34 44 49 45 31 26 32 45 38<br />
Mujeres <strong>de</strong> más <strong>de</strong> 60 años ................ 16 4 12 17 22 7 8 14 17 4<br />
Hombres no consta ............................. 32 28 39 45 39 48 43 41 28 24<br />
Mujeres no consta ............................... 31 36 41 53 44 66 52 52 34 31<br />
Fuente: INE. Movimiento Natural <strong>de</strong> <strong>la</strong> Pob<strong>la</strong>ción.<br />
3.16.1.3. EVOLUCIÓN DE LOS MATRIMONIOS POR SEXO Y EDAD, POR LUGAR DE<br />
CELEBRACIÓN. 1932-1974. PROVINCIA. (Continúa)<br />
EDADES 1932 1933 1934 1935 1936 1937 1938 1939 1940 1941 1942<br />
TOTAL ................................................. 3.948 3.465 3.781 3.537 6.274 9.538 5.396 3.433 5.399 4.915 4.754<br />
Hombres menores <strong>de</strong> 20 años ............ 61 41 30 32 57 201 146 64 91 82 66<br />
Mujeres menores <strong>de</strong> 20 años .............. 594 472 477 468 935 1.900 1.152 460 668 661 484<br />
Hombres <strong>de</strong> 20 a 24 años ................... 1.347 900 848 878 1.747 3.124 1.659 699 1.086 1.178 785<br />
Mujeres <strong>de</strong> 20 a 24 años ..................... 2.120 1.721 1.864 1.773 3.052 4.399 2.101 1.514 2.347 2.139 1.992<br />
Hombres <strong>de</strong> 25 a 29 años ................... 1.774 1.793 2.001 1.786 3.114 4.200 1.847 1.508 2.293 1.924 1.945<br />
Mujeres <strong>de</strong> 25 a 29 años ..................... 784 872 981 863 1.620 2.235 1.252 907 1.520 1.313 1.388<br />
Hombres <strong>de</strong> 30 a 34 años ................... 373 398 531 487 846 1.272 1.011 650 1.177 1.004 1.109<br />
Mujeres <strong>de</strong> 30 a 34 años ..................... 220 195 274 227 376 567 476 274 482 396 436<br />
Hombres <strong>de</strong> 35 a 39 años ................... 116 130 163 130 235 347 377 200 343 281 373<br />
Mujeres <strong>de</strong> 35 a 39 años ..................... 94 85 67 83 151 211 210 122 171 163 185<br />
Hombres <strong>de</strong> 40 a 49 años ................... 143 105 101 109 158 233 215 192 234 238 257<br />
Mujeres <strong>de</strong> 40 a 49 años ..................... 60 62 66 59 78 142 128 92 130 139 138<br />
Hombres <strong>de</strong> 50 a 59 años ................... 50 42 56 54 59 83 85 52 95 92 92<br />
Mujeres <strong>de</strong> 50 a 59 años ..................... 15 16 20 20 17 42 38 24 31 32 34<br />
Hombres <strong>de</strong> 60 y más años................. 31 24 27 31 21 43 36 36 46 57 51<br />
Mujeres <strong>de</strong> 60 y más años................... 5 5 3 10 3 7 7 6 12 9 12<br />
No consta Varones .............................. 53 32 24 30 37 35 20 32 34 59 76<br />
No consta Mujeres............................... 56 37 29 34 42 35 32 34 38 63 85<br />
Estadísticas Históricas <strong>de</strong> Pob<strong>la</strong>ción <strong>de</strong> <strong>la</strong> Región <strong>de</strong> Murcia.
MNP. Datos Regionales. Matrimonios.<br />
3.16.1.3. EVOLUCIÓN DE LOS MATRIMONIOS POR SEXO Y EDAD, POR LUGAR DE<br />
CELEBRACIÓN. 1932-1974. PROVINCIA. (Continúa)<br />
EDADES 1943 1944 1945 1946 1947 1948 1949 1950 1951 1952 1953<br />
TOTAL................................................. 4.535 5.218 6.150 6.218 7.242 6.590 5.850 6.565 6.418 6.826 6.466<br />
Hombres menores <strong>de</strong> 20 años ............ 83 86 74 68 67 87 53 67 158 77 69<br />
Mujeres menores <strong>de</strong> 20 años.............. 482 477 569 507 580 603 536 588 633 696 578<br />
Hombres <strong>de</strong> 20 a 24 años ................... 672 786 1.044 1.254 1.448 1.422 1.245 1.292 1.328 1.372 1.183<br />
Mujeres <strong>de</strong> 20 a 24 años..................... 1.875 2.347 2.784 2.978 3.362 3.131 2.791 2.991 2.947 3.159 2.944<br />
Hombres <strong>de</strong> 25 a 29 años ................... 1.944 2.390 2.800 2.852 3.496 3.109 2.894 3.327 3.113 3.467 3.269<br />
Mujeres <strong>de</strong> 25 a 29 años..................... 1.319 1.493 1.721 1.781 2.214 1.836 1.688 2.049 1.939 2.029 2.012<br />
Hombres <strong>de</strong> 30 a 34 años ................... 1.049 1.081 1.238 1.093 1.202 1.041 867 1.039 1.050 1.111 1.181<br />
Mujeres <strong>de</strong> 30 a 34 años..................... 467 468 597 483 520 496 389 494 452 472 498<br />
Hombres <strong>de</strong> 35 a 39 años ................... 355 436 491 440 496 412 351 360 317 328 342<br />
Mujeres <strong>de</strong> 35 a 39 años..................... 184 190 212 196 254 230 175 198 163 191 182<br />
Hombres <strong>de</strong> 40 a 49 años ................... 261 275 315 327 313 292 238 292 248 271 246<br />
Mujeres <strong>de</strong> 40 a 49 años..................... 125 162 166 154 185 151 144 126 147 132 145<br />
Hombres <strong>de</strong> 50 a 59 años ................... 93 90 103 106 124 102 92 83 84 94 88<br />
Mujeres <strong>de</strong> 50 a 59 años..................... 36 42 45 41 51 47 34 44 36 50 28<br />
Hombres <strong>de</strong> 60 y más años ................ 44 53 42 38 51 57 40 54 47 47 43<br />
Mujeres <strong>de</strong> 60 y más años .................. 10 11 10 17 12 18 13 9 16 10 11<br />
No consta Varones.............................. 34 21 43 40 45 68 70 51 73 59 45<br />
No consta Mujeres .............................. 37 28 46 61 64 78 80 66 85 87 68<br />
3.16.1.3. EVOLUCIÓN DE LOS MATRIMONIOS POR SEXO Y EDAD, POR LUGAR DE<br />
CELEBRACIÓN. 1932-1974. PROVINCIA. (Continúa)<br />
EDADES 1954 1955 1956 1957 1958 1959 1960 1961 1962 1963 1964<br />
TOTAL................................................. 6.848 7.179 7.958 7.638 7.601 6.941 6.588 6.722 6.871 7.145 6.830<br />
Hombres menores <strong>de</strong> 20 años ............ 73 52 73 64 69 74 86 74 96 160 163<br />
Mujeres menores <strong>de</strong> 20 años.............. 688 648 648 675 702 713 624 704 742 905 1.031<br />
Hombres <strong>de</strong> 20 a 24 años ................... 1.353 1.372 1.335 1.434 1.445 1.344 1.190 1.260 1.367 1.325 1.514<br />
Mujeres <strong>de</strong> 20 a 24 años..................... 3.067 3.249 3.441 3.470 3.534 2.999 2.994 3.050 3.029 3.146 3.248<br />
Hombres <strong>de</strong> 25 a 29 años ................... 3.479 3.612 4.144 4.011 4.063 3.591 3.479 3.522 3.508 3.698 3.408<br />
Mujeres <strong>de</strong> 25 a 29 años..................... 2.184 2.251 2.609 2.479 2.351 2.229 2.007 2.004 2.064 1.980 1.676<br />
Hombres <strong>de</strong> 30 a 34 años ................... 1.216 1.344 1.477 1.370 1.258 1.197 1.131 1.164 1.171 1.221 1.106<br />
Mujeres <strong>de</strong> 30 a 34 años..................... 492 555 643 540 554 548 496 488 537 585 463<br />
Hombres <strong>de</strong> 35 a 39 años ................... 331 337 372 331 338 341 316 300 293 329 302<br />
Mujeres <strong>de</strong> 35 a 39 años..................... 169 188 238 195 182 171 195 191 202 195 156<br />
Hombres <strong>de</strong> 40 a 49 años ................... 226 251 292 227 208 200 173 178 223 197 155<br />
Mujeres <strong>de</strong> 40 a 49 años..................... 141 145 163 138 146 150 126 143 152 158 125<br />
Hombres <strong>de</strong> 50 a 59 años ................... 96 98 104 88 104 83 102 112 90 92 82<br />
Mujeres <strong>de</strong> 50 a 59 años..................... 51 45 73 44 51 56 45 50 43 63 50<br />
Hombres <strong>de</strong> 60 y más años ................ 43 53 76 51 62 66 57 50 69 63 58<br />
Mujeres <strong>de</strong> 60 y más años .................. 13 14 24 20 15 17 21 15 26 23 20<br />
No consta Varones.............................. 31 60 85 62 54 45 54 62 54 60 42<br />
No consta Mujeres .............................. 43 84 119 77 66 58 80 77 76 90 61<br />
Estadísticas Históricas <strong>de</strong> Pob<strong>la</strong>ción <strong>de</strong> <strong>la</strong> Región <strong>de</strong> Murcia.<br />
147
MNP. Datos Regionales. Matrimonios.<br />
3.16.1.3. EVOLUCIÓN DE LOS MATRIMONIOS POR SEXO Y EDAD, POR LUGAR DE<br />
CELEBRACIÓN. 1932-1974. PROVINCIA. (Conclusión)<br />
148<br />
EDADES 1965 1966 1967 1968 1969 1970 1971 1972 1973 1974<br />
TOTAL ................................................. 6.826 6.578 6.481 6.219 6.382 6.606 6.498 6.703 7.019 6.851<br />
Hombres menores <strong>de</strong> 20 años ............ 150 208 236 232 252 293 331 356 484 448<br />
Mujeres menores <strong>de</strong> 20 años .............. 1.015 1.029 1.116 1.132 1.190 1.241 1.291 1.352 1.455 1.603<br />
Hombres <strong>de</strong> 20 a 24 años ................... 1.577 1.547 1.719 1.793 1.966 2.046 2.113 2.381 2.461 2.545<br />
Mujeres <strong>de</strong> 20 a 24 años ..................... 3.337 3.351 3.379 3.256 3.412 3.555 3.495 3.641 3.885 3.688<br />
Hombres <strong>de</strong> 25 a 29 años ................... 3.415 3.206 3.044 2.800 2.886 3.074 2.909 2.970 3.059 2.921<br />
Mujeres <strong>de</strong> 25 a 29 años ..................... 1.622 1.403 1.205 1.162 1.139 1.201 1.112 1.211 1.184 1.087<br />
Hombres <strong>de</strong> 30 a 34 años ................... 994 939 817 817 681 645 602 541 533 478<br />
Mujeres <strong>de</strong> 30 a 34 años ..................... 407 345 341 271 247 218 222 204 186 185<br />
Hombres <strong>de</strong> 35 a 39 años ................... 322 298 291 220 237 187 181 189 170 166<br />
Mujeres <strong>de</strong> 35 a 39 años ..................... 164 161 149 127 130 125 108 93 82 77<br />
Hombres <strong>de</strong> 40 a 49 años ................... 189 186 168 181 187 160 159 124 144 129<br />
Mujeres <strong>de</strong> 40 a 49 años ..................... 137 133 143 135 139 122 121 112 105 109<br />
Hombres <strong>de</strong> 50 a 59 años ................... 79 74 79 58 66 70 76 66 54 80<br />
Mujeres <strong>de</strong> 50 a 59 años ..................... 52 50 52 57 49 42 51 39 54 52<br />
Hombres <strong>de</strong> 60 y más años................. 57 46 58 82 66 66 70 54 83 58<br />
Mujeres <strong>de</strong> 60 y más años................... 19 19 20 30 19 33 33 17 36 24<br />
No consta Varones .............................. 43 74 69 36 41 65 57 22 31 26<br />
No consta Mujeres............................... 73 87 76 49 57 69 65 34 32 26<br />
Fuente: INE. Movimiento Natural <strong>de</strong> <strong>la</strong> Pob<strong>la</strong>ción.<br />
3.16.2.1. EVOLUCIÓN DE LOS MATRIMONIOS POR SEXO Y EDAD, POR LUGAR DE<br />
CELEBRACIÓN. 1863-1870. CAPITAL.<br />
EDAD 1863 (1) 1864 1865 1866 1867 1868 1869 1870<br />
TOTAL ............................................... 803 795 796 887 741 719 905 532<br />
Hombres <strong>de</strong> 14 a 25 años ................. 325 318 292 360 312 270 352 202<br />
Mujeres <strong>de</strong> 14 a 25 años ................... 550 556 530 618 518 492 616 337<br />
Hombres <strong>de</strong> 25 a 35 años ................. 373 364 373 378 307 341 418 237<br />
Mujeres <strong>de</strong> 25 a 35 años ................... 202 183 201 192 167 176 228 115<br />
Hombres <strong>de</strong> 35 a 50 años ................. 83 71 99 114 99 87 95 66<br />
Mujeres <strong>de</strong> 35 a 50 años ................... 45 48 60 70 50 46 48 56<br />
Hombres <strong>de</strong> más <strong>de</strong> 50 años ............ 21 42 32 35 23 21 40 27<br />
Mujeres <strong>de</strong> más <strong>de</strong> 50 años .............. 6 8 5 7 6 5 13 24<br />
Nota: Se respetan los intervalos <strong>de</strong> <strong>la</strong> fuente.<br />
(1) El total <strong>de</strong> matrimonios <strong>de</strong> hombres en 1863 suma 802 en vez <strong>de</strong> 803, si bien se respeta <strong>la</strong> fuente original.<br />
Fuente: INE. Movimiento Natural <strong>de</strong> <strong>la</strong> Pob<strong>la</strong>ción.<br />
Estadísticas Históricas <strong>de</strong> Pob<strong>la</strong>ción <strong>de</strong> <strong>la</strong> Región <strong>de</strong> Murcia.
MNP. Datos Regionales. Matrimonios.<br />
3.16.2.2. EVOLUCIÓN DE LOS MATRIMONIOS POR SEXO Y EDAD, POR LUGAR DE<br />
CELEBRACIÓN. 1900-1931. CAPITAL. (Continúa)<br />
EDADES 1900 1901 1902 1903 1904 1905 1906 1907 1908 1909 1910<br />
TOTAL................................................. 586 719 672 557 597 616 552 720 629 545 519<br />
Hombres menores <strong>de</strong> 20 años ............ 15 8 14 8 18 14 23 28 18 23 26<br />
Mujeres menores <strong>de</strong> 20 años.............. 128 149 162 109 115 114 136 154 123 111 110<br />
Hombres <strong>de</strong> 20 a 25 años ................... 308 377 346 291 265 284 261 334 294 273 237<br />
Mujeres <strong>de</strong> 20 a 25 años..................... 330 395 359 326 332 370 272 404 356 321 297<br />
Hombres <strong>de</strong> 26 a 30 años ................... 163 208 192 155 196 194 155 218 202 146 180<br />
Mujeres <strong>de</strong> 26 a 30 años..................... 73 102 88 71 87 72 90 88 85 70 75<br />
Hombres <strong>de</strong> 31 a 35 años ................... 49 50 52 47 56 47 42 49 38 33 35<br />
Mujeres <strong>de</strong> 31 a 35 años..................... 27 28 31 25 37 17 20 32 29 14 17<br />
Hombres <strong>de</strong> 36 a 40 años ................... 17 29 23 26 17 19 20 35 32 27 18<br />
Mujeres <strong>de</strong> 36 a 40 años..................... 13 15 16 13 13 21 15 18 14 15 10<br />
Hombres <strong>de</strong> 41 a 50 años ................... 22 23 25 17 27 32 27 30 23 29 12<br />
Mujeres <strong>de</strong> 41 a 50 años..................... 9 15 8 10 8 14 11 7 12 7 6<br />
Hombres <strong>de</strong> 51 a 60 años ................... 6 9 12 10 11 15 15 16 11 9 7<br />
Mujeres <strong>de</strong> 51 a 60 años..................... 4 4 6 2 2 3 4 11 3 5 1<br />
Hombres <strong>de</strong> más <strong>de</strong> 60 años .............. 6 8 6 3 6 7 8 6 5 3 1<br />
Mujeres <strong>de</strong> más <strong>de</strong> 60 años ................ 2 2 1 2 1 3 3 - - -<br />
Hombres no consta ............................. - 7 2 - 1 4 1 4 6 2 3<br />
Mujeres no consta ............................... - 9 2 - 1 4 1 3 7 2 3<br />
3.16.2.2. EVOLUCIÓN DE LOS MATRIMONIOS POR SEXO Y EDAD, POR LUGAR DE<br />
CELEBRACIÓN. 1900-1931. CAPITAL. (Continúa)<br />
EDADES 1911 1912 1913 1914 1915 1916 1917 1918 1919 1920 1921<br />
TOTAL VARONES............................... 562 814 834 776 622 731 733 855 1.243 1.439 1.272<br />
Hombres menores <strong>de</strong> 20 años ............ 23 33 46 26 25 35 23 30 34 50 45<br />
Mujeres menores <strong>de</strong> 20 años.............. 94 144 164 127 106 90 76 140 194 208 201<br />
Hombres <strong>de</strong> 20 a 25 años ................... 249 346 336 331 265 323 287 306 480 570 527<br />
Mujeres <strong>de</strong> 20 a 25 años..................... 337 501 508 473 385 493 474 503 723 878 780<br />
Hombres <strong>de</strong> 26 a 30 años ................... 182 288 295 280 229 275 300 361 495 545 457<br />
Mujeres <strong>de</strong> 26 a 30 años..................... 73 100 102 105 77 91 136 133 217 223 185<br />
Hombres <strong>de</strong> 31 a 35 años ................... 36 63 71 51 44 39 59 71 101 108 110<br />
Mujeres <strong>de</strong> 31 a 35 años..................... 19 35 22 25 32 27 26 38 56 57 45<br />
Hombres <strong>de</strong> 36 a 40 años ................... 23 36 32 31 23 25 23 35 51 58 52<br />
Mujeres <strong>de</strong> 36 a 40 años..................... 17 17 13 20 7 17 8 16 11 29 25<br />
Hombres <strong>de</strong> 41 a 50 años ................... 34 20 34 31 18 22 27 31 32 50 40<br />
Mujeres <strong>de</strong> 41 a 50 años..................... 17 12 20 16 10 9 9 17 24 17 15<br />
Hombres <strong>de</strong> 51 a 60 años ................... 12 19 17 16 12 4 6 14 27 25 19<br />
Mujeres <strong>de</strong> 51 a 60 años..................... 5 4 3 8 4 2 3 6 3 10 4<br />
Hombres <strong>de</strong> más <strong>de</strong> 60 años .............. 3 9 3 9 6 7 8 5 7 13 7<br />
Mujeres <strong>de</strong> más <strong>de</strong> 60 años ................ - 1 2 1 1 1 1 - - - 1<br />
Hombres no consta ............................. - - - 1 - 1 - 2 16 20 15<br />
Mujeres no consta ............................... - - - 1 - 1 - 2 15 17 16<br />
Estadísticas Históricas <strong>de</strong> Pob<strong>la</strong>ción <strong>de</strong> <strong>la</strong> Región <strong>de</strong> Murcia.<br />
149
MNP. Datos Regionales. Matrimonios.<br />
3.16.2.2. EVOLUCIÓN DE LOS MATRIMONIOS POR SEXO Y EDAD, POR LUGAR DE<br />
CELEBRACIÓN. 1900-1931. CAPITAL. (Conclusión)<br />
150<br />
EDADES 1922 1923 1924 1925 1926 1927 1928 1929 1930 1931<br />
TOTAL ................................................. 1.314 1.324 1.290 1.170 1.190 1.090 1.113 1.426 1.287 1.262<br />
Hombres menores <strong>de</strong> 20 años ............ 27 36 29 25 27 31 29 35 27 27<br />
Mujeres menores <strong>de</strong> 20 años .............. 188 215 193 177 181 182 160 199 184 194<br />
Hombres <strong>de</strong> 20 a 25 años ................... 540 572 520 484 516 469 472 573 516 557<br />
Mujeres <strong>de</strong> 20 a 25 años ..................... 795 797 748 684 711 652 677 861 746 742<br />
Hombres <strong>de</strong> 26 a 30 años ................... 518 482 474 431 432 412 411 574 498 469<br />
Mujeres <strong>de</strong> 26 a 30 años ..................... 223 193 209 186 178 156 149 234 206 209<br />
Hombres <strong>de</strong> 31 a 35 años ................... 105 110 117 86 77 76 75 116 108 94<br />
Mujeres <strong>de</strong> 31 a 35 años ..................... 53 47 63 56 46 39 43 48 65 45<br />
Hombres <strong>de</strong> 36 a 40 años ................... 32 47 47 59 44 31 35 48 44 38<br />
Mujeres <strong>de</strong> 36 a 40 años ..................... 17 18 22 17 20 13 22 31 29 30<br />
Hombres <strong>de</strong> 41 a 50 años ................... 50 32 41 40 41 34 32 41 50 34<br />
Mujeres <strong>de</strong> 41 a 50 años ..................... 19 23 20 16 13 9 12 13 22 15<br />
Hombres <strong>de</strong> 51 a 60 años ................... 16 17 30 15 17 9 19 13 15 24<br />
Mujeres <strong>de</strong> 51 a 60 años ..................... 2 9 11 4 3 2 9 7 11 7<br />
Hombres <strong>de</strong> más <strong>de</strong> 60 años .............. 10 8 9 8 7 2 9 3 12 5<br />
Mujeres <strong>de</strong> más <strong>de</strong> 60 años ................ 3 - 1 2 4 1 4 2 2 -<br />
Hombres no consta ............................. 16 20 23 22 29 26 31 23 17 14<br />
Mujeres no consta ............................... 14 22 23 28 34 36 37 31 22 20<br />
Fuente: INE. Movimiento Natural <strong>de</strong> <strong>la</strong> Pob<strong>la</strong>ción.<br />
3.16.2.3. EVOLUCIÓN DE LOS MATRIMONIOS POR SEXO Y EDAD, POR LUGAR DE<br />
CELEBRACIÓN. 1932-1974. CAPITAL. (Continúa)<br />
EDADES 1932 1933 1934 1935 1936 1937 1938 1939 1940 1941 1942<br />
TOTAL ................................................. 1.037 735 841 870 1.548 2.494 1.555 1.435 2.036 1.660 1.551<br />
Hombres menores <strong>de</strong> 20 años ............ 19 12 9 18 18 52 44 30 35 43 28<br />
Mujeres menores <strong>de</strong> 20 años .............. 158 119 111 111 241 413 299 184 271 247 196<br />
Hombres <strong>de</strong> 20 a 24 años ................... 356 205 201 242 460 755 460 308 476 412 296<br />
Mujeres <strong>de</strong> 20 a 24 años ..................... 564 342 414 442 768 1134 631 665 886 695 662<br />
Hombres <strong>de</strong> 25 a 29 años ................... 455 342 428 403 696 1120 555 616 795 628 614<br />
Mujeres <strong>de</strong> 25 a 29 años ..................... 186 174 210 202 381 681 362 366 562 454 413<br />
Hombres <strong>de</strong> 30 a 34 años ................... 92 87 104 112 226 360 290 256 480 330 337<br />
Mujeres <strong>de</strong> 30 a 34 años ..................... 44 41 52 48 81 150 139 106 194 132 134<br />
Hombres <strong>de</strong> 35 a 39 años ................... 21 27 32 32 53 97 97 94 112 103 119<br />
Mujeres <strong>de</strong> 35 a 39 años ..................... 23 16 9 19 20 51 47 50 57 56 63<br />
Hombres <strong>de</strong> 40 a 49 años ................... 29 31 30 26 44 59 61 85 85 75 93<br />
Mujeres <strong>de</strong> 40 a 49 años ..................... 20 13 15 15 21 40 38 40 35 46 42<br />
Hombres <strong>de</strong> 50 a 59 años ................... 18 5 12 11 18 27 24 17 25 33 29<br />
Mujeres <strong>de</strong> 50 a 59 años ..................... 2 3 6 3 5 4 12 8 14 7 12<br />
Hombres <strong>de</strong> 60 y más años................. 9 5 8 3 4 3 8 15 16 18 17<br />
Mujeres <strong>de</strong> 60 y más años................... - 1 - 2 - 2 2 3 4 - 4<br />
No consta Varones .............................. 38 21 17 23 29 21 16 14 12 18 18<br />
No consta Mujeres............................... 40 26 24 28 31 19 25 13 13 23 25<br />
Estadísticas Históricas <strong>de</strong> Pob<strong>la</strong>ción <strong>de</strong> <strong>la</strong> Región <strong>de</strong> Murcia.
MNP. Datos Regionales. Matrimonios.<br />
3.16.2.3. EVOLUCIÓN DE LOS MATRIMONIOS POR SEXO Y EDAD, POR LUGAR DE<br />
CELEBRACIÓN. 1932-1974. CAPITAL. (Continúa)<br />
EDADES 1943 1944 1945 1946 1947 1948 1949 1950 1951 1952 1953<br />
TOTAL................................................. 1.378 1.693 1.958 1.811 2.191 2.031 1.827 1.906 2.036 2.063 1.975<br />
Hombres menores <strong>de</strong> 20 años ............ 30 37 29 25 25 39 21 16 34 30 31<br />
Mujeres menores <strong>de</strong> 20 años.............. 163 175 191 160 187 202 181 160 225 242 196<br />
Hombres <strong>de</strong> 20 a 24 años ................... 258 303 348 378 471 492 435 404 426 462 414<br />
Mujeres <strong>de</strong> 20 a 24 años..................... 595 784 868 830 1.033 935 869 863 912 928 915<br />
Hombres <strong>de</strong> 25 a 29 años ................... 585 774 834 767 939 863 831 896 943 970 917<br />
Mujeres <strong>de</strong> 25 a 29 años..................... 373 455 522 527 565 546 497 569 594 571 578<br />
Hombres <strong>de</strong> 30 a 34 años ................... 267 313 419 341 369 325 261 307 347 332 391<br />
Mujeres <strong>de</strong> 30 a 34 años..................... 127 134 201 137 185 155 124 144 123 147 156<br />
Hombres <strong>de</strong> 35 a 39 años ................... 92 113 152 126 192 132 111 113 104 99 95<br />
Mujeres <strong>de</strong> 35 a 39 años..................... 48 59 70 59 92 79 53 73 47 57 50<br />
Hombres <strong>de</strong> 40 a 49 años ................... 78 99 97 106 105 100 72 92 78 80 71<br />
Mujeres <strong>de</strong> 40 a 49 años..................... 34 57 51 46 63 48 36 41 52 44 43<br />
Hombres <strong>de</strong> 50 a 59 años ................... 28 21 32 34 43 21 26 20 29 22 19<br />
Mujeres <strong>de</strong> 50 a 59 años..................... 3 7 14 16 18 10 5 10 11 14 3<br />
Hombres <strong>de</strong> 60 y más años ................ 13 16 15 8 11 15 13 20 18 22 10<br />
Mujeres <strong>de</strong> 60 y más años .................. 4 5 5 4 1 4 4 3 9 2 1<br />
No consta Varones.............................. 27 17 32 26 36 44 57 38 57 46 27<br />
No consta Mujeres .............................. 31 17 36 32 47 52 58 43 63 58 33<br />
3.16.2.3. EVOLUCIÓN DE LOS MATRIMONIOS POR SEXO Y EDAD, POR LUGAR DE<br />
CELEBRACIÓN. 1932-1974. CAPITAL. (Continúa)<br />
EDADES 1954 1955 1956 1957 1958 1959 1960 1961 1962 1963 1964<br />
TOTAL................................................. 1.981 2.025 2.227 2.237 2.236 2.075 1.916 2.021 2.085 2.188 2.143<br />
Hombres menores <strong>de</strong> 20 años ............ 33 19 21 39 32 24 29 23 39 53 73<br />
Mujeres menores <strong>de</strong> 20 años.............. 195 189 162 218 232 195 157 210 211 248 292<br />
Hombres <strong>de</strong> 20 a 24 años ................... 422 426 359 447 422 378 345 385 391 388 433<br />
Mujeres <strong>de</strong> 20 a 24 años..................... 841 875 936 987 1013 839 819 866 845 887 940<br />
Hombres <strong>de</strong> 25 a 29 años ................... 914 944 1.142 1.061 1.147 1.038 929 1.003 1.002 1.030 1.038<br />
Mujeres <strong>de</strong> 25 a 29 años..................... 656 644 766 704 684 708 634 641 662 645 595<br />
Hombres <strong>de</strong> 30 a 34 años ................... 374 387 416 430 387 401 389 380 393 442 384<br />
Mujeres <strong>de</strong> 30 a 34 años..................... 152 183 194 163 167 186 164 147 192 209 180<br />
Hombres <strong>de</strong> 35 a 39 años ................... 104 100 115 98 95 106 103 85 104 114 104<br />
Mujeres <strong>de</strong> 35 a 39 años..................... 51 61 58 61 51 58 78 57 71 71 53<br />
Hombres <strong>de</strong> 40 a 49 años ................... 78 86 83 74 67 65 59 60 79 77 49<br />
Mujeres <strong>de</strong> 40 a 49 años..................... 44 28 39 39 35 44 25 50 53 49 39<br />
Hombres <strong>de</strong> 50 a 59 años ................... 25 24 23 28 26 25 32 46 32 28 35<br />
Mujeres <strong>de</strong> 50 a 59 años..................... 12 8 22 10 10 12 13 17 12 23 16<br />
Hombres <strong>de</strong> 60 y más años ................ 8 8 22 14 20 17 14 17 23 25 14<br />
Mujeres <strong>de</strong> 60 y más años .................. 2 2 - 5 3 3 3 4 7 4 4<br />
No consta Varones.............................. 23 31 46 46 40 21 16 22 22 31 13<br />
No consta Mujeres .............................. 28 35 50 50 41 30 23 29 32 52 24<br />
Estadísticas Históricas <strong>de</strong> Pob<strong>la</strong>ción <strong>de</strong> <strong>la</strong> Región <strong>de</strong> Murcia.<br />
151
MNP. Datos Regionales. Matrimonios.<br />
3.16.2.3. EVOLUCIÓN DE LOS MATRIMONIOS POR SEXO Y EDAD, POR LUGAR DE<br />
CELEBRACIÓN. 1932-1974. CAPITAL. (Conclusión)<br />
152<br />
EDADES 1965 1966 1967(1) 1968 1969 1970 1971 1972 1973 1974<br />
TOTAL ................................................ 2.138 2.048 2.075 2.002 1.981 2.024 1.979 2.062 2.097 2.097<br />
Hombres menores <strong>de</strong> 20 años ........... 58 92 89 91 93 95 120 114 132 162<br />
Mujeres menores <strong>de</strong> 20 años ............. 302 330 367 377 371 362 397 419 449 510<br />
Hombres <strong>de</strong> 20 a 24 años .................. 427 448 256 550 575 563 607 695 719 757<br />
Mujeres <strong>de</strong> 20 a 24 años .................... 943 938 1.012 968 1.006 1.046 1.012 1.055 1.080 1.058<br />
Hombres <strong>de</strong> 25 a 29 años .................. 1.075 954 930 888 875 962 848 901 895 841<br />
Mujeres <strong>de</strong> 25 a 29 años .................... 598 510 417 444 377 409 359 397 395 350<br />
Hombres <strong>de</strong> 30 a 34 años .................. 333 312 301 286 240 228 227 196 189 178<br />
Mujeres <strong>de</strong> 30 a 34 años .................... 147 111 129 84 90 92 90 91 64 66<br />
Hombres <strong>de</strong> 35 a 39 años .................. 109 101 99 73 81 66 58 70 59 52<br />
Mujeres <strong>de</strong> 35 a 39 años .................... 52 55 52 43 43 46 25 42 36 36<br />
Hombres <strong>de</strong> 40 a 49 años .................. 75 73 56 55 58 54 45 41 49 46<br />
Mujeres <strong>de</strong> 40 a 49 años .................... 53 64 58 46 55 37 48 31 35 43<br />
Hombres <strong>de</strong> 50 a 59 años .................. 32 26 29 22 23 26 25 19 21 28<br />
Mujeres <strong>de</strong> 50 a 59 años .................... 17 11 18 18 19 16 14 11 19 17<br />
Hombres <strong>de</strong> 60 y más años................ 19 18 26 27 31 24 31 16 27 25<br />
Mujeres <strong>de</strong> 60 y más años.................. 4 4 4 7 9 7 12 2 13 10<br />
No consta Varones ............................. 10 24 16 10 5 6 18 10 6 8<br />
No consta Mujeres.............................. 22 25 18 15 11 9 22 14 6 7<br />
(1) El total <strong>de</strong> matrimonios <strong>de</strong> hombres en 1967 suma 1.802 en vez <strong>de</strong> 2.075, si bien se respeta <strong>la</strong> fuente original.<br />
Fuente: INE. Movimiento Natural <strong>de</strong> <strong>la</strong> Pob<strong>la</strong>ción.<br />
Estadísticas Históricas <strong>de</strong> Pob<strong>la</strong>ción <strong>de</strong> <strong>la</strong> Región <strong>de</strong> Murcia.
MNP. Datos Regionales. Matrimonios.<br />
3.17.1. EVOLUCIÓN DE LOS MATRIMONIOS POR SEXO Y EDAD, POR LUGAR DE RESIDENCIA.<br />
1975-1992. PROVINCIA. (Continúa)<br />
EDADES 1975 1976 1977 1978 1979 1980 1981 1982 1983 1984 1985<br />
TOTAL................................................. 6.467 6.355 6.586 6.595 6.635 6.432 5.795 782 1.112 1.461 5.931<br />
Hombres menores <strong>de</strong> 15 años ............ 1 - - - 1 1 2 - - - -<br />
Mujeres menores <strong>de</strong> 15 años.............. 78 65 96 86 73 80 51 7 7 4 9<br />
Hombres <strong>de</strong> 15 años ........................... 5 1 3 5 8 4 1 - 1 2 1<br />
Mujeres <strong>de</strong> 15 años............................. 125 112 147 136 169 161 108 6 19 26 46<br />
Hombres <strong>de</strong> 16 años ........................... 29 27 22 31 28 38 22 5 4 8 10<br />
Mujeres <strong>de</strong> 16 años............................. 200 228 228 244 245 245 165 29 46 49 136<br />
Hombres <strong>de</strong> 17 años ........................... 62 77 88 98 97 116 70 10 8 13 35<br />
Mujeres <strong>de</strong> 17 años............................. 318 350 330 327 331 289 270 30 53 67 194<br />
Hombres <strong>de</strong> 18 años ........................... 145 152 187 170 200 188 152 19 38 41 113<br />
Mujeres <strong>de</strong> 18 años............................. 373 390 432 432 452 426 349 59 76 121 344<br />
Hombres <strong>de</strong> 19 años ........................... 193 231 284 321 312 296 203 36 52 60 193<br />
Mujeres <strong>de</strong> 19 años............................. 520 516 601 630 578 512 444 56 98 111 441<br />
Hombres <strong>de</strong> 20 años ........................... 267 275 285 317 363 313 226 38 58 61 215<br />
Mujeres <strong>de</strong> 20 años............................. 611 608 661 788 769 708 585 70 80 134 539<br />
Hombres <strong>de</strong> 21 años ........................... 264 262 278 286 314 317 277 44 73 101 319<br />
Mujeres <strong>de</strong> 21 años............................. 733 733 736 738 835 838 739 59 103 110 664<br />
Hombres <strong>de</strong> 22 años ........................... 364 392 448 523 587 673 622 64 98 128 520<br />
Mujeres <strong>de</strong> 22 años............................. 814 733 781 787 756 812 751 70 118 141 658<br />
Hombres <strong>de</strong> 23 años ........................... 719 763 815 806 809 817 752 81 110 130 598<br />
Mujeres <strong>de</strong> 23 años............................. 704 712 730 624 661 688 664 59 95 117 664<br />
Hombres <strong>de</strong> 24 años ........................... 937 851 883 888 854 870 757 69 107 127 719<br />
Mujeres <strong>de</strong> 24 años............................. 587 553 561 543 490 491 509 55 65 124 602<br />
Hombres <strong>de</strong> 25 años ........................... 798 825 835 812 762 733 715 59 110 166 730<br />
Mujeres <strong>de</strong> 25 años............................. 362 402 378 356 338 320 323 50 71 102 470<br />
Hombres <strong>de</strong> 26 años ........................... 707 645 675 609 609 543 520 52 74 132 675<br />
Mujeres <strong>de</strong> 26 años............................. 262 225 190 229 246 208 230 36 54 74 367<br />
Hombres <strong>de</strong> 27 años ........................... 535 485 401 432 464 412 382 49 55 73 475<br />
Mujeres <strong>de</strong> 27 años............................. 165 162 139 146 147 142 124 24 33 47 231<br />
Hombres <strong>de</strong> 28 años ........................... 371 343 345 304 296 261 266 42 48 72 344<br />
Mujeres <strong>de</strong> 28 años............................. 111 117 108 101 100 102 76 24 24 37 121<br />
Hombres <strong>de</strong> 29 años ........................... 243 235 253 232 172 180 193 33 33 49 237<br />
Mujeres <strong>de</strong> 29 años............................. 76 69 79 65 71 67 64 15 12 27 81<br />
Hombres <strong>de</strong> 30 años ........................... 163 153 147 183 159 116 111 12 23 33 146<br />
Mujeres <strong>de</strong> 30 años............................. 56 55 44 53 62 44 48 13 14 16 54<br />
Hombres <strong>de</strong> 31 años ........................... 103 131 118 113 110 94 96 19 23 35 108<br />
Mujeres <strong>de</strong> 31 años............................. 44 51 44 42 46 20 43 9 10 10 47<br />
Hombres <strong>de</strong> 32 años ........................... 74 64 86 80 78 65 54 10 14 20 68<br />
Mujeres <strong>de</strong> 32 años............................. 30 23 41 35 28 37 26 9 13 8 32<br />
Hombres <strong>de</strong> 33 años ........................... 48 61 57 47 61 41 40 11 14 20 54<br />
Mujeres <strong>de</strong> 33 años............................. 24 24 27 21 25 26 19 9 6 14 26<br />
Hombres <strong>de</strong> 34 años ........................... 42 35 50 45 45 44 30 7 6 12 47<br />
Mujeres <strong>de</strong> 34 años............................. 21 16 26 21 15 17 16 4 6 13 23<br />
Hombres <strong>de</strong> 35 años ........................... 39 29 33 26 35 42 28 5 11 17 35<br />
Mujeres <strong>de</strong> 35 años............................. 14 19 13 9 26 17 15 1 8 5 16<br />
Hombres <strong>de</strong> 36 años ........................... 32 34 30 14 32 16 30 8 8 12 22<br />
Mujeres <strong>de</strong> 36 años............................. 17 11 11 8 14 14 10 9 3 8 10<br />
Hombres <strong>de</strong> 37 años ........................... 29 23 30 19 14 15 22 5 7 9 26<br />
Mujeres <strong>de</strong> 37 años............................. 22 11 12 12 5 10 9 5 3 4 13<br />
Hombres <strong>de</strong> 38 años ........................... 32 11 12 15 18 18 12 2 13 14 25<br />
Mujeres <strong>de</strong> 38 años............................. 11 8 19 12 7 8 6 6 1 7 8<br />
Hombres <strong>de</strong> 39 años ........................... 16 17 16 15 9 11 14 9 10 5 12<br />
Mujeres <strong>de</strong> 39 años............................. 13 8 7 12 12 10 4 1 3 2 7<br />
Estadísticas Históricas <strong>de</strong> Pob<strong>la</strong>ción <strong>de</strong> <strong>la</strong> Región <strong>de</strong> Murcia.<br />
153
MNP. Datos Regionales. Matrimonios.<br />
3.17.1. EVOLUCIÓN DE LOS MATRIMONIOS POR SEXO Y EDAD, POR LUGAR DE RESIDENCIA.<br />
1975-1992. PROVINCIA. (Continúa)<br />
154<br />
EDADES 1975 1976 1977 1978 1979 1980 1981 1982 1983 1984 1985<br />
Hombres <strong>de</strong> 40 años ........................... 13 14 17 12 12 10 12 4 4 7 7<br />
Mujeres <strong>de</strong> 40 años ............................. 14 12 12 10 8 8 5 2 5 4 9<br />
Hombres <strong>de</strong> 41 años ........................... 18 16 12 15 10 12 10 3 5 6 17<br />
Mujeres <strong>de</strong> 41 años ............................. 9 9 6 7 10 2 5 - 3 1 4<br />
Hombres <strong>de</strong> 42 años ........................... 11 17 12 10 9 8 10 6 2 - 9<br />
Mujeres <strong>de</strong> 42 años ............................. 8 6 8 6 7 9 4 4 3 3 5<br />
Hombres <strong>de</strong> 43 años ........................... 10 12 12 11 16 12 6 - 4 7 7<br />
Mujeres <strong>de</strong> 43 años ............................. 13 5 10 9 5 8 5 3 2 5 4<br />
Hombres <strong>de</strong> 44 años ........................... 16 14 5 8 7 9 13 3 3 5 5<br />
Mujeres <strong>de</strong> 44 años ............................. 10 7 9 5 5 7 7 3 2 3 8<br />
Hombres <strong>de</strong> 45 años ........................... 13 7 13 9 6 13 11 1 1 4 9<br />
Mujeres <strong>de</strong> 45 años ............................. 10 8 6 5 6 3 3 - 6 3 4<br />
Hombres <strong>de</strong> 46 años ........................... 8 7 12 11 7 6 6 1 1 6 10<br />
Mujeres <strong>de</strong> 46 años ............................. 15 5 8 4 7 5 3 2 1 5 4<br />
Hombres <strong>de</strong> 47 años ........................... 11 10 11 6 6 4 1 4 2 6 9<br />
Mujeres <strong>de</strong> 47 años ............................. 4 8 12 8 5 14 10 3 4 4 3<br />
Hombres <strong>de</strong> 48 años ........................... 8 7 4 12 7 9 4 5 3 3 4<br />
Mujeres <strong>de</strong> 48 años ............................. 12 9 4 7 6 5 6 1 6 1 5<br />
Hombres <strong>de</strong> 49 años ........................... 12 9 9 1 5 8 3 4 9 7 5<br />
Mujeres <strong>de</strong> 49 años ............................. 7 5 6 4 4 2 6 1 1 5 3<br />
Hombres <strong>de</strong> 50 años ........................... 8 8 6 4 6 9 3 1 1 2 4<br />
Mujeres <strong>de</strong> 50 años ............................. 8 5 3 3 4 4 8 2 4 2 3<br />
Hombres <strong>de</strong> 51 años ........................... 8 6 7 7 5 6 6 - 6 6 10<br />
Mujeres <strong>de</strong> 51 años ............................. 8 3 4 6 3 2 5 4 3 2 1<br />
Hombres <strong>de</strong> 52 años ........................... 11 7 6 5 4 4 2 3 4 5 4<br />
Mujeres <strong>de</strong> 52 años ............................. 7 3 7 8 1 7 7 7 2 3 1<br />
Hombres <strong>de</strong> 53 años ........................... 8 5 5 5 7 3 4 1 2 1 6<br />
Mujeres <strong>de</strong> 53 años ............................. 7 3 6 8 4 5 6 2 6 1 5<br />
Hombres <strong>de</strong> 54 años ........................... 3 5 1 7 3 10 5 2 5 2 9<br />
Mujeres <strong>de</strong> 54 años ............................. 3 6 5 2 3 5 6 1 3 3 7<br />
Hombres <strong>de</strong> 55 años ........................... 4 6 5 7 5 2 8 2 1 3 2<br />
Mujeres <strong>de</strong> 55 años ............................. 2 8 6 3 6 4 4 3 - 6 1<br />
Hombres <strong>de</strong> 56 años ........................... 7 4 3 5 9 5 8 3 5 1 5<br />
Mujeres <strong>de</strong> 56 años ............................. 3 2 2 2 8 5 5 1 4 3 3<br />
Hombres <strong>de</strong> 57 años ........................... 6 8 6 7 5 8 5 2 5 1 4<br />
Mujeres <strong>de</strong> 57 años ............................. 1 3 7 4 3 5 3 5 4 - 1<br />
Hombres <strong>de</strong> 58 años ........................... 9 2 2 2 7 8 6 2 5 4 6<br />
Mujeres <strong>de</strong> 58 años ............................. 4 4 3 4 5 4 8 1 5 2 6<br />
Hombres <strong>de</strong> 59 años ........................... 4 4 4 4 7 2 - 3 1 2 8<br />
Mujeres <strong>de</strong> 59 años ............................. 3 3 1 2 3 2 4 3 3 3 2<br />
Hombres <strong>de</strong> 60 y más años................. 61 65 53 56 55 60 75 43 45 43 64<br />
Mujeres <strong>de</strong> 60 y más años................... 28 40 20 31 31 34 37 19 24 24 49<br />
Estadísticas Históricas <strong>de</strong> Pob<strong>la</strong>ción <strong>de</strong> <strong>la</strong> Región <strong>de</strong> Murcia.
MNP. Datos Regionales. Matrimonios.<br />
3.17.1. EVOLUCIÓN DE LOS MATRIMONIOS POR SEXO Y EDAD, POR LUGAR DE RESIDENCIA.<br />
1975-1992. PROVINCIA. (Continúa)<br />
EDADES 1986 1987 1988 1989 1990 1991 1992<br />
TOTAL.................................................. 6.435 6.648 6.728 6.840 6.688 6.434 6.372<br />
Hombres menores <strong>de</strong> 15 años ............. 1 - - - 1 - -<br />
Mujeres menores <strong>de</strong> 15 años............... 10 7 14 9 14 5 6<br />
Hombres <strong>de</strong> 15 años ............................ 2 3 1 2 - 2 1<br />
Mujeres <strong>de</strong> 15 años.............................. 54 36 37 47 29 41 24<br />
Hombres <strong>de</strong> 16 años ............................ 8 13 11 9 11 4 8<br />
Mujeres <strong>de</strong> 16 años.............................. 128 142 135 126 119 88 91<br />
Hombres <strong>de</strong> 17 años ............................ 38 41 45 41 45 36 37<br />
Mujeres <strong>de</strong> 17 años.............................. 231 225 198 221 180 151 155<br />
Hombres <strong>de</strong> 18 años ............................ 106 109 114 93 96 98 102<br />
Mujeres <strong>de</strong> 18 años.............................. 319 335 397 305 269 263 257<br />
Hombres <strong>de</strong> 19 años ............................ 190 176 172 141 135 108 109<br />
Mujeres <strong>de</strong> 19 años.............................. 428 445 390 383 345 305 286<br />
Hombres <strong>de</strong> 20 años ............................ 228 242 245 241 226 182 165<br />
Mujeres <strong>de</strong> 20 años.............................. 559 527 542 517 406 403 335<br />
Hombres <strong>de</strong> 21 años ............................ 329 349 355 341 320 282 268<br />
Mujeres <strong>de</strong> 21 años.............................. 625 656 640 605 538 458 388<br />
Hombres <strong>de</strong> 22 años ............................ 480 517 478 476 378 313 317<br />
Mujeres <strong>de</strong> 22 años.............................. 737 722 768 762 679 529 497<br />
Hombres <strong>de</strong> 23 años ............................ 611 648 639 572 502 453 417<br />
Mujeres <strong>de</strong> 23 años.............................. 765 803 759 760 764 641 675<br />
Hombres <strong>de</strong> 24 años ............................ 715 718 804 751 649 582 535<br />
Mujeres <strong>de</strong> 24 años.............................. 663 706 726 725 752 725 727<br />
Hombres <strong>de</strong> 25 años ............................ 820 730 788 813 759 686 671<br />
Mujeres <strong>de</strong> 25 años.............................. 536 546 609 656 647 673 680<br />
Hombres <strong>de</strong> 26 años ............................ 772 749 707 806 781 771 707<br />
Mujeres <strong>de</strong> 26 años.............................. 395 410 380 453 545 616 550<br />
Hombres <strong>de</strong> 27 años ............................ 595 620 569 601 685 697 697<br />
Mujeres <strong>de</strong> 27 años.............................. 254 315 276 322 381 425 434<br />
Hombres <strong>de</strong> 28 años ............................ 397 468 464 481 505 556 525<br />
Mujeres <strong>de</strong> 28 años.............................. 180 161 229 233 249 301 343<br />
Hombres <strong>de</strong> 29 años ............................ 269 313 342 386 402 418 438<br />
Mujeres <strong>de</strong> 29 años.............................. 114 144 151 162 190 199 222<br />
Hombres <strong>de</strong> 30 años ............................ 154 207 239 236 288 265 332<br />
Mujeres <strong>de</strong> 30 años.............................. 82 78 90 105 129 145 163<br />
Hombres <strong>de</strong> 31 años ............................ 131 144 157 182 201 215 226<br />
Mujeres <strong>de</strong> 31 años.............................. 41 49 68 90 88 87 102<br />
Hombres <strong>de</strong> 32 años ............................ 89 96 88 129 135 129 151<br />
Mujeres <strong>de</strong> 32 años.............................. 39 41 49 59 68 60 88<br />
Hombres <strong>de</strong> 33 años ............................ 67 74 83 99 102 103 114<br />
Mujeres <strong>de</strong> 33 años.............................. 19 26 40 49 43 49 57<br />
Hombres <strong>de</strong> 34 años ............................ 46 49 55 55 71 89 84<br />
Mujeres <strong>de</strong> 34 años.............................. 29 30 34 37 33 34 39<br />
Hombres <strong>de</strong> 35 años ............................ 53 48 57 49 46 53 78<br />
Mujeres <strong>de</strong> 35 años.............................. 23 30 15 18 24 24 36<br />
Hombres <strong>de</strong> 36 años ............................ 31 39 38 46 36 37 59<br />
Mujeres <strong>de</strong> 36 años.............................. 14 22 19 18 21 25 38<br />
Hombres <strong>de</strong> 37 años ............................ 18 18 24 32 42 44 43<br />
Mujeres <strong>de</strong> 37 años.............................. 18 18 13 16 20 21 17<br />
Hombres <strong>de</strong> 38 años ............................ 30 27 28 23 25 40 28<br />
Mujeres <strong>de</strong> 38 años.............................. 11 11 9 13 8 21 13<br />
Hombres <strong>de</strong> 39 años ............................ 15 20 17 22 22 23 23<br />
Mujeres <strong>de</strong> 39 años.............................. 15 18 14 15 10 11 15<br />
Estadísticas Históricas <strong>de</strong> Pob<strong>la</strong>ción <strong>de</strong> <strong>la</strong> Región <strong>de</strong> Murcia.<br />
155
MNP. Datos Regionales. Matrimonios.<br />
3.17.1. EVOLUCIÓN DE LOS MATRIMONIOS POR SEXO Y EDAD, POR LUGAR DE RESIDENCIA.<br />
1975-1992. PROVINCIA. (Conclusión)<br />
156<br />
EDADES 1986 1987 1988 1989 1990 1991 1992<br />
Hombres <strong>de</strong> 40 años ............................ 19 13 23 18 23 24 16<br />
Mujeres <strong>de</strong> 40 años .............................. 11 8 18 13 13 8 17<br />
Hombres <strong>de</strong> 41 años ............................ 21 13 11 11 19 19 20<br />
Mujeres <strong>de</strong> 41 años .............................. 11 6 3 7 9 9 14<br />
Hombres <strong>de</strong> 42 años ............................ 9 13 11 17 11 15 22<br />
Mujeres <strong>de</strong> 42 años .............................. 3 8 7 9 3 8 12<br />
Hombres <strong>de</strong> 43 años ............................ 7 12 8 10 14 13 9<br />
Mujeres <strong>de</strong> 43 años .............................. 7 11 9 7 11 8 3<br />
Hombres <strong>de</strong> 44 años ............................ 9 8 9 11 5 8 13<br />
Mujeres <strong>de</strong> 44 años .............................. 6 3 4 8 7 11 6<br />
Hombres <strong>de</strong> 45 años ............................ 12 9 11 5 13 15 16<br />
Mujeres <strong>de</strong> 45 años .............................. 7 10 9 6 9 7 4<br />
Hombres <strong>de</strong> 46 años ............................ 5 4 7 7 10 13 11<br />
Mujeres <strong>de</strong> 46 años .............................. 4 5 6 1 5 11 2<br />
Hombres <strong>de</strong> 47 años ............................ 2 7 1 10 5 10 12<br />
Mujeres <strong>de</strong> 47 años .............................. 5 3 4 5 8 9 9<br />
Hombres <strong>de</strong> 48 años ............................ 10 8 7 7 6 6 4<br />
Mujeres <strong>de</strong> 48 años .............................. 6 5 5 2 7 2 9<br />
Hombres <strong>de</strong> 49 años ............................ 9 6 8 6 1 6 10<br />
Mujeres <strong>de</strong> 49 años .............................. 7 11 10 6 1 4 4<br />
Hombres <strong>de</strong> 50 años ............................ 6 8 6 4 8 8 6<br />
Mujeres <strong>de</strong> 50 años .............................. 4 4 1 7 5 4 4<br />
Hombres <strong>de</strong> 51 años ............................ 14 8 9 2 7 5 6<br />
Mujeres <strong>de</strong> 51 años .............................. 4 2 4 4 2 6 4<br />
Hombres <strong>de</strong> 52 años ............................ 13 5 8 2 8 4 4<br />
Mujeres <strong>de</strong> 52 años .............................. 5 2 3 7 3 4 4<br />
Hombres <strong>de</strong> 53 años ............................ 6 8 8 8 2 4 3<br />
Mujeres <strong>de</strong> 53 años .............................. 4 5 3 1 4 2 1<br />
Hombres <strong>de</strong> 54 años ............................ 5 7 4 5 2 10 4<br />
Mujeres <strong>de</strong> 54 años .............................. 6 3 2 1 3 1 4<br />
Hombres <strong>de</strong> 55 años ............................ 7 5 2 7 6 6 6<br />
Mujeres <strong>de</strong> 55 años .............................. 4 2 1 9 4 4 5<br />
Hombres <strong>de</strong> 56 años ............................ 5 5 5 6 4 8 9<br />
Mujeres <strong>de</strong> 56 años .............................. 1 7 2 2 1 2 2<br />
Hombres <strong>de</strong> 57 años ............................ 4 5 2 5 11 7 4<br />
Mujeres <strong>de</strong> 57 años .............................. 3 2 2 4 1 6 3<br />
Hombres <strong>de</strong> 58 años ............................ 6 5 7 4 8 8 4<br />
Mujeres <strong>de</strong> 58 años .............................. 6 4 1 2 4 1 2<br />
Hombres <strong>de</strong> 59 años ............................ 3 5 3 4 6 3 6<br />
Mujeres <strong>de</strong> 59 años .............................. 3 6 5 2 5 2 1<br />
Hombres <strong>de</strong> 60 y más años.................. 68 76 58 64 56 56 52<br />
Mujeres <strong>de</strong> 60 y más años.................... 39 38 27 31 32 25 24<br />
Fuente: INE. Movimiento Natural <strong>de</strong> <strong>la</strong> Pob<strong>la</strong>ción.<br />
Estadísticas Históricas <strong>de</strong> Pob<strong>la</strong>ción <strong>de</strong> <strong>la</strong> Región <strong>de</strong> Murcia.
MNP. Datos Regionales. Matrimonios.<br />
3.17.2. EVOLUCIÓN DE LOS MATRIMONIOS POR SEXO Y EDAD, POR LUGAR DE RESIDENCIA.<br />
1975-1992. CAPITAL. (Continúa)<br />
EDADES 1975 1976 1977 1978 1979 1980 1981 1982 1983 1984 1985<br />
TOTAL HOMBRES .............................. 2.118 2.003 2.149 2.051 2.056 2.035 1.890 270 304 423 1.884<br />
Hombres menores <strong>de</strong> 15 años ............ 1 - - - 1 - 1 - - - -<br />
Mujeres menores <strong>de</strong> 15 años.............. 25 16 32 25 27 27 19 1 1 - 1<br />
Hombres <strong>de</strong> 15 años ........................... 1 1 - 1 2 2 1 - - 1 -<br />
Mujeres <strong>de</strong> 15 años............................. 43 39 52 35 52 42 34 1 - 3 11<br />
Hombres <strong>de</strong> 16 años ........................... 12 3 12 11 5 18 10 2 1 2 -<br />
Mujeres <strong>de</strong> 16 años............................. 73 81 78 78 75 79 56 6 7 13 43<br />
Hombres <strong>de</strong> 17 años ........................... 20 26 33 32 39 39 28 1 - 2 9<br />
Mujeres <strong>de</strong> 17 años............................. 87 127 101 99 96 83 91 1 5 11 52<br />
Hombres <strong>de</strong> 18 años ........................... 53 50 62 56 83 59 52 3 8 9 42<br />
Mujeres <strong>de</strong> 18 años............................. 110 121 131 117 138 122 116 14 19 26 108<br />
Hombres <strong>de</strong> 19 años ........................... 59 84 95 114 91 97 70 6 6 11 53<br />
Mujeres <strong>de</strong> 19 años............................. 174 137 167 178 173 157 127 13 19 13 125<br />
Hombres <strong>de</strong> 20 años ........................... 116 97 108 102 125 99 94 6 11 16 66<br />
Mujeres <strong>de</strong> 20 años............................. 193 194 232 236 216 198 175 22 12 40 178<br />
Hombres <strong>de</strong> 21 años ........................... 89 76 89 87 96 87 94 9 12 30 109<br />
Mujeres <strong>de</strong> 21 años............................. 234 197 231 231 261 241 227 16 19 30 185<br />
Hombres <strong>de</strong> 22 años ........................... 108 120 144 160 172 212 196 19 24 23 154<br />
Mujeres <strong>de</strong> 22 años............................. 272 212 245 230 220 236 227 20 28 32 186<br />
Hombres <strong>de</strong> 23 años ........................... 234 254 262 232 246 232 215 16 22 19 183<br />
Mujeres <strong>de</strong> 23 años............................. 223 232 243 189 213 225 207 23 33 33 230<br />
Hombres <strong>de</strong> 24 años ........................... 273 240 264 242 252 252 225 24 28 36 236<br />
Mujeres <strong>de</strong> 24 años............................. 198 182 192 173 166 167 172 27 23 37 201<br />
Hombres <strong>de</strong> 25 años ........................... 255 254 268 254 244 237 222 28 26 41 223<br />
Mujeres <strong>de</strong> 25 años............................. 120 152 129 125 128 127 118 24 26 29 165<br />
Hombres <strong>de</strong> 26 años ........................... 221 194 206 185 196 187 165 25 18 33 208<br />
Mujeres <strong>de</strong> 26 años............................. 101 73 67 94 88 86 91 17 24 30 127<br />
Hombres <strong>de</strong> 27 años ........................... 169 154 137 146 142 137 122 24 20 20 154<br />
Mujeres <strong>de</strong> 27 años............................. 63 54 47 60 43 48 44 17 15 18 80<br />
Hombres <strong>de</strong> 28 años ........................... 136 117 113 107 88 80 95 18 17 23 106<br />
Mujeres <strong>de</strong> 28 años............................. 43 32 31 38 25 44 30 14 11 19 40<br />
Hombres <strong>de</strong> 29 años ........................... 86 79 88 69 61 63 77 12 17 21 71<br />
Mujeres <strong>de</strong> 29 años............................. 24 27 28 23 25 31 25 6 4 14 27<br />
Hombres <strong>de</strong> 30 años ........................... 61 54 45 67 44 33 36 3 7 15 48<br />
Mujeres <strong>de</strong> 30 años............................. 11 20 8 22 20 15 14 6 5 5 18<br />
Hombres <strong>de</strong> 31 años ........................... 29 48 36 36 37 29 36 9 12 12 38<br />
Mujeres <strong>de</strong> 31 años............................. 9 13 23 11 12 7 18 5 4 4 18<br />
Hombres <strong>de</strong> 32 años ........................... 29 12 34 27 18 27 19 5 7 7 23<br />
Mujeres <strong>de</strong> 32 años............................. 9 8 14 13 6 11 17 2 7 5 12<br />
Hombres <strong>de</strong> 33 años ........................... 21 21 20 18 17 9 14 4 4 9 23<br />
Mujeres <strong>de</strong> 33 años............................. 13 8 8 8 12 12 4 6 5 5 10<br />
Hombres <strong>de</strong> 34 años ........................... 17 8 20 13 17 20 10 6 2 8 12<br />
Mujeres <strong>de</strong> 34 años............................. 6 8 8 5 5 6 4 1 1 6 6<br />
Hombres <strong>de</strong> 35 años ........................... 11 6 4 6 10 15 9 1 6 8 16<br />
Mujeres <strong>de</strong> 35 años............................. 4 7 4 5 6 6 5 1 4 4 8<br />
Hombres <strong>de</strong> 36 años ........................... 11 10 11 4 8 6 11 6 3 5 10<br />
Mujeres <strong>de</strong> 36 años............................. 5 3 2 3 3 6 4 4 - 3 3<br />
Hombres <strong>de</strong> 37 años ........................... 13 7 7 6 5 4 2 - 3 5 11<br />
Mujeres <strong>de</strong> 37 años............................. 10 2 6 2 3 3 5 1 1 2 6<br />
Hombres <strong>de</strong> 38 años ........................... 6 4 4 6 4 6 5 1 8 6 12<br />
Mujeres <strong>de</strong> 38 años............................. 5 2 6 3 2 3 1 2 - 4 1<br />
Hombres <strong>de</strong> 39 años ........................... 6 6 6 8 4 4 7 7 4 4 4<br />
Mujeres <strong>de</strong> 39 años............................. 5 2 3 4 4 4 - - 1 1 2<br />
Estadísticas Históricas <strong>de</strong> Pob<strong>la</strong>ción <strong>de</strong> <strong>la</strong> Región <strong>de</strong> Murcia.<br />
157
MNP. Datos Regionales. Matrimonios.<br />
3.17.2. EVOLUCIÓN DE LOS MATRIMONIOS POR SEXO Y EDAD, POR LUGAR DE RESIDENCIA.<br />
1975-1992. CAPITAL. (Continúa)<br />
158<br />
EDADES 1975 1976 1977 1978 1979 1980 1981 1982 1983 1984 1985<br />
Hombres <strong>de</strong> 40 años ........................... 3 7 6 6 3 2 3 3 1 3 3<br />
Mujeres <strong>de</strong> 40 años ............................. 5 4 2 4 3 3 3 - - 2 3<br />
Hombres <strong>de</strong> 41 años ........................... 5 6 5 1 2 4 1 - 2 5 4<br />
Mujeres <strong>de</strong> 41 años ............................. 5 4 1 3 4 1 - - 1 1 2<br />
Hombres <strong>de</strong> 42 años ........................... 3 2 4 5 2 3 4 1 2 - 3<br />
Mujeres <strong>de</strong> 42 años ............................. 5 3 3 3 - 2 1 2 2 1 1<br />
Hombres <strong>de</strong> 43 años ........................... 7 3 4 2 1 6 1 - 1 3 3<br />
Mujeres <strong>de</strong> 43 años ............................. 6 3 5 1 1 3 1 1 1 3 2<br />
Hombres <strong>de</strong> 44 años ........................... 7 5 1 3 3 4 8 2 2 4 2<br />
Mujeres <strong>de</strong> 44 años ............................. - 2 6 2 1 1 2 - 2 - 4<br />
Hombres <strong>de</strong> 45 años ........................... 4 1 7 2 1 5 3 1 1 3 5<br />
Mujeres <strong>de</strong> 45 años ............................. 3 6 2 1 2 3 3 - 5 1 4<br />
Hombres <strong>de</strong> 46 años ........................... 3 3 5 3 - 4 2 - - - 4<br />
Mujeres <strong>de</strong> 46 años ............................. 2 2 3 2 3 2 1 - - 4 -<br />
Hombres <strong>de</strong> 47 años ........................... 2 3 4 3 2 1 - 1 - 3 1<br />
Mujeres <strong>de</strong> 47 años ............................. 4 4 8 2 2 6 7 1 4 4 2<br />
Hombres <strong>de</strong> 48 años ........................... 5 4 1 2 2 2 - 2 1 - 2<br />
Mujeres <strong>de</strong> 48 años ............................. 1 3 2 3 1 2 3 - 1 1 1<br />
Hombres <strong>de</strong> 49 años ........................... 4 4 3 - - 4 2 1 3 6 4<br />
Mujeres <strong>de</strong> 49 años ............................. 4 2 3 3 - 1 3 - - 2 -<br />
Hombres <strong>de</strong> 50 años ........................... 3 4 4 1 2 6 1 - 1 1 1<br />
Mujeres <strong>de</strong> 50 años ............................. 4 3 1 1 2 3 3 - 2 1 1<br />
Hombres <strong>de</strong> 51 años ........................... 4 2 2 3 2 3 2 - 3 5 6<br />
Mujeres <strong>de</strong> 51 años ............................. 3 1 4 2 - 1 1 2 - 1 1<br />
Hombres <strong>de</strong> 52 años ........................... 3 3 4 1 2 4 1 1 2 2 1<br />
Mujeres <strong>de</strong> 52 años ............................. 5 - 2 - - 3 2 2 1 - 1<br />
Hombres <strong>de</strong> 53 años ........................... - - 2 1 1 - 1 - 1 - 4<br />
Mujeres <strong>de</strong> 53 años ............................. 1 1 2 3 1 2 1 1 2 1 2<br />
Hombres <strong>de</strong> 54 años ........................... 1 2 - 3 1 7 - - 1 1 2<br />
Mujeres <strong>de</strong> 54 años ............................. - 3 3 - 2 2 4 - 2 2 2<br />
Hombres <strong>de</strong> 55 años ........................... 1 3 3 2 - 1 3 2 - 2 1<br />
Mujeres <strong>de</strong> 55 años ............................. 2 2 2 1 - 2 1 1 - 3 -<br />
Hombres <strong>de</strong> 56 años ........................... 2 3 1 3 3 1 6 2 3 - 1<br />
Mujeres <strong>de</strong> 56 años ............................. 1 - - 1 1 3 1 - 1 2 1<br />
Hombres <strong>de</strong> 57 años ........................... 1 3 3 3 2 2 3 - 1 - 3<br />
Mujeres <strong>de</strong> 57 años ............................. - 1 4 2 2 1 2 2 1 - -<br />
Hombres <strong>de</strong> 58 años ........................... 5 1 1 - 2 2 2 - 1 2 3<br />
Mujeres <strong>de</strong> 58 años ............................. - 1 2 2 1 - 4 - 3 - 2<br />
Hombres <strong>de</strong> 59 años ........................... 1 2 3 1 2 1 - 1 - 1 1<br />
Mujeres <strong>de</strong> 59 años ............................. - 1 1 1 - - 3 1 - 1 -<br />
Hombres <strong>de</strong> 60 y más años................. 17 17 18 17 16 19 31 18 12 16 19<br />
Mujeres <strong>de</strong> 60 y más años................... 7 8 5 7 11 8 13 7 2 6 12<br />
Estadísticas Históricas <strong>de</strong> Pob<strong>la</strong>ción <strong>de</strong> <strong>la</strong> Región <strong>de</strong> Murcia.
MNP. Datos Regionales. Matrimonios.<br />
3.17.2. EVOLUCIÓN DE LOS MATRIMONIOS POR SEXO Y EDAD, POR LUGAR DE RESIDENCIA.<br />
1975-1992. CAPITAL. (Continúa)<br />
EDADES 1986 1987 1988 1989 1990 1991 1992<br />
TOTAL.................................................. 4.090 4.184 4.328 4.330 2.175 4.360 2.128<br />
Hombres menores <strong>de</strong> 15 años ............. - - - - - - -<br />
Mujeres menores <strong>de</strong> 15 años............... 5 1 2 3 3 2 -<br />
Hombres <strong>de</strong> 15 años ............................ - 2 - - - 1 1<br />
Mujeres <strong>de</strong> 15 años.............................. 12 12 11 20 12 15 9<br />
Hombres <strong>de</strong> 16 años ............................ 4 6 3 1 4 1 3<br />
Mujeres <strong>de</strong> 16 años.............................. 44 50 48 36 39 32 31<br />
Hombres <strong>de</strong> 17 años ............................ 14 10 15 12 18 17 15<br />
Mujeres <strong>de</strong> 17 años.............................. 80 65 61 73 62 54 53<br />
Hombres <strong>de</strong> 18 años ............................ 40 35 39 27 35 27 35<br />
Mujeres <strong>de</strong> 18 años.............................. 108 91 122 94 78 72 73<br />
Hombres <strong>de</strong> 19 años ............................ 67 62 52 50 41 30 35<br />
Mujeres <strong>de</strong> 19 años.............................. 137 125 115 109 96 93 81<br />
Hombres <strong>de</strong> 20 años ............................ 81 74 82 79 75 66 41<br />
Mujeres <strong>de</strong> 20 años.............................. 162 144 198 138 141 123 106<br />
Hombres <strong>de</strong> 21 años ............................ 113 113 116 105 96 96 80<br />
Mujeres <strong>de</strong> 21 años.............................. 194 205 185 181 150 146 115<br />
Hombres <strong>de</strong> 22 años ............................ 158 134 164 162 110 107 110<br />
Mujeres <strong>de</strong> 22 años.............................. 207 223 234 236 206 157 145<br />
Hombres <strong>de</strong> 23 años ............................ 175 194 215 182 162 144 124<br />
Mujeres <strong>de</strong> 23 años.............................. 242 215 237 223 211 197 215<br />
Hombres <strong>de</strong> 24 años ............................ 221 222 247 221 200 211 158<br />
Mujeres <strong>de</strong> 24 años.............................. 211 250 214 224 236 240 238<br />
Hombres <strong>de</strong> 25 años ............................ 244 222 225 251 234 205 206<br />
Mujeres <strong>de</strong> 25 años.............................. 178 158 193 224 192 241 212<br />
Hombres <strong>de</strong> 26 años ............................ 236 223 213 232 234 242 247<br />
Mujeres <strong>de</strong> 26 años.............................. 120 123 123 158 196 200 187<br />
Hombres <strong>de</strong> 27 años ............................ 196 183 175 193 214 230 220<br />
Mujeres <strong>de</strong> 27 años.............................. 91 119 107 113 152 153 163<br />
Hombres <strong>de</strong> 28 años ............................ 126 145 144 145 169 177 184<br />
Mujeres <strong>de</strong> 28 años.............................. 64 72 74 74 96 114 126<br />
Hombres <strong>de</strong> 29 años ............................ 94 114 113 134 135 125 145<br />
Mujeres <strong>de</strong> 29 años.............................. 40 60 54 58 65 80 80<br />
Hombres <strong>de</strong> 30 años ............................ 45 75 94 79 99 106 110<br />
Mujeres <strong>de</strong> 30 años.............................. 28 30 34 36 59 69 69<br />
Hombres <strong>de</strong> 31 años ............................ 33 48 57 54 74 90 87<br />
Mujeres <strong>de</strong> 31 años.............................. 16 22 30 27 31 34 44<br />
Hombres <strong>de</strong> 32 años ............................ 25 33 30 44 52 48 45<br />
Mujeres <strong>de</strong> 32 años.............................. 11 18 24 17 27 29 32<br />
Hombres <strong>de</strong> 33 años ............................ 18 38 21 36 33 42 58<br />
Mujeres <strong>de</strong> 33 años.............................. 8 5 14 17 17 19 32<br />
Hombres <strong>de</strong> 34 años ............................ 23 16 21 21 20 37 38<br />
Mujeres <strong>de</strong> 34 años.............................. 9 11 11 17 9 16 26<br />
Hombres <strong>de</strong> 35 años ............................ 15 15 21 12 20 25 31<br />
Mujeres <strong>de</strong> 35 años.............................. 6 15 6 8 11 9 15<br />
Hombres <strong>de</strong> 36 años ............................ 10 24 7 15 15 19 22<br />
Mujeres <strong>de</strong> 36 años.............................. 4 10 4 11 9 9 12<br />
Hombres <strong>de</strong> 37 años ............................ 7 7 9 11 15 19 17<br />
Mujeres <strong>de</strong> 37 años.............................. 6 11 8 8 8 11 5<br />
Hombres <strong>de</strong> 38 años ............................ 9 9 12 9 13 10 9<br />
Mujeres <strong>de</strong> 38 años.............................. 4 6 4 7 3 7 3<br />
Hombres <strong>de</strong> 39 años ............................ 5 6 6 12 10 10 10<br />
Mujeres <strong>de</strong> 39 años.............................. 8 6 4 7 3 7 3<br />
Estadísticas Históricas <strong>de</strong> Pob<strong>la</strong>ción <strong>de</strong> <strong>la</strong> Región <strong>de</strong> Murcia.<br />
159
MNP. Datos Regionales. Matrimonios.<br />
3.17.2. EVOLUCIÓN DE LOS MATRIMONIOS POR SEXO Y EDAD, POR LUGAR DE RESIDENCIA.<br />
1975-1992. CAPITAL. (Conclusión)<br />
160<br />
EDADES 1986 1987 1988 1989 1990 1991 1992<br />
Hombres <strong>de</strong> 40 años ............................ 8 6 11 7 9 7 9<br />
Mujeres <strong>de</strong> 40 años .............................. 2 3 5 5 3 6 3<br />
Hombres <strong>de</strong> 41 años ............................ 8 5 2 5 6 4 6<br />
Mujeres <strong>de</strong> 41 años .............................. 5 2 1 3 6 2 6<br />
Hombres <strong>de</strong> 42 años ............................ 3 5 4 6 5 4 6<br />
Mujeres <strong>de</strong> 42 años .............................. 1 - 3 5 2 3 5<br />
Hombres <strong>de</strong> 43 años ............................ 2 4 4 3 7 5 3<br />
Mujeres <strong>de</strong> 43 años .............................. 1 2 4 3 6 2 1<br />
Hombres <strong>de</strong> 44 años ............................ 4 2 4 6 3 5 7<br />
Mujeres <strong>de</strong> 44 años .............................. - - 2 2 4 5 3<br />
Hombres <strong>de</strong> 45 años ............................ 1 5 4 2 6 2 4<br />
Mujeres <strong>de</strong> 45 años .............................. 1 3 4 3 6 4 -<br />
Hombres <strong>de</strong> 46 años ............................ 2 1 2 2 3 8 4<br />
Mujeres <strong>de</strong> 46 años .............................. 2 3 1 1 2 6 1<br />
Hombres <strong>de</strong> 47 años ............................ - 2 - 6 3 4 7<br />
Mujeres <strong>de</strong> 47 años .............................. 2 2 - 2 2 3 1<br />
Hombres <strong>de</strong> 48 años ............................ 5 3 2 2 3 4 2<br />
Mujeres <strong>de</strong> 48 años .............................. 3 1 1 - 5 1 6<br />
Hombres <strong>de</strong> 49 años ............................ 2 2 1 1 - 3 6<br />
Mujeres <strong>de</strong> 49 años .............................. 2 6 7 3 1 - 2<br />
Hombres <strong>de</strong> 50 años ............................ 4 3 4 1 4 5 3<br />
Mujeres <strong>de</strong> 50 años .............................. - 1 - 1 1 - 3<br />
Hombres <strong>de</strong> 51 años ............................ 4 3 4 - 4 2 2<br />
Mujeres <strong>de</strong> 51 años .............................. 3 1 1 - 1 2 2<br />
Hombres <strong>de</strong> 52 años ............................ 5 1 1 1 2 1 3<br />
Mujeres <strong>de</strong> 52 años .............................. 2 1 - 1 1 1 1<br />
Hombres <strong>de</strong> 53 años ............................ 1 3 6 4 1 4 1<br />
Mujeres <strong>de</strong> 53 años .............................. 2 2 1 - 2 1 -<br />
Hombres <strong>de</strong> 54 años ............................ 3 2 3 - 1 5 1<br />
Mujeres <strong>de</strong> 54 años .............................. 3 1 1 1 2 1 3<br />
Hombres <strong>de</strong> 55 años ............................ 3 2 - 1 3 3 2<br />
Mujeres <strong>de</strong> 55 años .............................. 2 - 1 2 1 2 4<br />
Hombres <strong>de</strong> 56 años ............................ 1 3 3 2 1 - 3<br />
Mujeres <strong>de</strong> 56 años .............................. - 3 2 - - 1 1<br />
Hombres <strong>de</strong> 57 años ............................ - 4 1 2 6 3 3<br />
Mujeres <strong>de</strong> 57 años .............................. - 1 2 1 1 2 -<br />
Hombres <strong>de</strong> 58 años ............................ 2 2 2 2 3 4 4<br />
Mujeres <strong>de</strong> 58 años .............................. 2 - - 1 3 - 1<br />
Hombres <strong>de</strong> 59 años ............................ 2 1 1 3 2 1 2<br />
Mujeres <strong>de</strong> 59 años .............................. - 2 3 - 2 2 -<br />
Hombres <strong>de</strong> 60 y más años.................. 26 23 24 22 25 21 19<br />
Mujeres <strong>de</strong> 60 y más años.................... 17 11 8 12 12 7 10<br />
Fuente: INE. Movimiento Natural <strong>de</strong> <strong>la</strong> Pob<strong>la</strong>ción.<br />
Estadísticas Históricas <strong>de</strong> Pob<strong>la</strong>ción <strong>de</strong> <strong>la</strong> Región <strong>de</strong> Murcia.
MNP. Datos Regionales. Tasas y Pob<strong>la</strong>ción Calcu<strong>la</strong>da.<br />
3.18. EVOLUCIÓN DE LA NUPCIALIDAD, NATALIDAD Y MORTALIDAD.1900-1993. PROVINCIA<br />
(Continúa)<br />
AÑOS NUPCIALIDAD NATALIDAD MORTALIDAD<br />
Estadísticas Históricas <strong>de</strong> Pob<strong>la</strong>ción <strong>de</strong> <strong>la</strong> Región <strong>de</strong> Murcia.<br />
MORTALIDAD<br />
INFANTIL<br />
1900 ................................ 8,36 34,27 28,87 234,07<br />
1901 ................................ 8,47 33,17 24,93 210,19<br />
1902 ................................ 8,39 36,11 25,17 188,76<br />
1903 ................................ 7,59 34,03 25,46 190,89<br />
1904 ................................ 7,19 33,23 24,56 192,58<br />
1905 ................................ 7,01 34,29 25,73 174,88<br />
1906 ................................ 6,71 31,06 26,58 186,41<br />
1907 ................................ 7,29 30,53 24,35 178,00<br />
1908 ................................ 6,98 33,00 22,81 168,32<br />
1909 ................................ 6,67 31,67 21,43 152,69<br />
1910 ................................ 6,28 29,65 25,54 176,00<br />
1911 ................................ 6,70 26,59 22,36 169,47<br />
1912 ................................ 7,24 28,50 21,97 160,51<br />
1913 ................................ 7,46 25,14 20,18 164,57<br />
1914 ................................ 6,48 25,73 20,32 162,85<br />
1915 ................................ 6,12 27,35 21,38 167,06<br />
1916 ................................ 7,15 25,17 18,72 143,83<br />
1917 ................................ 7,67 26,32 19,84 155,24<br />
1918 ................................ 7,42 27,38 32,90 188,47<br />
1919 ................................ 8,64 29,26 23,29 149,00<br />
1920 ................................ 9,79 27,12 23,57 176,57<br />
1921 ................................ 8,65 30,92 20,55 141,38<br />
1922 ................................ 8,43 31,43 19,41 128,15<br />
1923 ................................ 8,07 29,03 18,87 134,55<br />
1924 ................................ 8,73 32,27 17,84 126,80<br />
1925 ................................ 8,50 32,09 18,89 127,69<br />
1926 ................................ 8,03 32,79 17,98 117,15<br />
1927 ................................ 7,53 32,79 17,98 116,70<br />
1928 ................................ 7,66 31,24 17,80 117,96<br />
1929 ................................ 8,22 28,99 15,87 107,61<br />
1930 ................................ 7,85 29,36 16,34 109,57<br />
1931 ................................ 7,61 28,22 16,91 112,88<br />
1932 ................................ 6,11 28,74 16,06 112,30<br />
1933 ................................ 5,34 31,92 16,40 107,08<br />
1934 ................................ 5,84 31,25 15,89 100,23<br />
1935 ................................ 5,45 30,50 16,40 100,19<br />
1936 ................................ 9,66 31,66 17,18 92,49<br />
1937 ................................ 14,68 35,90 22,06 104,32<br />
1938 ................................ 8,29 34,89 22,83 95,21<br />
1939 ................................ 5,27 20,25 25,03 147,50<br />
1940 ................................ 8,28 31,11 18,28 99,92<br />
1941 ................................ 6,79 21,72 17,66 124,60<br />
1942 ................................ 6,50 21,85 14,15 80,38<br />
1943 ................................ 6,13 23,20 12,35 81,46<br />
1944 ................................ 6,98 24,65 12,50 75,37<br />
1945 ................................ 8,14 26,62 10,41 65,25<br />
1946 ................................ 8,14 24,33 10,92 67,44<br />
1947 ................................ 9,37 23,61 10,27 57,63<br />
1948 ................................ 8,44 25,64 9,41 52,03<br />
1949 ................................ 7,41 22,87 9,69 53,45<br />
1950 ................................ 8,23 22,11 9,69 58,94<br />
1951 ................................ 8,46 23,60 10,68 54,41<br />
161
MNP. Datos Regionales. Tasas y Pob<strong>la</strong>ción Calcu<strong>la</strong>da.<br />
3.18. EVOLUCIÓN DE LA NUPCIALIDAD, NATALIDAD Y MORTALIDAD.1900-1993. PROVINCIA<br />
(Conclusión)<br />
162<br />
AÑOS NUPCIALIDAD NATALIDAD MORTALIDAD<br />
MORTALIDAD<br />
INFANTIL<br />
1952................................. 8,95 23,71 9,17 52,71<br />
1953................................. 8,44 23,56 8,55 42,42<br />
1954................................. 8,89 21,99 8,53 47,19<br />
1955................................. 9,28 22,74 8,72 49,60<br />
1956................................. 10,23 22,33 8,99 46,68<br />
1957................................. 9,77 25,20 9,14 45,99<br />
1958................................. 9,67 24,78 8,16 45,60<br />
1959................................. 8,79 24,41 8,23 44,55<br />
1960................................. 8,25 24,00 8,31 41,64<br />
1961................................. 8,38 23,58 8,10 41,17<br />
1962................................. 8,52 25,15 8,59 36,49<br />
1963................................. 8,82 26,31 8,37 29,04<br />
1964................................. 8,39 25,85 8,46 35,70<br />
1965................................. 8,35 25,21 8,32 37,60<br />
1966................................. 8,21 25,07 8,57 33,48<br />
1967................................. 7,93 25,13 8,52 31,23<br />
1968................................. 7,58 24,70 8,61 29,77<br />
1969................................. 7,76 24,33 9,01 28,37<br />
1970................................. 7,95 23,58 8,64 30,14<br />
1971................................. 7,80 23,58 9,54 25,15<br />
1972................................. 8,03 23,45 8,53 24,52<br />
1973................................. 8,39 23,59 9,20 21,70<br />
1974................................. 8,18 24,34 9,12 18,69<br />
1975................................. 7,80 22,29 9,16 23,37<br />
1976................................. 7,23 22,35 8,46 20,20<br />
1977................................. 7,41 21,48 8,33 15,97<br />
1978................................. 7,34 21,08 8,65 13,09<br />
1979................................. 7,32 20,70 8,26 12,37<br />
1980................................. 6,78 19,18 7,97 14,45<br />
1981................................. 6,04 17,48 7,99 9,07<br />
1982................................. 0,81 17,11 7,73 11,22<br />
1983................................. 1,14 15,68 8,06 10,62<br />
1984................................. 1,48 15,05 7,77 9,89<br />
1985................................. 5,96 14,61 7,99 8,88<br />
1986................................. 6,47 14,02 7,82 7,81<br />
1987................................. 6,79 13,87 7,51 7,14<br />
1988................................. 6,63 13,77 7,72 7,58<br />
1989................................. 6,70 13,70 8,28 8,50<br />
1990................................. 6,51 13,51 8,33 6,58<br />
1991................................. 6,23 13,36 8,21 9,14<br />
1992................................. 5,78 12,85 8,02 8,47<br />
1993 (*)............................ 5,60 12,44 7,78 5,54<br />
Nota: Hasta 1974 son nacimientos, matrimonios y <strong>de</strong>funciones por lugar <strong>de</strong> inscripción, a partir <strong>de</strong> 1975 por lugar <strong>de</strong> resi<strong>de</strong>ncia. Las cifras son en tantos por mil.<br />
(*) Datos provisionales.<br />
Fuente: Consejería <strong>de</strong> Economía y Hacienda. Dirección General <strong>de</strong> Economía y P<strong>la</strong>nificación. Centro Regional <strong>de</strong> Estadística.<br />
Estadísticas Históricas <strong>de</strong> Pob<strong>la</strong>ción <strong>de</strong> <strong>la</strong> Región <strong>de</strong> Murcia.
MNP. Datos Regionales. Tasas y Pob<strong>la</strong>ción Calcu<strong>la</strong>da.<br />
3.19. POBLACIÓN CALCULADA. 1900-1994. PROVINCIA Y CAPITAL. (Continúa)<br />
AÑO FECHA DE REFERENCIA<br />
Estadísticas Históricas <strong>de</strong> Pob<strong>la</strong>ción <strong>de</strong> <strong>la</strong> Región <strong>de</strong> Murcia.<br />
POBLACIÓN CALCULADA<br />
Provincia Capital<br />
1900 ......................................... 31-12-1900 577.987 111.539<br />
1901 ......................................... 30-06-1901 579.788 112.179<br />
1902 ......................................... 30-06-1902 583.408 113.470<br />
1903 ......................................... 30-06-1903 587.051 114.775<br />
1904 ......................................... 30-06-1904 590.716 116.096<br />
1905 ......................................... 30-06-1905 594.404 117.432<br />
1906 ......................................... 30-06-1906 598.115 118.783<br />
1907 ......................................... 30-06-1907 601.849 120.150<br />
1908 ......................................... 30-06-1908 605.607 121.532<br />
1909 ......................................... 30-06-1909 609.388 122.930<br />
1910 ......................................... 30-06-1910 613.193 124.344<br />
1911 ......................................... 30-06-1911 617.122 125.675<br />
1912 ......................................... 30-06-1912 620.874 127.121<br />
1913 ......................................... 30-06-1913 624.750 128.584<br />
1914 ......................................... 30-06-1914 628.651 130.063<br />
1915 ......................................... 30-06-1915 632.576 131.559<br />
1916 ......................................... 30-06-1916 636.526 133.073<br />
1917 ......................................... 30-06-1917 640.500 134.604<br />
1918 ......................................... 30-06-1918 644.499 136.156<br />
1919 ......................................... 31-12-1918 629.188 133.335<br />
1920 ......................................... 31-12-1919 631.906 134.656<br />
1921 ......................................... 31-12-1920 638.639 141.175<br />
1922 ......................................... 31-12-1921 643.109 142.163<br />
1923 ......................................... 31-12-1922 647.608 143.578<br />
1924 ......................................... 31-12-1923 643.050 146.517<br />
1925 ......................................... 31-12-1924 654.739 147.758<br />
1926 ......................................... 31-12-1925 658.826 149.485<br />
1927 ......................................... 31-12-1926 662.939 151.205<br />
1928 ......................................... 31-12-1927 667.078 152.945<br />
1929 ......................................... 31-12-1928 671.243 154.705<br />
1930 ......................................... 31-12-1929 675.434 156.485<br />
1931 ......................................... 31-12-1930 645.449 158.724<br />
1932 ......................................... 31-12-1931 646.134 160.595<br />
1933 ......................................... 31-12-1932 646.820 162.488<br />
1934 ......................................... 31-12-1933 647.495 164.044<br />
1935 ......................................... 31-07-1935 648.547 167.317<br />
1936 ......................................... 31-07-1936 649.237 169.284<br />
1937 ......................................... 31-07-1937 649.927 171.283<br />
1938 ......................................... 31-07-1938 650.620 173.302<br />
1939 ......................................... 31-07-1939 651.312 175.344<br />
1940 ......................................... 01-07-1940 652.097 177.406<br />
1941 ......................................... 01-07-1941 723.630 195.671<br />
1942 ......................................... 01-07-1942 731.553 200.531<br />
1943 ......................................... 01-07-1943 739.562 205.512<br />
1944 ......................................... 01-07-1944 747.659 210.617<br />
1945 ......................................... 01-07-1945 755.845 215.848<br />
1946 ......................................... 01-07-1946 764.120 221.209<br />
1947 ......................................... 01-07-1947 772.486 226.702<br />
1948 ......................................... 01-07-1948 780.943 232.336<br />
1949 ......................................... 01-07-1949 789.493 283.103<br />
1950 ......................................... 01-07-1950 798.137 244.016<br />
1951 ......................................... 01-07-1951 758.621 219.686<br />
163
MNP. Datos Regionales. Tasas y Pob<strong>la</strong>ción Calcu<strong>la</strong>da.<br />
3.19. POBLACIÓN CALCULADA. 1900-1994. PROVINCIA Y CAPITAL. (Conclusión)<br />
164<br />
AÑO FECHA DE REFERENCIA<br />
POBLACIÓN CALCULADA<br />
Provincia Capital<br />
1952......................................... 01-07-1952 762.436 222.332<br />
1953......................................... 01-07-1953 766.270 225.010<br />
1954......................................... 01-07-1954 770.123 227.720<br />
1955......................................... 01-07-1955 773.996 230.463<br />
1956......................................... 01-07-1956 777.888 233.239<br />
1957......................................... 01-07-1957 781.799 236.049<br />
1958......................................... 01-07-1958 785.730 238.892<br />
1959......................................... 01-07-1959 789.681 241.770<br />
1960......................................... 01-07-1960 798.457 248.121<br />
1961......................................... 01-07-1961 802.448 251.360<br />
1962......................................... 01-07-1962 806.355 254.617<br />
1963......................................... 01-07-1963 810.175 257.895<br />
1964......................................... 01-07-1964 813.906 261.191<br />
1965......................................... 01-07-1965 817.545 264.505<br />
1966......................................... 01-07-1966 813.552 267.839<br />
1967......................................... 01-07-1967 816.875 271.191<br />
1968......................................... 01-07-1968 820.080 274.560<br />
1969......................................... 01-07-1969 822.913 277.948<br />
1970......................................... 01-07-1970 831.329 244.138<br />
1971......................................... 01-07-1971 833.231 243.372<br />
1972......................................... 01-07-1972 834.873 242.574<br />
1973......................................... 01-07-1973 836.250 241.743<br />
1974......................................... 01-07-1974 837.364 240.881<br />
1975......................................... 01-07-1975 829.276 239.988<br />
1976......................................... 01-07-1976 879.294 261.913<br />
1977......................................... 01-07-1977 889.371 265.782<br />
1978......................................... 01-07-1978 898.769 269.466<br />
1979......................................... 01-07-1979 906.026 272.499<br />
1980......................................... 01-07-1980 949.167 282.662<br />
1981......................................... 01-07-1981 958.787 285.834<br />
1982......................................... 01-07-1982 968.929 289.446<br />
1983......................................... 01-07-1983 978.322 293.110<br />
1984......................................... 01-07-1984 987.202 296.787<br />
1985......................................... 01-07-1985 995.958 300.479<br />
1986......................................... 01-07-1986 995.306 304.184<br />
1987......................................... 01-07-1987 1.009.146 307.903<br />
1988......................................... 01-07-1988 1.015.312 311.635<br />
1989......................................... 01-07-1989 1.021.104 315.378<br />
1990......................................... 01-07-1990 1.026.644 319.133<br />
1991......................................... 01-07-1991 1.032.284 328.186<br />
1992......................................... 01-07-1992 1.056.527 330.042<br />
1993......................................... 01-07-1993 1.063.702 331.898<br />
1994......................................... 01-07-1994 1.070.401 333.754<br />
Nota: Hasta 1975 es <strong>pob<strong>la</strong>ción</strong> <strong>de</strong> hecho. A partir <strong>de</strong> 1976 es <strong>pob<strong>la</strong>ción</strong> <strong>de</strong> <strong>de</strong>recho.<br />
Fuente: INE. Movimiento Natural <strong>de</strong> <strong>la</strong> Pob<strong>la</strong>ción.<br />
INE. Anuario Estadístico <strong>de</strong> España.<br />
Estadísticas Históricas <strong>de</strong> Pob<strong>la</strong>ción <strong>de</strong> <strong>la</strong> Región <strong>de</strong> Murcia.
MOVIMIENTO<br />
NATURAL<br />
DE<br />
LA<br />
POBLACIÓN.<br />
DATOS<br />
MUNICIPALES.
MNP. Datos Municipales. Nacimientos y Defunciones.<br />
4.1.1. EVOLUCIÓN DE LOS NACIMIENTOS POR LUGAR DE INSCRIPCIÓN. 1886-1892.<br />
MUNICIPIOS 1886 1887 1888 1889 1890 1891 1892<br />
Abanil<strong>la</strong>................................. 207 233 237 232 232 266 234<br />
Águi<strong>la</strong>s.................................. 428 486 543 507 555 614 590<br />
Alhama <strong>de</strong> Murcia ................ 258 211 271 221 217 271 256<br />
Bul<strong>la</strong>s.................................... 379 374 366 325 357 394 425<br />
Ca<strong>la</strong>sparra............................ 262 244 279 266 248 263 276<br />
Caravaca <strong>de</strong> <strong>la</strong> Cruz............. 594 541 564 538 536 562 537<br />
Cartagena............................. 2.637 3.105 3.132 3.206 2.983 3.388 3.472<br />
Cehegín................................ 469 476 478 428 459 444 517<br />
Cieza .................................... 334 304 324 303 277 307 330<br />
Fortuna ................................. 232 214 251 223 241 258 293<br />
Fuente Á<strong>la</strong>mo ....................... 392 373 358 402 322 358 420<br />
Jumil<strong>la</strong> .................................. 472 496 500 587 557 597 600<br />
Lorca .................................... 1.375 1.315 1.522 1.638 1.852 1.928 2.245<br />
Mazarrón .............................. 696 792 811 809 903 837 1064<br />
Molina <strong>de</strong> Segura ................. 140 110 108 104 94 91 113<br />
Moratal<strong>la</strong>............................... 478 530 507 543 495 502 470<br />
Mu<strong>la</strong>...................................... 429 391 488 442 444 447 530<br />
Murcia................................... 3.416 2.915 3.405 3.397 3.367 3.634 3.560<br />
Torre Pacheco...................... 339 278 371 327 338 376 375<br />
Totana .................................. 470 461 484 462 478 511 591<br />
Unión (La)............................. 1.148 1.178 1.286 1.122 1.134 1.230 1.227<br />
Yec<strong>la</strong> .................................... 733 807 847 772 766 772 871<br />
Nota: Sólo hay datos para los municipios mayores <strong>de</strong> 5.000 habitantes.<br />
Fuente: INE. Movimiento Natural <strong>de</strong> <strong>la</strong> Pob<strong>la</strong>ción<br />
Estadísticas Históricas <strong>de</strong> Pob<strong>la</strong>ción <strong>de</strong> <strong>la</strong> Región <strong>de</strong> Murcia.<br />
167
MNP. Datos Municipales. Nacimientos y Defunciones.<br />
4.1.2. EVOLUCIÓN DE LOS NACIMIENTOS POR LUGAR DE INSCRIPCIÓN. 1900-1933. (Continúa)<br />
168<br />
MUNICIPIOS 1900 1901 1902 1903 1904 1905 1906 1907<br />
Águi<strong>la</strong>s...................................... 596 583 679 654 636 749 628 643<br />
Caravaca <strong>de</strong> <strong>la</strong> Cruz................. 456 490 552 480 453 523 434 486<br />
Cartagena................................. 3.597 3.387 3.537 3.365 3.398 3.259 3.288 3.237<br />
Cehegín .................................... 500 408 516 489 488 466 467 472<br />
Cieza......................................... 252 356 418 423 379 380 352 351<br />
Fuente Á<strong>la</strong>mo ........................... .. .. .. .. .. .. .. ..<br />
Jumil<strong>la</strong> ...................................... 551 592 696 664 609 619 489 559<br />
Lorca......................................... 1.872 1.662 1.898 1.868 1.704 1.925 1.537 1.644<br />
Mazarrón................................... 1.083 1.013 1.230 1.167 1.027 1.046 946 940<br />
Molina <strong>de</strong> Segura...................... .. .. .. .. .. .. .. ..<br />
Moratal<strong>la</strong>................................... 472 484 485 523 425 449 358 398<br />
Mu<strong>la</strong>.......................................... 461 450 474 403 455 479 414 411<br />
Murcia....................................... 2.816 2.858 3.306 2.965 2.960 3.225 3.080 2.586<br />
Totana....................................... 563 521 591 553 564 521 485 477<br />
Unión (La)................................. 1.306 1.267 1.177 1.180 1.157 1.219 1.139 1.208<br />
Yec<strong>la</strong>......................................... 760 805 768 785 834 774 662 672<br />
4.1.2. EVOLUCIÓN DE LOS NACIMIENTOS POR LUGAR DE INSCRIPCIÓN. 1900-1933. (Continúa)<br />
MUNICIPIOS 1908 1909 1910 1911 1912 1913 1914 1915<br />
Águi<strong>la</strong>s...................................... 742 624 593 579 592 453 619 575<br />
Caravaca <strong>de</strong> <strong>la</strong> Cruz................. 480 529 475 455 469 439 465 509<br />
Cartagena................................. 3.533 3.392 3.226 2.850 2.838 2.615 2.608 2.866<br />
Cehegín .................................... 514 511 522 462 489 450 410 531<br />
Cieza......................................... 473 431 427 389 415 397 413 401<br />
Fuente Á<strong>la</strong>mo ........................... .. .. .. 352 348 275 238 392<br />
Jumil<strong>la</strong> ...................................... 619 543 504 501 520 459 393 452<br />
Lorca......................................... 1.712 1.620 1.729 1.409 1.515 1.156 1.231 1.344<br />
Mazarrón................................... 1054 954 942 755 850 680 706 850<br />
Molina <strong>de</strong> Segura...................... .. .. .. 318 355 317 314 355<br />
Moratal<strong>la</strong>................................... 405 404 367 369 382 363 338 394<br />
Mu<strong>la</strong>.......................................... 414 452 424 362 352 341 335 365<br />
Murcia....................................... 3.013 2.763 2.463 2.381 2.929 2.748 3.022 2.884<br />
Totana....................................... 473 512 450 379 409 330 376 414<br />
Unión (La)................................. 1.338 1.059 1.074 898 928 925 833 888<br />
Yec<strong>la</strong>......................................... 714 627 613 604 705 620 642 644<br />
Estadísticas Históricas <strong>de</strong> Pob<strong>la</strong>ción <strong>de</strong> <strong>la</strong> Región <strong>de</strong> Murcia.
MNP. Datos Municipales. Nacimientos y Defunciones.<br />
4.1.2. EVOLUCIÓN DE LOS NACIMIENTOS POR LUGAR DE INSCRIPCIÓN. 1900-1933. (Continúa)<br />
MUNICIPIOS 1916 1917 1918 1919 1920 1921 1922 1923 1924<br />
Águi<strong>la</strong>s....................................... 476 546 .. 546 547 563 581 536 650<br />
Caravaca <strong>de</strong> <strong>la</strong> Cruz.................. 540 535 .. 537 679 687 730 637 698<br />
Cartagena.................................. 2.437 2.589 .. 2.485 2.325 2.635 2.761 2.698 3.043<br />
Cehegín..................................... 419 417 .. 410 472 521 490 512 512<br />
Cieza ......................................... 403 428 .. 514 481 587 592 496 580<br />
Fuente Á<strong>la</strong>mo ............................ 281 292 .. 393 288 372 371 262 386<br />
Jumil<strong>la</strong> ....................................... 523 519 .. 547 539 597 617 569 591<br />
Lorca ......................................... 1.343 1.522 .. 2.322 2.105 2.375 2.380 2.151 2.158<br />
Mazarrón ................................... 767 742 .. 527 492 600 603 448 621<br />
Molina <strong>de</strong> Segura ...................... 340 339 .. 419 383 405 389 440 395<br />
Moratal<strong>la</strong>.................................... 393 365 .. 421 443 457 520 438 405<br />
Mu<strong>la</strong>........................................... 370 370 .. 386 441 463 454 434 479<br />
Murcia........................................ 2.694 2.949 3.196 3.289 3.075 3.810 3.882 3.844 4.244<br />
Totana ....................................... 318 354 .. 425 367 392 416 349 346<br />
Unión (La).................................. 790 805 .. 654 486 594 497 435 584<br />
Yec<strong>la</strong> ......................................... 671 731 .. 718 647 794 786 756 751<br />
4.1.2. EVOLUCIÓN DE LOS NACIMIENTOS POR LUGAR DE INSCRIPCIÓN. 1900-1933. (Conclusión)<br />
MUNICIPIOS 1925 1926 1927 1928 1929 1930 1931 1932 1933<br />
Águi<strong>la</strong>s....................................... 599 580 575 571 478 605 479 557 521<br />
Caravaca <strong>de</strong> <strong>la</strong> Cruz.................. 638 750 707 710 709 666 653 625 631<br />
Cartagena.................................. 3.045 3.090 2.819 2.892 2.735 2.811 2.072 2.322 2.984<br />
Cehegín..................................... 486 531 526 525 514 484 462 458 410<br />
Cieza ......................................... 618 596 559 576 472 517 518 561 534<br />
Fuente Á<strong>la</strong>mo ............................ 351 341 302 269 253 230 .. .. ..<br />
Jumil<strong>la</strong> ....................................... 566 581 591 600 600 548 586 473 505<br />
Lorca ......................................... 2.391 2.245 1.930 2.143 1.778 1.871 1.508 1.583 1.924<br />
Mazarrón ................................... 478 585 492 513 419 428 396 470 464<br />
Molina <strong>de</strong> Segura ...................... 405 404 375 449 369 409 459 445 438<br />
Moratal<strong>la</strong>.................................... 440 451 442 457 477 452 427 396 440<br />
Mu<strong>la</strong>........................................... 486 481 401 483 407 396 417 425 473<br />
Murcia........................................ 4.714 4.806 5.589 4.769 4.894 4.875 4.554 4.607 5.225<br />
Totana ....................................... 398 420 381 392 355 326 356 380 361<br />
Unión (La).................................. 600 622 520 433 359 449 332 342 325<br />
Yec<strong>la</strong> ......................................... 745 800 719 794 730 668 693 642 633<br />
Nota: Sólo hay datos para los municipios mayores <strong>de</strong> 10.000 habitantes. De 1934 a 1940 no se publican datos a nivel municipal.<br />
Fuente: INE. Movimiento Natural <strong>de</strong> <strong>la</strong> Pob<strong>la</strong>ción<br />
Estadísticas Históricas <strong>de</strong> Pob<strong>la</strong>ción <strong>de</strong> <strong>la</strong> Región <strong>de</strong> Murcia.<br />
169
MNP. Datos Municipales. Nacimientos y Defunciones.<br />
4.1.3. EVOLUCIÓN DE LOS NACIMIENTOS POR LUGAR DE INSCRIPCIÓN. 1941-1974. (Continúa)<br />
170<br />
MUNICIPIOS 1941 1942 1943 1944 1945 1946 1947 1948 1949<br />
Caravaca <strong>de</strong> <strong>la</strong> Cruz.................. 532 523 577 559 603 581 568 641 535<br />
Cartagena.................................. 2.153 1.774 2.195 2.350 2.811 3.234 2.356 2.590 2.338<br />
Cieza.......................................... 486 535 537 488 570 492 490 568 536<br />
Jumil<strong>la</strong> ....................................... 399 408 461 471 438 397 434 514 422<br />
Lorca.......................................... 1.648 1.520 1.771 1.787 2.183 2.156 2.087 2.279 1.935<br />
Molina <strong>de</strong> Segura....................... .. .. .. .. .. .. .. .. ..<br />
Murcia........................................ 4.475 5.079 5.196 5.933 6.215 5.783 5.457 6.090 5.574<br />
Yec<strong>la</strong>.......................................... 417 462 473 469 446 422 500 518 533<br />
4.1.3. EVOLUCIÓN DE LOS NACIMIENTOS POR LUGAR DE INSCRIPCIÓN. 1941-1974. (Continúa)<br />
MUNICIPIOS 1950 1951 1952 1953 1954 1955 1956 1957 1958<br />
Caravaca <strong>de</strong> <strong>la</strong> Cruz.................. 496 505 569 628 511 514 516 586 616<br />
Cartagena.................................. 2.270 2.397 2.444 2.487 2.329 2.538 2.504 3.036 3.015<br />
Cieza.......................................... 507 529 546 621 524 574 512 619 657<br />
Jumil<strong>la</strong> ....................................... 418 458 554 477 414 434 378 437 490<br />
Lorca.......................................... 1.976 1.881 1.882 1.856 1.700 1.737 1.891 2.069 1.892<br />
Molina <strong>de</strong> Segura....................... .. .. .. .. .. .. .. .. ..<br />
Murcia........................................ 5.371 5.456 5.319 5.368 5.057 5.397 4.957 5.327 5.281<br />
Yec<strong>la</strong>.......................................... 474 461 473 478 541 462 428 552 572<br />
4.1.3. EVOLUCIÓN DE LOS NACIMIENTOS POR LUGAR DE INSCRIPCIÓN. 1941-1974. (Continúa)<br />
MUNICIPIOS 1959 1960 1961 1962 1963 1964 1965 1966 1967<br />
Caravaca <strong>de</strong> <strong>la</strong> Cruz.................. 575 575 523 465 531 489 473 416 380<br />
Cartagena.................................. 2.991 2.953 3.058 2.902 3.377 3.530 3.538 3.455 3.746<br />
Cieza.......................................... 623 589 571 564 695 682 657 610 613<br />
Jumil<strong>la</strong> ....................................... 455 428 444 417 370 400 380 383 380<br />
Lorca.......................................... 1.790 1.623 1.540 1.939 2.389 1.951 1.713 1.738 1.591<br />
Molina <strong>de</strong> Segura....................... .. .. .. .. .. .. .. .. ..<br />
Murcia........................................ 5.458 5.893 5.889 7.020 6.831 6.766 6.775 6.870 7.019<br />
Yec<strong>la</strong>.......................................... 492 498 484 513 454 483 438 425 386<br />
Estadísticas Históricas <strong>de</strong> Pob<strong>la</strong>ción <strong>de</strong> <strong>la</strong> Región <strong>de</strong> Murcia.
MNP. Datos Municipales. Nacimientos y Defunciones.<br />
4.1.3. EVOLUCIÓN DE LOS NACIMIENTOS POR LUGAR DE INSCRIPCIÓN. 1941-1974. (Conclusión)<br />
MUNICIPIOS 1968 1969 1970 1971 1972 1973 1974<br />
Caravaca <strong>de</strong> <strong>la</strong> Cruz............. 396 388 358 .. .. .. ..<br />
Cartagena............................. 3.771 3.711 3.847 3.907 3.994 4.069 4.109<br />
Cieza .................................... 611 620 556 564 605 614 586<br />
Jumil<strong>la</strong> .................................. 342 313 289 307 310 354 385<br />
Lorca .................................... 1.485 1.469 1.410 1.430 1.381 1.380 1.536<br />
Molina <strong>de</strong> Segura ................. .. .. .. 479 443 506 493<br />
Murcia................................... 6.863 7.244 7.368 7.154 7.092 6.937 7.347<br />
Yec<strong>la</strong> .................................... 446 378 376 396 469 432 480<br />
Nota: Sólo hay datos para los municipios mayores <strong>de</strong> 20.000 habitantes, aunque Alcantaril<strong>la</strong> supera los 20.000 habitantes <strong>de</strong> <strong>de</strong>recho en el censo <strong>de</strong> 1970.<br />
Fuente: INE. Movimiento Natural <strong>de</strong> <strong>la</strong> Pob<strong>la</strong>ción<br />
4.1.4. EVOLUCIÓN DE LOS NACIMIENTOS POR LUGAR DE INSCRIPCIÓN. 1975-1992. (Continúa)<br />
MUNICIPIOS 1975 1976 1977 1978 1979 1980 1981 1982 1983<br />
Abarán....................................... 203 220 202 206 215 207 197 185 164<br />
Águi<strong>la</strong>s....................................... 421 472 443 451 477 429 463 406 345<br />
Alcantaril<strong>la</strong>................................. 335 329 305 253 262 229 240 198 206<br />
Alhama <strong>de</strong> Murcia ..................... 232 226 219 241 218 230 192 192 189<br />
Archena ..................................... 210 282 267 268 255 226 228 227 215<br />
Bul<strong>la</strong>s......................................... .. .. .. .. .. .. .. .. ..<br />
Caravaca <strong>de</strong> <strong>la</strong> Cruz.................. 346 329 348 296 303 276 296 269 294<br />
Cartagena.................................. 3.742 3.954 3.868 3.767 3.641 3.446 3.188 3.067 2.965<br />
Cehegín..................................... 212 244 224 196 209 186 184 184 169<br />
Cieza ......................................... 586 432 248 269 186 138 87 123 162<br />
Jumil<strong>la</strong> ....................................... 325 383 367 355 378 357 348 345 247<br />
Lorca ......................................... 1.201 1.317 1.239 1.260 1.240 1.182 1.042 996 983<br />
Mazarrón ................................... .. .. .. .. .. .. 188 189 213<br />
Molina <strong>de</strong> Segura ...................... 514 535 557 503 523 512 459 511 507<br />
Moratal<strong>la</strong>.................................... 168 152 158 128 131 138 .. .. ..<br />
Mu<strong>la</strong>........................................... 171 195 194 197 222 185 196 160 182<br />
Murcia........................................ 6.688 7.347 7.377 7.429 7.349 7.322 6.686 6.611 5.679<br />
San Javier ................................. 161 183 152 166 149 141 204 245 245<br />
San Pedro <strong>de</strong> Pinatar ................ .. .. .. .. .. .. .. .. ..<br />
Torre Pacheco........................... 263 272 250 277 277 267 240 225 229<br />
Torres <strong>de</strong> Cotil<strong>la</strong>s (Las) ............. .. .. .. .. .. .. 192 161 149<br />
Totana ....................................... 345 372 344 352 333 339 331 287 248<br />
Unión (La).................................. 53 47 49 44 42 49 51 31 48<br />
Yec<strong>la</strong> ......................................... 444 454 391 367 444 404 342 530 634<br />
Estadísticas Históricas <strong>de</strong> Pob<strong>la</strong>ción <strong>de</strong> <strong>la</strong> Región <strong>de</strong> Murcia.<br />
171
MNP. Datos Municipales. Nacimientos y Defunciones.<br />
4.1.4. EVOLUCIÓN DE LOS NACIMIENTOS POR LUGAR DE INSCRIPCIÓN. 1975-1992. (Conclusión)<br />
172<br />
MUNICIPIOS 1984 1985 1986 1987 1988 1989 1990 1991 1992<br />
Abarán ....................................... 162 162 146 137 153 141 133 159 139<br />
Águi<strong>la</strong>s....................................... 351 342 325 347 275 181 89 263 303<br />
Alcantaril<strong>la</strong> ................................. 220 165 112 79 18 18 9 162 318<br />
Alhama <strong>de</strong> Murcia...................... 178 195 170 160 159 135 142 146 143<br />
Archena ..................................... 193 193 190 199 191 170 178 165 185<br />
Bul<strong>la</strong>s......................................... .. .. 112 121 136 144 130 132 151<br />
Caravaca <strong>de</strong> <strong>la</strong> Cruz.................. 242 248 234 279 298 268 267 290 298<br />
Cartagena.................................. 2.764 2.746 2.466 2.477 2.354 2.348 2.375 2.304 2.179<br />
Cehegín ..................................... 189 170 147 142 138 130 130 145 149<br />
Cieza.......................................... 361 401 370 387 398 427 433 430 456<br />
Jumil<strong>la</strong> ....................................... 282 293 290 233 248 241 249 262 245<br />
Lorca.......................................... 924 990 904 908 854 981 1.054 897 796<br />
Mazarrón.................................... 208 211 190 188 189 195 161 131 168<br />
Molina <strong>de</strong> Segura....................... 368 400 377 390 376 404 330 207 470<br />
Moratal<strong>la</strong>.................................... .. .. 89 109 99 92 101 .. ..<br />
Mu<strong>la</strong>........................................... 150 150 158 165 177 156 167 148 144<br />
Murcia........................................ 5.474 5.324 5.371 5.328 5.462 5.546 5.510 5.413 4.866<br />
San Javier.................................. 241 187 254 269 305 320 352 187 261<br />
San Pedro <strong>de</strong> Pinatar ................ .. .. 178 181 181 167 155 188 186<br />
Torre Pacheco ........................... 238 212 234 207 198 220 210 194 224<br />
Torres <strong>de</strong> Cotil<strong>la</strong>s (Las) ............. 119 131 132 117 115 90 91 118 153<br />
Totana........................................ 284 232 175 187 193 212 177 219 241<br />
Unión (La).................................. 51 49 46 54 46 26 15 67 98<br />
Yec<strong>la</strong>.......................................... 618 484 489 534 505 506 484 418 382<br />
Nota: Sólo hay datos para los municipios mayores <strong>de</strong> 10.000 habitantes.<br />
Fuente: INE. Movimiento Natural <strong>de</strong> <strong>la</strong> Pob<strong>la</strong>ción<br />
Estadísticas Históricas <strong>de</strong> Pob<strong>la</strong>ción <strong>de</strong> <strong>la</strong> Región <strong>de</strong> Murcia.
MNP. Datos Municipales. Nacimientos y Defunciones.<br />
4.2. EVOLUCIÓN DE LOS NACIMIENTOS POR LUGAR DE RESIDENCIA DE LA MADRE. 1975-<br />
1993. (Continúa)<br />
MUNICIPIOS 1975 1976 1977 1978 1979 1980 1981 1982 1983<br />
TOTAL.................................... 18.484 19.649 19.103 18.942 18.758 18.204 16.758 16.575 15.344<br />
Abanil<strong>la</strong>................................... 111 104 107 99 90 101 116 84 85<br />
Abarán.................................... 208 217 204 219 217 215 209 187 165<br />
Águi<strong>la</strong>s.................................... 413 467 443 456 469 424 459 412 353<br />
Albu<strong>de</strong>ite ................................ 29 41 23 35 29 42 43 23 31<br />
Alcantaril<strong>la</strong>.............................. 542 595 599 573 529 528 473 466 426<br />
Alcázares (Los) ...................... .. .. .. .. .. .. .. .. ..<br />
Aledo ...................................... 13 17 21 21 8 18 19 13 13<br />
Alguazas................................. 100 130 117 100 134 134 113 103 110<br />
Alhama <strong>de</strong> Murcia .................. 247 238 227 253 230 250 196 211 196<br />
Archena .................................. 229 296 287 282 259 229 235 233 223<br />
Beniel ..................................... 101 117 117 136 127 133 120 110 111<br />
B<strong>la</strong>nca .................................... 93 92 104 83 100 93 95 97 92<br />
Bul<strong>la</strong>s...................................... 165 156 160 180 166 147 169 166 119<br />
Ca<strong>la</strong>sparra.............................. 136 155 131 125 134 143 136 150 98<br />
Campos <strong>de</strong>l Rio...................... 37 34 40 28 29 42 49 33 17<br />
Caravaca <strong>de</strong> <strong>la</strong> Cruz............... 351 342 349 307 315 300 301 267 291<br />
Cartagena............................... 3.398 3.558 3.494 3.382 3.291 3.121 2.929 2.799 2.693<br />
Cehegín.................................. 217 251 233 206 223 197 187 206 191<br />
Ceutí....................................... 110 114 132 102 146 132 104 100 96<br />
Cieza ...................................... 607 577 503 583 534 567 487 509 435<br />
Fortuna ................................... 144 125 139 112 105 132 124 132 114<br />
Fuente Á<strong>la</strong>mo ......................... 155 153 126 114 123 133 126 106 129<br />
Jumil<strong>la</strong> .................................... 350 405 384 378 407 379 370 363 265<br />
Libril<strong>la</strong>..................................... 82 66 61 55 68 45 31 27 61<br />
Lorca ...................................... 1.172 1.266 1.189 1.227 1.209 1.145 1.030 997 953<br />
Lorquí ..................................... 95 107 104 94 100 118 92 105 69<br />
Mazarrón ................................ 177 239 217 204 239 225 228 235 254<br />
Molina <strong>de</strong> Segura ................... 613 629 673 664 706 684 566 658 646<br />
Moratal<strong>la</strong>................................. 179 153 167 132 132 146 136 142 131<br />
Mu<strong>la</strong>........................................ 217 242 246 240 250 233 240 185 233<br />
Murcia..................................... 5.931 6.376 6.242 6.106 6.003 5.818 5.201 5.262 4.591<br />
Ojós ........................................ 5 11 10 23 13 20 22 12 10<br />
Pliego ..................................... 63 66 52 65 61 47 53 52 45<br />
Puerto Lumbreras................... 145 146 158 152 149 127 148 95 132<br />
Ricote ..................................... 30 32 23 25 26 14 18 23 13<br />
San Javier .............................. 211 257 214 259 211 218 241 240 232<br />
San Pedro <strong>de</strong> Pinatar ............. 169 174 162 203 172 200 171 189 191<br />
Santomera.............................. .. .. .. .. .. 1 11 75 108<br />
Torre Pacheco........................ 309 318 296 331 315 346 264 278 281<br />
Torres <strong>de</strong> Cotil<strong>la</strong>s (Las) .......... 220 251 245 234 270 257 260 235 210<br />
Totana .................................... 362 379 353 365 350 346 348 300 257<br />
Ulea ........................................ 27 18 14 19 21 13 20 10 9<br />
Unión (La)............................... 231 233 273 262 275 247 223 234 244<br />
Vil<strong>la</strong>nueva <strong>de</strong>l Río Segura...... 34 30 27 30 16 17 4 - 21<br />
Yec<strong>la</strong> ...................................... 456 472 437 478 507 477 391 451 400<br />
Estadísticas Históricas <strong>de</strong> Pob<strong>la</strong>ción <strong>de</strong> <strong>la</strong> Región <strong>de</strong> Murcia.<br />
173
MNP. Datos Municipales. Nacimientos y Defunciones.<br />
4.2. EVOLUCIÓN DE LOS NACIMIENTOS POR LUGAR DE RESIDENCIA DE LA MADRE. 1975-<br />
1993. (Conclusión)<br />
174<br />
MUNICIPIOS 1984 1985 1986 1987 1988 1989 1990 1991 1992 1993 (*)<br />
TOTAL .............................. 14.862 14.546 13.958 13.996 13.979 13.992 13.869 13.790 13.770 13.235<br />
Abanil<strong>la</strong>............................. 80 75 93 76 76 74 67 68 72 66<br />
Abarán .............................. 164 161 148 142 157 145 132 158 140 152<br />
Águi<strong>la</strong>s.............................. 350 366 340 362 334 329 317 333 322 300<br />
Albu<strong>de</strong>ite........................... 22 14 22 23 26 14 24 18 18 22<br />
Alcantaril<strong>la</strong> ........................ 446 459 422 436 444 473 422 438 416 460<br />
Alcázares (Los)................. 18 26 35 32 42 72 66 66 63 71<br />
Aledo ................................ 2 9 12 8 6 8 9 3 6 10<br />
Alguazas........................... 107 81 88 90 95 86 77 77 82 95<br />
Alhama <strong>de</strong> Murcia............. 185 206 177 171 170 145 151 154 150 150<br />
Archena ............................ 196 201 198 207 201 178 184 172 196 170<br />
Beniel................................ 100 106 103 101 112 117 109 106 112 113<br />
B<strong>la</strong>nca............................... 85 66 53 59 89 58 50 59 65 70<br />
Bul<strong>la</strong>s................................ 122 141 117 124 139 146 132 133 154 126<br />
Ca<strong>la</strong>sparra ........................ 129 114 115 106 112 100 101 119 114 107<br />
Campos <strong>de</strong>l Rio ................ 41 33 21 23 34 42 28 29 27 27<br />
Caravaca <strong>de</strong> <strong>la</strong> Cruz......... 264 258 240 271 282 264 248 274 289 245<br />
Cartagena......................... 2.536 2.526 2.298 2.321 2.222 2.214 2.218 2.111 2.120 2.017<br />
Cehegín ............................ 200 182 154 157 154 137 148 152 151 163<br />
Ceutí ................................. 99 76 86 96 101 100 87 93 89 93<br />
Cieza................................. 439 440 408 416 418 453 446 444 464 392<br />
Fortuna ............................. 103 101 88 111 89 77 85 93 68 98<br />
Fuente Á<strong>la</strong>mo ................... 114 103 123 118 116 123 115 112 123 88<br />
Jumil<strong>la</strong> .............................. 300 304 311 244 262 247 256 267 247 257<br />
Libril<strong>la</strong> ............................... 44 49 41 46 44 43 42 44 44 39<br />
Lorca................................. 939 936 826 871 780 834 819 817 780 780<br />
Lorquí ............................... 86 85 83 86 75 74 78 57 63 70<br />
Mazarrón........................... 235 225 218 233 226 221 211 210 182 203<br />
Molina <strong>de</strong> Segura.............. 532 545 531 531 523 547 543 508 537 548<br />
Moratal<strong>la</strong>........................... 107 113 99 113 103 94 105 84 88 82<br />
Mu<strong>la</strong>.................................. 175 164 169 175 188 165 172 154 152 167<br />
Murcia............................... 4.600 4.447 4.374 4.262 4.337 4.405 4.414 4.436 4.494 4.181<br />
Ojós .................................. 6 10 8 5 5 7 9 7 4 5<br />
Pliego................................ 52 41 39 52 33 45 28 40 32 34<br />
Puerto Lumbreras............. 121 122 116 106 141 96 121 141 110 109<br />
Ricote ............................... 20 20 21 16 17 11 13 16 13 14<br />
San Javier......................... 219 186 213 229 254 225 250 219 220 199<br />
San Pedro <strong>de</strong> Pinatar ....... 177 173 203 201 216 200 195 222 203 207<br />
Santomera ........................ 104 116 100 109 129 119 139 134 121 124<br />
Torre Pacheco .................. 269 243 254 247 231 266 255 226 244 237<br />
Torres <strong>de</strong> Cotil<strong>la</strong>s (Las) .... 167 198 199 199 209 199 191 186 194 201<br />
Totana............................... 287 242 246 198 216 240 204 234 247 192<br />
Ulea .................................. 13 11 8 10 7 7 11 9 8 6<br />
Unión (La)......................... 230 222 194 218 191 196 206 189 162 168<br />
Vil<strong>la</strong>nueva <strong>de</strong>l Río Segura 8 17 12 13 7 12 9 13 17 7<br />
Yec<strong>la</strong>................................. 369 333 352 382 366 384 382 365 367 370<br />
(*) Datos Provisionales.<br />
Fuente: INE. Movimiento Natural <strong>de</strong> <strong>la</strong> Pob<strong>la</strong>ción.<br />
Consejería <strong>de</strong> Economía y Hacienda. Centro Regional <strong>de</strong> Estadística. Movimiento Natural <strong>de</strong> <strong>la</strong> Pob<strong>la</strong>ción <strong>de</strong> <strong>la</strong> Región <strong>de</strong> Murcia<br />
Estadísticas Históricas <strong>de</strong> Pob<strong>la</strong>ción <strong>de</strong> <strong>la</strong> Región <strong>de</strong> Murcia.
MNP. Datos Municipales. Nacimientos y Defunciones.<br />
4.3.1. EVOLUCIÓN DE LAS DEFUNCIONES POR LUGAR DE INSCRIPCIÓN. 1886-1892.<br />
MUNICIPIOS 1886 1887 1888 1889 1890 1891 1892<br />
Abanil<strong>la</strong>................................. 208 205 140 140 138 145 132<br />
Águi<strong>la</strong>s.................................. 339 471 355 305 345 378 356<br />
Alhama <strong>de</strong> Murcia ................ 157 208 208 225 210 221 185<br />
Bul<strong>la</strong>s.................................... 283 484 266 232 339 278 299<br />
Ca<strong>la</strong>sparra............................ 183 212 194 212 177 176 231<br />
Caravaca <strong>de</strong> <strong>la</strong> Cruz............. 542 551 636 469 458 559 591<br />
Cartagena............................. 3.103 4.484 3.585 3.337 2.815 3.220 2.737<br />
Cehegín................................ 372 347 300 392 311 437 368<br />
Cieza .................................... 354 483 324 287 350 398 380<br />
Fortuna ................................. 291 330 185 214 236 225 194<br />
Fuente Á<strong>la</strong>mo ....................... 223 387 276 258 220 203 190<br />
Jumil<strong>la</strong> .................................. 435 647 392 339 420 507 424<br />
Lorca .................................... 1.854 2.525 2.097 2.199 2.012 2.193 1.707<br />
Mazarrón .............................. 549 783 757 705 657 768 559<br />
Molina <strong>de</strong> Segura ................. 209 298 215 187 185 185 207<br />
Moratal<strong>la</strong>............................... 383 423 418 377 379 348 575<br />
Mu<strong>la</strong>...................................... 233 403 373 291 357 382 301<br />
Murcia................................... 3.381 4.330 3.618 3.370 3.907 3.274 3.027<br />
Torre Pacheco...................... 267 297 243 202 207 204 189<br />
Totana .................................. 288 465 323 316 326 337 321<br />
Unión (La)............................. 1.167 1.514 1.352 1.194 1.113 1.254 956<br />
Yec<strong>la</strong> .................................... 505 739 507 517 586 682 801<br />
Nota: Sólo hay datos para los municipios mayores <strong>de</strong> 5.000 habitantes.<br />
Fuente: INE. Movimiento Natural <strong>de</strong> <strong>la</strong> Pob<strong>la</strong>ción<br />
Estadísticas Históricas <strong>de</strong> Pob<strong>la</strong>ción <strong>de</strong> <strong>la</strong> Región <strong>de</strong> Murcia.<br />
175
MNP. Datos Municipales. Nacimientos y Defunciones.<br />
4.3.2. EVOLUCIÓN DE LAS DEFUNCIONES POR LUGAR DE INSCRIPCIÓN. 1900-1933. (Continúa)<br />
176<br />
MUNICIPIOS 1900 1901 1902 1903 1904 1905 1906 1907<br />
Águi<strong>la</strong>s...................................... 470 414 371 379 437 429 517 413<br />
Caravaca <strong>de</strong> <strong>la</strong> Cruz................. 517 502 501 506 401 415 450 485<br />
Cartagena................................. 2.849 2.588 2.451 2.859 2.436 2.638 2.936 2.702<br />
Cehegín .................................... 347 296 310 346 263 248 284 388<br />
Cieza......................................... 345 328 478 383 324 314 391 354<br />
Fuente Á<strong>la</strong>mo ........................... .. .. .. .. .. .. .. ..<br />
Jumil<strong>la</strong> ...................................... 367 402 382 510 435 371 410 374<br />
Lorca......................................... 1.798 1.512 1.489 1.550 1.565 1.522 1.652 1.401<br />
Mazarrón................................... 792 685 656 579 698 856 585 494<br />
Molina <strong>de</strong> Segura...................... .. .. .. .. .. .. .. ..<br />
Moratal<strong>la</strong>................................... 362 367 334 275 290 279 321 273<br />
Mu<strong>la</strong>.......................................... 297 243 279 268 268 303 235 256<br />
Murcia....................................... 3.377 2.773 3.087 2.710 2.744 3.188 3.043 3.014<br />
Totana....................................... 372 267 282 285 289 329 329 266<br />
Unión (La)................................. 1.070 977 932 1.025 906 970 1.287 1.191<br />
Yec<strong>la</strong>......................................... 509 431 423 593 613 597 599 485<br />
4.3.2. EVOLUCIÓN DE LAS DEFUNCIONES POR LUGAR DE INSCRIPCIÓN. 1900-1933. (Continúa)<br />
MUNICIPIOS 1908 1909 1910 1911 1912 1913 1914 1915<br />
Águi<strong>la</strong>s...................................... 359 328 462 291 386 389 300 353<br />
Caravaca <strong>de</strong> <strong>la</strong> Cruz................. 347 389 445 548 316 403 523 390<br />
Cartagena................................. 2.633 2.422 2.873 2.302 2.424 2.153 2.136 2.303<br />
Cehegín .................................... 267 253 367 326 239 311 358 352<br />
Cieza......................................... 325 284 405 268 325 300 270 262<br />
Fuente Á<strong>la</strong>mo ........................... .. .. .. 181 220 163 160 170<br />
Jumil<strong>la</strong> ...................................... 368 304 422 303 373 313 277 296<br />
Lorca......................................... 1.360 1.373 1.502 1.375 1.511 1.244 1.184 1.260<br />
Mazarrón................................... 465 479 667 516 575 447 383 437<br />
Molina <strong>de</strong> Segura...................... .. .. .. 157 211 175 191 230<br />
Moratal<strong>la</strong>................................... 289 259 333 311 247 273 344 275<br />
Mu<strong>la</strong>.......................................... 281 262 250 263 214 239 268 312<br />
Murcia....................................... 2.840 2.704 2.953 3.051 2.793 2.694 2.906 3.282<br />
Totana....................................... 313 284 296 300 262 312 279 288<br />
Unión (La)................................. 850 804 1.110 795 798 731 675 685<br />
Yec<strong>la</strong>......................................... 524 477 629 489 546 389 422 429<br />
Estadísticas Históricas <strong>de</strong> Pob<strong>la</strong>ción <strong>de</strong> <strong>la</strong> Región <strong>de</strong> Murcia.
MNP. Datos Municipales. Nacimientos y Defunciones.<br />
4.3.2. EVOLUCIÓN DE LAS DEFUNCIONES POR LUGAR DE INSCRIPCIÓN. 1900-1933. (Continúa)<br />
MUNICIPIOS 1916 1917 1918 1919 1920 1921 1922 1923 1924<br />
Águi<strong>la</strong>s....................................... 364 398 .. 336 408 320 394 293 272<br />
Caravaca <strong>de</strong> <strong>la</strong> Cruz.................. 378 376 .. 478 511 463 380 455 410<br />
Cartagena.................................. 2.084 2.269 .. 2.612 2.255 2.196 2.000 2.014 1.857<br />
Cehegín..................................... 227 231 .. 247 310 286 247 337 312<br />
Cieza ......................................... 311 286 .. 348 357 475 270 279 313<br />
Fuente Á<strong>la</strong>mo ............................ 141 152 .. 222 216 178 173 182 143<br />
Jumil<strong>la</strong> ....................................... 336 301 .. 417 363 398 285 332 344<br />
Lorca ......................................... 1.149 1.272 .. 1.415 1.773 1.477 1.140 1.225 1.147<br />
Mazarrón ................................... 486 567 .. 492 430 321 316 288 274<br />
Molina <strong>de</strong> Segura ...................... 200 204 .. 244 225 236 245 221 208<br />
Moratal<strong>la</strong>.................................... 251 262 .. 333 338 163 225 274 336<br />
Mu<strong>la</strong>........................................... 180 202 .. 271 251 227 250 301 217<br />
Murcia........................................ 2.521 2.652 4.054 3.148 3.541 2.897 3.008 2.679 2.634<br />
Totana ....................................... 231 266 .. 328 284 259 253 208 235<br />
Unión (La).................................. 634 742 .. 749 533 372 356 329 331<br />
Yec<strong>la</strong> ......................................... 484 514 .. 478 558 445 480 478 432<br />
4.3.2. EVOLUCIÓN DE LAS DEFUNCIONES POR LUGAR DE INSCRIPCIÓN. 1900-1933.<br />
(Conclusión)<br />
MUNICIPIOS 1925 1926 1927 1928 1929 1930 1931 1932 1933<br />
Águi<strong>la</strong>s....................................... 278 349 277 294 308 263 283 233 242<br />
Caravaca <strong>de</strong> <strong>la</strong> Cruz.................. 355 381 446 413 388 371 342 363 360<br />
Cartagena.................................. 2.080 1.951 1.889 2.139 1.768 1.779 1.955 1.780 1.791<br />
Cehegín..................................... 229 255 240 290 199 221 245 243 221<br />
Cieza ......................................... 266 300 404 273 277 366 279 293 310<br />
Fuente Á<strong>la</strong>mo ............................ 152 205 151 158 148 112 .. .. ..<br />
Jumil<strong>la</strong> ....................................... 296 349 302 316 295 393 301 290 283<br />
Lorca ......................................... 1.247 1.133 1.183 1.046 1.068 1.020 989 942 1.022<br />
Mazarrón ................................... 313 322 269 247 228 275 279 206 187<br />
Molina <strong>de</strong> Segura ...................... 253 256 177 155 191 189 198 212 175<br />
Moratal<strong>la</strong>.................................... 249 220 290 236 208 217 208 192 250<br />
Mu<strong>la</strong>........................................... 265 220 303 246 203 247 299 181 212<br />
Murcia........................................ 3.065 2.776 2.654 2.871 2.600 2.648 2.634 2.539 2.636<br />
Totana ....................................... 250 242 228 281 210 237 208 202 206<br />
Unión (La).................................. 411 392 360 351 249 241 278 223 216<br />
Yec<strong>la</strong> ......................................... 489 391 313 385 455 394 325 338 326<br />
Nota: Sólo hay datos para los municipios mayores <strong>de</strong> 10.000 habitantes. De 1934 a 1940 no se publican datos a nivel municipal.<br />
Fuente: INE. Movimiento Natural <strong>de</strong> <strong>la</strong> Pob<strong>la</strong>ción<br />
Estadísticas Históricas <strong>de</strong> Pob<strong>la</strong>ción <strong>de</strong> <strong>la</strong> Región <strong>de</strong> Murcia.<br />
177
MNP. Datos Municipales. Nacimientos y Defunciones.<br />
4.3.3. EVOLUCIÓN DE LAS DEFUNCIONES POR LUGAR DE INSCRIPCIÓN. 1941-1974. (Continúa)<br />
178<br />
MUNICIPIOS 1941 1942 1943 1944 1945 1946 1947 1948 1949<br />
Caravaca <strong>de</strong> <strong>la</strong> Cruz.................. 336 253 313 329 269 261 225 266 268<br />
Cartagena.................................. 2.356 1.907 1.406 1.532 1.224 1.234 1.259 1.154 1.175<br />
Cieza.......................................... 374 314 258 273 267 253 226 224 229<br />
Jumil<strong>la</strong> ....................................... 300 238 230 295 234 295 232 177 221<br />
Lorca.......................................... 1.189 885 879 854 692 780 725 730 700<br />
Molina <strong>de</strong> Segura....................... .. .. .. .. .. .. .. .. ..<br />
Murcia........................................ 3.261 2.939 2.492 2.614 2.179 2.177 2.236 1.911 2.035<br />
Yec<strong>la</strong>.......................................... 398 256 473 329 267 360 265 219 231<br />
4.3.3. EVOLUCIÓN DE LAS DEFUNCIONES POR LUGAR DE INSCRIPCIÓN. 1941-1974. (Continúa)<br />
MUNICIPIOS 1950 1951 1952 1953 1954 1955 1956 1957 1958<br />
Caravaca <strong>de</strong> <strong>la</strong> Cruz.................. 234 277 210 218 230 205 227 193 183<br />
Cartagena.................................. 1.176 1.279 1.124 1.043 1.035 1.055 1.135 1.126 1.056<br />
Cieza.......................................... 272 290 204 204 227 241 215 236 217<br />
Jumil<strong>la</strong> ....................................... 215 262 213 214 194 185 182 203 157<br />
Lorca.......................................... 690 767 687 665 584 601 642 628 560<br />
Molina <strong>de</strong> Segura....................... .. .. .. .. .. .. .. .. ..<br />
Murcia........................................ 2.112 2.225 1.840 1.644 1.760 1.784 1.911 1.987 1.800<br />
Yec<strong>la</strong>.......................................... 230 222 212 191 231 224 230 193 183<br />
4.3.3. EVOLUCIÓN DE LAS DEFUNCIONES POR LUGAR DE INSCRIPCIÓN. 1941-1974. (Continúa)<br />
MUNICIPIOS 1959 1960 1961 1962 1963 1964 1965 1966 1967<br />
Caravaca <strong>de</strong> <strong>la</strong> Cruz.................. 212 198 184 204 191 182 203 161 191<br />
Cartagena.................................. 1.028 1.115 1.082 1.092 983 1.128 1.102 1.056 1.144<br />
Cieza.......................................... 211 205 183 236 211 224 211 149 235<br />
Jumil<strong>la</strong> ....................................... 163 254 181 169 158 187 177 191 163<br />
Lorca.......................................... 577 446 480 483 476 501 476 538 516<br />
Molina <strong>de</strong> Segura....................... .. .. .. .. .. .. .. .. ..<br />
Murcia........................................ 1.775 1.810 1.802 2.053 1.972 1.948 1.958 2.095 2.006<br />
Yec<strong>la</strong>.......................................... 193 136 200 167 189 209 186 169 188<br />
Estadísticas Históricas <strong>de</strong> Pob<strong>la</strong>ción <strong>de</strong> <strong>la</strong> Región <strong>de</strong> Murcia.
MNP. Datos Municipales. Nacimientos y Defunciones.<br />
4.3.3. EVOLUCIÓN DE LAS DEFUNCIONES POR LUGAR DE INSCRIPCIÓN. 1941-1974. (Conclusión)<br />
MUNICIPIOS 1968 1969 1970 1971 1972 1973 1974<br />
Caravaca <strong>de</strong> <strong>la</strong> Cruz............. 172 171 157 .. .. .. ..<br />
Cartagena............................. 1.118 1.209 1.126 1.265 1.209 1.333 1.350<br />
Cieza .................................... 241 212 238 220 193 199 198<br />
Jumil<strong>la</strong> .................................. 181 184 171 185 173 167 193<br />
Lorca .................................... 466 514 487 500 509 540 487<br />
Molina <strong>de</strong> Segura ................. .. .. .. 151 123 125 131<br />
Murcia................................... 2.193 2.353 2.350 2.620 2.390 2.591 2.623<br />
Yec<strong>la</strong> .................................... 213 227 210 233 206 211 188<br />
Nota: Sólo hay datos para los municipios mayores <strong>de</strong> 20.000 habitantes, aunque Alcantaril<strong>la</strong> supera los 20.000 habitantes <strong>de</strong> <strong>de</strong>recho en el censo <strong>de</strong> 1970.<br />
Fuente: INE. Movimiento Natural <strong>de</strong> <strong>la</strong> Pob<strong>la</strong>ción<br />
4.3.4. EVOLUCIÓN DE LAS DEFUNCIONES POR LUGAR DE INSCRIPCIÓN. 1975-1992. (Continúa)<br />
MUNICIPIOS 1975 1976 1977 1978 1979 1980 1981 1982 1983<br />
Abarán....................................... 84 85 101 85 85 92 86 88 96<br />
Águi<strong>la</strong>s....................................... 156 161 154 148 186 185 150 147 178<br />
Alcantaril<strong>la</strong>................................. 141 108 100 112 109 103 108 101 123<br />
Alhama <strong>de</strong> Murcia ..................... 77 95 96 90 87 97 99 105 102<br />
Archena ..................................... 74 71 78 67 57 66 79 65 72<br />
Bul<strong>la</strong>s......................................... .. .. .. .. .. .. .. .. ..<br />
Caravaca <strong>de</strong> <strong>la</strong> Cruz.................. 163 175 142 157 157 156 204 173 185<br />
Cartagena.................................. 1.363 1.334 1.305 1.396 1.386 1.352 1.367 1.393 1.360<br />
Cehegín..................................... 124 125 90 100 127 101 103 82 118<br />
Cieza ......................................... 221 211 186 197 198 224 186 181 187<br />
Jumil<strong>la</strong> ....................................... 157 142 169 149 158 126 157 171 157<br />
Lorca ......................................... 489 481 457 552 490 462 504 490 532<br />
Mazarrón ................................... .. .. .. .. .. .. 75 83 64<br />
Molina <strong>de</strong> Segura ...................... 148 109 111 126 126 130 126 131 187<br />
Moratal<strong>la</strong>.................................... 106 78 90 65 71 84 .. .. ..<br />
Mu<strong>la</strong>........................................... 118 122 122 96 112 91 107 74 121<br />
Murcia........................................ 2.672 2.624 2.774 3.011 2.788 2.866 2.800 2.734 2.806<br />
San Javier ................................. 85 74 64 53 67 77 105 133 148<br />
San Pedro <strong>de</strong> Pinatar ................ .. .. .. .. .. .. .. .. ..<br />
Torre Pacheco........................... 88 83 86 90 80 82 82 83 111<br />
Torres <strong>de</strong> Cotil<strong>la</strong>s (Las) ............. .. .. .. .. .. .. 52 52 44<br />
Totana ....................................... 153 164 144 136 158 139 138 119 135<br />
Unión (La).................................. 56 58 62 59 67 46 55 62 45<br />
Yec<strong>la</strong> ......................................... 187 194 191 182 181 181 208 182 208<br />
Estadísticas Históricas <strong>de</strong> Pob<strong>la</strong>ción <strong>de</strong> <strong>la</strong> Región <strong>de</strong> Murcia.<br />
179
MNP. Datos Municipales. Nacimientos y Defunciones.<br />
4.3.4. EVOLUCIÓN DE LAS DEFUNCIONES POR LUGAR DE INSCRIPCIÓN. 1975-1992. (Conclusión)<br />
180<br />
MUNICIPIOS 1984 1985 1986 1987 1988 1989 1990 1991 1992<br />
Abarán ....................................... 81 99 83 66 78 94 85 94 90<br />
Águi<strong>la</strong>s....................................... 141 144 160 134 172 143 158 170 162<br />
Alcantaril<strong>la</strong> ................................. 159 156 149 183 145 137 140 130 135<br />
Alhama <strong>de</strong> Murcia...................... 63 113 97 102 88 111 91 89 102<br />
Archena ..................................... 82 60 71 67 62 66 70 60 57<br />
Bul<strong>la</strong>s......................................... .. .. 82 72 62 67 62 73 72<br />
Caravaca <strong>de</strong> <strong>la</strong> Cruz.................. 167 161 156 186 243 251 263 283 257<br />
Cartagena.................................. 1.346 1.481 1.419 1.344 1.397 1.588 1.581 1.604 1.561<br />
Cehegín ..................................... 110 83 100 78 89 78 89 78 93<br />
Cieza.......................................... 195 186 211 175 157 199 171 180 149<br />
Jumil<strong>la</strong> ....................................... 148 144 152 137 146 124 141 142 137<br />
Lorca.......................................... 442 476 516 490 535 504 579 558 591<br />
Mazarrón.................................... 76 86 73 74 80 82 89 76 66<br />
Molina <strong>de</strong> Segura....................... 270 373 286 216 128 138 139 121 128<br />
Moratal<strong>la</strong>.................................... .. .. 74 81 60 76 80 .. ..<br />
Mu<strong>la</strong>........................................... 109 117 95 75 102 105 97 89 80<br />
Murcia........................................ 2.777 2.786 2.839 2.879 3.117 3.319 3.400 3.342 3.271<br />
San Javier.................................. 149 107 188 192 178 184 221 167 169<br />
San Pedro <strong>de</strong> Pinatar ................ .. .. 46 42 52 49 59 59 39<br />
Torre Pacheco ........................... 79 73 79 60 53 56 54 78 61<br />
Torres <strong>de</strong> Cotil<strong>la</strong>s (Las) ............. 51 58 50 32 50 49 54 68 50<br />
Totana........................................ 127 139 143 113 128 152 124 130 132<br />
Unión (La).................................. 48 48 25 29 36 39 25 36 37<br />
Yec<strong>la</strong>.......................................... 205 233 215 222 241 245 276 279 280<br />
Nota: Sólo hay datos para los municipios mayores <strong>de</strong> 10.000 habitantes.<br />
Fuente: INE. Movimiento Natural <strong>de</strong> <strong>la</strong> Pob<strong>la</strong>ción<br />
Estadísticas Históricas <strong>de</strong> Pob<strong>la</strong>ción <strong>de</strong> <strong>la</strong> Región <strong>de</strong> Murcia.
MNP. Datos Municipales. Nacimientos y Defunciones.<br />
4.4. EVOLUCIÓN DE LAS DEFUNCIONES POR LUGAR DE RESIDENCIA DEL FALLECIDO. 1975-<br />
1993. (Continúa)<br />
MUNICIPIOS 1975 1976 1977 1978 1979 1980 1981 1982 1983<br />
TOTAL.................................... 7.599 7.443 7.412 7.771 7.488 7.561 7.662 7.487 7.888<br />
Abanil<strong>la</strong>................................... 72 70 65 83 73 56 82 75 90<br />
Abarán.................................... 99 98 117 104 90 106 95 104 114<br />
Águi<strong>la</strong>s.................................... 161 172 165 162 204 204 171 163 204<br />
Albu<strong>de</strong>ite ................................ 9 8 16 15 15 19 9 21 16<br />
Alcantaril<strong>la</strong>.............................. 178 146 140 160 158 152 153 142 174<br />
Alcázares (Los) ...................... .. .. .. .. .. .. .. .. ..<br />
Aledo ...................................... 13 10 9 10 13 11 13 7 12<br />
Alguazas................................. 48 51 45 40 49 36 37 47 39<br />
Alhama <strong>de</strong> Murcia .................. 91 104 119 116 107 119 113 120 126<br />
Archena .................................. 84 82 94 79 81 81 98 77 88<br />
Beniel ..................................... 32 31 22 43 31 37 28 40 43<br />
B<strong>la</strong>nca .................................... 50 57 34 43 51 51 44 45 37<br />
Bul<strong>la</strong>s...................................... 91 90 105 84 73 89 90 93 104<br />
Ca<strong>la</strong>sparra.............................. 71 78 82 77 73 74 77 77 65<br />
Campos <strong>de</strong>l Rio...................... 13 20 26 16 11 25 21 13 16<br />
Caravaca <strong>de</strong> <strong>la</strong> Cruz............... 172 197 156 178 174 180 229 189 198<br />
Cartagena............................... 1.316 1.302 1.254 1.332 1.337 1.334 1.311 1.347 1.316<br />
Cehegín.................................. 135 137 107 118 145 115 115 95 135<br />
Ceutí....................................... 41 46 37 39 32 32 50 29 39<br />
Cieza ...................................... 258 237 229 242 244 280 223 221 246<br />
Fortuna ................................... 42 49 51 65 46 49 47 38 53<br />
Fuente Á<strong>la</strong>mo ......................... 92 84 95 101 93 72 85 88 77<br />
Jumil<strong>la</strong> .................................... 168 165 182 168 194 155 174 183 180<br />
Libril<strong>la</strong>..................................... 27 33 31 47 27 29 22 15 32<br />
Lorca ...................................... 501 510 519 599 531 497 523 530 580<br />
Lorquí ..................................... 25 31 26 28 26 33 40 30 19<br />
Mazarrón ................................ 120 85 84 92 97 97 99 106 96<br />
Molina <strong>de</strong> Segura ................... 168 150 150 176 166 162 158 155 157<br />
Moratal<strong>la</strong>................................. 105 84 99 77 80 85 87 100 101<br />
Mu<strong>la</strong>........................................ 130 137 141 118 129 114 125 87 144<br />
Murcia..................................... 2.375 2.219 2.259 2.371 2.153 2.307 2.340 2.322 2.323<br />
Ojós ........................................ 9 9 12 9 8 10 6 10 7<br />
Pliego ..................................... 26 30 28 28 31 36 33 21 38<br />
Puerto Lumbreras................... 68 86 84 98 73 87 107 81 87<br />
Ricote ..................................... 25 19 24 28 23 16 10 23 15<br />
San Javier .............................. 88 79 72 73 80 86 100 98 112<br />
San Pedro <strong>de</strong> Pinatar ............. 43 49 61 56 58 61 66 47 58<br />
Santomera.............................. .. .. .. .. .. - 4 48 51<br />
Torre Pacheco........................ 111 96 101 111 104 110 111 111 139<br />
Torres <strong>de</strong> Cotil<strong>la</strong>s (Las) .......... 72 65 77 71 77 73 66 63 59<br />
Totana .................................... 159 182 160 171 173 171 153 128 166<br />
Ulea ........................................ 9 14 10 9 14 7 14 8 9<br />
Unión (La)............................... 90 91 96 99 110 83 96 97 103<br />
Vil<strong>la</strong>nueva <strong>de</strong>l Río Segura...... 16 18 15 18 19 16 4 4 17<br />
Yec<strong>la</strong> ...................................... 196 222 213 217 215 204 233 189 203<br />
Estadísticas Históricas <strong>de</strong> Pob<strong>la</strong>ción <strong>de</strong> <strong>la</strong> Región <strong>de</strong> Murcia.<br />
181
MNP. Datos Municipales. Nacimientos y Defunciones.<br />
4.4. EVOLUCIÓN DE LAS DEFUNCIONES POR LUGAR DE RESIDENCIA DEL FALLECIDO. 1975-<br />
1993. (Conclusión)<br />
182<br />
MUNICIPIOS 1984 1985 1986 1987 1988 1989 1990 1991 1992 1993 (*)<br />
TOTAL .............................. 7.668 7.955 7.779 7.576 7.841 8.408 8.552 8.480 8.264 8.279<br />
Abanil<strong>la</strong>............................. 69 67 60 69 66 81 64 80 64 60<br />
Abarán .............................. 100 112 100 88 98 113 101 121 109 112<br />
Águi<strong>la</strong>s.............................. 166 164 194 179 199 196 208 209 222 180<br />
Albu<strong>de</strong>ite........................... 12 18 18 14 17 15 17 18 15 15<br />
Alcantaril<strong>la</strong> ........................ 191 164 147 184 173 192 217 191 194 200<br />
Alcázares (Los)................. 12 15 22 23 20 27 32 28 28 34<br />
Aledo ................................ 12 11 10 13 10 13 11 9 18 9<br />
Alguazas........................... 55 51 54 53 40 53 48 59 43 56<br />
Alhama <strong>de</strong> Murcia............. 97 138 132 139 136 153 150 123 153 113<br />
Archena ............................ 104 89 102 96 81 106 106 100 98 93<br />
Beniel................................ 27 20 40 32 55 45 36 41 52 34<br />
B<strong>la</strong>nca............................... 39 35 45 49 52 50 61 51 63 39<br />
Bul<strong>la</strong>s................................ 89 85 104 95 86 96 96 104 90 94<br />
Ca<strong>la</strong>sparra ........................ 73 74 76 88 82 96 96 87 83 70<br />
Campos <strong>de</strong>l Rio ................ 7 22 18 11 17 25 22 13 16 26<br />
Caravaca <strong>de</strong> <strong>la</strong> Cruz......... 187 186 172 187 191 185 184 194 191 187<br />
Cartagena......................... 1.306 1.420 1.344 1.312 1.314 1.491 1.472 1.475 1.416 1.452<br />
Cehegín ............................ 128 111 123 95 128 105 145 123 127 150<br />
Ceutí ................................. 34 37 43 33 42 51 34 34 46 46<br />
Cieza................................. 245 249 260 226 232 274 236 264 213 232<br />
Fortuna ............................. 60 40 65 49 50 33 66 48 38 54<br />
Fuente Á<strong>la</strong>mo ................... 98 91 93 73 106 97 86 102 99 62<br />
Jumil<strong>la</strong> .............................. 169 166 186 167 180 157 185 182 184 195<br />
Libril<strong>la</strong> ............................... 27 27 31 38 46 33 34 41 35 35<br />
Lorca................................. 483 533 551 545 565 531 562 532 568 594<br />
Lorquí ............................... 35 30 41 31 25 41 39 40 43 39<br />
Mazarrón........................... 102 113 100 96 106 123 106 105 104 104<br />
Molina <strong>de</strong> Segura.............. 191 191 175 222 185 204 223 198 215 179<br />
Moratal<strong>la</strong>........................... 95 99 86 94 74 96 105 120 86 66<br />
Mu<strong>la</strong>.................................. 126 148 124 91 143 141 143 125 122 148<br />
Murcia............................... 2.347 2.414 2.235 2.214 2.291 2.456 2.519 2.446 2.443 2.453<br />
Ojós .................................. 10 3 4 4 7 11 4 4 6 5<br />
Pliego................................ 28 33 31 39 26 35 27 35 23 35<br />
Puerto Lumbreras............. 78 80 79 87 74 79 87 78 86 97<br />
Ricote ............................... 17 25 21 10 16 15 21 27 12 19<br />
San Javier......................... 111 87 98 73 91 103 119 114 79 116<br />
San Pedro <strong>de</strong> Pinatar ....... 64 86 70 69 78 88 105 97 71 89<br />
Santomera ........................ 51 46 58 65 59 49 60 62 67 49<br />
Torre Pacheco .................. 94 106 110 96 94 108 97 124 107 128<br />
Torres <strong>de</strong> Cotil<strong>la</strong>s (Las) .... 64 80 72 62 78 82 99 100 74 84<br />
Totana............................... 151 161 174 150 163 211 171 187 186 183<br />
Ulea .................................. 15 11 9 10 12 16 9 11 9 11<br />
Unión (La)......................... 92 91 85 89 99 107 107 104 112 82<br />
Vil<strong>la</strong>nueva <strong>de</strong>l Río Segura 8 6 18 20 16 9 17 21 17 20<br />
Yec<strong>la</strong>................................. 199 220 199 196 218 216 225 253 237 230<br />
(*) Datos Provisionales.<br />
Fuente: INE. Movimiento Natural <strong>de</strong> <strong>la</strong> Pob<strong>la</strong>ción<br />
Consejería <strong>de</strong> Economía y Hacienda. Centro Regional <strong>de</strong> Estadística. Movimiento Natural <strong>de</strong> <strong>la</strong> Pob<strong>la</strong>ción <strong>de</strong> <strong>la</strong> Región <strong>de</strong> Murcia<br />
Estadísticas Históricas <strong>de</strong> Pob<strong>la</strong>ción <strong>de</strong> <strong>la</strong> Región <strong>de</strong> Murcia.
MNP. Datos Municipales. Nacimientos y Defunciones.<br />
4.5. EVOLUCIÓN DEL CRECIMIENTO VEGETATIVO POR LUGAR DE RESIDENCIA. 1975- 1993.<br />
(Continúa)<br />
MUNICIPIOS 1975 1976 1977 1978 1979 1980 1981 1982 1983<br />
TOTAL....................................... 10.885 12.206 11.691 11.171 11.270 10.643 9.096 9.088 7.456<br />
Abanil<strong>la</strong>...................................... 39 34 42 16 17 45 34 9 -5<br />
Abarán....................................... 109 119 87 115 127 109 114 83 51<br />
Águi<strong>la</strong>s....................................... 252 295 278 294 265 220 288 249 149<br />
Albu<strong>de</strong>ite ................................... 20 33 7 20 14 23 34 2 15<br />
Alcantaril<strong>la</strong>................................. 364 449 459 413 371 376 320 324 252<br />
Alcázares (Los) ........................ .. .. .. .. .. .. .. .. ..<br />
Aledo ......................................... - 7 12 11 -5 7 6 6 1<br />
Alguazas.................................... 52 79 72 60 85 98 76 56 71<br />
Alhama <strong>de</strong> Murcia ..................... 156 134 108 137 123 131 83 91 70<br />
Archena ..................................... 145 214 193 203 178 148 137 156 135<br />
Beniel ........................................ 69 86 95 93 96 96 92 70 68<br />
B<strong>la</strong>nca ....................................... 43 35 70 40 49 42 51 52 55<br />
Bul<strong>la</strong>s......................................... 74 66 55 96 93 58 79 73 15<br />
Ca<strong>la</strong>sparra................................. 65 77 49 48 61 69 59 73 33<br />
Campos <strong>de</strong>l Río......................... 24 14 14 12 18 17 28 20 1<br />
Caravaca <strong>de</strong> <strong>la</strong> Cruz.................. 179 145 193 129 141 120 72 78 93<br />
Cartagena.................................. 2.082 2.256 2.240 2.050 1.954 1.787 1.618 1.452 1.377<br />
Cehegín..................................... 82 114 126 88 78 82 72 111 56<br />
Ceutí.......................................... 69 68 95 63 114 100 54 71 57<br />
Cieza ......................................... 349 340 274 341 290 287 264 288 189<br />
Fortuna ...................................... 102 76 88 47 59 83 77 94 61<br />
Fuente-Á<strong>la</strong>mo............................ 63 69 31 13 30 61 41 18 52<br />
Jumil<strong>la</strong> ....................................... 182 240 202 210 213 224 196 180 85<br />
Libril<strong>la</strong>........................................ 55 33 30 8 41 16 9 12 29<br />
Lorca ......................................... 671 756 670 628 678 648 507 467 373<br />
Lorquí ........................................ 70 76 78 66 74 85 52 75 50<br />
Mazarrón ................................... 57 154 133 112 142 128 129 129 158<br />
Molina <strong>de</strong> Segura ...................... 445 479 523 488 540 522 408 503 489<br />
Moratal<strong>la</strong>.................................... 74 69 68 55 52 61 49 42 30<br />
Mu<strong>la</strong>........................................... 87 105 105 122 121 119 115 98 89<br />
Murcia........................................ 3.556 4.157 3.983 3.735 3.850 3.511 2.861 2.940 2.268<br />
Ojós ........................................... -4 2 -2 14 5 10 16 2 3<br />
Pliego ........................................ 37 36 24 37 30 11 20 31 7<br />
Puerto Lumbreras...................... 77 60 74 54 76 40 41 14 45<br />
Ricote ........................................ 5 13 -1 -3 3 -2 8 - -2<br />
San Javier ................................. 123 178 142 186 131 132 141 142 120<br />
San Pedro <strong>de</strong>l Pinatar ............... 126 125 101 147 114 139 105 142 133<br />
Santomera................................. .. .. .. .. .. 1 7 27 57<br />
Torre-Pacheco........................... 198 222 195 220 211 236 153 167 142<br />
Torres <strong>de</strong> Cotil<strong>la</strong>s (Las) ............. 148 186 168 163 193 184 194 172 151<br />
Totana ....................................... 203 197 193 194 177 175 195 172 91<br />
Ulea ........................................... 18 4 4 10 7 6 6 2 -<br />
Unión (La).................................. 141 142 177 163 165 164 127 137 141<br />
Vil<strong>la</strong>nueva <strong>de</strong>l Río Segura......... 18 12 12 12 -3 1 - -4 4<br />
Yec<strong>la</strong> ......................................... 260 250 224 261 292 273 158 262 197<br />
Estadísticas Históricas <strong>de</strong> Pob<strong>la</strong>ción <strong>de</strong> <strong>la</strong> Región <strong>de</strong> Murcia.<br />
183
MNP. Datos Municipales. Nacimientos y Defunciones.<br />
4.5. EVOLUCIÓN DEL CRECIMIENTO VEGETATIVO POR LUGAR DE RESIDENCIA. 1975- 1993.<br />
(Conclusión)<br />
184<br />
MUNICIPIOS 1984 1985 1986 1987 1988 1989 1990 1991 1992 1993 (*)<br />
TOTAL .................................. 7.194 6.591 6.179 6.420 6.138 5.584 5.317 5.310 5.506 4.956<br />
Abanil<strong>la</strong>................................. 11 8 33 7 10 -7 3 -12 8 6<br />
Abarán .................................. 64 49 48 54 59 32 31 37 31 40<br />
Águi<strong>la</strong>s.................................. 184 202 146 183 135 133 109 124 100 120<br />
Albu<strong>de</strong>ite............................... 10 -4 4 9 9 -1 7 - 3 7<br />
Alcantaril<strong>la</strong> ............................ 255 295 275 252 271 281 205 247 222 260<br />
Alcázares (Los)..................... 6 11 13 9 22 45 34 38 35 37<br />
Aledo .................................... -10 -2 2 -5 -4 -5 -2 -6 -12 1<br />
Alguazas............................... 52 30 34 37 55 33 29 18 39 39<br />
Alhama <strong>de</strong> Murcia................. 88 68 45 32 34 -8 1 31 -3 37<br />
Archena ................................ 92 112 96 111 120 72 78 72 98 77<br />
Beniel.................................... 73 86 63 69 57 72 73 65 60 79<br />
B<strong>la</strong>nca................................... 46 31 8 10 37 8 -11 8 2 31<br />
Bul<strong>la</strong>s.................................... 33 56 13 29 53 50 36 29 64 32<br />
Ca<strong>la</strong>sparra ............................ 56 40 39 18 30 4 5 32 31 37<br />
Campos <strong>de</strong>l Río.................... 34 11 3 12 17 17 6 16 11 1<br />
Caravaca <strong>de</strong> <strong>la</strong> Cruz............. 77 72 68 84 91 79 64 80 98 58<br />
Cartagena............................. 1.230 1.106 954 1.009 908 723 746 636 704 565<br />
Cehegín ................................ 72 71 31 62 26 32 3 29 24 13<br />
Ceutí ..................................... 65 39 43 63 59 49 53 59 43 47<br />
Cieza..................................... 194 191 148 190 186 179 210 180 251 160<br />
Fortuna ................................. 43 61 23 62 39 44 19 45 30 44<br />
Fuente-Á<strong>la</strong>mo ....................... 16 12 30 45 10 26 29 10 24 26<br />
Jumil<strong>la</strong> .................................. 131 138 125 77 82 90 71 85 63 62<br />
Libril<strong>la</strong> ................................... 17 22 10 8 -2 10 8 3 9 4<br />
Lorca..................................... 456 403 275 326 215 303 257 285 212 186<br />
Lorquí ................................... 51 55 42 55 50 33 39 17 20 31<br />
Mazarrón............................... 133 112 118 137 120 98 105 105 78 99<br />
Molina <strong>de</strong> Segura.................. 341 354 356 309 338 343 320 310 322 369<br />
Moratal<strong>la</strong>............................... 12 14 13 19 29 -2 - -36 2 16<br />
Mu<strong>la</strong>...................................... 49 16 45 84 45 24 29 29 30 19<br />
Murcia................................... 2.253 2.033 2.139 2.048 2.046 1.949 1.895 1.990 2.051 1728<br />
Ojós ...................................... -4 7 4 1 -2 -4 5 3 -2 -<br />
Pliego.................................... 24 8 8 13 7 10 1 5 9 -1<br />
Puerto Lumbreras................. 43 42 37 19 67 17 34 63 24 12<br />
Ricote ................................... 3 -5 - 6 1 -4 -8 -11 1 -5<br />
San Javier............................. 108 99 115 156 163 122 131 105 141 83<br />
San Pedro <strong>de</strong>l Pinatar........... 113 87 133 132 138 112 90 125 132 118<br />
Santomera ............................ 53 70 42 44 70 70 79 72 54 75<br />
Torre-Pacheco...................... 175 137 144 151 137 158 158 102 137 109<br />
Torres <strong>de</strong> Cotil<strong>la</strong>s (Las) ........ 103 118 127 137 131 117 92 86 120 117<br />
Totana................................... 136 81 72 48 53 29 33 47 61 9<br />
Ulea ...................................... -2 - -1 - -5 -9 2 -2 -1 -5<br />
Unión (La)............................. 138 131 109 129 92 89 99 85 50 86<br />
Vil<strong>la</strong>nueva <strong>de</strong>l Río Segura .... - 11 -6 -7 -9 3 -8 -8 - -13<br />
Yec<strong>la</strong>..................................... 170 113 153 186 148 168 157 112 130 140<br />
(*) Datos Provisionales.<br />
Fuente: INE. Movimiento Natural <strong>de</strong> <strong>la</strong> Pob<strong>la</strong>ción<br />
Consejería <strong>de</strong> Economía y Hacienda. Centro Regional <strong>de</strong> Estadística.<br />
Estadísticas Históricas <strong>de</strong> Pob<strong>la</strong>ción <strong>de</strong> <strong>la</strong> Región <strong>de</strong> Murcia.
MNP. Datos Municipales. Partos.<br />
4.6. EVOLUCIÓN DE LOS PARTOS POR LUGAR DE RESIDENCIA DE LA MADRE. 1975-<br />
1993.(Continúa)<br />
MUNICIPIOS 1975 1976 1977 1978 1979 1980 1981 1982 1983<br />
Abarán.................................... .. .. .. .. .. 211 209 187 163<br />
Águi<strong>la</strong>s.................................... .. .. .. .. .. 425 460 412 354<br />
Alcantaril<strong>la</strong>.............................. .. 598 595 581 528 526 470 462 424<br />
Alhama <strong>de</strong> Murcia .................. .. .. .. .. .. 249 195 209 195<br />
Archena .................................. .. .. .. .. .. 229 234 231 224<br />
Bul<strong>la</strong>s...................................... .. .. .. .. .. .. .. .. ..<br />
Caravaca <strong>de</strong> <strong>la</strong> Cruz............... .. .. .. .. .. 297 302 267 290<br />
Cartagena............................... 3.391 3.551 3.505 3.395 3.300 3.122 2.914 2.783 2.685<br />
Cehegín.................................. .. .. .. .. .. 195 187 204 189<br />
Cieza ...................................... 601 581 512 581 534 564 485 503 431<br />
Jumil<strong>la</strong> .................................... 356 405 388 379 409 379 371 363 266<br />
Lorca ...................................... 1.171 1.267 1.185 1.234 1.208 1.151 1.032 993 952<br />
Mazarrón ................................ .. .. .. .. .. 678 229 236 250<br />
Molina <strong>de</strong> Segura ................... 610 628 672 662 707 147 568 653 642<br />
Moratal<strong>la</strong>................................. .. .. .. .. .. .. .. .. ..<br />
Mu<strong>la</strong>........................................ .. .. .. .. .. 234 241 185 232<br />
Murcia..................................... 5.946 6.372 6.260 6.097 6.012 5.800 5.199 5.205 4.580<br />
San Javier .............................. .. .. .. .. .. 218 242 238 232<br />
San Pedro <strong>de</strong> Pinatar ............. .. .. .. .. .. .. .. .. ..<br />
Torre Pacheco........................ .. .. .. .. .. 339 264 275 283<br />
Torres <strong>de</strong> Cotil<strong>la</strong>s (Las) .......... .. .. .. .. .. .. 260 234 208<br />
Totana .................................... .. .. .. .. .. 343 346 298 256<br />
Unión (La)............................... .. .. .. .. .. 246 220 225 243<br />
Yec<strong>la</strong> ...................................... 461 474 438 478 506 475 391 453 398<br />
Estadísticas Históricas <strong>de</strong> Pob<strong>la</strong>ción <strong>de</strong> <strong>la</strong> Región <strong>de</strong> Murcia.<br />
185
MNP. Datos Municipales. Partos.<br />
4.6. EVOLUCIÓN DE LOS PARTOS POR LUGAR DE RESIDENCIA DE LA MADRE. 1975-<br />
1993.(Conclusión)<br />
186<br />
MUNICIPIOS 1984 1985 1986 1987 1988 1989 1990 1991 1992 1993 (*)<br />
Abarán .................................. 165 160 150 141 157 146 132 158 141 150<br />
Águi<strong>la</strong>s.................................. 347 367 340 361 335 326 319 332 320 300<br />
Alcantaril<strong>la</strong> ............................ 443 457 422 437 446 471 424 433 414 459<br />
Alhama <strong>de</strong> Murcia................. 184 205 175 170 168 146 151 154 148 149<br />
Archena ................................ 195 201 195 208 201 178 184 171 194 169<br />
Bul<strong>la</strong>s.................................... .. .. 118 124 139 144 129 131 151 124<br />
Caravaca <strong>de</strong> <strong>la</strong> Cruz............. 263 258 240 269 283 260 248 273 286 243<br />
Cartagena............................. 2.558 2.535 2.299 2.312 2.221 2.190 2.199 2.106 2.098 1.999<br />
Cehegín ................................ 202 181 153 156 153 134 146 153 150 160<br />
Cieza..................................... 437 440 406 416 416 448 448 444 462 387<br />
Jumil<strong>la</strong> .................................. 300 304 310 244 262 246 257 263 244 254<br />
Lorca..................................... 939 936 825 870 788 835 818 815 777 776<br />
Mazarrón............................... 234 224 216 233 225 222 210 209 184 199<br />
Molina <strong>de</strong> Segura.................. 529 547 528 527 523 544 543 506 537 544<br />
Moratal<strong>la</strong>............................... .. .. 99 113 102 93 103 .. .. 82<br />
Mu<strong>la</strong>...................................... 177 166 168 174 190 162 172 154 153 166<br />
Murcia................................... 4.600 4.437 4.365 4.243 4.323 4.380 4.397 4.407 4.465 4.157<br />
San Javier............................. 219 185 212 229 254 220 249 217 219 196<br />
San Pedro <strong>de</strong> Pinatar ........... .. .. 203 197 216 200 194 218 202 204<br />
Torre Pacheco ...................... 259 241 253 243 229 263 257 224 241 233<br />
Torres <strong>de</strong> Cotil<strong>la</strong>s (Las) ........ 166 197 199 198 210 196 192 184 195 197<br />
Totana................................... 288 243 242 197 215 236 205 232 245 190<br />
Unión (La)............................. 228 222 196 222 192 195 204 189 162 164<br />
Yec<strong>la</strong>..................................... 368 331 352 381 371 386 383 363 366 368<br />
Nota: Hasta 1979 sólo hay datos para los municipios mayores <strong>de</strong> 20.000 habitantes. A partir <strong>de</strong> 1980 para los municipios mayores <strong>de</strong> 10.000 habitantes.<br />
(*) Datos Provisionales.<br />
Fuente: INE. Movimiento Natural <strong>de</strong> <strong>la</strong> Pob<strong>la</strong>ción<br />
Consejería <strong>de</strong> Economía y Hacienda. Centro Regional <strong>de</strong> Estadística. Movimiento Natural <strong>de</strong> <strong>la</strong> Pob<strong>la</strong>ción <strong>de</strong> <strong>la</strong> Región <strong>de</strong> Murcia<br />
Estadísticas Históricas <strong>de</strong> Pob<strong>la</strong>ción <strong>de</strong> <strong>la</strong> Región <strong>de</strong> Murcia.
MNP. Datos Municipales. Muertes Fetales Tardías.<br />
4.7. EVOLUCIÓN DE LAS MUERTES FETALES TARDÍAS POR LUGAR DE RESIDENCIA DE LA<br />
MADRE. 1975-1993.(Continúa)<br />
MUNICIPIOS 1975 1976 1977 1978 1979 1980 1981 1982 1983<br />
TOTAL....................................... 183 193 188 172 162 114 93 81 77<br />
Abanil<strong>la</strong>...................................... - - 3 - 2 - - - -<br />
Abarán....................................... 2 3 1 2 - - 1 - -<br />
Águi<strong>la</strong>s....................................... 2 8 3 2 6 4 3 1 2<br />
Albu<strong>de</strong>ite ................................... - - 1 - - 1 - - -<br />
Alcantaril<strong>la</strong>................................. 3 7 3 9 2 4 3 - 1<br />
Alcázares (Los) ......................... .. .. .. .. .. .. .. .. ..<br />
Aledo ......................................... 1 - - 1 - - - - -<br />
Alguazas.................................... - 4 - - - 1 - - -<br />
Alhama <strong>de</strong> Murcia ..................... 2 3 - 5 3 - 1 - 1<br />
Archena ..................................... 2 3 3 2 2 2 - - 1<br />
Beniel ........................................ 1 2 - - 1 - - - -<br />
B<strong>la</strong>nca ....................................... - - 2 1 1 1 - - 1<br />
Bul<strong>la</strong>s......................................... 1 2 1 1 2 - - 3 1<br />
Ca<strong>la</strong>sparra................................. - 2 2 1 3 - - - -<br />
Campos <strong>de</strong>l Río......................... - 1 - - 2 - - - -<br />
Caravaca <strong>de</strong> <strong>la</strong> Cruz.................. 4 4 8 2 1 1 2 2 1<br />
Cartagena.................................. 38 35 42 41 37 25 16 29 21<br />
Cehegín..................................... 1 2 3 4 4 1 - - -<br />
Ceutí.......................................... 2 2 2 - - - - - 1<br />
Cieza ......................................... 3 6 9 3 3 3 3 - 1<br />
Fortuna ...................................... 4 2 1 3 - - 1 3 1<br />
Fuente Á<strong>la</strong>mo ............................ - 2 2 1 - 1 - 1 -<br />
Jumil<strong>la</strong> ....................................... 8 4 4 4 5 2 3 3 2<br />
Libril<strong>la</strong>........................................ 1 - - - - 1 - - -<br />
Lorca ......................................... 7 11 8 12 8 12 6 2 8<br />
Lorquí ........................................ - 1 - - - 2 2 - -<br />
Mazarrón ................................... 1 1 2 3 2 - 2 1 -<br />
Molina <strong>de</strong> Segura ...................... 4 5 4 3 4 - 3 - 3<br />
Moratal<strong>la</strong>.................................... - 1 2 4 2 1 2 - -<br />
Mu<strong>la</strong>........................................... - 2 1 3 - 4 2 1 -<br />
Murcia........................................ 72 52 58 44 54 37 33 24 25<br />
Ojós ........................................... - - - - - - - - -<br />
Pliego ........................................ 1 2 - - - - - - -<br />
Puerto Lumbreras...................... 1 1 3 2 - - - 2 -<br />
Ricote ........................................ - - - - - - - - -<br />
San Javier ................................. 2 3 3 5 2 2 2 1 1<br />
San Pedro <strong>de</strong> Pinatar ................ - - 1 - 4 1 2 1 1<br />
Santomera................................. .. .. .. .. .. - - 1 -<br />
Torre Pacheco........................... 5 5 - 4 1 3 1 1 2<br />
Torres <strong>de</strong> Cotil<strong>la</strong>s (Las) ............. 1 2 1 2 2 - 1 1 -<br />
Totana ....................................... 4 4 5 2 2 1 2 - 1<br />
Ulea ........................................... - - - - - - - - -<br />
Unión (La).................................. 2 3 4 1 1 1 - 1 2<br />
Vil<strong>la</strong>nueva <strong>de</strong>l Río Segura......... - 2 - - - - - - -<br />
Yec<strong>la</strong> ......................................... 8 6 6 5 6 3 2 3 -<br />
Estadísticas Históricas <strong>de</strong> Pob<strong>la</strong>ción <strong>de</strong> <strong>la</strong> Región <strong>de</strong> Murcia. 187
MNP. Datos Municipales. Muertes Fetales Tardías.<br />
4.7. EVOLUCIÓN DE LAS MUERTES FETALES TARDÍAS POR LUGAR DE RESIDENCIA DE LA<br />
MADRE. 1975-1993.(Continúa)<br />
MUNICIPIOS 1984 1985 1986 1987 1988 1989 1990 1991 1992 1993(*)<br />
TOTAL .................................. 106 103 84 67 82 58 77 70 63 50<br />
Abanil<strong>la</strong>................................. - - 1 - - 1 - - - -<br />
Abarán .................................. 2 1 2 - - 2 - 1 2 -<br />
Águi<strong>la</strong>s.................................. - 3 2 - 4 - 5 4 - 3<br />
Albu<strong>de</strong>ite............................... 1 - - - - - - - - -<br />
Alcantaril<strong>la</strong> ............................ - 1 4 2 3 1 4 3 4 2<br />
Alcázares (Los)..................... - - - - 2 - - - - -<br />
Aledo .................................... - - - - - - - - - -<br />
Alguazas............................... - - 1 - - - - - - -<br />
Alhama <strong>de</strong> Murcia................. - 1 2 1 - 2 1 1 - -<br />
Archena ................................ 1 1 - 2 - 1 - 1 1 -<br />
Beniel.................................... - - - - - - - - - -<br />
B<strong>la</strong>nca................................... 1 1 2 1 - - 1 - - -<br />
Bul<strong>la</strong>s.................................... 2 1 1 - 1 - - - - -<br />
Ca<strong>la</strong>sparra ............................ - 1 - - - 1 1 1 - -<br />
Campos <strong>de</strong>l Río.................... 1 - 1 - - - 1 - - -<br />
Caravaca <strong>de</strong> <strong>la</strong> Cruz............. 1 - 1 - 2 1 1 - - 2<br />
Cartagena............................. 34 35 14 15 11 - 8 16 8 9<br />
Cehegín ................................ 2 - 1 1 - - - 1 - -<br />
Ceutí ..................................... - - - - 1 - - 1 1 1<br />
Cieza..................................... 3 3 3 3 - - 2 2 3 -<br />
Fortuna ................................. - 3 - - - - - 1 1 -<br />
Fuente Á<strong>la</strong>mo ....................... 2 - 1 1 1 - - - - -<br />
Jumil<strong>la</strong> .................................. 3 2 2 2 1 1 1 2 - -<br />
Libril<strong>la</strong> ................................... 1 - - - - - - - - -<br />
Lorca..................................... 3 4 4 8 12 6 7 6 3 3<br />
Lorquí ................................... 1 - 1 1 - - - - - -<br />
Mazarrón............................... 1 - - - - 5 1 - 2 -<br />
Molina <strong>de</strong> Segura.................. - 3 1 1 2 5 5 - 1 1<br />
Moratal<strong>la</strong>............................... - - - - - - - - - -<br />
Mu<strong>la</strong>...................................... 2 2 - 1 2 - 1 - 1 1<br />
Murcia................................... 34 29 35 20 27 24 27 24 26 20<br />
Ojós ...................................... - - - - - - - - - -<br />
Pliego.................................... 1 - - - 1 - - - 1 1<br />
Puerto Lumbreras................. - - - 1 - 1 1 - - 1<br />
Ricote ................................... - 1 - - 1 1 - - - -<br />
San Javier............................. 1 1 1 - - - - - 2 -<br />
San Pedro <strong>de</strong> Pinatar ........... 2 1 - - - - - - 1 1<br />
Santomera ............................ 1 1 - - - 1 2 - 1 -<br />
Torre Pacheco ...................... 1 - - - - - 2 1 1 1<br />
Torres <strong>de</strong> Cotil<strong>la</strong>s (Las) ........ - - - - 1 - 1 2 1 -<br />
Totana................................... 1 2 - - 1 1 1 1 - 1<br />
Ulea ...................................... - - - - - - - - - -<br />
Unión (La)............................. 2 5 2 4 3 - 1 2 1 -<br />
Vil<strong>la</strong>nueva <strong>de</strong>l Río Segura .... - - - - - 1 - - - -<br />
Yec<strong>la</strong>..................................... 2 1 2 3 6 3 3 - 2 3<br />
(*) Datos Provisionales.<br />
Fuente: INE. Movimiento Natural <strong>de</strong> <strong>la</strong> Pob<strong>la</strong>ción<br />
Consejería <strong>de</strong> Economía y Hacienda. Centro Regional <strong>de</strong> Estadística. Movimiento Natural <strong>de</strong> <strong>la</strong> Pob<strong>la</strong>ción <strong>de</strong> <strong>la</strong> Región <strong>de</strong> Murcia<br />
188 Estadísticas Históricas <strong>de</strong> Pob<strong>la</strong>ción <strong>de</strong> <strong>la</strong> Región <strong>de</strong> Murcia.
MNP. Datos Municipales. Matrimonios.<br />
4.8.1. EVOLUCIÓN DE LOS MATRIMONIOS POR LUGAR DE CELEBRACIÓN. 1886-1892.<br />
MUNICIPIOS 1886 1887 1888 1889 1890 1891 1892<br />
Abanil<strong>la</strong>................................. 63 34 35 55 53 55 75<br />
Águi<strong>la</strong>s.................................. 57 38 75 140 109 244 109<br />
Alhama <strong>de</strong> Murcia ................ 49 37 54 76 86 100 78<br />
Bul<strong>la</strong>s.................................... 13 7 19 51 77 100 77<br />
Ca<strong>la</strong>sparra............................ 14 3 3 26 103 55 66<br />
Caravaca <strong>de</strong> <strong>la</strong> Cruz............. 22 22 24 129 139 163 195<br />
Cartagena............................. 483 498 499 622 902 931 928<br />
Cehegín................................ 8 11 14 65 97 134 115<br />
Cieza .................................... 46 30 39 112 129 140 127<br />
Fortuna ................................. 8 4 9 57 82 104 84<br />
Fuente Á<strong>la</strong>mo ....................... 96 75 83 78 98 139 114<br />
Jumil<strong>la</strong> .................................. 99 84 93 180 184 186 122<br />
Lorca .................................... 344 243 302 662 648 794 738<br />
Mazarrón .............................. 99 81 110 169 173 230 228<br />
Molina <strong>de</strong> Segura ................. 20 12 17 59 69 73 68<br />
Moratal<strong>la</strong>............................... 3 1 4 59 15 149 123<br />
Mu<strong>la</strong>...................................... 31 21 20 102 99 126 151<br />
Murcia................................... 357 204 247 768 836 791 790<br />
Torre Pacheco...................... 49 44 86 84 92 109 97<br />
Totana .................................. 93 67 46 140 102 132 154<br />
Unión (La)............................. 193 190 213 220 212 264 243<br />
Yec<strong>la</strong> .................................... 203 135 156 211 187 235 170<br />
Nota: Sólo hay datos para los municipios mayores <strong>de</strong> 5.000 habitantes.<br />
Fuente: INE. Movimiento Natural <strong>de</strong> <strong>la</strong> Pob<strong>la</strong>ción.<br />
Estadísticas Históricas <strong>de</strong> Pob<strong>la</strong>ción <strong>de</strong> <strong>la</strong> Región <strong>de</strong> Murcia.<br />
189
MNP. Datos Municipales. Matrimonios.<br />
4.8.2. EVOLUCIÓN DE LOS MATRIMONIOS POR LUGAR DE CELEBRACIÓN. 1900-1933. (Continúa)<br />
190<br />
MUNICIPIOS 1900 1901 1902 1903 1904 1905 1906 1907<br />
Águi<strong>la</strong>s...................................... 117 119 139 117 137 115 110 123<br />
Caravaca <strong>de</strong> <strong>la</strong> Cruz................. 141 119 155 136 138 129 116 135<br />
Cartagena................................. 904 849 887 792 734 709 722 758<br />
Cehegín .................................... 86 125 110 129 87 88 94 102<br />
Cieza......................................... 116 136 122 115 99 113 102 95<br />
Fuente Á<strong>la</strong>mo ........................... .. .. .. .. .. .. .. ..<br />
Jumil<strong>la</strong> ...................................... 138 156 142 141 125 99 109 124<br />
Lorca......................................... 609 592 642 543 507 502 412 475<br />
Mazarrón................................... 234 217 256 192 180 208 204 229<br />
Molina <strong>de</strong> Segura...................... .. .. .. .. .. .. .. ..<br />
Moratal<strong>la</strong>................................... 125 101 89 78 88 95 98 106<br />
Mu<strong>la</strong>.......................................... 100 105 120 104 97 110 84 98<br />
Murcia....................................... 586 719 672 557 597 616 552 720<br />
Totana....................................... 118 109 117 87 97 109 93 109<br />
Unión (La)................................. 277 295 215 221 238 250 296 258<br />
Yec<strong>la</strong>......................................... 154 181 162 163 131 152 149 148<br />
4.8.2. EVOLUCIÓN DE LOS MATRIMONIOS POR LUGAR DE CELEBRACIÓN. 1900-1933. (Continúa)<br />
MUNICIPIOS 1908 1909 1910 1911 1912 1913 1914 1915<br />
Águi<strong>la</strong>s...................................... 100 108 118 124 155 254 122 111<br />
Caravaca <strong>de</strong> <strong>la</strong> Cruz................. 121 120 130 144 137 99 129 109<br />
Cartagena................................. 723 832 722 710 678 675 619 670<br />
Cehegín .................................... 104 95 106 84 86 116 69 97<br />
Cieza......................................... 108 90 129 116 107 123 99 97<br />
Fuente Á<strong>la</strong>mo ........................... .. .. .. 78 88 70 68 44<br />
Jumil<strong>la</strong> ...................................... 141 106 117 134 122 109 132 120<br />
Lorca......................................... 501 517 519 524 488 513 471 430<br />
Mazarrón................................... 162 172 151 151 201 170 162 158<br />
Molina <strong>de</strong> Segura...................... .. .. .. 46 66 95 60 80<br />
Moratal<strong>la</strong>................................... 87 91 92 96 112 94 79 98<br />
Mu<strong>la</strong>.......................................... 97 109 77 90 80 96 68 68<br />
Murcia....................................... 629 545 519 562 814 834 776 622<br />
Totana....................................... 86 102 76 103 103 100 108 65<br />
Unión (La)................................. 200 230 173 212 272 329 216 168<br />
Yec<strong>la</strong>......................................... 137 123 148 166 148 162 170 174<br />
Estadísticas Históricas <strong>de</strong> Pob<strong>la</strong>ción <strong>de</strong> <strong>la</strong> Región <strong>de</strong> Murcia.
MNP. Datos Municipales. Matrimonios.<br />
4.8.2. EVOLUCIÓN DE LOS MATRIMONIOS POR LUGAR DE CELEBRACIÓN. 1900-1933. (Continúa)<br />
MUNICIPIOS 1916 1917 1918 1919 1920 1921 1922 1923 1924<br />
Águi<strong>la</strong>s....................................... 97 126 .. 142 163 148 180 133 127<br />
Caravaca <strong>de</strong> <strong>la</strong> Cruz.................. 135 125 .. 212 191 155 162 149 157<br />
Cartagena.................................. 659 802 .. 370 748 698 794 639 732<br />
Cehegín..................................... 96 123 .. 142 150 135 113 105 141<br />
Cieza ......................................... 119 138 .. 144 171 163 147 154 152<br />
Fuente Á<strong>la</strong>mo ............................ 95 109 .. 90 89 86 98 70 135<br />
Jumil<strong>la</strong> ....................................... 150 170 .. 136 167 171 156 159 146<br />
Lorca ......................................... 578 572 .. 703 665 552 591 570 674<br />
Mazarrón ................................... 176 196 .. 171 174 197 163 160 188<br />
Molina <strong>de</strong> Segura ...................... 85 75 .. 120 117 78 97 97 94<br />
Moratal<strong>la</strong>.................................... 110 93 .. 130 156 128 123 129 107<br />
Mu<strong>la</strong>........................................... 91 107 .. 125 152 129 105 105 155<br />
Murcia........................................ 731 733 855 1.243 1.439 1.272 1.314 1.324 1.290<br />
Totana ....................................... 108 113 .. 148 119 118 125 84 114<br />
Unión (La).................................. 227 231 .. 203 212 144 130 167 156<br />
Yec<strong>la</strong> ......................................... 202 210 .. 238 241 211 196 213 212<br />
4.8.2. EVOLUCIÓN DE LOS MATRIMONIOS POR LUGAR DE CELEBRACIÓN. 1900-1933. (Conclusión)<br />
MUNICIPIOS 1925 1926 1927 1928 1929 1930 1931 1932 1933<br />
Águi<strong>la</strong>s....................................... 137 124 123 146 138 128 102 120 120<br />
Caravaca <strong>de</strong> <strong>la</strong> Cruz.................. 152 146 145 156 140 130 128 88 94<br />
Cartagena.................................. 801 861 829 764 831 866 792 702 664<br />
Cehegín..................................... 136 129 106 123 128 103 92 63 53<br />
Cieza ......................................... 141 127 117 132 150 134 129 100 86<br />
Fuente Á<strong>la</strong>mo ............................ 97 45 72 87 74 86 .. .. ..<br />
Jumil<strong>la</strong> ....................................... 148 149 168 170 147 149 146 85 90<br />
Lorca ......................................... 626 533 543 533 600 544 444 320 265<br />
Mazarrón ................................... 160 138 118 107 78 57 124 93 112<br />
Molina <strong>de</strong> Segura ...................... 94 98 83 88 92 98 96 45 51<br />
Moratal<strong>la</strong>.................................... 133 114 96 121 164 117 79 72 61<br />
Mu<strong>la</strong>........................................... 133 92 93 102 99 101 91 74 79<br />
Murcia........................................ 1.170 1.190 1.090 1.113 1.426 1.287 1.262 1.037 735<br />
Totana ....................................... 126 98 83 96 114 94 98 95 98<br />
Unión (La).................................. 189 193 119 136 131 127 97 69 83<br />
Yec<strong>la</strong> ......................................... 195 219 210 175 204 189 199 137 133<br />
Nota: Sólo hay datos para los municipios mayores <strong>de</strong> 10.000 habitantes. De 1934 a 1940 no se publican datos a nivel municipal.<br />
Fuente: INE. Movimiento Natural <strong>de</strong> <strong>la</strong> Pob<strong>la</strong>ción.<br />
Estadísticas Históricas <strong>de</strong> Pob<strong>la</strong>ción <strong>de</strong> <strong>la</strong> Región <strong>de</strong> Murcia.<br />
191
MNP. Datos Municipales. Matrimonios.<br />
4.8.3. EVOLUCIÓN DE LOS MATRIMONIOS POR LUGAR DE CELEBRACIÓN. 1941-1974. (Continúa)<br />
192<br />
MUNICIPIOS 1941 1942 1943 1944 1945 1946 1947 1948 1949<br />
Caravaca <strong>de</strong> <strong>la</strong> Cruz.................. 145 147 118 159 169 157 242 188 163<br />
Cartagena.................................. 680 808 869 847 974 991 1.010 1.099 899<br />
Cieza.......................................... 133 90 115 108 140 157 222 160 158<br />
Jumil<strong>la</strong> ....................................... 101 110 115 103 145 154 225 150 138<br />
Lorca.......................................... 413 330 316 406 679 657 716 641 554<br />
Molina <strong>de</strong> Segura....................... .. .. .. .. .. .. .. .. ..<br />
Murcia........................................ 1.160 1.551 1.378 1.693 1.958 1.811 2.191 2.031 1.827<br />
Yec<strong>la</strong>.......................................... 160 137 127 138 158 218 231 201 193<br />
4.8.3. EVOLUCIÓN DE LOS MATRIMONIOS POR LUGAR DE CELEBRACIÓN. 1941-1974. (Continúa)<br />
MUNICIPIOS 1950 1951 1952 1953 1954 1955 1956 1957 1958<br />
Caravaca <strong>de</strong> <strong>la</strong> Cruz.................. 211 212 205 194 218 211 235 220 217<br />
Cartagena.................................. 990 964 953 1.016 1.104 1.081 1.252 1.198 1.133<br />
Cieza.......................................... 166 170 164 149 192 210 292 259 251<br />
Jumil<strong>la</strong> ....................................... 165 209 174 255 190 182 199 176 217<br />
Lorca.......................................... 668 532 616 547 682 886 682 587 714<br />
Molina <strong>de</strong> Segura....................... .. .. .. .. .. .. .. .. ..<br />
Murcia........................................ 1.906 2.036 2.063 1.975 1.981 2.025 2.227 2.237 2.236<br />
Yec<strong>la</strong>.......................................... 184 163 216 191 186 198 256 224 222<br />
4.8.3. EVOLUCIÓN DE LOS MATRIMONIOS POR LUGAR DE CELEBRACIÓN. 1941-1974. (Continúa)<br />
MUNICIPIOS 1959 1960 1961 1962 1963 1964 1965 1966 1967<br />
Caravaca <strong>de</strong> <strong>la</strong> Cruz.................. 210 180 148 169 180 158 138 140 135<br />
Cartagena.................................. 1.045 997 1.064 1.030 1.135 1.048 1.065 1.091 981<br />
Cieza.......................................... 218 191 203 236 278 237 192 177 212<br />
Jumil<strong>la</strong> ....................................... 160 162 157 142 128 162 134 137 162<br />
Lorca.......................................... 690 545 557 621 548 550 522 518 517<br />
Molina <strong>de</strong> Segura....................... .. .. .. .. .. .. .. .. ..<br />
Murcia........................................ 2.075 1.916 2.021 2085 2.188 2.143 2.138 2.048 2.075<br />
Yec<strong>la</strong>.......................................... 197 177 200 178 121 161 139 122 122<br />
Estadísticas Históricas <strong>de</strong> Pob<strong>la</strong>ción <strong>de</strong> <strong>la</strong> Región <strong>de</strong> Murcia.
MNP. Datos Municipales. Matrimonios.<br />
4.8.3. EVOLUCIÓN DE LOS MATRIMONIOS POR LUGAR DE CELEBRACIÓN. 1941-1974. (Conclusión)<br />
MUNICIPIOS 1968 1969 1970 1971 1972 1973 1974<br />
Caravaca <strong>de</strong> <strong>la</strong> Cruz............. 125 114 143 .. .. .. ..<br />
Cartagena............................. 940 1.021 1.047 1.038 1.072 1.180 1.176<br />
Cieza .................................... 182 190 205 204 194 200 204<br />
Jumil<strong>la</strong> .................................. 104 128 127 126 135 134 134<br />
Lorca .................................... 477 508 496 482 490 528 466<br />
Molina <strong>de</strong> Segura ................. .. .. .. 190 189 191 224<br />
Murcia................................... 2.002 1.981 2.024 1.979 2.062 2.097 2.097<br />
Yec<strong>la</strong> .................................... 138 127 137 164 143 197 148<br />
Nota: Sólo hay datos para los municipios mayores <strong>de</strong> 20.000 habitantes, aunque Alcantaril<strong>la</strong> supera los 20.000 habitantes <strong>de</strong> <strong>de</strong>recho en el censo <strong>de</strong> 1970.<br />
Fuente: INE. Movimiento Natural <strong>de</strong> <strong>la</strong> Pob<strong>la</strong>ción.<br />
4.8.4. EVOLUCIÓN DE LOS MATRIMONIOS POR LUGAR DE CELEBRACIÓN. 1975-1992. (Continúa)<br />
MUNICIPIOS 1975 1976 1977 1978 1979 1980 1981 1982 (1) 1983 (1)<br />
Abarán....................................... 93 74 89 82 74 76 62 1 34<br />
Águi<strong>la</strong>s....................................... 175 182 196 183 195 163 157 13 26<br />
Alcantaril<strong>la</strong>................................. 184 174 183 186 180 163 158 5 8<br />
Alhama <strong>de</strong> Murcia ..................... 100 75 95 105 92 85 79 5 11<br />
Archena ..................................... 96 105 88 91 108 80 81 7 16<br />
Bul<strong>la</strong>s......................................... .. .. .. .. .. .. .. .. ..<br />
Caravaca <strong>de</strong> <strong>la</strong> Cruz.................. 125 133 133 153 170 145 124 1 3<br />
Cartagena.................................. 1.155 1.185 1.156 1.148 1.164 1.106 970 185 239<br />
Cehegín..................................... 94 110 84 90 104 95 86 1 1<br />
Cieza ......................................... 217 187 209 215 227 213 188 14 19<br />
Jumil<strong>la</strong> ....................................... 148 147 152 129 157 162 135 10 7<br />
Lorca ......................................... 545 459 440 497 431 432 378 29 38<br />
Mazarrón ................................... .. .. .. .. .. .. 82 7 70<br />
Molina <strong>de</strong> Segura ...................... 212 194 223 242 250 211 200 14 17<br />
Moratal<strong>la</strong>.................................... 54 65 62 76 77 70 - - -<br />
Mu<strong>la</strong>........................................... 85 103 94 106 90 119 57 10 9<br />
Murcia........................................ 2.165 2.095 2.174 2.065 2.087 2.109 1.951 189 233<br />
San Javier ................................. 92 79 85 65 79 92 69 13 1<br />
San Pedro <strong>de</strong> Pinatar ................ .. .. .. .. .. .. .. .. ..<br />
Torre Pacheco........................... 112 97 104 112 108 100 91 3 1<br />
Torres <strong>de</strong> Cotil<strong>la</strong>s (Las) ............. .. .. .. .. .. .. 68 .. 1<br />
Totana ....................................... 171 136 142 143 142 129 115 6 1<br />
Unión (La).................................. 118 106 106 122 97 108 90 10 16<br />
Yec<strong>la</strong> ......................................... 170 154 184 192 180 163 149 4 14<br />
Estadísticas Históricas <strong>de</strong> Pob<strong>la</strong>ción <strong>de</strong> <strong>la</strong> Región <strong>de</strong> Murcia.<br />
193
MNP. Datos Municipales. Matrimonios.<br />
4.8.4. EVOLUCIÓN DE LOS MATRIMONIOS POR LUGAR DE CELEBRACIÓN. 1975-1992. (Conclusión)<br />
194<br />
MUNICIPIOS 1984 (1) 1985 1986 1987 1988 1989 1990 1991 1992<br />
Abarán ....................................... 33 66 83 74 97 51 74 58 74<br />
Águi<strong>la</strong>s....................................... 32 158 137 161 157 141 152 161 142<br />
Alcantaril<strong>la</strong> ................................. 3 148 187 128 207 218 188 195 181<br />
Alhama <strong>de</strong> Murcia...................... 10 78 69 71 78 72 75 73 70<br />
Archena ..................................... 6 104 101 99 112 116 94 84 102<br />
Bul<strong>la</strong>s......................................... .. .. 72 77 73 67 114 80 65<br />
Caravaca <strong>de</strong> <strong>la</strong> Cruz.................. 14 142 137 167 139 135 145 140 120<br />
Cartagena.................................. 246 980 1.063 1.098 1.133 1.112 1.099 1.051 1.002<br />
Cehegín ..................................... - 83 99 102 82 103 99 87 100<br />
Cieza.......................................... 24 184 188 216 210 225 177 63 (2) 223<br />
Jumil<strong>la</strong> ....................................... 4 131 109 142 147 133 114 139 122<br />
Lorca.......................................... 48 341 406 432 391 434 450 418 395<br />
Mazarrón.................................... 85 76 89 79 82 110 73 58 74<br />
Molina <strong>de</strong> Segura....................... 41 192 238 225 251 223 202 232 223<br />
Moratal<strong>la</strong>.................................... .. .. 76 65 62 55 66 .. ..<br />
Mu<strong>la</strong>........................................... 13 90 101 110 92 100 98 82 100<br />
Murcia........................................ 321 1.872 2.069 2.124 2.219 2.239 2.171 2.206 2.072<br />
San Javier.................................. 14 73 76 78 103 90 91 90 97<br />
San Pedro <strong>de</strong> Pinatar ................ .. .. 50 58 64 60 73 79 73<br />
Torre Pacheco ........................... 1 101 111 94 94 129 114 91 101<br />
Torres <strong>de</strong> Cotil<strong>la</strong>s (Las) ............. 5 57 80 96 57 79 72 74 83<br />
Totana........................................ 15 82 114 136 112 117 98 131 122<br />
Unión (La).................................. 24 91 70 85 80 94 75 92 82<br />
Yec<strong>la</strong>.......................................... 29 156 162 145 182 187 150 134 147<br />
Nota: Sólo hay datos para los municipios mayores <strong>de</strong> 10.000 habitantes.<br />
(1) Los datos <strong>de</strong> 1982, 1983 y 1984 son tan bajos <strong>de</strong>bido a que no incluyen todos los matrimonios religiosos, por no suministrar los párrocos los correspondientes<br />
boletines.<br />
(2) La cifra <strong>de</strong> matrimonios que publica el INE <strong>de</strong> Cieza para 1991 es <strong>de</strong> 63. Si bien, apuntamos que el dato <strong>de</strong> matrimonios que ofrece <strong>la</strong> estadística <strong>de</strong> MNP <strong>de</strong>l<br />
Centro Regional <strong>de</strong> Estadística es <strong>de</strong> 184, <strong>la</strong> cual parece más coherente con respecto a años anteriores y posterior.<br />
Fuente: INE. Movimiento Natural <strong>de</strong> <strong>la</strong> Pob<strong>la</strong>ción.<br />
Estadísticas Históricas <strong>de</strong> Pob<strong>la</strong>ción <strong>de</strong> <strong>la</strong> Región <strong>de</strong> Murcia.
MNP. Datos Municipales. Matrimonios.<br />
4.9. EVOLUCIÓN DE LOS MATRIMONIOS POR LUGAR DE RESIDENCIA. 1975-1992. (Continúa)<br />
MUNICIPIOS 1975 1976 1977 1978 1979 1980 1981 1982 (1) 1983 (1)<br />
TOTAL.................................... 6.467 6.355 6.586 6.595 6.635 6.432 5.795 782 1.112<br />
Abanil<strong>la</strong>................................... 35 48 25 32 36 31 31 1 6<br />
Abarán.................................... 63 59 69 64 62 69 56 1 24<br />
Águi<strong>la</strong>s.................................... 166 158 182 168 168 151 153 16 30<br />
Albu<strong>de</strong>ite ................................ 7 9 13 12 9 14 13 1 1<br />
Alcantaril<strong>la</strong>.............................. 193 200 205 183 190 176 176 8 15<br />
Alcázares (Los) ...................... .. .. .. .. .. .. .. .. ..<br />
Aledo ...................................... 9 9 6 7 7 3 4 1 3<br />
Alguazas................................. 33 41 37 42 53 59 42 11 16<br />
Alhama <strong>de</strong> Murcia .................. 85 69 92 101 92 86 82 8 13<br />
Archena .................................. 74 84 66 69 92 67 59 8 20<br />
Beniel ..................................... 24 35 32 49 31 25 33 2 2<br />
B<strong>la</strong>nca .................................... 24 27 25 27 29 25 35 1 4<br />
Bul<strong>la</strong>s...................................... 55 76 66 52 51 63 64 3 35<br />
Ca<strong>la</strong>sparra.............................. 41 42 31 44 54 53 33 5 11<br />
Campos <strong>de</strong>l Rio...................... 11 12 8 6 17 16 11 5 19<br />
Caravaca <strong>de</strong> <strong>la</strong> Cruz............... 117 112 117 136 149 131 114 11 7<br />
Cartagena............................... 1.180 1.236 1.199 1.166 1.130 1.105 959 230 261<br />
Cehegín.................................. 54 78 53 75 81 69 74 3 1<br />
Ceutí....................................... 25 40 23 44 42 30 36 1 2<br />
Cieza ...................................... 191 165 179 185 204 202 166 10 20<br />
Fortuna ................................... 32 43 49 47 39 37 40 1 26<br />
Fuente Á<strong>la</strong>mo ......................... 48 47 42 44 50 41 36 4 12<br />
Jumil<strong>la</strong> .................................... 127 120 137 118 152 149 127 10 14<br />
Libril<strong>la</strong>..................................... 22 16 21 25 21 23 8 - -<br />
Lorca ...................................... 481 413 412 459 392 399 367 40 54<br />
Lorquí ..................................... 29 28 41 33 37 27 26 - 1<br />
Mazarrón ................................ 71 65 68 90 92 101 81 13 79<br />
Molina <strong>de</strong> Segura ................... 197 200 244 283 292 249 232 22 28<br />
Moratal<strong>la</strong>................................. 42 56 44 53 63 55 53 5 6<br />
Mu<strong>la</strong>........................................ 76 88 77 80 71 105 52 8 9<br />
Murcia..................................... 2.118 2.003 2.149 2.051 2.056 2.035 1.890 270 304<br />
Ojós ........................................ 3 4 7 6 2 1 1 2 4<br />
Pliego ..................................... 27 18 20 14 10 20 14 2 -<br />
Puerto Lumbreras................... 60 53 71 53 44 63 44 6 9<br />
Ricote ..................................... 7 7 6 10 7 7 5 2 -<br />
San Javier .............................. 70 70 80 75 74 91 67 16 9<br />
San Pedro <strong>de</strong> Pinatar ............. 75 57 56 70 64 41 59 14 8<br />
Santomera.............................. .. .. .. .. .. - 6 7 3<br />
Torre Pacheco........................ 97 94 107 108 114 122 111 2 8<br />
Torres <strong>de</strong> Cotil<strong>la</strong>s (Las) .......... 74 106 100 83 122 110 83 7 2<br />
Totana .................................... 146 109 123 124 137 121 105 1 4<br />
Ulea ........................................ 4 3 8 8 - 2 3 9 -<br />
Unión (La)............................... 82 77 87 103 90 98 80 - 17<br />
Vil<strong>la</strong>nueva <strong>de</strong>l Río Segura...... 16 12 9 5 11 3 3 14 1<br />
Yec<strong>la</strong> ...................................... 176 166 200 191 198 157 161 1 24<br />
Estadísticas Históricas <strong>de</strong> Pob<strong>la</strong>ción <strong>de</strong> <strong>la</strong> Región <strong>de</strong> Murcia.<br />
195
MNP. Datos Municipales. Matrimonios.<br />
4.9. EVOLUCIÓN DE LOS MATRIMONIOS POR LUGAR DE RESIDENCIA. 1975-1992. (Conclusión)<br />
196<br />
MUNICIPIOS 1984 (1) 1985 1986 1987 1988 1989 1990 1991 1992<br />
TOTAL .............................. 1.461 5.931 6.435 6.648 6.728 6.840 6.688 6.434 6.372<br />
Abanil<strong>la</strong>............................. 2 32 41 24 21 31 32 36 30<br />
Abarán .............................. 28 71 78 67 94 57 77 56 78<br />
Águi<strong>la</strong>s.............................. 40 159 134 152 157 133 152 167 142<br />
Albu<strong>de</strong>ite........................... - 12 6 4 10 6 11 6 4<br />
Alcantaril<strong>la</strong> ........................ 13 140 228 169 243 223 196 221 184<br />
Alcázares (Los)................. 2 8 19 29 35 39 43 42 29<br />
Aledo ................................ 1 3 4 4 2 5 5 3 5<br />
Alguazas........................... 17 32 40 44 52 36 36 41 58<br />
Alhama <strong>de</strong> Murcia............. 13 71 73 75 88 72 86 91 68<br />
Archena ............................ 7 89 118 96 92 102 83 61 81<br />
Beniel................................ 7 26 37 34 53 56 43 42 31<br />
B<strong>la</strong>nca............................... 5 15 21 26 28 32 26 27 33<br />
Bul<strong>la</strong>s................................ 39 21 65 72 71 62 100 63 60<br />
Ca<strong>la</strong>sparra ........................ 14 35 41 46 45 59 59 64 68<br />
Campos <strong>de</strong>l Rio ................ 10 14 11 21 15 9 13 12 15<br />
Caravaca <strong>de</strong> <strong>la</strong> Cruz......... 21 129 140 149 130 128 136 139 116<br />
Cartagena......................... 302 1.078 1.041 1.060 1.079 1.083 1.059 1.012 926<br />
Cehegín ............................ 5 102 97 94 72 81 88 73 94<br />
Ceutí ................................. 7 37 47 49 42 39 54 42 37<br />
Cieza................................. 26 173 176 209 198 210 165 64 200<br />
Fortuna ............................. 23 37 35 46 30 50 54 40 47<br />
Fuente Á<strong>la</strong>mo ................... 26 49 58 57 65 62 51 47 45<br />
Jumil<strong>la</strong> .............................. 7 146 113 142 139 122 116 146 122<br />
Libril<strong>la</strong> ............................... 2 34 11 23 19 17 21 30 13<br />
Lorca................................. 60 336 416 424 360 414 425 379 365<br />
Lorquí ............................... 3 31 29 39 35 37 31 37 37<br />
Mazarrón........................... 87 77 87 93 95 121 85 62 92<br />
Molina <strong>de</strong> Segura.............. 46 197 257 277 288 273 263 285 259<br />
Moratal<strong>la</strong>........................... 12 56 62 53 48 45 55 41 31<br />
Mu<strong>la</strong>.................................. 15 85 110 104 81 97 83 78 83<br />
Murcia............................... 423 1.884 2.045 2.092 2.164 2.165 2.175 2.180 2.128<br />
Ojós .................................. 7 2 3 3 4 5 1 1 2<br />
Pliego................................ 2 27 23 23 19 20 20 14 19<br />
Puerto Lumbreras............. 42 44 51 57 38 52 54 46 49<br />
Ricote ............................... 8 10 5 22 7 10 10 6 3<br />
San Javier......................... 21 67 80 91 110 90 106 92 89<br />
San Pedro <strong>de</strong> Pinatar ....... 11 52 66 70 98 94 92 80 86<br />
Santomera ........................ 5 38 38 55 54 55 56 54 67<br />
Torre Pacheco .................. 7 96 104 107 114 149 121 106 114<br />
Torres <strong>de</strong> Cotil<strong>la</strong>s (Las) .... 10 61 87 90 74 101 82 95 97<br />
Totana............................... 19 82 99 123 102 117 92 122 117<br />
Ulea .................................. 2 3 7 2 2 2 3 4 4<br />
Unión (La)......................... 20 99 60 78 67 79 73 80 72<br />
Vil<strong>la</strong>nueva <strong>de</strong>l Río Segura - 3 2 3 3 2 5 1 9<br />
Yec<strong>la</strong>................................. 44 168 170 150 185 198 150 146 163<br />
(1) Los datos <strong>de</strong> 1982, 1983 y 1984 son tan bajos <strong>de</strong>bido a que no incluyen todos los matrimonios religiosos, por no suministrar los párrocos los correspondientes<br />
boletines.<br />
Fuente: INE. Movimiento Natural <strong>de</strong> <strong>la</strong> Pob<strong>la</strong>ción<br />
Estadísticas Históricas <strong>de</strong> Pob<strong>la</strong>ción <strong>de</strong> <strong>la</strong> Región <strong>de</strong> Murcia.
MNP. Datos Municipales. Tasas.<br />
4.10. EVOLUCIÓN DE LA NATALIDAD. 1976- 1992. (Continúa)<br />
MUNICIPIOS 1976 1977 1978 1979 1980 1981 1982 1983 1984<br />
TOTAL....................................... 21,63 21,25 20,26 19,70 19,39 18,32 17,22 16,01 14,96<br />
Abanil<strong>la</strong>...................................... 12,28 11,97 11,57 10,55 10,70 15,18 13,93 11,61 11,33<br />
Abarán....................................... 19,97 19,15 18,96 19,23 18,86 18,98 17,43 15,03 13,96<br />
Águi<strong>la</strong>s....................................... 23,42 23,39 22,42 22,63 21,40 21,26 20,53 17,55 15,88<br />
Albu<strong>de</strong>ite ................................... 21,06 18,90 17,05 18,62 20,37 25,71 19,63 15,73 15,25<br />
Alcantaril<strong>la</strong>................................. 25,99 25,96 24,65 22,66 21,43 20,37 18,79 17,23 16,55<br />
Alcázares (Los) ........................ .. .. .. .. .. .. .. .. ..<br />
Aledo ......................................... 13,99 17,42 19,04 13,46 11,99 17,12 14,75 11,85 6,78<br />
Alguazas.................................... 21,96 22,97 19,75 20,87 23,32 21,40 18,42 17,39 17,41<br />
Alhama <strong>de</strong> Murcia ..................... 20,03 18,45 18,65 18,56 18,15 16,99 15,32 14,96 13,80<br />
Archena ..................................... 23,77 24,94 23,79 22,10 19,56 19,45 19,38 17,90 16,25<br />
Beniel ........................................ 20,24 21,41 22,73 23,04 22,31 20,98 18,70 17,76 16,67<br />
B<strong>la</strong>nca ....................................... 14,03 14,77 13,94 13,56 14,28 14,51 14,76 14,36 13,34<br />
Bul<strong>la</strong>s......................................... 17,22 16,61 17,61 17,64 15,73 16,36 17,08 14,22 11,96<br />
Ca<strong>la</strong>sparra................................. 17,46 16,88 14,95 15,01 15,88 16,08 16,40 13,93 12,65<br />
Campos <strong>de</strong>l Río......................... 17,50 18,26 16,85 13,96 17,20 22,28 19,76 11,85 13,53<br />
Caravaca <strong>de</strong> <strong>la</strong> Cruz.................. 17,19 16,69 15,46 14,42 14,13 14,69 13,82 13,31 13,11<br />
Cartagena.................................. 22,41 22,21 21,14 20,15 19,08 18,03 16,89 15,95 15,03<br />
Cehegín..................................... 18,90 18,10 16,10 15,40 14,81 14,07 14,15 13,66 13,29<br />
Ceutí.......................................... 20,59 21,94 20,57 21,46 23,58 20,86 17,71 16,72 16,38<br />
Cieza ......................................... 20,20 18,33 17,91 18,18 17,70 17,40 16,23 15,14 13,92<br />
Fortuna ...................................... 23,82 22,87 21,26 18,15 19,66 22,14 21,79 20,36 17,63<br />
Fuente-Á<strong>la</strong>mo............................ 17,51 15,64 13,32 13,11 14,20 15,17 13,42 13,40 13,66<br />
Jumil<strong>la</strong> ....................................... 18,69 19,19 18,32 18,81 18,63 18,14 17,66 14,84 13,33<br />
Libril<strong>la</strong>........................................ 22,14 18,50 16,60 17,40 15,62 10,81 8,16 12,28 14,61<br />
Lorca ......................................... 20,54 19,48 18,67 18,51 17,60 17,59 16,25 15,17 14,54<br />
Lorquí ........................................ 22,29 22,87 20,93 20,14 22,13 20,82 19,23 16,67 14,58<br />
Mazarrón ................................... 20,90 22,44 20,34 21,23 21,69 22,09 22,07 22,13 21,53<br />
Molina <strong>de</strong> Segura ...................... 24,28 24,12 23,52 23,25 22,80 19,87 18,93 19,32 17,07<br />
Moratal<strong>la</strong>.................................... 16,16 15,42 14,34 12,63 13,33 15,05 14,71 14,37 12,49<br />
Mu<strong>la</strong>........................................... 15,91 16,40 15,95 15,89 15,44 16,06 14,23 13,53 13,12<br />
Murcia........................................ 23,48 23,18 21,77 20,85 20,03 19,38 18,11 16,37 15,08<br />
Ojós ........................................... 8,82 11,59 18,60 20,32 18,50 32,58 25,89 16,82 12,30<br />
Pliego ........................................ 18,20 16,56 16,37 17,52 14,93 14,81 15,34 13,94 13,90<br />
Puerto Lumbreras...................... 18,16 18,43 18,24 17,48 15,73 16,06 14,00 12,84 14,06<br />
Ricote ........................................ 13,15 11,60 10,22 10,93 8,71 9,02 11,49 9,73 8,97<br />
San Javier ................................. 21,43 20,52 19,86 19,24 17,40 18,13 18,75 17,61 16,50<br />
San Pedro <strong>de</strong>l Pinatar ............... 23,03 21,20 22,02 22,10 21,36 20,96 20,08 19,73 18,61<br />
Santomera................................. .. .. .. .. .. .. 5,79 12,17 13,90<br />
Torre-Pacheco........................... 23,87 21,59 21,39 21,50 21,57 19,51 17,14 17,34 16,89<br />
Torres <strong>de</strong> Cotil<strong>la</strong>s (Las) ............. 26,07 26,58 24,59 25,00 25,02 22,84 21,20 18,37 15,05<br />
Totana ....................................... 21,97 20,80 19,86 19,33 18,56 18,74 17,16 14,36 13,91<br />
Ulea ........................................... 14,95 10,60 10,92 13,19 11,24 14,06 12,61 7,90 9,09<br />
Unión (La).................................. 17,99 19,04 19,72 19,50 18,58 16,50 15,69 16,01 15,70<br />
Vil<strong>la</strong>nueva <strong>de</strong>l Río Segura......... 16,60 14,52 14,37 11,44 8,15 6,04 1,11 5,70 7,31<br />
Yec<strong>la</strong> ......................................... 19,89 19,11 18,94 20,05 19,54 17,16 16,51 16,40 14,64<br />
Estadísticas Históricas <strong>de</strong> Pob<strong>la</strong>ción <strong>de</strong> <strong>la</strong> Región <strong>de</strong> Murcia.<br />
197
MNP. Datos Municipales. Tasas.<br />
4.10. EVOLUCIÓN DE LA NATALIDAD. 1976- 1992. (Conclusión)<br />
198<br />
MUNICIPIOS 1985 1986 1987 1988 1989 1990 1991 1992<br />
TOTAL ...................................... 14,38 14,17 13,80 13,50 13,34 13,12 13,23 13,08<br />
Abanil<strong>la</strong>..................................... 10,56 12,06 12,06 10,87 10,68 10,09 11,11 11,46<br />
Abarán ...................................... 13,63 13,36 12,48 12,66 12,72 11,60 12,22 12,54<br />
Águi<strong>la</strong>s...................................... 15,86 15,41 15,15 14,59 13,64 13,03 13,06 13,04<br />
Albu<strong>de</strong>ite................................... 10,31 11,82 14,73 16,02 13,05 12,40 14,88 12,85<br />
Alcantaril<strong>la</strong> ................................ 16,93 16,35 15,63 15,56 15,65 14,85 14,28 13,94<br />
Alcázares (Los) ........................ 8,88 10,72 11,45 10,72 15,51 17,91 17,95 16,85<br />
Aledo ........................................ 5,07 10,00 9,51 6,69 6,72 8,17 6,08 4,57<br />
Alguazas................................... 14,83 13,11 13,66 13,87 13,40 11,89 11,11 11,42<br />
Alhama <strong>de</strong> Murcia..................... 13,97 13,87 12,54 12,08 11,07 10,28 10,76 10,62<br />
Archena .................................... 15,27 15,37 15,35 15,34 14,10 13,35 13,21 13,58<br />
Beniel........................................ 15,89 16,38 15,74 15,85 16,64 16,00 14,91 14,85<br />
B<strong>la</strong>nca....................................... 11,25 9,82 9,24 12,19 12,05 8,87 9,45 10,69<br />
Bul<strong>la</strong>s........................................ 13,01 12,79 11,88 12,88 13,89 13,44 13,24 14,25<br />
Ca<strong>la</strong>sparra ................................ 13,40 12,89 12,40 12,23 11,88 11,31 12,58 13,23<br />
Campos <strong>de</strong>l Río........................ 16,81 13,21 10,75 13,88 18,42 16,86 14,64 14,13<br />
Caravaca <strong>de</strong> <strong>la</strong> Cruz................. 12,22 11,01 11,47 11,98 11,82 11,02 12,26 13,19<br />
Cartagena................................. 14,43 14,32 13,66 13,15 12,76 12,59 12,89 12,48<br />
Cehegín .................................... 12,77 11,16 10,30 10,24 9,55 9,30 11,02 11,08<br />
Ceutí ......................................... 14,54 13,71 15,09 16,03 16,11 14,66 14,06 13,92<br />
Cieza......................................... 13,93 14,06 13,54 13,49 14,01 14,37 14,42 14,42<br />
Fortuna ..................................... 16,44 15,52 16,27 16,06 13,34 12,90 14,84 13,26<br />
Fuente-Á<strong>la</strong>mo ........................... 12,15 12,87 13,68 13,09 13,35 13,15 13,71 14,14<br />
Jumil<strong>la</strong> ...................................... 14,16 14,84 13,32 12,07 12,15 11,91 13,02 12,70<br />
Libril<strong>la</strong> ....................................... 12,78 12,11 11,64 12,03 11,61 11,28 11,42 11,71<br />
Lorca......................................... 14,27 13,46 12,93 12,43 12,08 12,27 12,41 12,00<br />
Lorquí ....................................... 15,88 16,02 15,94 14,91 13,76 13,95 12,67 11,09<br />
Mazarrón................................... 19,41 16,86 16,97 16,63 15,92 15,13 14,44 13,31<br />
Molina <strong>de</strong> Segura...................... 15,25 15,44 15,00 14,47 14,35 14,23 13,92 13,50<br />
Moratal<strong>la</strong>................................... 10,86 10,49 10,46 10,64 9,70 9,86 10,52 9,66<br />
Mu<strong>la</strong>.......................................... 10,88 12,78 13,16 13,70 13,23 12,54 12,49 11,62<br />
Murcia....................................... 14,64 14,56 14,14 13,69 13,72 13,66 13,50 13,60<br />
Ojós .......................................... 12,61 13,84 9,98 7,65 9,38 12,36 11,81 8,22<br />
Pliego........................................ 13,19 11,68 13,22 12,29 11,28 10,50 10,22 10,80<br />
Puerto Lumbreras..................... 13,28 12,66 11,72 12,98 12,35 11,18 13,16 12,46<br />
Ricote ....................................... 10,92 11,68 11,10 9,21 7,88 6,83 8,57 8,50<br />
San Javier................................. 15,51 14,82 15,95 16,66 16,12 15,36 15,97 14,69<br />
San Pedro <strong>de</strong>l Pinatar............... 17,19 17,29 18,20 17,94 16,98 15,60 17,32 17,39<br />
Santomera ................................ 14,25 13,88 13,33 14,98 15,16 15,36 16,04 14,69<br />
Torre-Pacheco.......................... 17,15 16,01 15,93 14,93 15,16 15,51 14,53 13,97<br />
Torres <strong>de</strong> Cotil<strong>la</strong>s (Las) ............ 14,38 15,48 15,29 15,38 15,10 14,13 13,35 13,25<br />
Totana....................................... 13,36 12,42 11,21 10,37 11,33 10,91 10,70 11,55<br />
Ulea .......................................... 9,91 8,48 7,99 7,62 6,38 8,36 9,31 7,98<br />
Unión (La)................................. 14,90 14,23 13,98 13,75 12,90 13,27 14,18 12,47<br />
Vil<strong>la</strong>nueva <strong>de</strong>l Río Segura ........ 6,00 8,38 7,22 5,82 5,48 6,01 6,61 9,11<br />
Yec<strong>la</strong>......................................... 13,28 12,97 13,81 13,93 13,89 14,04 13,66 13,36<br />
Nota: Tasas en tantos por mil.<br />
Fuente: Consejería <strong>de</strong> Economía y Hacienda. Centro Regional <strong>de</strong> Estadística<br />
Estadísticas Históricas <strong>de</strong> Pob<strong>la</strong>ción <strong>de</strong> <strong>la</strong> Región <strong>de</strong> Murcia.
MNP. Datos Municipales. Tasas.<br />
4.11. EVOLUCIÓN DE LA MORTALIDAD. 1976- 1992. (Continúa)<br />
MUNICIPIOS 1976 1977 1978 1979 1980 1981 1982 1983 1984<br />
TOTAL....................................... 8,53 8,15 8,09 7,97 7,89 7,98 7,82 7,71 7,70<br />
Abanil<strong>la</strong>...................................... 8,11 7,66 8,31 8,71 7,23 9,66 10,93 11,33 10,92<br />
Abarán....................................... 9,26 9,78 9,90 8,56 8,56 9,00 8,76 9,31 9,08<br />
Águi<strong>la</strong>s....................................... 8,86 8,66 8,15 8,95 9,78 9,03 7,87 8,42 8,36<br />
Albu<strong>de</strong>ite ................................... 5,11 7,09 9,11 8,73 9,75 8,47 8,92 10,78 8,06<br />
Alcantaril<strong>la</strong>................................. 7,41 6,22 6,31 6,54 6,29 6,21 5,90 6,10 6,93<br />
Alcázares (Los) ........................ .. .. .. .. .. .. .. .. ..<br />
Aledo ......................................... 10,73 8,71 8,61 10,68 11,07 11,10 9,22 8,66 10,85<br />
Alguazas.................................... 9,45 8,93 7,74 7,94 7,40 6,32 7,16 7,02 7,54<br />
Alhama <strong>de</strong> Murcia ..................... 8,05 8,85 9,13 8,57 8,55 8,84 8,77 9,04 8,08<br />
Archena ..................................... 7,51 7,53 7,23 6,53 6,49 7,50 7,25 6,48 7,45<br />
Beniel ........................................ 5,85 4,85 5,84 6,48 5,84 5,39 5,53 6,67 5,53<br />
B<strong>la</strong>nca ....................................... 8,11 6,86 5,74 6,96 7,55 7,33 6,84 6,23 5,73<br />
Bul<strong>la</strong>s......................................... 9,71 10,25 9,79 8,00 8,14 9,27 9,33 9,83 9,58<br />
Ca<strong>la</strong>sparra................................. 8,94 9,44 9,29 8,69 8,43 8,71 8,83 7,98 7,69<br />
Campos <strong>de</strong>l Río......................... 8,14 11,35 10,41 6,61 8,72 11,26 8,19 6,88 5,37<br />
Caravaca <strong>de</strong> <strong>la</strong> Cruz.................. 9,16 8,53 7,87 8,16 8,13 10,00 10,17 9,23 9,09<br />
Cartagena.................................. 8,44 8,05 7,95 8,06 7,95 7,88 7,84 7,73 7,54<br />
Cehegín..................................... 10,99 9,12 8,25 9,44 9,17 8,43 7,56 7,91 8,94<br />
Ceutí.......................................... 8,00 7,40 6,68 6,14 5,43 7,25 6,86 5,80 6,13<br />
Cieza ......................................... 8,44 7,91 7,77 7,91 8,42 8,30 7,24 7,49 7,82<br />
Fortuna ...................................... 8,06 8,66 9,83 9,28 7,88 8,30 7,24 7,53 9,18<br />
Fuente-Á<strong>la</strong>mo............................ 10,00 10,03 10,88 10,73 9,15 9,20 10,01 9,41 9,84<br />
Jumil<strong>la</strong> ....................................... 8,24 8,44 8,41 8,67 8,27 7,97 8,60 8,58 8,24<br />
Libril<strong>la</strong>........................................ 8,97 9,32 11,17 10,47 7,74 7,25 5,21 6,56 8,21<br />
Lorca ......................................... 8,52 8,16 8,64 8,59 7,69 8,25 8,44 8,64 8,17<br />
Lorquí ........................................ 6,18 6,18 5,71 5,61 5,99 7,24 6,83 4,69 5,08<br />
Mazarrón ................................... 10,30 8,32 8,50 9,06 9,07 9,56 9,77 9,14 8,72<br />
Molina <strong>de</strong> Segura ...................... 6,22 5,56 5,74 5,80 5,38 5,09 4,84 4,62 5,04<br />
Moratal<strong>la</strong>.................................... 9,20 8,82 8,44 7,51 7,91 9,18 9,89 10,58 10,29<br />
Mu<strong>la</strong>........................................... 9,26 9,34 8,50 8,01 7,77 8,11 7,10 7,48 8,68<br />
Murcia........................................ 8,76 8,22 8,16 7,79 7,56 8,17 8,07 7,72 7,66<br />
Ojós ........................................... 9,92 11,59 11,84 9,59 10,09 12,41 12,18 13,00 13,07<br />
Pliego ........................................ 7,90 8,14 7,84 8,21 9,26 10,22 7,89 8,48 9,46<br />
Puerto Lumbreras...................... 9,61 10,30 10,71 9,93 9,12 11,33 10,83 9,50 9,17<br />
Ricote ........................................ 9,33 9,07 11,07 10,93 8,49 7,33 9,25 10,27 8,70<br />
San Javier ................................. 7,65 6,58 6,09 6,26 6,73 7,35 7,72 7,84 8,16<br />
San Pedro <strong>de</strong>l Pinatar ............... 6,18 6,94 7,06 6,72 6,83 7,17 6,30 5,45 6,17<br />
Santomera................................. .. .. .. .. .. .. 3,50 6,58 6,69<br />
Torre-Pacheco........................... 7,88 6,93 7,23 7,16 6,98 7,07 7,02 7,76 7,16<br />
Torres <strong>de</strong> Cotil<strong>la</strong>s (Las) ............. 7,58 7,61 7,60 7,34 7,12 6,14 5,52 5,04 4,91<br />
Totana ....................................... 10,11 9,72 9,16 9,30 9,17 8,75 7,44 7,58 8,11<br />
Ulea ........................................... 7,64 7,95 6,29 7,59 6,94 8,94 9,25 7,07 9,92<br />
Unión (La).................................. 7,02 7,04 7,19 7,59 6,87 6,28 6,63 6,70 6,46<br />
Vil<strong>la</strong>nueva <strong>de</strong>l Río Segura......... 8,82 8,41 8,32 9,20 8,64 5,75 2,22 5,70 6,30<br />
Yec<strong>la</strong> ......................................... 8,96 9,15 8,90 8,79 8,32 8,64 8,27 7,55 7,66<br />
Estadísticas Históricas <strong>de</strong> Pob<strong>la</strong>ción <strong>de</strong> <strong>la</strong> Región <strong>de</strong> Murcia.<br />
199
MNP. Datos Municipales. Tasas.<br />
4.11. EVOLUCIÓN DE LA MORTALIDAD. 1976- 1992. (Conclusión)<br />
200<br />
MUNICIPIOS 1985 1986 1987 1988 1989 1990 1991 1992<br />
TOTAL ...................................... 7,64 7,82 7,58 7,44 7,75 7,98 8,15 7,95<br />
Abanil<strong>la</strong>..................................... 9,27 9,12 9,21 9,66 10,47 10,38 11,85 11,79<br />
Abarán ...................................... 8,89 9,16 8,09 7,88 8,89 8,96 9,36 9,68<br />
Águi<strong>la</strong>s...................................... 7,31 7,81 8,05 7,92 8,13 8,15 8,38 8,58<br />
Albu<strong>de</strong>ite................................... 8,59 11,82 10,48 10,14 10,44 10,44 12,40 11,78<br />
Alcantaril<strong>la</strong> ................................ 6,64 5,77 6,03 6,31 6,23 6,78 6,78 6,29<br />
Alcázares (Los) ........................ 5,45 6,50 7,69 6,23 6,39 7,66 8,16 7,32<br />
Aledo ........................................ 10,59 10,00 10,94 10,99 11,05 11,53 10,14 13,72<br />
Alguazas................................... 8,36 8,14 8,21 6,97 6,88 7,36 7,72 7,33<br />
Alhama <strong>de</strong> Murcia..................... 8,39 9,78 9,77 9,74 10,15 10,52 9,63 9,64<br />
Archena .................................... 7,42 7,36 7,50 6,65 6,96 7,82 7,64 7,31<br />
Beniel........................................ 3,63 4,70 5,56 6,48 7,27 5,73 5,34 6,34<br />
B<strong>la</strong>nca....................................... 5,51 6,60 7,76 8,32 8,36 9,11 9,71 9,82<br />
Bul<strong>la</strong>s........................................ 8,61 9,37 9,81 8,86 8,87 9,28 9,99 9,63<br />
Ca<strong>la</strong>sparra ................................ 8,10 8,44 9,20 9,54 9,98 10,80 10,47 9,65<br />
Campos <strong>de</strong>l Río........................ 6,59 9,78 7,09 6,82 10,18 11,32 8,99 7,32<br />
Caravaca <strong>de</strong> <strong>la</strong> Cruz................. 8,73 7,91 8,05 8,19 8,14 7,94 8,88 9,02<br />
Cartagena................................. 7,77 8,20 7,86 7,60 8,07 8,42 8,77 8,53<br />
Cehegín .................................... 7,99 7,78 7,22 7,34 7,65 8,16 9,84 9,14<br />
Ceutí ......................................... 5,90 6,77 6,30 6,10 7,45 6,66 5,31 6,12<br />
Cieza......................................... 7,83 8,44 7,99 7,41 8,14 8,15 8,10 7,58<br />
Fortuna ..................................... 8,06 8,62 9,32 7,95 6,67 7,88 9,50 7,08<br />
Fuente-Á<strong>la</strong>mo ........................... 10,59 10,48 9,43 10,01 11,34 10,11 11,35 12,09<br />
Jumil<strong>la</strong> ...................................... 7,85 8,49 8,47 8,28 8,04 8,09 9,14 9,04<br />
Libril<strong>la</strong> ....................................... 7,42 7,80 9,23 11,22 10,54 8,89 9,96 10,11<br />
Lorca......................................... 7,73 8,28 8,35 8,35 8,21 8,12 8,30 8,26<br />
Lorquí ....................................... 6,04 6,77 6,79 5,19 6,09 7,34 7,42 7,67<br />
Mazarrón................................... 9,07 8,11 7,37 7,32 8,16 8,02 7,24 7,09<br />
Molina <strong>de</strong> Segura...................... 5,41 5,25 5,61 5,59 5,22 5,58 5,57 5,33<br />
Moratal<strong>la</strong>................................... 9,58 9,15 8,88 8,28 8,37 9,96 12,52 11,57<br />
Mu<strong>la</strong>.......................................... 8,79 10,44 8,22 8,83 10,64 10,57 10,27 9,38<br />
Murcia....................................... 7,70 7,67 7,29 7,17 7,45 7,70 7,57 7,44<br />
Ojós .......................................... 10,25 5,38 6,14 8,41 14,06 11,59 5,90 7,47<br />
Pliego........................................ 8,65 9,35 10,17 9,40 8,82 8,92 9,32 8,70<br />
Puerto Lumbreras..................... 8,63 8,46 8,76 8,46 7,98 8,55 8,29 8,14<br />
Ricote ....................................... 11,47 13,10 9,30 7,25 8,73 10,24 14,19 11,44<br />
San Javier................................. 7,58 6,87 6,17 5,66 6,53 7,18 7,93 6,46<br />
San Pedro <strong>de</strong>l Pinatar............... 7,37 7,17 6,26 6,32 6,77 7,62 8,39 6,87<br />
Santomera ................................ 6,28 6,68 7,84 7,81 6,60 6,49 7,17 7,43<br />
Torre-Pacheco.......................... 6,70 6,96 6,55 5,93 6,16 6,10 6,67 6,87<br />
Torres <strong>de</strong> Cotil<strong>la</strong>s (Las) ............ 5,67 5,93 5,15 5,28 5,92 6,56 7,05 6,07<br />
Totana....................................... 7,88 8,53 8,18 7,84 9,29 9,39 8,75 8,96<br />
Ulea .......................................... 10,74 8,92 8,44 9,87 12,75 11,61 9,31 9,39<br />
Unión (La)................................. 6,03 6,02 5,90 6,32 6,87 7,07 7,57 7,67<br />
Vil<strong>la</strong>nueva <strong>de</strong>l Río Segura ........ 3,36 6,93 10,98 10,47 7,22 7,44 11,41 11,54<br />
Yec<strong>la</strong>......................................... 7,92 7,94 7,43 7,71 8,04 8,08 8,74 8,94<br />
Nota: Tasas en tantos por mil.<br />
Fuente: Consejería <strong>de</strong> Economía y Hacienda. Centro Regional <strong>de</strong> Estadística<br />
Estadísticas Históricas <strong>de</strong> Pob<strong>la</strong>ción <strong>de</strong> <strong>la</strong> Región <strong>de</strong> Murcia.
MNP. Datos Municipales. Tasas.<br />
4.12. EVOLUCIÓN DE LA NUPCIALIDAD. 1976- 1992. (Continúa)<br />
MUNICIPIOS 1976 1977 1978 1979 1980 1981 1982 (1) 1983 (1) 1984 (1)<br />
TOTAL....................................... 7,27 7,10 7,02 6,91 6,85 6,41 3,40 0,95 1,27<br />
Abanil<strong>la</strong>...................................... 4,74 4,14 3,20 3,80 3,75 4,34 2,23 0,48 0,55<br />
Abarán....................................... 5,73 5,82 5,96 5,56 5,72 5,60 2,51 1,07 2,21<br />
Águi<strong>la</strong>s....................................... 8,62 8,74 8,73 8,22 7,64 7,32 3,98 1,06 1,58<br />
Albu<strong>de</strong>ite ................................... 4,81 6,50 7,35 6,11 6,60 8,17 4,16 0,58 0,29<br />
Alcantaril<strong>la</strong>................................. 8,98 8,81 8,16 7,67 7,42 7,16 3,68 0,44 0,53<br />
Alcázares (Los) ........................ .. .. .. .. .. .. .. .. ..<br />
Aledo ......................................... 8,40 6,87 5,89 6,50 4,61 3,24 2,30 1,82 1,81<br />
Alguazas.................................... 7,07 7,25 7,19 8,47 9,74 8,75 4,52 2,20 2,65<br />
Alhama <strong>de</strong> Murcia ..................... 6,36 6,39 7,50 7,42 6,73 6,40 3,39 0,77 0,94<br />
Archena ..................................... 7,15 6,42 5,64 6,58 6,37 5,28 2,77 1,10 1,05<br />
Beniel ........................................ 5,48 6,13 7,28 7,01 4,81 4,81 2,85 0,32 0,71<br />
B<strong>la</strong>nca ....................................... 3,87 3,92 3,88 4,15 4,00 4,63 2,77 0,38 0,68<br />
Bul<strong>la</strong>s......................................... 7,03 7,46 6,11 5,25 5,73 6,57 3,42 1,90 3,67<br />
Ca<strong>la</strong>sparra................................. 4,98 4,31 4,38 5,68 6,14 4,96 2,18 0,90 1,39<br />
Campos <strong>de</strong>l Río......................... 5,67 4,94 3,47 5,63 7,99 6,61 3,85 5,69 6,77<br />
Caravaca <strong>de</strong> <strong>la</strong> Cruz.................. 5,68 5,53 5,96 6,61 6,43 5,99 3,04 0,43 0,66<br />
Cartagena.................................. 7,78 7,67 7,27 6,93 6,65 6,15 3,51 1,43 1,62<br />
Cehegín..................................... 5,33 4,90 4,69 5,60 5,29 5,24 2,77 0,14 0,20<br />
Ceutí.......................................... 5,97 5,62 5,89 7,44 6,11 5,83 3,21 0,26 0,76<br />
Cieza ......................................... 6,07 5,84 6,00 6,33 6,53 6,07 2,87 0,48 0,73<br />
Fortuna ...................................... 6,64 7,97 8,13 7,19 6,30 6,66 3,49 2,23 3,98<br />
Fuente-Á<strong>la</strong>mo............................ 5,40 4,99 4,77 5,20 5,05 4,51 2,31 0,91 2,14<br />
Jumil<strong>la</strong> ....................................... 6,11 6,25 6,13 6,47 7,13 6,69 3,30 0,57 0,50<br />
Libril<strong>la</strong>........................................ 5,68 5,39 6,58 6,51 6,08 4,41 1,13 0,00 0,28<br />
Lorca ......................................... 7,53 6,55 6,73 6,47 5,91 6,19 3,26 0,73 0,88<br />
Lorquí ........................................ 6,29 7,48 7,82 7,27 6,50 5,26 2,54 0,10 0,38<br />
Mazarrón ................................... 6,83 6,54 7,63 8,72 9,02 8,87 4,48 4,16 7,31<br />
Molina <strong>de</strong> Segura ...................... 7,76 8,23 9,27 9,76 8,87 7,65 3,93 0,74 1,07<br />
Moratal<strong>la</strong>.................................... 4,77 4,82 4,65 5,55 5,66 5,76 3,07 0,58 0,94<br />
Mu<strong>la</strong>........................................... 5,69 5,55 5,15 4,90 5,63 5,33 2,01 0,55 0,77<br />
Murcia........................................ 7,86 7,63 7,41 7,07 6,93 6,90 3,74 0,95 1,19<br />
Ojós ........................................... 3,86 6,07 7,33 4,51 1,68 1,55 2,28 4,59 8,46<br />
Pliego ........................................ 6,35 5,33 4,76 3,34 4,15 5,03 2,34 0,29 0,29<br />
Puerto Lumbreras...................... 7,05 7,52 7,30 5,63 6,10 6,25 2,88 0,85 2,83<br />
Ricote ........................................ 2,97 2,74 3,41 3,64 3,05 3,38 1,96 0,54 2,18<br />
San Javier ................................. 6,41 6,54 6,51 6,10 6,69 6,24 3,24 0,93 1,10<br />
San Pedro <strong>de</strong>l Pinatar ............... 8,86 7,13 7,60 7,90 6,03 5,65 4,07 1,14 0,96<br />
Santomera................................. .. .. .. .. .. .. 0,88 0,66 0,52<br />
Torre-Pacheco........................... 7,27 7,07 7,34 7,39 7,70 7,45 3,57 0,31 0,46<br />
Torres <strong>de</strong> Cotil<strong>la</strong>s (Las) ............. 9,96 11,04 9,39 10,17 11,02 8,52 3,85 0,37 0,48<br />
Totana ....................................... 7,56 6,59 6,83 7,05 6,88 6,10 2,81 0,13 0,59<br />
Ulea ........................................... 2,33 3,64 5,29 2,64 0,66 2,13 5,04 3,74 0,83<br />
Unión (La).................................. 6,16 6,17 7,00 7,01 6,69 6,25 2,75 0,57 1,23<br />
Vil<strong>la</strong>nueva <strong>de</strong>l Río Segura......... 7,26 5,35 3,53 3,98 3,46 1,73 4,71 4,07 0,25<br />
Yec<strong>la</strong> ......................................... 7,33 7,69 8,09 7,92 7,05 6,29 3,18 0,48 1,29<br />
Estadísticas Históricas <strong>de</strong> Pob<strong>la</strong>ción <strong>de</strong> <strong>la</strong> Región <strong>de</strong> Murcia.<br />
201
MNP. Datos Municipales. Tasas.<br />
4.12. EVOLUCIÓN DE LA NUPCIALIDAD. 1976- 1992. (Conclusión)<br />
202<br />
MUNICIPIOS 1985 (1) 1986 1987 1988 1989 1990 1991 1992<br />
TOTAL ...................................... 3,61 6,15 6,46 6,46 6,47 6,37 6,28 6,08<br />
Abanil<strong>la</strong>..................................... 2,32 5,24 4,64 3,22 3,70 4,51 5,59 5,40<br />
Abarán ...................................... 4,15 6,44 6,24 6,82 6,36 5,61 5,61 5,64<br />
Águi<strong>la</strong>s...................................... 4,41 6,40 6,17 6,48 5,97 5,75 6,41 6,15<br />
Albu<strong>de</strong>ite................................... 3,44 5,91 3,27 4,58 5,22 5,55 6,02 3,57<br />
Alcantaril<strong>la</strong> ................................ 2,86 6,83 7,23 7,28 7,95 6,95 6,92 6,61<br />
Alcázares (Los) ........................ 2,02 4,74 8,20 9,28 10,07 10,64 11,56 9,28<br />
Aledo ........................................ 1,84 3,33 3,81 2,87 3,36 4,80 4,06 4,07<br />
Alguazas................................... 3,87 5,58 6,45 7,20 6,51 5,25 5,56 7,11<br />
Alhama <strong>de</strong> Murcia..................... 3,00 5,22 5,33 5,77 5,62 5,49 6,24 5,55<br />
Archena .................................... 3,69 7,97 8,11 7,07 7,22 6,83 5,34 5,24<br />
Beniel........................................ 2,55 4,94 5,48 6,48 7,92 7,01 5,89 4,97<br />
B<strong>la</strong>nca....................................... 1,49 2,97 3,88 4,45 4,92 4,76 4,59 5,17<br />
Bul<strong>la</strong>s........................................ 2,97 4,26 6,75 7,00 6,48 7,83 8,14 6,11<br />
Ca<strong>la</strong>sparra ................................ 2,70 4,28 4,88 5,10 5,83 6,64 7,03 7,50<br />
Campos <strong>de</strong>l Río........................ 5,45 6,11 7,82 8,76 5,82 5,30 6,42 6,81<br />
Caravaca <strong>de</strong> <strong>la</strong> Cruz................. 3,51 5,95 6,48 6,04 5,58 5,68 6,46 5,97<br />
Cartagena................................. 3,93 6,29 6,21 6,19 6,22 6,09 6,16 5,72<br />
Cehegín .................................... 3,58 6,61 6,32 5,47 5,02 5,52 5,91 6,11<br />
Ceutí ......................................... 3,66 7,11 7,96 7,41 6,49 7,29 7,50 6,04<br />
Cieza......................................... 3,15 5,79 6,33 6,58 6,56 5,99 3,71 4,19<br />
Fortuna ..................................... 4,83 5,91 6,62 6,10 6,43 8,28 7,84 7,16<br />
Fuente-Á<strong>la</strong>mo ........................... 4,20 6,10 6,53 6,82 7,09 6,24 5,92 5,53<br />
Jumil<strong>la</strong> ...................................... 3,59 6,25 6,12 6,70 6,23 5,63 6,52 6,62<br />
Libril<strong>la</strong> ....................................... 4,95 6,06 4,55 5,61 4,81 5,04 6,77 5,72<br />
Lorca......................................... 3,01 5,75 6,40 5,90 5,79 6,23 6,10 5,59<br />
Lorquí ....................................... 3,16 5,72 6,41 6,85 6,65 6,24 6,38 6,84<br />
Mazarrón................................... 6,92 6,24 6,77 6,81 7,69 7,22 5,04 5,23<br />
Molina <strong>de</strong> Segura...................... 3,44 6,51 7,54 7,75 7,52 7,00 7,26 7,03<br />
Moratal<strong>la</strong>................................... 3,36 5,84 5,68 4,98 4,58 4,96 5,34 4,04<br />
Mu<strong>la</strong>.......................................... 3,21 7,49 8,19 6,98 6,67 6,70 6,17 6,11<br />
Murcia....................................... 3,73 6,49 6,78 6,77 6,79 6,72 6,64 6,56<br />
Ojós .......................................... 7,09 3,84 4,61 5,35 7,03 4,64 1,48 2,24<br />
Pliego........................................ 4,11 7,30 6,68 6,07 5,64 5,75 5,11 4,95<br />
Puerto Lumbreras..................... 4,70 5,05 5,70 4,99 4,69 5,46 5,02 4,72<br />
Ricote ....................................... 4,92 4,27 8,10 8,09 4,79 5,69 4,73 2,64<br />
San Javier................................. 3,37 5,46 6,17 6,93 6,73 6,34 6,74 6,05<br />
San Pedro <strong>de</strong>l Pinatar............... 3,09 5,43 6,13 7,23 7,84 7,35 7,14 6,79<br />
Santomera ................................ 2,78 4,88 5,93 6,86 6,66 6,61 6,46 6,97<br />
Torre-Pacheco.......................... 3,45 6,44 6,71 6,90 8,02 8,04 6,86 6,54<br />
Torres <strong>de</strong> Cotil<strong>la</strong>s (Las) ............ 2,80 5,77 6,80 6,18 6,48 6,63 6,27 6,69<br />
Totana....................................... 2,55 4,61 5,60 5,64 5,44 5,14 5,23 5,74<br />
Ulea .......................................... 2,07 4,46 4,00 1,79 1,82 2,32 3,26 3,76<br />
Unión (La)................................. 3,92 5,44 4,68 4,88 4,87 5,02 5,49 5,40<br />
Vil<strong>la</strong>nueva <strong>de</strong>l Río Segura ........ 0,72 1,44 1,44 1,75 1,44 2,00 1,80 3,04<br />
Yec<strong>la</strong>......................................... 4,01 6,40 6,02 6,24 7,09 6,38 5,41 5,64<br />
Nota: Tasas en tantos por mil.<br />
(1) Las tasas <strong>de</strong>l primer quinquenio <strong>de</strong> los 80 son tan bajas <strong>de</strong>bido a que no incluyen todos los matrimonios religiosos, por no suministrar los párrocos los<br />
correspondientes boletines.<br />
Fuente: Consejería <strong>de</strong> Economía y Hacienda. Centro Regional <strong>de</strong> Estadística<br />
Estadísticas Históricas <strong>de</strong> Pob<strong>la</strong>ción <strong>de</strong> <strong>la</strong> Región <strong>de</strong> Murcia.
MIGRACIONES.
Migraciones Interiores.<br />
5.1. EVOLUCIÓN DE LOS INMIGRANTES, EMIGRANTES Y SALDO MIGRATORIO POR SEXO.<br />
1949-1993.<br />
AÑOS INMIGRANTES EMIGRANTES SALDO MIGRATORIO<br />
Total Hombres Mujeres Total Hombres Mujeres Total Hombres Mujeres<br />
1949 ...................... 20 10 10 130 69 61 -110 -59 -51<br />
1950 ...................... 56 34 22 882 483 399 -826 -449 -377<br />
1951 ...................... 79 51 28 243 125 118 -164 -74 -90<br />
1952 ...................... 92 61 31 304 173 131 -212 -112 -100<br />
1953 ...................... 84 60 24 205 117 88 -121 -57 -64<br />
1954 ...................... 67 39 28 280 169 111 -213 -130 -83<br />
1955 ...................... 88 55 33 354 229 125 -266 -174 -92<br />
1956 ...................... 85 55 30 311 187 124 -226 -132 -94<br />
1957 ...................... 129 74 55 202 118 84 -73 -44 -29<br />
1958 ...................... 113 76 37 135 72 63 -22 4 -26<br />
1959 ...................... 94 50 44 149 82 67 -55 -32 -23<br />
1960 ...................... 143 76 67 109 67 42 34 9 25<br />
1961 ...................... 709 369 340 2.876 1.570 1.306 -2.167 -1.201 -966<br />
1962 ...................... 1.510 780 730 5.378 2.896 2.482 -3.868 -2.116 -1.752<br />
1963 ...................... 2.262 1.154 1.108 6.569 3.581 2.988 -4.307 -2.427 -1.880<br />
1964 ...................... 2.839 1.491 1.348 7.720 4.103 3.617 -4.881 -2.612 -2.269<br />
1965 ...................... 2.786 1.491 1.295 5.957 3.143 2.814 -3.171 -1.652 -1.519<br />
1966 ...................... 2.629 1.297 1.332 3.712 1.928 1.784 -1.083 -631 -452<br />
1967 ...................... 3.326 1.688 1.638 4.673 2.401 2.272 -1.347 -713 -634<br />
1968 ...................... 3.297 1.682 1.615 4.334 2.217 2.117 -1.037 -535 -502<br />
1969 ...................... 3.748 1.883 1.865 5.189 2.623 2.566 -1.441 -740 -701<br />
1970 ...................... 3.342 1.687 1.655 5.365 2.742 2.623 -2.023 -1.055 -968<br />
1971 ...................... 2.064 1.025 1.039 2.156 1.121 1.035 -92 -96 4<br />
1972 ...................... 4.091 2.030 2.061 4.478 2.329 2.149 -387 -299 -88<br />
1973 ...................... 5.111 2.550 2.561 5.430 2.777 2.653 -319 -227 -92<br />
1974 ...................... 5.869 2.930 2.939 6.353 3.211 3.142 -484 -281 -203<br />
1975 ...................... 4.998 2.453 2.545 5.453 2.807 2.646 -455 -354 -101<br />
1976 ...................... 3.070 1.535 1.535 2.745 1.381 1.364 325 154 171<br />
1977 ...................... 6.355 3.146 3.209 5.977 3.024 2.953 378 122 256<br />
1978 ...................... 6.894 3.433 3.461 5.621 2.798 2.823 1.273 635 638<br />
1979 ...................... 7.138 3.547 3.591 5.953 2.980 2.973 1.185 567 618<br />
1980 ...................... 6.144 3.079 3.065 4.778 2.393 2.385 1.366 686 680<br />
1981 ...................... 3.603 1.847 1.756 2.447 1.252 1.195 1.156 595 561<br />
1982 ...................... 6.199 3.136 3.063 4.336 2.191 2.145 1.863 945 918<br />
1983 ...................... 7.213 3.593 3.620 5.545 2.810 2.735 1.668 783 885<br />
1984 ...................... 8.176 4.062 4.114 6.102 3.022 3.080 2.074 1.040 1.034<br />
1985 ...................... 10.745 5.283 5.462 8.081 3.915 4.166 2.664 1.368 1.296<br />
1986 ...................... 5.654 2.839 2.815 4.499 2.325 2.174 1.155 514 641<br />
1987 ...................... 10.455 5.343 5.112 9.188 4.734 4.454 1.267 609 658<br />
1988 ...................... 11.375 5.735 5.640 10.499 5.394 5.105 876 341 535<br />
1989 ...................... 14.463 7.285 7.178 12.290 6.121 6.169 2.173 1.164 1.009<br />
1990 ...................... 14.574 7.301 7.273 13.397 6.687 6.710 1.177 614 563<br />
1991 ...................... 10.609 5.162 5.447 8.996 4.469 4.527 1.613 693 920<br />
1992 ...................... 13.545 6.663 6.882 11.748 5.870 5.878 1.797 793 1.004<br />
1993 ...................... 15.647 7.625 8.022 13.620 6.708 6.912 2.027 917 1.110<br />
Nota: En los años coinci<strong>de</strong>ntes con <strong>la</strong>s Renovaciones Padronales el número <strong>de</strong> migrantes es inferior a <strong>la</strong> <strong>de</strong> los restantes años, ya que durante los meses en los<br />
que se <strong>de</strong>sarrol<strong>la</strong> <strong>la</strong> operación, <strong>la</strong>s migraciones se recogen como nuevas inscripciones en el Padrón Municipal.<br />
Fuente: INE. Anuario Estadístico <strong>de</strong> España.<br />
INE. Migraciones.<br />
Estadísticas Históricas <strong>de</strong> Pob<strong>la</strong>ción <strong>de</strong> <strong>la</strong> Región <strong>de</strong> Murcia.<br />
205
Migraciones Interiores.<br />
5.2. EVOLUCIÓN DE LOS INMIGRANTES POR PROVINCIAS DE PROCEDENCIA. 1962-1993.<br />
(Continúa)<br />
206<br />
PROVINCIAS 1962 1963 1964 1965 1966 1967 1968 1969 1970 1971 1972<br />
TOTAL ...................... 1.510 2.262 2.839 2.786 2.629 3.326 3.297 3.748 3.342 2.064 4.091<br />
Á<strong>la</strong>va......................... - - - 5 11 - 1 - 1 - 10<br />
Albacete.................... 105 152 124 183 181 193 139 98 135 110 182<br />
Alicante..................... 86 116 183 223 214 294 256 305 236 153 288<br />
Almería ..................... 203 185 217 161 64 114 172 199 157 71 151<br />
Asturias..................... 10 - 8 10 14 14 10 14 6 9 6<br />
Ávi<strong>la</strong>.......................... - 10 - 2 1 4 2 8 - 6 10<br />
Badajoz..................... 15 - 15 8 20 14 11 14 22 15 44<br />
Baleares ................... 27 24 43 17 29 35 41 59 22 64 48<br />
Barcelona ................. 134 180 238 226 172 192 290 298 185 103 311<br />
Burgos ...................... - 5 8 5 3 6 - 6 13 2 5<br />
Cáceres .................... 5 3 - 12 15 14 7 7 10 10 17<br />
Cádiz......................... 26 33 36 45 35 67 92 72 105 121 101<br />
Cantabria .................. 7 3 - 4 3 7 5 1 13 6 20<br />
Castellón................... 7 1 3 1 3 22 17 24 31 23 37<br />
Ciudad Real.............. 20 45 46 16 22 42 17 38 54 28 76<br />
Córdoba.................... 18 60 10 54 29 35 61 100 74 98 249<br />
Coruña (La)............... 26 8 35 12 35 35 42 39 41 22 23<br />
Cuenca ..................... 23 32 50 12 18 33 40 21 32 18 31<br />
Gerona...................... 13 3 18 20 24 3 13 3 13 24 30<br />
Granada.................... 24 78 146 213 103 174 129 118 96 47 93<br />
Guada<strong>la</strong>jara .............. 3 9 - 7 2 3 1 4 6 1 3<br />
Guipuzcoa................. 9 12 4 - 7 1 11 7 21 12 6<br />
Huelva....................... 7 10 - 2 - 8 4 21 - 16 5<br />
Huesca ..................... 7 1 - 9 2 3 9 5 7 - 10<br />
Jaén.......................... 11 37 24 81 45 41 36 58 65 33 45<br />
León.......................... - 14 1 9 2 66 10 6 14 2 5<br />
Lérida........................ 11 12 1 14 10 6 19 28 20 11 14<br />
Lugo.......................... 3 - - - 4 3 - 1 - 3 2<br />
Madrid....................... 82 40 84 75 58 108 96 113 146 75 147<br />
Má<strong>la</strong>ga...................... 27 15 42 26 12 55 44 38 44 42 28<br />
Murcia....................... 460 969 1.226 1.099 1.204 1.388 1.281 1.613 1.468 633 1.606<br />
Navarra..................... - 6 3 - - 7 23 - 6 - 21<br />
Orense...................... - - 11 - - - 6 - 6 1 6<br />
Palencia.................... - 1 18 5 1 20 3 6 - 8 3<br />
Palmas (Las) ............ - - 11 3 - 23 4 43 11 15 30<br />
Pontevedra ............... 1 9 - 1 - 10 11 28 5 17 13<br />
Rioja (La) .................. - 6 - 8 5 5 2 - - - -<br />
Sa<strong>la</strong>manca................ - 9 6 4 19 1 1 4 9 3 56<br />
Sta. C. <strong>de</strong> Tenerife.... 13 12 3 14 12 24 15 23 6 10 8<br />
Segovia..................... 10 - 4 9 12 10 4 - 1 - 7<br />
Sevil<strong>la</strong> ....................... 15 13 36 46 10 19 47 14 28 18 15<br />
Soria ......................... - 11 2 6 - - - 2 2 6 -<br />
Tarragona ................. 16 5 46 10 19 36 39 33 14 19 15<br />
Teruel........................ 10 7 12 - 3 - 7 18 10 - 7<br />
Toledo....................... 8 18 17 9 25 16 8 9 17 7 16<br />
Valencia.................... 24 48 78 83 90 104 181 123 101 117 186<br />
Val<strong>la</strong>dolid .................. 2 7 1 1 - 18 11 13 19 19 10<br />
Vizcaya ..................... 6 9 13 17 3 2 4 24 12 15 38<br />
Zamora ..................... 4 10 - 4 4 2 11 2 8 1 19<br />
Zaragoza................... 3 9 - 10 16 7 16 8 12 8 18<br />
Prov. Africanas (2).... 4 6 8 1 16 31 32 51 20 35 -<br />
Ceuta ........................ 20 11 8 4 15 9 16 (1) 29 (1) 18 (1) 5 11<br />
Melil<strong>la</strong>........................ 5 8 - - 37 2 .. .. .. 2 9<br />
(1) Incluye los datos <strong>de</strong> Melil<strong>la</strong>.<br />
Estadísticas Históricas <strong>de</strong> Pob<strong>la</strong>ción <strong>de</strong> <strong>la</strong> Región <strong>de</strong> Murcia.
Migraciones Interiores.<br />
5.2. EVOLUCIÓN DE LOS INMIGRANTES POR PROVINCIAS DE PROCEDENCIA. 1962-1993.<br />
(Continúa)<br />
PROVINCIAS 1973 1974 1975 1976 1977 1978 1979 1980 1981 1982 1983<br />
TOTAL....................... 5.111 5.869 4.998 3.070 6.355 6.894 7.138 6.144 3.603 6.199 7.213<br />
Á<strong>la</strong>va ......................... 4 5 9 6 14 2 14 44 7 11 11<br />
Albacete .................... 362 371 249 145 277 240 287 224 98 183 237<br />
Alicante...................... 478 660 440 369 586 580 651 628 356 528 746<br />
Almería ...................... 259 260 227 154 329 204 247 221 98 198 237<br />
Asturias ..................... 11 4 12 26 7 28 28 26 26 30 24<br />
Ávi<strong>la</strong>........................... 3 3 9 - 23 2 17 9 2 14 6<br />
Badajoz ..................... 17 34 22 5 18 26 33 35 16 53 44<br />
Baleares .................... 39 99 61 33 182 101 113 92 27 129 156<br />
Barcelona .................. 312 574 479 299 529 586 728 673 558 846 854<br />
Burgos ....................... 13 8 19 8 13 27 21 9 18 6 8<br />
Cáceres ..................... 29 19 25 17 50 31 16 24 11 7 31<br />
Cádiz ......................... 40 47 32 64 144 133 140 75 39 95 78<br />
Cantabria................... 12 4 20 - 13 15 14 6 16 21 13<br />
Castellón ................... 44 58 43 7 53 40 58 65 17 65 46<br />
Ciudad Real............... 56 77 73 38 85 47 89 33 47 40 66<br />
Córdoba..................... 90 36 25 17 25 35 25 22 26 64 11<br />
Coruña (La) ............... 23 17 - 55 112 82 92 74 9 46 72<br />
Cuenca ...................... 3 17 11 5 3 12 24 31 19 14 23<br />
Gerona ...................... 16 24 21 9 24 52 44 47 27 76 35<br />
Granada .................... 160 254 177 68 169 188 170 173 90 126 167<br />
Guada<strong>la</strong>jara............... 2 12 11 - 5 6 12 - 5 16 18<br />
Guipuzcoa ................. 10 6 10 11 34 53 37 36 41 67 34<br />
Huelva ....................... 18 9 10 7 7 30 20 29 - 18 8<br />
Huesca ...................... 12 10 16 4 20 1 6 14 5 10 7<br />
Jaén........................... 64 103 97 58 126 101 48 71 34 35 100<br />
León .......................... 27 4 6 8 47 31 29 20 9 13 21<br />
Lérida ........................ 28 30 23 14 37 32 25 11 14 30 24<br />
Lugo .......................... 6 5 3 - 6 9 13 7 - 8 5<br />
Madrid ....................... 266 232 247 178 302 508 498 467 284 542 552<br />
Má<strong>la</strong>ga....................... 53 22 30 21 41 63 56 8 16 21 23<br />
Murcia........................ 1.983 2.122 1.953 814 2.285 2.380 2.483 1.980 1.006 1.950 2.602<br />
Navarra...................... 10 13 7 18 15 29 66 38 25 21 22<br />
Orense....................... 15 16 - 3 5 5 1 1 6 7 -<br />
Palencia..................... 7 12 6 - 14 5 2 - 9 10 4<br />
Palmas (Las) ............. 53 55 44 63 15 98 119 121 54 95 129<br />
Pontevedra ................ 15 11 4 32 83 44 62 22 9 31 9<br />
Rioja (La)................... 4 5 5 - 5 33 6 24 5 10 5<br />
Sa<strong>la</strong>manca ................ 68 13 3 15 3 36 15 11 18 14 20<br />
Sta. C. <strong>de</strong> Tenerife .... 18 28 46 31 27 99 49 25 41 35 35<br />
Segovia ..................... 6 11 15 11 12 16 9 2 - 13 9<br />
Sevil<strong>la</strong>........................ 46 102 41 39 55 53 75 59 38 56 41<br />
Soria .......................... 10 12 11 9 6 11 3 10 3 2 -<br />
Tarragona.................. 43 29 28 61 149 208 173 104 57 110 112<br />
Teruel ........................ 4 7 1 16 11 5 10 1 14 19 20<br />
Toledo ....................... 16 18 26 24 26 19 44 20 39 24 34<br />
Valencia..................... 215 189 221 165 225 383 302 293 217 323 335<br />
Val<strong>la</strong>dolid................... 20 24 6 2 35 23 10 37 16 17 13<br />
Vizcaya...................... 24 55 49 24 38 87 52 111 54 72 34<br />
Zamora ...................... 18 17 4 5 4 9 20 10 - 6 17<br />
Zaragoza ................... 10 25 33 29 29 38 34 41 33 46 57<br />
Prov. Africanas (2)..... 8 26 38 34 - .. .. .. .. .. ..<br />
Ceuta......................... 22 37 23 29 16 20 18 34 12 18 41<br />
Melil<strong>la</strong> ........................ 39 38 27 20 16 28 30 26 32 8 17<br />
Estadísticas Históricas <strong>de</strong> Pob<strong>la</strong>ción <strong>de</strong> <strong>la</strong> Región <strong>de</strong> Murcia.<br />
207
Migraciones Interiores.<br />
5.2. EVOLUCIÓN DE LOS INMIGRANTES POR PROVINCIAS DE PROCEDENCIA. 1962-1993.<br />
(Conclusión)<br />
208<br />
PROVINCIAS 1984 1985 1986 1987 1988 1989 1990 1991 1992 1993<br />
TOTAL ...................... 8.176 10.745 5.654 10.455 11.375 14.463 14.574 10.609 13.545 15.647<br />
Á<strong>la</strong>va......................... 10 12 11 14 21 21 23 17 30 9<br />
Albacete.................... 259 345 214 404 425 544 465 308 388 454<br />
Alicante..................... 880 1.037 653 1.040 1.065 1.391 1.534 1.226 1.787 2.013<br />
Almería ..................... 312 355 148 316 347 523 459 360 544 558<br />
Asturias..................... 29 31 29 39 56 78 36 23 44 56<br />
Ávi<strong>la</strong>.......................... 1 6 4 1 16 31 12 4 4 24<br />
Badajoz..................... 14 33 15 39 44 50 37 41 44 37<br />
Baleares ................... 119 190 107 177 231 270 397 312 341 304<br />
Barcelona ................. 918 941 536 638 589 845 792 635 750 684<br />
Burgos ...................... 14 5 4 24 41 55 33 32 13 30<br />
Cáceres .................... 31 29 18 30 20 40 35 16 31 39<br />
Cádiz......................... 83 128 43 132 124 188 183 145 155 140<br />
Cantabria .................. 8 27 11 28 24 27 26 16 27 20<br />
Castellón................... 55 81 38 67 61 55 88 38 63 57<br />
Ciudad Real.............. 50 84 37 87 93 113 109 65 86 51<br />
Córdoba.................... 52 38 27 49 47 131 114 83 63 71<br />
Coruña (La)............... 66 93 40 45 60 87 86 81 98 140<br />
Cuenca ..................... 22 47 31 19 33 56 43 32 33 77<br />
Gerona...................... 61 53 36 45 49 58 65 74 94 66<br />
Granada.................... 193 267 109 218 268 362 440 257 289 317<br />
Guada<strong>la</strong>jara .............. 15 46 24 33 46 52 12 26 15 28<br />
Guipuzcoa................. 48 30 34 53 61 49 36 19 18 23<br />
Huelva....................... 5 34 14 17 14 24 8 12 17 25<br />
Huesca ..................... 27 23 9 13 9 16 17 5 35 10<br />
Jaén.......................... 98 151 149 256 384 606 426 248 236 232<br />
León.......................... 37 38 17 29 49 70 54 22 24 38<br />
Lérida........................ 40 37 21 30 40 43 21 20 31 44<br />
Lugo.......................... 12 10 5 4 4 11 12 7 6 7<br />
Madrid....................... 590 871 380 911 884 1.057 965 673 900 1.105<br />
Má<strong>la</strong>ga...................... 47 53 32 64 65 84 81 71 80 99<br />
Murcia....................... 3.135 4.246 1.947 4.480 4.827 5.895 6.370 4.662 6.034 7.503<br />
Navarra..................... 19 39 20 31 28 22 41 15 63 41<br />
Orense...................... 7 4 5 4 8 22 7 5 7 12<br />
Palencia.................... 6 16 12 8 20 12 27 4 15 29<br />
Palmas (Las) ............ 93 140 74 192 223 323 266 161 148 210<br />
Pontevedra ............... 23 47 18 30 42 73 81 58 32 50<br />
Rioja (La) .................. 13 37 8 14 14 17 19 5 8 31<br />
Sa<strong>la</strong>manca................ 18 45 11 10 27 40 37 18 41 39<br />
Sta. C. <strong>de</strong> Tenerife.... 38 62 33 73 102 104 117 73 58 56<br />
Segovia..................... 3 22 8 4 9 16 8 11 20 38<br />
Sevil<strong>la</strong> ....................... 58 88 46 55 78 81 77 48 85 102<br />
Soria ......................... 4 18 12 1 12 7 11 5 2 10<br />
Tarragona ................. 117 130 124 146 97 78 83 115 95 77<br />
Teruel........................ 16 26 13 12 13 11 14 19 20 11<br />
Toledo....................... 28 46 17 35 36 65 67 54 28 48<br />
Valencia.................... 296 417 384 338 380 474 484 289 395 411<br />
Val<strong>la</strong>dolid .................. 14 54 34 39 51 55 43 41 50 50<br />
Vizcaya ..................... 82 72 23 70 99 93 67 62 78 64<br />
Zamora ..................... 11 9 3 12 13 14 12 10 11 3<br />
Zaragoza................... 27 45 32 30 71 60 53 35 62 47<br />
Prov. Africanas (2).... .. .. .. .. .. .. .. .. .. ..<br />
Ceuta ........................ 46 35 21 14 21 35 30 30 7 23<br />
Melil<strong>la</strong>........................ 26 52 13 35 34 29 51 21 40 34<br />
(2) A partir <strong>de</strong> 1978 <strong>de</strong>jan <strong>de</strong> aparecer en <strong>la</strong> publicación fuente.<br />
Fuente: INE. Anuario Estadístico <strong>de</strong> España.<br />
INE. Migraciones.<br />
Estadísticas Históricas <strong>de</strong> Pob<strong>la</strong>ción <strong>de</strong> <strong>la</strong> Región <strong>de</strong> Murcia.
Migraciones Interiores.<br />
5.3. EVOLUCIÓN DE LOS EMIGRANTES POR PROVINCIAS DE DESTINO. 1962-1993. (Continúa)<br />
PROVINCIAS 1962 1963 1964 1965 1966 1967 1968 1969 1970 1971 1972<br />
TOTAL....................... 5.378 6.569 7.720 5.957 3.712 4.673 4.334 5.189 5.365 2.156 4.478<br />
Á<strong>la</strong>va ......................... 2 14 4 3 - - 4 - 7 8 -<br />
Albacete .................... 34 24 16 48 22 31 54 67 29 31 59<br />
Alicante...................... 814 1.319 1.654 1.165 426 713 770 993 1.238 347 769<br />
Almería ...................... 18 20 29 26 10 25 40 38 41 17 26<br />
Asturias ..................... 3 - 14 4 1 8 8 10 30 8 5<br />
Ávi<strong>la</strong>........................... - 1 - 2 - 3 - 7 5 - -<br />
Badajoz ..................... 29 - 40 2 10 11 21 8 9 4 -<br />
Baleares .................... 201 145 436 259 187 122 73 40 147 58 89<br />
Barcelona .................. 2.607 2.576 2.680 1.891 983 1.096 804 949 1.203 419 744<br />
Burgos ....................... - 6 - - - 1 8 - 9 8 -<br />
Cáceres ..................... 1 - 7 - 1 15 23 - 1 - 11<br />
Cádiz ......................... 3 19 24 26 5 51 32 42 9 16 22<br />
Cantabria................... - 3 - - 7 9 2 12 19 4 9<br />
Castellón ................... 125 116 133 105 58 110 45 44 38 17 151<br />
Ciudad Real............... 6 17 3 31 6 14 6 10 - 15 10<br />
Córdoba..................... - 8 19 7 13 16 19 22 11 18 11<br />
Coruña (La) ............... 9 1 20 7 19 3 12 14 10 5 40<br />
Cuenca ...................... 6 18 12 11 14 12 19 7 8 6 3<br />
Gerona ...................... 38 59 56 50 23 50 23 29 20 11 57<br />
Granada .................... 15 15 18 24 9 26 35 30 38 19 26<br />
Guada<strong>la</strong>jara............... - - 7 4 - - 3 6 6 - 6<br />
Guipuzcoa ................. 6 15 8 14 8 4 9 4 16 - 10<br />
Huelva ....................... - - 5 - 1 9 8 8 5 2 1<br />
Huesca ...................... 4 5 17 6 - 6 11 7 4 4 4<br />
Jaén........................... 11 27 22 9 14 16 2 18 17 6 15<br />
León .......................... 1 11 - 7 - 1 10 6 8 - 11<br />
Lérida ........................ 40 22 29 17 15 21 7 17 7 7 14<br />
Lugo .......................... 3 - - - 2 - - - 7 6 -<br />
Madrid ....................... 251 381 401 350 247 354 392 429 315 139 208<br />
Má<strong>la</strong>ga....................... 89 4 29 17 2 3 7 13 7 3 24<br />
Murcia........................ 460 969 1.226 1.099 1.204 1.388 1.281 1.613 1.468 633 1.606<br />
Navarra...................... 5 3 5 7 8 18 21 17 8 1 10<br />
Orense....................... - 2 - - 1 1 - 5 4 5 2<br />
Palencia..................... 10 - 2 - - 3 2 2 2 - 1<br />
Palmas (Las) ............. 13 23 18 10 12 55 23 19 14 18 33<br />
Pontevedra ................ - 3 - 13 3 18 9 15 2 6 17<br />
Rioja (La)................... 9 13 13 3 1 5 2 7 5 7 1<br />
Sa<strong>la</strong>manca ................ 3 1 - 4 - - 6 9 1 4 9<br />
Sta. C. <strong>de</strong> Tenerife .... 12 33 19 18 4 13 16 33 26 12 19<br />
Segovia ..................... 6 5 - - - 2 1 4 - 1 8<br />
Sevil<strong>la</strong>........................ 12 22 6 8 2 27 29 21 45 18 15<br />
Soria .......................... - 2 1 4 - - - 7 5 5 1<br />
Tarragona.................. 63 84 113 55 60 29 88 62 35 42 49<br />
Teruel ........................ 8 10 7 4 16 7 13 2 5 - 16<br />
Toledo ....................... - 5 4 25 10 5 8 20 21 4 9<br />
Valencia..................... 385 510 574 517 259 295 344 465 366 171 262<br />
Val<strong>la</strong>dolid................... 17 7 - 15 5 8 10 12 7 5 12<br />
Vizcaya...................... 18 26 17 37 16 22 11 14 27 8 24<br />
Zamora ...................... 4 - - - - 5 1 - 9 - 4<br />
Zaragoza ................... 28 13 13 40 15 25 17 20 27 14 34<br />
Prov. Africanas (2)..... - - - 3 12 6 .. .. .. .. ..<br />
Ceuta......................... - 5 6 10 (1) 1 (1) 11 (1) 5 (1) 12 (1) 24 (1) 18 13<br />
Melil<strong>la</strong> ........................ 9 7 13 .. .. .. .. .. .. 7 8<br />
(1) Incluye los datos <strong>de</strong> Melil<strong>la</strong>.<br />
Estadísticas Históricas <strong>de</strong> Pob<strong>la</strong>ción <strong>de</strong> <strong>la</strong> Región <strong>de</strong> Murcia.<br />
209
Migraciones Interiores.<br />
5.3. EVOLUCIÓN DE LOS EMIGRANTES POR PROVINCIAS DE DESTINO. 1962-1993. (Continúa)<br />
210<br />
PROVINCIAS 1973 1974 1975 1976 1977 1978 1979 1980 1981 1982 1983<br />
TOTAL ...................... 5.430 6.353 5.453 2745 5.977 5.621 5.953 4.778 2.447 4.336 5.545<br />
Á<strong>la</strong>va......................... 1 5 3 - 10 - 4 1 8 6 3<br />
Albacete.................... 52 107 76 29 98 116 117 112 25 69 123<br />
Alicante..................... 993 963 722 358 664 626 600 482 193 391 515<br />
Almería ..................... 56 22 42 48 90 102 87 124 38 49 134<br />
Asturias..................... 11 9 25 13 17 16 9 8 9 9 34<br />
Ávi<strong>la</strong>.......................... 1 9 - 1 2 - - 4 - 1 -<br />
Badajoz..................... 14 9 13 13 9 16 28 14 19 16 24<br />
Baleares ................... 79 94 77 42 63 104 145 166 68 124 151<br />
Barcelona ................. 853 917 662 273 540 363 389 287 114 155 205<br />
Burgos ...................... 1 11 6 34 21 11 11 7 1 5 2<br />
Cáceres .................... 32 9 3 12 11 24 26 2 - 12 10<br />
Cádiz......................... 32 93 31 28 111 103 88 56 59 83 76<br />
Cantabria .................. 2 13 11 7 - 5 13 2 2 9 13<br />
Castellón................... 93 55 80 28 77 79 48 16 17 20 32<br />
Ciudad Real.............. 24 16 15 24 16 13 32 1 4 24 28<br />
Córdoba.................... 13 38 39 20 26 23 52 22 6 19 27<br />
Coruña (La)............... 32 20 15 16 57 42 32 36 8 12 7<br />
Cuenca ..................... 14 1 10 2 1 13 8 4 2 11 7<br />
Gerona...................... 30 48 38 37 40 24 38 65 18 53 45<br />
Granada.................... 48 59 50 43 98 71 95 90 36 51 106<br />
Guada<strong>la</strong>jara .............. - - 3 10 14 1 7 6 10 4 9<br />
Guipuzcoa................. 11 27 15 14 20 17 3 11 3 2 10<br />
Huelva....................... 10 11 11 - 6 3 10 1 - 7 5<br />
Huesca ..................... - 23 - 12 5 1 5 7 1 7 7<br />
Jaén.......................... 8 23 7 7 20 18 23 13 6 23 30<br />
León.......................... - 2 - 5 5 3 - 15 6 11 12<br />
Lérida........................ 11 38 6 8 20 9 17 22 2 11 6<br />
Lugo.......................... 1 - 5 10 7 1 7 - 5 9 15<br />
Madrid....................... 261 454 433 215 523 453 510 415 259 387 448<br />
Má<strong>la</strong>ga...................... 24 9 19 9 33 13 72 36 15 26 5<br />
Murcia....................... 1.983 2.122 1.953 814 2.285 2.380 2.483 1.980 1.006 1.950 2.602<br />
Navarra..................... 18 12 36 11 46 22 5 9 - 18 11<br />
Orense...................... - - 3 3 13 1 2 1 1 - 1<br />
Palencia.................... 4 - 1 - 5 - 10 17 - 7 12<br />
Palmas (Las) ............ 74 60 66 35 91 67 113 105 185 147 170<br />
Pontevedra ............... 21 18 20 13 30 17 12 10 10 23 34<br />
Rioja (La) .................. 11 13 5 6 13 6 5 11 12 5 6<br />
Sa<strong>la</strong>manca................ 1 15 - 9 12 17 25 8 4 1 7<br />
Sta. C. <strong>de</strong> Tenerife.... 9 27 24 12 23 36 50 36 40 27 74<br />
Segovia..................... - 1 4 - 1 8 6 4 11 6 4<br />
Sevil<strong>la</strong> ....................... 21 36 41 66 37 60 49 49 26 58 42<br />
Soria ......................... - 12 3 4 4 1 1 - - - 5<br />
Tarragona ................. 117 387 395 118 279 169 130 104 18 59 35<br />
Teruel........................ - - - 1 9 7 4 5 4 2 1<br />
Toledo....................... 14 9 5 2 30 20 19 23 14 10 19<br />
Valencia.................... 282 415 342 221 356 329 392 232 127 243 299<br />
Val<strong>la</strong>dolid .................. 22 23 15 14 13 32 24 13 2 13 19<br />
Vizcaya ..................... 45 37 41 11 37 18 26 18 17 24 13<br />
Zamora ..................... 1 - 6 - - 1 - 6 - 1 -<br />
Zaragoza................... 46 36 38 36 27 80 28 41 13 43 54<br />
Prov. Africanas (2).... .. .. .. .. .. .. .. .. .. .. ..<br />
Ceuta ........................ 38 24 8 51 (1) 40 46 40 35 8 25 25<br />
Melil<strong>la</strong>........................ 16 21 30 .. 22 34 53 46 15 68 23<br />
(1) Incluye los datos <strong>de</strong> Melil<strong>la</strong>.<br />
Estadísticas Históricas <strong>de</strong> Pob<strong>la</strong>ción <strong>de</strong> <strong>la</strong> Región <strong>de</strong> Murcia.
Migraciones Interiores.<br />
5.3. EVOLUCIÓN DE LOS EMIGRANTES POR PROVINCIAS DE DESTINO. 1962-1993. (Conclusión)<br />
PROVINCIAS 1984 1985 1986 1987 1988 1989 1990 1991 1992 1993<br />
TOTAL....................... 6.102 8.081 4.499 9.188 10.499 12.290 13.397 8.996 11.748 13.620<br />
Á<strong>la</strong>va ......................... 12 4 6 4 7 18 5 6 11 10<br />
Albacete .................... 137 198 77 159 218 242 345 282 303 302<br />
Alicante...................... 647 793 421 949 1.049 1.206 1.355 902 1.155 1442<br />
Almería ...................... 116 120 48 205 323 356 425 206 339 376<br />
Asturias ..................... 14 9 5 9 34 39 37 31 56 42<br />
Ávi<strong>la</strong>........................... 5 4 - 7 6 1 16 7 4 5<br />
Badajoz ..................... 23 27 35 17 25 31 25 41 67 44<br />
Baleares .................... 52 185 91 304 338 409 322 252 276 274<br />
Barcelona .................. 213 245 122 308 438 459 484 281 362 406<br />
Burgos ....................... 3 2 3 4 14 20 16 8 19 9<br />
Cáceres ..................... 21 6 9 20 19 5 23 24 83 62<br />
Cádiz ......................... 58 101 39 122 150 157 156 104 143 135<br />
Cantabria................... 10 19 2 11 30 22 24 29 18 21<br />
Castellón ................... 34 53 62 24 77 88 112 63 80 73<br />
Ciudad Real............... 23 43 18 49 86 63 61 35 37 46<br />
Córdoba..................... 14 52 16 22 45 42 79 54 49 62<br />
Coruña (La) ............... 10 33 6 27 56 51 85 37 88 81<br />
Cuenca ...................... 16 23 6 19 26 27 38 24 40 24<br />
Gerona ...................... 29 39 20 58 23 80 87 43 80 39<br />
Granada .................... 148 144 87 183 222 312 311 187 215 238<br />
Guada<strong>la</strong>jara............... 15 15 4 16 21 14 22 11 21 44<br />
Guipuzcoa ................. 12 13 4 13 5 10 20 4 14 33<br />
Huelva ....................... 4 22 7 23 14 23 40 1 14 37<br />
Huesca ...................... 3 1 5 4 9 9 20 5 11 11<br />
Jaén........................... 34 71 24 114 133 295 279 183 226 183<br />
León .......................... 10 17 5 6 10 17 17 8 19 18<br />
Lérida ........................ 15 17 3 31 17 18 20 11 14 19<br />
Lugo .......................... 6 7 1 3 4 16 3 - 7 14<br />
Madrid ....................... 399 611 466 683 813 902 1.135 501 701 736<br />
Má<strong>la</strong>ga....................... 34 19 79 59 102 76 102 61 72 71<br />
Murcia........................ 3.135 4.246 1.947 4.480 4.827 5.895 6.370 4.662 6.034 7.503<br />
Navarra...................... 6 38 8 22 27 27 20 9 24 22<br />
Orense....................... 3 8 3 2 11 11 8 2 3 8<br />
Palencia..................... 5 6 5 7 8 11 5 7 15 14<br />
Palmas (Las) ............. 119 133 264 394 328 300 188 130 117 149<br />
Pontevedra ................ 32 36 15 22 53 35 61 8 29 41<br />
Rioja (La)................... 10 7 2 10 15 3 31 6 6 25<br />
Sa<strong>la</strong>manca ................ 11 18 6 12 20 16 23 22 10 15<br />
Sta. C. <strong>de</strong>Tenerife ..... 61 62 50 100 142 85 90 59 120 65<br />
Segovia ..................... 1 3 1 4 10 13 9 17 16 34<br />
Sevil<strong>la</strong>........................ 33 92 38 57 60 106 128 85 73 101<br />
Soria .......................... 10 11 3 13 4 1 6 7 8 1<br />
Tarragona.................. 75 48 14 59 72 69 89 89 76 73<br />
Teruel ........................ 16 18 4 5 2 4 7 12 4 14<br />
Toledo ....................... 29 22 14 24 40 55 46 30 46 54<br />
Valencia..................... 256 282 341 376 380 463 456 311 412 460<br />
Val<strong>la</strong>dolid................... 37 26 24 19 45 22 29 21 28 20<br />
Vizcaya...................... 32 28 20 17 19 45 32 21 34 25<br />
Zamora ...................... 8 11 - 1 3 9 15 - 8 17<br />
Zaragoza ................... 43 25 31 52 54 69 56 24 81 38<br />
Prov. Africanas (2)..... .. .. .. .. .. .. .. .. .. ..<br />
Ceuta......................... 40 33 16 28 32 18 23 33 33 11<br />
Melil<strong>la</strong> ........................ 23 35 22 31 33 25 41 40 47 73<br />
(2) A partir <strong>de</strong> 1968 <strong>de</strong>jan <strong>de</strong> aparecer en <strong>la</strong> publicación fuente.<br />
Fuente: INE. Anuario Estadístico <strong>de</strong> España.<br />
INE. Migraciones.<br />
Estadísticas Históricas <strong>de</strong> Pob<strong>la</strong>ción <strong>de</strong> <strong>la</strong> Región <strong>de</strong> Murcia.<br />
211
Migraciones Interiores.<br />
5.4. EVOLUCIÓN DE LOS INMIGRANTES POR SEXO, EDAD Y ESTADO CIVIL. 1962-1993.<br />
212<br />
AÑOS TOTAL Hombres Mujeres<br />
SEXO EDAD(*) ESTADO CIVIL (1)<br />
< 16<br />
años<br />
16-24<br />
años<br />
25-64<br />
años<br />
65 y más<br />
años<br />
Solteros Casados Viudos Divorc.<br />
y separ.<br />
1962............................... 1.510 780 730 533 258 673 46 816 642 52 -<br />
1963............................... 2.262 1.154 1.108 730 386 1.041 105 1.154 1.031 77 -<br />
1964............................... 2.839 1.491 1.348 889 529 1.296 125 1.504 1.236 99 -<br />
1965............................... 2.786 1.421 1.365 891 510 1.224 161 1.490 1.183 113 -<br />
1966............................... 2.629 1.297 1.332 920 406 1.156 147 1.359 1.156 114 -<br />
1967............................... 3.326 1.688 1.638 1.153 613 1.402 158 1.782 1.435 109 -<br />
1968............................... 3.297 1.682 1.615 1.098 583 1.442 174 1.726 1.462 109 -<br />
1969............................... 3.748 1.883 1.865 1.268 681 1.602 197 1.990 1.616 142 -<br />
1970............................... 3.342 1.687 1.655 1.160 617 1.354 211 1.779 1.422 141 -<br />
1971............................... 2.064 1.025 1.039 798 322 836 108 1.149 843 72 -<br />
1972............................... 4.091 2.030 2.061 1.356 702 1.739 294 2.042 1.887 162 -<br />
1973............................... 5.111 2.550 2.561 1.601 1.066 2.182 262 2.563 2.398 150 -<br />
1974............................... 5.869 2.930 2.939 1.801 1.194 2.566 308 2.851 2.833 185 -<br />
1975............................... 4.998 2.453 2.545 1.467 1.041 2.187 303 2.401 2.409 188 -<br />
1976............................... 3.070 1.535 1.535 1.022 540 1.320 188 1.559 1.416 95 -<br />
1977............................... 6.355 3.146 3.209 2.016 1.268 2.747 324 3.063 3.083 209 -<br />
1978............................... 6.894 3.433 3.461 2.177 1.370 3.030 317 3.231 3.441 222 -<br />
1979............................... 7.138 3.547 3.591 2.220 1.381 3.108 429 3.457 3.439 242 -<br />
1980............................... 6.144 3.079 3.065 1.811 1.279 2.734 320 2.938 3.032 174 -<br />
1981............................... 3.603 1.847 1.756 1.148 736 1.553 166 1.804 1.689 110 -<br />
1982............................... 6.199 3.136 3.063 1.918 1.202 2.795 284 3.034 2.981 184 -<br />
1983............................... 7.213 3.593 3.620 2.142 1.423 3.263 385 3.396 3.552 190 75<br />
1984............................... 8.176 4.062 4.114 2.435 1.696 3.668 377 4.038 3.858 201 79<br />
1985............................... 10.745 5.283 5.462 2.982 2.354 5.005 404 5.278 5.123 228 116<br />
1986............................... 5.654 2.839 2.815 1.394 1.310 2.702 248 2.926 2.536 122 70<br />
1987............................... 10.455 5.343 5.112 2.597 2.230 5.098 530 5.233 4.860 223 139<br />
1988............................... 11.375 5.735 5.640 2.712 2.790 5.348 525 6.057 4.898 237 183<br />
1989............................... 14.463 7.285 7.178 3.249 3.522 6.970 722 7.549 6.303 348 263<br />
1990............................... 14.574 7.301 7.273 3.342 3.371 7.232 629 7.821 6.192 291 270<br />
1991............................... 10.609 5.162 5.447 2.427 2.584 5.118 480 .. .. .. ..<br />
1992............................... 13.545 6.663 6.882 2.986 3.467 6.452 640 .. .. .. ..<br />
1993............................... 15.647 7.625 8.022 3.510 3.796 7.577 764 .. .. .. ..<br />
(*) Des<strong>de</strong> el año 1962 hasta 1982 los dos primeros grupos <strong>de</strong> edad son menores <strong>de</strong> 15 años y <strong>de</strong> 15 a 24 años.<br />
(1) A partir <strong>de</strong> 1991 no se recoge el estado civil.<br />
Fuente: INE. Anuario Estadístico <strong>de</strong> España.<br />
INE. Migraciones.<br />
Estadísticas Históricas <strong>de</strong> Pob<strong>la</strong>ción <strong>de</strong> <strong>la</strong> Región <strong>de</strong> Murcia.
Migraciones Interiores.<br />
5.5. EVOLUCIÓN DE LOS EMIGRANTES POR SEXO, EDAD Y ESTADO CIVIL. 1962-1993.<br />
AÑOS TOTAL Hombres Mujeres<br />
Estadísticas Históricas <strong>de</strong> Pob<strong>la</strong>ción <strong>de</strong> <strong>la</strong> Región <strong>de</strong> Murcia.<br />
SEXO EDAD(*) ESTADO CIVIL (1)<br />
< 16<br />
años<br />
16-24<br />
años<br />
25-64<br />
años<br />
65 y más<br />
años<br />
Solteros Casados Viudos Divorc.<br />
y separ.<br />
1962 .............................. 5.378 2.896 2.482 1.621 1.269 2.306 182 3.068 2.100 210 -<br />
1963 .............................. 6.569 3.581 2.988 1.989 1.463 2.856 261 3.612 2.703 254 -<br />
1964 .............................. 7.720 4.103 3.617 2.273 1.786 3.382 279 4.171 3.297 252 -<br />
1965 .............................. 5.957 3.143 2.814 1.763 1.283 2.634 277 3.191 2.527 239 -<br />
1966 .............................. 3.712 1.928 1.784 1.151 745 1.614 202 1.951 1.600 161 -<br />
1967 .............................. 4.673 2.401 2.272 1.426 1.103 1.950 194 2.552 1.938 183 -<br />
1968 .............................. 4.334 2.217 2.117 1.321 940 1.849 224 2.294 1.878 162 -<br />
1969 .............................. 5.189 2.623 2.566 1.640 1.112 2.193 244 2.797 2.186 206 -<br />
1970 .............................. 5.365 2.742 2.623 1.771 1.126 2.207 261 2.985 2.152 228 -<br />
1971 .............................. 2.156 1.121 1.035 725 427 891 113 1.197 870 89 -<br />
1972 .............................. 4.478 2.329 2.149 1.443 931 1.828 276 2.367 1.945 166 -<br />
1973 .............................. 5.430 2.777 2.653 1.716 1.213 2.262 239 2.775 2.478 177 -<br />
1974 .............................. 6.353 3.211 3.142 1.992 1.423 2.646 292 3.207 2.941 205 -<br />
1975 .............................. 5.453 2.807 2.646 1.959 1.228 2.401 229 2.657 2.599 197 -<br />
1976 .............................. 2.745 1.381 1.364 862 560 1.177 146 1.393 1.265 87 -<br />
1977 .............................. 5.977 3.024 2.953 1.843 1.313 2.555 266 2.912 2.875 190 -<br />
1978 .............................. 5.621 2.798 2.823 1.732 1.217 2.431 241 2.704 2.738 179 -<br />
1979 .............................. 5.953 2.980 2.973 1.769 1.315 2.549 320 2.881 2.879 193 -<br />
1980 .............................. 4.778 2.393 2.385 1.319 1.107 2.116 236 2.236 2.407 135 -<br />
1981 .............................. 2.447 1.252 1.195 736 560 1.039 112 1.243 1.128 76 -<br />
1982 .............................. 4.336 2.191 2.145 1.270 921 1.954 191 2.101 2.098 137 -<br />
1983 .............................. 5.545 2.810 2.735 1.716 1.109 2.466 254 2.663 2.692 146 44<br />
1984 .............................. 6.102 3.022 3.080 1.881 1.239 2.739 243 2.994 2.922 140 46<br />
1985 .............................. 8.081 3.915 4.166 2.191 1.773 3.793 324 3.916 3.914 180 71<br />
1986 .............................. 4.499 2.325 2.174 1.155 1.024 2.169 151 2.277 2.073 92 57<br />
1987 .............................. 9.188 4.734 4.454 2.416 2.044 4.385 343 4.786 4.132 151 119<br />
1988 .............................. 10.499 5.394 5.105 2.571 2.623 4.958 347 5.620 4.499 195 185<br />
1989 .............................. 12.290 6.121 6.169 2.774 3.053 6.007 456 6.498 5.301 280 211<br />
1990 .............................. 13.397 6.687 6.710 3.130 3.190 6.584 493 7.125 5.730 273 269<br />
1991 .............................. 8.996 4.469 4.527 2.044 2.205 4.358 389 .. .. .. ..<br />
1992 .............................. 11.748 5.870 5.878 2.703 2.925 5.667 453 .. .. .. ..<br />
1993 .............................. 13.620 6.708 6.912 3.028 3.395 6.617 580 .. .. .. ..<br />
(*) Des<strong>de</strong> el año 1962 hasta 1982 los primeros grupos <strong>de</strong> edad son menores <strong>de</strong> 15 años y <strong>de</strong> 15 a 24 años.<br />
(1) A partir <strong>de</strong> 1991 no se recoge el estado civil.<br />
Fuente: INE. Anuario Estadístico <strong>de</strong> España.<br />
INE. Migraciones.<br />
213
Migraciones Interiores.<br />
5.6.1. EVOLUCIÓN DE LOS INMIGRANTES POR TIPOS DE ACTIVIDAD. 1962-1968.<br />
214<br />
AÑOS TOTAL NO<br />
ACTIVOS<br />
Empresarios<br />
y Altos<br />
Cargos<br />
Profesionales<br />
Técnicos y<br />
Afines<br />
Admtvos.<br />
Dependientes<br />
y Simi<strong>la</strong>res<br />
ACTIVOS<br />
Servidores<br />
Domésticos<br />
y Subalter.<br />
Obreros<br />
Cualificados<br />
Obreros No<br />
Cualificados<br />
1962............................... 1.510 1.076 14 50 51 16 74 229<br />
1963............................... 2.262 1.591 15 44 98 23 246 245<br />
1964............................... 2.839 1.850 28 70 148 20 368 355<br />
1965............................... 2.786 1.895 17 48 127 35 293 371<br />
1966............................... 2.629 1.880 13 170 151 30 172 213<br />
1967............................... 3.326 2.305 11 230 171 37 297 275<br />
1968............................... 3.297 2.306 18 129 220 53 278 293<br />
Fuente: INE. Anuario Estadístico <strong>de</strong> España.<br />
5.6.2. EVOLUCIÓN DE LOS INMIGRANTES POR TIPOS DE ACTIVIDAD. 1969-1986.<br />
AÑOS TOTAL<br />
NO<br />
ACTIVOS Profesionales<br />
y<br />
Técnicos<br />
Personal<br />
Admtvo.<br />
Comerciantes<br />
y<br />
Ven<strong>de</strong>d.<br />
Trabajad.<br />
<strong>de</strong> los<br />
Servicios<br />
ACTIVOS<br />
Agricult.<br />
Gana<strong>de</strong>r.<br />
y Pescad.<br />
Trabajad.<br />
y Peones<br />
<strong>de</strong> <strong>la</strong><br />
Industria<br />
Funcion.<br />
Públicos<br />
Super. y<br />
Direct. <strong>de</strong><br />
Empresas<br />
Fuerzas<br />
Armadas<br />
Otros<br />
Activos<br />
1969...................... 3.748 2.663 135 135 34 67 129 435 .. .. 150<br />
1970...................... 3.342 2.394 126 115 31 65 127 315 .. .. 169<br />
1971...................... 2.064 1.512 59 80 19 33 77 156 .. .. 128<br />
1972...................... 4.091 2.890 169 158 50 146 229 300 .. .. 149<br />
1973...................... 5.111 3.507 377 194 81 190 237 475 .. .. 50<br />
1974...................... 5.869 4.048 350 229 85 130 321 582 .. .. 124<br />
1975...................... 4.998 3.429 317 194 80 120 257 460 .. .. 141<br />
1976...................... 3.070 2.181 230 132 34 55 104 198 .. .. 136<br />
1977...................... 6.355 4.360 482 274 97 177 230 480 .. .. 255<br />
1978...................... 6.894 4.695 618 305 91 177 211 519 .. .. 278<br />
1979...................... 7.138 4.905 519 389 107 234 201 560 .. .. 223<br />
1980...................... 6.144 4.173 482 307 87 217 235 461 .. .. 182<br />
1981...................... 3.603 2.494 268 216 68 118 93 227 .. .. 119<br />
1982...................... 6.199 4.198 533 318 121 184 118 423 .. .. 304<br />
1983...................... 7.213 4.832 535 227 139 254 216 649 105 219 37<br />
1984...................... 8.176 5.439 722 209 130 325 357 624 131 207 32<br />
1985...................... 10.745 6.786 1.056 536 243 486 337 746 106 296 153<br />
1986...................... 5.654 3.360 745 209 112 216 236 495 52 123 106<br />
Fuente: INE. Anuario Estadístico <strong>de</strong> España.<br />
INE. Migraciones.<br />
Estadísticas Históricas <strong>de</strong> Pob<strong>la</strong>ción <strong>de</strong> <strong>la</strong> Región <strong>de</strong> Murcia.
Migraciones Interiores.<br />
5.7.1. EVOLUCIÓN DE LOS EMIGRANTES POR TIPOS DE ACTIVIDAD. 1962-1968.<br />
AÑOS TOTAL NO<br />
ACTIVOS<br />
Estadísticas Históricas <strong>de</strong> Pob<strong>la</strong>ción <strong>de</strong> <strong>la</strong> Región <strong>de</strong> Murcia.<br />
Empresarios<br />
y Altos<br />
Cargos<br />
Profesionales<br />
Técnicos y<br />
Afines<br />
Admtvos.<br />
Dependientes<br />
y Simi<strong>la</strong>res<br />
ACTIVOS<br />
Servidores<br />
Domésticos<br />
y Subalter.<br />
Obreros<br />
Cualificados<br />
Obreros No<br />
Cualificados<br />
1962 .............................. 5.378 3.225 21 122 219 57 921 813<br />
1963 .............................. 6.569 4.005 36 164 283 64 1.125 892<br />
1964 .............................. 7.720 4.538 23 154 354 78 1.367 1.206<br />
1965 .............................. 5.957 3.659 24 162 292 72 976 772<br />
1966 .............................. 3.712 2.382 8 209 209 49 449 406<br />
1967 .............................. 4.673 3.022 20 265 242 67 572 485<br />
1968 .............................. 4.334 2.967 22 127 303 82 500 333<br />
Fuente: INE. Anuario Estadístico <strong>de</strong> España.<br />
5.7.2. EVOLUCIÓN DE LOS EMIGRANTES POR TIPOS DE ACTIVIDAD. 1969-1986.<br />
AÑOS TOTAL<br />
NO<br />
ACTIVOS Profesionales<br />
y<br />
Técnicos<br />
Personal<br />
Admtvo.<br />
Comerciantes<br />
y<br />
Ven<strong>de</strong>d.<br />
Trabajad.<br />
<strong>de</strong> los<br />
Servicios<br />
ACTIVOS<br />
Agricult.<br />
Gana<strong>de</strong>r.<br />
y Pescad.<br />
Trabajad.<br />
y Peones<br />
<strong>de</strong> <strong>la</strong><br />
Industria<br />
Funcion.<br />
Públicos<br />
Super. y<br />
Direct. <strong>de</strong><br />
Empresas<br />
Fuerzas<br />
Armadas<br />
Otros<br />
Activos<br />
1969 ..................... 5.189 3.473 173 173 63 111 180 857 .. .. 159<br />
1970 ..................... 5.365 3.583 161 165 91 119 156 894 .. .. 196<br />
1971 ..................... 2.156 1.484 65 65 27 45 84 279 .. .. 107<br />
1972 ..................... 4.478 3.014 160 171 82 134 179 611 .. .. 127<br />
1973 ..................... 5.430 3.624 273 193 77 164 182 833 .. .. 84<br />
1974 ..................... 6.353 4.256 334 263 78 158 224 898 .. .. 142<br />
1975 ..................... 5.453 3.564 357 225 85 154 180 755 .. .. 133<br />
1976 ..................... 2.745 1.868 225 117 44 74 81 251 .. .. 85<br />
1977 ..................... 5.977 3.939 462 277 107 208 167 612 .. .. 205<br />
1978 ..................... 5.621 3.694 510 260 81 220 185 516 .. .. 155<br />
1979 ..................... 5.953 3.983 494 276 96 229 154 560 .. .. 161<br />
1980 ..................... 4.778 3.086 423 233 98 192 164 448 .. .. 134<br />
1981 ..................... 2.447 1.666 244 121 40 81 56 166 .. .. 73<br />
1982 ..................... 4.336 2.856 389 207 118 149 76 347 .. .. 194<br />
1983 ..................... 5.545 3.614 471 212 138 229 129 461 56 186 49<br />
1984 ..................... 6.102 3.956 554 208 98 274 234 472 74 189 43<br />
1985 ..................... 8.081 5.060 733 410 207 435 229 630 66 233 78<br />
1986 ..................... 4.499 2.805 357 165 89 178 141 442 40 144 138<br />
Fuente: INE. Anuario Estadístico <strong>de</strong> España.<br />
INE. Migraciones.<br />
215
Migraciones Interiores.<br />
5.8. EVOLUCIÓN DE LOS INMIGRANTES POR TITULACIÓN ACADÉMICA. 1988-1993.<br />
216<br />
AÑOS TOTAL ANALFA-<br />
BETOS<br />
SIN SEGUNDO GRADO TERCER GRADO NO<br />
ESTUDIOS<br />
COMPLE-<br />
TOS<br />
PRIMER<br />
GRADO<br />
Primer<br />
Ciclo<br />
Segundo<br />
Ciclo<br />
Escuel.<br />
Univ. y<br />
Equival.<br />
Facul.<br />
Univ. y<br />
E.T.S.<br />
Doctorado<br />
CLASIFICAB.<br />
Y NO BIEN<br />
ESPECIFIC.<br />
1988...................... 11.375 53 4.014 2.633 1.936 1.572 454 680 23 10<br />
1989...................... 14.463 26 5.835 2.627 2.479 2.111 546 790 18 31<br />
1990...................... 14.574 23 5.568 2.538 2.553 2.341 644 760 22 125<br />
1991...................... 10.609 6 5.991 1.943 2.650 (1) .. .. .. .. 19<br />
1992...................... 13.545 29 8.976 2.638 1.876 (1) .. .. .. .. 26<br />
1993...................... 15.647 1.307 6.043 5.408 2.888 (1) .. .. .. .. 1<br />
(1) Incluidos 2º y 3º grado.<br />
Fuente: INE. Migraciones.<br />
5.9. EVOLUCIÓN DE LOS EMIGRANTES POR TITULACIÓN ACADÉMICA. 1988-1993.<br />
AÑOS TOTAL ANALFA-<br />
BETOS<br />
SIN SEGUNDO GRADO TERCER GRADO NO<br />
ESTUDIOS<br />
COMPLE-<br />
TOS<br />
PRIMER<br />
GRADO<br />
Primer<br />
Ciclo<br />
Segundo<br />
Ciclo<br />
Escuel.<br />
Univ. y<br />
Equival.<br />
Facul.<br />
Univ. y<br />
E.T.S.<br />
Doctorado CLASIFICAB.<br />
Y NO BIEN<br />
ESPECIFIC.<br />
1988...................... 10.499 165 3.462 2.120 1.832 1.568 473 610 30 239<br />
1989...................... 12.290 185 4.102 2.283 2.112 2.090 514 687 11 306<br />
1990...................... 13.397 170 4.520 2.217 2.368 2.244 649 800 25 404<br />
1991...................... 8.996 71 4.693 1.710 2.387 (1) .. .. .. .. 135<br />
1992...................... 11.748 172 6.608 2.306 2.537 (1) .. .. .. .. 125<br />
1993...................... 13.620 1.212 5.136 4.218 2.955 (1) .. .. .. .. 99<br />
(1) Incluidos 2º y 3º grado.<br />
Fuente: INE. Migraciones.<br />
Estadísticas Históricas <strong>de</strong> Pob<strong>la</strong>ción <strong>de</strong> <strong>la</strong> Región <strong>de</strong> Murcia.
Migraciones Exteriores.<br />
5.10. EVOLUCIÓN DE LOS INMIGRANTES PROCEDENTES DEL EXTRANJERO POR SEXO,<br />
GRUPOS DE EDAD Y ESTADO CIVIL. ESPAÑOLES Y EXTRANJEROS. 1983-1993.<br />
AÑOS TOTAL Hombres Mujeres<br />
Estadísticas Históricas <strong>de</strong> Pob<strong>la</strong>ción <strong>de</strong> <strong>la</strong> Región <strong>de</strong> Murcia.<br />
SEXO EDAD ESTADO CIVIL (*)<br />
< 16<br />
años<br />
16-24<br />
años<br />
25-64<br />
años<br />
65 y más<br />
años<br />
Solteros Casados Viudos Divorc.<br />
y separ.<br />
1983<br />
Españoles................ 596 309 287 185 73 319 19 266 314 9 7<br />
Extranjeros............... 43 25 18 6 8 26 3 15 23 2 3<br />
1984<br />
Españoles................ 469 234 235 131 64 258 16 203 251 9 6<br />
Extranjeros............... 97 51 46 24 10 55 8 34 56 3 4<br />
1985<br />
Españoles................ 466 247 219 114 65 256 31 198 257 8 3<br />
Extranjeros............... 49 25 24 11 8 29 1 29 17 1 2<br />
1986<br />
Españoles................ 358 189 169 89 33 216 20 130 207 18 3<br />
Extranjeros............... 62 37 25 13 15 32 2 29 28 2 3<br />
1987<br />
Españoles................ 433 228 205 99 60 252 22 182 233 11 7<br />
Extranjeros............... 59 33 26 4 8 45 2 16 40 - 3<br />
1988<br />
Españoles................ 411 214 197 96 59 233 23 187 197 19 8<br />
Extranjeros............... 80 44 36 19 14 38 9 34 42 - 4<br />
1989<br />
Españoles................ 783 395 388 181 117 447 38 352 409 6 16<br />
Extranjeros............... 167 86 81 38 19 98 12 69 89 3 6<br />
1990<br />
Españoles................ 753 419 334 186 102 422 43 336 381 17 19<br />
Extranjeros............... 171 90 81 32 41 93 5 78 84 2 7<br />
1991<br />
Españoles................ 594 322 272 150 70 332 42 .. .. .. ..<br />
Extranjeros............... 137 91 46 19 18 92 8 .. .. .. ..<br />
1992<br />
Españoles................ 695 383 312 169 84 409 33 .. .. .. ..<br />
Extranjeros............... 373 300 73 25 64 273 11 .. .. .. ..<br />
1993<br />
Españoles................ 405 221 184 84 63 227 31 .. .. .. ..<br />
Extranjeros............... 474 323 151 92 54 312 16 .. .. .. ..<br />
(*) A partir <strong>de</strong> 1991 no se recoge el estado civil.<br />
Fuente: INE. Anuario Estadístico <strong>de</strong> España.<br />
INE. Migraciones.<br />
217
Migraciones Exteriores.<br />
5.11. EVOLUCIÓN DE LOS INMIGRANTES PROCEDENTES DEL EXTRANJERO POR PAÍS DE<br />
PROCEDENCIA. 1983-1993. (Continúa)<br />
218<br />
EUROPA COMUNITARIA<br />
AÑOS TOTAL Total Alemania Bélgica Dinamarca Francia Reino Unido<br />
1983<br />
Españoles ....................... 596 488 151 34 - 267 6<br />
Extranjeros...................... 43 28 3 1 - 15 1<br />
1984<br />
Españoles ....................... 469 402 142 21 1 211 4<br />
Extranjeros...................... 97 81 15 13 - 30 5<br />
1985<br />
Españoles ....................... 466 380 87 23 - 218 16<br />
Extranjeros...................... 49 16 4 1 - 1 -<br />
1986<br />
Españoles ....................... 358 304 84 14 - 191 6<br />
Extranjeros...................... 62 26 8 3 - 2 8<br />
1987<br />
Españoles ....................... 433 365 94 19 - 227 9<br />
Extranjeros...................... 59 39 7 - 1 11 13<br />
1988<br />
Españoles ....................... 411 337 56 23 - 251 2<br />
Extranjeros...................... 80 52 12 4 - 16 14<br />
1989<br />
Españoles ....................... 783 575 98 30 1 422 6<br />
Extranjeros...................... 167 79 12 19 - 14 19<br />
1990<br />
Españoles ....................... 753 565 120 19 1 390 14<br />
Extranjeros...................... 171 71 19 - - 27 14<br />
1991<br />
Españoles ....................... 594 416 82 25 - 293 7<br />
Extranjeros...................... 137 33 6 3 2 6 11<br />
1992<br />
Españoles ....................... 694 438 100 19 - 299 11<br />
Extranjeros...................... 373 63 10 3 - 28 9<br />
1993<br />
Españoles ....................... 405 220 56 11 - 144 5<br />
Extranjeros...................... 474 106 24 6 - 32 20<br />
Estadísticas Históricas <strong>de</strong> Pob<strong>la</strong>ción <strong>de</strong> <strong>la</strong> Región <strong>de</strong> Murcia.
Migraciones Exteriores.<br />
5.11. EVOLUCIÓN DE LOS INMIGRANTES PROCEDENTES DEL EXTRANJERO POR PAÍS DE<br />
PROCEDENCIA. 1983-1993. (Continúa)<br />
Estadísticas Históricas <strong>de</strong> Pob<strong>la</strong>ción <strong>de</strong> <strong>la</strong> Región <strong>de</strong> Murcia.<br />
EUROPA COMUNITARIA EUROPA NO COMUNITARIA<br />
AÑOS Italia Luxemburgo Paises Bajos Portugal Otros Paises Total Andorra<br />
1983<br />
Españoles....................... .. 4 23 - 3 (1) 61 ..<br />
Extranjeros...................... .. - 5 1 2 (1) 5 ..<br />
1984<br />
Españoles....................... - 1 21 1 - 22 -<br />
Extranjeros...................... .. - 13 1 4 (1) 1 ..<br />
1985<br />
Españoles....................... - 16 19 1 - 49 2<br />
Extranjeros...................... 5 - 3 2 - 1 -<br />
1986<br />
Españoles....................... - 1 1 7 - 45 1<br />
Extranjeros...................... - 1 4 - - 7 -<br />
1987<br />
Españoles....................... 2 7 7 - - 27 -<br />
Extranjeros...................... 1 - 6 - - 1 -<br />
1988<br />
Españoles....................... 2 - 2 - 1 40 4<br />
Extranjeros...................... 1 - 1 4 - 9 -<br />
1989<br />
Españoles....................... 6 1 11 - - 90 2<br />
Extranjeros...................... 4 - 8 3 - 15 -<br />
1990<br />
Españoles....................... 7 2 10 2 - 86 1<br />
Extranjeros...................... 2 1 1 7 - 17 -<br />
1991<br />
Españoles....................... 6 1 2 - - 98 6<br />
Extranjeros...................... 2 - 1 2 - 6 -<br />
1992<br />
Españoles....................... 2 1 5 1 - 186 16<br />
Extranjeros...................... 7 1 1 4 - 10 -<br />
1993<br />
Españoles....................... - - 3 1 - 101 8<br />
Extranjeros...................... 14 - 6 4 - 42 1<br />
(1) Este épigrafe “otros paises” incluye a los <strong>de</strong> <strong>la</strong> Europa comunitaria y no comunitaria.<br />
219
Migraciones Exteriores.<br />
5.11. EVOLUCIÓN DE LOS INMIGRANTES PROCEDENTES DEL EXTRANJERO POR PAÍS DE<br />
PROCEDENCIA. 1983-1993. (Continúa)<br />
220<br />
EUROPA NO COMUNITARIA AFRICA<br />
AÑOS Suecia Suiza Otros Paises Total Argelia Marruecos Otros Paises<br />
1983<br />
Españoles ....................... 2 59 .. 10 2 5 3<br />
Extranjeros...................... .. 5 .. 5 - 4 1<br />
1984<br />
Españoles ....................... - 22 - 6 - 5 1<br />
Extranjeros...................... - 1 .. 6 1 2 3<br />
1985<br />
Españoles ....................... 5 42 - 7 - 7 -<br />
Extranjeros...................... 1 - - 11 - 7 4<br />
1986<br />
Españoles ....................... - 41 3 1 1 - -<br />
Extranjeros...................... - - 7 5 - 3 2<br />
1987<br />
Españoles ....................... - 27 - 2 - 2 -<br />
Extranjeros...................... - - 1 9 - 7 2<br />
1988<br />
Españoles ....................... - 36 - 4 - 2 2<br />
Extranjeros...................... 2 - 7 4 - 4 -<br />
1989<br />
Españoles ....................... 1 87 - 15 1 7 7<br />
Extranjeros...................... 8 5 2 14 - 12 2<br />
1990<br />
Españoles ....................... 1 83 1 9 - 5 4<br />
Extranjeros...................... 2 5 10 22 2 16 4<br />
1991<br />
Españoles ....................... - 89 3 19 1 9 9<br />
Extranjeros...................... - - 6 53 4 33 16<br />
1992<br />
Españoles ....................... 2 167 1 9 - 8 1<br />
Extranjeros...................... 6 1 3 253 17 232 4<br />
1993<br />
Españoles ....................... 3 85 5 14 1 12 1<br />
Extranjeros...................... 1 5 35 200 7 177 16<br />
Estadísticas Históricas <strong>de</strong> Pob<strong>la</strong>ción <strong>de</strong> <strong>la</strong> Región <strong>de</strong> Murcia.
Migraciones Exteriores.<br />
5.11. EVOLUCIÓN DE LOS INMIGRANTES PROCEDENTES DEL EXTRANJERO POR PAÍS DE<br />
PROCEDENCIA. 1983-1993. (Conclusión)<br />
AÑOS Total EE.UU.<br />
AMÉRICA<br />
Argentina Venezue<strong>la</strong> Otros Paises ASIA OCEANÍA<br />
1983<br />
Españoles....................... 35 1 1 13 20 2 -<br />
Extranjeros...................... 4 - - - 4 1 -<br />
1984<br />
Españoles....................... 31 7 10 4 10 1 7<br />
Extranjeros...................... 9 4 4 1 - - -<br />
1985<br />
Españoles....................... 21 6 2 3 10 2 7<br />
Extranjeros...................... 21 - 9 - 12 - -<br />
1986<br />
Españoles....................... 8 - - 2 6 - -<br />
Extranjeros...................... 3 - 1 - 2 21 -<br />
1987<br />
Españoles....................... 39 15 5 5 14 - -<br />
Extranjeros...................... 10 6 1 - 3 - -<br />
1988<br />
Españoles....................... 22 3 9 3 7 - 8<br />
Extranjeros...................... 8 1 5 2 - 6 1<br />
1989<br />
Españoles....................... 97 11 22 19 45 2 4<br />
Extranjeros...................... 55 - 27 3 25 4 -<br />
1990<br />
Españoles....................... 76 6 23 12 35 - 17<br />
Extranjeros...................... 59 2 27 4 26 2 -<br />
1991<br />
Españoles....................... 57 22 7 7 21 1 3<br />
Extranjeros...................... 42 1 9 5 27 3 -<br />
1992<br />
Españoles....................... 42 7 5 6 24 2 17<br />
Extranjeros...................... 33 1 13 1 18 11 3<br />
1993<br />
Españoles....................... 57 7 6 6 38 2 11<br />
Extranjeros...................... 103 1 45 - 57 23 -<br />
Fuente: INE. Anuario Estadístico <strong>de</strong> España.<br />
INE. Migraciones.<br />
Estadísticas Históricas <strong>de</strong> Pob<strong>la</strong>ción <strong>de</strong> <strong>la</strong> Región <strong>de</strong> Murcia.<br />
221
Migraciones Exteriores.<br />
5.12. EVOLUCIÓN DE LA EMIGRACIÓN ASISTIDA A PAISES EUROPEOS POR PAÍS DE DESTINO.<br />
1964-1993. (Continúa)<br />
222<br />
AÑOS TOTAL ALEMANIA BÉLGICA FRANCIA<br />
Total Hombres Mujeres Total Hombres Mujeres Total Hombres Mujeres Total Hombres Mujeres<br />
1964....................... 3.154 .. .. 1.784 .. .. 11 .. .. 800 .. ..<br />
1965....................... 2.748 2.145 603 2.067 1.589 478 1 1 - 379 340 39<br />
1966....................... 1.426 .. .. 850 .. .. - - - 306 .. ..<br />
1967....................... 658 .. .. 191 .. .. - - - 180 .. ..<br />
1968....................... 4.048 2.950 1.098 781 579 202 - - - 2.892 2.079 813<br />
1969....................... 6.902 5.425 1.477 2.017 1.672 345 7 7 - 4.212 3.187 1.025<br />
1970....................... 4.066 3.516 550 1.824 1.498 326 3 3 - 1.356 1.188 168<br />
1971....................... 4.406 3.705 701 1.307 1.034 273 - - - 1.335 1.033 302<br />
1972....................... 3.201 2.839 362 983 766 217 - - - 539 463 76<br />
1973....................... 2.510 2.302 208 900 760 140 - - - 208 191 17<br />
1974....................... 1.220 1.147 73 5 - 5 - - - 132 111 21<br />
1975....................... 469 411 58 - - - - - - 4 - 4<br />
1976....................... 404 345 59 - - - - - - - - -<br />
1977....................... 372 312 60 - - - - - - 10 5 5<br />
1978....................... 346 294 52 - - - - - - 17 5 12<br />
1979....................... 282 236 46 - - - - - - 22 3 19<br />
1980....................... 279 232 47 - - - - - - 30 10 20<br />
1981....................... 253 204 49 1 1 - - - - 35 5 30<br />
1982....................... 555 462 93 - - - - - - 377 .. ..<br />
1983....................... 112 91 21 - - - - - - 17 .. ..<br />
1984....................... 24 8 16 - - - - - - 24 8 16<br />
1985....................... 35 .. .. - - - - - - 12 .. ..<br />
1986....................... 28 .. .. - - - - - - 28 .. ..<br />
1987....................... 2 .. .. - - - - - - 1 .. ..<br />
1988....................... 1 .. .. - - - - - - 1 .. ..<br />
1989....................... 1 .. .. - - - - - - 1 .. ..<br />
1990....................... 1 .. .. - - - - - - 1 .. ..<br />
1991....................... 2 .. .. - - - - - - 1 .. ..<br />
1992....................... 1 .. .. - - - - - - - - -<br />
1993....................... 2 .. .. - - - - - - - - -<br />
Estadísticas Históricas <strong>de</strong> Pob<strong>la</strong>ción <strong>de</strong> <strong>la</strong> Región <strong>de</strong> Murcia.
Migraciones Exteriores.<br />
5.12. EVOLUCIÓN DE LA EMIGRACIÓN ASISTIDA A PAISES EUROPEOS POR PAÍS DE DESTINO.<br />
1964-1993. (Conclusión)<br />
AÑOS HOLANDA INGLATERRA SUIZA OTROS PAISES<br />
Total Hombres Mujeres Total Hombres Mujeres Total Hombres Mujeres Total Hombres Mujeres<br />
1964 ...................... 218 .. .. 5 .. .. 334 .. .. 2 .. ..<br />
1965 ...................... 42 41 1 4 1 3 255 173 82 - - -<br />
1966 ...................... 39 .. .. - - - 231 .. .. - - -<br />
1967 ...................... 4 .. .. 4 .. .. 279 .. .. - - -<br />
1968 ...................... 75 73 2 2 1 1 298 218 80 - - -<br />
1969 ...................... 169 167 2 - - - 497 392 105 - - -<br />
1970 ...................... 173 171 2 - - - 710 656 54 - - -<br />
1971 ...................... 172 168 4 1 1 - 1.591 1.469 122 - - -<br />
1972 ...................... 34 24 10 - - - 1.645 1.586 59 - - -<br />
1973 ...................... 52 48 4 - - - 1.350 1.303 47 - - -<br />
1974 ...................... 85 85 - 1 1 - 996 949 47 1 1 -<br />
1975 ...................... - - - - - - 465 411 54 - - -<br />
1976 ...................... - - - - - - 404 345 59 - - -<br />
1977 ...................... - - - - - - 355 300 55 7 7 -<br />
1978 ...................... - - - - . - 328 288 40 1 1 -<br />
1979 ...................... - - - - - - 260 233 27 - - -<br />
1980 ...................... - - - - - - 249 222 27 - - -<br />
1981 ...................... - - - - - - 217 198 19 - - -<br />
1982 ...................... - - - - - - 178 .. .. - - -<br />
1983 ...................... - - - - - - 95 .. .. - - -<br />
1984 ...................... - - - - - - - - - - - -<br />
1985 ...................... - - - - - - 23 .. .. - - -<br />
1986 ...................... - - - - - - - - - .. .. ..<br />
1987 ...................... - - - - - - 1 .. .. - - -<br />
1988 ...................... - - - - - - - - - - - -<br />
1989 ...................... - - - - - - - - - - - -<br />
1990 ...................... - - - - - - - - - - - -<br />
1991 ...................... - - - - - - 1 .. .. - - -<br />
1992 ...................... - - - - - - 1 .. .. - - -<br />
1993 ...................... - - - - - - 2 .. .. - - -<br />
Nota: Es sólo emigración permanente.<br />
Fuente: INE. Anuario Estadístico <strong>de</strong> España.<br />
INE. Migraciones.<br />
Estadísticas Históricas <strong>de</strong> Pob<strong>la</strong>ción <strong>de</strong> <strong>la</strong> Región <strong>de</strong> Murcia.<br />
223
Migraciones Exteriores.<br />
5.13. EVOLUCIÓN DE LAS MIGRACIONES ASISTIDAS A PAISES NO EUROPEOS POR SEXO Y<br />
MEDIO DE TRANSPORTE. 1962-1984.<br />
224<br />
AÑOS<br />
EMIGRACIONES POR VÍA<br />
AÉREA<br />
EMIGRACIONES POR VÍA<br />
MARÍTIMA<br />
INMIGRACIONES POR VÍA<br />
MARÍTIMA<br />
Total Hombres Mujeres Total Hombres Mujeres Total Hombres Mujeres<br />
1962................................. 7 4 3 67 36 31 75 47 28<br />
1963................................. 1 1 - 63 39 24 83 50 33<br />
1964................................. 8 5 3 66 39 27 152 75 77<br />
1965................................. 7 5 2 81 40 41 135 85 50<br />
1966................................. 21 11 10 77 41 36 113 66 47<br />
1967................................. 8 7 1 81 41 40 110 59 51<br />
1968................................. 11 8 3 45 27 18 103 56 47<br />
1969................................. 12 10 2 50 30 20 98 44 54<br />
1970................................. 7 3 4 60 .. .. 114 .. ..<br />
1971................................. 6 3 3 51 .. .. 58 .. ..<br />
1972................................. 16 6 10 1 1 - - - -<br />
1973................................. 15 6 9 2 1 1 - - -<br />
1974................................. 10 7 3 - - - - - -<br />
1975................................. 3 2 1 - - - - - -<br />
1976................................. 11 5 6 2 1 1 - - -<br />
1977................................. 3 1 2 - - - - - -<br />
1978................................. 13 9 4 - - - - - -<br />
1979................................. 36 31 5 - - - - - -<br />
1980................................. 9 9 - - - - - - -<br />
1981................................. 23 19 4 - - - - - -<br />
1982................................. 25 22 3 - - - - - -<br />
1983................................. 37 32 5 - - - - - -<br />
1984................................. 52 52 - - - - - - -<br />
Fuente: INE. Anuario Estadístico <strong>de</strong> España.<br />
5.14. EVOLUCIÓN DE LA EMIGRACIÓN ASISTIDA A PAISES NO EUROPEOS POR PAÍS DE<br />
DESTINO. 1985-1993.<br />
AÑOS TOTAL ARGELIA ARGENTINA MEJICO MARRUECOS OTROS<br />
1985................................. 26 12 .. - 3 11<br />
1986................................. 14 9 .. - 1 4<br />
1987................................. 24 11 .. - - 13<br />
1988................................. 16 9 - - - 7<br />
1989................................. 8 1 - 1 - 6<br />
1990................................. - - - - - -<br />
1991................................. 18 - 3 - 3 12<br />
1992................................. 44 .. 35 - 4 5<br />
1993................................. 58 - 57 1 - -<br />
Fuente: INE. Migraciones.<br />
Estadísticas Históricas <strong>de</strong> Pob<strong>la</strong>ción <strong>de</strong> <strong>la</strong> Región <strong>de</strong> Murcia.
Extranjeros Resi<strong>de</strong>ntes.<br />
5.15. EVOLUCIÓN DE LOS EXTRANJEROS RESIDENTES POR NACIONALIDAD. 1945-1993.<br />
(Continúa)<br />
AÑOS TOTAL<br />
Estadísticas Históricas <strong>de</strong> Pob<strong>la</strong>ción <strong>de</strong> <strong>la</strong> Región <strong>de</strong> Murcia.<br />
EUROPA<br />
Total Alemania Austria Bélgica Dinamarca Fin<strong>la</strong>ndia Francia<br />
1945 ....................... 64 43 3 .. - - .. 17<br />
1946 ....................... 114 82 10 .. 1 - .. 19<br />
1947 ....................... 121 91 14 .. 1 - .. 22<br />
1948 ....................... 135 94 13 .. 1 - .. 24<br />
1949 ....................... 133 90 13 .. 2 - .. 23<br />
1950 ....................... 144 92 14 .. 2 - .. 22<br />
1951 ....................... 190 128 21 .. 3 2 .. 31<br />
1952 ....................... 184 133 23 .. 4 4 .. 31<br />
1953 ....................... 179 134 21 .. - 3 .. 32<br />
1954 ....................... 178 136 24 .. - 3 .. 30<br />
1955 ....................... 179 138 24 2 - 3 - 31<br />
1956 ....................... 178 138 24 2 - 3 - 31<br />
1957 ....................... 205 137 24 2 5 3 - 21<br />
1958 ....................... 187 124 29 - 2 3 - 31<br />
1959 ....................... 225 154 30 - 2 2 - 42<br />
1960 ....................... 215 153 26 - 4 2 - 43<br />
1961 ....................... 292 189 38 - 4 2 - 48<br />
1962 ....................... 287 178 32 - 3 2 - 43<br />
1963 ....................... 323 202 37 - 3 2 - 56<br />
1964 ....................... 328 205 38 1 2 2 - 59<br />
1965 ....................... 405 258 47 1 3 3 - 78<br />
1966 ....................... 467 304 50 1 5 3 - 109<br />
1967 ....................... 421 277 39 1 3 2 - 109<br />
1968 ....................... 436 292 35 1 5 4 1 112<br />
1969 ....................... 455 302 30 1 4 2 1 130<br />
1970 ....................... 543 369 32 1 4 1 1 158<br />
1971 ....................... 627 403 33 1 6 2 1 173<br />
1972 ....................... 646 416 34 - 5 2 1 166<br />
1973 ....................... 701 458 44 - - 4 1 170<br />
1974 ....................... 789 508 46 2 1 6 1 184<br />
1975 ....................... 866 560 51 3 3 6 1 201<br />
1976 ....................... 912 604 60 4 5 6 1 208<br />
1977 ....................... 1.034 682 69 6 6 6 - 221<br />
1978 ....................... 902 608 77 4 7 5 1 185<br />
1979 ....................... 1.050 741 102 3 15 6 1 200<br />
1980 ....................... 1.160 816 116 3 17 6 1 206<br />
1981 ....................... 1.286 901 130 2 23 6 1 211<br />
1982 ....................... 1.363 951 147 2 35 7 1 226<br />
1983 ....................... 1.416 958 160 2 41 7 1 213<br />
1984 ....................... 1.355 924 139 1 38 5 - 225<br />
1985 ....................... 1.629 1.056 160 6 45 7 - 236<br />
1986 ....................... 2.217 1.338 208 9 60 9 - 298<br />
1987 ....................... 2.520 1.578 246 11 63 9 7 330<br />
1988 ....................... 2.789 1.780 280 15 74 8 16 369<br />
1989 ....................... 3.131 2.024 309 21 95 8 19 410<br />
1990 ....................... 3.422 2.247 330 22 94 10 24 452<br />
1991 ....................... 6.286 .. .. .. .. .. .. ..<br />
1992 ....................... 5.581 1.895 256 17 82 5 19 443<br />
1993 ....................... 7.550 2.332 293 20 101 7 22 564<br />
225
Extranjeros Resi<strong>de</strong>ntes.<br />
5.15. EVOLUCIÓN DE LOS EXTRANJEROS RESIDENTES POR NACIONALIDAD. 1945-1993.<br />
(Continúa)<br />
226<br />
AÑOS<br />
EUROPA<br />
G. Bretaña Grecia Hungria Ir<strong>la</strong>nda Italia Noruega P. Bajos Polonia<br />
1945........................ 8 - - - 4 - - ..<br />
1946........................ 27 - - - 10 - 1 ..<br />
1947........................ 30 - - - 11 - 1 ..<br />
1948........................ 30 - - - 10 - 1 ..<br />
1949........................ 26 - - - 11 - 1 ..<br />
1950........................ 29 - - - 10 - 1 ..<br />
1951........................ 34 - - - 14 - 2 ..<br />
1952........................ 32 - - - 17 - - ..<br />
1953........................ 31 - - - 22 - 2 ..<br />
1954........................ 31 - - - 25 - 2 ..<br />
1955........................ 31 - - - 25 - 2 -<br />
1956........................ 31 - - - 25 - 2 -<br />
1957........................ 35 - - - 25 - 2 -<br />
1958........................ 31 - - - 13 - - -<br />
1959........................ 37 2 - - 13 - - -<br />
1960........................ 35 3 - - 13 - - -<br />
1961........................ 35 3 - - 28 - 1 1<br />
1962........................ 28 3 - - 33 - - 2<br />
1963........................ 30 3 - - 35 - 2 -<br />
1964........................ 32 3 - - 35 - - -<br />
1965........................ 41 3 - - 39 1 2 1<br />
1966........................ 45 3 - - 44 1 2 1<br />
1967........................ 33 - - 1 43 1 2 -<br />
1968........................ 44 - - 1 29 1 7 1<br />
1969........................ 50 - - 1 25 1 5 -<br />
1970........................ 63 - - 1 29 1 9 -<br />
1971........................ 60 - - 1 31 3 11 -<br />
1972........................ 70 - - 1 33 3 14 -<br />
1973........................ 87 - - 1 34 3 21 -<br />
1974........................ 109 - - 1 34 3 22 -<br />
1975........................ 117 1 - 1 38 1 29 -<br />
1976........................ 127 3 - 1 39 1 39 -<br />
1977........................ 161 4 - 2 46 1 43 -<br />
1978........................ 135 4 1 2 42 - 47 -<br />
1979........................ 180 2 2 2 49 1 67 -<br />
1980........................ 209 4 3 4 52 1 77 -<br />
1981........................ 239 4 3 4 56 1 90 -<br />
1982........................ 255 4 4 1 56 1 91 -<br />
1983........................ 261 5 2 4 54 3 98 -<br />
1984........................ 264 3 2 6 50 3 91 -<br />
1985........................ 316 3 1 8 62 3 97 1<br />
1986........................ 410 3 2 9 79 4 108 1<br />
1987........................ 537 2 2 14 80 4 116 -<br />
1988........................ 583 2 4 16 97 5 139 1<br />
1989........................ 696 2 4 18 102 7 138 1<br />
1990........................ 794 2 5 21 117 8 146 1<br />
1991........................ .. .. .. .. .. .. .. ..<br />
1992........................ 569 2 .. 17 133 6 95 6<br />
1993........................ 651 3 .. 17 174 4 128 14<br />
Estadísticas Históricas <strong>de</strong> Pob<strong>la</strong>ción <strong>de</strong> <strong>la</strong> Región <strong>de</strong> Murcia.
Extranjeros Resi<strong>de</strong>ntes.<br />
5.15. EVOLUCIÓN DE LOS EXTRANJEROS RESIDENTES POR NACIONALIDAD. 1945-1993.<br />
(Continúa)<br />
AÑOS<br />
Estadísticas Históricas <strong>de</strong> Pob<strong>la</strong>ción <strong>de</strong> <strong>la</strong> Región <strong>de</strong> Murcia.<br />
EUROPA<br />
Portugal Rumanía Suecia Suiza URSS Yugos<strong>la</strong>via Otros Paises<br />
1945 ....................... 1 - - 10 - - ..<br />
1946 ....................... - - 3 11 - - ..<br />
1947 ....................... 1 - 1 10 - - ..<br />
1948 ....................... 1 - 2 12 - - ..<br />
1949 ....................... 1 - 3 10 - - ..<br />
1950 ....................... 1 - 3 10 - - ..<br />
1951 ....................... 3 - 3 15 - - ..<br />
1952 ....................... 3 - 3 16 - - ..<br />
1953 ....................... 5 - 3 13 - 2 ..<br />
1954 ....................... 5 - 3 13 .. .. ..<br />
1955 ....................... 5 - 2 13 - - -<br />
1956 ....................... 5 - 2 13 - - -<br />
1957 ....................... 5 - 2 13 - - -<br />
1958 ....................... 7 - 1 7 - - -<br />
1959 ....................... 7 - 1 17 - 1 -<br />
1960 ....................... 9 - 2 16 - - -<br />
1961 ....................... 14 - 2 13 - - -<br />
1962 ....................... 15 - 2 15 - - -<br />
1963 ....................... 15 - 2 17 - - -<br />
1964 ....................... 14 - 2 17 - - -<br />
1965 ....................... 15 - 2 21 - 1 -<br />
1966 ....................... 19 - 2 18 - 1 -<br />
1967 ....................... 22 - 2 18 - 1 -<br />
1968 ....................... 22 - 11 18 - - -<br />
1969 ....................... 18 - 15 19 - - -<br />
1970 ....................... 23 - 28 18 - - -<br />
1971 ....................... 26 - 33 22 - - -<br />
1972 ....................... 27 - 36 24 - - -<br />
1973 ....................... 30 - 38 25 - - -<br />
1974 ....................... 33 - 42 24 - - -<br />
1975 ....................... 39 - 43 25 - - 1<br />
1976 ....................... 39 - 44 26 - - 1<br />
1977 ....................... 45 - 46 26 - - -<br />
1978 ....................... 46 - 26 25 - 1 -<br />
1979 ....................... 47 - 35 26 - 2 1<br />
1980 ....................... 50 - 36 29 - 1 1<br />
1981 ....................... 59 - 39 30 - 1 2<br />
1982 ....................... 55 - 40 22 - 2 2<br />
1983 ....................... 43 - 34 26 - 2 2<br />
1984 ....................... 39 - 29 25 - 1 3<br />
1985 ....................... 44 - 33 29 - 2 3<br />
1986 ....................... 61 - 40 31 - 2 4<br />
1987 ....................... 67 - 48 37 - 1 4<br />
1988 ....................... 67 - 58 39 - 2 5<br />
1989 ....................... 76 .. 64 45 - 4 5<br />
1990 ....................... 88 .. 71 52 - 4 6<br />
1991 ....................... .. .. .. .. .. .. ..<br />
1992 ....................... 77 13 69 49 9 3 25<br />
1993 ....................... 93 15 62 64 28 36 36<br />
227
Extranjeros Resi<strong>de</strong>ntes.<br />
5.15. EVOLUCIÓN DE LOS EXTRANJEROS RESIDENTES POR NACIONALIDAD. 1945-1993.<br />
(Continúa)<br />
228<br />
AÑOS<br />
AMÉRICA DEL NORTE Y CENTRO<br />
Total Canada Costa Rica Cuba El Salvador EE.UU. Guatema<strong>la</strong><br />
1945........................ - .. .. - .. - ..<br />
1946........................ - .. .. - .. - ..<br />
1947........................ - .. .. - .. - ..<br />
1948........................ 1 .. .. 1 .. - ..<br />
1949........................ 4 .. .. 1 .. 1 ..<br />
1950........................ 1 .. .. 1 .. - ..<br />
1951........................ 17 .. .. 1 .. 12 ..<br />
1952........................ 5 .. .. 1 .. 2 ..<br />
1953........................ 7 .. .. - .. 1 ..<br />
1954........................ 7 - .. 1 .. 1 ..<br />
1955........................ 8 - .. 1 .. 1 ..<br />
1956........................ 8 - .. 1 .. 1 ..<br />
1957........................ 40 4 .. - .. 30 ..<br />
1958........................ 29 - .. - .. 27 ..<br />
1959........................ 22 - .. - .. 21 ..<br />
1960........................ 15 7 .. - .. 7 ..<br />
1961........................ 34 4 .. - .. 27 ..<br />
1962........................ 38 4 .. - .. 29 ..<br />
1963........................ 34 3 .. - .. 30 ..<br />
1964........................ 38 3 - 4 4 24 1<br />
1965........................ 57 3 - 5 4 36 5<br />
1966........................ 65 3 1 5 4 39 6<br />
1967........................ 53 - 2 14 3 22 4<br />
1968........................ 57 1 5 12 4 23 5<br />
1969........................ 60 3 7 10 2 26 9<br />
1970........................ 60 3 7 7 1 30 9<br />
1971........................ 71 3 7 15 - 32 9<br />
1972........................ 77 3 2 22 - 36 6<br />
1973........................ 85 3 2 24 - 41 4<br />
1974........................ 100 3 2 25 - 53 4<br />
1975........................ 108 3 3 25 - 58 5<br />
1976........................ 116 3 3 28 1 59 6<br />
1977........................ 133 3 3 36 - 64 7<br />
1978........................ 91 1 4 23 2 41 3<br />
1979........................ 104 1 7 24 2 47 3<br />
1980........................ 105 3 6 22 3 49 1<br />
1981........................ 117 7 8 22 4 50 1<br />
1982........................ 125 10 7 22 7 53 3<br />
1983........................ 125 13 6 20 7 51 3<br />
1984........................ 105 10 1 19 8 42 3<br />
1985........................ 107 10 1 20 8 45 5<br />
1986........................ 132 11 7 16 9 56 10<br />
1987........................ 140 11 7 15 11 66 10<br />
1988........................ 157 13 7 12 11 77 13<br />
1989........................ 199 19 9 21 11 91 13<br />
1990........................ 224 20 10 22 12 100 13<br />
1991........................ .. .. .. .. .. .. ..<br />
1992........................ 199 12 6 15 11 70 11<br />
1993........................ 294 16 11 32 17 93 16<br />
Estadísticas Históricas <strong>de</strong> Pob<strong>la</strong>ción <strong>de</strong> <strong>la</strong> Región <strong>de</strong> Murcia.
Extranjeros Resi<strong>de</strong>ntes.<br />
5.15. EVOLUCIÓN DE LOS EXTRANJEROS RESIDENTES POR NACIONALIDAD. 1945-1993.<br />
(Continúa)<br />
AÑOS<br />
Estadísticas Históricas <strong>de</strong> Pob<strong>la</strong>ción <strong>de</strong> <strong>la</strong> Región <strong>de</strong> Murcia.<br />
AMÉRICA DEL NORTE Y CENTRO<br />
Haití Honduras Mejico Nicaragua Panamá R. Dominicana Otros Paises<br />
1945 ....................... .. .. - .. .. .. - (1)<br />
1946 ....................... .. .. - .. .. .. - (1)<br />
1947 ....................... .. .. - .. .. .. - (1)<br />
1948 ....................... .. .. - .. .. .. - (1)<br />
1949 ....................... . . - . . . 2 (1)<br />
1950 ....................... .. .. - .. .. .. - (1)<br />
1951 ....................... .. .. - .. .. .. 4 (1)<br />
1952 ....................... .. .. - .. .. .. 2 (1)<br />
1953 ....................... .. .. - .. .. .. 6 (1)<br />
1954 ....................... .. .. - .. .. .. 5 (1)<br />
1955 ....................... .. .. - .. .. .. 6<br />
1956 ....................... .. .. - .. .. .. 6<br />
1957 ....................... .. .. - .. .. .. 6<br />
1958 ....................... . . - . . . 2<br />
1959 ....................... .. .. - .. .. .. 1<br />
1960 ....................... .. .. - .. .. .. 1<br />
1961 ....................... .. .. - .. .. .. 3<br />
1962 ....................... .. .. - .. .. .. 5<br />
1963 ....................... .. .. 1 .. .. .. 5<br />
1964 ....................... - - 1 1 - - -<br />
1965 ....................... - - 1 3 - - -<br />
1966 ....................... - - 1 5 1 - -<br />
1967 ....................... - - 1 6 1 - -<br />
1968 ....................... - - 1 5 1 - -<br />
1969 ....................... - - - 2 - 1 -<br />
1970 ....................... - - 1 2 - - -<br />
1971 ....................... - - 2 2 - 1 -<br />
1972 ....................... - - 7 1 - - -<br />
1973 ....................... - - 11 - - - -<br />
1974 ....................... - - 11 1 - 1 -<br />
1975 ....................... 1 - 11 1 - 1 -<br />
1976 ....................... 1 1 12 1 - 1 -<br />
1977 ....................... 1 1 13 3 - 2 -<br />
1978 ....................... 1 2 11 - 1 2 -<br />
1979 ....................... 1 2 10 4 1 2 -<br />
1980 ....................... 1 2 10 5 1 2 -<br />
1981 ....................... 1 3 12 5 1 3 -<br />
1982 ....................... 1 4 7 4 1 6 -<br />
1983 ....................... - 7 7 4 1 6 -<br />
1984 ....................... - 5 6 6 1 4 -<br />
1985 ....................... - 5 4 5 - 4 -<br />
1986 ....................... - 6 4 6 - 7 -<br />
1987 ....................... - 6 3 3 1 7 -<br />
1988 ....................... - 6 2 4 2 9 1<br />
1989 ....................... - 7 5 5 4 13 1<br />
1990 ....................... - 8 9 5 4 20 1<br />
1991 ....................... .. .. .. .. .. .. ..<br />
1992 ....................... 1 2 22 8 4 36 1<br />
1993 ....................... - 4 26 7 5 65 2<br />
(1) Costa Rica, República Dominicana, El Salvador, Guatema<strong>la</strong> y Panamá.<br />
229
Extranjeros Resi<strong>de</strong>ntes.<br />
5.15. EVOLUCIÓN DE LOS EXTRANJEROS RESIDENTES POR NACIONALIDAD. 1945-1993.<br />
(Continúa)<br />
230<br />
AÑOS<br />
AMÉRICA DEL SUR<br />
Total Argentina Bolivia Brasil Colombia Chile Ecuador<br />
1945........................ 20 19 - 1 - - -<br />
1946........................ 28 25 - 1 1 1 -<br />
1947........................ 27 25 - - 1 1 -<br />
1948........................ 35 25 - 4 3 1 -<br />
1949........................ 32 26 - 3 2 1 -<br />
1950........................ 37 32 - 2 2 1 -<br />
1951........................ 35 27 - 2 3 1 -<br />
1952........................ 38 29 - 2 3 1 -<br />
1953........................ 33 28 - - 4 1 -<br />
1954........................ 29 24 .. - 4 - ..<br />
1955........................ 29 24 - - 4 - -<br />
1956........................ 28 24 - - 4 - -<br />
1957........................ 26 24 - - - - -<br />
1958........................ 32 24 - - - 1 2<br />
1959........................ 46 28 1 2 7 1 2<br />
1960........................ 38 29 - 2 - 1 -<br />
1961........................ 61 32 - 4 8 1 -<br />
1962........................ 63 27 - 1 12 3 -<br />
1963........................ 75 26 - - 13 3 1<br />
1964........................ 75 28 - - 13 3 -<br />
1965........................ 75 30 - 1 7 3 2<br />
1966........................ 84 33 - 2 8 3 4<br />
1967........................ 70 26 - 2 4 1 3<br />
1968........................ 65 27 - - 6 - 2<br />
1969........................ 78 29 - 2 6 2 4<br />
1970........................ 96 33 - 2 8 3 3<br />
1971........................ 132 38 - 3 10 7 4<br />
1972........................ 134 30 1 2 10 6 3<br />
1973........................ 134 28 1 2 13 2 3<br />
1974........................ 150 32 1 1 19 3 3<br />
1975........................ 155 33 1 1 19 3 3<br />
1976........................ 158 32 3 1 23 1 3<br />
1977........................ 179 33 5 - 28 9 2<br />
1978........................ 160 37 4 2 20 10 2<br />
1979........................ 172 45 3 3 22 8 3<br />
1980........................ 186 46 3 3 27 8 4<br />
1981........................ 192 44 4 3 29 8 5<br />
1982........................ 166 56 4 5 33 - 8<br />
1983........................ 174 62 5 5 25 10 8<br />
1984........................ 159 54 3 3 24 11 4<br />
1985........................ 189 70 3 2 21 16 4<br />
1986........................ 255 104 4 3 26 24 5<br />
1987........................ 298 133 4 2 24 28 6<br />
1988........................ 321 138 5 3 24 31 7<br />
1989........................ 336 143 5 13 26 37 9<br />
1990........................ 385 175 4 14 29 41 10<br />
1991........................ .. .. .. .. .. .. ..<br />
1992........................ 499 227 7 35 34 46 22<br />
1993........................ 586 249 15 45 46 50 30<br />
Estadísticas Históricas <strong>de</strong> Pob<strong>la</strong>ción <strong>de</strong> <strong>la</strong> Región <strong>de</strong> Murcia.
Extranjeros Resi<strong>de</strong>ntes.<br />
5.15. EVOLUCIÓN DE LOS EXTRANJEROS RESIDENTES POR NACIONALIDAD. 1945-1993.<br />
(Continúa)<br />
AÑOS<br />
Estadísticas Históricas <strong>de</strong> Pob<strong>la</strong>ción <strong>de</strong> <strong>la</strong> Región <strong>de</strong> Murcia.<br />
AMÉRICA DEL SUR ASIA<br />
Paraguay Perú Uruguay Venezue<strong>la</strong> Otros Paises Total China<br />
1945 ....................... - - - - - .. ..<br />
1946 ....................... - - - - - .. ..<br />
1947 ....................... - - - - - .. ..<br />
1948 ....................... - - 2 - - .. ..<br />
1949 ....................... - - - - - .. ..<br />
1950 ....................... - - - - - .. ..<br />
1951 ....................... - - 2 - - .. ..<br />
1952 ....................... - - 2 1 - .. ..<br />
1953 ....................... - - - - - .. ..<br />
1954 ....................... .. - - - 1 .. ..<br />
1955 ....................... 1 - - - - - -<br />
1956 ....................... - - - - - - -<br />
1957 ....................... - - - 2 - - -<br />
1958 ....................... - 1 - 4 - 2 -<br />
1959 ....................... 1 - - 4 - 3 -<br />
1960 ....................... - 2 - 4 - 1 -<br />
1961 ....................... - 1 - 15 - 2 -<br />
1962 ....................... - 1 - 19 - 2 -<br />
1963 ....................... - 3 - 29 - 1 -<br />
1964 ....................... - 3 - 28 - 1 -<br />
1965 ....................... - 1 - 31 - 2 -<br />
1966 ....................... - 1 - 33 - 2 -<br />
1967 ....................... - 1 - 33 - 11 -<br />
1968 ....................... - 2 - 28 - 11 -<br />
1969 ....................... - 9 - 26 - 6 2<br />
1970 ....................... - 11 - 36 - 7 2<br />
1971 ....................... 1 11 - 58 - 8 2<br />
1972 ....................... - 17 - 65 - 8 1<br />
1973 ....................... - 16 - 69 - 9 1<br />
1974 ....................... - 18 - 73 - 11 1<br />
1975 ....................... 2 18 - 75 - 16 1<br />
1976 ....................... 2 17 - 76 - 12 1<br />
1977 ....................... 2 19 - 81 - 18 -<br />
1978 ....................... 2 16 1 66 - 22 1<br />
1979 ....................... 2 18 1 67 - 12 1<br />
1980 ....................... 2 19 3 71 - 26 1<br />
1981 ....................... 2 19 6 72 - 40 1<br />
1982 ....................... 3 9 9 39 - 73 12<br />
1983 ....................... 2 8 13 36 - 72 11<br />
1984 ....................... 2 10 14 34 - 75 21<br />
1985 ....................... 4 16 18 35 - 87 32<br />
1986 ....................... 4 21 22 42 - 134 56<br />
1987 ....................... 6 18 24 53 - 142 58<br />
1988 ....................... 6 24 26 57 - 154 64<br />
1989 ....................... 5 34 26 38 - 170 73<br />
1990 ....................... 5 33 27 47 - 187 83<br />
1991 ....................... .. .. .. .. .. .. ..<br />
1992 ....................... 2 37 39 50 - 197 111<br />
1993 ....................... 6 50 49 46 - 238 153<br />
231
Extranjeros Resi<strong>de</strong>ntes.<br />
5.15. EVOLUCIÓN DE LOS EXTRANJEROS RESIDENTES POR NACIONALIDAD. 1945-1993.<br />
(Continúa)<br />
232<br />
AÑOS<br />
ASIA<br />
Filipinas India Irán Israel Japón Jordania Líbano<br />
1945........................ .. .. .. .. - .. ..<br />
1946........................ .. .. .. .. - .. ..<br />
1947........................ .. .. .. .. - .. ..<br />
1948........................ .. .. .. .. - .. ..<br />
1949........................ .. .. .. .. - .. ..<br />
1950........................ .. .. .. .. - .. ..<br />
1951........................ .. .. .. .. - .. ..<br />
1952........................ .. .. .. .. - .. ..<br />
1953........................ .. .. .. .. - .. ..<br />
1954........................ - .. .. .. - .. ..<br />
1955........................ - - - - - - -<br />
1956........................ - - - - - - -<br />
1957........................ - - - - - - -<br />
1958........................ 2 - - - - - -<br />
1959........................ 2 - - .. - .. ..<br />
1960........................ - 1 - - - - -<br />
1961........................ 1 1 - - - - -<br />
1962........................ - 1 - .. - .. ..<br />
1963........................ - 1 - - - - -<br />
1964........................ - 1 - - - - -<br />
1965........................ - 1 - - - - -<br />
1966........................ - 1 - - - - -<br />
1967........................ 7 1 - 2 - - -<br />
1968........................ 9 - - 2 - - -<br />
1969........................ 2 - - - - - 1<br />
1970........................ 3 - - - - - 1<br />
1971........................ 3 - - - - - 1<br />
1972........................ 2 - - - - - -<br />
1973........................ 2 - - - - 1 1<br />
1974........................ 2 - - - 1 2 1<br />
1975........................ 2 - - - 2 2 3<br />
1976........................ 2 - - - 3 2 3<br />
1977........................ 2 - - - 3 4 2<br />
1978........................ 1 1 - - 4 4 2<br />
1979........................ 1 - - - 4 4 2<br />
1980........................ 5 - - - 3 4 3<br />
1981........................ 14 1 - - 3 5 3<br />
1982........................ 23 2 6 - 4 4 3<br />
1983........................ 32 2 2 1 7 2 3<br />
1984........................ 25 - 2 1 5 3 3<br />
1985........................ 27 1 2 1 5 2 2<br />
1986........................ 33 1 2 1 2 5 6<br />
1987........................ 35 - 1 1 6 3 5<br />
1988........................ 34 1 6 1 6 3 5<br />
1989........................ 32 1 9 .. 6 3 7<br />
1990........................ 34 1 11 .. 6 3 10<br />
1991........................ .. .. .. .. .. .. ..<br />
1992........................ 28 1 11 .. 8 3 7<br />
1993........................ 25 2 13 .. 10 2 7<br />
Estadísticas Históricas <strong>de</strong> Pob<strong>la</strong>ción <strong>de</strong> <strong>la</strong> Región <strong>de</strong> Murcia.
Extranjeros Resi<strong>de</strong>ntes.<br />
5.15. EVOLUCIÓN DE LOS EXTRANJEROS RESIDENTES POR NACIONALIDAD. 1945-1993.<br />
(Continúa)<br />
AÑOS<br />
Estadísticas Históricas <strong>de</strong> Pob<strong>la</strong>ción <strong>de</strong> <strong>la</strong> Región <strong>de</strong> Murcia.<br />
ASIA AFRICA<br />
Siria Turquía Otros Paises Total Marruecos R.A.U. U. Sudafric.<br />
1945 ....................... .. - .. .. .. - ..<br />
1946 ....................... .. - .. .. .. - ..<br />
1947 ....................... .. - .. .. .. - ..<br />
1948 ....................... .. - .. .. .. - ..<br />
1949 ....................... .. - .. .. .. - ..<br />
1950 ....................... .. - .. .. .. - ..<br />
1951 ....................... .. - .. .. .. - ..<br />
1952 ....................... .. - .. .. .. - ..<br />
1953 ....................... . - .. .. .. - ..<br />
1954 ....................... .. - .. .. .. - ..<br />
1955 ....................... - - - - - - -<br />
1956 ....................... - - - - - - -<br />
1957 ....................... - - - - - - -<br />
1958 ....................... - - - - - - -<br />
1959 ....................... .. - 1 - - - -<br />
1960 ....................... - - - - - - -<br />
1961 ....................... - - - 1 - - 1<br />
1962 ....................... .. - 1 1 - - 1<br />
1963 ....................... - - - 1 - - -<br />
1964 ....................... - - - 5 2 - 3<br />
1965 ....................... - 1 - 6 3 - 3<br />
1966 ....................... - 1 - 4 2 - 2<br />
1967 ....................... - 1 - 3 1 - 2<br />
1968 ....................... - - - 3 1 - 2<br />
1969 ....................... - - 1 2 2 - -<br />
1970 ....................... - - 1 3 3 - -<br />
1971 ....................... 2 - - 4 3 - 1<br />
1972 ....................... 3 - 2 5 2 - 2<br />
1973 ....................... 3 - 1 7 2 - 2<br />
1974 ....................... 3 - 1 12 3 - 3<br />
1975 ....................... 5 - 1 17 4 - 3<br />
1976 ....................... - - 1 12 3 - 3<br />
1977 ....................... 6 - 1 11 4 - 3<br />
1978 ....................... 7 - 2 14 5 - 2<br />
1979 ....................... - - - 14 8 - 2<br />
1980 ....................... 8 - 2 19 13 - 2<br />
1981 ....................... 8 1 4 27 18 - 3<br />
1982 ....................... 6 1 12 38 28 - 3<br />
1983 ....................... 3 2 7 76 61 2 3<br />
1984 ....................... 2 4 9 84 61 3 3<br />
1985 ....................... 1 3 11 181 138 3 3<br />
1986 ....................... 2 5 21 350 267 7 4<br />
1987 ....................... 2 6 25 355 269 7 5<br />
1988 ....................... 3 6 25 369 273 6 5<br />
1989 ....................... 3 .. 36 392 292 .. ..<br />
1990 ....................... 3 .. 36 368 310 .. ..<br />
1991 ....................... .. .. .. .. .. .. ..<br />
1992 ....................... 3 .. 25 2.786 2.456 .. ..<br />
1993 ....................... 3 .. 23 4.095 3.755 .. ..<br />
233
Extranjeros Resi<strong>de</strong>ntes.<br />
5.15. EVOLUCIÓN DE LOS EXTRANJEROS RESIDENTES POR NACIONALIDAD. 1945-1993.<br />
(Conclusión)<br />
234<br />
AÑOS<br />
AFRICA OCEANÍA Apátridas o Sin<br />
Otros Paises Total Australia N. Ze<strong>la</strong>nda<br />
sin nacionalidad Determinar (*)<br />
1945........................ .. .. .. .. .. 1<br />
1946........................ .. .. .. .. .. 4<br />
1947........................ .. .. .. .. .. 3<br />
1948........................ .. .. .. .. .. 5<br />
1949........................ .. .. .. .. .. 7<br />
1950........................ .. .. .. .. .. 14<br />
1951........................ .. .. .. .. .. 10<br />
1952........................ .. .. .. .. .. 8<br />
1953........................ .. .. .. .. .. 5<br />
1954........................ .. .. .. .. .. 6<br />
1955........................ - - - - 2 2<br />
1956........................ - - - - 2 2<br />
1957........................ - - - - - 2<br />
1958........................ - - - - - -<br />
1959........................ - - - - - -<br />
1960........................ - 2 2 - 2 4<br />
1961........................ - - - - 3 2<br />
1962........................ - - - - - 5<br />
1963........................ 1 1 1 - 3 1<br />
1964........................ - 1 1 - 3 -<br />
1965........................ - 2 2 - 5 -<br />
1966........................ - 2 2 - 6 -<br />
1967........................ - 1 1 - 6 -<br />
1968........................ - 1 1 - 7 -<br />
1969........................ - 1 1 - 6 -<br />
1970........................ - 2 2 - 6 -<br />
1971........................ - 3 3 - 6 -<br />
1972........................ 1 2 2 - 4 -<br />
1973........................ 3 1 1 - 7 -<br />
1974........................ 6 1 1 - 7 -<br />
1975........................ 10 1 1 - 9 -<br />
1976........................ 6 1 1 - 9 -<br />
1977........................ 4 1 1 - 10 -<br />
1978........................ 7 1 1 - 6 -<br />
1979........................ 4 2 1 1 5 -<br />
1980........................ 4 1 1 - 7 -<br />
1981........................ 6 3 2 1 6 -<br />
1982........................ 7 4 3 1 6 -<br />
1983........................ 10 4 3 1 7 -<br />
1984........................ 17 2 1 1 6 -<br />
1985........................ 37 4 3 1 5 -<br />
1986........................ 72 4 3 1 4 -<br />
1987........................ 74 4 4 - 3 -<br />
1988........................ 85 5 5 - 3 -<br />
1989........................ 100 5 4 1 5 -<br />
1990........................ 58 5 4 1 6 -<br />
1991........................ .. .. .. .. .. ..<br />
1992........................ 330 3 3 - 2 -<br />
1993........................ 340 4 4 - 1 -<br />
Nota: Antes <strong>de</strong> 1985 son extranjeros resi<strong>de</strong>ntes por país <strong>de</strong> origen.<br />
(*) Hasta 1954, inclusive, este apartado se refiere a otras nacionalida<strong>de</strong>s no <strong>de</strong>tal<strong>la</strong>das.<br />
Fuente: INE. Migraciones.<br />
Estadísticas Históricas <strong>de</strong> Pob<strong>la</strong>ción <strong>de</strong> <strong>la</strong> Región <strong>de</strong> Murcia.