1. Visual Basic - Curso completo teoria y practica
1. Visual Basic - Curso completo teoria y practica 1. Visual Basic - Curso completo teoria y practica
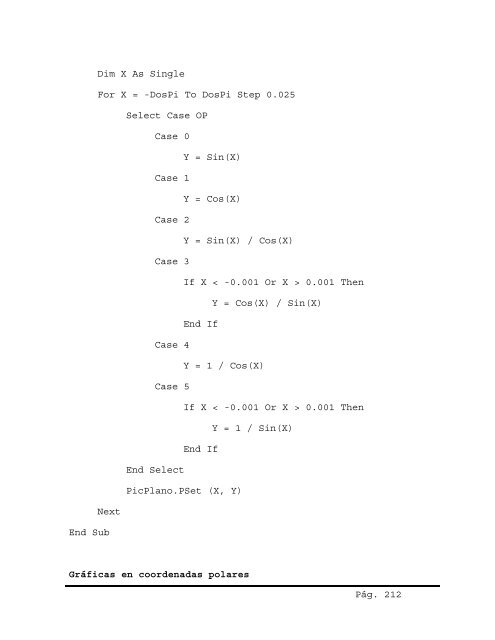
Dim X As Single For X = -DosPi To DosPi Step 0.025 Next End Sub Select Case OP Case 0 Case 1 Case 2 Case 3 Case 4 Case 5 End Select Y = Sin(X) Y = Cos(X) Y = Sin(X) / Cos(X) If X < -0.001 Or X > 0.001 Then End If Y = Cos(X) / Sin(X) Y = 1 / Cos(X) If X < -0.001 Or X > 0.001 Then End If PicPlano.PSet (X, Y) Gráficas en coordenadas polares Y = 1 / Sin(X) Pág. 212
Para el caso de las gráficas de ecuaciones polares tampoco es complicado, sólo hay que tener presente las siguientes consideraciones. Dado un punto Px ( , y) del plano, tal punto se encuentra a una distancia r del origen, y a un ángulo θ respecto del semieje horizontal positivo. De la gráfica se tiene que el punto P tiene coordenadas rectangulares ( x, y ) y coordenadas polares (, r θ ) entonces se cumplen las siguientes relaciones de transformación: x= rcosθ y = rsenθ = + y θ = 2 2 2 De donde: r x ; tan y x Pág. 213
- Page 161 and 162: universales, de modo que los datos
- Page 163 and 164: Los datos del archivo deben aparece
- Page 165 and 166: Función Input Retorna los siguient
- Page 167 and 168: sus prestaciones son bastante limit
- Page 169 and 170: Private Sub MnuArchivoAbrir_Click()
- Page 171 and 172: longitud), lo cuales son identifica
- Page 173 and 174: Get # NÚMERO_ARCHIVO, NÚMERO_REG,
- Page 175 and 176: La función Loc() aplicada a un arc
- Page 177 and 178: Frame1 Frame2 Frame3 Label1 Label2
- Page 179 and 180: Command3 Command4 Command5 Command6
- Page 181 and 182: End Sub TxtVacantes.Locked = Not Ok
- Page 183 and 184: End Sub POSICION = Loc(N1) + 1 If P
- Page 185 and 186: End Sub Open “C:\DATA\TEMPO.DAT
- Page 187 and 188: Permite grabar en un archivo binari
- Page 189 and 190: Por ejemplo si ingresa el mensaje
- Page 191 and 192: Como ejemplo considere los siguient
- Page 193 and 194: El ejemplo inicial (código hexadec
- Page 195 and 196: Por ejemplo, las instrucciones sigu
- Page 197 and 198: A manera de ejemplo considere la es
- Page 199 and 200: Para el dibujo de puntos se usará
- Page 201 and 202: En el ejemplo anterior se utiliza l
- Page 203 and 204: Para este ejemplo crear una nueva a
- Page 205 and 206: Para el desarrollo de la presente a
- Page 207 and 208: Control Line Line es un control gr
- Page 209 and 210: Como ejemplo de este tipo de gráfi
- Page 211: Para realizar nuestra aplicación d
- Page 215 and 216: Luego proceda a ingresar el código
- Page 217 and 218: La matemática fractal es producto
- Page 219 and 220: Para el desarrollo de la presente a
- Page 221 and 222: En este capítulo, debido a las lim
- Page 223 and 224: La presente Guía de Laboratorio de
- Page 225 and 226: Para el desarrollo de esta aplicaci
- Page 227 and 228: Text1 Text2 Text3 Text4 Text5 Text6
- Page 229 and 230: Luego, haga doble click sobre el bo
- Page 231 and 232: A continuación active la casilla d
- Page 233 and 234: Label10 Nombre LblImpuesto Caption
- Page 235 and 236: En primer lugar debemos cargar los
- Page 237 and 238: A continuación haga doble click so
- Page 239 and 240: Private Sub CmdAceptar_Click() Dim
- Page 241 and 242: Los descuentos a aplicar son sobre
- Page 243 and 244: Label4 Label5 Text1 Text2 Text3 Tex
- Page 245 and 246: Check3 Command1 Command2 Command3 N
- Page 247 and 248: Cuatro notas entre 0 y 20 represent
- Page 249 and 250: Label6 Label7 Text1 Text2 Text3 Tex
- Page 251 and 252: N3 = Val(TxtN3) : N4 = Val(TxtN4) P
- Page 253 and 254: Form1 Label1 Label2 Label3 Label4 T
- Page 255 and 256: Case 10: CadMes = “Octubre” Cas
- Page 257 and 258: Para el desarrollo de esta aplicaci
- Page 259 and 260: El diseño de la interfaz debe ser
- Page 261 and 262: Para el desarrollo de esta aplicaci
Dim X As Single<br />
For X = -DosPi To DosPi Step 0.025<br />
Next<br />
End Sub<br />
Select Case OP<br />
Case 0<br />
Case 1<br />
Case 2<br />
Case 3<br />
Case 4<br />
Case 5<br />
End Select<br />
Y = Sin(X)<br />
Y = Cos(X)<br />
Y = Sin(X) / Cos(X)<br />
If X < -0.001 Or X > 0.001 Then<br />
End If<br />
Y = Cos(X) / Sin(X)<br />
Y = 1 / Cos(X)<br />
If X < -0.001 Or X > 0.001 Then<br />
End If<br />
PicPlano.PSet (X, Y)<br />
Gráficas en coordenadas polares<br />
Y = 1 / Sin(X)<br />
Pág. 212


