Mortalidad en la niñez : una base de datos - Cepal
Mortalidad en la niñez : una base de datos - Cepal Mortalidad en la niñez : una base de datos - Cepal
CUADRO XII.12 Haití: Estimaciones indirectas de mortalidad infantil y en menores de cinco años (modelo oeste) en base a la “Enquête mortalité, morbidité et utilisation des services“ de 1994-1995 Edad de la mujer Paridez media Proporción de hijos fallecidos Fuente: Cayemittes, Michel y otros, Enquete Mortalité, Morbidité, et Utilisation des Services, EMMUS - II 1994-1995, Pétionville, Haití, Institute Haïtien de l’Enfance e Institute of Resource Development/Macro International, 1995, pág. 39, tabla 3.6. CUADRO XII.13 Haití: Estimaciones directas de mortalidad infantil y en menores de cinco años en base a la “Enquête mortalité, morbidité et utilisation des services“ del 2000 Fecha de referencia Mortalidad Infantil (por mil) q(1) q(5) 15-19 0,13 0,155 1993.6 160 239 20-24 0,85 0,142 1992.5 122 179 25-29 2,15 0,149 1990.9 114 167 30-34 3,35 0,146 1989.0 105 152 35-39 4,73 0,171 1986.9 114 166 40-44 5,32 0,184 1984.5 114 167 45-49 5,39 0,234 1981.5 132 195 Período Tasa de mortalidad (por mil) q(1) q(5) 1976 -1980 159 255 1981-1985 122 189 1986-1990 109 156 1991-1995 99 158 1996-2000 80 119 Fuente: Cayemittes, Michel y otros, Enquete Mortalité, Morbidité, et Utilisation des Services, EMMUS – III 2000, Pétionville, Haití, Institute Haïtien de l’Enfance e Institute of Resource Development/Macro International, 2001, pág.182, tabla 11.1. Mortalidad en la niñez HAITÍ XII 173
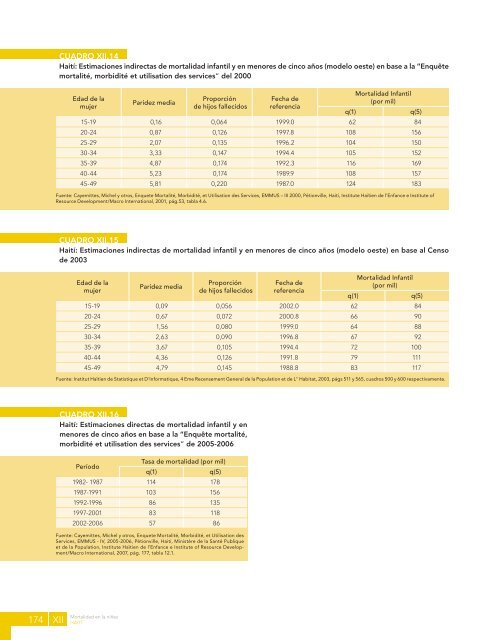
174 CUADRO XII.14 Haití: Estimaciones indirectas de mortalidad infantil y en menores de cinco años (modelo oeste) en base a la “Enquête mortalité, morbidité et utilisation des services“ del 2000 Edad de la mujer Fuente: Cayemittes, Michel y otros, Enquete Mortalité, Morbidité, et Utilisation des Services, EMMUS – III 2000, Pétionville, Haití, Institute Haïtien de l’Enfance e Institute of Resource Development/Macro International, 2001, pág.53, tabla 4.6. CUADRO XII.15 Haití: Estimaciones indirectas de mortalidad infantil y en menores de cinco años (modelo oeste) en base al Censo de 2003 Edad de la mujer Paridez media Paridez media Proporción de hijos fallecidos Proporción de hijos fallecidos Fuente: Institut Haïtien de Statistique et D'Informatique, 4 Eme Recensement General de la Population et de L'' Habitat, 2003, págs 511 y 565, cuadros 500 y 600 respectivamente. CUADRO XII.16 Haití: Estimaciones directas de mortalidad infantil y en menores de cinco años en base a la “Enquête mortalité, morbidité et utilisation des services“ de 2005-2006 Fecha de referencia Mortalidad Infantil (por mil) q(1) q(5) 15-19 0,09 0,056 2002.0 62 84 20-24 0,67 0,072 2000.8 66 90 25-29 1,56 0,080 1999.0 64 88 30-34 2,63 0,090 1996.8 67 92 35-39 3,67 0,105 1994.4 72 100 40-44 4,36 0,126 1991.8 79 111 45-49 4,79 0,145 1988.8 83 117 Período Tasa de mortalidad (por mil) q(1) q(5) 1982- 1987 114 178 1987-1991 103 156 1992-1996 86 135 1997-2001 83 118 2002-2006 57 86 Fuente: Cayemittes, Michel y otros, Enquete Mortalité, Morbidité, et Utilisation des Services, EMMUS - IV, 2005-2006, Pétionville, Haití, Ministère de la Santé Publique et de la Population, Institute Haïtien de l’Enfance e Institute of Resource Development/Macro International, 2007, pág. 177, tabla 12.1. XII Fecha de referencia Mortalidad Infantil (por mil) q(1) q(5) 15-19 0,16 0,064 1999.0 62 84 20-24 0,87 0,126 1997.8 108 156 25-29 2,07 0,135 1996.2 104 150 30-34 3,33 0,147 1994.4 105 152 35-39 4,87 0,174 1992.3 116 169 40-44 5,23 0,174 1989.9 108 157 45-49 5,81 0,220 1987.0 124 183 Mortalidad en la niñez HAITÍ
- Page 124 and 125: Bibliografía Bay, Guiomar y Orella
- Page 126 and 127: CUADRO IX.1 Ecuador: Estimaciones d
- Page 128 and 129: CUADRO IX.2 Ecuador: Mortalidad inf
- Page 130 and 131: CUADRO IX.5 Ecuador: Estimaciones i
- Page 132 and 133: CUADRO IX.11 Ecuador: Estimaciones
- Page 134 and 135: CUADRO IX.17 Ecuador: Estimaciones
- Page 136: GRÁFICO IX.3 Ecuador: Tasas de mor
- Page 139 and 140: 138 X. EL SALVADOR X.1.Fuentes de i
- Page 141 and 142: 140 GRÁFICO X.1 El Salvador: Estim
- Page 143 and 144: 142 X.4. Cuadros y gráficos CUADRO
- Page 145 and 146: 144 CUADRO X.8 El Salvador: Estimac
- Page 147 and 148: 146 CUADRO X.14 El Salvador: Estima
- Page 149 and 150: 148 CUADRO X.20 El Salvador: Estima
- Page 151 and 152: 150 GRÁFICO X.3 El Salvador: Tasas
- Page 153 and 154: 152 XI. GUATEMALA XI.1. Fuente de i
- Page 155 and 156: 154 GRÁFICO XI.1 Guatemala: Estima
- Page 157 and 158: 156 XI.4. Cuadros y gráficos CUADR
- Page 159 and 160: 158 CUADRO XI.8 Guatemala: Estimaci
- Page 161 and 162: 160 CUADRO XI.14 Guatemala: Estimac
- Page 163 and 164: 162 CUADRO XI.19 Guatemala: Estimac
- Page 165 and 166: 164 GRÁFICO XI.3 Guatemala: Tasas
- Page 167 and 168: 166 XII. HAITÍ XII.1 Fuentes de in
- Page 169 and 170: 168 GRÁFICO XII.1 Haití: Estimaci
- Page 171 and 172: 170 XII.4. Cuadros y gráficos CUAD
- Page 173: 172 CUADRO XII.9 Haití: Estimacion
- Page 177 and 178: 176 GRÁFICO XII.2 Haití: Tasas de
- Page 180 and 181: Bibliografía Bay, Guiomar y Orella
- Page 182 and 183: CUADRO XIII.1 Honduras: Estimacione
- Page 184 and 185: XIII.3. Diferencias sociales de la
- Page 186 and 187: XIII.4. Cuadros y gráficos CUADRO
- Page 188 and 189: CUADRO XIII.8 Honduras: Estimacione
- Page 190 and 191: CUADRO XIII.14 Honduras: Estimacion
- Page 192 and 193: CUADRO XIII.20 Honduras: Estimacion
- Page 194: GRÁFICO XIII.3 Honduras: Tasas de
- Page 197 and 198: 196 XIV. MÉXICO XIV.1. Fuentes de
- Page 199 and 200: 198 GRÁFICO XIV.1 México: estimac
- Page 201 and 202: 200 XIV.4. Cuadros y gráficos CUAD
- Page 203 and 204: 202 CUADRO XIV.8 México: Estimacio
- Page 205 and 206: 204 CUADRO XIV.14 México: Estimaci
- Page 207 and 208: 206 GRÁFICO XIV.2 México: Tasas d
- Page 210 and 211: Bibliografía Bay, Guiomar y Orella
- Page 212 and 213: CUADRO XV.1 Nicaragua: Estimaciones
- Page 214 and 215: CUADRO XV.2 Nicaragua: Mortalidad i
- Page 216 and 217: CUADRO XV.5 Nicaragua: Estimaciones
- Page 218 and 219: CUADRO XV.11 Nicaragua: Estimacione
- Page 220 and 221: CUADRO XV.16 Nicaragua: Estimacione
- Page 222: GRÁFICO XV.3 Nicaragua: Tasas de m
174<br />
CUADRO XII.14<br />
Haití: Estimaciones indirectas <strong>de</strong> mortalidad infantil y <strong>en</strong> m<strong>en</strong>ores <strong>de</strong> cinco años (mo<strong>de</strong>lo oeste) <strong>en</strong> <strong>base</strong> a <strong>la</strong> “Enquête<br />
mortalité, morbidité et utilisation <strong>de</strong>s services“ <strong>de</strong>l 2000<br />
Edad <strong>de</strong> <strong>la</strong><br />
mujer<br />
Fu<strong>en</strong>te: Cayemittes, Michel y otros, Enquete Mortalité, Morbidité, et Utilisation <strong>de</strong>s Services, EMMUS – III 2000, Pétionville, Haití, Institute Haïti<strong>en</strong> <strong>de</strong> l’Enfance e Institute of<br />
Resource Developm<strong>en</strong>t/Macro International, 2001, pág.53, tab<strong>la</strong> 4.6.<br />
CUADRO XII.15<br />
Haití: Estimaciones indirectas <strong>de</strong> mortalidad infantil y <strong>en</strong> m<strong>en</strong>ores <strong>de</strong> cinco años (mo<strong>de</strong>lo oeste) <strong>en</strong> <strong>base</strong> al C<strong>en</strong>so<br />
<strong>de</strong> 2003<br />
Edad <strong>de</strong> <strong>la</strong><br />
mujer<br />
Pari<strong>de</strong>z media<br />
Pari<strong>de</strong>z media<br />
Proporción<br />
<strong>de</strong> hijos fallecidos<br />
Proporción<br />
<strong>de</strong> hijos fallecidos<br />
Fu<strong>en</strong>te: Institut Haïti<strong>en</strong> <strong>de</strong> Statistique et D'Informatique, 4 Eme Rec<strong>en</strong>sem<strong>en</strong>t G<strong>en</strong>eral <strong>de</strong> <strong>la</strong> Popu<strong>la</strong>tion et <strong>de</strong> L'' Habitat, 2003, págs 511 y 565, cuadros 500 y 600 respectivam<strong>en</strong>te.<br />
CUADRO XII.16<br />
Haití: Estimaciones directas <strong>de</strong> mortalidad infantil y <strong>en</strong><br />
m<strong>en</strong>ores <strong>de</strong> cinco años <strong>en</strong> <strong>base</strong> a <strong>la</strong> “Enquête mortalité,<br />
morbidité et utilisation <strong>de</strong>s services“ <strong>de</strong> 2005-2006<br />
Fecha <strong>de</strong><br />
refer<strong>en</strong>cia<br />
<strong>Mortalidad</strong> Infantil<br />
(por mil)<br />
q(1) q(5)<br />
15-19 0,09 0,056 2002.0 62 84<br />
20-24 0,67 0,072 2000.8 66 90<br />
25-29 1,56 0,080 1999.0 64 88<br />
30-34 2,63 0,090 1996.8 67 92<br />
35-39 3,67 0,105 1994.4 72 100<br />
40-44 4,36 0,126 1991.8 79 111<br />
45-49 4,79 0,145 1988.8 83 117<br />
Período<br />
Tasa <strong>de</strong> mortalidad (por mil)<br />
q(1) q(5)<br />
1982- 1987 114 178<br />
1987-1991 103 156<br />
1992-1996 86 135<br />
1997-2001 83 118<br />
2002-2006 57 86<br />
Fu<strong>en</strong>te: Cayemittes, Michel y otros, Enquete Mortalité, Morbidité, et Utilisation <strong>de</strong>s<br />
Services, EMMUS - IV, 2005-2006, Pétionville, Haití, Ministère <strong>de</strong> <strong>la</strong> Santé Publique<br />
et <strong>de</strong> <strong>la</strong> Popu<strong>la</strong>tion, Institute Haïti<strong>en</strong> <strong>de</strong> l’Enfance e Institute of Resource Developm<strong>en</strong>t/Macro<br />
International, 2007, pág. 177, tab<strong>la</strong> 12.1.<br />
XII<br />
Fecha <strong>de</strong><br />
refer<strong>en</strong>cia<br />
<strong>Mortalidad</strong> Infantil<br />
(por mil)<br />
q(1) q(5)<br />
15-19 0,16 0,064 1999.0 62 84<br />
20-24 0,87 0,126 1997.8 108 156<br />
25-29 2,07 0,135 1996.2 104 150<br />
30-34 3,33 0,147 1994.4 105 152<br />
35-39 4,87 0,174 1992.3 116 169<br />
40-44 5,23 0,174 1989.9 108 157<br />
45-49 5,81 0,220 1987.0 124 183<br />
<strong>Mortalidad</strong> <strong>en</strong> <strong>la</strong> <strong>niñez</strong><br />
HAITÍ


