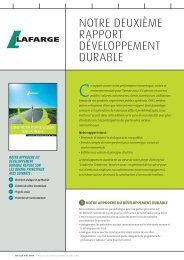
2005 Sustainability Report - Lafarge
2005 Sustainability Report - Lafarge
2005 Sustainability Report - Lafarge

Create successful ePaper yourself
Turn your PDF publications into a flip-book with our unique Google optimized e-Paper software.
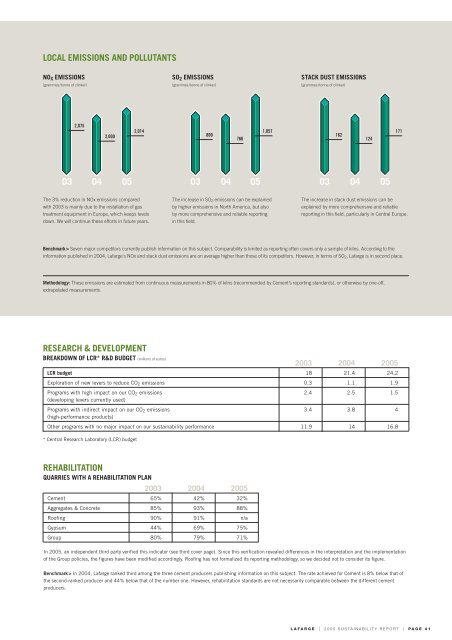
LOCAL EMISSIONS AND POLLUTANTS<br />
NOX EMISSIONS<br />
(grammes/tonne of clinker)<br />
2,075<br />
2,000<br />
03 04 05<br />
2,014<br />
The 3% reduction in NOx emissions compared<br />
with 2003 is mainly due to the installation of gas<br />
treatment equipment in Europe, which keeps levels<br />
down. We will continue these efforts in future years.<br />
SO2 EMISSIONS<br />
(grammes/tonne of clinker)<br />
800<br />
03 04 05<br />
The increase in SO2 emissions can be explained<br />
by higher emissions in North America, but also<br />
by more comprehensive and reliable reporting<br />
in this field.<br />
STACK DUST EMISSIONS<br />
(grammes/tonne of clinker)<br />
03 04 05<br />
The increase in stack dust emissions can be<br />
explained by more comprehensive and reliable<br />
reporting in this field, particularly in Central Europe.<br />
Benchmark> Seven major competitors currently publish information on this subject. Comparability is limited as reporting often covers only a sample of kilns. According to the<br />
information published in 2004, <strong>Lafarge</strong>'s NOx and stack dust emissions are on average higher than those of its competitors. However, in terms of SO2, <strong>Lafarge</strong> is in second place.<br />
Methodology: These emissions are estimated from continuous measurements in 80% of kilns (recommended by Cement’s reporting standards), or otherwise by one-off,<br />
extrapolated measurements.<br />
RESEARCH & DEVELOPMENT<br />
BREAKDOWN OF LCR* R&D BUDGET (millions of euros)<br />
* Central Research Laboratory (LCR) budget<br />
766<br />
1,057<br />
162<br />
LAFARGE | <strong>2005</strong> SUSTAINABILITY REPORT | PAGE 41<br />
124<br />
2003 2004 <strong>2005</strong><br />
LCR budget 18 21.4 24,2<br />
Exploration of new levers to reduce CO2 emissions 0.3 1.1 1.9<br />
Programs with high impact on our CO2 emissions<br />
(developing levers currently used)<br />
2.4 2.5 1.5<br />
Programs with indirect impact on our CO2 emissions<br />
(high-performance products)<br />
3.4 3.8 4<br />
Other programs with no major impact on our sustainability performance 11.9 14 16.8<br />
REHABILITATION<br />
QUARRIES WITH A REHABILITATION PLAN<br />
2003 2004 <strong>2005</strong><br />
Cement 65% 42% 32%<br />
Aggregates & Concrete 85% 93% 88%<br />
Roofing 90% 91% n/a<br />
Gypsum 44% 69% 75%<br />
Group 80% 79% 71%<br />
In <strong>2005</strong>, an independent third party verified this indicator (see third cover page). Since this verification revealed differences in the interpretation and the implementation<br />
of the Group policies, the figures have been modified accordingly. Roofing has not formalized its reporting methodology, so we decided not to consider its figure.<br />
Benchmark> In 2004, <strong>Lafarge</strong> ranked third among the three cement producers publishing information on this subject. The rate achieved for Cement is 8% below that of<br />
the second-ranked producer and 44% below that of the number one. However, rehabilitation standards are not necessarily comparable between the different cement<br />
producers.<br />
171