2005 Sustainability Report - Lafarge
2005 Sustainability Report - Lafarge
2005 Sustainability Report - Lafarge

You also want an ePaper? Increase the reach of your titles
YUMPU automatically turns print PDFs into web optimized ePapers that Google loves.
Monitoring our<br />
performance<br />
PAGE 40 | <strong>2005</strong> SUSTAINABILITY REPORT | LAFARGE<br />
Our environmental,<br />
social and community<br />
performance<br />
To ensure that our sustainable development indicators are transparent, independent and reliable,<br />
<strong>Lafarge</strong> initiated an external verification process in <strong>2005</strong>. International auditors<br />
PricewaterhouseCoopers handled the verification of four additional indicators, bringing the<br />
number of verified indicators to seven and marking the first stage of our campaign to produce reliable<br />
indicators.<br />
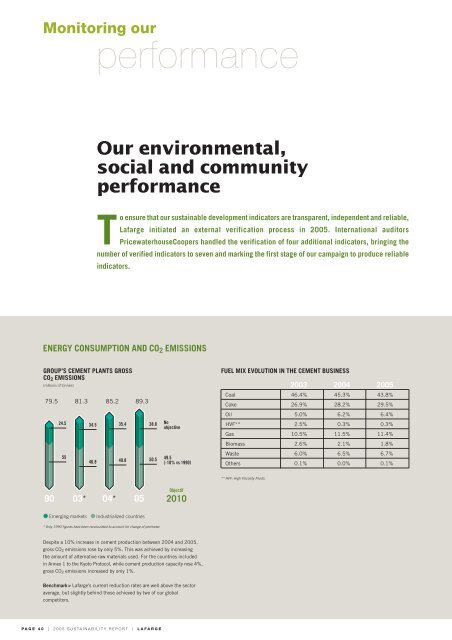
ENERGY CONSUMPTION AND CO2 EMISSIONS<br />
GROUP’S CEMENT PLANTS GROSS<br />
CO2 EMISSIONS<br />
* Only 1990 figures have been recalculated to account for change of perimeter.<br />
Despite a 10% increase in cement production between 2004 and <strong>2005</strong>,<br />
gross CO2 emissions rose by only 5%. This was achieved by increasing<br />
the amount of alternative raw materials used. For the countries included<br />
in Annex 1 to the Kyoto Protocol, while cement production capacity rose 4%,<br />
gross CO2 emissions increased by only 1%.<br />
Benchmark> <strong>Lafarge</strong>'s current reduction rates are well above the sector<br />
average, but slightly behind those achieved by two of our global<br />
competitors.<br />
FUEL MIX EVOLUTION IN THE CEMENT BUSINESS<br />
(millions of tonnes) 2003 2004 <strong>2005</strong><br />
Coal 46.4% 45.3% 43.8%<br />
79.5 81.3 85.2 89.3<br />
24.5<br />
55<br />
34.5<br />
46.8<br />
35.4<br />
49.8<br />
38.8<br />
50.5<br />
No<br />
objective<br />
49.5<br />
(-10% vs 1990)<br />
90 03* 04* 05<br />
Objectif<br />
2010<br />
● Emerging markets ● Industrialized countries<br />
Coke 26.9% 28.2% 29.5%<br />
Oil 5.0% 6.2% 6.4%<br />
HVF** 2.5% 0.3% 0.3%<br />
Gas 10.5% 11.5% 11.4%<br />
Biomass 2.6% 2.1% 1.8%<br />
Waste 6.0% 6.5% 6.7%<br />
Others 0.1% 0.0% 0.1%<br />
** HVF: High Viscosity Fluids.