The slides for the analyst presentation - Lafarge
The slides for the analyst presentation - Lafarge
The slides for the analyst presentation - Lafarge

Create successful ePaper yourself
Turn your PDF publications into a flip-book with our unique Google optimized e-Paper software.
Granulats et Béton - Afrique du Sud,<br />
stade Moses Mabhida<br />
2010 Full Year Results<br />
February 18, 2011
Disclaimer<br />
This document may contain <strong>for</strong>ward-looking statements. Such <strong>for</strong>ward-looking statements<br />
do not constitute <strong>for</strong>ecasts regarding <strong>the</strong> Company’s results or any o<strong>the</strong>r per<strong>for</strong>mance<br />
indicator, but ra<strong>the</strong>r trends or targets, as <strong>the</strong> case may be. <strong>The</strong>se statements are by <strong>the</strong>ir<br />
nature subject to risks and uncertainties, many of which are outside our control, including,<br />
but not limited to <strong>the</strong> risks described in <strong>the</strong> Company’s annual report available on its<br />
Internet website (www.lafarge.com). <strong>The</strong>se statements do not reflect future per<strong>for</strong>mance of<br />
<strong>the</strong> Company, which may materially differ. <strong>The</strong> Company does not undertake to provide<br />
updates of <strong>the</strong>se statements.<br />
More comprehensive in<strong>for</strong>mation about <strong>Lafarge</strong> may be obtained on its Internet website<br />
(www.lafarge.com).<br />
This document does not constitute an offer to sell, or a solicitation of an offer to buy<br />
<strong>Lafarge</strong> shares.<br />
2
Granulats et Béton - Afrique du Sud,<br />
stade Moses Mabhida<br />
Bruno Lafont<br />
Chairman and CEO
Group Positioned <strong>for</strong> Recovery in 2011<br />
� Successful cash generation measures in 2010 built strong base<br />
<strong>for</strong> <strong>the</strong> upcoming year<br />
� Drove structural cost savings of €220M<br />
� Improved working capital by 11 days<br />
� Secured divestments of over €500M<br />
� Strategy focused on profitable sales growth<br />
� Diversified portfolio benefited from recovery of mature markets<br />
� Started 12 MT of capacity in emerging markets<br />
� Maintained resilient pricing<br />
� Executed asset swap that establishes a leadership position<br />
in growing Brazil market<br />
4
Higher Volumes to Drive 2011 Earnings Growth<br />
� High quality plants to capture volume growth in emerging markets<br />
� Fundamental drivers of construction remain strong<br />
� Market expansion is absorbing new capacities<br />
� <strong>Lafarge</strong>’s strategically placed 68 MT of capacity additions between<br />
2006 and 2010 will drive growth<br />
� New Brazilian assets significantly contributing to results<br />
� Lower cost base in place as volumes improve in developed markets<br />
� Large room <strong>for</strong> recovery<br />
� Significant operating leverage potential as volumes return<br />
� Taking fur<strong>the</strong>r action to offset <strong>the</strong> impact of higher inflation<br />
� Price increase announcements made / being planned<br />
� Cost cutting actions continue to be significant<br />
A return to growth<br />
5
€2 Billion Debt Reduction in 2011<br />
� Actions secure a minimum of €1Bn debt reduction<br />
� Reduction of capex by €400M<br />
� Reduction of dividend by 50% to €1 per share<br />
� Reduction of costs and working capital<br />
� Higher cash flows from operations provide upside<br />
� Use divestments as an accelerator of this process<br />
� At least €750 million of divestments in 2011<br />
A significantly improved financial structure<br />
6
North America<br />
21MT<br />
4%<br />
65%<br />
A Well Diversified Portfolio in Place to Capture<br />
<strong>the</strong> Growth of Our Markets<br />
Latin America<br />
12MT<br />
5%<br />
75%<br />
Western Europe<br />
37MT<br />
2%<br />
55%<br />
Middle East<br />
and Africa<br />
55MT<br />
6%<br />
80%<br />
Central and Eastern Europe<br />
20MT<br />
6%<br />
55%<br />
Asia<br />
Total Capacity end 2010<br />
Construction Growth Forecast through 2020*<br />
Utilization rates <strong>for</strong> 2010<br />
Capacity already in place to capture growth as developed<br />
markets recover and emerging markets continue to grow<br />
* Source: Global Construction 2020 report prepared in 2010 by Global Construction Perspectives and Ox<strong>for</strong>d Economics<br />
72MT<br />
8%<br />
75%<br />
7
Fur<strong>the</strong>r Development of 11 million tons <strong>for</strong> 2011<br />
Brazil<br />
0.4 MT<br />
Algeria<br />
0.5 MT<br />
Poland<br />
0.5 MT<br />
Hungary<br />
1 MT<br />
Nigeria<br />
2.2 MT<br />
Iraq<br />
0.4 MT<br />
Saudi<br />
2 MT India<br />
1 MT<br />
China<br />
3 MT<br />
Diverse geographic portfolio of capacity additions<br />
to generate solid returns<br />
8
A Focus on Egypt<br />
� Latest facts<br />
� 7 days of sales interruption in total<br />
� Sales have resumed since February 5th and are near pre-crisis levels<br />
� Egypt represents 4% of <strong>the</strong> Group’s 2010 revenues<br />
� Stability is returning and long-term growth potential of Egypt<br />
is very significant<br />
� Largest growing population in <strong>the</strong> Middle East<br />
� Significant requirements <strong>for</strong> new housing and infrastructure<br />
9
Portfolio Optimization – A Non-Cash Deal<br />
that Streng<strong>the</strong>ns <strong>Lafarge</strong>’s UK Position<br />
� <strong>Lafarge</strong> and Anglo American to create a leading United Kingdom<br />
construction materials company<br />
� 50/50 <strong>Lafarge</strong> UK / Tarmac joint venture combining cement, aggregates,<br />
ready-mix concrete, and asphalt/paving businesses<br />
� Non-cash transaction<br />
� Combined revenues of £1.8 billion and EBITDA of £210 million <strong>for</strong> 2010<br />
� <strong>The</strong> combined operations will unlock significant value<br />
� EPS accretive to <strong>Lafarge</strong><br />
� Generates at least £60M in annual synergies<br />
• economies of scale<br />
• introduction of valued added products across a wider geographic reach<br />
� JV to benefit from a future recovery in <strong>the</strong> UK market<br />
� Significant aggregates reserves<br />
� Next steps<br />
� Regulatory approval<br />
� Businesses will operate independently during this process<br />
10
Strong Potential <strong>for</strong> <strong>the</strong> Future<br />
� Volume improvement to underpin earnings growth<br />
� Recovery of mature markets<br />
� Continued growth in emerging markets<br />
� Management actions leverage strength of growth<br />
� Strategically diversified geographic portfolio of assets<br />
� Cost reduction part of <strong>the</strong> Group’s culture<br />
� Non-cash deals that streng<strong>the</strong>n local positions<br />
� Significant debt reduction <strong>for</strong> 2011<br />
� Operational cash flows<br />
� Divestments<br />
11
Granulats et Béton - Brésil,<br />
Musée d'Art Contemporain<br />
Jean-Jacques Gauthier<br />
Chief Financial Officer
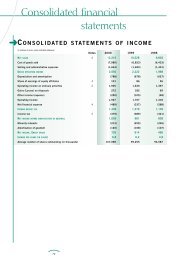
Solid Per<strong>for</strong>mance in 2010 in a Challenging<br />
Environment<br />
� Fourth Quarter Highlights<br />
� Cement volumes rose in <strong>the</strong> quarter, <strong>the</strong> first increase since Q4 2008<br />
� Current operating income increased 7%, helped by <strong>the</strong> strength<br />
of <strong>the</strong> Brazilian assets acquired in Q3 and favorable <strong>for</strong>eign exchange<br />
� €50M of structural cost savings partially offset <strong>the</strong> higher cost<br />
of inflation<br />
� Strong cash flows due to working capital actions<br />
� Full Year Highlights<br />
� Rate of volume declines slowed significantly <strong>for</strong> <strong>the</strong> year<br />
� Pricing remained resilient in <strong>the</strong> face of a challenging environment<br />
� Achieved target of securing more than €500M of divestments<br />
� Exceeded structural cost savings target, achieving €220M <strong>for</strong> <strong>the</strong> year<br />
� Generated strong free cash flows of €2.2Bn (1) <strong>for</strong> <strong>the</strong> year<br />
(1) Excluding <strong>the</strong> €338m one-time payment <strong>for</strong> <strong>the</strong> Gypsum competition fine paid in <strong>the</strong> third quarter 2010<br />
13
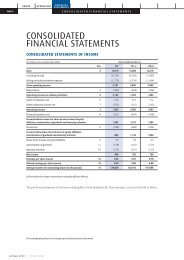
Key Figures<br />
12 months 4 th Quarter<br />
€m 2009 2010 Variation lfl 2009 2010 Variation lfl<br />
Sales 15,884 16,169 2% -3% 3,641 3,959 9% -<br />
EBITDA 3,600 3,614 - -6% 768 824 7% -2%<br />
Current Operating Income 2,477 2,441 -1% -8% 494 530 7% -4%<br />
Operating Margin 15.6% 15.1% -50bp 13.6% 13.4% -20bp<br />
Net income Group share (1) 736 827 12% (38) 62 nm<br />
Earnings per share (in €) 2.77 2.89 4% (0.13) 0.22 nm<br />
Net dividend (in €) (2) 2.00 1.00<br />
ROCE (3) 6.0% 5.8%<br />
Free cash flow 2,834 2,151 (4) -24% 1,123 848 -24%<br />
Net debt 13,795 13,993 1%<br />
(1) Net income attributable to <strong>the</strong> owners of <strong>the</strong> parent company.<br />
(2) Subject to approval of Annual General Meeting<br />
(3) After tax, using <strong>the</strong> effective tax rate<br />
(4) Excluding <strong>the</strong> €338m one-time payment <strong>for</strong> <strong>the</strong> Gypsum competition fine paid in <strong>the</strong> third quarter 2010<br />
14
Exceeded 2010 Cost-Cutting Target<br />
� Driving permanent cost savings <strong>for</strong> <strong>the</strong> Group<br />
� Leveraging industrial technical expertise, purchasing power,<br />
and knowledge sharing through <strong>the</strong> Group network<br />
� Focus on energy efficiency, industrial productivity and SG&A<br />
Structural cost cuts (million €)<br />
70<br />
0,4% *<br />
*% of sales<br />
170<br />
180<br />
1,0% * 0,9% *<br />
230<br />
1,4% *<br />
2006 2007 2008 2009<br />
220<br />
1,4% *<br />
2010<br />
Achieving over €1Bn of structural cost savings since 2006<br />
>200<br />
Obj 2011<br />
15
Brésil, cimenterie, usine d’Arcos<br />
Cement
Cement Highlights<br />
(1) Be<strong>for</strong>e elimination of inter divisional sales<br />
12 months 4 th Quarter<br />
MT 2009 2010 Variation lfl 2009 2010 Variation lfl<br />
Volumes 141.2 135.7 -4% -3% 33.6 34.4 2% 1%<br />
€m<br />
Sales (1) 10,105 10,280 2% -3% 2,288 2,514 10% 1%<br />
EBITDA 3,076 3,005 -2% -7% 683 695 1% -7%<br />
Current Operating Income 2,343 2,230 -5% -10% 507 503 -1% -9%<br />
€<br />
EBITDA / t 21.8 22.1<br />
Operating margin<br />
23.2% 21.7%<br />
2009 2010<br />
� Volumes increased in Q4 <strong>for</strong> <strong>the</strong> first time since Q4<br />
2008, supported by a return to growth in emerging<br />
markets.<br />
� Prices were resilient in a challenging environment,<br />
despite price declines in some markets.<br />
� For <strong>the</strong> year, our cost reduction program supported<br />
a solid 2010 EBITDA margin of 29.2%, despite rising<br />
variable costs in <strong>the</strong> second half of <strong>the</strong> year.<br />
17
Cement highlights<br />
Resilient earnings in a challenging environment<br />
By geographical zone<br />
12 months 4 th Quarter<br />
2009 2010 Variation 2009 2010 Variation<br />
COI (€m) 2,343 2,230 -5% 507 503 -1%<br />
Western Europe 507 427 -16% 130 70 -46%<br />
North America 24 79 229% (1) 13 nm<br />
Central and Eastern Europe 262 193 -26% 47 22 -53%<br />
Middle East and Africa 1,048 1,000 -5% 212 267 26%<br />
Latin America 140 193 38% 35 58 66%<br />
Asia 362 338 -7% 84 73 -13%<br />
� In Western Europe, positive UK volume trends and strong cost reduction only partially offset <strong>the</strong> impact of <strong>the</strong><br />
steep volume declines in Greece and Spain. In Q4, poor wea<strong>the</strong>r and fewer carbon credit sales lowered results.<br />
� North America volume recovery and cost containment supported earnings growth <strong>for</strong> both <strong>the</strong> FY and Q4.<br />
� Central and Eastern Europe results were impacted by difficult economic conditions in Romania and lower prices<br />
in Poland. Market trends in Russia and Poland improved in <strong>the</strong> second half, although harsh wea<strong>the</strong>r and fewer<br />
carbon credit sales weighted on Q4 results.<br />
� MEA market trends were positive but results were lower <strong>for</strong> <strong>the</strong> year due to <strong>the</strong> entrance of new capacities<br />
(Jordan) and production shortfalls (Algeria). Q4 volumes returned to growth and current operating income<br />
benefited from <strong>the</strong> reversal of a regulatory fee on raw materials in Egypt.<br />
� Latin America grew due to dynamic market trends and newly integrated Brazil assets.<br />
� Asia earnings declined due to lower prices in South Korea and China, compounded by rising costs.<br />
18
Ciment - Granulats et Béton - Brésil,<br />
centre administratif gouvernemental<br />
de l'état de Minas Gerais<br />
Aggregates & Concrete
Aggregates & Concrete Highlights<br />
Signs of Improvement <strong>for</strong> Aggregates Volumes<br />
and Tight Cost Management<br />
Volumes<br />
Pure Aggregates MT<br />
Ready-Mix Concrete Mm 3<br />
€m<br />
(1) Be<strong>for</strong>e elimination of inter divisional sales<br />
12 months 4 th Quarter<br />
2009 2010 Variation lfl 2009 2010 Variation lfl<br />
196.0<br />
37.1<br />
193.2<br />
34.0<br />
-1%<br />
-8%<br />
Sales (1) 5,067 5,093 1% -3% 1,173 1,260 7% -1%<br />
EBITDA 458 482 5% -6% 116 123 6% -4%<br />
Current Operating Income 193 216 12% -8% 46 53 15% -8%<br />
Operating margin<br />
3.8%<br />
4.2%<br />
2009 2010<br />
1%<br />
-5%<br />
48.3<br />
8.6<br />
48.1<br />
8.4<br />
0%<br />
-2%<br />
0%<br />
-3%<br />
� Sales stabilized in <strong>the</strong> fourth quarter, supported by<br />
volume growth in North America and in <strong>the</strong> United<br />
Kingdom.<br />
� Operating margin improved, reflecting continuous<br />
cost containment and aggregates volumes<br />
improvement.<br />
� Ready-Mix sales of Value Added Products<br />
improved at comparable scope<br />
and contributed to earnings.<br />
20
Plätre- Afrique du Sud, immeuble de<br />
Johannesburg<br />
Gypsum
Gypsum<br />
Continuing Results Improvements<br />
(1) Be<strong>for</strong>e elimination of inter divisional sales<br />
12 months 4 th Quarter<br />
Mm² 2009 2010 Variation lfl 2009 2010 Variation lfl<br />
Volumes 667 690 3% 3% 165 173 5% 5%<br />
€m<br />
Sales (1) 1,355 1,441 6% 2% 320 351 10% 4%<br />
EBITDA 119 143 20% 13% 17 30 76% 61%<br />
Current Operating<br />
Income<br />
Operating margin<br />
2.8%<br />
4.0%<br />
2009 2010<br />
38 58 53% 42% (4) 10 nm nm<br />
� Organic growth in sales both year-to-date<br />
and in Q4.<br />
� Solid market trends in Asia and in <strong>the</strong> UK.<br />
� Operating margin improved in a context of slightly<br />
lower prices, thanks to tight cost control and<br />
improved volumes.<br />
22
Granulats et Béton - Brésil,<br />
Musée d'Art Contemporain<br />
Net Income
Net Income<br />
12 months 4 th Quarter<br />
€m 2009 2010 2009 2010<br />
Current Operating Income 2,477 2,441 494 530<br />
O<strong>the</strong>r income (expenses) (227) (272) (209) (127)<br />
Finance costs, net (926) (723) (1) (248) (224)<br />
Income from associates (18) (16) (4) (2)<br />
Income taxes (260) (316) (16) (32)<br />
Non-controlling interests (310) (287) (55) (83)<br />
Net income Group Share (2) 736 827 (38) 62<br />
(1) Including <strong>the</strong> gain on <strong>the</strong> disposal of Cimpor shares <strong>for</strong> €161m<br />
(2) Net income attributable to <strong>the</strong> owners of <strong>the</strong> parent company.<br />
24
Granulats et Béton - Brésil,<br />
Musée d'Art Contemporain<br />
Cash Flow and Debt<br />
Highlights
Cash Flow<br />
12 months 4 th Quarter<br />
€m 2009 2010 2009 2010<br />
Cash flow from operations<br />
Change in working capital<br />
Sustaining capex<br />
2,177<br />
1,029<br />
(372)<br />
2,156 (1)<br />
354<br />
(359)<br />
405<br />
891<br />
(173)<br />
(1) <strong>The</strong> €338m one-time payment <strong>for</strong> <strong>the</strong> Gypsum competition fine paid in <strong>the</strong> third quarter 2010 is excluded from <strong>the</strong> cash flow<br />
from operations and presented in a separate line to facilitate comparability of periods<br />
(2) Including debt acquired / Net of <strong>the</strong> debt disposed of, and including <strong>the</strong> non controlling interests’ share in capital increase of subsidiaries<br />
(mainly EBRD additional investment in our operations in Eastern Europe in Q4 2009 and Q4 2010)<br />
(3) Including <strong>the</strong> divestment of a minority stake in <strong>Lafarge</strong> Malayan Cement Berhad <strong>for</strong> €141m in Q3 2010<br />
323<br />
698<br />
(173)<br />
Free cash flow excluding non recurring payment 2,834 2,151 (1) 1,123 848<br />
Non-recurring payment (1) - (338) - -<br />
Free cash flow 2,834 1,813 1,123 848<br />
Development investments (2)<br />
Divestments (2)<br />
(1,349)<br />
919<br />
(1,034)<br />
364 (3)<br />
(338)<br />
286<br />
(198)<br />
78<br />
Cash flow after investments 2,404 1,143 1,071 728<br />
Dividends<br />
Equity issuance (repurchase)<br />
Currency fluctuation impact<br />
Change in fair value<br />
O<strong>the</strong>rs<br />
(536)<br />
1,448<br />
33<br />
(138)<br />
(122)<br />
(849)<br />
26<br />
(490)<br />
41<br />
(69)<br />
(26)<br />
3<br />
(111)<br />
(64)<br />
(55)<br />
(28)<br />
6<br />
(128)<br />
54<br />
35<br />
Net debt reduction (increase) 3,089 (198) 818 667<br />
Net debt at <strong>the</strong> beginning of period 16,884 13,795 14,613 14,660<br />
Net debt at period end 13,795 13,993 13,795 13,993<br />
26
Successful Working Capital Actions<br />
to Maximize Cash Flow Generation<br />
� Strict Working Capital brought close to 30 sales days<br />
at <strong>the</strong> end of 2010<br />
Strict Working Capital in days of sales<br />
� Actions generated more than € 350 million of additional cash flows<br />
in 2010.<br />
27
Balanced Debt Maturity Schedule<br />
and Strong Liquidity<br />
2 000<br />
1 800<br />
1 600<br />
1 400<br />
1 200<br />
1 000<br />
800<br />
600<br />
400<br />
200<br />
0<br />
<strong>Lafarge</strong> SA Commercial paper <strong>Lafarge</strong> SA Bonds & o<strong>the</strong>r MLT instruments<br />
Subsidiaries debt instruments<br />
Securitization programs<br />
Orascom acquisition facility (drawings)<br />
at December 31, 2010 (€m) (1)<br />
2011 2012 2013 2014 2015 2016 2017 2018 2019 After<br />
2019<br />
� Successfully refinanced €2.7Bn in 2010 with an average interest<br />
cost of 4.5% and average maturity of 6.5 years.<br />
� Cash and cash equivalents and committed unused credit lines fully<br />
cover short-term obligations.<br />
(1) Excluding puts on shares and derivatives instruments: €0.3bn in 2010 and 2009<br />
28
Strong Liquidity Backed<br />
by Well Balanced Committed Credit Lines<br />
€m, as at December 31, 2010<br />
Line<br />
currency<br />
Line<br />
size<br />
Amount<br />
available<br />
Expiry<br />
date<br />
Financial<br />
covenant<br />
MAC<br />
clause<br />
Syndicated credit facility EUR 1,764 1,764 28/07/13 (1) No No<br />
Bilateral committed credit facilities EUR 2,024 2,024 Various (2) No No<br />
Total <strong>Lafarge</strong> SA committed<br />
credit lines<br />
3,788 3,788<br />
� Cash and cash equivalents of €3.3Bn<br />
� <strong>Lafarge</strong> SA committed unused credit lines of €3.8Bn with average<br />
maturity of 2.7 years<br />
� Only €510m maturing by <strong>the</strong> end of 2012<br />
� 24 banks participating to <strong>the</strong> syndicated credit facility<br />
� No financial covenants on any credit facility<br />
(1) Except €110m, maturing on July 28, 2012.<br />
(2) From April 2011 to July 2015<br />
29
Granulats et Béton - Afrique du Sud,<br />
stade Moses Mabhida<br />
Outlook 2011
2011 Outlook – Market * Overview<br />
Volumes (%) Price Highlights<br />
North America 1 to 4 + Progressive recovery; prices improving<br />
Western Europe -5 to -2 =/+<br />
Central and Eastern Europe 3 to 6 +<br />
Slowdown in Spain and Greece with<br />
modest improvement in France<br />
Solid market trends in Russia and Poland;<br />
Romania lower with stabilization<br />
elsewhere; prices improving<br />
Middle East and Africa 4 to 7 =/+ (1) Solid market trends in most countries<br />
Latin America 7 to 10 + Solid market trends; prices improving<br />
Asia 5 to 8 + Solid market trends; prices improving<br />
Overall 3 to 6 +<br />
* Market growth <strong>for</strong>ecast at national level<br />
(1) Relative to year-end pricing; down at average pricing<br />
Solid market trends in most emerging<br />
countries and stabilization or slow<br />
recovery in mature markets<br />
31
2011 Outlook – O<strong>the</strong>r Elements<br />
(1) Impacted by country mix<br />
� +8% energy cost increase (1 euro per tonne)<br />
� Structural cost reduction of a fur<strong>the</strong>r €200 m in 2011<br />
� Cost of debt (gross): 5.7%<br />
� Tax rate: 26% (1)<br />
� Capital expenditures:<br />
- Sustaining: ~ €0.5 Bn<br />
- Development: ~ €0.5 Bn<br />
32
Granulats et Béton - Afrique du Sud,<br />
stade Moses Mabhida<br />
Conclusion
Granulats et Béton - Afrique du Sud,<br />
stade Moses Mabhida<br />
Appendices<br />
I. 2011 Market Overview
2011 Outlook – Market (1) overview<br />
Cement<br />
North America<br />
United States<br />
Canada<br />
Western Europe<br />
France<br />
United Kingdom<br />
Spain<br />
Greece<br />
Central and Eastern Europe<br />
Poland<br />
Romania<br />
Russia (1)<br />
Serbia<br />
Latin America<br />
Brazil<br />
Honduras<br />
Ecuador<br />
Market Volumes<br />
(%)<br />
1 to 4<br />
1 to 4<br />
3 to 6<br />
-5 to -2<br />
1 to 4<br />
-1 to 2<br />
-15 to -12<br />
-10 to -7<br />
3 to 6<br />
7 to 10<br />
-7 to -4<br />
8 to 11<br />
0 to 3<br />
7 to 10<br />
8 to 11<br />
4 to 7<br />
4 to 7<br />
Middle East and Africa<br />
Algeria<br />
Egypt<br />
Iraq<br />
Jordan<br />
Kenya<br />
Morocco<br />
Nigeria<br />
South Africa<br />
Syria<br />
Asia<br />
China (1)<br />
India (1)<br />
Indonesia<br />
Malaysia<br />
Philippines<br />
South Korea<br />
(1) Market growth <strong>for</strong>ecast at national level except <strong>for</strong> China, India and Russia <strong>for</strong> which only relevant markets are considered<br />
Market Volumes<br />
(%)<br />
4 to 7<br />
5 to 8<br />
3 to 6<br />
10 to 13<br />
0 to 3<br />
3 to 6<br />
1 to 4<br />
8 to 11<br />
0 to 3<br />
3 to 6<br />
5 to 8<br />
6 to 9<br />
7 to 10<br />
6 to 9<br />
3 to 6<br />
5 to 8<br />
-6 to -3<br />
Overall 3 to 6<br />
35
2011 Outlook – Market overview<br />
Aggregates & Concrete – Gypsum<br />
� Aggregates and Concrete<br />
� Gypsum<br />
� Mature markets: subdued volume growth in North America with<br />
contrasted trends in Western Europe.<br />
� Emerging markets: volume growth in most countries.<br />
� Price improvement expected <strong>for</strong> both Pure Aggregates and Ready-Mix<br />
concrete in a challenging context.<br />
� Volume and price improvement.<br />
36
Brésil, cimenterie, usine d’Arcos<br />
II. O<strong>the</strong>r In<strong>for</strong>mation<br />
Cement - Regional in<strong>for</strong>mation
YTD Sales at December 31, 2010 – Cement<br />
Like <strong>for</strong> Like Sales Variance Analysis by Region and in Major Markets (1)<br />
Cement – Analysis by Region and in Major<br />
Markets as at December 31, 2010<br />
(1) Variance on like <strong>for</strong> like sales on domestic markets be<strong>for</strong>e elimination of sales between Divisions<br />
(2) O<strong>the</strong>r effects: including price effects, product and customer mix effects<br />
(3) Volumes in <strong>the</strong> United States: 5.8%; in Canada: 9.9%<br />
(4) Pure price effect: +0.4%<br />
(5) Mainly due an increase in excise taxes<br />
Volume effect O<strong>the</strong>r effects (2) Activity variation<br />
vs. 2009<br />
North America 6.8% (3) -3.5% 3.3%<br />
Western Europe<br />
France<br />
United Kingdom<br />
Spain<br />
Germany<br />
Greece<br />
Central and Eastern Europe<br />
Poland<br />
Romania<br />
Serbia<br />
Russia<br />
Middle East and Africa<br />
Egypt<br />
Iraq<br />
Jordan<br />
Algeria<br />
South Africa<br />
Morocco<br />
Kenya<br />
Nigeria<br />
Latin America<br />
Brazil<br />
Ecuador<br />
Asia<br />
China<br />
South Korea<br />
India<br />
Malaysia<br />
Philippines<br />
-9.3%<br />
-6.4%<br />
3.3%<br />
-17.5%<br />
-2.2%<br />
-26.0%<br />
-6.6%<br />
3.1%<br />
-18.5%<br />
-12.3%<br />
-0.2%<br />
-6.5%<br />
-5.0%<br />
12.0%<br />
-46.2%<br />
-6.7%<br />
8.1%<br />
-2.9%<br />
-12.8%<br />
0.2%<br />
5.2%<br />
7.0%<br />
9.7%<br />
-2.9%<br />
-2.5%<br />
-11.0%<br />
7.7%<br />
-0.8%<br />
1.3%<br />
-1.8%<br />
-0.7% (4)<br />
-3.1%<br />
-8.8%<br />
2.1%<br />
-0.8%<br />
-2.0%<br />
-7.8%<br />
-1.4%<br />
13.3%<br />
2.2%<br />
1.8%<br />
-1.2%<br />
1.7%<br />
4.4%<br />
1.2%<br />
3.6%<br />
0.4%<br />
1.2%<br />
-0.8%<br />
2.0%<br />
2.4%<br />
2.7%<br />
2.8%<br />
-2.5%<br />
-8.5%<br />
7.3% (5)<br />
3.9%<br />
3.1%<br />
-11.1%<br />
-7.1%<br />
0.2%<br />
-26.3%<br />
-0.1%<br />
-26.8%<br />
-8.6%<br />
-4.7%<br />
-19.9%<br />
1.0%<br />
2.0%<br />
-4.7%<br />
-6.2%<br />
13.7%<br />
-41.8%<br />
-5.5%<br />
11.7%<br />
-2.5%<br />
-11.6%<br />
-0.6%<br />
7.2%<br />
9.4%<br />
12.4%<br />
-0.1%<br />
-5.0%<br />
-19.5%<br />
15.0%<br />
3.1%<br />
4.4%<br />
Cement domestic markets -4.0% 0.3% -3.7%<br />
38
Cement: North America<br />
(1) By destination<br />
(2) Be<strong>for</strong>e elimination of inter divisional sales<br />
12 months 4 th Quarter<br />
MT 2009 2010 Variation lfl 2009 2010 Variation lfl<br />
Volumes (1) 12.7 13.6 7% 7% 2.9 3.4 17% 17%<br />
€m<br />
Sales (2) 1,189 1,333 12% 3% 260 324 25% 12%<br />
EBITDA 154 216 40% 23% 29 46 59% 33%<br />
Current Operating Income 24 79 229% 133% (1) 13 nm nm<br />
€<br />
EBITDA / t 12.1 15.9<br />
Operating margin<br />
2.0%<br />
5.9%<br />
2009 2010<br />
� Positive volume trends in Canada and in <strong>the</strong> United<br />
States helped by higher infrastructure spending<br />
and stabilization in <strong>the</strong> residential markets.<br />
� Prices remained solid in Canada and eroded<br />
in <strong>the</strong> United States.<br />
� Earnings strongly improved due to significant cost<br />
cutting measures and continued volume growth.<br />
39
Cement: Western Europe<br />
12 months 4 th Quarter<br />
MT 2009 2010 Variation 2009 2010 Variation<br />
Volumes (1) 22.6 20.3 -10% 5.3 4.7 -11%<br />
€m<br />
Sales (2) 2,104 1,892 -10% 486 426 -12%<br />
EBITDA 659 575 -13% 165 106 -36%<br />
Current Operating Income 507 427 -16% 130 70 -46%<br />
€<br />
EBITDA / t 29.2 28.3<br />
Operating margin<br />
24.1%<br />
22.6%<br />
2009 2010<br />
(1) By destination<br />
(2) Be<strong>for</strong>e elimination of inter divisional sales<br />
� Positive volume trends in <strong>the</strong> UK with progressive stabilization<br />
in France and Germany. Spain and Greece continued to suffer<br />
from <strong>the</strong> economic environment.<br />
� Prices resilient overall in a challenging context.<br />
� Margins in Q4 fur<strong>the</strong>r impacted by poor wea<strong>the</strong>r and lower<br />
carbon credit sales of an incremental €30M. Year-to-date,<br />
EBITDA margin remained above 30% due to strict cost cutting<br />
measures across <strong>the</strong> region.<br />
40
Cement: Central And Eastern Europe<br />
(1) By destination<br />
(2) Be<strong>for</strong>e elimination of inter divisional sales<br />
12 months 4 th Quarter<br />
MT 2009 2010 Variation lfl 2009 2010 Variation lfl<br />
Volumes (1) 11.9 11.1 -7% -7% 2.4 2.4 - -<br />
€m<br />
Sales (2) 795 757 -5% -8% 162 170 5% 1%<br />
EBITDA 303 242 -20% -22% 57 35 -39% -34%<br />
Current Operating Income 262 193 -26% -27% 47 22 -53% -46%<br />
€<br />
EBITDA / t 25.5 21.8<br />
Operating margin<br />
33.0%<br />
25.5%<br />
2009 2010<br />
� Volume trends improved over <strong>the</strong> course of <strong>the</strong> year with strong<br />
market trends in Russia and Poland in H2, while Romania still<br />
suffers from <strong>the</strong> economic crisis.<br />
� Prices, while down <strong>for</strong> <strong>the</strong> year especially in Poland, improved<br />
in Q4 versus last year due to positive pricing in Russia.<br />
� 2010 EBITDA margin was a solid 32%.<br />
� Q4 current operating income and margins fur<strong>the</strong>r impacted by<br />
poor wea<strong>the</strong>r and lower carbon credit sales of an incremental<br />
€8M.<br />
41
Cement: Middle East and Africa<br />
(1) By destination<br />
(2) Be<strong>for</strong>e elimination of inter divisional sales<br />
12 months 4 th Quarter<br />
MT 2009 2010 Variation lfl 2009 2010 Variation lfl<br />
Volumes (1) 44.1 40.2 -9% -7% 10.2 10.0 -2% 1%<br />
€m<br />
Sales (2) 3,566 3,530 -1% -5% 786 857 9% 4%<br />
EBITDA 1,304 1,264 -3% -6% 276 330 20% 14%<br />
Current Operating Income 1,048 1,000 -5% -9% 212 267 26% 16%<br />
€<br />
EBITDA / t 29.6 31.4<br />
Operating margin<br />
29.4%<br />
28.3%<br />
2009 2010<br />
� Q4 sales increased by 9%, with a positive contribution of most<br />
markets, <strong>the</strong> main exception being Jordan. First contribution<br />
of our new plants in Syria and Uganda.<br />
� Prices were resilient in a challenging context.<br />
� 2010 EBITDA margin was at 35.8%;Q4 EBITDA margin was<br />
at 38.5%, benefiting from higher sales and from <strong>the</strong> reversal<br />
of a regulatory fee on past raw materials purchases in Egypt<br />
of €67M.<br />
42
Cement: Latin America<br />
(1) By destination<br />
(2) Be<strong>for</strong>e elimination of inter divisional sales<br />
12 months 4 th Quarter<br />
MT 2009 2010 Variation lfl 2009 2010 Variation lfl<br />
Volumes (1) 7.6 8.4 11% 5% 1.7 2.5 47% 9%<br />
€m<br />
Sales (2) 614 722 18% 7% 133 213 60% 13%<br />
EBITDA 172 228 33% 12% 41 69 68% 11%<br />
Current Operating Income 140 193 38% 12% 35 58 66% 12%<br />
€<br />
EBITDA / t 22.6 27.1<br />
Operating margin<br />
22.8%<br />
26.7%<br />
2009 2010<br />
� Organic growth of sales was 13% in <strong>the</strong> quarter<br />
and 7% year-to date, driven by positive market trends<br />
in <strong>the</strong> region.<br />
� Pricing improvement.<br />
� <strong>The</strong> successful integration of <strong>the</strong> acquired assets in<br />
Brazil significantly contributed to <strong>the</strong> earnings growth.<br />
� Margins significantly improved due to higher sales,<br />
contained costs and <strong>the</strong> level of margins of our new<br />
assets in Brazil.<br />
43
Cement: Asia<br />
(1) By destination<br />
(2) Be<strong>for</strong>e elimination of inter divisional sales<br />
12 months 4 th Quarter<br />
MT 2009 2010 Variation lfl 2009 2010 Variation lfl<br />
Volumes (1) 42.3 42.1 - - 11.1 11.4 3% 3%<br />
€m<br />
Sales (2) 1,837 2,046 11% - 461 524 14% -1%<br />
EBITDA 484 480 -1% -10% 115 109 -5% -17%<br />
Current Operating Income 362 338 -7% -15% 84 73 -13% -25%<br />
€<br />
EBITDA / t 11.4 11.4<br />
Operating margin<br />
19.7%<br />
16.5%<br />
2009 2010<br />
� Q4 volumes increased 3%, helped by positive<br />
market trends overall and with <strong>the</strong> progressive<br />
contribution of our new capacities.<br />
� In a challenging environment, prices were resilient in<br />
most countries outside South Korea, and stabilized<br />
in China versus Q3 levels.<br />
� Continuous cost cutting measures partly mitigated<br />
higher variable costs.<br />
44
Ciment - Granulats et Béton - Brésil,<br />
centre administratif gouvernemental<br />
de l'état de Minas Gerais<br />
III. O<strong>the</strong>r in<strong>for</strong>mation<br />
Aggregates & Concrete Division<br />
by Product Line and Geographical zone
Pure Aggregates<br />
(1) Be<strong>for</strong>e elimination of inter divisional sales<br />
12 months 4 th Quarter<br />
MT 2009 2010 Variation lfl 2009 2010 Variation lfl<br />
Volumes 196.0 193.2 -1% 1% 48.3 48.1 - -<br />
€m<br />
Sales (1) 1,907 2,036 7% 2% 455 499 10% 2%<br />
EBITDA 276 320 16% 9% 74 81 9% -<br />
Current Operating<br />
Income<br />
Operating margin<br />
6.2%<br />
8.0%<br />
2009 2010<br />
118 163 38% 26% 31 39 26% 16%<br />
� Sales increased by 2% like <strong>for</strong> like in <strong>the</strong> fourth<br />
quarter, supported by positive volume trends in North<br />
America and in <strong>the</strong> UK and despite harsh wea<strong>the</strong>r<br />
in December.<br />
� Overall, price level improved.<br />
� Continuous tight cost control management<br />
is reflected in <strong>the</strong> increase of operating margins,<br />
toge<strong>the</strong>r with <strong>the</strong> improvement<br />
in prices.<br />
46
Ready-Mix Concrete<br />
(1) Be<strong>for</strong>e elimination of inter divisional sales<br />
12 months 4 th Quarter<br />
Mm 3 2009 2010 Variation lfl 2009 2010 Variation lfl<br />
Volumes 37.1 34.0 -8% -5% 8.6 8.4 -2% -3%<br />
€m<br />
Sales (1) 2,920 2,838 -3% -6% 666 696 5% -3%<br />
EBITDA 146 113 -23% -32% 34 25 -26% -38%<br />
Current Operating Income 61 24 -61% -72% 12 2 -83% -98%<br />
Operating margin<br />
2.1%<br />
0.8%<br />
2009 2010<br />
� Volumes declined 3% like <strong>for</strong> like in <strong>the</strong> fourth quarter<br />
versus 5% year-to-date, helped by improved volume trends<br />
in <strong>the</strong> UK and in North America and despite harsh wea<strong>the</strong>r<br />
in December.<br />
� Price levels, while down <strong>for</strong> <strong>the</strong> year, largely stabilized<br />
at Q2 levels.<br />
� Significant cost containment and <strong>the</strong> contribution of Value<br />
Added Products partly offset <strong>the</strong> impact of lower sales.<br />
47
YTD Sales at December 31, 2010<br />
Like <strong>for</strong> Like Sales Variance Analysis by Region and in Major Markets<br />
Aggregates & Concrete Volume effect O<strong>the</strong>r effects*<br />
Pure Aggregates<br />
France<br />
United Kingdom<br />
North America<br />
South Africa<br />
Ready-mix Concrete<br />
France<br />
United Kingdom<br />
North America<br />
South Africa<br />
* O<strong>the</strong>r effects: including price effects, product and customer mix effects<br />
0.9%<br />
-2.9%<br />
8.8%<br />
6.3%<br />
-34.4%<br />
-5.0%<br />
-4.5%<br />
5.1%<br />
4.5%<br />
-23.3%<br />
0.8%<br />
0.5%<br />
2.1%<br />
0.5%<br />
4.1%<br />
-1.2%<br />
-1.0%<br />
-2.0%<br />
-3.3%<br />
2.4%<br />
Activity variation<br />
vs. 2009<br />
1.7%<br />
-2.4%<br />
10.9%<br />
6.8%<br />
-30.3%<br />
-6.2%<br />
-5.5%<br />
3.1%<br />
1.2%<br />
-20.9%<br />
48
Aggregates & Concrete<br />
Additional In<strong>for</strong>mation by Geographical Zone<br />
Volumes (1)<br />
Pure Aggregates (millions of tonnes)<br />
Of which Western Europe<br />
North America<br />
O<strong>the</strong>r countries<br />
Ready-mix (millions of m 3 )<br />
Of which Western Europe<br />
North America<br />
O<strong>the</strong>r countries<br />
Sales (2) (millions of €)<br />
(1) By destination<br />
(2) Be<strong>for</strong>e elimination of inter divisional sales by origin<br />
12 months 4 th Quarter<br />
2009 2010<br />
196.0<br />
65.6<br />
93.8<br />
36.6<br />
37.1<br />
14.1<br />
6.7<br />
16.3<br />
193.2<br />
61.9<br />
97.4<br />
33.9<br />
34.0<br />
13.0<br />
7.1<br />
13.9<br />
Var like f/<br />
like<br />
1%<br />
-5%<br />
2009 2010<br />
48.3<br />
15.6<br />
24.4<br />
8.3<br />
8.6<br />
3.3<br />
1.5<br />
3.8<br />
48.1<br />
14.3<br />
25.1<br />
8.7<br />
8.4<br />
3.0<br />
1.9<br />
3.5<br />
Var like f/<br />
like<br />
Total Aggregates & Concrete 5,067 5,093 -3% 1,173 1,260 -1%<br />
Of which Pure Aggregates Total<br />
Western Europe<br />
North America<br />
O<strong>the</strong>r countries<br />
Of which Ready-mix Total<br />
Western Europe<br />
North America<br />
O<strong>the</strong>r countries<br />
1,907<br />
830<br />
774<br />
303<br />
2,920<br />
1,270<br />
702<br />
948<br />
Current Operating Income (millions of €)<br />
Total Aggregates & Concrete 193 216 -8% 46 53 -8%<br />
Of which Western Europe<br />
North America<br />
O<strong>the</strong>r countries<br />
94<br />
18<br />
81<br />
62<br />
96<br />
58<br />
23<br />
12<br />
11<br />
4<br />
39<br />
10<br />
2,036<br />
807<br />
913<br />
316<br />
2,838<br />
1,181<br />
793<br />
864<br />
2%<br />
-6%<br />
455<br />
189<br />
197<br />
69<br />
666<br />
296<br />
164<br />
206<br />
499<br />
185<br />
232<br />
82<br />
696<br />
275<br />
203<br />
218<br />
49<br />
-<br />
-3%<br />
2%<br />
-3%
Plätre- Afrique du Sud, immeuble de<br />
Johannesburg<br />
IV. O<strong>the</strong>r in<strong>for</strong>mation<br />
Gypsum division by Geographical zone
Gypsum<br />
Additional In<strong>for</strong>mation by Geographical Zone<br />
Volumes<br />
(1) Be<strong>for</strong>e elimination of inter divisional sales by origin<br />
12 months 4 th Quarter<br />
2009 2010<br />
Var like f/<br />
like<br />
2009 2010<br />
Var like f/<br />
like<br />
Total Boards (millions of m²) 667 690 3% 165 173 5%<br />
Sales (1) (millions of €)<br />
Total Gypsum 1,355 1,441 2% 320 351 4%<br />
Of which Western Europe<br />
North America<br />
O<strong>the</strong>r countries<br />
762<br />
180<br />
413<br />
Current Operating Income (millions of €)<br />
Total Gypsum 38 58 42% (4) 10 nm<br />
Of which Western Europe<br />
North America<br />
O<strong>the</strong>r countries<br />
48<br />
(43)<br />
33<br />
753<br />
184<br />
504<br />
58<br />
(46)<br />
46<br />
175<br />
40<br />
105<br />
4<br />
(13)<br />
5<br />
180<br />
42<br />
129<br />
13<br />
(13)<br />
10<br />
51
Granulats et Béton - Brésil,<br />
Musée d'Art Contemporain<br />
V. O<strong>the</strong>r In<strong>for</strong>mation<br />
Income statement
O<strong>the</strong>r Income (Expenses)<br />
12 months 4 th Quarter<br />
€m 2009 2010 2009 2010<br />
Net gains (losses) on disposals 103 45 41 (5)<br />
Impairment of assets (164) (1) (154) (2) (123) (1) (60)<br />
Restructuring (155) (122) (83) (63)<br />
O<strong>the</strong>rs (11) (41) (44) 1<br />
Total (227) (272) (209) (127)<br />
(1) Of which 90 million euros impairment loss recognized on cement assets in Western Europe<br />
(2) Mostly comprise impairment loss on assets located in Western Europe and South Korea and closure costs of a paper plant in Sweden<br />
53
Finance Costs and Average Interest rate<br />
12 months 4 th Quarter<br />
Finance Costs in €m 2009 2010 2009 2010<br />
Financial charges on net debt (760) (773) (174) (193)<br />
Foreign exchange (37) (26) (31) (2)<br />
O<strong>the</strong>rs (129) 76 (1) (43) (29)<br />
Total (926) (723) (248) (224)<br />
December 31, 2009 December 31, 2010<br />
Average interest rate Interest rate Interest rate<br />
Spot Average Spot Average<br />
Total gross debt (2) €15.7 Bn 5.3% 5.1% €17.0 Bn 5.5% 5.3%<br />
Of which: Fixed rate 68% 6.3% 66% 6.7%<br />
Floating rate 32% 2.9% 34% 3.1%<br />
(1) Including gain on disposal of Cimpor <strong>for</strong> €161m<br />
(2) Excluding puts: €0.3Bn<br />
54
Granulats et Béton - Brésil,<br />
Musée d'Art Contemporain<br />
VI. O<strong>the</strong>r In<strong>for</strong>mation<br />
Statement of Financial Position (1) Statement of Financial Position & Cash Flow Statement<br />
(1) & Cash Flow Statement<br />
(1) Former Balance sheet
Statement of Financial position (1)<br />
€m<br />
Capital Employed<br />
Out of which:<br />
Goodwill<br />
Prop, plant & equip.<br />
Working Capital<br />
O<strong>the</strong>r<br />
Dec.<br />
31, 2009<br />
31,836<br />
13,249<br />
16,699<br />
921<br />
967<br />
Dec.<br />
31, 2010<br />
33,762<br />
14,327<br />
17,912<br />
440<br />
1,083<br />
Financial assets 1,591 863<br />
Total 33,427 34,625<br />
(1) Former balance sheet<br />
€m<br />
Equity<br />
Out of which:<br />
Shareholders’ equity<br />
Non controlling<br />
interests<br />
Dec.<br />
31, 2009<br />
16,800<br />
14,977<br />
1,823<br />
Dec.<br />
31, 2010<br />
18,224<br />
16,144<br />
2,080<br />
Net debt 13,795 13,993<br />
Provisions 2,832 2,408<br />
Total 33,427 34,625<br />
56
Investments and Divestments<br />
12 months 4 th Quarter<br />
€m 2009 2010 2009 2010<br />
Sustaining capital expenditures 372 359 173 173<br />
Development capital expenditures 1,234 950 308 155<br />
Acquisitions 115 84 30 43<br />
Capital expenditure 1,721 1,393 511 371<br />
Divestments (1) 919 364 (2) 286 78<br />
(1) Including <strong>the</strong> non controlling interests’ share in capital increase of subsidiaries, mainly composed of EBRD additional investment<br />
in our cement operations in Eastern Europe and <strong>the</strong> gross debt disposed of as part of <strong>the</strong> divested operations<br />
(2) Including <strong>the</strong> divestment of a minority stake in <strong>Lafarge</strong> Malayan Cement Berhad <strong>for</strong> €141m in Q3 2010<br />
57
Gross Debt (1) by Currency<br />
and by Source of Financing as at December 31<br />
USD<br />
€bn 4.0<br />
24%<br />
GBP<br />
€bn 0.8<br />
5%<br />
Split by currency<br />
CNY<br />
€bn 0.4<br />
3%<br />
O<strong>the</strong>r<br />
€bn 1.3<br />
7%<br />
EUR<br />
€bn 10.5<br />
61%<br />
Total Gross Debt (1) : €17.0Bn<br />
(1) Excluding puts: €0.3Bn<br />
Commercial<br />
paper<br />
4%<br />
€bn 0.7<br />
Split by source of financing<br />
Banks and<br />
o<strong>the</strong>rs<br />
25%<br />
€bn 4.3<br />
Notes / Private<br />
placements<br />
4%<br />
€bn 0.7<br />
Debentures<br />
67%<br />
€bn 11.3<br />
58
Key definitions<br />
Volumes Volumes are shown by destination<br />
Sales by Division<br />
EBITDA<br />
Current Operating Income<br />
Sales by Division are disclosed by origin, and be<strong>for</strong>e<br />
elimination of inter divisional sales<br />
Current Operating Income be<strong>for</strong>e depreciation and<br />
amortization<br />
Operating Income be<strong>for</strong>e “capital gains, impairment,<br />
restructuring and o<strong>the</strong>r”<br />
Operating margin Current Operating Income / Sales<br />
Free Cash Flow<br />
Like <strong>for</strong> Like variation<br />
Net operating cash flow generated by continuing operations<br />
less sustaining capital expenditures<br />
Like <strong>for</strong> Like variation corresponds to <strong>the</strong> variation<br />
at constant scope and exchange rates<br />
Strict Working Capital Trade receivables plus inventories less trade payables<br />
Strict Working Capital<br />
in days sales<br />
Strict Working Capital end of N * 90 days<br />
Sales of <strong>the</strong> last quarter<br />
59