DIRECTORS' REPORT ON PGNiG SA'S OPERATIONS ... - Notowania
DIRECTORS' REPORT ON PGNiG SA'S OPERATIONS ... - Notowania
DIRECTORS' REPORT ON PGNiG SA'S OPERATIONS ... - Notowania

You also want an ePaper? Increase the reach of your titles
YUMPU automatically turns print PDFs into web optimized ePapers that Google loves.
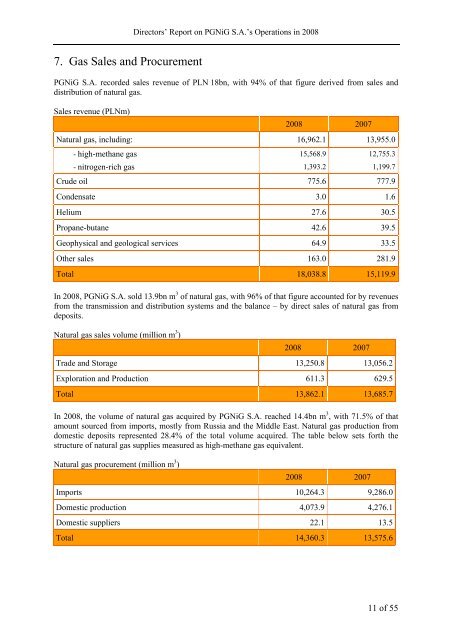
7. Gas Sales and Procurement<br />
Directors’ Report on <strong>PGNiG</strong> S.A.’s Operations in 2008<br />
<strong>PGNiG</strong> S.A. recorded sales revenue of PLN 18bn, with 94% of that figure derived from sales and<br />
distribution of natural gas.<br />
Sales revenue (PLNm)<br />
2008 2007<br />
Natural gas, including: 16,962.1 13,955.0<br />
- high-methane gas 15,568.9 12,755.3<br />
- nitrogen-rich gas 1,393.2 1,199.7<br />
Crude oil 775.6 777.9<br />
Condensate 3.0 1.6<br />
Helium 27.6 30.5<br />
Propane-butane 42.6 39.5<br />
Geophysical and geological services 64.9 33.5<br />
Other sales 163.0 281.9<br />
Total 18,038.8 15,119.9<br />
In 2008, <strong>PGNiG</strong> S.A. sold 13.9bn m 3 of natural gas, with 96% of that figure accounted for by revenues<br />
from the transmission and distribution systems and the balance – by direct sales of natural gas from<br />
deposits.<br />
Natural gas sales volume (million m 3 )<br />
2008 2007<br />
Trade and Storage 13,250.8 13,056.2<br />
Exploration and Production 611.3 629.5<br />
Total 13,862.1 13,685.7<br />
In 2008, the volume of natural gas acquired by <strong>PGNiG</strong> S.A. reached 14.4bn m 3 , with 71.5% of that<br />
amount sourced from imports, mostly from Russia and the Middle East. Natural gas production from<br />
domestic deposits represented 28.4% of the total volume acquired. The table below sets forth the<br />
structure of natural gas supplies measured as high-methane gas equivalent.<br />
Natural gas procurement (million m 3 )<br />
2008 2007<br />
Imports 10,264.3 9,286.0<br />
Domestic production 4,073.9 4,276.1<br />
Domestic suppliers 22.1 13.5<br />
Total 14,360.3 13,575.6<br />
11 of 55