Q-Compensating PSDM - CGG Veritas
Q-Compensating PSDM - CGG Veritas
Q-Compensating PSDM - CGG Veritas

Create successful ePaper yourself
Turn your PDF publications into a flip-book with our unique Google optimized e-Paper software.
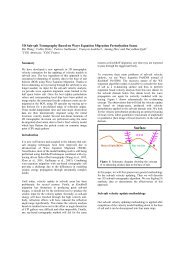
PROCESSING & IMAGING<br />
Q-<strong>Compensating</strong> <strong>PSDM</strong><br />
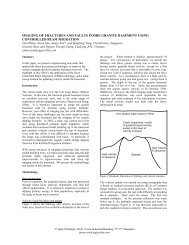
Prestack compensation for transmission anomalies<br />
Spatial variations in the absorption properties of the overburden cause frequency-dependent<br />
dissipation effects. These result in seismic amplitude attenuation and wavelet phase distortion<br />
which mask underlying events and decrease resolution. <strong>CGG</strong><strong>Veritas</strong> proprietary Q Tomography<br />
and Q <strong>PSDM</strong> help address these issues. Q Tomography builds a model of the anomaly using<br />
prestack amplitudes. Q <strong>PSDM</strong> can then use this model to compensate, recovering bandwidth,<br />
allowing meaningful AVO studies to be performed and aiding in the accurate prediction of<br />
reservoir properties.<br />
FEATURES:<br />
• Implemented for Kirchhoff, Beam and Reverse Time Migration<br />
algorithms<br />
• Compensates for frequency-dependent loss during propagation,<br />
giving correct phase, amplitude and resolution<br />
• Uses the estimated absorption model from frequencydependent<br />
Q Tomography to compensate for Q effects relative<br />
to the background<br />
• Goes beyond simplistic surface-consistent assumptions<br />
to compensate for transmission effects anywhere in the<br />
overburden<br />
BENEFITS:<br />
• Enables meaningful AVO analysis under complex overburdens,<br />
for example:<br />
- Gas pockets or gas hydrates<br />
- Unconformities<br />
• More accurate prediction of reservoir properties<br />
• Easier identification and interpretation of deeper reflectors<br />
Amplitude spectra for a good data zone (red), compared to an<br />
anomaly zone on a standard <strong>PSDM</strong> (blue) or the broadband result<br />
from Q <strong>PSDM</strong> (green).<br />
Safer, Clearer, Better<br />
Stack data migrated using a standard <strong>PSDM</strong> (top) and with Q <strong>PSDM</strong> (bottom). Data courtesy<br />
of Reliance.<br />
powered by
PROCESSING & IMAGING<br />
CONTENDING WITH GAS HYDRATES<br />
Gas hydrates can be found in the shallow sediments of many deep ocean<br />
areas. These form zones which strongly attenuate seismic amplitudes<br />
and are characterized by strong reflectivity due to the higher-velocity<br />
hydrates overlying the lower-velocity free gas interval. Dim zones occur<br />
beneath these gas hydrate pockets. The size and shape of the dim<br />
zones vary over different offsets, prohibiting AVO analysis and reservoir<br />
evaluation of the deeper reflectors.<br />
To resolve this issue, a frequency-dependent tomographic amplitude<br />
inversion is applied to offset-domain Common Image Gathers in order to<br />
estimate an interval Q model.<br />
After deriving and validating a geologically meaningful Q model, Q <strong>PSDM</strong><br />
uses it to compensate for amplitude and phase distortions during the<br />
migration itself. This generates a clearer image of the subsurface and<br />
enables more accurate interpretation and AVO analysis.<br />
The examples on this page use data taken from the extensive <strong>CGG</strong><strong>Veritas</strong><br />
data library in the Gulf of Mexico.<br />
Worldwide Headquarters<br />
Paris +33 1 64 47 45 00<br />
Massy +33 1 64 47 30 00<br />
Houston +1 832 351 8300<br />
geovation@cggveritas.com<br />
powered by<br />
cggveritas.com<br />
Superposition of conventional Reverse Time Migration (black traces) with Q Reverse Time<br />
Migration (colour traces), showing how Q migration corrects for phase as well as the more<br />
visually obvious effects on amplitude.<br />
Comparison of stack data from the Alaminos Canyon area, Gulf of Mexico, after conventional Reverse Time Migration (left) and Q Reverse Time Migration (right). After Q migration, events<br />
below the gas hydrates appear more continuous with more consistent amplitudes (dashed circle).<br />
10F–PI-447-V1