Integrated Data Viewer The Integrated Data Viewer - IDV
Integrated Data Viewer The Integrated Data Viewer - IDV Integrated Data Viewer The Integrated Data Viewer - IDV
Comparison of high resolution spectra (AIRS), and water vapor retrieval profiles at two locations over the Black Sea – one with a higher amount of low level moisture – using HYDRA's MultiChannelViewer.
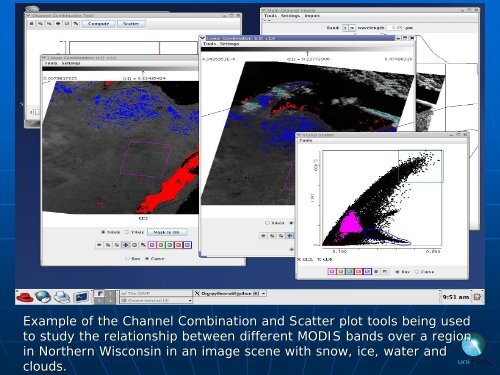
Example of the Channel Combination and Scatter plot tools being used to study the relationship between different MODIS bands over a region region in Northern Wisconsin in an image scene with snow, ice, water and an clouds.
- Page 1 and 2: The Integrated Data Viewer - IDV An
- Page 3 and 4: What is the IDV? �� Visualizati
- Page 5 and 6: �� In Classroom: IDV Benefits
- Page 7 and 8: IDV Examples GOES-EAST GOES EAST IR
- Page 9 and 10: IDV Examples EUMETSAT Meteosat-8 3-
- Page 11 and 12: IDV Examples Time Series Charts
- Page 13 and 14: IDV Examples TREX Field Project - G
- Page 15 and 16: IDV Examples WMS and Drawing Tool
- Page 17 and 18: IDV Features �� Bundles & new
- Page 19 and 20: IDV Product Generation IDV supports
- Page 21 and 22: Examples: Educational Modules Proje
- Page 23 and 24: Examples: IDV in LEAD �� LEAD V
- Page 25 and 26: �� GEON project is “Unidata U
- Page 27: Modis (Terra) Direct Broadcast over
- Page 31 and 32: L1B image overlayed by the MODIS fi
- Page 33 and 34: �� Next generation of McIDAS wi
- Page 35: �� IDV Homepage: IDV Informatio
Example of the Channel Combination and Scatter plot tools being used<br />
to study the relationship between different MODIS bands over a region region<br />
in Northern Wisconsin in an image scene with snow, ice, water and an<br />
clouds.


