NIST Technical Note 1621 - National Institute of Standards and ...
NIST Technical Note 1621 - National Institute of Standards and ...
NIST Technical Note 1621 - National Institute of Standards and ...

Create successful ePaper yourself
Turn your PDF publications into a flip-book with our unique Google optimized e-Paper software.
<strong>NIST</strong> <strong>Technical</strong> <strong>Note</strong> <strong>1621</strong><br />
Optical Radiation Measurements<br />
Based on Detector <strong>St<strong>and</strong>ards</strong><br />
George P. Eppeldauer, Editor
<strong>NIST</strong> <strong>Technical</strong> <strong>Note</strong> <strong>1621</strong><br />
Optical Radiation Measurements<br />
Based on Detector <strong>St<strong>and</strong>ards</strong><br />
George P. Eppeldauer, Editor<br />
Optical Technology Division<br />
Physics Laboratory<br />
<strong>National</strong> <strong>Institute</strong> <strong>of</strong> <strong>St<strong>and</strong>ards</strong> <strong>and</strong> Technology<br />
Gaithersburg, MD 20899-8441<br />
March 2009<br />
U.S. Department <strong>of</strong> Commerce<br />
Otto J. Wolff, Acting Secretary<br />
<strong>National</strong> <strong>Institute</strong> <strong>of</strong> <strong>St<strong>and</strong>ards</strong> <strong>and</strong> Technology<br />
Patrick Gallagher, Deputy Director
Certain commercial entities, equipment, or materials may be identified in this<br />
document in order to describe an experimental procedure or concept adequately. Such<br />
identification is not intended to imply recommendation or endorsement by the<br />
<strong>National</strong> <strong>Institute</strong> <strong>of</strong> <strong>St<strong>and</strong>ards</strong> <strong>and</strong> Technology, nor is it intended to imply that the<br />
entities, materials, or equipment are necessarily the best available for the purpose.<br />
<strong>National</strong> <strong>Institute</strong> <strong>of</strong> <strong>St<strong>and</strong>ards</strong> <strong>and</strong> Technology <strong>Technical</strong> <strong>Note</strong> <strong>1621</strong><br />
Natl. Inst. St<strong>and</strong>. Technol. Tech. <strong>Note</strong> <strong>1621</strong>, 371 pages (March 2009)<br />
CODEN: NTNOEF<br />
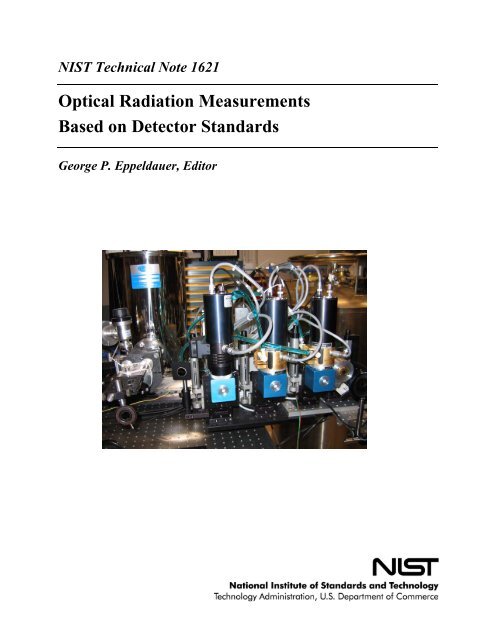
Front Cover:<br />
Spectral responsivity calibrations <strong>of</strong> three transfer-st<strong>and</strong>ard extended-InGaAs radiometers<br />
against the primary-st<strong>and</strong>ard cryogenic radiometer at the SIRCUS facility in the 1 µm to<br />
2.5 µm wavelength range.<br />
ii
Preface<br />
Improved detector technology in the past two decades opened a new era in the field <strong>of</strong> optical<br />
radiation measurements. Lower calibration <strong>and</strong> measurement uncertainties can be achieved with<br />
modern detector/radiometer st<strong>and</strong>ards than traditionally used source st<strong>and</strong>ards (blackbodies <strong>and</strong><br />
lamps). The achievable lower uncertainties provided the motivation to decrease the gap between<br />
the 0.02 % (k=2) relative exp<strong>and</strong>ed uncertainty <strong>of</strong> cryogenic radiometer measurements <strong>and</strong> the<br />
two to three orders <strong>of</strong> magnitude higher uncertainties <strong>of</strong> field-level optical radiation<br />
measurements.<br />
The <strong>NIST</strong> <strong>Technical</strong> <strong>Note</strong> (TN) 1438 published in 2001 summarized the research <strong>and</strong><br />
development work carried out in the Optical Sensor Group <strong>of</strong> the Optical Technology Division<br />
(OTD) since 1989 to develop high optical <strong>and</strong> electronic performance radiometers with selected<br />
optical detectors for the 200 nm to 20 µm wavelength range. In this present <strong>Technical</strong> <strong>Note</strong>,<br />
which is the continuation <strong>of</strong> the TN 1438, 36 research papers, published by the OTD from 1996<br />
to present, have been selected to show how the high-performance optical radiometers were<br />
converted into st<strong>and</strong>ards <strong>and</strong> used to realize new spectral-responsivity-based scales. In order to<br />
utilize the increased performance <strong>of</strong> the radiometers, new calibration-facilities have been<br />
developed to realize, maintain, <strong>and</strong> disseminate the detector/radiometer st<strong>and</strong>ards-based scales.<br />
As a result <strong>of</strong> the work described in these two TNs most <strong>of</strong> the calibrations at the OTD are<br />
performed with the new-generation detector/radiometer st<strong>and</strong>ards.<br />
The spectral power responsivity calibrations that started at the OTD about 30 years ago have<br />
been extended from the silicon wavelength range for the 210 nm to 20 µm range. New reference<br />
responsivity scales have been developed on the newly developed Spectral Irradiance <strong>and</strong><br />
Radiance Responsivity Calibrations with Uniform Sources Facility (SIRCUS), where instead <strong>of</strong><br />
traditional monochromators, tunable laser-driven integrating sphere sources are used to decrease<br />
detector <strong>and</strong> radiometer measurement uncertainties. The spectral power responsivity calibrations<br />
have also been extended to spectral irradiance <strong>and</strong> radiance responsivity calibrations.<br />
The irradiance mode reference scale was needed for the SIRCUS facility to improve the <strong>NIST</strong><br />
realized SI unit, the c<strong>and</strong>ela, <strong>and</strong> to realize the first spectral-responsivity-based tristimulus color<br />
scale. New filter-radiometers including photometers, <strong>and</strong> tristimulus colorimeters have been<br />
developed for the scale extensions with electronic <strong>and</strong> radiometric characteristics that will not<br />
limit the scale realization uncertainties. Silicon-trap <strong>and</strong> sphere-input InGaAs detectors have<br />
been developed as highest level transfer st<strong>and</strong>ards that can perform 0.05 % (k=2) responsivity<br />
uncertainties between 400 nm <strong>and</strong> 1650 nm. These SIRCUS reference st<strong>and</strong>ards are directly<br />
traceable to the primary-st<strong>and</strong>ard optical power measuring electrical-substitution cryogenic<br />
radiometers.<br />
The radiance responsivity scale was needed to calibrate new-generation optical-radiation<br />
thermometers to realize the detector-responsivity-based radiance temperature scale <strong>and</strong> the SI<br />
unit, the kelvin. The most accurate temperature determination <strong>of</strong> blackbody sources is based on<br />
the spectral irradiance <strong>and</strong> radiance responsivity determinations <strong>of</strong> the filter (b<strong>and</strong>-pass)<br />
radiometers that measure the radiation from blackbody sources. For temperature scale<br />
disseminations, improved transfer- <strong>and</strong> working-st<strong>and</strong>ard radiometers have been developed with<br />
selected Si, InGaAs, <strong>and</strong> extended-InGaAs detectors to perform direct thermodynamic<br />
temperature measurements in a wide temperature range. As an alternative to the source-based<br />
International Temperature Scale (ITS-90), low-uncertainty detector-based radiation temperature<br />
measurements can be directly performed with the new Si <strong>and</strong> InGaAs radiation thermometers<br />
between 2700 K <strong>and</strong> 430 K.<br />
iii
For routine spectral power responsivity calibrations in an extended wavelength range, low noiseequivalent-power<br />
(NEP) pyroelectric radiometers have been developed that can be operated at<br />
the low-power-output <strong>of</strong> traditional monochromators. These radiometers, traceable to the above<br />
reference detectors, extended the routine spectral power responsivity calibrations to a wavelength<br />
range from 250 nm to 19 µm.<br />
The low measurement uncertainties <strong>of</strong> the radiometric reference scale realizations required<br />
detector output signal measurements with uncertainties smaller than the uncertainty <strong>of</strong> the<br />
radiometric scale realization itself. In order to perform 0.01 % (k=2) electrical output signal<br />
measurement uncertainties for the detectors, traceability <strong>of</strong> the photocurrent measurements has<br />
been established to <strong>NIST</strong> electrical st<strong>and</strong>ards. The calibrated photocurrent meters <strong>and</strong> the<br />
different input optics to measure the different radiometric, photometric, <strong>and</strong> color quantities are<br />
integral parts <strong>of</strong> the new generation radiometers.<br />
Using the calibrated radiometers, the reference responsivity scales have been transferred to other<br />
<strong>NIST</strong> calibration facilities to decrease calibration <strong>and</strong> measurement uncertainties. Now, the<br />
spectral irradiance <strong>and</strong> radiance scales (disseminated by lamps) are derived from blackbody<br />
sources that are calibrated against the filter radiometer st<strong>and</strong>ards. Also, the radiometer st<strong>and</strong>ards<br />
are used to validate other existing source-based scales such as the irradiance from a synchrotron<br />
radiation source. The reference radiometers with the new calibration facilities have also been<br />
used for the absolute radiometric calibration <strong>of</strong> digital imaging systems. As a result <strong>of</strong> the<br />
photometric scale improvement <strong>and</strong> the spectral-responsivity-based tristimulus color scale<br />
development, both regular <strong>and</strong> special light sources (discharge lamps, color displays/monitors,<br />
solid-state light sources, etc.) can be measured with low uncertainty resulting in significant<br />
energy saving <strong>and</strong> quality improvement.<br />
With the calibrated radiometers, the <strong>NIST</strong> detector-st<strong>and</strong>ards-based radiometric scales are also<br />
disseminated to industry, military, <strong>and</strong> academia. The new calibrations with the lower<br />
measurement uncertainties support the economic growth <strong>and</strong> competitiveness <strong>of</strong> the U.S. electrooptical,<br />
lighting, paint, textile, <strong>and</strong> other industries. They also support the <strong>National</strong> Aeronautics<br />
<strong>and</strong> Space Administration’s (NASA) remote sensing activities. With the improved uncertainties<br />
<strong>of</strong> radiometric calibrations <strong>and</strong> measurements, it became possible to monitor the smaller than<br />
0.1 % long-term changes <strong>of</strong> the Earth. The detector-st<strong>and</strong>ards-based radiance scale is used to<br />
validate the calibration sources for the Earth Observing System <strong>of</strong> the U.S. Global Change<br />
Research Program. The OTD developed detector-st<strong>and</strong>ards-based infrared calibration systems<br />
have also significantly increased the competitiveness <strong>of</strong> the U.S. military-defense <strong>and</strong> security.<br />
George P Eppeldauer, Ph.D.<br />
Electronics Engineer, Development <strong>and</strong> Calibration <strong>of</strong> Optical Radiometers<br />
Optical Sensor Group, Optical Technology Division<br />
<strong>National</strong> <strong>Institute</strong> <strong>of</strong> <strong>St<strong>and</strong>ards</strong> <strong>and</strong> Technology<br />
100 Bureau Drive, Gaithersburg, MD 20899-8441<br />
iv
Table <strong>of</strong> Contents<br />
Preface ................................................................................................................................................iii<br />
1. “Facility for spectral irradiance <strong>and</strong> radiance responsivity calibrations using uniform<br />
sources,” Applied Optics, Vol. 45, No. 32, p. 8218-8237, 2006, S. W. Brown, G. P.<br />
Eppeldauer, <strong>and</strong> K. R. Lykke. Reproduced with permission <strong>of</strong> the Optical Society <strong>of</strong><br />
America ........................................................................................................................................1<br />
2. “Radiometer st<strong>and</strong>ard for absolute responsivity calibrations from 950 nm to 1650 nm with<br />
0.05 % (k=2) uncertainty,” NEWRAD-2008 presentation, to be published in Metrologia,<br />
G. P. Eppeldauer, H. W. Yoon, Y. Zong, T. C. Larason, A. Smith, <strong>and</strong> M. Racz .......................21<br />
3. “Optical characterization <strong>of</strong> diffuser-input st<strong>and</strong>ard irradiance meters,” Optika’98, 5th<br />
Congress on Modern Optics, SPIE Proc. Vol. 3573, 220-224, 1998. G. Eppeldauer, M.<br />
Racz, <strong>and</strong> T. Larason ...................................................................................................................34<br />
4. “Near infrared radiometer st<strong>and</strong>ards,” SPIE Proceedings, Vol. 2815, 42-54, 1996. G.<br />
Eppeldauer ...................................................................................................................................39<br />
5. “Calibration <strong>of</strong> a pyroelectric detector at 10.6 µm with the <strong>National</strong> <strong>Institute</strong> <strong>of</strong> <strong>St<strong>and</strong>ards</strong><br />
<strong>and</strong> Technology high-accuracy cryogenic radiometer,” Applied Optics, Vol. 36, No.16,<br />
3614-3621, 1997. T. R. Gentile, J. M. Houston, G. Eppeldauer, A. L. Migdall, <strong>and</strong> C. L.<br />
Cromer. Reproduced with permission <strong>of</strong> the Optical Society <strong>of</strong> America ...................................53<br />
6. “Realization <strong>of</strong> an infrared spectral response scale on a cryogenic bolometer,” Metrologia,<br />
Vol. 35, 307-315, 1998. A. Migdall <strong>and</strong> G. Eppeldauer ..............................................................61<br />
7. “Spectral power <strong>and</strong> irradiance responsivity calibration <strong>of</strong> InSb working-st<strong>and</strong>ard<br />
radiometers,” Applied Optics, Vol. 39, No. 31, 5739-5744, 2000. G. Eppeldauer <strong>and</strong> M.<br />
Racz. Reproduced with permission <strong>of</strong> the Optical Society <strong>of</strong> America .......................................68<br />
8. “Spectral responsivity determination <strong>of</strong> a transfer-st<strong>and</strong>ard pyroelectric radiometer,” SPIE<br />
Proceedings, Vol. 4818, 118-126, 2002. G. P. Eppeldauer, M. Racz, <strong>and</strong> L. M. Hanssen .........78<br />
9. “Spectral irradiance responsivity measurements between 1 µm <strong>and</strong> 5 µm,” SPIE<br />
Proceedings, Vol. 5543, 248-257, 2004. G. P. Eppeldauer, J. P. Rice, J. Zhang, <strong>and</strong> K. R.<br />
Lykke ...........................................................................................................................................87<br />
10. “Development <strong>and</strong> calibration <strong>of</strong> pyroelectric radiometer st<strong>and</strong>ards at <strong>NIST</strong>,” SPIE Proc.<br />
Vol. 6201, pp. 620119-1 to 620119-12, 2006, G. P. Eppeldauer, J. Zeng, <strong>and</strong> L. M.<br />
Hanssen ........................................................................................................................................97<br />
v
11. “Extension <strong>of</strong> the <strong>NIST</strong> infrared spectral responsivity scale to routine monochromatorbased<br />
calibrations using improved-NEP pyroelectric detectors,” NEWRAD-2008<br />
presentation, to be published in the Metrologia, G. P. Eppeldauer, J. Zeng, H. W. Yoon, B.<br />
Wilthan, T. C. Larason, <strong>and</strong> L. M. Hanssen ................................................................................110<br />
12. “Responsivity calibration methods for 365-nm irradiance meters,” also in IEEE<br />
Transactions on Instrumentation <strong>and</strong> Measurement, Vol. 50, No. 2, p. 474-477, April,<br />
2001, T. C. Larason, S. W. Brown, , G. P. Eppeldauer, <strong>and</strong> K. R. Lykke ...................................118<br />
13. “Realization <strong>of</strong> a spectral radiance responsivity scale with a laser-based source <strong>and</strong> Si<br />
radiance meters,” Metrologia, Vol. 37, p. 531-534, 2000, G. P. Eppeldauer, S. W. Brown,<br />
T. C. Larason, M. Racz, <strong>and</strong> K. R. Lykke ...................................................................................123<br />
14. “Uncertainties <strong>of</strong> Spectral Responsivity Measurements,” Proc. <strong>of</strong> the 2nd CIE Expert<br />
Symposium on Measurement Uncertainty, p. 133-138, CIE Central Bureau, 27 Kegelgasse,<br />
A-1030, Vienna, Austria, 2006, G. P. Eppeldauer, G. Sauter, <strong>and</strong> J. L. Gardner ........................134<br />
15. “Realization <strong>of</strong> the <strong>National</strong> <strong>Institute</strong> <strong>of</strong> <strong>St<strong>and</strong>ards</strong> <strong>and</strong> Technology detector-based spectral<br />
irradiance scale,” Applied Optics, Vol. 41, No. 28, 5879-5890, 2002. H. W. Yoon, C. E.<br />
Gibson, <strong>and</strong> P. Y. Barnes. Reproduced with permission <strong>of</strong> the Optical Society <strong>of</strong> America ......140<br />
16. “The <strong>NIST</strong> detector-based luminous intensity scale,” J. Res. Natl. Inst. St<strong>and</strong>. Technol.<br />
Vol. 101, 109-132, 1996. C. L. Cromer, G. Eppeldauer, J. E. Hardis, T. C. Larason, Y.<br />
Ohno, <strong>and</strong> A. C. Parr ....................................................................................................................152<br />
17. “Spectral response based calibration method <strong>of</strong> tristimulus colorimeters,” J. Res. Natl. Inst.<br />
St<strong>and</strong>. Technol. Vol. 103, 615-619, 1998. G. Eppeldauer ...........................................................172<br />
18. “Design <strong>and</strong> characterization <strong>of</strong> a photometer-colorimeter st<strong>and</strong>ard,” Applied Optics, Vol.<br />
43, No. 13, 2621-2631, 2004. G. P. Eppeldauer <strong>and</strong> M. Racz. Reproduced with permission<br />
<strong>of</strong> the Optical Society <strong>of</strong> America ...............................................................................................181<br />
19. “New photometer st<strong>and</strong>ards for low uncertainty illuminance scale realization,” The 26th<br />
Session <strong>of</strong> the CIE, July 4-11, 2007, Beijing, China, Proceedings Volume 1, pp. D2-99 to<br />
D2-102, G. P. Eppeldauer, C. C. Miller, <strong>and</strong> Y. Ohno ................................................................192<br />
20. “Improved accuracy photometric <strong>and</strong> tristimulus-color scales based on spectral irradiance<br />
responsivity,” 25th Session <strong>of</strong> the CIE, Conference Proceedings, Vol. 1, D2-30 to D2-33,<br />
2003. G. P. Eppeldauer, S. W. Brown, C. C. Miller, <strong>and</strong> K. R. Lykke .......................................197<br />
21. “Realization <strong>and</strong> application <strong>of</strong> a detector-based tristimulus color scale at the <strong>National</strong><br />
<strong>Institute</strong> <strong>of</strong> <strong>St<strong>and</strong>ards</strong> <strong>and</strong> Technology, USA,” AIC Colour 05 – 10th Congress <strong>of</strong> the<br />
International Colour Association, Proc. Part I (Editors, J. L. Nieves <strong>and</strong> J. H-Andres),<br />
p.693-696, 2005, G. P. Eppeldauer, S. W. Brown, K. R. Lykke, <strong>and</strong> Y. Ohno ...........................201<br />
vi
22. “Detector-based calibration procedures for tristimulus colorimeter st<strong>and</strong>ards,” CIE Expert<br />
Symposium on Advances in Photometry <strong>and</strong> Colorimetry, Turin, Italy, 2008, G. P.<br />
Eppeldauer, C. C. Miller, <strong>and</strong> Y. Ohno .......................................................................................205<br />
23. “Directional error correction <strong>of</strong> radiometric <strong>and</strong> photometric st<strong>and</strong>ard detectors”,<br />
Metrologia, Vol. 37, p. 489-492, 2000, M. Racz <strong>and</strong> G. Eppeldauer ..........................................211<br />
24. “The realization <strong>and</strong> the dissemination <strong>of</strong> the detector-based kelvin,” in Proc. <strong>of</strong> the 9th<br />
International Symposium on Temperature <strong>and</strong> Thermal Measurements in Industry <strong>and</strong><br />
Science TEMPMEKO 2004, Dubrovnik Croatia, 22-25 June 2004, D. Zvizdic, L. G.<br />
Bermanec, T. Stasic, T. Veliki eds., 59-70, 2004, H. W. Yoon, C.E. Gibson, D. W. Allen,<br />
R. D. Saunders, M. Litorja, S. W. Brown, G. P. Eppeldauer, K. R. Lykke .................................216<br />
25. “Thermodynamic-temperature determinations <strong>of</strong> the Ag <strong>and</strong> Au freezing temperatures<br />
using a detector-based radiation thermometer,” Applied Optics, Vol. 46, No. 15, p. 2870-<br />
2880, 2007, H. W. Yoon, D. W. Allen, C.E. Gibson, M. Litorja, R. D. Saunders, S. W.<br />
Brown, G. P. Eppeldauer, K. R. Lykke. Reproduced with permission <strong>of</strong> the Optical<br />
Society <strong>of</strong> America ......................................................................................................................228<br />
26. “Uncertainty analysis <strong>and</strong> maintenance <strong>of</strong> the <strong>NIST</strong> detector-based temperature scale,<br />
Acta Metrologica Sinica,” Vol. 29, No 4A, October, 2008, H. W. Yoon, C .E. Gibson, G.<br />
P. Eppeldauer, A. W. Smith, S. W. Brown, <strong>and</strong> K. R. Lykke .....................................................239<br />
27. “SSE- <strong>and</strong> Noise-Optimized InGaAs Radiation Thermometer,” Int. J. Thermophysics, Vol.<br />
28, No. 6, p. 2076-2086, Springer, Online: December 2007,” H. W. Yoon, C. E. Gibson,<br />
V. Khromchenko, <strong>and</strong> G. P. Eppeldauer ......................................................................................247<br />
28. “Linearity <strong>of</strong> InGaAs photodiodes,” Poster presentation, 8th NEWRAD Conference, <strong>NIST</strong>,<br />
Gaithersburg, MD, May 20-24, 2002. Metrologia Vol. 40, S154-S158, 2003, H. W. Yoon,<br />
J. J. Butler, T. C. Larason, G. P. Eppeldauer. Reproduced with permission <strong>of</strong> the BIPM. .........263<br />
29. “Short-wave infrared radiometers design <strong>and</strong> characterization,” SPIE Defense & Security<br />
Symposium, Infrared Technology <strong>and</strong> Applications XXXIII, 9-13 April, 2007, Orl<strong>and</strong>o,<br />
FL, Proceedings Volume 6542, Part 1, pp. 65420O-1 to 65420O-10, G. P. Eppeldauer <strong>and</strong><br />
H. W. Yoon ..................................................................................................................................268<br />
30. “Measurement <strong>of</strong> thermal radiation using regular glass optics <strong>and</strong> short-wave infrared<br />
detectors,” Optics Express, Vol. 16, No. 2, pp. 937-949, January 21, 2008, H. W. Yoon<br />
<strong>and</strong> G. P. Eppeldauer ...................................................................................................................278<br />
31. “AC-mode Short-Wavelength IR Radiation Thermometers for Measurement <strong>of</strong> Ambient<br />
Temperatures,” Int. J. Thermophysics, Vol. 29, p. 1041-1051, Springer, 2008, G. P.<br />
Eppeldauer <strong>and</strong> H. W. Yoon ........................................................................................................292<br />
vii
32. “System-level calibration <strong>of</strong> a transfer radiometer used to validate EOS radiance scales,”<br />
Int. J. Remote Sensing, Vol. 24, No. 2, 339-356, 2003. B. C. Johnson, S. W. Brown, G. P.<br />
Eppeldauer, <strong>and</strong> K. R. Lykke. Reprinted by permission <strong>of</strong> the publisher, Taylor & Francis<br />
Ltd. ...............................................................................................................................................303<br />
33. “Spectral Irradiance <strong>and</strong> Radiance Responsivity Calibrations using Uniform Sources<br />
(SIRCUS) facility at <strong>NIST</strong>,” SPIE Symposium, Denver, CO, August 2-6, 2004, Proc. Vol.<br />
5542, p. 363-374, S. W. Brown, G. P. Eppeldauer, J. P. Rice, J. Zhang, <strong>and</strong> K. R. Lykke ........321<br />
34. “Absolute radiometric calibration <strong>of</strong> digital imaging systems,” SPIE Proceedings, Vol.<br />
4306, 13-21, 2001. S. W. Brown, T. C. Larason, C. Habazuit, G. P. Eppeldauer, Y. Ohno,<br />
<strong>and</strong> K. R. Lykke ...........................................................................................................................333<br />
35. “Uniform calibration <strong>of</strong> night vision goggles <strong>and</strong> test sets,” SPIE Europe Security <strong>and</strong><br />
Defence Symposium, Electro-Optical <strong>and</strong> Infrared Systems: Technology <strong>and</strong> Applications<br />
IV, Vol. 6737, p. 67370M-1 to 67370M-16, 2007, G. P. Eppeldauer .........................................342<br />
36. “Traceability <strong>of</strong> <strong>NIST</strong> photocurrent measurements to electrical st<strong>and</strong>ards,” NEWRAD-<br />
2008 presentation, to be published in the J. Res. Natl. Inst. St<strong>and</strong>. Technol., G. P.<br />
Eppeldauer ...................................................................................................................................358<br />
viii
Facility for spectral irradiance <strong>and</strong> radiance responsivity<br />
calibrations using uniform sources<br />
Steven W. Brown, George P. Eppeldauer, <strong>and</strong> Keith R. Lykke<br />
Detectors have historically been calibrated for spectral power responsivity at the <strong>National</strong> <strong>Institute</strong> <strong>of</strong><br />
<strong>St<strong>and</strong>ards</strong> <strong>and</strong> Technology by using a lamp–monochromator system to tune the wavelength <strong>of</strong> the excitation<br />
source. Silicon detectors can be calibrated in the visible spectral region with combined st<strong>and</strong>ard uncertainties<br />
at the 0.1% level. However, uncertainties increase dramatically when measuring an instrument’s<br />
spectral irradiance or radiance responsivity. We describe what we believe to be a new laser-based facility for<br />
spectral irradiance <strong>and</strong> radiance responsivity calibrations using uniform sources (SIRCUS) that was developed<br />
to calibrate instruments directly in irradiance or radiance mode with uncertainties approaching or<br />
exceeding those available for spectral power responsivity calibrations. In SIRCUS, the emission from<br />
high-power, tunable lasers is introduced into an integrating sphere using optical fibers, producing uniform,<br />
quasi-Lambertian, high-radiant-flux sources. Reference st<strong>and</strong>ard irradiance detectors, calibrated directly<br />
against national primary st<strong>and</strong>ards for spectral power responsivity <strong>and</strong> aperture area measurement, are<br />
used to determine the irradiance at a reference plane. Knowing the measurement geometry, the source<br />
radiance can be readily determined as well. The radiometric properties <strong>of</strong> the SIRCUS source coupled with<br />
state-<strong>of</strong>-the-art transfer st<strong>and</strong>ard radiometers whose responsivities are directly traceable to primary national<br />
radiometric scales result in typical combined st<strong>and</strong>ard uncertainties in irradiance <strong>and</strong> radiance<br />
responsivity calibrations <strong>of</strong> less than 0.1%. The details <strong>of</strong> the facility <strong>and</strong> its effect on primary national<br />
radiometric scales are discussed.<br />
OCIS codes: 120.0120, 120.5630, 120.3930.<br />
1. Introduction<br />
Detectors are calibrated for spectral power responsivity<br />
over the spectral range from 350 to 1000 nm<br />
at the <strong>National</strong> <strong>Institute</strong> <strong>of</strong> <strong>St<strong>and</strong>ards</strong> <strong>and</strong> Technology<br />
(<strong>NIST</strong>) on the spectral comparator facility 1 (SCF)<br />
by using a lamp–monochromator system to tune the<br />
wavelength <strong>of</strong> the excitation source <strong>and</strong> silicon working<br />
st<strong>and</strong>ard detectors with responsivities directly<br />
traceable to the <strong>NIST</strong> high-accuracy cryogenic radiometer<br />
(HACR), the primary U.S. national radiometric<br />
st<strong>and</strong>ard for optical power measurement. 2,3<br />
Silicon detectors can be calibrated for optical power<br />
responsivity in the visible spectral region on the SCF<br />
with combined exp<strong>and</strong>ed uncertainties �k � 2� at the<br />
0.2% level. However, quantities <strong>of</strong> interest are <strong>of</strong>ten<br />
the amount <strong>of</strong> light falling on a surface (irradiance) or<br />
the amount <strong>of</strong> light emitted from a source (radiance).<br />
In many cases, spectral information is required as<br />
The authors are with the <strong>National</strong> <strong>Institute</strong> <strong>of</strong> <strong>St<strong>and</strong>ards</strong> <strong>and</strong><br />
Technology, Gaithersburg, Maryl<strong>and</strong> 20899. S. Brown’s e-mail address<br />
is steven.brown@nist.gov.<br />
Received 14 February 2006; accepted 27 April 2006; posted 7<br />
July 2006 (Doc. ID 68064).<br />
8218 APPLIED OPTICS � Vol. 45, No. 32 � 10 November 2006<br />
well. Consequently, the calibration <strong>of</strong> filter-based irradiance<br />
<strong>and</strong> radiance meters is frequently needed.<br />
Because <strong>of</strong> the low flux in the lamp–monochromator<br />
system, instruments cannot be directly calibrated for<br />
irradiance or radiance responsivity on the SCF, <strong>and</strong><br />
more complicated approaches must be taken that <strong>of</strong>ten<br />
increase the exp<strong>and</strong>ed uncertainty �k � 2� in the measurements<br />
to the 0.5% level or greater. 4 In addition,<br />
the low flux associated with lamp–monochromator<br />
excitation sources ��1 �W� limits the effective dynamic<br />
range <strong>of</strong> the system. The out-<strong>of</strong>-b<strong>and</strong> response<br />
<strong>of</strong> filter radiometers can be measured only to approximately<br />
0.001% <strong>of</strong> the peak response while a<br />
dynamic range greater than 10 6 can be required for<br />
high-accuracy applications. In more advanced applications,<br />
spatially nonuniform (e.g., infrared or<br />
ultraviolet) irradiance meters cannot be calibrated<br />
accurately by using the traditional power measurement<br />
mode on the SCF <strong>and</strong> detector-array-based<br />
imaging systems require tests in uniform, monochromatic<br />
fields.<br />
With the development <strong>of</strong> tunable dye lasers in<br />
1970, 5,6 high-power, monochromatic, tunable sources<br />
became available for scientific use. Replacing the<br />
lamp–monochromator source with a tunable laser
source has a number <strong>of</strong> advantages for radiometric<br />
applications, in particular the high-power, very narrow<br />
spectral b<strong>and</strong>width, <strong>and</strong> the extremely low wavelength<br />
uncertainty <strong>of</strong> the laser-based source. Schaefer<br />
<strong>and</strong> Eckerle 7 developed the first laser-based radiometric<br />
facility at <strong>NIST</strong> in 1984. In 1986, independent<br />
irradiance scales maintained by <strong>NIST</strong> based on blackbody<br />
or synchrotron radiation were compared with<br />
scales established on the laser calibration facility<br />
based on silicon photodiode physics traceable to cryogenic<br />
radiometry. 8 In 1990, absolute spectral radiometric<br />
measurements <strong>of</strong> the melting <strong>and</strong> freezing<br />
points <strong>of</strong> a gold blackbody were made at <strong>NIST</strong> using<br />
the laser-based facility. 9 The radiometric temperature<br />
was in agreement with the gold-point value established<br />
in the International Temperature Scale <strong>of</strong> 1990<br />
(ITS-90). In the same time frame, a laser-based radiometric<br />
calibration facility was established at the<br />
<strong>National</strong> Physical Laboratory (NPL) in the United<br />
Kingdom, <strong>and</strong> the radiometric freezing <strong>and</strong> melting<br />
temperatures <strong>of</strong> gold, silver, <strong>and</strong> aluminum blackbodies<br />
were determined with a radiometric uncertainty <strong>of</strong><br />
0.04%. 10 The results were compared with thermodynamic<br />
temperatures established by using constantvolume<br />
gas thermometry. Subsequently, several<br />
primary national radiometric st<strong>and</strong>ards laboratories<br />
have developed or are developing laser-based calibration<br />
facilities, including the NPL in the UK, 11<br />
the Helsinki University <strong>of</strong> Technology (HUT) in<br />
Finl<strong>and</strong>, 12 <strong>and</strong> the Physikalisch-Technische Bundesanstalt<br />
(PTB) in Germany, 13 as well as at <strong>NIST</strong>. In<br />
this work, a new laser-based facility developed at<br />
<strong>NIST</strong> for spectral irradiance <strong>and</strong> radiance responsivity<br />
calibrations using uniform sources (SIRCUS) is<br />
described.<br />
This facility exp<strong>and</strong>s on previous work through the<br />
integration <strong>of</strong> cw, continuously tunable lasers that<br />
cover wide ranges <strong>of</strong> the spectrum as well as with the<br />
development <strong>of</strong> high-performance transfer st<strong>and</strong>ard<br />
detectors. The exp<strong>and</strong>ed continuous spectral coverage<br />
has been made possible by recent <strong>and</strong> continued<br />
advances in laser technology. By exploiting the<br />
developments in laser <strong>and</strong> detector technologies in<br />
SIRCUS <strong>and</strong> calibrating filter radiometers that are<br />
used in radiance temperature (pyrometers) <strong>and</strong> photometry<br />
(photometers), the uncertainty <strong>of</strong> the two<br />
Systeme Internationale (SI) units maintained by the<br />
<strong>NIST</strong> Optical Technology Division, the kelvin <strong>and</strong> the<br />
c<strong>and</strong>ela, can be reduced.<br />
In Section 2 we describe the principal components<br />
<strong>of</strong> the facility <strong>and</strong> give a representative uncertainty<br />
budget for an instrument calibration. In Section 3 we<br />
compare the SCF with SIRCUS. In Section 4 we discuss<br />
the effect on <strong>NIST</strong> scales <strong>and</strong> facilities. In Section<br />
5, we give examples <strong>of</strong> calibrations that illustrate<br />
the flexibility <strong>of</strong> the new facility.<br />
2. Description <strong>of</strong> Spectral Irradiance <strong>and</strong> Radiance<br />
Responsivity Calibrations Using Uniform Sources<br />
In the SIRCUS facility, emission from high-power,<br />
tunable lasers is introduced into an integrating sphere<br />
producing uniform, quasi-Lambertian, highly radiant<br />
flux sources. Reference st<strong>and</strong>ard irradiance detectors,<br />
calibrated directly against national primary st<strong>and</strong>ards<br />
for spectral power responsivity, are used to determine<br />
the irradiance at a reference plane. Knowing the<br />
measurement geometry, the source radiance can be<br />
readily determined as well. Instruments are calibrated<br />
directly in irradiance or radiance mode with<br />
uncertainties approaching or exceeding those available<br />
for spectral power responsivity calibrations.<br />
There are three components to the SIRCUS facility:<br />
an ultraviolet, visible, <strong>and</strong> near-infrared (UV–Vis–<br />
NIR) SIRCUS; an infrared (IR) SIRCUS; <strong>and</strong> a highaccuracy<br />
electrical substitution cryogenic radiometer<br />
system called the primary optical watt radiometer<br />
(POWR). 14 POWR is a primary st<strong>and</strong>ard facility for the<br />
measurement <strong>of</strong> optical power. The UV–Vis–NIR facility<br />
currently operates over the spectral region from<br />
210 to 960 nm; extensions to the short-wave IR, out to<br />
2.5 �m, are planned. The IR SIRCUS facility has a<br />
spectral coverage from 700 to 5.3 �m using tunable<br />
optical parametric oscillator (OPO) systems <strong>and</strong> coverage<br />
to 11 �m using discrete laser sources. Lasers<br />
from both SIRCUS facilities can be introduced into<br />
the POWR radiometer for detector responsivity measurements.<br />
Typically, reference instruments used on<br />
SIRCUS are calibrated against POWR. Occasionally,<br />
a second, working-st<strong>and</strong>ard absolute cryogenic<br />
radiometer (ACR) is used. 15 This system is smaller<br />
<strong>and</strong> easier to operate than POWR. It is located on a<br />
portable table <strong>and</strong> can be readily moved between facilities.<br />
Intercomparisons using transfer st<strong>and</strong>ard detectors<br />
establish the equivalence between the two<br />
cryogenic radiometers.<br />
The spectral coverage available with the tunable<br />
lasers ultimately defines the spectral range <strong>of</strong> the<br />
SIRCUS facility while the quality <strong>of</strong> the reference<br />
st<strong>and</strong>ard detectors <strong>and</strong> their radiometric uncertainties<br />
ultimately determine the uncertainty achievable<br />
on SIRCUS. In this work we focus on the UV–Vis–<br />
NIR facility <strong>and</strong> limit the discussion to the spectral<br />
range from 210 to 960 nm where silicon reference<br />
detectors are available. A general description <strong>of</strong> the<br />
SIRCUS facility is given in Subsection 2.A. Sources<br />
<strong>and</strong> reference detectors are discussed in Subsections<br />
2.B <strong>and</strong> 2.C. Subsection 2.D outlines the calibration<br />
method. The uncertainties achievable for radiance<br />
<strong>and</strong> irradiance responsivity calibrations are discussed<br />
in Subsection 2.E.<br />
It should be noted that our identification <strong>of</strong> commercial<br />
equipment is for information purposes only.<br />
It does not imply recommendation or endorsement by<br />
the <strong>National</strong> <strong>Institute</strong> <strong>of</strong> <strong>St<strong>and</strong>ards</strong> <strong>and</strong> Technology,<br />
nor does it imply that the equipment identified is<br />
necessarily the best available for the purpose.<br />
A. Setup<br />
The SIRCUS facility is shown schematically in Fig. 1.<br />
The output <strong>of</strong> a high-power, tunable laser is first<br />
directed through an intensity stabilizer that controls<br />
the relative optical power in the beam to within 0.1%<br />
<strong>of</strong> the set point. A portion <strong>of</strong> the laser beam is sent<br />
into a traveling Michelson interferometer that mea-<br />
10 November 2006 � Vol. 45, No. 32 � APPLIED OPTICS 8219
Fig. 1. (Color online) Schematic diagram <strong>of</strong> the SIRCUS facility.<br />
sures the wavelength <strong>of</strong> the radiation to within<br />
0.001 nm. A beam splitter sends another portion <strong>of</strong><br />
the laser beam into a Fabry–Perot interferometer to<br />
measure the b<strong>and</strong>width <strong>and</strong> mode stability <strong>of</strong> the<br />
laser. The laser radiation is typically introduced into<br />
an integrating sphere, <strong>of</strong>ten using an optical fiber.<br />
Different size spheres are used depending on the application.<br />
Occasionally, a collimator coupled to the<br />
sphere is used as a calibration source. Speckle in the<br />
image from the source, originating from interference<br />
due to the coherent nature <strong>of</strong> the laser radiation, is<br />
effectively removed either by rastering the beam inside<br />
the sphere with a galvanometer-driven mirror 9<br />
or by placing a short length <strong>of</strong> optical fiber in an<br />
ultrasonic bath. 11,16 <strong>Note</strong> that the speckle is still<br />
present but is altered on a much shorter time constant<br />
than the observing radiometers, effectively averaging<br />
out the distribution. A monitor photodiode is<br />
located on the sphere to correct for any radiant flux<br />
changes in the sphere output between measurements<br />
with the reference instrument <strong>and</strong> the device under<br />
test. The sources <strong>and</strong> detectors are located inside<br />
a light-tight box (1.4 m wide, 1.2 m tall, 3.2 m long)<br />
that has been covered on the inside with Ultrapol, a<br />
material with excellent light-absorbing properties:<br />
The measured reflectance is <strong>of</strong> the order <strong>of</strong> 0.1%–<br />
0.3% from 300 nm to 2.5 �m. Two baffles are typically<br />
installed between the source <strong>and</strong> the detectors<br />
to minimize the effects <strong>of</strong> stray radiation on the measurement.<br />
The calibrations are performed by direct substitution<br />
against primary st<strong>and</strong>ard reference irradiance<br />
meters (see Subsection 2.C). For both irradiance <strong>and</strong><br />
radiance responsivity calibrations, the distance between<br />
the source aperture <strong>and</strong> the defining aperture<br />
on the reference st<strong>and</strong>ard detector is required. An<br />
electronic ruler with a resolution <strong>of</strong> 5 �m measures<br />
the distance between the source <strong>and</strong> the detectors.<br />
B. Sources<br />
In this subsection we go into detail on the laser systems<br />
as well as the different calibration sources,<br />
8220 APPLIED OPTICS � Vol. 45, No. 32 � 10 November 2006<br />
namely, the integrating spheres <strong>and</strong> collimators used<br />
on SIRCUS.<br />
1. Lasers<br />
A number <strong>of</strong> different lasers are used to cover the<br />
spectral range from about 210 to 960 nm (see Fig. 2).<br />
Continuous tunability is provided by dye lasers<br />
<strong>and</strong> Ti:sapphire lasers that are pumped by either<br />
an argon-ion laser (25 W, all lines visible; 7 W, all<br />
lines UV) or a frequency-doubled Nd:vanadate laser<br />
�10 W, 532 nm�. A number <strong>of</strong> discrete wavelengths<br />
are provided by the pump lasers themselves.<br />
Dye laser use has declined in recent years because <strong>of</strong><br />
the development <strong>of</strong> the solid-state Ti:sapphire laser,<br />
but the dye laser is still the easiest method for producing<br />
high-power, tunable, cw light in the visible. 17,18<br />
Dye lasers at SIRCUS cover the spectral region from<br />
415 to 700 nm; the dyes used include Stilbene 3<br />
�415–475 nm�, Coumarin 480 �470–520 nm�, Coumarin<br />
521 �505–565 nm�, 19 Rhodamine 6G �R6G; 550–<br />
620 nm�, <strong>and</strong> DCM �610–700 nm�. A separate laser is<br />
used for each dye so that the full tuning range can be<br />
rapidly covered, <strong>and</strong> no dye change or optical reconfiguration<br />
is required. The longer-wavelength dye lasers,<br />
with DCM <strong>and</strong> R6G dyes, are ring lasers. They<br />
are located on a table separate from the other three<br />
dye lasers <strong>and</strong> are pumped by the 532 nm output<br />
from a frequency-doubled Nd:vanadate laser. The<br />
Coumarin 521, Coumarin 480, <strong>and</strong> Stilbene 3 lasers<br />
are pumped with the output <strong>of</strong> an argon-ion laser.<br />
Separate optical fibers, located on each laser table,<br />
couple the radiation from the lasers into the integrating<br />
spheres.<br />
Ti:sapphire lasers cover the spectral range from 680<br />
to 1050 nm. 20 A frequency doubling <strong>of</strong> Ti:sapphire<br />
lasers enables us to tune from 350 to 500 nm. Two<br />
different types <strong>of</strong> frequency doubling are available:<br />
The first approach uses an external power buildup<br />
cavity that requires a frequency-stabilized, singlemode<br />
pump laser. 21 The second is a home-built<br />
intracavity-doubled Ti:sapphire laser that requires<br />
no frequency stabilization. This system uses a simple<br />
Fig. 2. (Color online) Lasers, output power, <strong>and</strong> spectral coverage<br />
<strong>of</strong> UV–Vis–IR SIRCUS.
z-cavity Ti:sapphire laser. When doubling is required,<br />
the output coupler is removed <strong>and</strong> two mirrors are<br />
used in its place: a fold mirror (with a5cmfocal<br />
length) <strong>and</strong> a flat mirror. The doubling crystal, typically<br />
lithium barium oxide (LBO), is located near the<br />
focus <strong>of</strong> the curved mirror. 22 One <strong>of</strong> the attractive<br />
features <strong>of</strong> the intracavity-doubling design is that the<br />
system lases without the doubling crystal in place—<br />
ensuring the proper cavity alignment prior to installation<br />
<strong>of</strong> the doubling crystal. It is also less sensitive<br />
to acoustic noise <strong>and</strong> small frequency fluctuations in<br />
the laser than the external-cavity system.<br />
Over 300 mW <strong>of</strong> optical power is available from<br />
the dye lasers <strong>and</strong> the Ti:sapphire laser (with optical<br />
powers <strong>of</strong> 1 W or greater over much <strong>of</strong> the spectral<br />
range). The power available from the cw, frequencydoubled<br />
radiation is typically in the range from 100 to<br />
200 mW. A variety <strong>of</strong> st<strong>and</strong>ing-wave <strong>and</strong> ring lasers<br />
are currently used on SIRCUS. With the exception <strong>of</strong><br />
the external buildup cavity approach to frequencydoubled<br />
light, simple, inexpensive st<strong>and</strong>ing-wave dye<br />
lasers <strong>and</strong> Ti:sapphire lasers equipped with an intracavity,<br />
uncoated etalon to ensure narrowb<strong>and</strong> operation<br />
are sufficient for all foreseeable radiometric<br />
applications.<br />
Quasi-cw, mode-locked laser systems have been<br />
shown in the past to be equivalent to cw systems for<br />
radiometric calibrations <strong>of</strong> silicon radiometers, with<br />
no additional uncertainties in the calibration arising<br />
from the quasi-cw nature <strong>of</strong> the radiation. 23,24 A commercial<br />
mode-locked system was recently installed in<br />
the facility. The system includes an OPO system for<br />
generation <strong>of</strong> visible <strong>and</strong> infrared light, <strong>and</strong> a frequency<br />
doubler, tripler, <strong>and</strong> quadrupler system for<br />
generation <strong>of</strong> visible <strong>and</strong> UV radiation. These nonlinear<br />
optical systems take advantage <strong>of</strong> the pulsed nature<br />
<strong>of</strong> the radiation: It is significantly easier to<br />
generate sum <strong>and</strong> difference frequency radiation using<br />
a mode-locked laser rather than a true cw laser<br />
because <strong>of</strong> the high peak power <strong>of</strong> the mode-locked<br />
source. This system generates almost continuously<br />
tunable radiation from 210 to 3 �m. One useful feature<br />
<strong>of</strong> the quasi-cw system is that the b<strong>and</strong>width <strong>of</strong><br />
the radiation is considerably broader than radiation<br />
from the cw systems. This may help to alleviate the<br />
measurement problems associated with interference<br />
fringes (discussed in Section 6).<br />
Computer-controlled actuators rotate the angle <strong>of</strong><br />
the birefringent tuner in the dye <strong>and</strong> Ti:sapphire<br />
lasers. The minimum step size is determined by the<br />
free spectral range <strong>of</strong> the etalon in the lasers. For a<br />
1 mm thick etalon, the thickness <strong>of</strong> the etalons used<br />
on SIRCUS, the minimum wavelength step using the<br />
birefringent tuner is 0.16 nm at 600 nm. For finer<br />
spectral resolution, the etalon angle is changed as<br />
well. Controlling both the birefringent tuner <strong>and</strong> the<br />
etalon angle, wavelength steps <strong>of</strong> 0.01 nm or less can<br />
be readily achieved.<br />
2. Integrating Spheres<br />
Different integrating spheres are used, depending on<br />
the radiometric calibration. Small-diameter integrat-<br />
ing spheres—with diameters ranging from 2.54 to<br />
5.08 cm—equipped with precision apertures with diameters<br />
ranging from 3 to 8 mm are typically used for<br />
irradiance responsivity calibrations. <strong>Note</strong> that the<br />
areas <strong>of</strong> the exit apertures are normally measured at<br />
the <strong>NIST</strong> facility for aperture area measurement. 25<br />
Larger-diameter spheres—30 cm in diameter—with<br />
5 to 10 cm diameter exit ports are used for radiance<br />
measurements. The spheres are made <strong>of</strong> a sintered<br />
polytetrafluoroethylene-based (PTFE-based) coating<br />
that has high diffuse reflectance from approximately<br />
250 nm to 2.5 �m. 26 Typical irradiance levels at 1 m<br />
using a 2.54 cm diameter integrating sphere with a<br />
5 mm diameter aperture range from approximately1to10�W�cm<br />
2 . Radiance levels between 1 <strong>and</strong><br />
5mW�cm 2 �sr are st<strong>and</strong>ard for a 30 cm diameter<br />
sphere with a 7.5 cm diameter output port. A monitor<br />
detector is mounted on the sphere wall to monitor<br />
<strong>and</strong> correct for fluctuations in the source radiant flux<br />
during a calibration. The irradiance is uniform to<br />
within 0.1% over several centimeters at a 1 m separation<br />
from the integrating sphere. Similarly, the radiance<br />
from the integrating sphere is uniform to<br />
within 0.1% over the central 90% <strong>of</strong> the exit aperture.<br />
3. Collimator Sources<br />
In earlier work at the NPL, collimated sources made<br />
from spheres with lenses were used in the calibration<br />
<strong>of</strong> a number <strong>of</strong> filter radiometers <strong>and</strong> transmission <strong>of</strong><br />
lenses. 11 In SIRCUS, <strong>of</strong>f-axis parabolic mirrors are<br />
used to prepare the quasi-collimated source. Mirrors<br />
have the advantage over lenses <strong>of</strong> achromaticity from<br />
the UV to the IR. In addition to the collimators in<br />
SIRCUS, both on- <strong>and</strong> <strong>of</strong>f-axis collimator sources<br />
have been developed in collaboration with NASA 27<br />
<strong>and</strong> the U.S. Geological Survey 28 (USGS) for the<br />
characterization <strong>and</strong> calibration <strong>of</strong> large-aperturearea<br />
telescopes. Nonuniformities <strong>of</strong> 1% or less are<br />
achieved over a 5 cm diameter area with an irradiance<br />
up to 2 orders <strong>of</strong> magnitude greater than with<br />
the integrating sphere alone.<br />
C. Detectors<br />
The uncertainty in the spectral irradiance responsivity<br />
<strong>of</strong> reference st<strong>and</strong>ard detectors is the largest component<br />
in the SIRCUS calibration uncertainty budget.<br />
Ultimately, the quality <strong>and</strong> characteristics <strong>of</strong> the reference<br />
st<strong>and</strong>ard detectors determine the uncertainty<br />
achievable on SIRCUS. Silicon tunnel-trap detectors,<br />
configured to operate in both radiant power <strong>and</strong> irradiance<br />
measurement modes, are the highest-level reference<br />
st<strong>and</strong>ards used in the SIRCUS facility. They<br />
cover the spectral range from 300 to 960 nm. Reflectance<br />
traps with specially designed Si detectors that<br />
are stable under UV exposure are used for calibrations<br />
in the 210 to 350 nm spectral region.<br />
1. Reference St<strong>and</strong>ard Silicon Tunnel-Trap Detector<br />
Trap detectors consist <strong>of</strong> multiple silicon photodiodes<br />
oriented such that the incident radiation reflected<br />
from one detector impinges on a second detector. 29<br />
Hamamatsu model S1337 (Ref. 30) photodiodes are<br />
10 November 2006 � Vol. 45, No. 32 � APPLIED OPTICS 8221
Fig. 3. Beam propagation through the six-element transmission<br />
tunnel-trap detector. Detectors 3 <strong>and</strong> 6 have been removed from<br />
the diagram.<br />
typically used in trap detectors to utilize the physical<br />
model <strong>of</strong> internal quantum efficiency (IQE) for spectral<br />
responsivity extrapolation <strong>and</strong> interpolation. 3 The<br />
IQE is the ratio <strong>of</strong> the number <strong>of</strong> collected electrons to<br />
the number <strong>of</strong> photons absorbed by the detector after<br />
the front surface reflection loss; the S1337 photodiodes<br />
are chosen because <strong>of</strong> their extremely high IQE (close<br />
to 1). A detector’s external quantum efficiency (EQE) is<br />
equal to the IQE times the term 1 � reflectance. In<br />
trap detectors, the reflection loss is minimized by having<br />
incident reflected radiation impinge on the next<br />
photodiode in succession, leading to the absorption <strong>of</strong><br />
almost all the incident radiation. Measuring the sum<br />
<strong>of</strong> the photocurrents from the photodiodes that make<br />
up the trap detector, the EQE can be very close to<br />
unity. This type <strong>of</strong> detector is frequently called a<br />
quantum-flat detector.<br />
The schematic <strong>of</strong> the transmission tunnel-trap<br />
detectors used on SIRCUS, with the input aperture<br />
included, is shown in Fig. 3. 31 By choosing different<br />
size photodiodes, the aperture area <strong>and</strong> the field <strong>of</strong><br />
view (FOV) could be maximized. Two 10 mm �<br />
10 mm <strong>and</strong> four 18 mm � 18 mm silicon photodiodes,<br />
equivalent to the Hamamatsu S1337 model photodiodes,<br />
were packaged in a triangular-shaped,<br />
light-trapping arrangement. The photodiodes were<br />
selected for large <strong>and</strong> equal shunt resistance, an<br />
important consideration for the signal current-tovoltage<br />
conversion. 31 The beam propagates in the<br />
tunnel-trap detector from the first photodiode (behind<br />
the aperture) to the last (sixth) photodiode. Photodiodes<br />
3 <strong>and</strong> 6 are not shown for better illustration.<br />
The small amount <strong>of</strong> radiation that exits the back <strong>of</strong><br />
the trap detector can be utilized for alignment or can<br />
be measured for detector transmittance measurements<br />
in spectral responsivity determination. A conical<br />
light trap attached to the trap detector output<br />
absorbs the transmitted radiation <strong>and</strong> minimizes the<br />
effect <strong>of</strong> ambient stray light for low-level optical radiation<br />
measurements. The photodiodes in the trap<br />
detectors are not temperature controlled. The trap<br />
detectors have been characterized for both electri-<br />
8222 APPLIED OPTICS � Vol. 45, No. 32 � 10 November 2006<br />
cal <strong>and</strong> optical performance. In Subsection 2.D, the<br />
trap detector’s response linearity, spatial uniformity,<br />
<strong>and</strong> angular responsivity are discussed along with<br />
the spectral power responsivity calibration against a<br />
high-accuracy cryogenic radiometer.<br />
2. Monitor Detectors<br />
Silicon detectors mounted on the integrating sphere<br />
sources monitor the source radiance <strong>and</strong> correct for<br />
any small changes that occur during a calibration<br />
caused by fluctuations in the laser power input into<br />
the integrating spheres. To avoid interference fringes<br />
in the monitor signal (caused by residual coherence in<br />
the output radiation <strong>of</strong> a sphere source), the window<br />
<strong>of</strong> the silicon monitor detector is removed, or a diffuser<br />
is placed between the silicon detector <strong>and</strong> the<br />
integrating sphere. Both the reference st<strong>and</strong>ard trap<br />
detectors <strong>and</strong> the monitor detectors operate in dc<br />
measurement mode. 32<br />
D. Method <strong>of</strong> Calibration<br />
A calibration relates the measured quantity from a<br />
radiometer, usually current or voltage, to the radiometric<br />
quantity being measured, e.g., radiance or<br />
irradiance, through the instrument’s responsivity. Determination<br />
<strong>of</strong> an instrument’s responsivity <strong>and</strong> an<br />
evaluation <strong>of</strong> the associated uncertainties are required<br />
in a calibration. The substitution method is used for<br />
calibrations in SIRCUS. <strong>NIST</strong> reference st<strong>and</strong>ard irradiance<br />
meters determine the irradiance at a reference<br />
plane. From the irradiance at the reference plane,<br />
which is usually the plane <strong>of</strong> the detector aperture, the<br />
radiance <strong>of</strong> a source can be determined by knowing the<br />
distance between the detector <strong>and</strong> source apertures, as<br />
well as the area <strong>of</strong> the source aperture. The instrument<br />
being calibrated, or device under test (DUT), is then<br />
placed in front <strong>of</strong> the source <strong>and</strong> its signal is recorded.<br />
The laser is blocked <strong>and</strong> the dark signal is recorded<br />
prior to each measurement. The responsivity (at the<br />
excitation wavelength) is the instrument’s net output<br />
signal (with the dark signal subtracted from the light<br />
signal) divided by the radiometric quantity to be measured.<br />
The characterization <strong>of</strong> an instrument <strong>and</strong> an underst<strong>and</strong>ing<br />
<strong>and</strong> evaluation <strong>of</strong> all meaningful sources<br />
<strong>of</strong> uncertainty are crucial for a proper calibration. A<br />
calibration without an associated uncertainty table is<br />
<strong>of</strong> limited use. The evaluation <strong>and</strong> expression <strong>of</strong> uncertainty<br />
is generally difficult <strong>and</strong> time consuming; it<br />
is not unusual to have incomplete or inaccurate information<br />
in an uncertainty table. Determining how<br />
best to express a particular uncertainty component<br />
can be confusing. There are a variety <strong>of</strong> useful references<br />
that provide definitions <strong>and</strong> recommendations<br />
for describing <strong>and</strong> establishing the uncertainties encountered<br />
when calibrating a radiometer. 33<br />
A measurement equation is a mathematical expression<br />
describing the relationship between the<br />
measured source-related radiometric quantity <strong>and</strong><br />
the instrument responsivity. The simplified measurement<br />
equation for an irradiance responsivity<br />
calibration is
RDUT � iDUT Rtrap �<br />
itrap iDUT strap A, (1)<br />
itrap where R DUT is the irradiance responsivity <strong>of</strong> the device<br />
under test, R trap is the irradiance responsivity <strong>of</strong><br />
the trap, s trap is the power spectral responsivity <strong>of</strong> the<br />
trap, A is the area <strong>of</strong> the aperture on the trap, <strong>and</strong> i<br />
is the photocurrent. The photocurrent is converted to<br />
voltage in a transimpedence amplifier <strong>and</strong> then measured<br />
with a multimeter.<br />
Equation (1) assumes that the reference planes <strong>of</strong><br />
the DUT <strong>and</strong> trap are in the same plane, i.e., that the<br />
defining apertures are located the same distance<br />
from the point source. In many cases, they are located<br />
in different planes. In Subsection 2.D.4, it is shown<br />
that, for the aperture sizes <strong>and</strong> operating distances<br />
used on SIRCUS, the sources can be treated as point<br />
sources. For a point-source geometry,<br />
2 2<br />
I��� � E1���d1 � E2���d2 , (2)<br />
where I��� is the radiant intensity <strong>of</strong> the source; E1 is<br />
the irradiance at reference plane 1, located a distance<br />
d1 from the source; <strong>and</strong> E2 is the irradiance at reference<br />
plane 2, located a distance d2 from the source. In<br />
many cases, the reference plane <strong>of</strong> the DUT is not<br />
known <strong>and</strong> must be determined radiometrically.<br />
There are two types <strong>of</strong> uncertainty components, designated<br />
Type A <strong>and</strong> Type B. Type A uncertainties<br />
are evaluated using statistical methods, <strong>and</strong> Type B<br />
uncertainties are evaluated using models or other external<br />
information. The term st<strong>and</strong>ard uncertainty<br />
refers to an estimated st<strong>and</strong>ard deviation. Assuming<br />
each uncertainty component is independent from the<br />
others (the components are uncorrelated), the combined<br />
st<strong>and</strong>ard uncertainty is the root sum square <strong>of</strong><br />
the individual uncertainty components. Often, the different<br />
variables are not completely independent from<br />
one another, <strong>and</strong> correlations between these variables<br />
need to be taken into account. 34,35<br />
The exp<strong>and</strong>ed uncertainty is the product <strong>of</strong> the combined<br />
st<strong>and</strong>ard uncertainty <strong>and</strong> a coverage factor k,<br />
where the value <strong>of</strong> k is chosen based on the desired<br />
level <strong>of</strong> confidence. Typically the exp<strong>and</strong>ed uncertainty<br />
is reported with k � 2, corresponding to a confidence<br />
level <strong>of</strong> 95%. A confidence level <strong>of</strong> 95% means that<br />
there isa1in20chance that a measurement will fall<br />
outside the interval. A coverage factor k � 3 corresponds<br />
to a confidence level <strong>of</strong> 99%, meaning there is<br />
a1% chance that a measurement will fall outside the<br />
stated interval. In reporting the uncertainty for a<br />
measurement, the components <strong>of</strong> st<strong>and</strong>ard uncertainty<br />
are listed <strong>and</strong> their designation stated (A or B).<br />
The uncertainty table should also identify <strong>and</strong> distinguish<br />
r<strong>and</strong>om components from systematic components<br />
that are common to all wavelengths. This<br />
information is important when combining the spectral<br />
measurements, for example in measuring the<br />
b<strong>and</strong>-integrated response <strong>of</strong> filtered detectors.<br />
The dominant uncertainties <strong>of</strong> the spectral irradiance<br />
responsivity scale originate from systematic errors<br />
in the absolute scale transfer from the cryogenic<br />
radiometer. Temperature variations within the facil-<br />
Table 1. SIRCUS Uncertainty for an Irradiance Responsivity Calibration<br />
Uncertainty Component<br />
Relative St<strong>and</strong>ard<br />
Uncertainty<br />
[%]<br />
Type A Type B<br />
Reference detector responsivity<br />
Radiant power responsivity<br />
(400 to 920 nm)<br />
0.025<br />
Aperture area 0.004<br />
Response uniformity 0.005<br />
Cosine dependence 0.01<br />
Polarization 0.00<br />
Linearity 0.00<br />
Temperature<br />
Source characteristics<br />
0.003<br />
Radiant flux 0.005<br />
Wavelength (�0.01 nm) 0.005<br />
Irradiance uniformity 0.005<br />
Determination <strong>of</strong> the<br />
reference plane<br />
0.01<br />
I–V Gain 0.01<br />
Voltmeter reading 0.005<br />
Irradiance 0.032<br />
Transfer to device under test<br />
(estimated)<br />
0.030<br />
Combined st<strong>and</strong>ard<br />
uncertainty (k � 1) (%)<br />
0.044<br />
ity, while small, may also contribute to the overall<br />
uncertainty in certain spectral regions. The radiometric<br />
stability <strong>of</strong> the source (<strong>and</strong> monitor detector) <strong>and</strong><br />
the irradiance uniformity at a reference plane contribute<br />
to the overall uncertainty in the measurement.<br />
Additional uncertainties from the radiometric characteristics<br />
<strong>of</strong> the DUT need to be quantified to establish<br />
the uncertainty in the calibration (<strong>and</strong> subsequent<br />
measurements <strong>of</strong> a source). Typically, the instrument’s<br />
response linearity, temperature dependence, polarization<br />
dependence, <strong>and</strong> out-<strong>of</strong>-FOV blocking are<br />
measured. The current-to-voltage converter <strong>and</strong> the<br />
multimeter used to measure the signal need to be characterized<br />
<strong>and</strong> their contribution to the overall uncertainty<br />
established. Finally, both short-term stability<br />
(repeatability) <strong>and</strong> long-term stability (to monitor<br />
degradation in time) should be considered.<br />
In the following subsections, we discuss the uncertainty<br />
components in a typical irradiance responsivity<br />
calibration. The components are combined into an<br />
uncertainty budget in Table 1. These are representative<br />
numbers only. The uncertainty in an irradiance<br />
responsivity calibration may differ slightly, depending<br />
on the details <strong>of</strong> the calibration <strong>and</strong> the DUT.<br />
1. Detector-Based Spectral Irradiance Responsivity<br />
Scale<br />
The reference st<strong>and</strong>ard tunnel-trap detectors hold the<br />
spectral irradiance responsivity scale on SIRCUS. As<br />
no light is reflected back from the trap detector to the<br />
aperture, the aperture area <strong>and</strong> the trap detector spectral<br />
radiant power responsivity can be determined sep-<br />
10 November 2006 � Vol. 45, No. 32 � APPLIED OPTICS 8223
Fig. 4. Silicon tunnel-trap detector EQE versus wavelength.<br />
arately. The spectral irradiance responsivity <strong>of</strong> the<br />
trap detector is calculated as the product <strong>of</strong> the aperture<br />
area <strong>and</strong> the spectral radiant power responsivity<br />
<strong>of</strong> the trap detector. The spectral radiant power responsivity<br />
<strong>of</strong> the tunnel trap was measured by direct<br />
substitution against the working st<strong>and</strong>ard ACR (Section<br />
2). The spectral power responsivity (in A�W) is<br />
proportional to the EQE <strong>and</strong> the wavelength. The proportionality<br />
factor is e�hc, where e is the elementary<br />
electron charge, c is the speed <strong>of</strong> light in vacuum, <strong>and</strong><br />
h is the Planck constant. The measured EQE <strong>of</strong> one <strong>of</strong><br />
the working st<strong>and</strong>ard trap detectors (T-01) versus the<br />
wavelength (82 laser wavelengths) is shown in Fig. 4.<br />
The EQE is equal to 0.996 to within 0.1% between 600<br />
<strong>and</strong> 920 nm. The relative combined st<strong>and</strong>ard uncertainties<br />
in the detector responsivity are 0.05% between<br />
400 <strong>and</strong> 960 nm <strong>and</strong> 0.1% between 350 <strong>and</strong><br />
400 nm. A fit to the data points, illustrated in Fig. 4,<br />
shows that the reproducibility error <strong>of</strong> the responsivity<br />
determinations is very small, especially between<br />
500 <strong>and</strong> 900 nm. That is, the uncertainty in the fit to<br />
the EQE is smaller than the uncertainty determination<br />
at each wavelength. Additionally, there are correlations<br />
among these absolute points. 35 Neither<br />
have been considered or included in the uncertainty<br />
budget listed in Table 1.<br />
The trap detector was then equipped with a precision<br />
circular aperture whose area was measured on an<br />
interferometrically controlled x–y translation stage<br />
with a video microscope by using edge detection. 25 The<br />
relative st<strong>and</strong>ard uncertainty <strong>of</strong> the area determination<br />
for the 5 mm diameter aperture <strong>of</strong> the trap detector<br />
was 0.004%. 25<br />
The spectral radiant power responsivity <strong>of</strong> the<br />
reference st<strong>and</strong>ard trap detectors was measured in<br />
underfilled (total beam power measurement) mode. In<br />
the irradiance mode, the incident flux overfills the aperture.<br />
The radiant flux falls on different regions <strong>of</strong> the<br />
trap detector for the two measurement modes. While<br />
8224 APPLIED OPTICS � Vol. 45, No. 32 � 10 November 2006<br />
Fig. 5. Angular responsivity <strong>of</strong> the tunnel-trap detector.<br />
typically small for silicon trap detectors, the spatial<br />
nonuniformity in responsivity <strong>of</strong> the trap detector can<br />
produce the ultimate limiting uncertainty component<br />
for the reference irradiance responsivity scale when<br />
the primary st<strong>and</strong>ard, in our case the ACR, measures<br />
radiant power. Dust is the primary cause <strong>of</strong> nonuniformity<br />
in the responsivity because the reference trap<br />
detectors are nonwindowed devices. To propagate the<br />
low uncertainties in power responsivity to irradiance<br />
responsivity, the detector’s spatial response uniformity,<br />
as well as the area <strong>of</strong> the defining aperture, must<br />
be measured. The response <strong>of</strong> a reference trap detector<br />
was recently found to be uniform to within 0.01% over<br />
the entire area <strong>of</strong> the entrance window (with the<br />
aperture removed).<br />
When measuring a point source, the expected responsivity<br />
in irradiance mode is a cosine dependence<br />
on the angle <strong>of</strong> rotation <strong>of</strong> the detector from<br />
the plane normal to the incident flux. Deviations<br />
from the expected response can give rise to errors<br />
when measuring extended sources. Figure 5 shows<br />
the normalized angular responsivity <strong>of</strong> the tunneltrap<br />
detector when it is equipped with a circular<br />
aperture <strong>of</strong> 5 mm in diameter. The responsivity deviation<br />
from the cosine function is less than 0.02%<br />
within a 6° FOV. For an 8° FOV, the deviation is<br />
approximately 0.05%. This feature makes it possible<br />
to use these trap detectors as transfer st<strong>and</strong>ards for<br />
monochromator-based facilities where the beam convergence<br />
angle is smaller than the unvignetted FOV<br />
<strong>of</strong> the tunnel-trap detector.<br />
2. Radiometric Characteristics <strong>of</strong> the Trap Detector<br />
The radiation from an integrating sphere is typically<br />
unpolarized. 36 If polarized light is required for a calibration,<br />
a collimator can be used with a polarizer in<br />
the beam.<br />
Linearity is easily checked by changing the laser<br />
power with the intensity stabilizer at the input to the<br />
fiber. The ratio <strong>of</strong> the signal <strong>of</strong> the DUT or reference<br />
trap to the monitor signal as a function <strong>of</strong> power should
Fig. 6. Detector response linearity. The signal-to-monitor ratio as<br />
a function <strong>of</strong> the signal (related to incident optical power).<br />
be a straight horizontal line. Figure 6 is a representative<br />
plot <strong>of</strong> a silicon detector’s response linearity over<br />
four decades. Some silicon detectors have been measured<br />
to be linear over 14 decades. 37,38<br />
The temperature in the SIRCUS facility was<br />
maintained at a nominal temperature <strong>of</strong> 22 °C. Typical<br />
variations were <strong>of</strong> the order <strong>of</strong> 0.5 °C or less,<br />
though in extreme cases, variations <strong>of</strong> the order <strong>of</strong><br />
�2 °C were observed. The temperature, pressure,<br />
<strong>and</strong> humidity inside the light-tight enclosure can be<br />
monitored <strong>and</strong> corrections can be made if necessary.<br />
The temperature coefficient <strong>of</strong> Hamamatsu S1337<br />
photodiodes (the type <strong>of</strong> silicon photodiode used in the<br />
trap detectors) has been measured. 1 It was found<br />
that there was negligible dependence below 950 nm<br />
��0.01%�K� but that the dependence rose quickly to<br />
�0.2%�K by 1000 nm. 39 A similar dependence should<br />
be seen in trap detectors using these diodes.<br />
3. Source Characteristics<br />
The radiant power <strong>and</strong> wavelength stability are two<br />
<strong>of</strong> the primary uncertainty components. A laser intensity<br />
stabilizer keeps the laser power level constant<br />
to within 0.1%. The lasers used as excitation sources<br />
are equipped with etalons to reduce the wavelength<br />
uncertainty from mode hopping. The wavelength uncertainty<br />
is <strong>of</strong> the order <strong>of</strong> 10 �3 nm with a typical<br />
b<strong>and</strong>width <strong>of</strong> the order <strong>of</strong> 10 �3 nm. The wavelength<br />
uncertainty is dominated by the dependence <strong>of</strong> the<br />
index <strong>of</strong> refraction <strong>of</strong> air on temperature, humidity,<br />
<strong>and</strong> pressure. The wavemeter corrects for the temperature<br />
<strong>and</strong> pressure dependence <strong>and</strong> can be programmed<br />
to correct for the humidity.<br />
The sequence for measurements <strong>of</strong> a DUT is to first<br />
measure the trap <strong>and</strong> monitor signal, then move the<br />
stage so that the DUT versus the monitor signal is<br />
measured, then move back to the trap measurement.<br />
If any change is observed in the trap-to-monitor ratio<br />
greater than �0.01%, additional measurements are<br />
made <strong>and</strong> the data are averaged. Typically, from 9 to<br />
16 samples are averaged for each data point. Occa-<br />
Fig. 7. Irradiance uniformity at a reference plane 1 m from the<br />
irradiance source. (a) Two-dimensional map <strong>of</strong> the irradiance distribution;<br />
(b) horizontal slice through the vertically centered irradiance.<br />
sionally additional samples are taken, for example,<br />
when measuring the out-<strong>of</strong>-b<strong>and</strong> response <strong>of</strong> a filter<br />
radiometer under test.<br />
The irradiance at a reference plane should be spatially<br />
uniform to limit the magnitude <strong>of</strong> corrections for<br />
different size entrance pupils. In Fig. 7(a) we show the<br />
irradiance distribution at a reference plane approximately<br />
1 m from the exit port <strong>of</strong> a 25.4 mm integrating<br />
sphere equipped with a 5 mm diameter aperture. In<br />
Fig. 7(b) we show a horizontal slice across the center<br />
<strong>of</strong> the distribution. As shown in Fig. 7, the irradiance<br />
is uniform to within 0.1% over the central �2 cm<br />
in both the horizontal <strong>and</strong> vertical directions. The<br />
entrance apertures <strong>of</strong> most irradiance meters calibrated<br />
on SIRCUS have diameters significantly<br />
smaller than 4 cm, <strong>and</strong> no correction for irradiance<br />
nonuniformity at the reference plane is applied.<br />
4. Distance<br />
The distance between the source <strong>and</strong> trap detector<br />
apertures (reference planes) is measured optically <strong>and</strong><br />
mechanically. For a point-source geometry, the irradiance<br />
should follow an inverse square law, i.e., the ir-<br />
10 November 2006 � Vol. 45, No. 32 � APPLIED OPTICS 8225
Fig. 8. Radiometric determination <strong>of</strong> the distance between two<br />
aperture planes. Dots are measured trap-to-monitor ratios; solid<br />
curve is a fit to the data.<br />
radiance should be a function <strong>of</strong> 1�d 2 , where d is the<br />
distance between the two reference planes. The relative<br />
distance between the source <strong>and</strong> the detector is<br />
measured with an electronic ruler that has a quoted<br />
resolution <strong>of</strong> 5 �m. 40 The three-axis detector translation<br />
stage is moved in the horizontal direction, <strong>and</strong><br />
the detector <strong>and</strong> monitor signals are acquired as a<br />
function <strong>of</strong> relative distance. The ratio <strong>of</strong> the trap<br />
signal to the monitor signal is then plotted as a function<br />
<strong>of</strong> distance <strong>and</strong> fit with a nonlinear least-squares<br />
algorithm. 41 Figure 8 illustrates an optical distance<br />
measurement, with the dots measuring trap-tomonitor<br />
ratios <strong>and</strong> the solid curve being the fit to the<br />
data. The data were fit to the expression<br />
y � m1��m0 � m 2<br />
2� , (3)<br />
where the radiant intensity is given by m 1, the zero<br />
<strong>of</strong>fset <strong>of</strong> the fixed source is m 2, <strong>and</strong> m 0 is the position<br />
<strong>of</strong> the stage measured by the electronic ruler. The<br />
uncertainty in the fit to m 2 is 28.7 �m. Since we know<br />
the zero <strong>of</strong>fset from this fit, we also know the absolute<br />
separation at any value <strong>of</strong> the electronic ruler with an<br />
uncertainty <strong>of</strong> 28.7 �m. To validate the radiometric<br />
measurements, we also measured the aperture<br />
separation by using a calibrated ruler. The two separate<br />
techniques used to measure the distance between<br />
the source <strong>and</strong> the detector reference planes<br />
agreed usually within 50 �m. Given a 50 �m uncertainty<br />
in the trap reference plane, the uncertainty in<br />
the irradiance at a given reference plane for distances<br />
<strong>of</strong> 1 m or greater is less than 0.01%.<br />
For radiometers with a known reference plane, we<br />
use a micrometer to make sure that the DUTs <strong>and</strong> the<br />
reference trap aperture lie in the same plane. By using<br />
a micrometer, the reference planes can be aligned to<br />
within approximately 10 �m. Consequently, this approach<br />
significantly reduces the uncertainty in the<br />
irradiance at the DUT reference plane. If the DUT<br />
reference plane is not known, it is optically determined<br />
by using Eq. (3). For a non-point-source geometry,<br />
the full equation including the spatial extent <strong>of</strong><br />
8226 APPLIED OPTICS � Vol. 45, No. 32 � 10 November 2006<br />
the source <strong>and</strong> detector is required 42 ; the uncertainties<br />
remain the same.<br />
5. Current-to-Voltage Conversion (I–V Amplification)<br />
The uncertainty <strong>of</strong> the current-to-voltage (I–V) conversion<br />
43 was 0.01% for gain selections between<br />
10 4 V�A <strong>and</strong> 10 7 V�A. At these gains, the uncertainty<br />
<strong>of</strong> the feedback resistors in the I–V converter was<br />
0.01% �k � 1� for the decade nominal resistance values.<br />
The uncertainty increased to 0.014% at the<br />
10 8 V�A gain where two 50 M� resistors (each with<br />
0.01% resistance uncertainty) were connected serially.<br />
Because the resistance uncertainty <strong>of</strong> 10 9 �<br />
resistors is 0.5% or higher, a gain <strong>of</strong> 10 9 V�A was<br />
radiometrically calibrated against a gain <strong>of</strong> 10 8 V�A<br />
by measuring the same stabilized optical power. The<br />
gain uncertainty for this highest gain selection was<br />
0.02%. The low uncertainties in gain can be achieved<br />
only if the dark reading is substracted from the signal<br />
plus the dark reading <strong>of</strong> the trap detector radiometer<br />
(which includes the I–V converter) using a shutter<br />
positioned upstream in the laser beam. The temperature<br />
coefficients <strong>of</strong> the resistances were 0.001%�°C<br />
for gain selections between 10 4 V�A <strong>and</strong> 10 7 V�A.<br />
The maximum temperature change in the lighttight<br />
box is 2 °C. Given an equal probability distribution<br />
for the temperature, the uncertainty in the<br />
resistance arising from the temperature coefficient is<br />
�0.001%� � 2�3 � 7 � 10 �4 %. 33<br />
6. Transfer to Test Instrument<br />
To achieve the lowest possible uncertainties on<br />
SIRCUS, the instrument should be designed with the<br />
calibration in mind. The uncertainty in the transfer to<br />
a test instrument is listed in Table 1 as 0.03%. This is<br />
for a well-designed, well-characterized, stable radiometer.<br />
Nonideal instrument characteristics such as<br />
stability, temperature dependence, long-term drift,<br />
<strong>and</strong> out-<strong>of</strong>-field response, all contribute to increased<br />
overall uncertainty in a calibration. Interference<br />
fringes from multiple reflections <strong>of</strong> incident radiation<br />
at optical surfaces have been observed in the calibration<br />
<strong>of</strong> instruments with windows <strong>and</strong> other optical<br />
elements if they are not wedged or antireflection<br />
coated. For example, the absolute spectral responsivity<br />
<strong>of</strong> a pyrometer (discussed in Subsection 4.A) calibrated<br />
on SIRCUS is shown in Fig. 9, in both a<br />
logarithmic [Fig. 9(a)] <strong>and</strong> a linear [Fig. 9(b)] scale.<br />
Interference fringes (the sinusoidal oscillations in the<br />
responsivity) are emphasized in the exp<strong>and</strong>ed view<br />
[Fig. 9(c)]. The presence <strong>of</strong> interference fringes increases<br />
the difficulty in the calibration if they must be<br />
measured during the calibration or increases the uncertainty<br />
in the calibration.<br />
As an aside, we have found that interference fringes<br />
are ubiquitous, caused mainly by the window on the<br />
photodiode or parallel-surface windows in the device,<br />
or filters. 12 A complete mapping <strong>of</strong> the fringes is possible<br />
on SIRCUS because <strong>of</strong> the narrow spectral b<strong>and</strong>width<br />
<strong>and</strong> wavelength stability <strong>of</strong> the lasers <strong>and</strong><br />
because the laser wavelength can be tuned automatically.<br />
In certain calibration approaches—for example,
Fig. 9. Absolute spectral irradiance responsivity <strong>of</strong> a filter radiometer,<br />
namely, the AP1 pyrometer, shown on (a) a logarithmic<br />
<strong>and</strong> (b) a linear scale. (c) Exp<strong>and</strong>ed view <strong>of</strong> the responsivity showing<br />
large oscillations arising from multiple reflections <strong>of</strong> the incident<br />
flux between surfaces within the instrument.<br />
using lamp–monochromator systems—the fringes are<br />
not observed. Interference fringes occur when the coherence<br />
length <strong>of</strong> the source is as long as or longer than<br />
the size <strong>of</strong> the interfering structure. For example, interference<br />
fringes will most likely be present from multilayer<br />
coatings even for an incoherent source such as<br />
a lamp. If they are not observed, it is likely because the<br />
fine structure in the spectral responsivity caused by<br />
interference fringes is being averaged over the finite<br />
source b<strong>and</strong>width. However, the averaging may not<br />
be complete, <strong>and</strong> artifacts caused by the incomplete<br />
cancellation <strong>of</strong> the fringes can lead to erroneous<br />
results. Also, errors can arise in the determination<br />
<strong>of</strong> an instrument’s effective aperture area using the<br />
scanning method if fringes are present. 12 In this<br />
case, the instrument should be calibrated directly<br />
in the irradiance mode to obtain the lowest achievable<br />
uncertainties.<br />
7. Radiance Responsivity Calibrations<br />
For radiance responsivity calibrations, the uncertainty<br />
budget differs only slightly from the uncertainty<br />
budget derived for irradiance responsivity<br />
calibrations. In a radiance responsivity calibration,<br />
the average radiance over the entire integrating<br />
sphere exit port area is measured by the reference<br />
trap detector, while instruments being calibrated<br />
typically image variously sized central regions <strong>of</strong><br />
the exit port. Errors in calibration can occur if the<br />
sphere radiance is nonuniform, giving different average<br />
radiance depending on the area <strong>of</strong> the exit<br />
port being imaged. While the sphere’s nonuniformity<br />
can be mapped <strong>and</strong> corrections applied, for the<br />
lowest uncertainty measurements, it is desirable to<br />
keep the sphere’s nonuniformity as small as possible.<br />
Many researchers have calculated baffle arrangements<br />
for spheres to improve the radiance<br />
uniformity within the exit port for different input<br />
source configurations. We have found empirically<br />
that if the input laser beam impinges on the sphere<br />
wall close to the exit port, no baffles inside the<br />
sphere are needed.<br />
The integrating spheres used for radiance responsivity<br />
calibrations on SIRCUS have been designed to<br />
allow the incident laser light to hit the sphere wall<br />
near the exit port. The spatial uniformity <strong>of</strong> one <strong>of</strong><br />
the spheres, a 30 cm diameter Spectralon-coated integrating<br />
sphere with a 7.5 cm diameter aperture,<br />
was mapped using a radiometer with a narrow<br />
��1°� FOV. Fixed at a distance <strong>of</strong> 0.5 m from the<br />
sphere, the target spot diameter <strong>of</strong> the radiometer at<br />
the sphere exit port was approximately 12.5 mm. The<br />
radiometer was translated in 6 mm increments <strong>and</strong><br />
the radiance recorded at each position. The sphere<br />
radiance was spatially uniform to within �0.1% over<br />
the entire sphere exit port (Fig. 10). Radiance is a<br />
conserved quantity. As long as the DUT is imaging an<br />
area within the exit port, the distance from the DUT<br />
to the sphere exit port is not critical for radiance<br />
responsivity calibrations.<br />
10 November 2006 � Vol. 45, No. 32 � APPLIED OPTICS 8227
Fig. 10. Contour plot <strong>of</strong> the sphere radiance uniformity within the<br />
exit port; 0.1% steps.<br />
E. Calibration Procedure<br />
Before an instrument can be calibrated, it must be<br />
aligned with respect to the integrating sphere, as<br />
must the reference st<strong>and</strong>ard detector. To align the<br />
system, a laser is used to define an optical axis. Both<br />
the integrating sphere <strong>and</strong> the detectors are then<br />
aligned to the optical axis. The optical axis is typically<br />
set to be parallel to the direction <strong>of</strong> motion <strong>of</strong> a linear<br />
translation stage that moves perpendicular to the<br />
sphere exit port (the z axis defined in Fig. 11). The z<br />
axis translation stage sits on a pair <strong>of</strong> rails <strong>and</strong> is<br />
manually translated. A linear encoder records the<br />
stage position along the rails.<br />
As illustrated in Fig. 11, to define the optical axis,<br />
a laser beam is incident on a pellicle beam splitter<br />
that is mounted on the z-axis rail system. A mirror<br />
is positioned behind the pellicle to retroreflect the<br />
light directly back into the laser. The pellicle is in a<br />
mirror mount <strong>and</strong> is adjusted to reflect light that is<br />
then aligned to be parallel to the translation stage.<br />
This is done by first mounting an iris near the<br />
pellicle beam splitter on the translation stage <strong>and</strong><br />
Fig. 11. Schematic <strong>of</strong> the alignment method for SIRCUS.<br />
8228 APPLIED OPTICS � Vol. 45, No. 32 � 10 November 2006<br />
aligning it so that the laser light is centered on the<br />
iris aperture. Then the iris is moved by using the<br />
translation stage to lie some distance away from<br />
the pellicle. The angle <strong>of</strong> the pellicle beam splitter is<br />
adjusted so that the light reflected from it goes<br />
through the iris aperture. These two steps are repeated<br />
until the beam is centered on the iris at the<br />
two translation stage positions. At this point, the<br />
optical beam is parallel to the translation stage, <strong>and</strong><br />
the optical axis is defined.<br />
To align the detectors, the motorized x–y translation<br />
stage is positioned such that the laser is centered on<br />
each detector (one at a time), <strong>and</strong> the reflection from a<br />
flat reference plane on the detector is parallel with the<br />
incident beam. For each detector, a computer registers<br />
<strong>and</strong> stores the alignment position. The retroreflected<br />
beam (from the mirror behind the pellicle) is automatically<br />
aligned parallel to the rail. The sphere exit port<br />
is then centered on this beam (<strong>and</strong> the angle adjusted<br />
to coalign the reflected laser beam with the incident<br />
beam).<br />
The alignment between the detectors <strong>and</strong> the integrating<br />
sphere is radiometrically validated by<br />
translating the detectors in the x <strong>and</strong> y directions<br />
<strong>and</strong> recording the signals as a function <strong>of</strong> stage<br />
position. The stage position giving the maximum<br />
signal from each instrument is compared with the<br />
stage position derived from the optical alignment<br />
procedure. The two positions typically agree to<br />
within 1 mm, well within the desired alignment<br />
uncertainty.<br />
1. Calibration Protocol<br />
The entire data collection sequence is automated.<br />
Initially, an electronic shutter that blocks the laser<br />
radiation before it enters the optical fiber is closed,<br />
<strong>and</strong> a background signal is acquired for both the<br />
reference st<strong>and</strong>ard trap detector <strong>and</strong> the sphere<br />
monitor. Then the shutter opens <strong>and</strong> the signals<br />
from the trap <strong>and</strong> the monitor on the sphere are<br />
recorded. The signals are initially amplified using a<br />
current-to-voltage amplifier 44 <strong>and</strong> then fed into a<br />
digital multimeter. 45 The signal from the multimeter<br />
is averaged for several seconds. The mean<br />
reference-to-monitor ratio <strong>and</strong> the st<strong>and</strong>ard deviation<br />
<strong>of</strong> the ratio are recorded. After this, the stage<br />
moves to the DUT position, <strong>and</strong> the data acquisition<br />
sequence is repeated. This gives the DUT mean<br />
signal-to-monitor ratio <strong>and</strong> the st<strong>and</strong>ard deviation<br />
<strong>of</strong> the ratio. The st<strong>and</strong>ard deviations <strong>of</strong> the ratios<br />
are monitored; trap detector measurement st<strong>and</strong>ard<br />
deviations larger than 0.01% are an indication<br />
<strong>of</strong> laser power instabilities.<br />
Under routine calibration conditions, the intensitystabilized<br />
laser wavelength is read by the wavemeter<br />
<strong>and</strong> transferred to the computer during each measurement.<br />
Along with mean ratios, the mean <strong>and</strong> st<strong>and</strong>ard<br />
deviations <strong>of</strong> the wavelength are recorded. This allows<br />
ready identification <strong>of</strong> laser wavelength instabilities<br />
during a scan. Occasionally, for faster data acquisition,<br />
the wavelength is recorded only at the beginning <strong>of</strong> the<br />
acquisition sequence. Following the data acquisition
sequence, the wavelength is changed <strong>and</strong> the sequence<br />
is repeated.<br />
3. Comparison with the <strong>National</strong> <strong>Institute</strong> <strong>of</strong> <strong>St<strong>and</strong>ards</strong><br />
<strong>and</strong> Technology Lamp–Monochromator-Based<br />
Calibration Facility<br />
The high optical power available with laser-based calibration<br />
systems enables us to calibrate instruments<br />
directly for either radiance or irradiance responsivity.<br />
The low wavelength uncertainty <strong>of</strong> the laser is instrumental<br />
in reducing the calibration uncertainty for<br />
filtered instruments. The source radiance uniformity<br />
also permits rapid characterization <strong>and</strong> calibration <strong>of</strong><br />
digital imaging systems. Some <strong>of</strong> the advantages <strong>of</strong> the<br />
laser-based calibration approach over a conventional<br />
lamp–monochromator-based approach are illustrated<br />
by the calibration <strong>of</strong> a photoelectric pyrometer<br />
(PEP), an instrument used to radiometrically determine<br />
the temperature <strong>of</strong> a blackbody. 46 The instrument<br />
is equipped with a narrow b<strong>and</strong>pass filter<br />
��1 nm� for spectral selectivity.<br />
For accurate radiance temperature determinations,<br />
the instrument’s spectral out-<strong>of</strong>-b<strong>and</strong> responsivity<br />
must be measured as well as its in-b<strong>and</strong> responsivity.<br />
Figure 12 shows the relative spectral responsivity <strong>of</strong><br />
Fig. 12. Relative spectral responsivity <strong>of</strong> the PEP measured on<br />
SIRCUS <strong>and</strong> on the SCF: (a) linear scale; (b) log scale.<br />
the PEP determined on SIRCUS compared with the<br />
relative spectral responsivity determined using the<br />
lamp–monochromator system in the SCF. As shown in<br />
Fig. 12(a), the spectral responsivity measured with the<br />
lamp–monochromator system is dominated by the<br />
spectral b<strong>and</strong>width <strong>of</strong> the source <strong>and</strong> deconvolution <strong>of</strong><br />
the spectrum by using the source slit scatter function<br />
is required. In contrast, the fine detail in the spectral<br />
responsivity is easily measured on SIRCUS because <strong>of</strong><br />
the monochromatic nature <strong>of</strong> the source. <strong>Note</strong> that<br />
there are several overlying data points at each wavelength<br />
along both the rising <strong>and</strong> falling edges, demonstrating<br />
the extreme wavelength stability <strong>of</strong> the<br />
SIRCUS facility. Because <strong>of</strong> the low flux in the lamp–<br />
monochromator system, the out-<strong>of</strong>-b<strong>and</strong> responsivity<br />
is limited to approximately 10 �6 [Fig. 12(b)]. In contrast,<br />
the out-<strong>of</strong>-b<strong>and</strong> responsivity can be measured<br />
to the 10 �9 level in the SIRCUS facility.<br />
In SIRCUS, instruments are calibrated in their operational<br />
state: at the system level, with entrance pupils<br />
overfilled. This approach avoids unforeseen errors<br />
that can occur using other calibration approaches. For<br />
example, consider the measurements <strong>of</strong> the relative<br />
spectral responsivity <strong>of</strong> a single channel filter radiometer<br />
known as a st<strong>and</strong>ard lamp monitor (SLM). 47 The<br />
SLM can be operated in irradiance or radiance mode,<br />
depending on the foreoptics. The irradiance mode configuration<br />
has a Teflon diffuser, a window, an interference<br />
filter, <strong>and</strong> a silicon photodiode. The instrument’s<br />
relative spectral responsivities (RSRs) are used to<br />
b<strong>and</strong> integrate the response to an illumination source.<br />
The RSR <strong>of</strong> a SLM was measured on the SCF. During<br />
these measurements, the flux from the monochromator<br />
exit slit was imaged onto the center <strong>of</strong> the diffuser.<br />
In this case, the irradiance collector was underfilled by<br />
the incident radiant flux. The SLM was also calibrated<br />
in irradiance mode for absolute spectral responsivity<br />
on SIRCUS. In this case, the irradiance collector was<br />
overfilled by the flux from the laser-illuminated integrating<br />
sphere. A comparison <strong>of</strong> the two results by<br />
using peak-normalized data showed that the relative<br />
spectral responses did not agree (Fig. 13). There was<br />
no dependence on the f�# <strong>of</strong> the incoming flux. However,<br />
spatial maps <strong>of</strong> the relative response at multiple<br />
Fig. 13. Relative spectral responsivity <strong>of</strong> the SLM measured in<br />
underfilled mode (SCF) <strong>and</strong> in overfilled mode (SIRCUS).<br />
10 November 2006 � Vol. 45, No. 32 � APPLIED OPTICS 8229
fixed wavelengths within the in-b<strong>and</strong> region showed<br />
that the irradiance responsivity was not spatially<br />
uniform (due to the diffuser), leading to the observed<br />
differences. These measured differences can cause<br />
errors in the b<strong>and</strong>-averaged measurements <strong>of</strong> spectral<br />
irradiance when the spectrum <strong>of</strong> the source being<br />
measured differs from that <strong>of</strong> the calibration source.<br />
4. Application to Primary Radiometric Quantities<br />
<strong>and</strong> Units<br />
The <strong>NIST</strong> Optical Technology Division is responsible<br />
for maintaining two fundamental SI units, the<br />
unit for temperature, the kelvin, above 1234.96 K,<br />
<strong>and</strong> the unit for luminous intensity, the c<strong>and</strong>ela. In<br />
the following subsections we describe the effect <strong>of</strong><br />
SIRCUS calibrations on reference st<strong>and</strong>ard pyrometers<br />
used to measure the radiance temperature <strong>of</strong><br />
blackbody sources <strong>and</strong> photometers used to measure<br />
the illuminance <strong>of</strong> st<strong>and</strong>ard lamps. Using SIRCUS to<br />
develop a detector-based validation <strong>of</strong> the spatial distribution<br />
<strong>of</strong> the radiant flux from a st<strong>and</strong>ard synchrotron<br />
source predicted by the Schwinger equation is<br />
also discussed.<br />
A. Radiance Temperature<br />
For temperatures above the freezing temperature <strong>of</strong><br />
silver, the ITS-90 (Ref. 48) is defined in terms <strong>of</strong> spectral<br />
radiance ratios to one <strong>of</strong> the silver-, gold-, or<br />
aluminum-freezing temperature blackbodies using the<br />
Planck radiance law. 49 In the ITS-90, the assigned<br />
temperatures for the aluminum, silver, <strong>and</strong> gold freezing<br />
points result from thermometry using ratio pyrometry<br />
from the mean <strong>of</strong> two different <strong>and</strong> conflicting<br />
constant-volume gas thermometry measurements at<br />
lower temperatures. There are thermodynamic temperature<br />
uncertainties <strong>of</strong> the freezing points <strong>of</strong> the<br />
primary metal blackbodies that arise primarily from<br />
the uncertainties in the lower temperature gas thermometry.<br />
Because <strong>of</strong> the use <strong>of</strong> spectral radiance ratios, the<br />
temperature uncertainties <strong>of</strong> ITS-90 assigned blackbody,<br />
u�T BB�, increase as the square <strong>of</strong> the temperature<br />
ratios according to<br />
u�TBB� � u�TFP� 2<br />
TFP T 2<br />
BB , (4)<br />
where T FP <strong>and</strong> u�T FP� are the temperature <strong>and</strong> the<br />
uncertainty <strong>of</strong> the fixed-point blackbody <strong>and</strong> T BB is<br />
the temperature <strong>of</strong> the higher temperature blackbody.<br />
The increases in the temperature uncertainties<br />
can be reduced by using absolute radiometry with pyrometers<br />
traceable to cryogenic radiometers, <strong>and</strong> the<br />
resulting temperature uncertainties can be smaller<br />
than those measured using the ITS-90 techniques. 10,50<br />
To decrease the uncertainties in the radiance temperature<br />
scale at <strong>NIST</strong> <strong>and</strong>, ultimately, in the thermodynamic<br />
temperature assignment <strong>of</strong> the metal<br />
freezing-point temperatures, a pyrometer—denoted<br />
the Absolute Pyrometer-1 (AP1)—was built to radiometrically<br />
measure blackbody temperatures. 50,51 Spec-<br />
8230 APPLIED OPTICS � Vol. 45, No. 32 � 10 November 2006<br />
tral selection is achieved by using a narrowb<strong>and</strong><br />
interference filter with a center wavelength at 650 nm<br />
<strong>and</strong> a b<strong>and</strong>pass <strong>of</strong> 10 nm. The filter is temperature<br />
stabilized to near room temperature, <strong>and</strong> the hermetically<br />
sealed silicon photodiode has a two-stage thermoelectric<br />
cooler for operation at �15 °C. It has a<br />
noise-equivalent power (NEP) <strong>of</strong> 3 fW at an electrical<br />
b<strong>and</strong>width <strong>of</strong> 0.3 Hz. The radiometric characteristics,<br />
e.g., stability <strong>and</strong> linearity, for example, <strong>of</strong> the AP1<br />
have been established. 51<br />
The AP1 was calibrated for absolute spectral radiance<br />
responsivity on SIRCUS. As shown in Fig. 9,<br />
it has a peak responsivity between 647 <strong>and</strong> 652 nm,<br />
a FWHM b<strong>and</strong>width <strong>of</strong> approximately 10 nm, <strong>and</strong><br />
out-<strong>of</strong>-b<strong>and</strong> blocking better than 10 �7 . Interference<br />
fringes with an amplitude <strong>of</strong> 0.5% were observed in<br />
the responsivity. The absolute spectral responsivity<br />
was therefore measured with 0.03 nm resolution. The<br />
AP1 subsequently measured the melt <strong>and</strong> freeze cycles<br />
<strong>of</strong> silver <strong>and</strong> gold fixed-point blackbodies. The<br />
signal from the AP1 is converted to temperature using<br />
the equation:<br />
i u ��s L���� uL u��, T�d�, (5)<br />
where s L��� is the absolute spectral responsivity <strong>of</strong><br />
the AP1, � u is the emissivity <strong>of</strong> the blackbody, <strong>and</strong><br />
L u��, T� is the radiance <strong>of</strong> the blackbody derived from<br />
Planck’s equation. 50<br />
The noise-equivalent temperature at the gold (<strong>and</strong><br />
silver) freezing temperature is �2 mK, <strong>and</strong> the noise<br />
will not be the dominant component <strong>of</strong> the total<br />
temperature uncertainties. The AP1 was calibrated<br />
twice on SIRCUS, once in 2003 <strong>and</strong> again in 2005.<br />
Using the SIRCUS 2003 calibration, the exp<strong>and</strong>ed<br />
uncertainty �k � 2� in the radiometric measurement<br />
<strong>of</strong> the gold (or silver) freezing-point blackbody was<br />
approximately 0.15%. The radiometric uncertainties<br />
can be related to the uncertainties <strong>of</strong> the temperature<br />
determinations from the derivative <strong>of</strong> the Wien approximation,<br />
which shows the relationship between<br />
the uncertainty in radiance, L, to the uncertainty in<br />
blackbody temperature, T:<br />
�L<br />
L � c2 �<br />
�T<br />
2 . (6)<br />
T<br />
In Eq. (6), c 2 is the second radiation constant, <strong>and</strong> �<br />
is the wavelength. Using Eq. (6), an uncertainty <strong>of</strong><br />
0.15% in radiance responsivity at 650 nm will lead to<br />
an uncertainty <strong>of</strong> 121 mK in the measurement <strong>of</strong> the<br />
melting <strong>and</strong> freezing temperature <strong>of</strong> the gold-point<br />
blackbody, which is slightly larger than the ITS-90<br />
uncertainty, as shown in Table 2. 52 The AP1 was<br />
recently recalibrated on SIRCUS by using the 2004<br />
trap-detector responsivity scale (Table 1). By using<br />
the new calibration, the exp<strong>and</strong>ed uncertainty in the<br />
radiometric measurement <strong>of</strong> the gold point is reduced<br />
to approximately 0.09%. With the reduced uncer-
Table 2. Comparison <strong>of</strong> the Results <strong>of</strong> Radiometric Determinations <strong>of</strong><br />
the Gold- <strong>and</strong> Silver-Point Blackbody Temperatures Using the AP1<br />
Pyrometer with the ITS-90 Values<br />
T AP1<br />
(K)<br />
u (T AP1)<br />
(K)<br />
(k � 2)<br />
T 90<br />
(K)<br />
u (T 90)<br />
(K)<br />
(k � 2)<br />
T AP1 � T 90<br />
(K)<br />
Au-point<br />
blackbody<br />
1337.344 0.121 1337.33 0.100 0.014<br />
Ag-point<br />
blackbody<br />
1234.956 0.106 1234.93 0.080 0.026<br />
tainty from SIRCUS, the corresponding temperature<br />
uncertainty derived from the uncertainty in the radiometric<br />
measurement <strong>of</strong> the gold-point blackbody<br />
can be reduced to approximately 72 mK, significantly<br />
lower than the ITS-90 uncertainty.<br />
These results are, in effect, the first step toward<br />
implementation <strong>of</strong> a detector-based thermodynamic<br />
temperature scale. SIRCUS can be used to calibrate<br />
optical pyrometers directly, eliminating the dependence<br />
on a blackbody <strong>and</strong> the ITS-90. As discussed<br />
by Yoon et al., 50,53 moving from a source-based to<br />
a detector-based spectral irradiance (<strong>and</strong> radiance)<br />
scale can greatly reduce the radiometric uncertainty<br />
in the measurement <strong>of</strong> higher temperature sources.<br />
B. Photometry<br />
The redefinition <strong>of</strong> the c<strong>and</strong>ela in 1979 coupled photometric<br />
<strong>and</strong> radiometric units 54 <strong>and</strong> made it possible to<br />
realize <strong>and</strong> maintain photometric units by using detectors<br />
as well as sources. Following the redefinition,<br />
many national laboratories, including <strong>NIST</strong>, derived<br />
<strong>and</strong> maintained the c<strong>and</strong>ela (<strong>and</strong> derived photometric<br />
units) using calibrated st<strong>and</strong>ard detectors traceable to<br />
cryogenic radiometry rather than st<strong>and</strong>ard lamps<br />
traceable to primary st<strong>and</strong>ard blackbodies <strong>and</strong> international<br />
temperature scales. 55,56 Since 1992, the c<strong>and</strong>ela<br />
has been maintained at <strong>NIST</strong> by using a group <strong>of</strong><br />
eight st<strong>and</strong>ard photometers. 57 The overall relative exp<strong>and</strong>ed<br />
uncertainty (k � 2) for the <strong>NIST</strong> illuminance<br />
unit realization is currently 0.39%. 57<br />
There are several components in the uncertainty<br />
budget related to the determination <strong>of</strong> the photometer<br />
relative spectral responsivity using the lamp–<br />
monochromator system in the SCF. 1,57 The uncertainties<br />
in these components can be significantly reduced<br />
or eliminated by realizing the illuminance scale on<br />
SIRCUS. The spectral responsivity scale will be reduced<br />
from a st<strong>and</strong>ard uncertainty <strong>of</strong> 0.11% currently<br />
measured on the SCF to 0.075% because <strong>of</strong> the reduction<br />
<strong>of</strong> transfer steps from the high-accuracy<br />
cryogenic radiometer. The luminous efficiency function<br />
defined by the Commission Internationale de<br />
l’Eclairage (CIE), V���, is a strong function <strong>of</strong> wavelength.<br />
The SIRCUS wavelength scale, with uncertainties<br />
reduced to less than 0.01 nm from the SCF’s<br />
wavelength uncertainty <strong>of</strong> 0.1 nm, reduces the relative<br />
st<strong>and</strong>ard uncertainty for this component from<br />
0.04% to �0.004%. A significant set <strong>of</strong> uncertainty<br />
components results from the geometry <strong>of</strong> the SCF<br />
output beam. The SCF uses f�9 optics to focus the<br />
light to a 1 mm spot that is used to calibrate the photometers,<br />
whereas the photometers are normally used<br />
in a far-field condition. SIRCUS can calibrate photometers<br />
in a geometrical configuration identical to the<br />
application geometry, eliminating errors caused by different<br />
interreflection patterns inside the photometer<br />
between the calibration <strong>and</strong> application.<br />
In addition, since SIRCUS calibrates the detector<br />
in irradiance mode instead <strong>of</strong> power mode, the uncertainty<br />
<strong>of</strong> the aperture size <strong>and</strong> the uncertainty due to<br />
the nonuniform spatial response <strong>of</strong> the photometer<br />
are eliminated. Combined the uncertainty contribution<br />
from these components can be reduced from<br />
0.12% (Ref. 57) to less than 0.01%. The overall relative<br />
exp<strong>and</strong>ed uncertainty �k � 2� for the <strong>NIST</strong> illuminance<br />
unit realization is expected to be reduced to<br />
0.24%, a40% reduction from the uncertainty in the<br />
current scale, when the new illuminance scale is<br />
realized. The new illuminance scale will lead to an<br />
expected overall relative exp<strong>and</strong>ed uncertainty <strong>of</strong><br />
0.27% �k � 2� for the <strong>NIST</strong> c<strong>and</strong>ela.<br />
The current photometric working st<strong>and</strong>ard photometers<br />
were not calibrated on SIRCUS because<br />
large interference fringes (<strong>of</strong> the order <strong>of</strong> 10%) were<br />
observed in the spectral responsivity <strong>of</strong> those instruments.<br />
A trap-detector-based tristimulus colorimeter<br />
was developed to realize a detector-based color scale<br />
(see Subsection 5.A.). As a first step toward the new<br />
SIRCUS-based photometric scale, the irradiance responsivity<br />
<strong>of</strong> the photometric (Y) channel <strong>of</strong> the colorimeter<br />
was determined. An aperture mounted on<br />
the front surface <strong>of</strong> the colorimeter defines the reference<br />
plane for irradiance <strong>and</strong> illuminance measurements.<br />
Because <strong>of</strong> the thick color filter combinations 58<br />
<strong>and</strong> the removed photodiode windows, all four channels<br />
<strong>of</strong> this colorimeter showed fringe-free operation on<br />
SIRCUS. Use <strong>of</strong> feedback resistors in the photocurrent<br />
meters with 0.001%�°C temperature coefficient <strong>of</strong> resistance,<br />
0.01% uncertainty <strong>of</strong> their decade nominal<br />
values, <strong>and</strong> realizing loop gains larger than 10 4 in dc<br />
measurements for all signal-gain selections, the uncertainty<br />
<strong>of</strong> the photocurrent-to-voltage conversion<br />
was 0.01%. 31<br />
From the SIRCUS-measured spectral irradiance responsivity<br />
<strong>of</strong> the photometric channel (between 360<br />
<strong>and</strong> 950 nm), the illuminance responsivity was calculated.<br />
59 Thereafter st<strong>and</strong>ard lamps were measured<br />
in the photometry calibration facility to compare the<br />
illuminance responsivities <strong>of</strong> the same channel determined<br />
from both the existing (SCF-based) <strong>and</strong> the<br />
new (SIRCUS-based) scales. The colorimeter was<br />
calibrated on SIRCUS twice, with the calibrations<br />
separated in time by 15 months. The illuminance<br />
responsivity <strong>of</strong> the photometric channel from the two<br />
SIRCUS calibrations agreed within 0.1%. The average<br />
illuminance responsivity from the two SIRCUS<br />
calibrations was 4.911 nA�lx, 0.35% higher than the<br />
SCF-based illuminance responsivity.<br />
Our investigations showed that the SCF-based<br />
illuminance responsivity (used in the present photo-<br />
10 November 2006 � Vol. 45, No. 32 � APPLIED OPTICS 8231
metric scale) is low by approximately 3% because <strong>of</strong> a<br />
beam-clipping problem caused by the small apertures<br />
in the working st<strong>and</strong>ard photometers. Comparisons<br />
<strong>of</strong> the spectral responsivity determined on SIRCUS<br />
<strong>and</strong> the SCF show spectral shifts as large as 0.5 nm<br />
<strong>and</strong> responsivity differences as large as 1%.<br />
C. Synchrotron Radiation<br />
Schwinger described the nature <strong>of</strong> radiation that is<br />
emitted from the acceleration <strong>of</strong> relativistic particles.<br />
60 In a synchrotron accelerator, electrons are<br />
confined to a circular path <strong>and</strong> continuously emit<br />
radiation tangential to their direction. Magnets are<br />
used to control the energy <strong>and</strong> direction <strong>of</strong> electrons<br />
in the synchrotron. Like blackbody radiation, synchrotron<br />
radiation is absolutely calculable from the<br />
knowledge <strong>of</strong> a very few parameters. Blackbody radiation<br />
follows from Planck’s law: Knowledge <strong>of</strong> the<br />
temperature <strong>and</strong> emittance allows for calculation <strong>of</strong><br />
all radiation emanating from the blackbody. Synchro-<br />
Fig. 14. (a) Schematic diagram <strong>of</strong> the filter radiometers that were<br />
calibrated for irradiance responsivity on SIRCUS <strong>and</strong> used to measure<br />
the angular distribution <strong>of</strong> radiation <strong>and</strong> intensity at SURF<br />
III. (b) Absolute spectral irradiance responsivity <strong>of</strong> the 400 nm<br />
filter radiometer.<br />
8232 APPLIED OPTICS � Vol. 45, No. 32 � 10 November 2006<br />
Fig. 15. (Color online) Angular distribution pattern from SURF<br />
measured with three filter radiometers. The solid curve is the<br />
calculated distribution pattern.<br />
tron radiation is defined by the Schwinger equation:<br />
The electron beam current, magnetic field, <strong>and</strong> the<br />
orbital radius completely define the radiation field.<br />
The <strong>NIST</strong> Synchrotron Ultraviolet Radiation Facility<br />
(SURF III) is a particularly simple synchrotron<br />
storage ring. The electrons are confined to a circular<br />
orbit in a vacuum chamber by a dipole magnet with an<br />
extremely uniform magnetic field (�10 �4 nonuniformity<br />
in the magnetic field). The angular distribution<br />
<strong>and</strong> intensity <strong>of</strong> radiation is dependent on the electron<br />
beam energy <strong>and</strong> the wavelength <strong>of</strong> the emitted<br />
radiation. To validate the expected spatial distribution,<br />
three filter radiometers were constructed with<br />
b<strong>and</strong>-center wavelengths at 254, 400, <strong>and</strong> 800 nm,<br />
respectively. A simplified schematic <strong>of</strong> the filter radiometers<br />
is shown in Fig. 14(a). These filter radiometers<br />
contain a precision aperture, a diffuser, an<br />
interference filter, <strong>and</strong> a photodiode, <strong>and</strong> they are not<br />
polarization sensitive. The filter radiometers were<br />
calibrated for irradiance responsivity on SIRCUS; the<br />
absolute spectral responsivity <strong>of</strong> the 400 nm filter<br />
radiometer is shown in Fig. 14(b). They subsequently<br />
measured the angular distribution <strong>and</strong> intensity <strong>of</strong><br />
the emitted radiation at a known beam current <strong>and</strong><br />
magnetic field at SURF III. 61 The filter radiometer<br />
results are shown in Fig. 15. By numerically integrating<br />
the response <strong>of</strong> the radiometers <strong>and</strong> the calculated<br />
angular distribution <strong>of</strong> the intensity <strong>of</strong> emitted<br />
radiation, the spatial distribution <strong>of</strong> the radiant flux<br />
from SURF III can be calculated for different wavelengths.<br />
The quantitative results for the three filter<br />
radiometer wavelengths are given by the solid curves<br />
in Fig. 15. There are no adjustable parameters in the<br />
calculations. The results at 400 nm have been multiplied<br />
by a factor <strong>of</strong> 3 <strong>and</strong> the results at 800 by a<br />
factor <strong>of</strong> 15 to show all the results on the same figure.<br />
The calculated, or predicted signals as a function <strong>of</strong><br />
angle agree with the measurements to better than<br />
0.5%.<br />
5. Applications<br />
The unique characteristics <strong>of</strong> SIRCUS give us the<br />
versatility to address a wide range <strong>of</strong> optical metrology<br />
issues in addition to applications related to the
measurement <strong>of</strong> fundamental sources or to the realization<br />
<strong>of</strong> fundamental SI units. We briefly discuss<br />
other applications in the following subsections.<br />
A. Detector-Based Color Scale<br />
A tristimulus colorimeter st<strong>and</strong>ard was developed by<br />
using temperature-stabilized filters in front <strong>of</strong> a silicon<br />
tunnel-trap detector to realize a detector-based color<br />
scale. 58 The tristimulus colorimeter is composed <strong>of</strong> four<br />
channels consisting <strong>of</strong> filter combinations with the trap<br />
detector designed to mimic the CIE color-matching<br />
functions 62 with small spectral mismatch. The spectral<br />
mismatch <strong>of</strong> the realized channels is characterized<br />
by the CIE f 1� values. 63 The filter combinations are<br />
mounted in a temperature-controlled (heated) filter<br />
wheel that can be moved between the trap detector<br />
<strong>and</strong> the front aperture. The aperture plane is the<br />
reference plane <strong>of</strong> the illuminance-mode photometer–<br />
colorimeter, <strong>and</strong> it is in the plane <strong>of</strong> the front cover. A<br />
precision current-to-voltage converter is attached to<br />
the top <strong>of</strong> the instrument. Electronic <strong>and</strong> radiometric<br />
characterizations, including current-to-voltage conversion<br />
uncertainty <strong>and</strong> spatial, angular, <strong>and</strong> spectral<br />
responsivity, have been done.<br />
The tristimulus colorimeter was calibrated on<br />
SIRCUS as a first step in the establishment <strong>of</strong> a<br />
detector-based color scale. 64 When utilizing the uniform<br />
irradiance at the detector reference plane from<br />
the small sphere source <strong>of</strong> the SIRCUS, the nonuniformity<br />
<strong>of</strong> spatial responsivity <strong>of</strong> the filters <strong>and</strong> the<br />
detector in the tristimulus colorimeter will not contribute<br />
to measurement uncertainty. Also, interreflections<br />
between optical components will be the same for the<br />
calibration <strong>and</strong> subsequent applications, <strong>and</strong> their contribution<br />
to radiometric measurement error will cancel.<br />
The combined exp<strong>and</strong>ed uncertainties �k � 2� in<br />
the absolute spectral irradiance responsivities <strong>of</strong> the<br />
individual channels, neglecting correlations, are estimated<br />
to be 0.15% or less. From the spectral irradiance<br />
responsivity curves, the broadb<strong>and</strong> calibration<br />
factors <strong>of</strong> the colorimeter channels can be calculated,<br />
<strong>and</strong> the tristimulus values <strong>of</strong> a test light source can<br />
be measured. For a Planckian radiator (a light source<br />
with a well-known spectral distribution), a 0.15% uncertainty<br />
in the spectral irradiance responsivity <strong>of</strong><br />
any one channel <strong>of</strong> a tristimulus colorimeter will<br />
result in a chromaticity coordinate uncertainty <strong>of</strong><br />
0.0004 for both x <strong>and</strong> y. These uncertainties correspond<br />
to an uncertainty <strong>of</strong> 4 K in color temperature,<br />
a factor <strong>of</strong> 2 less than the uncertainties <strong>of</strong> current<br />
primary color temperature lamp st<strong>and</strong>ards.<br />
B. Stray Light Characterization <strong>of</strong> Spectrographs<br />
Spectrographs are spectroradiometers with multielement<br />
array detectors that can acquire an entire<br />
spectral image over some finite spectral region simultaneously.<br />
Spectrographs commonly consist <strong>of</strong><br />
an entrance port, a dispersing element (such as a<br />
grating) to spatially resolve the spectral components<br />
<strong>of</strong> the incident radiation, <strong>and</strong> mirrors to image<br />
the entrance port (<strong>of</strong>ten a slit) onto a reference<br />
plane where the array detector is located. Because<br />
<strong>of</strong> the dispersing element, the spatial image <strong>of</strong> the<br />
entrance port falls on different regions <strong>of</strong> the detector<br />
array, depending on its wavelength; broadb<strong>and</strong><br />
sources form an image across the entire array. The<br />
spectral coverage <strong>of</strong> a spectrograph is determined<br />
by the size <strong>of</strong> its detector array, the dispersion properties<br />
<strong>of</strong> its grating, <strong>and</strong> its optical layout. Compared<br />
with conventional, scanned grating systems,<br />
source spectral distributions can be acquired in a<br />
matter <strong>of</strong> seconds, as opposed to minutes. The ability<br />
to rapidly acquire a spectrum has led to the use<br />
<strong>of</strong> array-based systems in a variety <strong>of</strong> radiometric,<br />
photometric, <strong>and</strong> colorimetric applications where<br />
acquisition speed is an issue, for instance, on a<br />
production line, or in cases where the source being<br />
measured is not stable over extended periods <strong>of</strong><br />
time.<br />
The measurement uncertainties <strong>of</strong> spectrographs<br />
are <strong>of</strong>ten larger than conventional scanning spectrometers.<br />
Spectrographs are single grating instruments<br />
<strong>and</strong> there are intrinsic limitations in the background<br />
signal originating from radiation scattered from imperfections<br />
in the grating <strong>and</strong> other optical elements.<br />
This unwanted background radiation, called stray<br />
light, while small—<strong>of</strong> the order <strong>of</strong> 10 �4 or less <strong>of</strong><br />
the incident spectral radiance in a single grating<br />
spectrograph—can give rise to unforeseen errors, <strong>of</strong>ten<br />
much larger than anticipated, when the spectral<br />
distribution <strong>of</strong> a source being measured differs<br />
significantly from the spectral distribution <strong>of</strong> the calibration<br />
source. In comparison, a conventional scanning<br />
spectrometer is <strong>of</strong>ten constructed as a doublemonochromator<br />
instrument (double grating or prism<br />
grating) that has a stray light level lower than 10 �6 .<br />
In many applications, the spectral distributions <strong>of</strong><br />
the test source <strong>and</strong> the calibration source differ significantly.<br />
Spectrometers are typically calibrated against<br />
st<strong>and</strong>ard inc<strong>and</strong>escent lamps with correlated color<br />
temperatures (CCTs) ranging from 2800 to 3100 K.<br />
Most <strong>of</strong> the emission from these sources lies in the red<br />
<strong>and</strong> NIR regions. Measurement errors, <strong>of</strong>ten significant,<br />
arising from stray light are inevitable when<br />
instruments calibrated against st<strong>and</strong>ard lamps subsequently<br />
measure light sources that have dissimilar<br />
spectral distributions, such as LEDs, displays, discharge<br />
lamps, <strong>and</strong> fluorescent lamps. In these situations,<br />
stray light is <strong>of</strong>ten the dominant source <strong>of</strong><br />
spectrograph measurement error.<br />
Algorithms have been developed to correct the<br />
output <strong>of</strong> a spectrograph for stray light based on<br />
the spectral imaging properties <strong>of</strong> the instrument.<br />
The tunable lasers available on SIRCUS are used to<br />
characterize a spectrograph’s response for stray<br />
light. Figure 16 is a semilogarithm plot <strong>of</strong> spectra<br />
acquired from a spectrograph with excitation wavelengths<br />
ranging from 350 to 800 nm. Each spectrum<br />
is a single image normalized by the peak value. The<br />
strong central peak in each image (or spectrum) in<br />
Fig. 16 corresponds to the image <strong>of</strong> the entrance slit<br />
formed on the detector array. The broad shoulder <strong>and</strong><br />
finite baseline are signals from radiation that is not<br />
10 November 2006 � Vol. 45, No. 32 � APPLIED OPTICS 8233
Fig. 16. Spectrograph images as the incident wavelength is<br />
changed <strong>and</strong> the central image moves across the array.<br />
properly imaged onto the detector, i.e., from stray<br />
light within the spectrograph. By measuring the system<br />
response at a number <strong>of</strong> wavelengths, the evolution<br />
<strong>of</strong> the image as the excitation wavelength moves<br />
across the array can be determined. Based on these<br />
measurements, a stray light correction algorithm can<br />
be implemented that reduces the errors <strong>and</strong> associated<br />
uncertainties arising from stray light an order <strong>of</strong><br />
magnitude or more. 47,65,66 For an accurate characterization<br />
<strong>of</strong> spectrometers for this correction, the input<br />
optics must be illuminated by uniform monochromatic<br />
radiation at many wavelengths in irradiance<br />
or radiance mode. The SIRCUS facility is effectively<br />
utilized to achieve the necessary measurements.<br />
C. Solar Irradiance<br />
Sun photometers are filter radiometers used to determine<br />
atmospheric optical properties at different wavelengths.<br />
Primary st<strong>and</strong>ard reference sun photometers<br />
are calibrated at high altitudes by using the Langley–<br />
Bouguer technique. In this calibration approach, a series<br />
<strong>of</strong> measurements at different solar zenith angles<br />
are made over the course <strong>of</strong> a day, giving a range <strong>of</strong><br />
measured signals as a function <strong>of</strong> zenith angle (or air<br />
mass). The measurements are then extrapolated back<br />
to zero air mass, giving an instrument signal corresponding<br />
to the expected signal in the absence <strong>of</strong> any<br />
intervening atmosphere. 67 Reductions in the uncertainties<br />
in irradiance responsivity calibrations <strong>of</strong><br />
primary st<strong>and</strong>ard reference Sun photometers using<br />
laboratory st<strong>and</strong>ards would allow for meaningful com-<br />
8234 APPLIED OPTICS � Vol. 45, No. 32 � 10 November 2006<br />
parisons with the results from the Langley–Bouguer<br />
method, resulting in independent values for the exoatmospheric<br />
solar irradiance at the set <strong>of</strong> measurement<br />
wavelengths.<br />
Global networks <strong>of</strong> Sun photometers are used to<br />
provide detailed mapping <strong>of</strong> atmosphere optical<br />
properties, for example, aerosol concentrations <strong>and</strong><br />
distributions. Sun photometers that are part <strong>of</strong><br />
the Aerosol Robotic Network 68 (AERONET) are calibrated<br />
for irradiance responsivity against reference<br />
primary st<strong>and</strong>ard Sun photometers using the<br />
cross-calibration technique at the NASA Goddard<br />
Space Flight Center (GSFC). 67 The cross-calibration<br />
technique consists <strong>of</strong> near-simultaneous solar observations<br />
with the uncalibrated instrument <strong>and</strong> a<br />
calibrated reference Sun photometer. Reducing the uncertainties<br />
in network instruments by using laboratory<br />
st<strong>and</strong>ards would validate the uncertainties in the<br />
calibration transfer <strong>and</strong> could improve the characterization<br />
<strong>of</strong> the atmosphere.<br />
Because Sun photometers measure solar irradiance,<br />
their responsivity is typically low, <strong>and</strong> they are<br />
difficult to calibrate using lamp–monochromator systems.<br />
To demonstrate the feasibility <strong>of</strong> calibrating<br />
Sun photometers on SIRCUS, two multichannel Sun<br />
photometers were calibrated <strong>and</strong> the results compared<br />
with st<strong>and</strong>ard cross calibrations. 69 To compare<br />
the cross-calibration results to the SIRCUS calibrations,<br />
the SIRCUS-derived irradiance responsivities<br />
s(�) were used to predict a top-<strong>of</strong>-the-atmosphere<br />
(TOA) signal V o�SIRCUS�:<br />
V o�SIRCUS� ��s���E���d�, (7)<br />
where s��� is the spectral responsivity <strong>of</strong> one <strong>of</strong> the<br />
radiometer channels <strong>and</strong> E��� is an exoatmospheric<br />
solar irradiance spectrum. In this work we used the<br />
exoatmospheric solar irradiance spectrum developed<br />
by Thuillier et al. 70 To perform the integration, the<br />
s��� <strong>and</strong> the E��� were interpolated to a uniform<br />
wavelength interval <strong>of</strong> 0.25 nm <strong>and</strong> integrated. The<br />
750 nm channel results agreed with the cross calibration<br />
to within 0.15%, the 490 nm channel to within<br />
0.85%, <strong>and</strong> the 440 nm channel to within 5.76%.<br />
The dominant source <strong>of</strong> uncertainty in the SIRCUSbased<br />
predicted TOA signal was the uncertainty in the<br />
solar irradiance spectrum. Assuming an �1.5% combined<br />
st<strong>and</strong>ard uncertainty in the absolute value <strong>and</strong><br />
given a step size <strong>of</strong> 1 nm in the region <strong>of</strong> interest, we<br />
were able to validate the cross calibration with an<br />
exp<strong>and</strong>ed uncertainty �k � 2� <strong>of</strong> �4%. The agreement<br />
for the 490 <strong>and</strong> 750 nm channels were within the<br />
combined uncertainties, but the 440 nm results were<br />
not <strong>and</strong> warrant further investigation.<br />
The measurements demonstrated that SIRCUS irradiance<br />
levels were high enough to calibrate Sun<br />
photometers. Current uncertainties in the exoatmospheric<br />
solar irradiance depend on the wavelength,<br />
but in atmospheric transmittance windows in the vis-
ible spectral region, they are estimated to be approximately<br />
0.5% to 1%. Calibration <strong>of</strong> primary st<strong>and</strong>ard<br />
Sun photometers on SIRCUS with 0.1% uncertainties<br />
or less would enable us to differentiate between<br />
exoatmospheric solar irradiance spectra <strong>and</strong> could<br />
lead to a reduction in the uncertainties in the exoatmospheric<br />
solar irradiance spectrum. This has implications<br />
for global climate change studies because the<br />
exoatmospheric solar irradiance is one <strong>of</strong> the primary<br />
forcing functions driving the global climate.<br />
Additional applications include the development<br />
<strong>of</strong> wavelength st<strong>and</strong>ard reference materials with reduced<br />
uncertainty 71 <strong>and</strong> the characterization <strong>and</strong> calibration<br />
<strong>of</strong> instruments with large entrance pupils,<br />
such as telescopes <strong>and</strong> remote-sensing sensors. 72<br />
6. Summary<br />
We have described a laser-based calibration facility for<br />
irradiance- <strong>and</strong> radiance-measuring instruments. In<br />
this facility, high-power tunable lasers were introduced<br />
into integrating spheres by using optical fibers,<br />
producing uniform, quasi-Lambertian, highly radiant<br />
flux sources. Reference st<strong>and</strong>ard irradiance detectors,<br />
calibrated directly against national primary st<strong>and</strong>ards<br />
for spectral power responsivity, were used to determine<br />
the irradiance at a reference plane. Instruments<br />
were calibrated directly in irradiance or radiance mode<br />
with uncertainties approaching or lower than those<br />
available for spectral power responsivity calibrations<br />
in traditional lamp–monochromator facilities. The<br />
implications for fundamental radiometric measurements,<br />
including radiance temperature, photometric,<br />
<strong>and</strong> synchrotron source measurements, were described.<br />
Finally, advanced applications to realize the<br />
first detector-based color scale, to correct stray light in<br />
spectrographs, <strong>and</strong> to measure solar irradiance by using<br />
this facility were briefly outlined.<br />
Work continues on reducing the uncertainties associated<br />
with measurements on SIRCUS as well as the<br />
spectral coverage <strong>and</strong> laser powers available. In Table<br />
1 we calculated the uncertainty in the irradiance responsivity<br />
at a single wavelength. In practice, in determining<br />
the uncertainty in measuring the irradiance<br />
<strong>of</strong> a source by using a filter radiometer as an example,<br />
the responsivity was integrated over a wavelength<br />
range. The irradiance responsivity was determined<br />
for a large number <strong>of</strong> wavelengths, typically 100 or<br />
more, over the in-b<strong>and</strong> range. Calculating the b<strong>and</strong>integrated<br />
responsivity, the r<strong>and</strong>om components in the<br />
uncertainty budget were reduced by the square root <strong>of</strong><br />
the number <strong>of</strong> measurements, <strong>and</strong> only systematic<br />
components in the uncertainty budget contributed to<br />
the uncertainty in the measurement. We have neglected<br />
the reduction in the uncertainty from integrating<br />
the responsivity over a finite number <strong>of</strong> elements.<br />
The spectral coverage <strong>of</strong> the SIRCUS facility for<br />
spectral responsivity calibrations is determined by<br />
the high-reflectance range <strong>of</strong> the coating <strong>of</strong> the integrating<br />
sphere sources, the wavelength coverage <strong>of</strong><br />
the st<strong>and</strong>ard reference <strong>and</strong> monitor detectors, <strong>and</strong><br />
the spectral coverage <strong>of</strong> the tunable laser systems.<br />
Spectralon <strong>and</strong> similar PTFE-based coatings have<br />
high reflectance from 250 to 2500 nm. The spectral<br />
coverage <strong>of</strong> the UV–Vis–NIR SIRCUS facility has<br />
been extended into the UV <strong>and</strong> the short-wave infrared<br />
(SWIR) regions with the integration <strong>of</strong> a quasicontinuous-wave,<br />
mode-locked OPO–sum-frequency<br />
system. This system gave us nearly continuous tunability<br />
from 210 to 3.0 �m.<br />
Research is being conducted on reference detectors<br />
to extend the radiant power responsivity scale<br />
from 350 down to 200 nm <strong>and</strong> from 1 out to 2.5 �m<br />
<strong>and</strong> beyond. Reference UV reflectance-type trap detectors<br />
using nitride-passivated UVG-100 diodes73 as<br />
well as PIN-UV100 diodes73 have been developed to<br />
extend the wavelength coverage from 350 down to<br />
200 nm. Recently, a UV trap detector was calibrated<br />
for radiant power responsivity over the spectral<br />
range from 210 to 400 nm with an exp<strong>and</strong>ed uncertainty<br />
�k � 2� <strong>of</strong> 0.05% or less. Finally, a variety <strong>of</strong><br />
irradiance-measuring working st<strong>and</strong>ard radiometers<br />
have been developed for the NIR range, including<br />
single-element Ge, InGaAs, <strong>and</strong> extended InGaAs detectors.<br />
74,75 With their calibration against an ACR,<br />
the low uncertainty in the SIRCUS irradiance scale<br />
will be extended into the IR spectral range.<br />
The authors thank the U.S. Air Force Metrology for<br />
funding this work under contract 98-435. They also<br />
acknowledge the early <strong>and</strong> continued support <strong>of</strong> John<br />
Grangaard, USAF (ret.) <strong>and</strong> the significant contributions<br />
to the work by B. Carol Johnson, Howard Yoon,<br />
Yuqin Zong, Thomas C. Larason, C. Cameron Miller,<br />
<strong>and</strong> Ping-Shine Shaw from the <strong>NIST</strong> Optical Technology<br />
Division.<br />
References<br />
1. T. C. Larason, S. S. Bruce, <strong>and</strong> A. C. Parr, Spectroradiometric<br />
Detector Measurements (U.S. Government Printing Office,<br />
1998).<br />
2. T. R. Gentile, J. M. Houston, J. E. Hardis, C. L. Cromer, <strong>and</strong><br />
A. C. Parr, “<strong>National</strong> <strong>Institute</strong> <strong>of</strong> <strong>St<strong>and</strong>ards</strong> <strong>and</strong> Technology<br />
high-accuracy cryogenic radiometer,” Appl. Opt. 35, 1056–<br />
1068 (1996).<br />
3. T. R. Gentile, J. M. Houston, <strong>and</strong> C. L. Cromer, “Realization<br />
<strong>of</strong> a scale <strong>of</strong> absolute spectral response using the <strong>NIST</strong> highaccuracy<br />
cryogenic radiometer,” Appl. Opt. 35, 4392–4403<br />
(1996).<br />
4. G. Eppeldauer, M. Racz, <strong>and</strong> T. Larason, “Optical characterization<br />
<strong>of</strong> diffuser-input st<strong>and</strong>ard irradiance meters,” in Proc.<br />
SPIE 3573, 220–224 (1998).<br />
5. O. G. Peterson, S. A. Tuccio, <strong>and</strong> B. B. Snavely, “cw operation<br />
<strong>of</strong> an organic dye solution laser,” Appl. Phys. Lett. 17, 245–247<br />
(1970).<br />
6. J. M. Yarborough, “cw dye laser emission spanning the visible<br />
spectrum,” Appl. Phys. Lett. 24, 629–630 (1974).<br />
7. A. R. Schaefer <strong>and</strong> K. L. Eckerle, “Spectrophotometric tests<br />
using a dye-laser-based radiometric characterization facility,”<br />
Appl. Opt. 23, 250–256 (1984).<br />
8. A. R. Schaefer, R. D. Saunders, <strong>and</strong> L. R. Hughey, “Intercomparison<br />
between independent irradiance scales based on silicon<br />
photodiodes physics, gold-point blackbody radiation, <strong>and</strong><br />
synchrotron radiation,” Opt. Eng. 25, 892–896 (1986).<br />
9. K. D. Mielenz, R. D. Saunders, <strong>and</strong> J. B. Shumaker, “Spectroradiometric<br />
determination <strong>of</strong> the freezing temperature <strong>of</strong> gold,”<br />
J. Res. Natl. Inst. St<strong>and</strong>. Technol. 95, 49–67 (1990).<br />
10. N. P. Fox, J. E. Martin, <strong>and</strong> D. H. Nettleton, “Absolute spectral<br />
10 November 2006 � Vol. 45, No. 32 � APPLIED OPTICS 8235
adiometric determination <strong>of</strong> the thermodynamic temperatures<br />
<strong>of</strong> the melting�freezing points <strong>of</strong> gold, silver, <strong>and</strong> aluminium,”<br />
Metrologia 28, 357–374 (1991).<br />
11. V. E. Anderson, N. P. Fox, <strong>and</strong> D. H. Nettleton, “Highly stable,<br />
monochromatic <strong>and</strong> tunable optical radiation source <strong>and</strong> its<br />
application to high accuracy spectrophotometry,” Appl. Opt.<br />
31, 536–545 (1992).<br />
12. M. Noorma, P. Toivanen, F. Manoocheri, <strong>and</strong> E. Ikonen, “Characterization<br />
<strong>of</strong> filter radiometers with a wavelength-tunable<br />
laser source,” Metrologia 40, S220–S223 (2003).<br />
13. A. Sperling, Physikalisch-Technische Bundesanstalt, Braunschweig,<br />
Germany (personal communication, 2005).<br />
14. J. M. Houston <strong>and</strong> J. P. Rice, “<strong>NIST</strong> reference cryogenic radiometer<br />
designed for versatile performance,” Metrologia 43,<br />
S31–S35 (2006).<br />
15. L-1 <strong>St<strong>and</strong>ards</strong> <strong>and</strong> Technology, Ijamsville, Md.<br />
16. D. J. Pugh <strong>and</strong> K. Jackson, “Automatic gauge block measurement<br />
using multiple wavelength interferometry,” in Proc.<br />
SPIE 656, 244–250 (1986).<br />
17. T. F. Johnston, R. H. Brady, <strong>and</strong> W. Pr<strong>of</strong>fitt, “Powerful singlefrequency<br />
ring dye laser spanning the visible spectrum,” Appl.<br />
Opt. 21, 2307–2316 (1982).<br />
18. T. F. Johnston, “Lasers, dye,” in Encyclopedia <strong>of</strong> Physical Science<br />
<strong>and</strong> Technology, R. A. Meyers, ed. (Academic, 2002), pp.<br />
315–359.<br />
19. L. E. Jusinski <strong>and</strong> C. A. Taatjes, “Efficient <strong>and</strong> stable operation<br />
<strong>of</strong> an Ar�-pumped continuous-wave ring laser from 505–560<br />
nm using a coumarin dye,” Rev. Sci. Instrum 72, 2837–2838<br />
(2001).<br />
20. P. F. Moulton, “Spectroscopic <strong>and</strong> laser characteristics <strong>of</strong><br />
Ti:Al 2O 3,” J. Opt. Soc. Am. B 3, 125–133 (1986).<br />
21. Spectra-Physics, Inc., Wavetrain frequency doubler with a Coherent,<br />
Inc. Model 899 Ti:sapphire laser.<br />
22. W.-L. Zhou, Y. Mori, T. Sasaki, S. M. Nakai, K. Nakano, S.<br />
Niikura, <strong>and</strong> B. Craig, “Intracavity frequency doubling <strong>of</strong> a<br />
continuous wave Ti:sapphire laser with over 70% conversion<br />
efficiency,” Appl. Phys. Lett. 66, 2463–2465 (1995).<br />
23. T. R. Gentile <strong>and</strong> C. L. Cromer, “Mode-locked lasers for highaccuracy<br />
radiometry,” Metrologia 32, 585–587 (1996).<br />
24. W. S. Hartree, P. R. Haycocks, <strong>and</strong> N. P. Fox, “The use <strong>of</strong> a<br />
mode-locked laser for ultraviolet radiometry,” Metrologia 35,<br />
339–343 (1998).<br />
25. J. Fowler <strong>and</strong> M. Litorja, “Geometric area measurements <strong>of</strong><br />
circular apertures for radiometry at <strong>NIST</strong>,” Metrologia 40,<br />
S9–S12 (2003).<br />
26. Spectralon, Labsphere, Inc., No. Sutton, N.H.<br />
27. E. A. Early, B. C. Bush, S. W. Brown, D. W. Allen, <strong>and</strong> B. C.<br />
Johnson, “Radiometric calibration <strong>of</strong> the Scripps Earth<br />
Polychromatic Imaging Camera,” in Proc. SPIE 4483, 77–84<br />
(2001).<br />
28. T. Stone, U.S. Geological Survey, Flagstaff, Ariz., (personal<br />
communication, 2005).<br />
29. E. F. Zalewski <strong>and</strong> C. R. Duda, “Silicon photodiode device with<br />
100% external quantum efficiency,” Appl. Opt. 22, 2867–2873<br />
(1983).<br />
30. Hamamatsu, “Photodiodes,” Catalog 1990-91, 16.<br />
31. G. P. Eppeldauer <strong>and</strong> D. C. Lynch, “Opto-mechanical <strong>and</strong> electronic<br />
design <strong>of</strong> a tunnel-trap Si- radiometer,” J. Res. Natl.<br />
Inst. St<strong>and</strong>. Technol. 105, 813–828 (2000).<br />
32. G. Eppeldauer, “Noise-optimized silicon radiometers,” J. Res.<br />
Natl. Inst. St<strong>and</strong>. Technol. 105, 209–219 (2000).<br />
33. Guide to the Expression <strong>of</strong> Uncertainty in Measurement (International<br />
Organization for St<strong>and</strong>ardization, Geneva, 1993).<br />
34. J. L. Gardner, “Correlated color temperature-uncertainty <strong>and</strong><br />
estimation,” Metrologia 37, 381–384 (2000).<br />
35. J. L. Gardner, “Correlations in primary spectral st<strong>and</strong>ards,”<br />
Metrologia 40, S167–S176 (2003).<br />
36. K. R. Lykke, P.-S. Shaw, L. M. Hanssen, <strong>and</strong> G. P. Eppeldauer,<br />
8236 APPLIED OPTICS � Vol. 45, No. 32 � 10 November 2006<br />
“Development <strong>of</strong> a monochromatic, uniform source facility for<br />
calibration <strong>of</strong> radiance <strong>and</strong> irradiance detectors from 0.2 micrometer<br />
to 12 micrometer,” Metrologia 35, 479–484 (1998).<br />
37. G. Eppeldauer <strong>and</strong> J. E. Hardis, “Fourteen-decade photocurrent<br />
measurements with large-area silicon photodiodes at<br />
room temperature,” Appl. Opt. 30, 3091–3099 (1991).<br />
38. G. Eppeldauer, M. Racz, <strong>and</strong> L. M. Hanssen, “Spectral responsivity<br />
determination <strong>of</strong> a transfer-st<strong>and</strong>ard pyroelectric radiometer,”<br />
in Proc. SPIE 4818, 118–126 (2002).<br />
39. G. P. Eppeldauer, S. W. Brown, T. C. Larason, M. Racz, <strong>and</strong><br />
K. R. Lykke, “Realization <strong>of</strong> a spectral radiance responsivity<br />
scale with a laser-based source <strong>and</strong> Si radiance meters,”<br />
Metrologia 37, 531–534 (2000).<br />
40. Burgthaler Electronik GmbH.<br />
41. KaleidaGraph, Synergy S<strong>of</strong>tware, Reading, Pa.<br />
42. J. H. Walker, R. D. Saunders, J. K. Jackson, <strong>and</strong> D. A. Mc-<br />
Sparron, Spectral Irradiance Calibrations (U.S. Government<br />
Printing Office, 1987).<br />
43. G. Eppeldauer, Optical Radiation Measurement with Selected<br />
Detectors <strong>and</strong> Matched Electronic Circuits between 200 nm <strong>and</strong><br />
20 �m (U.S. Government Printing Office, 2001).<br />
44. Stanford Research Systems model SR570 or home built.<br />
45. Hewlett Packard Model HP3458A.<br />
46. C. E. Gibson, B. K. Tsai, <strong>and</strong> A. C. Parr, Radiance Temperature<br />
Calibrations (U.S. Government Printing Office, 1998).<br />
47. S. W. Brown, D. K. Clark, B. C. Johnson, H. W. Yoon, K. R.<br />
Lykke, S. J. Flora, M. E. Feinholz, M. A. Yarbrough, R. A.<br />
Barnes, Y. S. Kim, T. Stone, <strong>and</strong> J. Mueller, eds., Advances in<br />
Radiometry for Ocean Color (NASA, 2004).<br />
48. H. Preston-Thomas, “The international temperature scale <strong>of</strong><br />
1990 (ITS-90),” Metrologia 27, 3–10 (1990).<br />
49. D. Halliday <strong>and</strong> R. Resnick, Fundamentals <strong>of</strong> Physics (Wiley,<br />
1981).<br />
50. H. W. Yoon, D. W. Allen, C. E. Gibson, R. D. Saunders, B. C.<br />
Johnson, S. W. Brown, <strong>and</strong> K. R. Lykke, “Temperature scales<br />
using radiation thermometers calibrated from absolute irradiance<br />
<strong>and</strong> radiance responsivity,” in NCSL International Workshop<br />
<strong>and</strong> Symposium (Orl<strong>and</strong>o, Fla., 2003).<br />
51. D. W. Allen, R. D. Saunders, B. C. Johnson, C. E. Gibson, <strong>and</strong><br />
H. W. Yoon, “The development <strong>and</strong> characterization <strong>of</strong> an<br />
absolute pyrometer calibrated for radiance responsivity,” in<br />
International Temperature Symposium (Chicago, Ill., 2003).<br />
52. H. W. Yoon, C. E. Gibson, D. W. Allen, R. D. Saunders,<br />
M. Litorja, S. W. Brown, G. P. Eppeldauer, <strong>and</strong> K. R. Lykke,<br />
“The realization <strong>and</strong> the dissemination <strong>of</strong> the detector-based<br />
kelvin,” in Proceedings <strong>of</strong> Tempmeko 04 (Dubrovnik, Croatia,<br />
2004).<br />
53. H. W. Yoon, C. E. Gibson, <strong>and</strong> P. Y. Barnes, “Realization <strong>of</strong><br />
the <strong>National</strong> <strong>Institute</strong> <strong>of</strong> <strong>St<strong>and</strong>ards</strong> <strong>and</strong> Technology detectorbased<br />
spectral irradiance scale,” Appl. Opt. 41, 5879–5890<br />
(2002).<br />
54. Principles Governing Photometry (Bureau International des<br />
Poids et Mesures, 1983).<br />
55. R. L. Booker <strong>and</strong> D. A. McSparron, Photometric Calibrations<br />
(U.S. Government Printing Office, 1987).<br />
56. C. L. Cromer, G. Eppeldauer, J. E. Hardis, T. Larason, <strong>and</strong><br />
A. C. Parr, “<strong>National</strong> <strong>Institute</strong> <strong>of</strong> <strong>St<strong>and</strong>ards</strong> <strong>and</strong> Technology<br />
detector-based photometric scales,” Appl. Opt. 32, 2936–2948<br />
(1993).<br />
57. Y. Ohno, <strong>NIST</strong> Measurement Services: Photometric Calibrations<br />
(U.S. Government Printing Office, 1997).<br />
58. G. P. Eppeldauer <strong>and</strong> M. Racz, “Design <strong>and</strong> characterization <strong>of</strong><br />
a photometer-colorimeter st<strong>and</strong>ard,” Appl. Opt. 43, 2621–2631<br />
(2004).<br />
59. G. P. Eppeldauer, S. W. Brown, C. C. Miller, <strong>and</strong> K. R. Lykke,<br />
“Improved accuracy photometric <strong>and</strong> tristimulus-color scales<br />
based on spectral irradiance responsivity,” Proceedings <strong>of</strong> the
25th Session <strong>of</strong> the Commission Internationale de l’Eclairage,<br />
Vol. 1, pp. D2-30–D32-33 (2003).<br />
60. J. Schwinger, “On the classical radiation <strong>of</strong> accelerated<br />
electrons,” Phys. Rev. 75, 1912–1925 (1949).<br />
61. P.-S. Shaw, U. Arp, H. W. Yoon, R. D. Saunders, A. C. Parr,<br />
<strong>and</strong> K. R. Lykke, “A SURF beamline for synchrotron sourcebased<br />
radiometry,” Metrologia 40, S124–S127 (2003).<br />
62. R. McCluney, Introduction to Radiometry <strong>and</strong> Photometry<br />
(Artech House, 1994).<br />
63. J. D. Sch<strong>and</strong>a, “Colorimetry,” in H<strong>and</strong>book <strong>of</strong> Applied Photometry,<br />
C. DeCusatis, ed. (Springer, 1998), pp. 327–412.<br />
64. G. P. Eppeldauer, “Spectral response based calibration method<br />
<strong>of</strong> tristimulus colorimeters,” J. Res. Natl. Inst. St<strong>and</strong>. Technol.<br />
103, 615–619 (1998).<br />
65. S. W. Brown, B. C. Johnson, M. E. Feinholz, M. A. Yarborough,<br />
S. J. Flora, K. R. Lykke, <strong>and</strong> D. K. Clark, “Stray-light correction<br />
algorithm for spectrographs,” Metrologia 40, S81–S84<br />
(2003).<br />
66. Y. Zong, S. W. Brown, K. R. Lykke, <strong>and</strong> Y. Ohno, “A simple<br />
spectral stray light correction method for array spectroradiometers,”<br />
Appl. Opt. 45, 1111–1119 (2006).<br />
67. C. Pietras, M. Miller, R. Frouin, E. J. Welton, <strong>and</strong> I. Slutsker,<br />
“Calibration <strong>of</strong> sun photometers <strong>and</strong> sky radiance sensors,” in<br />
In Situ Aerosol Optical Thickness Collected by the SIMBIOS<br />
Program (1997–2000): Protocols, Data QC, <strong>and</strong> Analysis,<br />
R. B. G. S. Fargion <strong>and</strong> C. McClain, eds. (NASA Goddard Space<br />
Flight Center, 2001).<br />
68. B. N. Holben, T. F. Eck, I. Slutsker, D. Tanre, J. P. Buis, A.<br />
Setzer, E. Vermote, J. A. Reagan, Y. J. Kaufman, T. Nakajima,<br />
F. Leaven, I. Jankowiak, <strong>and</strong> A. Smirnov, “Aeronet—a federated<br />
instrument network <strong>and</strong> data archive for aerosol characterization,”<br />
Remote Sens. Environ. 66, 1–16 (1998).<br />
69. N. Souaidia, C. Pietras, G. Fargion, R. A. Barnes, R. Frouin,<br />
K. R. Lykke, B. C. Johnson, <strong>and</strong> S. W. Brown, “Comparison <strong>of</strong><br />
laser-based <strong>and</strong> conventional calibrations <strong>of</strong> sun photometers,”<br />
in Proc. SPIE 4481, 61–72 (2003).<br />
70. G. Thuillier, M. Herse, T. Foujots, W. Peetermans, W. Gillotay,<br />
P. C. Simon, <strong>and</strong> H. M<strong>and</strong>e, “The solar spectral irradiance<br />
from 200 to 2400 nm as measured by the SOLSPEC spectrometer<br />
from the ATLAS <strong>and</strong> EUREKA missions,” Sol. Phys. 214,<br />
1–22 (2003).<br />
71. E. A. Early, <strong>NIST</strong>, Gaithersburg, Md. (personal communication,<br />
2005).<br />
72. T. Stone, U.S. Geological Survey, Flagstaff, Ariz. (personal<br />
communication, 2005).<br />
73. R. Korde, International Radiation Detectors, Inc., Torrance,<br />
Calif. (personal communication, 2005).<br />
74. G. Eppeldauer, “Near infrared radiometer st<strong>and</strong>ards,” in Proc.<br />
SPIE 2815, 42–54 (1996).<br />
75. G. Eppeldauer, “Electronic characteristics <strong>of</strong> Ge <strong>and</strong> InGaAs<br />
radiometers,” in Proc. SPIE 3061-97, 833–838 (1997).<br />
10 November 2006 � Vol. 45, No. 32 � APPLIED OPTICS 8237
Radiometer st<strong>and</strong>ard for absolute responsivity calibrations from 950 nm to 1650 nm<br />
with 0.05 % (k=2) uncertainty<br />
Abstract<br />
G. P. Eppeldauer, H. W. Yoon, Y. Zong, T. C. Larason, A. Smith, <strong>and</strong> M. Racz<br />
<strong>National</strong> <strong>Institute</strong> <strong>of</strong> <strong>St<strong>and</strong>ards</strong> <strong>and</strong> Technology<br />
Gaithersburg, Maryl<strong>and</strong> USA<br />
A near-IR radiometer st<strong>and</strong>ard with similar performance to silicon trap-detectors has been<br />
developed to calibrate detectors <strong>and</strong> radiometers for absolute spectral power, irradiance,<br />
<strong>and</strong> radiance responsivities between 950 nm <strong>and</strong> 1650 nm. The new radiometer st<strong>and</strong>ard<br />
is utilized at the Spectral Irradiance <strong>and</strong> Radiance Responsivity Calibrations using<br />
Uniform Sources (SIRCUS) which is the reference calibration facility <strong>of</strong> <strong>NIST</strong> for<br />
absolute responsivity. The radiometer is a sphere-detector with a unique geometrical<br />
arrangement <strong>and</strong> it can convert the radiant-power responsivity scale <strong>of</strong> the primaryst<strong>and</strong>ard<br />
cryogenic-radiometer into a reference irradiance responsivity scale. The 0.05 %<br />
(k=2) scale conversion uncertainty is dominated by the two largest uncertainty<br />
components <strong>of</strong> the radiometer: The spatial non-uniformity <strong>of</strong> responsivity <strong>of</strong> less than<br />
0.05 % in power mode <strong>and</strong> the 0.03 % angular responsivity deviation from the cosine<br />
function in a five-degree angular range in irradiance mode. These small uncertainty<br />
components are the results <strong>of</strong> a tilted input aperture (relative to the sphere-axis) <strong>and</strong> four<br />
symmetrically positioned InGaAs detectors around the incident beam-spot in the sphere.<br />
With the new radiometer st<strong>and</strong>ard, it is expected that a thermodynamic temperature<br />
uncertainty <strong>of</strong> 10 mK (k=2) can be achieved at 157 o C the freeze temperature <strong>of</strong> the In<br />
fixed point blackbody.<br />
1. Introduction<br />
The primary basis <strong>of</strong> modern radiometry is the measurement <strong>of</strong> optical power with a<br />
cryogenic electrical-substitution radiometer. The spectroradiometric quantities such as<br />
spectral irradiance <strong>and</strong> spectral radiance can be derived from the primary power<br />
measurements. However, the derivation <strong>of</strong> the spectroradiometric quantities from optical<br />
power requires the use <strong>of</strong> spatially-uniform <strong>and</strong> Lambertian detectors. These detectors<br />
serve as power-to-irradiance converters. In the visible <strong>and</strong> near-infrared wavelength<br />
regions, up to 960 nm, silicon trap detectors, introduced in 1983 [1], are the lowest<br />
uncertainty transfer st<strong>and</strong>ards. Using these silicon reference detectors, 0.06 % (k=2)<br />
uncertainty can be achieved in irradiance measurement mode [2]. In the near-infrared<br />
(NIR) region, between 950 nm <strong>and</strong> 1650 nm, where the use <strong>of</strong> Si detectors is not possible,<br />
trap detectors using either Ge or InGaAs photodiodes have been constructed [3, 4]. Since<br />
the Ge or InGaAs photodiodes have much smaller shunt resistances than Si, the<br />
combinations <strong>of</strong> large area, NIR diodes in parallel electrical connections have resulted in<br />
low shunt resistance devices with much worse radiometric <strong>and</strong> electronic performances<br />
than Si trap detectors [5]. Also, the spatial non-uniformity <strong>of</strong> the internal-quantumefficiency<br />
limited their power measurement uncertainties to about 0.3 % (k=2).
Another approach to obtain detectors with high spatial uniformity <strong>and</strong> Lambertian<br />
angular responsivity is to utilize an integrating sphere as the input to detectors which are<br />
directly attached to the sphere. Previous designs using InGaAs photodiodes have utilized<br />
either a single photodiode placed perpendicularly from the entrance aperture or multiple<br />
diodes facing the sphere center [6, 7].<br />
Among other applications, the need for low-uncertainty radiance responsivity calibrations<br />
is driven by the possible thermodynamic temperature realizations in the near-infrared<br />
wavelength region where a 0.05 % (k=2) absolute radiance responsivity uncertainty is<br />
needed to achieve a 10 mK (k=2) uncertainty in the measurement <strong>of</strong> the In-point freezing<br />
blackbody at 157 o C. In the last 25 years, these low uncertainty requirements could not be<br />
achieved with regular near-IR detectors; it was possible only with silicon trap detectors<br />
up to 960 nm. In order to achieve this low uncertainty in the near-IR, a new type <strong>of</strong><br />
power-to-irradiance converting radiometer st<strong>and</strong>ard is needed that will not limit the<br />
uncertainty <strong>of</strong> the spectral responsivity propagation from the primary st<strong>and</strong>ard cryogenic<br />
radiometer. This new radiometer will be the reference detector <strong>of</strong> the Spectral Irradiance<br />
<strong>and</strong> Radiance Responsivity Calibrations using Uniform Sources (SIRCUS) facility for the<br />
near-IR range where up until now these low uncertainty spectral responsivity calibrations<br />
could not be performed.<br />
We describe the design <strong>and</strong> characterization <strong>of</strong> a novel near-IR radiometer transferst<strong>and</strong>ard<br />
that makes it possible to perform spectral power <strong>and</strong> irradiance responsivity<br />
calibrations with uncertainties lower than 0.05 % (k=2).<br />
2. Preliminary sphere-detector experiments<br />
For spatial <strong>and</strong> angular responsivity tests, a Ge radiometer was attached to the exit port <strong>of</strong><br />
a 5 cm diameter Spectralon # coated integrating sphere with 90 o angle between the<br />
entrance <strong>and</strong> exit ports. The spatial uniformity <strong>of</strong> this simple (no baffles) <strong>and</strong> asymmetric<br />
Ge sphere-detector with an 8 mm diameter input-aperture is shown in Fig. 1. The aperture<br />
plane was (traditionally) normal to the sphere-axis. The obtained maximum nonuniformity<br />
is 0.6 % at 1500 nm using a 1.1 mm diameter scanning beam with 0.5 mm<br />
increments. The poor uniformity is caused by the asymmetric arrangement <strong>of</strong> the sphere<br />
input <strong>and</strong> output ports.<br />
The angular responsivity test was performed with the same sphere-detector arrangement,<br />
but the sphere-aperture diameter was decreased to 3.5 mm to obtain improved sphere<br />
performance <strong>and</strong> better Lambertian angular response. First, as in traditional spheredetector<br />
designs, the aperture plane was normal (0 o tilt) to the sphere optical axis. The<br />
incident beam was produced by an FEL lamp, located 3 m away from the detector. As<br />
shown in Fig. 2, at 0 o tilt (see legend), the angular response curve is flattened around the<br />
0 o incidence angle because part <strong>of</strong> the reflected incident beam escaped through the<br />
entrance aperture <strong>of</strong> the sphere. The curve normalization was performed at the 0 o<br />
incidence angle. As a result <strong>of</strong> this problem, the angular responsivity is different from the<br />
cosine function, the ideal angular responsivity <strong>of</strong> detector irradiance measurements. The
difference from the cosine is about 0.2 % at + 4 o <strong>and</strong> - 4 o incidence angles. The structures<br />
within the response curve are dominated by lamp instabilities.<br />
-6<br />
-4<br />
-2<br />
0<br />
mm 2<br />
4<br />
6<br />
-6<br />
-4<br />
-2<br />
0<br />
mm<br />
2<br />
4<br />
6<br />
1.010<br />
1.005<br />
1.000<br />
0.995<br />
0.990<br />
Relative Responsivity<br />
Fig. 1. Spatial uniformity <strong>of</strong> responsivity <strong>of</strong> a traditional Ge sphere detector at 1500 nm.<br />
In the following steps, the angular responses <strong>of</strong> the Ge sphere-detector were measured at<br />
different aperture tilt-angles (between the normal <strong>of</strong> the aperture-plane <strong>and</strong> the sphereaxis).<br />
The tilt-angles were increased to check if the angular response relative to the above<br />
measurement (at 0 o tilt) can be improved. The incidence angle (x-axis) was changed as<br />
above, by rotating the sphere-detector around the center <strong>of</strong> the sphere-aperture. During<br />
these angular response scans, the sphere-detector was rotated in a plane perpendicular to<br />
the plane where the entrance <strong>and</strong> the exit ports are. The normal <strong>of</strong> the aperture plane was<br />
increased from 0 o (relative to the sphere axis) to 18 o in increments shown in Fig. 2.<br />
During the angular response tests, at all tilt angles, the incident beam (at the 0 o incidence<br />
angle) was always perpendicular to the plane <strong>of</strong> the input aperture. The measured<br />
response curves are shown in a +/- 10 o range <strong>of</strong> the incidence angle. At a large enough<br />
tilt-angle <strong>of</strong> the aperture plane (relative to the sphere axis), the angular response curve<br />
becomes similar to the cosine function. For aperture-plane tilt angles <strong>of</strong> 12 o <strong>and</strong> 18 o , the<br />
first specular reflection from the sphere wall could not escape from the sphere (as it<br />
happened at 0 o tilt) therefore the normalized responses do not show a suppressed cosine<br />
curve anymore. The reason <strong>of</strong> the slight angular shift relative to the cosine function is a<br />
close to 1 o alignment error in the rotation <strong>of</strong> the sphere-detector.<br />
The above spatial <strong>and</strong> angular responsivity results show that traditional sphere-detectors,<br />
with 90 o angle between the entrance <strong>and</strong> exit ports <strong>and</strong> where the aperture plane is<br />
perpendicular (not tilted) to the sphere axis, have significant spatial <strong>and</strong> angular<br />
responsivity errors, therefore, they are not suitable for absolute power <strong>and</strong> irradiance<br />
mode measurements with the required less than 0.1 % (k=2) responsivity uncertainty. It<br />
also has been shown with the preliminary angular response tests (at different aperture tilt<br />
angles relative to the sphere axis) that the non-Lambertian angular response can be<br />
significantly improved if the input aperture plane is tilted at least 12 o relative to the<br />
sphere axis. This improvement was verified in the rotation plane perpendicular to the<br />
plane where the aperture <strong>and</strong> the detector are located.
1.000<br />
0.995<br />
0.990<br />
18 o<br />
12 o<br />
0.985<br />
-10 -5 0 5 10<br />
6 o<br />
3 o<br />
0 o<br />
cosine<br />
Incidence angle [ o ]<br />
Fig. 2. Angular response <strong>of</strong> a Ge sphere-detector<br />
at different tilt angles <strong>of</strong> the input aperture plane relative to the sphere-axis.<br />
The influence <strong>of</strong> the sphere-detector asymmetry (90 o between the sphere aperture <strong>and</strong> the<br />
detector) for the angular response was tested as well. This test was performed with the<br />
18 o tilt (<strong>of</strong> the aperture plane relative to the sphere-axis) in the plane where the aperture<br />
<strong>and</strong> the detector are located. To make this test, the previous angular response<br />
measurements were repeated after a 90 o rotation <strong>of</strong> the sphere-detector (around its optical<br />
axis) <strong>and</strong> the previous measurement geometry (pivot point <strong>and</strong> fixed lamp distance) was<br />
used again. The obtained angular response curve significantly deviated from the cosine<br />
function. The measured asymmetric curve is shown in Fig. 3 (at 18 o tilt <strong>of</strong> the aperture<br />
plane relative to the sphere-axis). The asymmetric angular response is caused by the<br />
asymmetric arrangement <strong>of</strong> the sphere entrance <strong>and</strong> exit ports in the plane <strong>of</strong> the rotation.<br />
(The rotation changes the incidence angle.) The deviation from the cosine is about 0.4 %<br />
at a 4 o incidence angle. This error in the angular responsivity can be significantly<br />
decreased if multiple detectors are symmetrically arranged relative to the incident-beamproduced<br />
spot on the sphere wall. A symmetrical detector arrangement can improve the<br />
spatial uniformity <strong>of</strong> responsivity as well.<br />
The preliminary angular-response measurement results verified that using 18 o tilt in the<br />
plane <strong>of</strong> the input aperture (relative the sphere-axis), the escaping radiation can be<br />
trapped <strong>and</strong> the angular responsivity to the cosine can be restored. Probably, there is a<br />
very small enhanced reflection peak at 0 o in the BRDF <strong>of</strong> the Spectralon wall-coating<br />
since this material is not an ideal Lambertian reflector. This material-characteristic<br />
produced the flattened angular response. Also, the trapped specular-component <strong>of</strong> the<br />
first reflection could improve the spatial uniformity <strong>of</strong> responsivity which is important for
low-uncertainty radiant power measurements. The results in Fig. 3 show that the<br />
traditional 90 o aperture-detector arrangement should be changed to a symmetrical<br />
detector arrangement relative to the incident-beam-produced spot on the back <strong>of</strong> the<br />
sphere-wall. A symmetrical detector arrangement can be implemented using multiple<br />
detectors instead <strong>of</strong> a single element detector.<br />
1.000<br />
0.995<br />
0.990<br />
18 o<br />
cosine<br />
0.985<br />
-10 -5 0 5 10<br />
Incidence angle [ o ]<br />
Fig. 3. Angular response <strong>of</strong> a traditional Ge sphere-detector<br />
where the 90 o separated entrance <strong>and</strong> exit ports are in the plane <strong>of</strong> the rotation.<br />
3. Design <strong>of</strong> the sphere-InGaAs radiometer<br />
In order to improve the spatial <strong>and</strong> angular uniformity <strong>of</strong> the responsivity <strong>and</strong> to obtain<br />
lower responsivity uncertainties in a calibration transfer, a near-IR transfer st<strong>and</strong>ard<br />
radiometer has been designed. The new radiometer has an integrating-sphere receiver<br />
with the optical axis <strong>of</strong> the entrance aperture tilted away from the sphere-axis. Four<br />
temperature-controlled InGaAs photodiodes, selected for high shunt resistance, are<br />
symmetrically positioned in the sphere wall around the incident beam spot such that they<br />
cannot see each other.<br />
The geometrical arrangement for the input <strong>of</strong> the sphere-detector is shown in Fig. 4. A<br />
new position is needed for the aperture to obtain the maximum useful acceptance angle<br />
without beam clipping <strong>and</strong> to avoid any flux loss through the entrance aperture owing to<br />
the back reflection <strong>of</strong> the specular component <strong>of</strong> the incident beam from the sphere wall.<br />
The tilted aperure <strong>and</strong> the two unclipped beam-limits are illustrated. The incidence angle<br />
<strong>of</strong> the left limit-beam (relative to the sphere axis) is 6°, the other side limit-beam is<br />
determined by the sphere wall. The new entrance axis <strong>of</strong> the sphere is the aperture axis,<br />
which splits the angle between two limit-beams. The measurements <strong>and</strong> calculations for<br />
the available components showed that the optimum value <strong>of</strong> the angle between the sphere<br />
axis <strong>and</strong> the aperture axis is 17.5°.
Fig. 4. Sphere-detector with a tilted aperture input.<br />
The cross-section <strong>of</strong> the sphere-InGaAs detector housing is shown in Fig. 5. The aperture<br />
axis is tilted by 18 o . The housing is temperature controlled with a thermo-electric (TE)<br />
cooler/heater attached to the back <strong>of</strong> the Al-housing. As shown on the picture <strong>of</strong> the<br />
sphere-detector in Fig. 6, a heat sink is attached to the back side <strong>of</strong> the TE cooler/heater.<br />
The four 1 mm diameter InGaAs detectors are selected for equal shunt resistance <strong>and</strong><br />
they are parallel connected with each other. They are symmetrically positioned around the<br />
incident beam produced “hot” spot such that they cannot see each other. The stabilized<br />
26 o C temperature <strong>of</strong> the sphere-housing propagates to the metal cans <strong>of</strong> the detectors.<br />
4. Sphere-InGaAs radiometer characterizations<br />
In Fig. 6, the sphere-InGaAs detector with a 5 mm diameter input aperture was<br />
characterized at the Spectral Comparator Facility (SCF) by scanning with a 1 mm<br />
diameter beam. The measured spatial uniformity at 1200 nm is shown in Fig. 7. The<br />
maximum-to-minimum responsivity change is less than 0.05 %. The spatial uniformity<br />
tests were repeated at 1000 nm <strong>and</strong> 1600 nm. The pattern <strong>of</strong> the spatial non-uniformity <strong>of</strong><br />
responsivity was different at each wavelength. The maximum-to-minimum responsivity<br />
change was also 0.05 % at 1000 nm <strong>and</strong> it increased to 0.075 % at 1600 nm. With a larger<br />
beam spot positioned in the aperture-center, the beam positioning error in the power<br />
responsivity measurement can be decreased by about a factor <strong>of</strong> two.<br />
The noise-equivalent-power (NEP) was determined from output noise <strong>and</strong> spectral power<br />
responsivity measurements between 950 nm <strong>and</strong> 1650 nm. Figure 8 shows the NEP<br />
results from two spectral scans compared to the NEP <strong>of</strong> a Ge trap detector [8]. The
Fig. 5. Cross-section <strong>of</strong> the sphere-InGaAs detector.<br />
Fig. 6. Picture <strong>of</strong> the sphere-InGaAs detector.
Fig. 7. Spatial uniformity <strong>of</strong> the sphere-IGA detector<br />
with a 5 mm diameter input-aperture at 1200 nm.<br />
obtained data verify that the dominating noise <strong>of</strong> the sphere-InGaAs detector is white<br />
noise, specifically, resistor noise. The resistor noise, which originates from the parallel<br />
connection <strong>of</strong> the shunt resistance <strong>and</strong> the feedback resistance, is dominated by the<br />
resultant shunt resistance <strong>of</strong> the four parallel connected 1-mm detectors. The resultant<br />
shunt resistance was 33 MΩ for four non-selected photodiodes (set-1) <strong>and</strong> 50 MΩ for<br />
four photodiodes selected for equal shunt resistance <strong>of</strong> 200 MΩ (set-2). The exp<strong>and</strong>ed<br />
uncertainty <strong>of</strong> the shunt resistance measurements was 10 % (k=2). The feedback<br />
resistance <strong>of</strong> the current-to-voltage converter during the spectral measurements was<br />
100 MΩ. The average NEP was 5 pW/Hz 1/2 for run-1 <strong>and</strong> 5.5 pW/Hz 1/2 for run-2 using<br />
set-1 with the 33 MΩ shunt resistance. Since the resultant shunt resistance <strong>of</strong> the Ge trap<br />
detector is only 1 kΩ, its dominating noise is 1/f noise. The 1/f noise determined NEP <strong>of</strong><br />
the Ge trap detector was 30 pW/Hz 1/2 .<br />
Figure 9 shows the repeatability <strong>of</strong> four spectral responsivity scans at the SCF. The<br />
responsivity differences shown on the Y-axis are in the 0.05 % level between 950 nm <strong>and</strong><br />
1350 nm <strong>and</strong> also between 1450 nm <strong>and</strong> 1650 nm. The larger differences at 1400 nm are<br />
caused by the atmospheric absorption.<br />
The sphere-InGaAs detector angular responsivities were measured on a photometer bench.<br />
The illuminating source was a Wi41G lamp. This lamp had significantly smaller intensity<br />
fluctuations than the FEL lamp used in the preliminary experiments shown in Fig. 2.<br />
Otherwise, these measurements were performed similarly to the preliminary tests. Since<br />
the separation between the lamp <strong>and</strong> the sphere-detector was about 3 m, the lamp<br />
operated like a “point source” for the sphere-InGaAs detector. Two baffles were located<br />
between the lamp <strong>and</strong> the sphere-detector to minimize stray light on the detector. The<br />
detector was mounted on a rotation stage <strong>and</strong> it was rotated around the aperture-center in<br />
the horizontal plane. To repeat the angular responsivity measurements in the vertical<br />
plane, the sphere-detector was 90 o rotated on the rotation stage around its optical axis.<br />
The measurement results are shown in Fig. 10. The ratios <strong>of</strong> the measured responses to
the cosine function are shown versus the rotation (incidence) angle <strong>of</strong> the sphere-InGaAs<br />
detector. The curves are normalized. The deviations from the cosine function are 0.03 %<br />
if the (full-angle) field-<strong>of</strong>-view <strong>of</strong> the sphere-InGaAs detector which is limited to 5 o .<br />
The long-term stability <strong>of</strong> the sphere-InGaAs detector is an important issue. Our 2-years<br />
long stability tests on several InGaAs makes <strong>and</strong> models verified that these photodiodes<br />
Difference [%]<br />
1.0<br />
0.8<br />
0.6<br />
0.4<br />
0.2<br />
0.0<br />
-0.2<br />
-0.4<br />
-0.6<br />
-0.8<br />
-1.0<br />
35<br />
30<br />
25<br />
20<br />
15<br />
10<br />
5<br />
Sph-IGA run-1<br />
Sph-IGA run-2<br />
Ge trap<br />
0<br />
900 1000 1100 1200 1300 1400 1500 1600 1700<br />
Wavelength [nm]<br />
Fig. 8. NEP comparison <strong>of</strong> the sphere-IGA <strong>and</strong> the Ge-trap detectors.<br />
700 900 1100 1300 1500 1700 1900<br />
Wavelength [nm]<br />
Fig. 9. Responsivity differences (repeatability) <strong>of</strong> four spectral responsivity scans.
(even if they are not temperature stabilized) exhibit less than 0.2 % instabilities between<br />
1.0 μm <strong>and</strong> 1.6 μm. Also, when measurements are not performed, a protecting cap is<br />
mounted to the entrance port <strong>of</strong> the sphere to keep the dust <strong>and</strong> dirt outside. The low-NEP<br />
(high sensitivity) makes it possible to decrease throughput changes with gray spherecoatings<br />
where the reflectance factors are significantly smaller than unity. The sphere-<br />
InGaAs detector will be calibrated against the cryogenic radiometer yearly, to calibrate<br />
out long-term changes.<br />
1.0002<br />
1.0000<br />
0.9998<br />
0.9996<br />
0.9994<br />
0.9992<br />
5. Calibration procedure<br />
90 degree rotated<br />
0 degree rotated<br />
0.9990<br />
-4 -3 -2 -1 0 1 2 3<br />
Incidence angle [ o ]<br />
Fig. 10. Response/cosine versus incident angle to the normal<br />
<strong>of</strong> the 8 mm diameter input-aperture <strong>of</strong> the sphere-detector.<br />
The SIRCUS scale derivation is illustrated in Fig. 11. The new sphere-InGaAs detector<br />
(shown with the earlier used 90 o aperture–detector arrangement) is calibrated against the<br />
cryogenic radiometer for absolute spectral power responsivity. Following the radiant<br />
power responsivity scale transfer, an irradiance mode tie point is derived from a silicon<br />
trap detector at about 950 nm. An alternative solution is to use an area-calibrated aperture<br />
in front <strong>of</strong> the sphere-detector for power-to-irradiance mode conversion. The irradiance<br />
mode sphere-InGaAs detector is the reference detector for the SIRCUS in the NIR range<br />
to 1650 nm.<br />
Other (test) irradiance detectors can be calibrated against the sphere-InGaAs reference<br />
detector when they both measure the irradiance from an integrating sphere source <strong>of</strong> the<br />
SIRCUS. For absolute radiance responsivity calibrations, a large sphere-source is used at<br />
SIRCUS <strong>and</strong> its exit-port radiance is determined against the new sphere-InGaAs detector<br />
when the distance d is measured between the source aperture <strong>and</strong> the detector aperture.<br />
Test radiance meters are calibrated against the detector-based radiance <strong>of</strong> the large
sphere-source. In order to achieve the required 0.05 % (k=2) absolute radiance<br />
responsivity uncertainty, the uncertainty components are kept small <strong>and</strong> the sphere-<br />
InGaAs detector will not limit the overall uncertainty <strong>of</strong> the responsivity scale transfer.<br />
Fig. 11. The SIRCUS responsivity scale derivation using a sphere-InGaAs detector.<br />
6. Future applications<br />
In addition to the SIRCUS irradiance <strong>and</strong> radiance responsivity scale extension to the<br />
near-IR, the sphere-InGaAs detector can be used for fiber coupled spectral power<br />
responsivity scale transfer with sub-pW NEP <strong>and</strong> high coupling efficiency. The sphere-<br />
InGaAs detector with the 0.05 % (k=2) radiance responsivity uncertainty, also can be<br />
used to determine the thermodynamic temperature <strong>of</strong> a 157 o C Indium point (blackbody<br />
radiator) with 10 mK (k=2) uncertainty. Also, because <strong>of</strong> its excellent spatial uniformity<br />
<strong>of</strong> responsivity, it can be applied for international spectral power responsivity<br />
comparisons with decreased uncertainties compared to presently used single-element or<br />
trap near-IR quantum detectors even if the incident beam sizes are different (as was the<br />
case in the CCPR K2.a). We are planning to increase the area <strong>of</strong> the InGaAs detectors to<br />
increase responsivity. Also, the detectors will be cooled to increase their shunt resistance<br />
<strong>and</strong> to obtain lower output noise. According to our estimation, the NEP <strong>of</strong> an improved<br />
sphere-InGaAs detector can be as low as 50 fW/Hz 1/2 . This is equal to the NEP <strong>of</strong> silicon<br />
tunnel-trap detectors built with shunt-resistance selected photodiodes. We also plan to<br />
extend the spectral range to 2.5 μm using cooled extended-InGaAs detectors.
7. Conclusions<br />
This is the first time that a near-IR transfer st<strong>and</strong>ard detector with similar performance to<br />
silicon trap detectors has been developed. Recent responsivity scale realizations on the<br />
SIRCUS facility demonstrated that silicon trap detectors can propagate the low<br />
uncertainty radiant power scale <strong>of</strong> the cryogenic radiometer to 960 nm with a minimal<br />
increase in the uncertainty. Because <strong>of</strong> the increasing dem<strong>and</strong> for less than 0.1 % (k=2)<br />
responsivity calibrations at the SIRCUS facility between 950 nm <strong>and</strong> 1650 nm, a transfer<br />
st<strong>and</strong>ard near-IR radiometer was needed that can propagate the primary responsivity<br />
scale similarly to the silicon trap detectors. A novel sphere-input radiometer (with tilted<br />
input aperture to the sphere axis <strong>and</strong> a symmetrical arrangement <strong>of</strong> four InGaAs detectors<br />
to the incident beam spot on the sphere-wall) has been developed with electronic <strong>and</strong><br />
radiometric characteristics similar to silicon trap detectors. The two dominant<br />
responsivity uncertainty components (originating from the spatial non-uniformity <strong>and</strong> the<br />
angular responsivity deviation from the cosine) in a power to irradiance/radiance scale<br />
transfer could be decreased to less than 0.05 % (k=2). The new device with its improved<br />
responsivity uncertainty is used as the highest level reference radiometer <strong>of</strong> the SIRCUS<br />
facility for near-IR irradiance <strong>and</strong> radiance mode spectral responsivity calibrations. The<br />
radiometer st<strong>and</strong>ard can be utilized to realize a detector-based radiation temperature scale<br />
down to 157 o C with a 10 mK (k=2) uncertainty. There are also other application areas,<br />
such as fiber coupled spectral power responsivity measurements where the coupling<br />
efficiency can be high using this sphere-input st<strong>and</strong>ard. It also can be used as a traveling<br />
transfer detector to compare international near-IR responsivity scales in both power <strong>and</strong><br />
irradiance measurement modes with significantly lowered responsivity uncertainties.<br />
# Certain commercial equipment, instruments, or materials are identified in this paper to foster<br />
underst<strong>and</strong>ing. Such identification does not imply recommendation or endorsement by the <strong>National</strong><br />
<strong>Institute</strong> <strong>of</strong> <strong>St<strong>and</strong>ards</strong> <strong>and</strong> Technology, nor does it imply that the material or equipment are necessarily the<br />
best available for the purpose.<br />
References<br />
1. E. F. Zalewski <strong>and</strong> C. R. Duda, “Silicon photodiode device with 100 % external<br />
quantum efficiency,” Applied Optics, Vol. 22, No.18, p. 2867-2873, 1983.<br />
2. S. W. Brown, G. P. Eppeldauer, <strong>and</strong> K. R. Lykke, “Facility for Spectral Irradiance<br />
<strong>and</strong> Radiance Responsivity Calibrations using Uniform Sources,” Applied Optics, Vol. 45,<br />
No. 32, p. 8218-8237, 2006.<br />
3. K. D. Stock, R. Heine, <strong>and</strong> H. H<strong>of</strong>er, “Spectral characterization <strong>of</strong> Ge trap<br />
detectors <strong>and</strong> photodiodes used as transfer st<strong>and</strong>ards,” Metrologia, Vol. 40, p. S163–S166,<br />
2003.<br />
4. M. Lopez, H. H<strong>of</strong>er <strong>and</strong> S. Kuck, “High accuracy measurement <strong>of</strong> the absolute spectral<br />
responsivity <strong>of</strong> Ge <strong>and</strong> InGaAs trap detectors by direct calibration against an electrically
calibrated cryogenic radiometer in the near- infrared,” Metrologia, Vol. 43, p. 508–514,<br />
2006.<br />
5. A. Lamminpaa, M. Noorma, T. Hyyppa, F. Manoocheri, P. Karha, <strong>and</strong> E. Ikonen,<br />
“Characterization <strong>of</strong> germanium photodiodes <strong>and</strong> trap detector,” Meas. Sci. Technol., Vol.<br />
17, p. 908–912, 2006.<br />
6. Ana Carrasco-Sanz, Felix Rodrıguez-Barrios, Pedro Corredera, Sonia Martın-Lopez,<br />
Miguel Gonzalez-Herraez <strong>and</strong> Marıa Luisa Hernanz, “An integrating sphere radiometer<br />
as a solution for high power calibrations in fiber optics,” Metrologia, Vol. 43, p. S145–<br />
S150, 2006.<br />
7. L. P. Boivin “Properties <strong>of</strong> sphere radiometers suitable for high-accuracy cryogenicradiometer-based<br />
calibrations in the near-infrared,” Metrologia, Vol. 37, p. 273–8, 2000.<br />
8. J. H. Lehman <strong>and</strong> X. Li, “A transfer st<strong>and</strong>ard for optical fiber power metrology,”<br />
Applied Optics, Vol. 38, p. 7164-7166, 1999.
Optical characterization <strong>of</strong> diffuser-input st<strong>and</strong>ard irradiance<br />
meters<br />
George Eppeldauer a , Miklós Rácz b , <strong>and</strong> Thomas Larason a<br />
a Optical Technology Division <strong>of</strong> the <strong>National</strong> <strong>Institute</strong> <strong>of</strong> <strong>St<strong>and</strong>ards</strong> <strong>and</strong> Technology<br />
Gaithersburg, MD 20899, USA<br />
b Guest Researcher at <strong>National</strong> <strong>Institute</strong> <strong>of</strong> <strong>St<strong>and</strong>ards</strong> <strong>and</strong> Technology from the Hungarian<br />
Academy <strong>of</strong> Sciences Research <strong>Institute</strong> for <strong>Technical</strong> Physics <strong>and</strong> Materials Science<br />
P.O. Box 49, Budapest-114, Hungary 1525<br />
ABSTRACT<br />
<strong>St<strong>and</strong>ards</strong> quality irradiance meters have been developed at the <strong>National</strong> <strong>Institute</strong> <strong>of</strong> <strong>St<strong>and</strong>ards</strong> <strong>and</strong> Technology<br />
(<strong>NIST</strong>) to realize a detector based spectral irradiance scale. The design criteria <strong>and</strong> the optical <strong>and</strong> radiometric<br />
characterization <strong>of</strong> diffuser-input irradiance meters are discussed. The input geometry optimization is described for<br />
a broad-b<strong>and</strong> InGaAs irradiance meter when measuring a 2856 K inc<strong>and</strong>escent light source. The directional<br />
responsivity <strong>of</strong> the fabricated InGaAs <strong>and</strong> Si irradiance meters matches the cosine function with a maximum<br />
deviation <strong>of</strong> 0.15 % within a 12° field-<strong>of</strong>-view (FOV). Irradiance from sources <strong>of</strong> different sizes (incident beams<br />
with different f/numbers) can be measured over a wavelength range <strong>of</strong> 350 nm to 1800 nm.<br />
Keywords: aperture, cosine function, directional responsivity, detector, diffuser, irradiance, photodiode,<br />
radiometer, spectral responsivity, working st<strong>and</strong>ard.<br />
1. INTRODUCTION<br />
The detector spectral responsivity scale <strong>of</strong> <strong>NIST</strong> is based on an electrical substitution High Accuracy Cryogenic<br />
Radiometer (HACR) 1 . The HACR measures the radiant power <strong>of</strong> intensity stabilized laser lines with a relative<br />
st<strong>and</strong>ard uncertainty <strong>of</strong> 0.021 %. After a scale derivation procedure 2 , large-area, single-element Si 3 <strong>and</strong> Ge 4,5<br />
photodiode working st<strong>and</strong>ards are calibrated for spectral power responsivity. The uncertainty <strong>of</strong> the spectral power<br />
responsivity is wavelength dependent. The relative st<strong>and</strong>ard uncertainty is about 0.1 % in the visible, 1 % in the<br />
UV, <strong>and</strong> 2.5 % in the near-infrared range when the responsivity is transferred to test detectors 2 .<br />
In order to extend the detector based spectral power responsivity calibrations to irradiance responsivity, st<strong>and</strong>ards<br />
quality irradiance meters had to be developed. The beam geometry at calibration <strong>and</strong> the different applications<br />
varies from parallel (collimated) to 12° full angle (6° incidence angle). In order to achieve high measurement<br />
accuracy, the directional characteristics <strong>of</strong> the detectors have to follow the cosine law in this angular range. The<br />
directional characteristics were controlled up to a 10° incidence angle to assure the proper cosine response <strong>of</strong> the<br />
detectors within the desired angular range. The design <strong>and</strong> optical characterization <strong>of</strong> these meters are discussed for<br />
an InGaAs irradiance meter. The described optimization procedure was utilized for a Si irradiance meter as well.<br />
2. SPECTRAL CHARACTERISTICS<br />
The spectral characteristics <strong>of</strong> the irradiance meters are determined by the photodiode <strong>and</strong> the flashed opal glass<br />
diffuser used in the meter. In Fig. 1 the spectral responsivities <strong>of</strong> the Si <strong>and</strong> InGaAs photodiodes <strong>and</strong> the irradiance<br />
meters can be seen. The magnitudes <strong>of</strong> the irradiance responsivities are similar for the two meters because the<br />
larger aperture (8.0 mm diameter) <strong>of</strong> the Si meter produces higher irradiance responsivity than the smaller aperture<br />
(6.4 mm diameter) <strong>of</strong> the InGaAs meter. Sources with either monochromatic or known (e.g., Planckian) spectral<br />
power distributions can be measured with these broadb<strong>and</strong> irradiance meters.
Fig. 1. Spectral responsivities <strong>of</strong> the Si <strong>and</strong> InGaAs photodiodes <strong>and</strong> the corresponding irradiance meters.<br />
3. DIRECTIONAL CHARACTERISTICS<br />
The directional responsivity measurements were performed on the <strong>NIST</strong> photometry bench. Several tungsten<br />
inc<strong>and</strong>escent lamps were used as non-calibrated radiation sources. The color temperature <strong>of</strong> the lamps was set to<br />
2856 K or lower. The irradiance meters to be measured were mounted on a rotational stage <strong>and</strong> the input apertures<br />
were positioned on the rotation axis. The distance between the lamps <strong>and</strong> the rotation axis was about 3.25 m. The<br />
quality <strong>of</strong> the directional responsivity data was characterized with the Commission Internationale de L’Éclairage<br />
(CIE) directional error f2(ε,φ):<br />
f2( ε,φ)=<br />
( )<br />
E reading ε, φ<br />
−1<br />
( )⋅cosε E reading ε = 0°<br />
where Ereading(ε,φ) <strong>and</strong> Ereading(ε = 0°) are the readings for an irradiance, E, arriving at the angles <strong>of</strong> incidence ε <strong>and</strong><br />
0º respectively. φ is the azimuth angle. Because the irradiance meters are circularly symmetrical, they were only<br />
tested at two perpendicular φ values.<br />
Drawings <strong>of</strong> the <strong>NIST</strong> developed diffuser-input irradiance meters can be seen in Fig. 2. The FOV limiters reject<br />
optical radiation outside the FOV. The input apertures determine the reference plane <strong>and</strong> the active area <strong>of</strong> the<br />
irradiance meters. The diffusers dominate the directional responsivity <strong>of</strong> the meters. The detectors are temperature<br />
controlled by thermoelectric coolers <strong>and</strong> are electrically shielded. The temperature <strong>of</strong> the InGaAs <strong>and</strong> Si<br />
photodiodes are controlled to -30 °C <strong>and</strong> +25 °C respectively.<br />
Fig. 2. Input optics cross-section <strong>of</strong> the InGaAs (a) <strong>and</strong> Si (b) irradiance meters.<br />
(1)
The geometry <strong>of</strong> the input optics <strong>of</strong> the irradiance meters was optimized experimentally. Several flashed opal glass<br />
diffusers were tested with a Cary 4a spectroradiometer in the 400 nm to 1700 nm wavelength range because their<br />
visual appearance was not the same. The diffusers were separated into four groups according to their diffuse<br />
reflectances <strong>of</strong> about 27 %, 31 %, 35 %, <strong>and</strong> 40 % at 1400 nm. As can be seen in Fig. 3, the diffuse reflectance <strong>of</strong><br />
the samples decreases with increasing wavelength.<br />
Four sizes <strong>of</strong> apertures were also tested. Their diameters were approximately 3.5 mm, 6.4 mm, 8.0 mm, <strong>and</strong><br />
11.5 mm. The optimal aperture-diffuser pair was chosen experimentally. Every possible combination was<br />
measured for angular response <strong>and</strong> the CIE f2(ε) error functions were evaluated. Fig. 4 shows the f2(ε) functions for<br />
the 0° to 10° incidence angle range at a given φ value. The f2(ε) functions can be seen for combinations with the<br />
6.4 mm aperture <strong>and</strong> the four different diffusers in Fig. 4a. Whereas Fig. 4b shows the f2(ε) functions for<br />
combinations built with a 40 % reflectance diffuser <strong>and</strong> the four different apertures.<br />
Fig. 3. Diffuse spectral reflectance <strong>of</strong> the flashed opal glass diffusers. The vertical line shows the wavelength <strong>of</strong> the<br />
diffuser selection.<br />
Fig. 4. Directional error <strong>of</strong> different aperture-diffuser pairs for a circular InGaAs photodiode with a diameter <strong>of</strong><br />
5.0 mm. Figure 4a shows the measurement results for four different diffusers with the 6.4 mm aperture. Figure 4b<br />
shows the results for four different apertures with a diffuser reflectance <strong>of</strong> 40 %.
As can be seen, the angular responsivity depends upon the diameter <strong>of</strong> the aperture <strong>and</strong> the quality <strong>of</strong> the diffuser.<br />
Two pairs <strong>of</strong> aperture-diffuser were found to have adequate directional characteristics, the 6.4 mm aperture with a<br />
40 % diffuser <strong>and</strong> the 8 mm aperture with a 35 % diffuser. The 6.4 mm aperture <strong>and</strong> 40 % diffuser pair had better<br />
spatial responsivity characteristics <strong>and</strong> was selected for the InGaAs irradiance meter. The selected diffuser pair had<br />
an effective area 11.0 % smaller than the geometrically measured area. For the other pair, the effective area was<br />
18.4 % smaller than the geometrically measured area because <strong>of</strong> the larger spatial nonuniformity.<br />
It follows from Figs. 3 <strong>and</strong> 4a that the optimum cosine response depends on the wavelength. Consequently, the<br />
input geometry has to be optimized for the wavelength (or the spectral distribution) <strong>of</strong> the source to be measured.<br />
4. RESPONSIVITY CALIBRATION AND SPATIAL CHARACTERISTICS<br />
An x-y scanning procedure was used to determine the integrated irradiance responsivity <strong>and</strong> the effective aperture<br />
area <strong>of</strong> irradiance <strong>and</strong> illuminance meters 6 . This irradiance calibration method uses only detector st<strong>and</strong>ards instead<br />
<strong>of</strong> conventional st<strong>and</strong>ard sources. The procedure where a small beam overscans the input aperture <strong>of</strong> the meter, also<br />
provides information on the spatial responsivity uniformity <strong>of</strong> the detector. The output signal <strong>of</strong> the detector was<br />
measured as a function <strong>of</strong> the position <strong>of</strong> the beam. The wavelength was selected for the sensitivity range <strong>of</strong> the<br />
photodiode, 780 nm for Si <strong>and</strong> 1500 nm for InGaAs. Fig. 5 shows the spatial responsivity <strong>of</strong> the InGaAs meter with<br />
the 6.4 mm aperture <strong>and</strong> the 40 % diffuser. The diameter <strong>of</strong> the beam was 1.1 mm. Each distance step <strong>of</strong> the scan<br />
was 0.5 mm. The position <strong>of</strong> the beam relative to the center <strong>of</strong> the aperture is measured on the horizontal axes,<br />
while the output signal <strong>of</strong> the irradiance meter is drawn on the vertical axis. The irradiance meter output signal is<br />
normalized to the signal measured in the central position. In Fig. 5a the response uniformity <strong>of</strong> the active area is<br />
shown <strong>and</strong> in Fig. 5b the radiation scattered from the area surrounding the aperture can be seen.<br />
Fig. 5. Spatial responsivity distribution plots <strong>of</strong> the diffuser-input InGaAs irradiance meter with a 6.4 mm aperture<br />
<strong>and</strong> a 40 % diffuser. Figure 5a shows the uniformity <strong>of</strong> the sensitive area, while Fig. 5b shows the stray radiation.<br />
The effective area <strong>of</strong> an irradiance meter can be calculated as the ratio <strong>of</strong> the integrated irradiance responsivity to<br />
the radiant power responsivity in the center <strong>of</strong> the aperture. The effective area is utilized in flux transfers when the<br />
measured irradiance (in the meter’s aperture plane) is transferred to another device, e.g., the exit port <strong>of</strong> a radiance<br />
source 7 . In such cases, geometrical aperture area measurements are not needed. When a diffuser is used between<br />
the aperture <strong>and</strong> the photodiode to maintain the cosine response <strong>of</strong> an irradiance meter, a side effect is the decreased<br />
responsivity toward the edges <strong>of</strong> the photodiode. Because <strong>of</strong> this side effect, the effective area can be significantly<br />
different from the geometrically measured area <strong>of</strong> the aperture. The measured effective area <strong>of</strong> the InGaAs<br />
irradiance meter with the 6.4 mm aperture was 28.6 mm 2 ± 0.5 %, while the geometrical area is<br />
32.08 mm 2 ± 0.075 %. The effective area <strong>of</strong> the Si meter was measured at two different wavelengths <strong>of</strong> 563 nm <strong>and</strong><br />
815 nm. The area change was 0.29 %, well within the uncertainty <strong>of</strong> the radiometric effective area measurement.
5. UNCERTAINTIES<br />
The uncertainty components in addition to the uncertainty <strong>of</strong> the spectral power responsivity calibrations 2 originate<br />
from several sources. The uncertainty <strong>of</strong> the integrated irradiance measurement method is estimated to be 0.5 %,<br />
the directional error <strong>of</strong> 0.15 % for the optimized meters, <strong>and</strong> the integrated stray radiation <strong>of</strong> 0.1 %. The relative<br />
combined st<strong>and</strong>ard uncertainty <strong>of</strong> an irradiance measurement with the Si meter is 1.6 % at 350 nm. The st<strong>and</strong>ard<br />
uncertainty decreases to 0.94 % at 400 nm <strong>and</strong> is almost constant at 0.54 % in the visible to 925 nm. From 925 nm<br />
to 1800 nm where the InGaAs irradiance meter is used, the estimated st<strong>and</strong>ard uncertainty is about 1.2 % from<br />
925 nm to 1345 nm <strong>and</strong> increases to about 2.6 % between 1350 nm <strong>and</strong> 1800 nm.<br />
6. CONCLUSION<br />
Diffuser-input irradiance meters have been developed with InGaAs <strong>and</strong> Si photodiodes as working st<strong>and</strong>ards. The<br />
wavelength range <strong>of</strong> the two irradiance meters covers the 350 nm to 1800 nm wavelength region. The irradiance<br />
meters were calibrated against the <strong>NIST</strong> detector spectral power responsivity scale. The flashed opal glass diffusers<br />
were measured <strong>and</strong> grouped according to their diffuse reflectance. A range <strong>of</strong> apertures was tested with the<br />
different diffusers. Diffuser <strong>and</strong> aperture pairs were selected for optimum cosine response <strong>and</strong> minimum spatial<br />
responsivity non-uniformity. The CIE directional error was f2(ε) = 0.15 % or less for the irradiance meters in the 0°<br />
to 10° incidence angle range. The total irradiance responsivity <strong>of</strong> the meters was determined from spatial<br />
responsivity integrals over the aperture area during a scanning procedure. The st<strong>and</strong>ard irradiance meters, that hold<br />
the spectral irradiance responsivity scale <strong>of</strong> the SCF facility, can measure spectral irradiance with an estimated<br />
combined st<strong>and</strong>ard uncertainty <strong>of</strong> 0.54 % in the visible range.<br />
7. ACKNOWLEDGMENTS<br />
The authors thank Donald Lynch <strong>of</strong> Reyer Corporation for the irradiance meter fabrication, Yuqin Zong for helping<br />
in the directional response measurements, Sally Bruce for making the spectral responsivity <strong>and</strong> spatial uniformity<br />
measurements, Joel Fowler for the aperture area measurements, <strong>and</strong> Yvonne Barnes for helping in the diffuse<br />
reflectance measurements.<br />
8. REFERENCES<br />
1. Gentile, T. R., Houston, J. M., Hardis, J. E., Cromer, C. L., <strong>and</strong> Parr, A. C., “<strong>National</strong> <strong>Institute</strong> <strong>of</strong> <strong>St<strong>and</strong>ards</strong> <strong>and</strong><br />
Technology high accuracy cryogenic radiometer,” Appl. Opt. 35 (7), 1056-1068 (1996).<br />
2. Larason, T. C., Bruce, S. S., Parr, A. C., “Spectroradiometric Detector Measurements: Part I-Ultraviolet<br />
Detectors <strong>and</strong> Part II-Visible to Near-Infrared Detectors,” <strong>National</strong> <strong>Institute</strong> <strong>of</strong> <strong>St<strong>and</strong>ards</strong> <strong>and</strong> Technology<br />
Special Publication 250-41 (1998).<br />
3. Eppeldauer, G. <strong>and</strong> Hardis, J. E., “Fourteen-decade photocurrent measurements with large-area silicon<br />
photodiodes at room temperature,” Appl. Opt. 30 (22), 3091-3099 (1991).<br />
4. Eppeldauer, G., “Near Infrared Radiometer <strong>St<strong>and</strong>ards</strong>,” SPIE 2815 Optical Radiation Measurements III. 42-54<br />
(1996).<br />
5. Eppeldauer, G., “Electronic characteristics <strong>of</strong> Ge <strong>and</strong> InGaAs radiometers,” SPIE 3061 Infrared Technology<br />
<strong>and</strong> Applications XXIII. 833-838 (1997).<br />
6. Cromer, C. L., Eppeldauer, G., Hardis, J. E., Larason, T. C., Ohno, Y., Parr, A. C., “The <strong>NIST</strong> Detector-Based<br />
Luminous Intensity Scale,” J. Res. Natl. Inst. St<strong>and</strong>. Technol., 101 (2), 109-132 (1996).<br />
7. Johnson, B. C., Cromer, C. L., Saunders R. D., Eppeldauer, G., Fowler, J., Sapritsky, V. I. <strong>and</strong> G. Dézsi, “A<br />
Method <strong>of</strong> Realizing Spectral Irradiance Based on an Absolute Cryogenic Radiometer,” Metrologia, 30, 309-<br />
315 (1993).
Near Infrared Radiometer <strong>St<strong>and</strong>ards</strong><br />
George Eppeldauer<br />
Optical Technology Division<br />
<strong>National</strong> <strong>Institute</strong> <strong>of</strong> <strong>St<strong>and</strong>ards</strong> <strong>and</strong> Technology<br />
Gaithersburg, Maryl<strong>and</strong> 20899<br />
ABSTRACT<br />
We are developing new detector-based radiometric scales in the near infrared to extend<br />
existing spectral radiant power calibrations 1 to spectral irradiance <strong>and</strong> radiance calibrations. High<br />
accuracy irradiance <strong>and</strong> radiance meters have been developed to realize these new detector-based<br />
radiometric scales. Mechanical, optical, <strong>and</strong> radiometric design considerations <strong>of</strong> Ge <strong>and</strong> InGaAs<br />
radiometers are discussed. Calibration principles <strong>and</strong> design considerations <strong>of</strong> the calibration<br />
setup are also described. Several results <strong>of</strong> preliminary radiometric characterizations are<br />
reported.<br />
1. INTRODUCTION<br />
At present, st<strong>and</strong>ard quality high-accuracy radiometers for spectral irradiance <strong>and</strong><br />
radiance measurements are not available in the near infrared (NIR) wavelength range. Most<br />
national laboratories <strong>of</strong>fer detector calibrations only for spectral radiant power responsivity.<br />
Irradiance meters 2 frequently show response changes if the geometry (f/#) <strong>of</strong> the measured optical<br />
radiation changes. This usually happens in applications where the beam geometry reaching the<br />
irradiance meter is different than at calibration. In these situations the reflectance pattern inside<br />
the radiometer input optics can change. This change will result in irradiance response errors.<br />
Similarly, radiance meters frequently measure signal from outside <strong>of</strong> the source target area 3 .<br />
Here, again, the measurement results contain significant errors. In cases like this, the input optics<br />
<strong>of</strong> these radiance meters may not be properly designed, resulting in a poor out <strong>of</strong> field-<strong>of</strong>-view<br />
(FOV) blocking 4 .<br />
Sensitivity <strong>of</strong> NIR radiometers is an important issue in many radiometric applications.<br />
Typically, the peak radiant power level at the exit slit <strong>of</strong> a monochromator is a few µW only. The<br />
low power end <strong>of</strong> the signal can be several orders <strong>of</strong> magnitude smaller. In most monochromator<br />
applications, photomultiplier detectors are used to measure low level NIR signals. Similarly, low<br />
temperature black-bodies have extremely small radiance in the visible range <strong>and</strong> somewhat larger<br />
in the NIR. Radiance temperature meters measure radiance (scaled in temperature) in a narrow<br />
wavelength interval. Frequently used photomultiplier tubes 5 could be substituted with high<br />
sensitivity NIR detector-circuit packages in these radiance temperature meters by switching from<br />
the visible to the NIR range.<br />
The quality <strong>of</strong> NIR detectors have improved a lot in the past decade. As a result <strong>of</strong><br />
improved fabrication procedures, a 40 % to 50 % internal quantum efficiency increase was<br />
reported on Judson J16 P2 6 Ge photodiodes at the beginning <strong>of</strong> the decade 7 . The peak internal<br />
quantum efficiency was between 0.8 <strong>and</strong> 0.9. The reported shunt resistance <strong>of</strong> a 10 mm diameter<br />
photodiode was only 100 Ω. As introduced by Stock, the aging rate <strong>of</strong> the earliest Ge photodiode<br />
version was lower than +/- 0.5 % per year <strong>and</strong> was wavelength dependent. Within the 7 mm<br />
diameter central part <strong>of</strong> the photodiode active area the spatial response non-uniformity was less<br />
than +/- 0.5 % <strong>and</strong> increased at shorter wavelengths. Stock <strong>and</strong> others reported better spatial<br />
response uniformity for Ge photodiodes as compared to InGaAs 8 . They used a small integrating
sphere in front <strong>of</strong> the InGaAs photodiode to reduce the spatial response non-uniformity.<br />
However, the sphere decreased the absolute responsivity by a factor <strong>of</strong> about 300.<br />
In our earlier publication 9 , InGaAs, Ge, <strong>and</strong> InAs photodiodes were characterized. The<br />
average internal quantum efficiency <strong>of</strong> the tested mesa epitaxial type InGaAs photodiodes was<br />
0.975 at 1.3 µm. The position dependent change <strong>of</strong> the internal quantum efficiency was +/- 0.5<br />
%. However, because <strong>of</strong> the position-dependent reflectance change, the external quantum<br />
efficiency, which was proportional to the absolute response, changed 4 % as a function <strong>of</strong><br />
position across a diameter <strong>of</strong> a windowless InGaAs photodiode. These InGaAs photodiodes were<br />
linear over three decades <strong>of</strong> radiant power as measured at the high power end (0.8 mW<br />
maximum). They showed much higher shunt resistance at room temperature <strong>and</strong> higher external<br />
quantum efficiency than the few Ge <strong>and</strong> one InAs photodiodes examined in that study.<br />
As a continuation <strong>of</strong> our previous NIR detector study 9 , further internal quantum efficieny<br />
measurements were made on planar diffusion InGaAs photodiodes 10 . The measured internal<br />
quantum efficiencies were about 0.9 at 1.15 µm <strong>and</strong> 1.3 µm, <strong>and</strong> about 0.88 at 1.52 µm. The<br />
reason for these smaller values <strong>of</strong> the planar diffuse devices is that the junction was less shallow<br />
<strong>and</strong> the passivation was worse than for the mesa grown photodiodes. Also, the zinc dopant<br />
penetrates deeper than in the mesa technique, resulting in larger diode capacitance. With antireflection<br />
coating, these devices showed specular reflectances <strong>of</strong> about 2 %. All tested InGaAs<br />
photodiodes were p-on-n devices. The Ge photodiodes were constructed <strong>of</strong> p-type base material<br />
into which was diffused a shallow n-type junction. This construction is similar to those reported<br />
above 7 .<br />
The reason for adopting the planar diffuse technology to InGaAs manufacture was to<br />
produce larger area devices with greater stability. In the mesa device, the edge <strong>of</strong> the junction<br />
extends to the edge <strong>of</strong> the wafer <strong>and</strong> is therefore not protected. At present, it seems to be more<br />
important to produce high stability than to achieve 100 % internal quantum efficiency on InGaAs<br />
9, 10.<br />
photodiodes, which was the goal <strong>of</strong> the previous studies<br />
In the present work, large area, planar structure InGaAs photodiodes with dielectric<br />
passivation <strong>and</strong> large area Ge photodiodes similar to those reported above 7 are used. The<br />
diameters <strong>of</strong> the active areas are 5 mm for both the InGaAs <strong>and</strong> Ge photodiodes. They were all<br />
selected for high shunt resistance to obtain high sensitivity 11 . All photodiodes are hermetically<br />
sealed in st<strong>and</strong>ard packages <strong>of</strong> the same size, <strong>and</strong> cooled by two stage thermoelectric coolers.<br />
The temperature <strong>of</strong> the photodiodes is monitored by thermistors <strong>and</strong> controlled by temperature<br />
controllers 12 . Since lasers are used in these measurements, the photodiode chips are tilted by 1°<br />
to 2° out <strong>of</strong> parallel with the package window to avoid interference. Also, the sapphire windows<br />
have 20’ <strong>of</strong> wedge. The surfaces <strong>of</strong> all photodiodes are <strong>of</strong> optical quality.<br />
2.1. Radiant power response scale<br />
2. SCALE REALIZATION<br />
The detector response scale derivation scheme is shown in Fig. 1. The primary st<strong>and</strong>ard<br />
is an electrical substitution high accuracy cryogenic radiometer (HACR) 13 which measures laser<br />
power. At present, eleven laser lines are used between 320 nm <strong>and</strong> 950 nm. Silicon trap<br />
detectors 14 are calibrated against the HACR at the different laser lines. Interpolation between the<br />
calibrated points gives the spectral radiant power responsivity <strong>of</strong> a trap detector in A/W between<br />
406 nm <strong>and</strong> 920 nm 14 . The spectrally calibrated transfer st<strong>and</strong>ard trap detector(s) are used on the<br />
Visible Near Infrared Spectral Comparator Facility 1 , where working st<strong>and</strong>ard silicon photodiodes<br />
are calibrated against the trap detectors by using a substitution technique. The spectral power
esponse scale is extended from the silicon wavelength range to the NIR range with a pyroelectic<br />
transfer detector. The relative response <strong>of</strong> the gold-black coated pyroelectric detector is<br />
determined from spectral reflectance measurements <strong>of</strong> its coating. The coating transmission is<br />
negligible. Temperature controlled working st<strong>and</strong>ard Ge detectors are calibrated for spectral<br />
responsivity against the known response <strong>of</strong> the pyroelectric detector. Test NIR detectors can be<br />
calibrated for spectral radiant power responsivity (in A/W) against the working st<strong>and</strong>ard Ge<br />
detectors between 700 nm <strong>and</strong> 1800 nm.<br />
The goal <strong>of</strong> our scale realization work is to derive the spectral irradiance <strong>and</strong> radiance<br />
response scales from the existing radiant power response scale. To achieve this goal st<strong>and</strong>ard<br />
quality radiometers were developed. Optical <strong>and</strong> radiometric design considerations are discussed<br />
<strong>of</strong> two different kinds <strong>of</strong> irradiance meters <strong>and</strong> a radiance meter. The characterization results <strong>of</strong><br />
the radiance meter are discussed in this paper. The electronic characteristics <strong>of</strong> the radiometers<br />
<strong>and</strong> the detailed radiometric characterization <strong>of</strong> the irradiance meters will be discussed in<br />
consecutive papers. The scheme <strong>of</strong> the new calibration setup where the new radiometers are<br />
utilized is described in this paper. The scale realization measurements <strong>and</strong> the error budget <strong>of</strong> the<br />
new scales will be discussed in the final paper.<br />
2.2. Spectral irradiance <strong>and</strong> radiance response scales<br />
In a previous <strong>NIST</strong> project 15 , an irradiance meter composed <strong>of</strong> a silicon photodiode, an<br />
interference filter, an integrating sphere, <strong>and</strong> an input aperture was calibrated against a st<strong>and</strong>ard<br />
silicon detector using a laser beam. In this manner a detector-based irradiance scale was derived<br />
from the radiant power response <strong>of</strong> the st<strong>and</strong>ard silicon detector.<br />
HACR<br />
Ultraviolet-Visible-NIR-IR<br />
Radiant Power Scale<br />
Silicon Trap<br />
Detector<br />
Visible-NIR small area non-uniform<br />
monochromatic source / comparator<br />
Spectral Radiant Power Response Scale<br />
Power / Irradiance<br />
meters<br />
VIS-NIR large area uniform-field<br />
monochromatic source / comparator<br />
Spectral Irradiance / Radiance Response Scales<br />
Irradiance/Radiance<br />
meters<br />
Pyroelectric<br />
Detector<br />
Fig. 1. Detector response scale derivation scheme
This irradiance meter was then used to measure the spectral irradiance <strong>of</strong> two other beam<br />
geometries at the laser wavelength. The other two sources were st<strong>and</strong>ard spectral irradiance<br />
lamps (blackbody source-based scale) <strong>and</strong> the electron storage ring, SURF-II. The detector-based<br />
scale at the test wavelength, was 0.76 % lower than the source-based scale, <strong>and</strong> 0.25 % higher<br />
than the electron storage ring scale. Because <strong>of</strong> the high spatial response uniformity within the<br />
aperture area, the total uncertainty for the detector-based irradiance scale was 0.5 %. In contrast,<br />
the uncertainty <strong>of</strong> the source-based irradiance scale was 1.68 %. Throughout this paper, all<br />
uncertainty values are given as a relative exp<strong>and</strong>ed uncertainty with a coverage factor <strong>of</strong> k=2.<br />
This is equivalent to an uncertainty consisting <strong>of</strong> two st<strong>and</strong>ard deviations about the mean <strong>of</strong> a<br />
normalized Gaussian distribution.<br />
In our earlier report 16 , a technique had been described for realizing spectral irradiance<br />
scale using a large-area, high temperature, uniform black-body source <strong>and</strong> filter-radiometers that<br />
are calibrated on a detector-based system. The goal <strong>of</strong> this project was to reduce the<br />
measurement uncertainties in the present source-based spectral irradiance scale 21 . The filter<br />
radiometers were calibrated on the <strong>NIST</strong> Spectral Comparator Facility 1 , <strong>and</strong> the aperture areas<br />
were measured by flux comparison with a uniform source 17 . Six filter radiometers covering the<br />
visible <strong>and</strong> NIR wavelength ranges were used to measure a known irradiance source (FEL lamp).<br />
The measurements agreed with predictions to within 1% 18 . Comparisons were also conducted<br />
with three <strong>NIST</strong> st<strong>and</strong>ard photometers, <strong>and</strong> similar agreement was observed. Since the<br />
temperature <strong>and</strong> radiance calibration <strong>of</strong> the gold point blackbody source is also detector-based 19 ,<br />
the agreement will be improved if the input geometry <strong>of</strong> the filter radiometers is modified. The<br />
new input geometry requires a diffusing input element within the aperture area to realize the<br />
cosine function <strong>of</strong> illuminance measurements with a high accuracy.<br />
In radiant power response calibrations, the active area <strong>of</strong> the detectors was underfilled by<br />
the monochromatic beam <strong>and</strong> the detectors measured radiant power. Since the diameter <strong>of</strong> the f/9<br />
calibrating beam at the <strong>NIST</strong> Spectral Comparator Facility is small (i.e., it can be changed from<br />
1.2 mm to a few mm) <strong>and</strong> is spatially non-uniform, irradiance measuring radiometers cannot be<br />
overfilled with this beam. Otherwise, their irradiance responsivity would change as a function <strong>of</strong><br />
detector aperture positioning. Instead, the detector area, within the limiting aperture, is mapped<br />
(scanned) with the small, non-uniform beam, <strong>and</strong> the average power responsivity, savg, is<br />
determined versus wavelength, λ. The spectral irradiance responsivity, sE(λ), <strong>of</strong> a silicon or NIR<br />
irradiance meter is derived from its own spatially averaged spectral radiant power responsivity:<br />
sE(λ) = F cosα savg(λ) [A m 2 /W] (1)<br />
where m 2 is the unit <strong>of</strong> the known aperture area F, A is the unit <strong>of</strong> the detector output current, W<br />
is the unit <strong>of</strong> the measured beam power, <strong>and</strong> α is the angle <strong>of</strong> the incident beam. The angle <strong>of</strong><br />
incidence is the angle between the normal <strong>of</strong> the aperture plane <strong>and</strong> the axis <strong>of</strong> the incident beam.<br />
If the incident beam is different from perpendicular (relative to the aperture plane), the irradiance,<br />
as measured by the irradiance meter, will change according to the cosine <strong>of</strong> the incidence angle 20 .<br />
<strong>Note</strong> that α is constant in eq. 1. If the incident beam is not parallel, α is no longer a constant, but<br />
can take a range <strong>of</strong> values depending on the f/#. In this case the integral <strong>of</strong> cosα will be measured<br />
for all incident angles (changing α) <strong>of</strong> the beam.<br />
The calibrated irradiance meter can be used as a st<strong>and</strong>ard to calibrate test irradiance<br />
meters by substitution in a large enough, spatially uniform monochromatic field. The large <strong>and</strong>
uniform monochromatic fields are realized by either a collimator or an integrating sphere coupled<br />
to the output <strong>of</strong> a monochromatic radiation source.<br />
RADIANCE or<br />
IRRADIANCE<br />
TEST DEVICE<br />
EQUIPMENT FOR<br />
FLUX TRANSFER<br />
LIGHT TIGHT BOX<br />
MONOCHROMATIC<br />
BEAM<br />
INTEGRATING<br />
SPHERE<br />
TEMPERATURE<br />
CONTROLLED<br />
MONITORING<br />
DETECTOR<br />
OPTICAL FIBER<br />
D<br />
STANDARD<br />
IRRADIANCE<br />
METER<br />
DRIVE<br />
COMPUTER<br />
DVM2<br />
DVM1<br />
Fig. 2. Block scheme <strong>of</strong> the detector radiance/irradiance response calibration setup<br />
Figure 2 shows the block scheme <strong>of</strong> our detector radiance/irradiance response calibration<br />
setup, which is being constructed. Instead <strong>of</strong> a traditional lamp-monochromator assembly, high<br />
intensity monochromatic sources, such as lasers or filtered lamps/arcs are to be used to produce<br />
the monochromatic beam for the integrating sphere. The radiance <strong>of</strong> the sphere wall is monitored<br />
by a two-color (Si on top <strong>of</strong> InGaAs) detector which can hold the spectral radiance scale after<br />
scale realization. A st<strong>and</strong>ard irradiance meter is used to calibrate the monochromatic, large<br />
output area, Lambertian source <strong>of</strong> the sphere (or a plaque) for spectral radiance, L(λ). At the<br />
<strong>NIST</strong> Spectral Comparator Facility the st<strong>and</strong>ard irradiance meter is calibrated first for spectral<br />
power responsivity, s(λ), which is the wavelength dependent ratio <strong>of</strong> the detector output current,<br />
I, to the radiant power, P, as measured by the detector. A precision aperture <strong>of</strong> known area is<br />
mounted in front <strong>of</strong> the detector. If necessary, savg(λ) can be used instead <strong>of</strong> s(λ). The distance,<br />
D, between the source aperture <strong>and</strong> the detector (irradiance meter) aperture is measured. The<br />
output current <strong>of</strong> the st<strong>and</strong>ard irradiance meter is:<br />
I(λ) = s(λ) P(λ) [A], (2)<br />
where P(λ) is the spectral radiant power from the sphere source as measured by the st<strong>and</strong>ard<br />
irradiance meter. The spectral radiance can be calculated from P(λ), applying the geometric<br />
extent, GD 21 :<br />
L(λ) = P(λ) / GD [W m -2 sr -1 ] (3)<br />
The geometric extent, GD, can be given by the st<strong>and</strong>ard expression which describes the<br />
flux transfer between circular, parallel, <strong>and</strong> coaxial apertures with radii rS (for the source<br />
aperture) <strong>and</strong> rD (for the detector aperture), <strong>and</strong> separation, D,<br />
GD = (π 2 /2){(D 2 +rS 2 +rD 2 ) - [(D 2 +rS 2 +rD 2 ) 2 - 4 rS 2 rD 2 ] 1/2 } [m 2 sr] (4)
As a second step, the radiance meter measures the above determined radiance <strong>of</strong> the<br />
sphere source. The spectral radiance response <strong>of</strong> the radiance meter (test device in this case) is a<br />
ratio <strong>of</strong> its output current or voltage to the measured sphere radiance versus wavelength.<br />
Test irradiance meters can be substituted for the st<strong>and</strong>ard irradiance meter in the uniform<br />
monochromatic irradiance <strong>of</strong> the sphere source. This is a simple irradiance response calibration<br />
method for large area irradiance (test) meters. The same irradiance is measured by both<br />
irradiance meters. This irradiance is calculated from the irradiance response <strong>of</strong> the st<strong>and</strong>ard<br />
irradiance meter. The irradiance response <strong>of</strong> the test device is then determined from its output<br />
current or voltage reading <strong>and</strong> the calculated (<strong>and</strong> measured) irradiance, versus wavelength.<br />
The response <strong>of</strong> the st<strong>and</strong>ard irradiance meter has to be the same for the f/9 calibrating<br />
beam <strong>and</strong> the beam geometry at radiance <strong>and</strong> irradiance measurements (radiation from the<br />
Lambertian source).<br />
Properly designed NIR radiometers are the key components in realizing the above<br />
described radiometric scales for the NIR wavelength range.<br />
3. MECHANICAL AND OPTICAL DESIGN OF NIR RADIOMETERS<br />
3.1. Radiant power meter<br />
Figure 3 shows the design <strong>of</strong> the photodiode-housing for radiant power measurement.<br />
The TO-8 photodiode package is plugged into the center hole <strong>of</strong> the threaded holder. The<br />
threaded holder is limited to a FOV <strong>of</strong> +/- 30° for the photodiode to block radiation from the<br />
sides. During radiant power (W) measurement, the active area <strong>of</strong> the photodiode is underfilled by<br />
the incident beam. No aperture is needed in front <strong>of</strong> the photodiode for this measurement.<br />
However, the spatial response non-uniformity <strong>of</strong> the photodiode has to be in the order <strong>of</strong> 0.1 % to<br />
get repeatable radiant power responsivities (A/W) for different beam sizes <strong>and</strong> beam positions.<br />
The threaded holder can be used to mount different accessories, such as filters <strong>and</strong>/or apertures, in<br />
front <strong>of</strong> the photodiode. The heat from the bottom <strong>of</strong> the photodiode case is conducted by the<br />
copper plate to the heat sink where it is dissipated. On the side <strong>of</strong> the heat sink there is a<br />
connector for the temperature controller. The photodiode is connected to the input <strong>of</strong> the<br />
electronic unit through a connector in the adapter ring. The optical unit, which involves the<br />
adapter ring, can be detached from the electronic unit. The connector gives a direct access to<br />
both the photodiode leads <strong>and</strong> the input <strong>of</strong> the current-to-voltage converting electronics 11 . As a<br />
result <strong>of</strong> this design consideration, the gain linearity calibration <strong>of</strong> the signal measuring<br />
electronics can be done directly.<br />
3.2. Irradiance measurement<br />
In irradiance measurements, according to equation 1, the flux (radiant power) is measured<br />
within the aperture area <strong>of</strong> a detector. The incident flux has to overfill the aperture area. The<br />
measured irradiance (the flux collected by the aperture) depends on the angle <strong>of</strong> incidence. At a<br />
scale realization the area <strong>of</strong> the precision aperture has to be known. Test or secondary st<strong>and</strong>ard<br />
irradiance meters do not need apertures <strong>of</strong> known area. They are usually calibrated against
Threaded Holder<br />
Photodiode Hole<br />
Teflon Ring<br />
Copper Plate<br />
Heat Sink<br />
Adapter Ring<br />
Connector<br />
Electronics Housing<br />
O 63.5 mm<br />
Fig. 3. Ge or InGaAs photodiode housing for radiant power measurements<br />
st<strong>and</strong>ard irradiance meters, by substitution. If the field <strong>of</strong> irradiation is uniform, the spatial<br />
response uniformity <strong>of</strong> the detector does not have to be very good. In this case, the output<br />
electrical signal <strong>of</strong> the meter is determined by the average responsivity <strong>of</strong> the detector within the<br />
aperture area. The relation between the output electrical signal <strong>and</strong> the input irradiance is linear if<br />
the short circuit current <strong>of</strong> the photodiode is measured. The meters are calibrated for irradiance<br />
responsivity as a function <strong>of</strong> wavelength.<br />
The most important requirement for an irradiance meter is to design its front geometry to<br />
satisfy the cosine law <strong>of</strong> irradiance measurements for the overall angular range <strong>of</strong> the incident<br />
flux. Figure 4.a shows a bare detector with a very thin aperture on top <strong>of</strong> it. This is the simplest<br />
<strong>and</strong> most ideal design for eliminating reflections from the aperture edge <strong>and</strong> between the front<br />
surface <strong>of</strong> the detector <strong>and</strong> the back surface <strong>of</strong> the aperture for all possible input beam geometries<br />
(from parallel to a given f/#). However, in most applications the aperture cannot be positioned on<br />
top <strong>of</strong> the bare detector. In our present work, both the Ge <strong>and</strong> the InGaAs photodiodes are<br />
located in hermetically sealed cases with windows on top. Similarly, in many applications, filters<br />
are needed between the aperture <strong>and</strong> the detector to modify the overall spectral responsivity.<br />
Figure 4.b shows the ideal situation where the incident beam is perpendicular to the aperture <strong>and</strong><br />
the detector, <strong>and</strong> therefore there are no inter-reflections between the two in spite <strong>of</strong> a gap between<br />
them. In detector calibrations the monochromatic beam is usually not parallel. In Fig. 4.c the<br />
incident beam has a given f/#. In Fig. 4.d the incident beam is not normal to the aperture plane <strong>of</strong><br />
the irradiance meter. In the last two cases there are inter-reflections between the apertures <strong>and</strong><br />
the detectors. If filters are used <strong>and</strong>/or the detector case has a front window, additional reflections<br />
will happen 22 . In these situations the internal reflectance pattern depends on the beam geometry<br />
<strong>and</strong> the cosine law <strong>of</strong> irradiance measurements will work only with a decreased accuracy.<br />
However, if the irradiance meter performs accurate cosine measurement within its FOV, the<br />
absolute irradiance response can be determined with high accuracy for the different input beam<br />
geometries.
β<br />
(a) (b) (c) (d)<br />
Fig. 4. Traditional input optics <strong>of</strong> irradiance meters with different incident beams<br />
(a) Bare detector with a thin aperture on the top<br />
(b) The incident beam is perpendicular to the plane <strong>of</strong> the aperture<br />
(c) The incident beam has a given f/#<br />
(d) The incident beam is not perpendicular to the plane <strong>of</strong> the aperture<br />
FOV Limiting Aperture<br />
Precision Aperture<br />
Diffuser<br />
Photodiode<br />
Teflon Ring<br />
Copper Plate<br />
β<br />
60 o<br />
Fig. 5. Cross-section showing the input optics <strong>of</strong> a diffuser-type irradiance meter<br />
3.3. Diffuser-type irradiance meter<br />
Figure 5 shows the modified front piece (threaded holder) <strong>of</strong> the photodiode-housing for<br />
irradiance measurements. A flashed opal glass diffuser is located between the very thin aperture<br />
(black nickel coated copper) <strong>and</strong> the photodiode to eliminate internal reflections <strong>and</strong> to produce a<br />
spatially uniform surface within the aperture area. The goal is to maintain the high accuracy <strong>of</strong><br />
the cosine function <strong>of</strong> irradiance measurements. Without the right input geometry, the shape <strong>of</strong><br />
the cosine function could be altered greatly, resulting in low measurement accuracy.<br />
α
1.0<br />
0.9<br />
0.8<br />
0.7<br />
0.6<br />
Opal<br />
Spectralon<br />
0.5<br />
-80 -60 -40 -20 0 20 40 60 80<br />
Observation angle [°]<br />
Fig. 6. BTDF <strong>of</strong> flashed opal glass <strong>and</strong> Spectralon diffusers at normal beam incidence<br />
1<br />
0.8<br />
0.6<br />
0.4<br />
0.2<br />
0<br />
210<br />
Lambertian<br />
Measured<br />
Incident Beam<br />
120<br />
240<br />
90<br />
270<br />
Flashed Opal Glass<br />
60<br />
300<br />
30<br />
330<br />
Fig. 7. Ideal Lambertian (continuous) <strong>and</strong> flashed opal glass (dashed)<br />
angular transmittance distributions<br />
The goniometric (Bidirectional) Transmittance Distribution Function (BTDF) <strong>of</strong> two<br />
different diffusers were tested at 600 nm, with normal beam incidence on the <strong>NIST</strong> High<br />
Accuracy Reference Reflectometer-Spectrophotometer 23 . The normalized radiance <strong>of</strong><br />
transmission values for two materials as a function <strong>of</strong> observation angle are shown in Fig. 6. The<br />
3.2 mm thick Spectralon diffuser showed a large forward scatter between +/- 10°. The radiance<br />
<strong>of</strong> the transmittance <strong>of</strong> the 2.5 mm thick flashed opal glass was constant in a reasonably wide<br />
0
angular range. Figure 7 shows that the ideal Lambertian curve (solid circle) <strong>and</strong> the measured<br />
opal glass transmittance (dashed circle) curve are close to each other. Consequently, the higher<br />
quality flashed opal glass diffuser was selected for our irradiance meter developments.<br />
As it is shown in Fig. 5, a small (5 mm diameter) photodiode can receive the Lambertian<br />
radiation from a large (16 mm diameter) opal glass diffuser which is illuminated through a large<br />
(8 mm diameter) aperture. By this method the photodiode measures the radiation at the center <strong>of</strong><br />
an extended-source diffuser, where the radiance from the diffuser is constant. The beam<br />
geometry may change roughly from f/1 to parallel. The FOV is determined by the front aperture<br />
<strong>and</strong> the precision aperture. There is a baffle between the two apertures to minimize the measured<br />
stray radiation.<br />
PRECISION<br />
APERTURE<br />
O 7.98 mm<br />
INPUT BAFFLE TUBE<br />
DIFFUSER<br />
O 8.5<br />
mm<br />
PHOTODIODE<br />
O 50 mm<br />
COPPER PLATE<br />
HEAT SINK<br />
3.4. Sphere-type irradiance meter<br />
SPECTRALON SPHERE UNIT<br />
O 50 mm<br />
F/2<br />
Fig. 8. Cross section <strong>of</strong> a sphere-input irradiance meter<br />
Figure 8 shows another radiometer input geometry for accurate irradiance measurements.<br />
In this sphere-input irradiance meter the diffusing element, which gives the uniform input surface<br />
within the aperture area, is a small integrating sphere. The shape <strong>of</strong> the incident beam can change<br />
between f/2 <strong>and</strong> parallel. The FOV is limited by the precision aperture <strong>and</strong> the front aperture <strong>of</strong><br />
the input baffle tube. The sphere wall is made <strong>of</strong> machined Spectralon6 diffusing material, which
has a reflectance <strong>of</strong> 99 %. The irradiance on any part <strong>of</strong> the sphere wall is almost the same <strong>and</strong><br />
proportional to the input flux (radiant power) collected by the aperture. A plane-parallel diffuser,<br />
located in the exit port <strong>of</strong> the sphere, is part <strong>of</strong> the sphere wall. It is irradiated by the multiple<br />
reflections within the sphere. Its Lambertian transmitted radiation is measured by the Ge or<br />
InGaAs photodiode. The efficiency <strong>of</strong> the flux transfer between the diffuser <strong>and</strong> the photodiode 15<br />
is determined from the geometry between them. The flux coupling efficiency, κ, for a 5 mm<br />
diameter photodiode, an exit port diameter <strong>of</strong> 10.5 mm, <strong>and</strong> a separation (between the diffuser<br />
<strong>and</strong> the photodiode) <strong>of</strong> 6.5 mm, is equal to 8.5 %. The efficiency, τ, <strong>of</strong> the 50 mm diameter<br />
sphere with its two ports <strong>and</strong> a diffuser (with a transmittance <strong>of</strong> 36 %) located in the exit port, is<br />
equal to 21 %. The overall radiant flux efficiency is κ τ = 0.018, resulting in a signal attenuation<br />
<strong>of</strong> 56. High flux must be sacrificed in order to achieve st<strong>and</strong>ard quality spatial response<br />
uniformity.<br />
EYEPIECE<br />
CAMERA<br />
LENS<br />
APERTURE<br />
STOP<br />
FIELD STOP<br />
MIRROR<br />
SECOND<br />
IMAGING<br />
HEAT<br />
SINK<br />
PHOTO<br />
DIODE<br />
ADAPTER &<br />
CONNECTOR<br />
CURRENT-<br />
TO-VOLTAGE<br />
CONVERTER<br />
OUTPUT<br />
GAIN<br />
SWITCH<br />
Fig. 9. Optical/mechanical scheme <strong>of</strong> a radiance optics as attached to the irradiance meter<br />
3.5. Radiance meter<br />
Radiance is a source characteristic which can be measured by radiance meters. Usually,<br />
extended sources are characterized by radiance measurements. The requirement from a st<strong>and</strong>ard<br />
quality radiance meter is to have a well-defined measurement angle to measure the source target<br />
area only.<br />
Figure 9 shows the simplified optical/mechanical design <strong>of</strong> our radiance meter where the<br />
input optics are attached to the radiometer base-unit with a Bayonet mount. The beveled aperture<br />
mirror serves as a field stop, <strong>and</strong> it is positioned into the focus <strong>of</strong> the 35 mm focal length camera<br />
lens. Beveling is important to minimize stray radiation. This camera lens has a broad-b<strong>and</strong> antireflecting<br />
(AR) coating, resulting in high transmittance in the visible <strong>and</strong> NIR ranges. The<br />
surroundings <strong>of</strong> the source target area can be viewed through the eye-piece. The target radiation<br />
is imaged to the center <strong>of</strong> the photodiode through the second imaging optics. The second imaging<br />
optics has an important role to produce a well defined FOV <strong>and</strong> a very efficient out-<strong>of</strong>-FOV<br />
blocking. The original aperture stays in front <strong>of</strong> the photodiode, <strong>and</strong> it is underfilled. There is a<br />
dominant aperture stop in front <strong>of</strong> the second imaging optics in order to keep the flux response <strong>of</strong><br />
the optics constant for different target distances <strong>of</strong> the adjustable focus camera lens.
1.0000<br />
0.1000<br />
0.0100<br />
0.0010<br />
0.0001<br />
-0.6 -0.4 -0.2 0 0.2 0.4 0.6<br />
Rotation angle <strong>of</strong> meter [degree]<br />
Fig. 10. Radiance measurement pr<strong>of</strong>ile (point spread function) <strong>of</strong> a radiance meter<br />
Figure 10 shows the point spread function <strong>of</strong> our previous generation radiance meter,<br />
similar to the one in Fig. 9, with a 50 mm focal length camera lens <strong>and</strong> a 0.7 mm diameter field<br />
stop. The plot shows the measured radiance <strong>of</strong> a small source-spot versus rotation angle <strong>of</strong> the<br />
radiance meter. The roughly 3 mm diameter source spot was about 2 m away from the radiance<br />
meter. The pivot point <strong>of</strong> the radiance meter was the center <strong>of</strong> the field stop. The figure shows<br />
that the radiance measurement angle <strong>of</strong> the meter was about 1° <strong>and</strong> the out-<strong>of</strong>-FOV blocking was<br />
larger than four decades. The radiance response <strong>of</strong> the st<strong>and</strong>ard radiometer was measured at<br />
target distances between 1 m <strong>and</strong> 2 m. Figure 11 shows that the radiance response did not change<br />
more than the uncertainty <strong>of</strong> our measurements, which was 0.1 %.<br />
1.002<br />
1.001<br />
1<br />
0.999<br />
0.998<br />
1 1.2 1.4 1.6 1.8 2 2.2<br />
Target distance (m)<br />
Fig. 11. Change <strong>of</strong> radiance responsivity <strong>of</strong> an adjustable focus radiance meter<br />
4. CONCLUSIONS<br />
Mechanical, optical, <strong>and</strong> radiometric design criteria <strong>of</strong> radiant power, irradiance, <strong>and</strong><br />
radiance measuring radiometers have been discussed for high accuracy applications. The<br />
described st<strong>and</strong>ards quality NIR radiometers are being used to realize the <strong>NIST</strong> detector-based<br />
irradiance <strong>and</strong> radiance scales between 0.8 µm <strong>and</strong> 1.8 µm. The principle <strong>of</strong> radiometer<br />
calibrations <strong>and</strong> the design considerations for the calibration set-up have also been discussed. The<br />
paper describes the first part <strong>of</strong> the NIR scale realization work. Design criteria for wide dynamic<br />
range DC <strong>and</strong> AC detector signal measuring electronics, electrical <strong>and</strong> radiometric NIR detector<br />
characterizations with performance comparison <strong>of</strong> Ge <strong>and</strong> InGaAs radiometers, <strong>and</strong> NIR detectorbased<br />
scale realizations with error budget determination will be described in consecutive papers.
5. ACKNOWLEDGEMENTS<br />
The author thanks Don Lynch <strong>of</strong> Reyer Corporation for the radiometer fabrication related<br />
work, George Andor <strong>of</strong> Hungarian Office <strong>of</strong> Measures for the BTDF measurements, Gyula Dezsi<br />
<strong>of</strong> Hungarian Office <strong>of</strong> Measures <strong>and</strong> Robert Saunders for participating in the construction <strong>of</strong> the<br />
radiance/irradiance calibration set-up, <strong>and</strong> Yoshi Ohno for helping in the radiance/luminance<br />
response measurements.<br />
6. REFERENCES<br />
1. T.C. Larason, S.S. Bruce, <strong>and</strong> C.L. Cromer, “The <strong>NIST</strong> High Accuracy Scale for<br />
Absolute Spectral Response from 406 nm to 920 nm,”J. Res. Natl. Inst. St<strong>and</strong>. Technol., Vol.<br />
101, No.2, pp. 133-140, 1996.<br />
2. L.P. Boivin, “Diffusers in Silicon-photodiode Radiometers,” Appl. Opt., Vol. 21, No.<br />
5, pp. 918-923, 1982.<br />
3. J.L. Mueller, B.C. Johnson, C.L. Cromer, J.W. Cooper, J.T. McLean, S.B. Hooker, <strong>and</strong><br />
T.L. Westphal, “The Second SeaWiFS Intercalibration Round-Robin Experiment, SIRREX-2,”<br />
NASA <strong>Technical</strong> Memor<strong>and</strong>um 104566, SeaWiFS <strong>Technical</strong> Report Series, Vol. 16, pp. 36, June<br />
1993.<br />
4. G. Eppeldauer <strong>and</strong> Y. Ohno, “Illuminance/Luminance St<strong>and</strong>ard Photometer,”<br />
CORM’96, Natl. Inst. St<strong>and</strong>. Technol., Gaithersburg, MD, May 21-23, 1996.<br />
5. J.H. Walker, R.D. Saunders, <strong>and</strong> A.T. Hattenburg, “Spectral Radiance Calibrations,”<br />
NBS Special Publication 250-1, pp. 12, 1987.<br />
6. Identification <strong>of</strong> commercial equipment to specify adequately an experimental problem<br />
does not imply recommendation or endorsement by the <strong>National</strong> <strong>Institute</strong> <strong>of</strong> <strong>St<strong>and</strong>ards</strong> <strong>and</strong><br />
Technology nor does it imply that the equipment identified is necessarily the best available for<br />
the purpose.<br />
7. K.D. Stock, “Internal Quantum Efficiency <strong>of</strong> Ge Photodiodes,” Appl. Opt., Vol. 27,<br />
No.1, pp.12-14, 1988.<br />
8. K.D. Stock, R. Heine, <strong>and</strong> H. H<strong>of</strong>er, “Influence <strong>of</strong> Inhomogeneity <strong>of</strong> NIR-Photodiodes<br />
on Calibrations at 1047 nm,” Metrologia, Vol. 28, pp. 207-210, 1991.<br />
9. G. Eppeldauer, M. Tsudagawa, E. Zalewski, <strong>and</strong> J. Houston, “Electronic <strong>and</strong><br />
Radiometric Characteristics <strong>of</strong> Near Infrared Photodiodes,” 13th Intern. Symp. Photonic<br />
Measurements, IMEKO, Braunschweig, FRG, Proc. pp. 215-224, 1987.<br />
10. E. Zalewski, “Characteristics <strong>of</strong> Ge <strong>and</strong> InGaAs Photodiodes,” Inst. <strong>of</strong> Physics Conf.<br />
Series, No. 92, pp. 47-54, New Developments <strong>and</strong> Applications in Optical Radiometry,<br />
International Conf. on Radiometry, NPL, London, UK, 12-13 April, 1988.
11. G. Eppeldauer <strong>and</strong> J. Hardis, “Fourteen-decade Photocurrent Measurements with<br />
Large-area Silicon Photodiodes at Room Temperature,” Appl. Opt., Vol. 30, No. 22, pp. 3091-<br />
3099, 1991.<br />
12. G. Eppeldauer, “Temperature-monitored/controlled Silicon Photodiodes for<br />
St<strong>and</strong>ardization,” SPIE Proc., Volume 1479, pp. 71-77, 1991.<br />
13. T.R. Gentile, J.M. Houston, J.E. Hardis, C.L. Cromer, <strong>and</strong> A.C. Parr, “<strong>National</strong><br />
<strong>Institute</strong> <strong>of</strong> <strong>St<strong>and</strong>ards</strong> <strong>and</strong> Technology High-Accuracy Cryogenic Radiometer,” Appl. Opt. Vol.<br />
35, No. 7, pp. 1056-1068, 1996.<br />
14. T.R. Gentile, J.M. Houston, <strong>and</strong> C.L. Cromer, “Realization <strong>of</strong> a Scale <strong>of</strong> Absolute<br />
Spectral Response Using the <strong>NIST</strong> High Accuracy Cryogenic Radiometer,” to be published in<br />
Appl. Opt.<br />
15. A.R. Schaefer, R.D. Saunders, <strong>and</strong> L.R. Hughey, “Intercomparison Between<br />
Independent Irradiance Scales Based on Silicon Photodiode Physics, Gold-point Blackbody<br />
Radiation, <strong>and</strong> Synchrotron Radiation,” Opt. Engineering, Vol. 25, No. 7, pp. 892-896, 1986.<br />
16. B.C. Johnson, C.L. Cromer, R.D. Saunders, G. Eppeldauer, J. Fowler, V.I. Sapritsky,<br />
<strong>and</strong> G. Dezsi, “A Method <strong>of</strong> Realizing Spectral Irradiance Based on an Absolute Cryogenic<br />
Radiometer”, Metrologia, Vol. 30, pp. 309-315, 1993.<br />
17. J.B. Fowler <strong>and</strong> G. Dezsi, “High Accuracy Measurement <strong>of</strong> Aperture Area Relative to<br />
a St<strong>and</strong>ard Known Aperture,” J. Res. Natl. Inst. St<strong>and</strong>. Technol., Vol. 100, No. 3, pp. 277-283,<br />
1995.<br />
18. B.K. Tsai, B.C. Johnson, R.D. Saunders, <strong>and</strong> C.L. Cromer, “Comparison <strong>of</strong> Filter<br />
Radiometer Spectral Responsivity with the <strong>NIST</strong> Spectral Irradiance <strong>and</strong> Illuminance Scales,”<br />
Metrologia, Vol. 32, pp. 473-477, 1995/96.<br />
19. K.D. Mielenz, R.D. Saunders, <strong>and</strong> J.B. Shumaker, “Spectroradiometric Determination<br />
<strong>of</strong> the Freezing Temperature <strong>of</strong> Gold,” J. Res. Natl. Inst. St<strong>and</strong>. Technol., Vol. 95, No. 1, pp.49-<br />
67, 1990.<br />
20. W. Budde, “Physical Detectors <strong>of</strong> Optical Radiation,” Optical Radiation<br />
Measurements, Vol. 4, pp. 19, Academic Press, Inc., 1983.<br />
21. J.H. Walker, R.D. Saunders, J.K. Jackson, <strong>and</strong> D.A. McSparron, “Spectral Irradiance<br />
Calibrations,” NBS Special Publication 250-20, pp. 7, 1987.<br />
22. C.L. Cromer, G. Eppeldauer, J.E. Hardis, T.C. Larason, <strong>and</strong> A.C. Parr, “<strong>National</strong><br />
<strong>Institute</strong> <strong>of</strong> <strong>St<strong>and</strong>ards</strong> <strong>and</strong> Technology Detector-based Photometric Scale,” Appl. Opt. Vol. 32,<br />
No. 16, pp. 2936-2948, 1993.<br />
23. J.E. Proctor <strong>and</strong> P.Y. Barnes, “<strong>NIST</strong> High Accuracy Reference Reflectometer-<br />
Spectrophotometer,” To be published in the J. Res. Natl. Inst. St<strong>and</strong>. Technol., 1996.
Calibration <strong>of</strong> a pyroelectric detector<br />
at 10.6 �m with the <strong>National</strong> <strong>Institute</strong> <strong>of</strong><br />
<strong>St<strong>and</strong>ards</strong> <strong>and</strong> Technology high-accuracy<br />
cryogenic radiometer<br />
T. R. Gentile, J. M. Houston, G. Eppeldauer, A. L. Migdall, <strong>and</strong> C. L. Cromer<br />
The <strong>National</strong> <strong>Institute</strong> <strong>of</strong> <strong>St<strong>and</strong>ards</strong> <strong>and</strong> Technology �<strong>NIST</strong>� is establishing an infrared detector calibration<br />
facility to improve radiometric st<strong>and</strong>ards at infrared wavelengths. The absolute response <strong>of</strong> the<br />
cryogenic bolometer that serves as the transfer st<strong>and</strong>ard for this facility is being linked to the <strong>NIST</strong> highaccuracy<br />
cryogenic radiometer �HACR� at a few laser wavelengths. At the 10.6-�m CO 2laser line, this<br />
link is being established through a pyroelectric detector that has been calibrated against the HACR. We<br />
describe the apparatus, methods, <strong>and</strong> uncertainties for the calibration <strong>of</strong> this pyroelectric detector.<br />
1. Introduction<br />
To meet the growing need for calibrated detectors at<br />
infrared wavelengths, the <strong>National</strong> <strong>Institute</strong> <strong>of</strong> <strong>St<strong>and</strong>ards</strong><br />
<strong>and</strong> Technology �<strong>NIST</strong>� is establishing an infrared<br />
detector calibration facility. 1 The goal <strong>of</strong> this<br />
facility is to provide absolute responsivity calibrations<br />
<strong>of</strong> detectors in the 2–20 �m spectral region with<br />
a relative exp<strong>and</strong>ed uncertainty <strong>of</strong> �4% �2 sigma�.<br />
To serve as a transfer st<strong>and</strong>ard detector, a cryogenic<br />
bolometer has been constructed. 2,3,4 The calibration<br />
<strong>of</strong> this bolometer is being linked to the <strong>NIST</strong> highaccuracy<br />
cryogenic radiometer �HACR� 5 at a few laser<br />
wavelengths. At the 10.6-�m CO 2 laser line, the<br />
link to the HACR is being established through a calibrated<br />
pyroelectric detector. In this paper we describe<br />
the apparatus, methods, <strong>and</strong> uncertainties for<br />
a calibration <strong>of</strong> the pyroelectric detector against the<br />
HACR. The transfer <strong>of</strong> the calibration from the pyroelectric<br />
detector to the bolometer will be the subject<br />
<strong>of</strong> a separate paper.<br />
The HACR is a cryogenic electrical substitution<br />
radiometer that serves as a primary st<strong>and</strong>ard for<br />
optical power measurements <strong>and</strong> has been used to<br />
measure radiant power at visible wavelengths with a<br />
relative st<strong>and</strong>ard uncertainty <strong>of</strong> 0.021%. The<br />
HACR is best suited for measurements at an optical<br />
The authors are with the <strong>National</strong> <strong>Institute</strong> <strong>of</strong> <strong>St<strong>and</strong>ards</strong> <strong>and</strong><br />
Technology, Gaithersburg, Maryl<strong>and</strong> 20899.<br />
Received 3 September 1996; revised manuscript received 2 January<br />
1997.<br />
3614 APPLIED OPTICS � Vol. 36, No. 16 � 1 June 1997<br />
power level <strong>of</strong> between 0.1 <strong>and</strong> 1 mW, but the response<br />
<strong>of</strong> the bolometer becomes nonlinear at power<br />
levels above a few microwatts. Hence an indirect<br />
calibration is performed. First a pyroelectric detector<br />
is calibrated against the HACR, <strong>and</strong> then the<br />
cryogenic bolometer is calibrated against the pyroelectric<br />
detector. This approach is also convenient<br />
because the pyroelectric detector is compact, easily<br />
portable, relatively simple to use, <strong>and</strong> operates at<br />
room temperature. Its dynamic range is suitable for<br />
bridging the range between several microwatts <strong>and</strong> 1<br />
mW, although a somewhat lower noise floor would be<br />
desirable. The main disadvantage <strong>of</strong> the pyroelectric<br />
detector is the spatial nonuniformity in its response.<br />
Although a thermopile detector was tested<br />
as an alternative transfer detector, we chose the pyroelectric<br />
detector because <strong>of</strong> reduced susceptibility<br />
to noise due to thermal drift.<br />
We describe the apparatus <strong>and</strong> methods <strong>of</strong> the calibration<br />
in Section 2 <strong>and</strong> the measurement results<br />
<strong>and</strong> uncertainties in Section 3.<br />
2. Apparatus<br />
A. High-Accuracy Cryogenic Radiometer<br />
As the HACR has been described in detail elsewhere, 5<br />
here we provide only a brief overview <strong>of</strong> the instrument.<br />
A diagram is shown in Fig. 1. The HACR is<br />
an electrical substitution radiometer operated just<br />
above the boiling point <strong>of</strong> liquid helium. An electrical<br />
substitution radiometer links a measurement <strong>of</strong><br />
optical power to the watt by comparing the temper-
Fig. 1. Diagram <strong>of</strong> the <strong>NIST</strong> high-accuracy cryogenic radiometer.<br />
ature rise induced in an absorbing mass by incident<br />
optical radiation to that obtained by electrical heating.<br />
The absorbing mass is a cavity designed for<br />
nearly complete absorption <strong>of</strong> laser radiation. Operation<br />
at cryogenic temperatures allows a large,<br />
highly absorptive cavity to be used without significantly<br />
increasing the time constant, <strong>and</strong> the radiative<br />
coupling <strong>of</strong> the cavity to its surroundings is reduced.<br />
These features improve the equivalence <strong>of</strong> optical <strong>and</strong><br />
electrical heating. However, cryogenic operation<br />
also requires a vacuum Dewar, necessitating a window<br />
between the cavity <strong>and</strong> the laboratory. To reduce<br />
the reflection loss, this window is oriented at the<br />
Brewster angle, <strong>and</strong> appropriately polarized light is<br />
used. To facilitate alignment <strong>of</strong> the laser light into<br />
the cavity <strong>and</strong> to measure the amount <strong>of</strong> laser light<br />
scattered out <strong>of</strong> the beam, two sets <strong>of</strong> four annular<br />
quadrant silicon photodiodes, each 50 mm in diameter<br />
with a 9-mm-diameter central aperture to pass<br />
the beam, are located along the optical path within<br />
the HACR. �Although these detectors were not directly<br />
usable with the infrared beam, they were used<br />
with a visible alignment beam that was spatially<br />
overlapped with the infrared beam.� The apertures<br />
in the quadrant photodiodes are the limiting apertures<br />
in the HACR.<br />
B. Laser System<br />
The laser system is shown in Fig. 2. As with the<br />
apparatus previously described for visible wavelengths,<br />
5 the primary goal is to generate a geometrically<br />
well-defined beam with stable power. The<br />
power was stabilized using an acousto-optic laser stabilizer<br />
6 with an external feedback detector. A welldefined<br />
beam spatial pr<strong>of</strong>ile was obtained using a<br />
spatial filter with an overfilled pinhole. Because the<br />
output power <strong>of</strong> the CO 2 laser is 4 orders <strong>of</strong> magnitude<br />
higher than the level that can be used with the<br />
HACR, it was also necessary to attenuate the laser.<br />
While this could be accomplished with either attenuating<br />
filters or nearly crossed polarizers, both methods<br />
have disadvantages. A filter’s attenuation could<br />
be affected by temperature rise induced by high<br />
Fig. 2. Diagram <strong>of</strong> the laser system. W1, W3, W4, ZnSe-wedged windows �there is an additional wedged window W2 located just before<br />
L2 that is not shown�; L1, L2, L3, L4, ZnSe lenses; AOM, acousto-optic modulator; P1, P2, polarizers; PH, pinhole; A1, A2, apertures; FD,<br />
HgCdTe feedback detector; S, shutter; C, chopper; M, steering mirror; PD, pyroelectric detector. The reflection from the steering mirror<br />
is out <strong>of</strong> the plane <strong>of</strong> the diagram.<br />
1 June 1997 � Vol. 36, No. 16 � APPLIED OPTICS 3615
power levels, while crossed polarizers could degrade<br />
the polarization purity <strong>of</strong> the beam. Because <strong>of</strong><br />
these drawbacks, most <strong>of</strong> the attenuation was accomplished<br />
by reflecting the beam from ZnSe-wedged<br />
windows instead <strong>of</strong> steering mirrors. For each window,<br />
only one <strong>of</strong> the reflected beams was used, while<br />
the other reflected beam was blocked. An attenuation<br />
factor <strong>of</strong> �300 was obtained from the four<br />
wedged windows in the system. This approach also<br />
provided monitor beams <strong>and</strong> a method for overlapping<br />
the alignment He–Ne beam with the CO 2 beam,<br />
as described below.<br />
The source was a 5-W, air-cooled, grating-tuned,<br />
vertically polarized CO 2 laser operated with a frequency<br />
stabilizer. The laser was operated on the<br />
P�20� line �wavelength equals 10.5910 �m �Ref. 7��,<br />
with a TEM 00 transverse mode. After exiting the<br />
laser, the diverging beam was reflected by a wedged<br />
window �W1�, collimated by a ZnSe lens �L1�, <strong>and</strong><br />
passed through an acousto-optic modulator �AOM�<br />
that is part <strong>of</strong> a power stabilizer. �The beam transmitted<br />
through W1 was used to monitor the laser’s<br />
output power or to determine its wavelength using a<br />
CO 2 spectrum analyzer.� When rf power is applied<br />
to the AOM, a fraction <strong>of</strong> the laser light is deflected<br />
into a secondary beam, thereby providing control <strong>of</strong><br />
the power in the primary beam. Farther down the<br />
beam path, a HgCdTe feedback detector �FD� sampled<br />
the beam <strong>and</strong> provided the input to the stabilizer’s<br />
feedback circuit. This system maintained the<br />
power <strong>of</strong> the laser beam to within 0.1% over the<br />
course <strong>of</strong> an hour. The feedback detector was located<br />
as far downstream in the beam path as possible<br />
within the constraint <strong>of</strong> this detector’s sensitivity.<br />
After the AOM, the beam passed through a polarizer<br />
�stack <strong>of</strong> six ZnSe plates, P1� <strong>and</strong> was reflected<br />
from another wedged window �referred to as W2, but<br />
not shown�. For most <strong>of</strong> the measurements this polarizer<br />
simply improved the vertical polarization <strong>of</strong><br />
the beam, but it was also used in conjunction with a<br />
wire grid polarizer located farther downstream �P2�<br />
for relatively minor attenuation <strong>of</strong> the beam �less<br />
than a factor <strong>of</strong> 3�. The beam was attenuated by<br />
rotating P1, while the polarizer P2 reestablished the<br />
vertical polarization required to minimize the reflectance<br />
from the Brewster window. The polarization<br />
<strong>of</strong> the beam incident upon P2 was nearly vertical<br />
because vertically polarized light is preferentially reflected<br />
from the wedged windows. When additional<br />
attenuation was required, a thin 12% transmitting<br />
filter �25-nm-thick layer <strong>of</strong> NiCr deposited on 100nm-thick<br />
substrate� was placed just before P2.<br />
Using a thin filter avoided possible interference effects<br />
<strong>and</strong> deflection <strong>of</strong> the beam.<br />
A well-defined beam spatial pr<strong>of</strong>ile was obtained by<br />
using a spatial filter with an overfilled pinhole. The<br />
laser light was focused with a 8-cm focal length ZnSe<br />
lens �L2� onto a 250-�m-diameter pinhole �PH�.<br />
This beam overfilled the aperture, creating an Airy<br />
diffraction pattern. �The amount <strong>of</strong> overfilling was<br />
also used to attenuate the beam by a factor <strong>of</strong> between<br />
2.5 <strong>and</strong> 7.� The diameter <strong>of</strong> an iris �A1� was<br />
3616 APPLIED OPTICS � Vol. 36, No. 16 � 1 June 1997<br />
adjusted to allow only the 13-mm-diameter central<br />
spot <strong>of</strong> the diffraction pattern to pass through. The<br />
diameter <strong>of</strong> the aperture corresponded to the location<br />
<strong>of</strong> the first minimum <strong>of</strong> the diffraction pattern, thus<br />
defining the beam diameter with minimal scattering<br />
from the aperture. A 12.5-cm focal length ZnSe lens<br />
�L3� produced a long beam waist between the pyroelectric<br />
detector �PD� <strong>and</strong> the limiting apertures inside<br />
the HACR dewar. At the waist, 85% <strong>of</strong> the<br />
power fell within a 3-mm beam diameter <strong>and</strong> 99%<br />
within a5mmdiameter. The beam was then reflected<br />
from another wedged window �W3�, while the<br />
transmitted beam was focused by a ZnSe lens �L4�<br />
onto the feedback detector. Finally, the beam was<br />
reflected from the last wedged window �W4�, where it<br />
was spatially overlapped with a visible alignment<br />
beam. The alignment beam was provided by a<br />
He–Ne laser <strong>and</strong> prepared with a similar optical system<br />
�not shown�. The total attenuation <strong>of</strong> the CO 2<br />
laser beam along the optical path to the HACR was a<br />
factor <strong>of</strong> 3000 or more, reducing the 3-W output<br />
power <strong>of</strong> the laser down to 1 mW or less.<br />
The polarizer P2 was adjusted to minimize the reflection<br />
from the ZnSe Brewster window on the<br />
HACR, <strong>and</strong> a mirror �M� reflected the laser light into<br />
the HACR. �This reflection is out <strong>of</strong> the plane <strong>of</strong> Fig.<br />
2.� Whereas the final steering mirror could affect<br />
the polarization <strong>of</strong> the beam if the direction <strong>of</strong> the<br />
polarization were at an arbitrary angle to the plane <strong>of</strong><br />
incidence, this effect was negligible in this system<br />
because the light was polarized parallel to the plane<br />
<strong>of</strong> incidence <strong>of</strong> the mirror. A computer-controlled<br />
shutter �S� was used to block the laser during electrical<br />
heating <strong>of</strong> the cavity <strong>and</strong> to measure the background<br />
signal from the pyroelectric detector. A<br />
chopper �C�, which is required for use with the pyroelectric<br />
detector, was located after the shutter <strong>and</strong><br />
operated at a chopping frequency <strong>of</strong> 40.0 Hz. In addition,<br />
an 8-mm-diameter aperture �A2� located just<br />
before the final steering mirror was used to block<br />
residual scattered laser light.<br />
The infrared beam was aligned into the HACR by<br />
being spatially overlapped with the He–Ne laser.<br />
Although the alignment <strong>of</strong> a visible beam into the<br />
HACR is usually optimized by minimizing the scattered<br />
light signal from the quadrant photodiodes, the<br />
sensitivity <strong>of</strong> this method was limited by the high<br />
level <strong>of</strong> scatter from the ZnSe Brewster window at<br />
633 nm. Instead, the diameter <strong>of</strong> the He–Ne beam<br />
was made to be larger than the infrared beam, in fact,<br />
nearly as large as the apertures in the annular quadrant<br />
photodiodes. This approach provided a sensitive<br />
method to align the He–Ne beam into the HACR.<br />
After this alignment procedure, the He–Ne beam was<br />
blocked. The difference between the displacement <strong>of</strong><br />
the He–Ne <strong>and</strong> CO 2 beams due to the ZnSe Brewster<br />
window is only 0.15 mm. The alignment was tested<br />
by establishing that the temperature rise <strong>of</strong> the cavity<br />
due to the infrared beam was a maximum <strong>and</strong> not<br />
unduly sensitive to small changes in the alignment <strong>of</strong><br />
the final steering mirror. As described below, small<br />
changes were also made in the alignment to test for
change in the measured responsivities <strong>of</strong> the pyroelectric<br />
detectors.<br />
C. Pyroelectric Detectors<br />
Lithium tantalate detectors, coated with black paint<br />
to absorb infrared light, were calibrated against the<br />
HACR. A pyroelectric material has a permanent<br />
electric dipole moment. A change in the temperature<br />
<strong>of</strong> the material changes the magnitude <strong>of</strong> this<br />
moment, requiring a flow <strong>of</strong> charge. If a chopped<br />
source <strong>of</strong> optical power is absorbed by a pyroelectric<br />
material, the resulting time variation in its temperature<br />
will produce a measurable ac current. This<br />
current can be detected by use <strong>of</strong> a lock-in amplifier,<br />
with the chopping frequency used as the reference. 8<br />
Two1cm�1 cm pyroelectric detectors, 9 here referred<br />
to as PD1 <strong>and</strong> PD2, were calibrated against the<br />
HACR. These particular pyroelectric detectors were<br />
chosen because <strong>of</strong> their large area. Unfortunately,<br />
as discussed below, the black paint coating supplied<br />
with the detector proved to have lower than desired<br />
absorption in the infrared. For the most part, we<br />
will describe <strong>and</strong> show data only for PD2, which is<br />
being used to calibrate the bolometer. The results<br />
for PD1 are comparable, but because <strong>of</strong> accidental<br />
damage that occurred during the course <strong>of</strong> this work,<br />
its spatial uniformity was degraded. We also calibrated<br />
a third pyroelectric detector that is part <strong>of</strong> a<br />
commercial electrical substitution pyroelectric radiometer<br />
�ECPR�. This detector was calibrated with<br />
<strong>and</strong> without the electrically calibrating circuitry operational.<br />
PD1 <strong>and</strong> PD2 were each mounted in a small aluminum<br />
box with a 13-mm-diameter entrance aperture.<br />
The boxes were mounted on a computer-controlled,<br />
motor-driven carousel, which positioned each detector<br />
in the infrared beam. Atmospheric absorption between<br />
the pyroelectric detector <strong>and</strong> the HACR is<br />
�0.01% �Ref. 10� <strong>and</strong> was neglected. To minimize the<br />
uncertainty due to the spatial response nonuniformity<br />
<strong>of</strong> the detector, we used an algorithm for reproducibly<br />
positioning the detector in the infrared beam: For<br />
each <strong>of</strong> the two axes transverse to the beam, the detector<br />
was positioned midway between the two locations<br />
at which the detector response was 50% <strong>of</strong> its<br />
maximum value.<br />
The spatial nonuniformity observed in the response<br />
<strong>of</strong> PD2 is shown in Fig. 3. We obtained these<br />
data by scanning the detector over a6mm�6mm<br />
region in 0.5-mm steps, using the same size beam as<br />
was used for the calibrations. For the region within<br />
0.5 mm �2mm�<strong>of</strong> the center, the maximum variation<br />
in the detector response is �0.8% ��2.6%� <strong>and</strong> is<br />
primarily along one direction. This rather substantial<br />
nonuniformity is likely to vary from detector to<br />
detector <strong>and</strong> could be improved with a better absorbing<br />
coating. We estimate the reflectance <strong>of</strong> the pyroelectric<br />
detector to be at least 25% at 10.6 �m,<br />
based on comparing the responsivity at 10.6 �m to<br />
that measured at 633 nm with a calibrated visible<br />
detector. 11 �The value <strong>of</strong> 25% assumes that the reflectance<br />
is close to zero at 633 nm.� Using a half-<br />
Fig. 3. Contour plot illustrating the spatial uniformity <strong>of</strong> the<br />
responsivity <strong>of</strong> pyroelectric detector PD2. These data were obtained<br />
by scanning <strong>of</strong> the 3-mm-diameter beam �85% <strong>of</strong> power� in<br />
0.5-mm steps.<br />
wave plate to rotate the polarization <strong>of</strong> the infrared<br />
beam, we found the polarization dependence <strong>of</strong> the<br />
detector’s responsivity to be �0.05%.<br />
The temperature dependence <strong>of</strong> the responsivity<br />
for lithium tantalate is weak. The responsivity is<br />
proportional to the ratio <strong>of</strong> the pyroelectric coefficient<br />
to the specific heat. The temperature dependence <strong>of</strong><br />
this ratio was measured by Glass <strong>and</strong> Lines 12 ; from<br />
their data one can estimate the expected temperature<br />
dependence <strong>of</strong> the responsivity to be 0.1% K �1 at<br />
room temperature. Using a temperature-controlled<br />
box, we measured 0.16% K �1 , roughly consistent with<br />
the predicted result.<br />
This work was carried out over a period <strong>of</strong> a few<br />
months, during which time we saw no evidence for<br />
any long-term change in the calibration <strong>of</strong> the pyroelectric<br />
detectors. However, the stability <strong>of</strong> these<br />
detectors over a period <strong>of</strong> years remains to be established.<br />
D. Measurement Instrumentation<br />
The output signal from each detector was sent to a<br />
transimpedance amplifier with a gain <strong>of</strong> 10 8 V�A, <strong>and</strong><br />
then to a lock-in amplifier that was sensitive to only<br />
the fundamental Fourier component <strong>of</strong> the waveform<br />
at the chopping frequency. The in-phase output <strong>of</strong><br />
the lock-in amplifier was read by a digital voltmeter.<br />
The phase was set manually to minimize the out-<strong>of</strong>phase<br />
signal. The component <strong>of</strong> relative st<strong>and</strong>ard<br />
uncertainty in the responsivity S due to the uncertainty<br />
in setting the phase was 0.02%.<br />
The system, consisting <strong>of</strong> the pyroelectric detector<br />
<strong>and</strong> preamplifier, was calibrated as a unit. The responsivity<br />
was defined to be the amplitude <strong>of</strong> the ac<br />
voltage output from the preamplifier, assuming a per-<br />
1 June 1997 � Vol. 36, No. 16 � APPLIED OPTICS 3617
fectly square optical waveform, for a given dc optical<br />
power that would be incident on the detector if the<br />
chopper were removed. The responsivity is given by<br />
S � VC d�GC sP L, (1)<br />
where V is the in-phase output <strong>of</strong> the lock-in amplifier<br />
in millivolts, G is a correction factor for the absolute<br />
response <strong>of</strong> the lock-in, P L is the infrared power in<br />
mW as determined by the HACR, C d is the chopper<br />
duty cycle, <strong>and</strong> C s is a small correction factor associated<br />
with the deviation <strong>of</strong> the optical waveform from<br />
a perfect square wave �described below�. Because<br />
the HACR has a 4-min time constant, P L is the average<br />
power in the chopped beam.<br />
We determined the chopper duty cycle by measuring<br />
the ratio <strong>of</strong> the infrared power with the chopper<br />
turned on to that obtained with the chopper <strong>of</strong>f. Because<br />
the pyroelectric detector responds only to<br />
chopped radiation, it was necessary to install a second<br />
chopper in the beam path. Operating the second<br />
chopper at a much higher frequency �400 Hz�<br />
allowed lock-in detection at the second chopper’s frequency<br />
without interference from the primary chopper.<br />
The duty cycle was independently determined<br />
with the HACR <strong>and</strong> also with a He–Ne laser <strong>and</strong> a<br />
visible detector. We obtained C d � 0.4964 with a<br />
st<strong>and</strong>ard uncertainty <strong>of</strong> 0.001.<br />
The measured responsivity <strong>of</strong> the entire system<br />
was found to change by 0.25% Hz �1 at the 40.0-Hz<br />
chopping frequency. This dependence was almost<br />
entirely due to the preamplifier’s 3-dB point at 110<br />
Hz. �This preamplifier, originally designed for dc<br />
applications, was used simply because it could be<br />
immediately dedicated to these measurements <strong>and</strong><br />
may be replaced in the future.� For a st<strong>and</strong>ard uncertainty<br />
<strong>of</strong> �0.1 Hz in the chopper frequency, the<br />
relative st<strong>and</strong>ard uncertainty in the responsivity is<br />
only 0.025%.<br />
The magnitude <strong>of</strong> the fundamental component in<br />
the output from the pyroelectric detector depends on<br />
the shape <strong>of</strong> the optical waveform, which is primarily<br />
determined by the beam size <strong>and</strong> the chopper blade<br />
geometry. The two-blade chopper has an inner diameter<br />
<strong>of</strong> 5 cm <strong>and</strong> an outer diameter <strong>of</strong> 11 cm, which<br />
yields a mean chopper opening width <strong>of</strong> 6.3 cm.<br />
Thus, for a beam diameter <strong>of</strong> 5 mm at the chopper,<br />
the output <strong>of</strong> the preamplifier should exhibit a rise<br />
time <strong>of</strong> only 8% <strong>of</strong> the half-period, which is due only<br />
to the chopper. �The observed rise time was roughly<br />
twice this value, owing to the limited frequency response<br />
<strong>of</strong> the preamplifier.� We have corrected the<br />
measured responsivities to the ideal conditions <strong>of</strong> a<br />
perfectly square optical waveform, which would only<br />
be obtained with an infinitely narrow beam. To determine<br />
this correction, labeled C s in Eq. �1�, we measured<br />
the effect on the responsivity <strong>of</strong> changing the<br />
beam diameter at the chopper from 6 mm to under 1<br />
mm <strong>and</strong> found C s � 0.9980 with a st<strong>and</strong>ard uncertainty<br />
<strong>of</strong> 0.0005. �Because this correction is independent<br />
<strong>of</strong> the detector used, these measurements<br />
were performed more easily at a visible wavelength.�<br />
3618 APPLIED OPTICS � Vol. 36, No. 16 � 1 June 1997<br />
Because this correction is small, the calibration is<br />
quite insensitive to the beam size <strong>and</strong> spatial pr<strong>of</strong>ile.<br />
To determine the correction G for the absolute response<br />
<strong>of</strong> the lock-in amplifier, we used a square wave<br />
with a known amplitude. We obtained this square<br />
wave by illuminating a silicon photodiode with a<br />
chopped He–Ne laser beam. The detector’s output<br />
was sent to a fast transimpedance amplifier. We<br />
determined the amplitude <strong>of</strong> the square wave by<br />
turning <strong>of</strong>f the chopper <strong>and</strong> measuring the dc voltage<br />
from this amplifier with a high accuracy digital voltmeter.<br />
�The uncertainty in the measurement <strong>of</strong> dc<br />
voltage is negligible.� This measurement was performed<br />
with the lock-in amplifier on the 500-mV<br />
range. A range-to-range correction factor was determined<br />
for the 10-mV range, which was used for most<br />
<strong>of</strong> the pyroelectric detector measurements. The total<br />
correction factor for the 10-mV range was G �<br />
0.9023 with a st<strong>and</strong>ard uncertainty <strong>of</strong> 0.002. <strong>Note</strong><br />
that a 1-V amplitude square wave, sent into an ideal<br />
sine-wave lock-in amplifier, produces an output <strong>of</strong><br />
0.9003 ��4���2� V. The value <strong>of</strong> G for each <strong>of</strong> the<br />
other ranges that were used with the pyroelectric<br />
detectors were also measured; these correction factors<br />
were typically within 1% <strong>of</strong> 0.9003 <strong>and</strong> were<br />
measured with a relative st<strong>and</strong>ard uncertainty <strong>of</strong><br />
0.1%.<br />
E. Measurement Sequence<br />
The details <strong>of</strong> the automated sequence for HACR<br />
measurements are described in Ref. 5. Briefly, the<br />
sequence consists <strong>of</strong> one optical measurement cycle,<br />
in which the temperature rise <strong>of</strong> the cavity due to the<br />
laser light is determined, followed by electrical heating,<br />
in which the quantity <strong>of</strong> electrical power required<br />
to reproduce this temperature is determined. The<br />
entire sequence takes �45 min. The response <strong>of</strong> the<br />
pyroelectric detectors was measured during the electrical<br />
heating cycle.<br />
3. Measurement Results <strong>and</strong> Uncertainties<br />
A. Measurement Results<br />
The results <strong>of</strong> several responsivity measurements <strong>of</strong><br />
PD2 are summarized in Table 1 <strong>and</strong> shown in Fig. 4.<br />
Each data point is the mean responsivity for a given<br />
session <strong>of</strong> data acquisition, in which typically 15–20<br />
measurements were obtained. We calibrated the<br />
detector over an infrared power range from 0.011 to<br />
0.35 mW, with no other deliberate change in conditions.<br />
�These data are the first seven entries in Table<br />
1 <strong>and</strong> are shown by filled circles in Fig. 4.� As<br />
described below, this series <strong>of</strong> measurements allowed<br />
us to establish an uncertainty due to background<br />
effects. For the remaining data points, small<br />
changes were made in the measurement conditions to<br />
test the sensitivity to certain systematic effects that<br />
are discussed below. �These data are the last four<br />
values in Table 1 <strong>and</strong> are shown by open squares in<br />
Fig. 4.�<br />
In Fig. 4, the uncertainty bar shown on each data<br />
point corresponds to the relative st<strong>and</strong>ard deviation
Table 1. Measured Values <strong>of</strong> the Responsivity S <strong>of</strong> the Pyroelectric<br />
Detector PD2 for a Range <strong>of</strong> Infrared Power Levels <strong>and</strong> Other Variations<br />
in the Conditions <strong>of</strong> the Calibration a<br />
P L<br />
�mW�<br />
S<br />
�mV/mW�<br />
� m/S<br />
�%�<br />
�S � S a�/S a<br />
�%�<br />
0.3397 6.880 0.03 �0.17<br />
0.3392 6.893 0.04 0.03<br />
0.3203 6.897 0.03 0.09<br />
0.2599 6.894 0.02 0.04<br />
0.07379 6.880 0.11 �0.16<br />
0.03079 6.873 0.21 �0.26<br />
0.01375 6.815 0.41 �1.11<br />
1.051 6.904 0.10 0.18<br />
0.3395 6.888 0.02 �0.04<br />
0.3421 6.924 0.01 0.48<br />
0.3368 6.849 0.04 �0.61<br />
a The mean responsivities <strong>of</strong> the relative st<strong>and</strong>ard deviation <strong>of</strong><br />
the mean, � m�S, are listed for each session <strong>of</strong> data acquisition. The<br />
percentage deviation <strong>of</strong> each responsivity from the average responsivity<br />
�S a � 6.89 mV�mW� is also listed; the average is based on the<br />
data obtained at power levels above 0.2 mW.<br />
<strong>of</strong> the mean in the measurements <strong>of</strong> S for the given<br />
session. �For the results at 1.05 mW <strong>and</strong> below 0.2<br />
mW, which were not obtained on the 10-mV lock-in<br />
range, an additional contribution <strong>of</strong> 0.1% has been<br />
added in quadrature to yield the total uncertainty<br />
bar.� The increased st<strong>and</strong>ard deviation at low values<br />
<strong>of</strong> P L is due to comparable contributions from the<br />
noise floors <strong>of</strong> the HACR 5 <strong>and</strong> the pyroelectric detector.<br />
The slight decrease in responsivity at the lowest<br />
power levels could indicate a systematic effect<br />
associated with background subtraction. This decrease<br />
was seen for both pyroelectric detectors but<br />
not for the ECPR, which suggests a possible systematic<br />
error in the calibration <strong>of</strong> the pyroelectrics.<br />
However, fitting the data to a form that models such<br />
a background error 5 yielded a relative st<strong>and</strong>ard un-<br />
Fig. 4. Percentage deviation <strong>of</strong> each responsivity S listed in Table<br />
1 from the average responsivity S a; the average is based on the<br />
data obtained at power levels above 0.2 mW. The data shown by<br />
filled circles were obtained with no deliberate change in conditions<br />
to test for linearity <strong>of</strong> the detector <strong>and</strong> background effects. The<br />
data shown by open squares include changes in the conditions <strong>of</strong><br />
the measurements that are described in the text.<br />
certainty component <strong>of</strong> 0.05% at our typical calibration<br />
power <strong>of</strong> 0.35 mW.<br />
We now restrict the discussion to the data obtained<br />
at power levels <strong>of</strong> 0.2 mW or above. For a typical<br />
session <strong>of</strong> data acquisition, the relative st<strong>and</strong>ard deviation<br />
in repeated measurements for either V or P L<br />
was typically 0.15%. The primary source <strong>of</strong> this<br />
variation was drift in the power <strong>of</strong> the infrared beam.<br />
For S the relative st<strong>and</strong>ard deviation was only 0.1%<br />
or less because slow drift in the infrared power does<br />
not affect the measurement <strong>of</strong> S.<br />
The data shown by open squares were obtained<br />
with small changes to the calibration conditions.<br />
These changes included removing the detector from<br />
the carousel, repeating the alignment algorithm, <strong>and</strong><br />
small variations in the alignment <strong>of</strong> the laser beam<br />
into the HACR. The goal <strong>of</strong> these changes was to<br />
establish the reproducibility <strong>of</strong> the calibration, given<br />
the known spatial nonuniformity <strong>of</strong> the detector <strong>and</strong><br />
the difficulty in aligning the infrared beam into the<br />
HACR. �For our work here we are primarily interested<br />
in our ability to reproducibly calibrate the detector<br />
using our alignment algorithm. The related,<br />
but separate, issue <strong>of</strong> the transfer <strong>of</strong> this calibration<br />
to the cryogenic bolometer will be discussed in another<br />
paper.�<br />
We determined the average responsivity �S a � 6.89<br />
mV�mW� by averaging the data obtained at power<br />
levels above 0.2 mW. The relative st<strong>and</strong>ard deviation<br />
<strong>of</strong> this data set is 0.31%, which is substantially<br />
larger than the relative st<strong>and</strong>ard deviation <strong>of</strong> the<br />
mean for any given session <strong>of</strong> data acquisition.<br />
Hence the reproducibility <strong>of</strong> the calibration was affected<br />
by both unintentional <strong>and</strong> imposed changes in<br />
calibration conditions. The small relative st<strong>and</strong>ard<br />
uncertainty <strong>of</strong> �0.05% that is due to the typical variations<br />
<strong>of</strong> �0.3 K in the ambient laboratory temperature<br />
can account for only a small portion <strong>of</strong> the<br />
observed 0.31% relative st<strong>and</strong>ard deviation. We believe<br />
the most likely cause is the known spatial nonuniformity<br />
<strong>of</strong> the detector. From Fig. 3 we see that<br />
a change <strong>of</strong> �0.2 mm in the location <strong>of</strong> the detector or<br />
the beam can result in a �0.3% change in the measured<br />
responsivity. We believe that spatial uniformity<br />
could explain most <strong>of</strong> the observed variation in<br />
the measurements <strong>of</strong> S. We assign a type A relative<br />
st<strong>and</strong>ard uncertainty 13 <strong>of</strong> 0.31% to the reproducibility<br />
<strong>of</strong> the calibration, which includes effects <strong>of</strong> spatial<br />
nonuniformity <strong>and</strong> beam alignment.<br />
As a final test <strong>of</strong> the quality <strong>of</strong> the alignment into<br />
the HACR, we shifted the location <strong>of</strong> the focus farther<br />
along the beam path so that it was between the two<br />
limiting apertures in the HACR. If the beam had<br />
been slightly obstructed by these apertures, shifting<br />
the focus would cause the measured responsivity to<br />
decrease. We observed a decrease <strong>of</strong> 1.0% in the<br />
measured responsivity for detector PD2, whereas the<br />
responsivity <strong>of</strong> PD1 was nearly unchanged. This<br />
suggests that the effect was not due to alignment into<br />
the HACR but some other effect that was different for<br />
the two detectors. Changing the location <strong>of</strong> the focus<br />
did require realigning the detectors <strong>and</strong> also in-<br />
1 June 1997 � Vol. 36, No. 16 � APPLIED OPTICS 3619
Table 2. Components <strong>of</strong> the Combined Relative St<strong>and</strong>ard Uncertainty <strong>of</strong> 0.48% in the Calibration <strong>of</strong> the Pyroelectric Detector Transfer St<strong>and</strong>ard<br />
Against the HACR at an Optical Power Level <strong>of</strong> 0.35 mW a<br />
Uncertainty Component Type<br />
creased the beam size at the detectors a small<br />
amount. These changes, in conjunction with the<br />
spatial nonuniformity <strong>of</strong> the detectors, could explain<br />
the observed 1.0% shift in the responsivity for PD2.<br />
Hence we have not increased the uncertainty in the<br />
reproducibility in the calibration because <strong>of</strong> this measurement.<br />
B. Corrections for Window Transmittance <strong>and</strong> Scattered<br />
Laser Light<br />
The uncertainty components in these calibrations are<br />
listed in Table 2. The method used to evaluate each<br />
uncertainty component �type A or type B� is also<br />
listed. We now discuss the combined uncertainty<br />
component in the measurement <strong>of</strong> P L by the HACR.<br />
The infrared power P L is given by<br />
P L � �1�T���NP H�A� � P S�. (2)<br />
where P H is the electrical heater power that yields<br />
the same temperature rise <strong>of</strong> the cavity as that produced<br />
by the infrared beam, P S is the estimated infrared<br />
power scattered out <strong>of</strong> the field <strong>of</strong> view <strong>of</strong> the<br />
cavity, A is the absorptance <strong>of</strong> the cavity, T is the<br />
transmittance <strong>of</strong> the entrance window <strong>of</strong> the HACR,<br />
<strong>and</strong> N is a factor to take into account any nonequivalence<br />
between the infrared <strong>and</strong> electrical heating.<br />
For this work, the type B uncertainty in the measurement<br />
<strong>of</strong> P L by the HACR is dominated by the uncertainties<br />
in T <strong>and</strong> P S, which are discussed in detail<br />
below. Other HACR uncertainties discussed in Ref.<br />
5 are less than 0.01%, which is negligible for this<br />
work.<br />
The transmittance <strong>of</strong> the window was measured on<br />
the optical table before <strong>and</strong> after the series <strong>of</strong> measurements<br />
with the HACR. Although this is a simple<br />
measurement in principle, care was required<br />
because <strong>of</strong> the nonuniformity <strong>of</strong> the available detectors.<br />
The transmittance was determined by measuring<br />
the signal on a pyroelectric detector with <strong>and</strong><br />
without the window in the beam. Because the window<br />
translates the beam, the detector must also be<br />
translated so that the beam is still incident upon the<br />
same location on the detector. Any error in this re-<br />
Value <strong>of</strong><br />
Correction<br />
Component <strong>of</strong><br />
Uncertainty �%�<br />
Reproducibility A 0.31<br />
Background A 0.05<br />
G B 0.9023 0.20<br />
C d B 0.4964 0.20<br />
C s A 0.9980 0.05<br />
Chopper frequency <strong>and</strong> lock-in phase B 0.03<br />
Combined st<strong>and</strong>ard uncertainty in P L B 0.21<br />
Window transmittance �T� 0.9978 0.18<br />
Scattered optical power �P S� 0.61 �W 0.1<br />
a The uncertainties are identified as type A or type B relative st<strong>and</strong>ard uncertainties. The measured values <strong>of</strong> corrections to the data are<br />
also listed.<br />
3620 APPLIED OPTICS � Vol. 36, No. 16 � 1 June 1997<br />
location leads to an error in the measured transmittance.<br />
We measured a transmittance <strong>of</strong> 0.9993 �<br />
0.0004 before the series <strong>of</strong> HACR measurements <strong>and</strong><br />
0.9962 � 0.0008 afterward, where the uncertainties<br />
quoted are the st<strong>and</strong>ard deviations <strong>of</strong> the mean for<br />
each group <strong>of</strong> measurements �16 measurements for<br />
the before data <strong>and</strong> 7 for the after data�. These<br />
transmittance measurements were separated by 4<br />
months, <strong>and</strong> we believe that the decrease in transmittance<br />
was due to accumulation <strong>of</strong> contaminants<br />
on the window. We used the average value <strong>of</strong> T �<br />
0.9978 � 0.0018 to determine P L, where the st<strong>and</strong>ard<br />
uncertainty quoted is equal to the sum <strong>of</strong> half the<br />
difference between the before <strong>and</strong> after values, plus<br />
the uncertainties quoted for the before <strong>and</strong> after data,<br />
added in quadrature.<br />
Before measuring the transmittance, the window<br />
reflectance was minimized by adjusting the polarizer<br />
P2 <strong>and</strong> the angle <strong>of</strong> incidence <strong>of</strong> the beam on the<br />
window. We minimized the reflection, rather than<br />
maximizing the transmittance, so that the procedure<br />
was the same as that performed when the window<br />
was installed in the HACR. �Because <strong>of</strong> the slow<br />
time constant <strong>of</strong> the HACR, it is difficult to maximize<br />
the transmittance by observing the temperature <strong>of</strong><br />
the cavity.� Furthermore, we measured the reflectance<br />
to establish that the same value was obtained<br />
when the window was installed in the HACR. Using<br />
one <strong>of</strong> the pyroelectric detectors, we measured the<br />
reflectivity <strong>of</strong> the window to be 0.1% � 0.03%.<br />
Scattered laser light refers to light that is incident<br />
upon the detector to be calibrated but scattered out <strong>of</strong><br />
the field <strong>of</strong> view <strong>of</strong> the absorbing cavity in the HACR.<br />
For visible wavelengths there is little scattered laser<br />
light, <strong>and</strong> it is measured by annular silicon photodiodes<br />
located along the optical path within the<br />
HACR. Because scattered infrared laser light cannot<br />
be measured by the photodiodes in the HACR, we<br />
estimated the correction for scattered laser light by<br />
simulating the usual trajectory <strong>of</strong> the beam into the<br />
HACR on the optical table: Just before the final<br />
steering mirror, the beam was deflected with a mirror.<br />
A window was placed in the beam where the<br />
HACR window would normally be located. To col-
lect only the scattered light, we used a 15-cm focallength<br />
concave mirror with a 9-mm central aperture.<br />
This mirror was located near the position <strong>of</strong> the quadrant<br />
photodiodes in the HACR dewar, which also<br />
have 9-mm-diameter apertures. Detector PD1 was<br />
used to detect the reflected light from this mirror.<br />
We measured P S to be 0.18% <strong>of</strong> the incident infrared<br />
power. Most <strong>of</strong> this scattered light was not due to<br />
the window. It is difficult to establish how close this<br />
measurement is to the actual value that P S was during<br />
our calibrations. On the basis <strong>of</strong> the repeatability<br />
<strong>of</strong> the measurement <strong>and</strong> the sensitivity to changes<br />
in the beam alignment, we estimate an relative st<strong>and</strong>ard<br />
uncertainty component <strong>of</strong> 0.1% due to scattered<br />
light, about half the value <strong>of</strong> the correction itself.<br />
4. Conclusion<br />
We have calibrated a pyroelectric detector against<br />
the HACR at a wavelength <strong>of</strong> 10.6 �m with a combined<br />
relative st<strong>and</strong>ard uncertainty <strong>of</strong> 0.48%. This<br />
detector is being used to calibrate the transfer st<strong>and</strong>ard<br />
cryogenic bolometer for an infrared comparator<br />
facility. The calibration <strong>of</strong> the bolometer, which is<br />
being performed with a different laser system, will be<br />
discussed in another paper. The primary issue in<br />
the accuracy <strong>of</strong> the bolometer calibration is the spatial<br />
uniformity <strong>of</strong> the pyroelectric detector. Minimizing<br />
this uncertainty requires reproducing the<br />
alignment procedure <strong>and</strong> beam characteristics that<br />
were used for the HACR calibration. We believe<br />
that the transfer <strong>of</strong> this calibration can easily be done<br />
with a conservative relative st<strong>and</strong>ard uncertainty <strong>of</strong><br />
�2%, <strong>and</strong> with careful attention to detail, a relative<br />
st<strong>and</strong>ard uncertainty <strong>of</strong> �0.6% should be achievable.<br />
We are investigating detectors with improved spatial<br />
uniformity, which can be obtained by using goldblack<br />
coatings or a light-trapping arrangement. 14,15<br />
Colleagues in our laboratory have produced gold-black<br />
coatings with less than 1% reflectance at the CO 2 laser<br />
wavelength. An alternative solution is to calibrate<br />
the cryogenic bolometer directly against the HACR.<br />
This approach would require improving the sensitivity<br />
<strong>of</strong> the HACR, attenuating the beam for the bolometer<br />
by a precisely known amount, further quantifying the<br />
bolometer’s nonlinearity, or some combination <strong>of</strong> these<br />
changes. Finally, work is in progress at <strong>NIST</strong> to develop<br />
a large-area silicon bolometer that could have<br />
both high sensitivity <strong>and</strong> a sufficiently large dynamic<br />
range to be used easily with the HACR.<br />
References <strong>and</strong> <strong>Note</strong>s<br />
1. A. Migdall, G. Eppeldauer, <strong>and</strong> C. Cromer, “IR detector spectral<br />
responsivity calibration facility at <strong>NIST</strong>,” in Cryogenic<br />
Optical Systems <strong>and</strong> Instruments VI, J. B. Heaney <strong>and</strong> L. G.<br />
Burriesci, eds., Proc. SPIE 2227, 46–53 �1994�.<br />
2. G. Eppeldauer, A. L. Migdall, <strong>and</strong> C. L. Cromer, “Characterization<br />
<strong>of</strong> a high sensitivity composite silicon bolometer,”<br />
Metrologia 30, 317–320 �1993�.<br />
3. G. Eppeldauer, A. L. Migdall, <strong>and</strong> C. L. Cromer, “A cryogenic<br />
silicon resistance bolometer for use as an infrared transfer<br />
st<strong>and</strong>ard detector,” in Thermal Phenomena at Molecular <strong>and</strong><br />
in Cryogenic Infrared Detectors, M. Kaviany, D. A. Kaminskii,<br />
A. Majumdar, P. E. Phelan, M. M. Yovanovich, Z. M. Zhang,<br />
eds. �American Society <strong>of</strong> Mechanical Engineers, New York,<br />
1994�, Vol. 277, pp. 63–67.<br />
4. G. Eppeldauer, A. L. Migdall, T. R. Gentile, <strong>and</strong> C. L. Cromer,<br />
“Absolute response calibration <strong>of</strong> a transfer st<strong>and</strong>ard cryogenic<br />
bolometer,” in Photodetectors <strong>and</strong> Power Meters II, K. Murray<br />
<strong>and</strong> K. J. Kaufmann, eds., Proc. SPIE 2550, 36–46 �1995�.<br />
5. T. R. Gentile, J. M. Houston, J. E. Hardis, C. L. Cromer, <strong>and</strong><br />
A. C. Parr, “<strong>National</strong> <strong>Institute</strong> <strong>of</strong> <strong>St<strong>and</strong>ards</strong> <strong>and</strong> Technology<br />
high accuracy cryogenic radiometer,” Appl. Opt. 35, 1056–<br />
1068 �1996�.<br />
6. Model LS-10.6, Cambridge Research <strong>and</strong> Instrumentation,<br />
Inc., 21 Erie Street, Cambridge, Mass. 02139. Certain trade<br />
names <strong>and</strong> company products are mentioned in the text or<br />
identified in an illustration in order to adequately specify the<br />
experimental procedure <strong>and</strong> equipment used. In no case does<br />
such identification imply recommendation or endorsement by<br />
the <strong>National</strong> <strong>Institute</strong> <strong>of</strong> <strong>St<strong>and</strong>ards</strong> <strong>and</strong> Technology, nor does<br />
it imply that the products are necessarily the best available for<br />
the purpose.<br />
7. R. J. Pressley, ed., H<strong>and</strong>book <strong>of</strong> Lasers With Selected Data on<br />
Optical Technology �CRC, Clevel<strong>and</strong>, Ohio, 1971�, p. 331.<br />
8. R. W. Boyd, Radiometry <strong>and</strong> the Detection <strong>of</strong> Optical Radiation<br />
�Wiley, New York, 1983�, pp. 219–223.<br />
9. Servo Corporation <strong>of</strong> America, 111 New South Road, Hicksville,<br />
New York 11802-1490.<br />
10. W. L. Wolfe <strong>and</strong> G. J. Zeissis, eds., Infrared H<strong>and</strong>book, 3rd ed.<br />
�Infrared Information Analysis Center, Environmental Research<br />
<strong>Institute</strong> <strong>of</strong> Michigan, Ann Arbor, Mich., 1989�, pp.<br />
5–69.<br />
11. T. R. Gentile, J. M. Houston, <strong>and</strong> C. L. Cromer, “Realization <strong>of</strong><br />
a scale <strong>of</strong> absolute spectral response using the <strong>NIST</strong> high<br />
accuracy cryogenic radiometer,” Appl. Opt. 35, 4392–4403<br />
�1996�.<br />
12. A. M. Glass <strong>and</strong> M. E. Lines, “Low-temperature behavior <strong>of</strong><br />
spontaneous polarization in LiNbO 3 <strong>and</strong> LiTaO 3,” Phys. Rev. B<br />
13, 180–191 �1976�.<br />
13. B. N. Taylor <strong>and</strong> C. E. Kuyatt, “Guidelines for evaluating <strong>and</strong><br />
expressing the uncertainty <strong>of</strong> <strong>NIST</strong> measurement results,”<br />
Tech. <strong>Note</strong> 1297, 2nd ed. �<strong>National</strong> <strong>Institute</strong> <strong>of</strong> <strong>St<strong>and</strong>ards</strong> <strong>and</strong><br />
Technology, Gaithersburg, Md., 1994�.<br />
14. D. J. Advena, V. T. Bly, <strong>and</strong> J. T. Cox, “Deposition <strong>and</strong> characterization<br />
<strong>of</strong> far-infrared absorbing gold black films,” Appl.<br />
Opt. 32, 1136–1144 �1993�.<br />
15. R. J. Phelan, Jr., J. Lehman, <strong>and</strong> D. R. Larson, “Electrically<br />
calibrated pyroelectric detector—refinements for improved optical<br />
power measurements,” in Photodetectors <strong>and</strong> Power<br />
Meters, K. J. Kaufmann, ed., Proc. SPIE 2022, 160–163 �1993�.<br />
1 June 1997 � Vol. 36, No. 16 � APPLIED OPTICS 3621
REALIZATION OF AN INFRARED SPECTRAL RADIANT POWER RESPONSE<br />
SCALE ON A CRYOGENIC BOLOMETER<br />
Alan Migdall <strong>and</strong> George Eppeldauer<br />
<strong>National</strong> <strong>Institute</strong> <strong>of</strong> <strong>St<strong>and</strong>ards</strong> <strong>and</strong> Technology<br />
Optical Technology Division<br />
Abstract<br />
An ambient temperature Infrared Spectral Responsivity Comparator Facility has been developed at<br />
<strong>NIST</strong> to calibrate infrared detectors <strong>and</strong> radiometers for spectral <strong>and</strong> spatial responsivities. Test<br />
detectors are substituted for working- or transfer-st<strong>and</strong>ard radiometers in the output beam <strong>of</strong> a<br />
monochromator. InSb working st<strong>and</strong>ard radiometers have been developed <strong>and</strong> characterized to<br />
hold the spectral responsivity scale between 2 µm <strong>and</strong> 5.4 µm. The InSb working st<strong>and</strong>ard<br />
radiometers were calibrated against the transfer st<strong>and</strong>ard cryogenic bolometer that is tied to the<br />
primary st<strong>and</strong>ard cryogenic radiometer <strong>of</strong> <strong>NIST</strong>. The cryogenic bolometer holds the infrared<br />
power responsivity scale between 2 µm <strong>and</strong> 20 µm. The combined st<strong>and</strong>ard uncertainty (k=1) <strong>of</strong><br />
the spectral power responsivity scale, as realized on the cryogenic bolometer, is +/- 0.25 %.<br />
Key Words: bolometer; calibration; infrared detectors; radiometry; scale; spectral irradiance<br />
responsivity; spectral power responsivity.<br />
1. Introduction<br />
The <strong>National</strong> <strong>Institute</strong> <strong>of</strong> <strong>St<strong>and</strong>ards</strong> <strong>and</strong> Technology (<strong>NIST</strong>) has developed an IR radiant power<br />
responsivity scale for the spectral range from 2 µm to 20 µm. This scale is required for a facility<br />
that provides a detector-based calibration <strong>of</strong> IR detectors (1, 2) . The scale operates at much higher<br />
sensitivities (input power levels are 10 µW to 20 pW) than existing IR scales (between 500 µW<br />
<strong>and</strong> about 0.1 µW) (3) , while using a transfer st<strong>and</strong>ard detector with a flat spectral responsivity over<br />
the entire spectral range. The scale has been realized on a cryogenic bolometer, which accounts<br />
for the improved sensitivity relative to a pyroelectric detector based scale. The responsivity <strong>of</strong> this<br />
bolometer has been determined by multiple ties (4) to a primary st<strong>and</strong>ard, the <strong>NIST</strong> High Accuracy<br />
Cryogenic Radiometer (HACR) (5) . In addition, an independent method was used to determine the<br />
relative response <strong>of</strong> the bolometer over the entire spectral range. The uncertainty over the entire<br />
spectral range <strong>of</strong> 2 µm to 20 µm is typically better than 0.25 %, with the typical uncertainty <strong>of</strong> an<br />
individual measurement made with the bolometer being about 0.8 %.<br />
Working st<strong>and</strong>ard InSb radiometers (6) have been developed for the 2 µm to 5.4 µm wavelength<br />
range to hold the spectral responsivity scale. They are easy to use relative to the sophisticated<br />
bolometer that requires liquid He sensor-temperature <strong>and</strong> continuous computer control/monitor for<br />
responsivity change corrections (7) . Infrared test detectors with good spatial response uniformity<br />
can be calibrated against the InSb working st<strong>and</strong>ard radiometers in radiant power measurement<br />
mode. Spatially nonuniform infrared detectors can be used for accurate radiometric measurements<br />
when they are calibrated against the working st<strong>and</strong>ard InSb radiometers in irradiance measurement<br />
mode.
2. Spectral Responsivity <strong>of</strong> the Transfer St<strong>and</strong>ard Bolometer<br />
To determine the radiant power responsivity <strong>of</strong> the bolometer, its relative response was determined<br />
over its entire spectral range from measurements <strong>of</strong> bolometer components. This relative response<br />
shape was then tied down at many wavelengths via Si, Ge, <strong>and</strong> pyroelectric transfer detectors to<br />
the HACR. The bolometer consists <strong>of</strong> a sapphire disk with a heat sensor on one side <strong>and</strong> a gold<br />
black absorptive coating on the other side. Incident radiation is detected as a temperature rise.<br />
Because the bolometer operates by sensing energy deposited within its absorber, its relative<br />
response is just the product <strong>of</strong> the absorptance <strong>of</strong> the bolometer’s coating <strong>and</strong> the transmittance <strong>of</strong><br />
the window <strong>of</strong> the cryogenic dewar. For more details on the device construction <strong>and</strong><br />
characterization, see References 7, 8, <strong>and</strong> 9.<br />
The spectral absorptance <strong>of</strong> the bolometer gold black coating was measured using a Fourier<br />
Transform Infrared (FTIR) spectrometer system with hemispherical collection optics. This<br />
allowed the total reflectance (diffuse <strong>and</strong> specular) to be measured. The results are shown in Fig.<br />
1.<br />
Reflectance<br />
0.100<br />
0.050<br />
0.000<br />
-0.050<br />
0 5 10 15 20<br />
Wavelength [µm]<br />
mean= 0.00749<br />
σ= 0.20<br />
σ/√n= 0.00063<br />
Figure 1. Total bolometer reflectance<br />
Two additional measurements were made using laser sources. At 0.633 µm <strong>and</strong> 10.6 µm, the<br />
reflectances were determined to be (1.2±0.3) % <strong>and</strong> (0.5±0.3) % respectively. [(The uncertainties<br />
reported in this paper are all st<strong>and</strong>ard uncertainties as defined in Ref. 10 (coverage factor k=1).] A<br />
linear fit to the FTIR data from 2 µm to 17 µm indicated a minimal slope with a value not much<br />
larger than its uncertainty. Because <strong>of</strong> this, the FTIR reflectance data were simply averaged<br />
yielding a wavelength independent reflectance value, R=0.75 %. This is consistent with the values<br />
<strong>and</strong> uncertainties <strong>of</strong> the two laser reflectance measurements. Because the IR termination <strong>of</strong> the<br />
reflectance data beyond 17 µm was due to low FTIR sensitivity rather than a variation <strong>of</strong> gold<br />
black, it is expected that an extrapolation <strong>of</strong> this data will be valid to at least 20 µm.<br />
The transmittance <strong>of</strong> the bolometer window was measured from 600 nm to beyond 18 µm. The<br />
Infrared Spectral Comparator Facility (IR SCF) was used to measure the transmittance <strong>of</strong> single<br />
KBr window samples from 2 µm to 20 µm (see Fig. 2a.). The mean size <strong>of</strong> the error bars was<br />
about 0.1 % for the region from 2 µm to 16 µm. The IR SCF was used to measure the<br />
transmittance difference <strong>of</strong> two window samples as shown in Figure 2b. The mean difference
etween the two measurements was 0.016 % with a st<strong>and</strong>ard deviation <strong>of</strong> 0.2 %. These small<br />
differences allow for window replacements, while using this st<strong>and</strong>ard deviation as the uncertainty.<br />
These small differences also indicate that the spatial uniformity <strong>of</strong> the windows, which was not<br />
specifically tested, should be significantly below these levels.<br />
Transmittance<br />
0.92<br />
0.91<br />
0.90<br />
0.89<br />
error bars are stdev <strong>of</strong> 5 to 9 pts.<br />
4 8 12 16 20<br />
Wavelength (µm)<br />
KBr Transmittance<br />
0.92<br />
0.91<br />
0.90<br />
0.89<br />
sample 1<br />
sample 2<br />
2-19 µm stats<br />
Minimum<br />
Maximum<br />
(T 1 -T 2 )/T 1<br />
4 8 12 16 20<br />
Wavelength (µm)<br />
(T 1 -T 2 )/T 1<br />
-0.0078<br />
0.0068<br />
Mean 0.000156<br />
Figure 2. (a) Spectral transmittance <strong>of</strong> one <strong>and</strong> (b) two KBr windows <strong>and</strong> their relative differences.<br />
The relative spectral response <strong>of</strong> the bolometer as shown in Figure 3 is the product <strong>of</strong> the window<br />
transmittance <strong>and</strong> the bolometer gold black absorptance. Except for a pair <strong>of</strong> 1 % to 2 % dips<br />
(most likely due to window coating absorption lines) the bolometer response is quite flat. The<br />
uncertainty for the 2 µm to 20 µm region is 0.36 %, the quadrature sum <strong>of</strong> the 0.2 % KBr<br />
transmittance uncertainty <strong>and</strong> the 0.3 % gold black absorptance uncertainty. In the 0.6 µm to 2 µm<br />
region, the transmittance uncertainty is so small that the gold black absorptance uncertainty<br />
dominates the total uncertainty.<br />
To convert the relative spectral curve just discussed into an absolute scale, it was necessary to<br />
determine the absolute responsivity at one, or preferably, more wavelengths. This was done by<br />
comparison to Si, Ge, <strong>and</strong> pyroelectric st<strong>and</strong>ard detectors, which were themselves tied to the<br />
HACR primary st<strong>and</strong>ard. The comparisons were made at specific wavelengths using laser sources<br />
at 0.633 µm, 1.3 µm, <strong>and</strong> 10.6 µm <strong>and</strong> over a continuous range from 600 nm to 900 nm using the<br />
quartz lamp <strong>and</strong> the IR SCF itself as the source. Even though the VIS/NIR calibrations are outside<br />
<strong>of</strong> the intended range <strong>of</strong> the IR SCF, those measurements are important because <strong>of</strong> their accuracy<br />
<strong>and</strong> to verify the spectral flatness <strong>of</strong> the bolometer.<br />
The overall bolometer spectral response is shown in Fig. 4, where it is overlaid on the responsivity<br />
determined from the bolometer reflectance <strong>and</strong> window transmittance. This determination is a<br />
relative spectral curve, requiring a single scale factor to fit all <strong>of</strong> the absolute measurements. The<br />
resulting curve shown is T(1-R)*0.3913 V/µW. As can be seen from the figure, this response is a<br />
good fit, well within the uncertainties. For the VIS/NIR region the data shows excellent<br />
smoothness reflecting the quality <strong>of</strong> the Si <strong>and</strong> Ge transfer st<strong>and</strong>ards.<br />
Std Dev<br />
0.0021<br />
0.01<br />
0<br />
-0.01<br />
(T 1 -T 2 )/T 1
Transmittance<br />
0.920<br />
0.910<br />
0.900<br />
0.890<br />
0.880<br />
Transmittance<br />
Stdev<br />
0<br />
0.5 1 1.5 2<br />
Wavelength (µm)<br />
0.01<br />
0.008<br />
0.006<br />
0.004<br />
0.002<br />
Figure 3. Transmittance <strong>of</strong> the KBr bolometer-window.<br />
The IR region shows much higher variation due to the poorer quality <strong>of</strong> the pyroelectric transfer<br />
detector, which had much lower signal to noise ratio, poorer spatial response uniformity, <strong>and</strong><br />
involved a more difficult calibration transfer. The overall good fit <strong>of</strong> the curve shape to the actual<br />
measurements over the 0.6 µm to 11 µm range indicates excellent selfconsistency. This should be<br />
emphasized as the overall data set includes three independent transfer detectors <strong>and</strong> a continuous<br />
spectral source as well as a laser source. This high level <strong>of</strong> selfconsistency increases confidence in<br />
the regions where absolute measurements were not directly made.<br />
The overall scale factor <strong>of</strong> the relative response curve was determined by taking the ratio <strong>of</strong> the<br />
bolometer responsivity to the predicted relative response (T·(1-R)). The weighted mean <strong>of</strong> all the<br />
ratio data was 0.3913±0.00015 (The uncertainty is the st<strong>and</strong>ard deviation <strong>of</strong> the mean). The<br />
weights used were the ratio uncertainty (the quadrature sum <strong>of</strong> the uncertainties <strong>of</strong> the responsivity<br />
measurements <strong>and</strong> the responsivity curve). This constant is a scale factor to convert the relative<br />
response curve to an absolute scale.<br />
All uncertainty components were included, so the nonstatistical uncertainty correlations are<br />
ignored here. This analysis assumes a single scale factor over the entire wavelength range. To test<br />
this, the ratios <strong>of</strong> the responsivity measurements to the now absolute predicted responsivity were<br />
plotted versus wavelength <strong>and</strong> fit to a line. As shown in Fig. 5, the fit stays within ±0.25 % <strong>of</strong><br />
unity indicating that any systematic tilting <strong>of</strong> the relative curve is less than this value. A second<br />
analysis was done that included some correlations in the component uncertainties with very little<br />
change <strong>of</strong> the final uncertainty (11) .<br />
St<strong>and</strong>ard deviation
Bolometer Responsivity (V/µW)<br />
0.38<br />
0.37<br />
0.36<br />
0.35<br />
0.34<br />
0.33<br />
Only error bar caps are<br />
shown here for clarity.<br />
T*(1-R)*scale factor<br />
1.31 µm laser<br />
measurement<br />
Si Ge Pyroelectric<br />
1 2<br />
10<br />
Wavelength(µm)<br />
Figure 4. Radiant power responsivity <strong>of</strong> the bolometer.<br />
The different analysis schemes support an overall uncertainty <strong>of</strong> ±0.25 % in the absolute<br />
responsivity scale as shown by the solid curve in Fig. 4. This uncertainty when combined with the<br />
uncertainty associated with an individual bolometer radiant power measurement at a specific<br />
wavelength (about 0.75 %) gives an overall bolometer power responsivity scale uncertainty <strong>of</strong><br />
about 0.8 %. This is the uncertainty that can be expected for a bolometer measurement <strong>of</strong> radiant<br />
power made at a single wavelength within the 2 µm to 20 µm range <strong>of</strong> the IR SCF (assuming<br />
adequate measurement time is allowed so as not to be limited by bolometer signal noise). This<br />
uncertainty is comparable to the quoted uncertainty <strong>of</strong> a similar IR scale also set up for detector<br />
calibrations (3) .<br />
3. Conclusion<br />
<strong>NIST</strong> has developed an IR spectral responsivity scale. The radiant power responsivity scale was<br />
first implemented on a high sensitivity cryogenic bolometer between 2 µm <strong>and</strong> 20 µm. The power<br />
responsivity scale uncertainty is comparable with the best existing IR responsivity scales. Working<br />
st<strong>and</strong>ard <strong>and</strong> test infrared detectors <strong>and</strong> radiometers can be calibrated against the cryogenic<br />
bolometer.<br />
20
Responsivity/T(1-R)*c<br />
4. References<br />
1.04<br />
1.03<br />
1.02<br />
1.01<br />
1<br />
0.99<br />
0.98<br />
0.97<br />
0.96<br />
c= 0.39130<br />
y=a+b λ<br />
a=0.9975±0.0014<br />
b=0.00072±0.00026<br />
χ 2 =70.4<br />
1 10<br />
Wavelength (µm)<br />
Figure 5. Ratio <strong>of</strong> the bolometer power responsivity to the scaled relative response.<br />
1. Migdall, A., Eppeldauer, G., <strong>and</strong> Cromer, C., “IR Detector Spectral Responsivity Calibration<br />
Facility at <strong>NIST</strong>,” Cryogenic Optical Systems <strong>and</strong> Instruments VI, SPIE 2227, 46-53, 1994.<br />
2. Parr, A.C., “A <strong>National</strong> Measurement System For Radiometry, Photometry, <strong>and</strong> Pyrometry<br />
Based upon Absolute Detectors, <strong>NIST</strong> <strong>Technical</strong> <strong>Note</strong> 1421, 1996.<br />
3. Nettleton, D.H., Prior, T.R., <strong>and</strong> Ward, T.H., “Improved Spectral Responsivity Scales at the<br />
NPL, 400 nm to 20 µm,” Metrologia, Vol. 30, 425-432, 1993.<br />
4. Migdall, A. <strong>and</strong> Eppeldauer, G., “Realization <strong>of</strong> an infrared spectral radiant power response<br />
scale on a cryogenic bolometer,” Metrologia, Vol. 35, 307-315, 1998.<br />
5. Gentile, T.R., Houston, J.M. <strong>and</strong> Cromer, C.L., “Realization <strong>of</strong> a scale <strong>of</strong> absolute spectral<br />
response using the <strong>National</strong> <strong>Institute</strong> <strong>of</strong> <strong>St<strong>and</strong>ards</strong> <strong>and</strong> Technology high-accuracy cryogenic<br />
radiometer,” Appl. Opt. 35, 1996, 4392-4403.<br />
6. Eppeldauer, G.P., Migdall, A.L., <strong>and</strong> Hanssen, L.M., “InSb Working St<strong>and</strong>ard Radiometers”,<br />
Metrologia, Vol. 35, 485-490, 1998.<br />
7. Eppeldauer, G., Migdall, A.L., Gentile, T.R., <strong>and</strong> Cromer, C.L., “Absolute response<br />
calibration <strong>of</strong> a transfer st<strong>and</strong>ard cryogenic bolometer”, SPIE, Proc. Vol. 2550, 36-46, 1995.<br />
8. Eppeldauer, G., Migdall, A.L., Cromer, C. L., “Characterization <strong>of</strong> a High Sensitivity<br />
Composite Silicon Bolometer,” Metrologia, Vol. 30, 317-320, 1993.
9. Eppeldauer, G., Migdall, A.L., <strong>and</strong> Cromer, C.L., “A Cryogenic Silicon Resistance<br />
Bolometer for use as an Infrared Transfer St<strong>and</strong>ard Detector,” Thermal Phenomena at<br />
Molecular <strong>and</strong> in Cryogenic Infrared Detectors, edited by M. Kaviany et al., ASME, HTD-<br />
Vol. 277, New York, NY, 63-67, 1994.<br />
10. Taylor, B.N. <strong>and</strong> Kuyatt, C.E., Guidelines for Evaluating <strong>and</strong> Expressing the Uncertainty <strong>of</strong><br />
<strong>NIST</strong> Measurement Results, Natl. Inst. St<strong>and</strong>. Technol. (U.S.), Tech. <strong>Note</strong> 1297, 1994.<br />
11. Migdall, A.L., Eppeldauer, G.P., <strong>NIST</strong> Measurement Services: Spectroradiometric Detector<br />
Measurements: Part III-Infrared Detectors, <strong>NIST</strong> Special Publication 250-42, 1998.
Abstract<br />
SPECTRAL POWER AND IRRADIANCE RESPONSIVITY CALIBRATION<br />
OF InSb WORKING STANDARD RADIOMETERS<br />
George Eppeldauer <strong>and</strong> Miklos Racz *<br />
<strong>National</strong> <strong>Institute</strong> <strong>of</strong> <strong>St<strong>and</strong>ards</strong> <strong>and</strong> Technology<br />
Optical Technology Division<br />
Gaithersburg, Maryl<strong>and</strong> 20899<br />
* Guest researcher from the Hungarian Academy <strong>of</strong> Sciences<br />
Research <strong>Institute</strong> for <strong>Technical</strong> Physics <strong>and</strong> Materials Science 1<br />
New, improved performance, InSb power/irradiance meters have been developed <strong>and</strong><br />
characterized to hold the <strong>National</strong> <strong>Institute</strong> <strong>of</strong> <strong>St<strong>and</strong>ards</strong> <strong>and</strong> Technology (<strong>NIST</strong>) spectral<br />
responsivity scale between 2 µm <strong>and</strong> 5.1 µm. The InSb radiometers were calibrated against the<br />
transfer st<strong>and</strong>ard cryogenic bolometer that is tied to the primary st<strong>and</strong>ard cryogenic radiometer <strong>of</strong><br />
<strong>NIST</strong>. The InSb radiometers serve as easy-to-use working st<strong>and</strong>ards for routine spectral power<br />
<strong>and</strong> irradiance responsivity calibrations. The spectral irradiance responsivities were derived from<br />
the spectral power responsivities utilizing the measured area <strong>of</strong> the apertures in front <strong>of</strong> the InSb<br />
detectors.<br />
1. Introduction<br />
High sensitivity infrared radiometer st<strong>and</strong>ards can eliminate signal level problems caused by the<br />
weak outputs <strong>of</strong> commonly used thermal sources. An accurate infrared spectral responsivity scale<br />
has been realized on pyroelectric detectors at the <strong>National</strong> Physical Laboratory. 1 The responsivity<br />
calibration <strong>of</strong> an InSb transfer st<strong>and</strong>ard detector has been reported for metrological applications<br />
between 1 µm <strong>and</strong> 3 µm. 2 The new infrared spectral responsivity scale developed at <strong>NIST</strong> has<br />
been realized on a cryogenic bolometer 3 that operates at much higher sensitivities (input power<br />
levels are 10 µW to 20 pW) than pyroelectric detector based scales (between 500 µW <strong>and</strong> 1 µW).<br />
Working st<strong>and</strong>ard InSb radiometers 4 have been developed for the 2 µm to 5.4 µm wavelength<br />
range to hold the spectral responsivity scale. They are easy to use relative to the sophisticated<br />
cryogenic bolometer 5 that requires liquid He sensor-temperature <strong>and</strong> continuous computer<br />
control/monitor for responsivity-change corrections. 6 Design, characterization, <strong>and</strong> spectral<br />
power responsivity calibration <strong>of</strong> the improved performance second-generation InSb radiometers<br />
is discussed in this paper. Realization <strong>of</strong> a new spectral irradiance responsivity scale is described<br />
also for the 2 µm to 5.1 µm wavelength range. Infrared test detectors with good spatial response<br />
uniformity can be calibrated against the InSb working st<strong>and</strong>ard radiometers in radiant power<br />
measurement mode. Spatially nonuniform infrared detectors can be used for accurate radiometric<br />
measurements when they are calibrated against the working st<strong>and</strong>ard InSb radiometers in<br />
irradiance measurement mode.<br />
2. Mechanical structure <strong>of</strong> the InSb radiometers<br />
1 Current position is with the Konkoly Observatory, Budapest, Hungary
Following the first-generation 4 mm diameter InSb detectors 4 second generation InSb radiometers<br />
have been developed in cooperation with EG&G Judson. 7 Large area <strong>and</strong> selected high-shuntresistance<br />
detectors are mounted in the 77 K dewars. These InSb detectors were designed to<br />
minimize the problem <strong>of</strong> flashing 4 even when exposed to short wavelength optical radiation.<br />
Precision apertures <strong>of</strong> 6.4 mm diameter are mounted in all dewars in front <strong>of</strong> the 7 mm diameter<br />
InSb photovoltaic detectors. Long-snout <strong>and</strong> short-snout dewars have been developed for<br />
different applications. In the long-snout version, as shown in Figure 1, a 17° field-<strong>of</strong>-view (FOV)<br />
limiter is realized with a cold second aperture positioned 50 mm away from the precision<br />
aperture. The advantage <strong>of</strong> this arrangement is that laser beams can be measured if a wedged<br />
Dewar-window is used to avoid interference <strong>and</strong> to produce a large enough separation between<br />
the primary <strong>and</strong> reflected beams in the plane <strong>of</strong> the precision aperture. Also, the background<br />
rejection is higher here than in the short-snout Dewar because <strong>of</strong> the 31° partial (clipped) FOV.<br />
The separation between the two apertures is only 7.2 mm in the short-snout Dewar. This unit is<br />
used only for non-coherent radiation measurements where easy alignment is an issue. The<br />
background produced signal is higher in the short-snout unit because <strong>of</strong> the 90° overall FOV (the<br />
unvignetted FOV remained 17°). Optical filters can be mounted inside the cylindrical holder <strong>of</strong><br />
the cold FOV limiter. These radiometers can be used in both radiant power <strong>and</strong> irradiance<br />
measurement modes.<br />
Fig. 1. Mechanical-optical construction <strong>of</strong> the second generation (long-snout) InSb radiometer.<br />
3. DC background <strong>and</strong> AC noise test <strong>of</strong> the InSb radiometers<br />
The current-to-voltage converter gains <strong>of</strong> the InSb radiometers were designed to achieve a DC<br />
thermal background-induced output voltage <strong>of</strong> less than 5 V.<br />
An infrared collimator was used for AC noise tests. The infrared collimator was built from a<br />
variable temperature blackbody (BB) radiator, a 25 cm diameter reflecting (collimating) mirror,<br />
<strong>and</strong> a detector stage. An aperture wheel, a chopper, <strong>and</strong> then a shutter (this was the closest to the<br />
BB) were located in front <strong>of</strong> the BB cavity. The output voltage from the current-to-voltage<br />
converter <strong>of</strong> the InSb radiometer was measured with a lockin amplifier.<br />
The noise floor <strong>of</strong> the second-generation InSb radiometers was tested with a 40 Hz chopping<br />
frequency while the shutter was closed. From 10 measurements, a 6.7 pA st<strong>and</strong>ard deviation was<br />
calculated for the current noise <strong>of</strong> the broadb<strong>and</strong> InSb-1 radiometer when the electrical b<strong>and</strong>width
was 0.5 Hz. This corresponds to a noise equivalent photocurrent <strong>of</strong> 5 pA/Hz 1/2 . The InSb-1<br />
radiometer is a short-snout unit without any cold filter. This is our most frequently used working<br />
st<strong>and</strong>ard.<br />
For very high sensitivity measurements, the background rejection <strong>of</strong> the long-snout InSb<br />
radiometer was further increased by installing a cold filter (Model BBP-3200-3590-D from<br />
Spectrogon US, Inc.) 7 with a b<strong>and</strong>pass <strong>of</strong> 3.2 µm to 3.6 µm (FWHM). The current-to-voltage gain<br />
could be increased from the 3 x 10 4 V/A maximum <strong>of</strong> the short-snout unit to 10 6 V/A where the<br />
DC background-caused output voltage was 1.6 V. A noise equivalent power (NEP) <strong>of</strong> 0.22<br />
pW/Hz 1/2 was obtained at the peak responsivity <strong>of</strong> the filtered InSb radiometer. The dynamic<br />
(signal) range was six orders <strong>of</strong> magnitude at the 10 6 V/A gain.<br />
4. Calibration facility <strong>and</strong> procedure<br />
All measurements were performed on the Ambient Infrared Spectral Comparator Facility<br />
(IRSCF). 8 The optical-mechanical scheme <strong>of</strong> the facility is shown in Fig. 2.<br />
The light sources were a 100 W tungsten halogen lamp from 2 µm to 3.65 µm, <strong>and</strong> a 45 W<br />
ceramic glower from 3.65 µm to 5.7 µm. The sources were imaged to the entrance aperture <strong>of</strong> the<br />
prism-grating double monochromator using spherical <strong>and</strong> flat mirrors. A chopper was positioned<br />
in front <strong>of</strong> the entrance aperture. Either 1 mm or 2 mm diameter apertures could be used. An<br />
input iris was mounted on the spherical mirror to adjust the solid angle <strong>of</strong> the beam entering the<br />
monochromator. The flat mirror was removable using a kinematic mount. The b<strong>and</strong>pass <strong>of</strong> the<br />
monochromator was about 1% <strong>of</strong> the selected wavelength. Laser beams could be introduced into<br />
the monochromator when the flat mirror was removed. The laser inputs were used either for<br />
wavelength calibration or to scan detectors with a small spot for high resolution spatial response<br />
tests. Order sorting filters were used at the exit aperture <strong>of</strong> the monochromator to improve the<br />
out-<strong>of</strong>-b<strong>and</strong> blocking <strong>of</strong> the prism (KRS-5) pre-disperser <strong>of</strong> the monochromator. Off-axis<br />
paraboloid mirrors imaged the output beam to the detectors. The f/# <strong>of</strong> the output beam could be<br />
controlled with another iris. The detectors measured the total radiant power <strong>of</strong> the incident<br />
monochromatic beam (focussed into a 2 mm diameter spot on the detector surface) in underfilled<br />
mode. The kinematic mount <strong>of</strong> the bolometer was held by a separate stage where it could be<br />
tilted rotated, <strong>and</strong> shifted. Three InSb radiometers could be aligned on a second detector stage<br />
which was mounted on the computer moved Z (vertical) translation stage. Both detector stages<br />
were mounted on the computer controlled Y (horizontal) translation stage.<br />
Spatial response scans were made along the horizontal <strong>and</strong> vertical diameters <strong>of</strong> all detectors<br />
before measurements to determine the location <strong>of</strong> the beam spot in the center <strong>of</strong> the detector.<br />
The calibration procedure included a number <strong>of</strong> spectral scans in different wavelength intervals.<br />
During a scan, the computer set the wavelength, moved the bolometer into the beam where the<br />
test points 8 <strong>and</strong> the output signal were measured, then the first InSb radiometer was moved into<br />
the same beam where its output signal was measured as well. During the responsivity scale<br />
derivation, a large enough number <strong>of</strong> measured points <strong>and</strong> scans were selected to make the<br />
statistical evaluation easier. After all InSb radiometers were measured at a selected wavelength,<br />
the scan was repeated at a 25 nm or 50 nm increment.
Fig. 2. Optical-mechanical scheme <strong>of</strong> the Ambient Infrared Spectral Comparator Facility<br />
5. Measurement results<br />
Those electronic <strong>and</strong> radiometric characteristics <strong>of</strong> the second generation InSb radiometers were<br />
measured which could influence the performance <strong>of</strong> the spectral responsivity calibrations.<br />
5.1. Frequency dependent signal responsivity<br />
The frequency dependence <strong>of</strong> the InSb radiometer responsivity was measured to allow response corrections<br />
for different chopping frequencies in different applications. Usually, the DC signal responsivity is<br />
reported. The measured responsivity curves <strong>of</strong> the InSb-1 radiometer are shown in Fig. 3 at<br />
transimpedances <strong>of</strong> 10 kΩ, 20 kΩ, <strong>and</strong> 30 kΩ. The 30 kΩ feedback resistor was used in the responsivity<br />
calibrations at the IRSCF. The lowest 3 dB roll-<strong>of</strong>f frequency was about 400 Hz. The roll-<strong>of</strong>f frequencies<br />
were determined from curve fits to a single time constant equivalent circuit <strong>of</strong> a low-pass RC filter. 9 The<br />
chopping frequency (for a given application) should be selected to be 40 Hz or less to keep the operating<br />
point on the plateau <strong>of</strong> the responsivity curves.<br />
Normalized signal response<br />
1.05<br />
1<br />
0.95<br />
0.9<br />
0.85<br />
0.8<br />
0.75<br />
0.7 10<br />
401.5 Hz<br />
30 kΩ<br />
10 kΩ<br />
604.5 Hz<br />
20 kΩ 1354 Hz<br />
100 1000<br />
Chopping frequency [Hz]<br />
Fig. 3. Frequency-dependent signal responsivity curves <strong>of</strong> the InSb-1 radiometer at different gains.
5.2. Spatial response<br />
Horizontal <strong>and</strong> vertical scans were made through the detector centers with 2 mm diameter beam<br />
spots. The goal <strong>of</strong> these measurements was to check the spatial response uniformity <strong>of</strong> the<br />
detectors. The scans were made to find the plateau for power responsivity measurement <strong>and</strong> also<br />
to calculate an uncertainty component for the uncertainty budget. Beam clipping was avoided by<br />
working in the center <strong>of</strong> the measured plateau.<br />
Figure 4 shows the horizontal <strong>and</strong> vertical response scans <strong>of</strong> the InSb-1 radiometer. The response<br />
difference is shown for both scans relative to the response in the detector center. The scans<br />
appear to show that the degree <strong>of</strong> non-uniformity is 0.36% along a vertical diameter calculated as<br />
the st<strong>and</strong>ard deviation from seven points on the plateau. The non-uniformity along the<br />
perpendicular (horizontal) diameter was much lower. The average run-to-run st<strong>and</strong>ard deviation<br />
for the seven points was 0.05%.<br />
5.3. Spectral power responsivity<br />
The measured spectral power responsivity curves <strong>of</strong> the second generation InSb-1 <strong>and</strong> the first<br />
generation InSb-0 radiometers are shown in Fig. 5. The curves were calculated from a number <strong>of</strong><br />
spectral responsivity scans performed in a few weeks period. The responsivity at each<br />
wavelength was determined from the average <strong>of</strong> at least four substitution measurements against<br />
the transfer st<strong>and</strong>ard cryogenic bolometer. Both the transfer- <strong>and</strong> working-st<strong>and</strong>ards were<br />
underfilled by the incident monochromatic radiation. The graph also shows the 100% external<br />
quantum efficiency 10 (EQE) (discussed below). The second generation detector has improved<br />
spectral responsivity. A roughly 5% dip at 4.2 µm <strong>and</strong> a smaller dip at 2.7 µm were caused by<br />
atmospheric absorption because the length <strong>of</strong> the optical path was different for the InSb detectors<br />
as compared to the transfer st<strong>and</strong>ard bolometer. The dips at 4.2 µm are shown with thinner lines.<br />
Only the monochromator was purged. The other small dips at 3.2 µm were caused by absorption<br />
inside <strong>of</strong> the InSb Dewars. Dip-free responsivity curves could be obtained by either extending<br />
the purged beam-passes or applying responsivity corrections. The right-side Y-axis combines the<br />
relative uncertainties (k=1) <strong>of</strong> the two detector spectral responsivity measurements. Uncertainties<br />
are not shown for the 4.2 µm absorption b<strong>and</strong> where high accuracy calibrations are not suggested.<br />
Increased uncertainties can be seen at the other absorption b<strong>and</strong>s. The low uncertainties reflect<br />
the small changes (drift) during a short substitution measurement at a selected wavelength. The<br />
uncertainties <strong>of</strong> the InSb-0 detector are lower because <strong>of</strong> the better spatial response nonuniformity.<br />
5.4. Spectral irradiance responsivity<br />
The spectral irradiance responsivity <strong>of</strong> the working st<strong>and</strong>ard radiometers was determined to<br />
calibrate test detectors with large spatial response non-uniformity. The response non-uniformity<br />
<strong>of</strong> these test detectors can be averaged out if they are calibrated in irradiance measurement mode<br />
where both the st<strong>and</strong>ard <strong>and</strong> the test irradiance meters are overfilled with a uniform field <strong>of</strong><br />
radiation.<br />
The spectral irradiance responsivity <strong>of</strong> the st<strong>and</strong>ard meter is equal to the product <strong>of</strong> the spectral<br />
power responsivity <strong>and</strong> the area <strong>of</strong> the precision aperture in front <strong>of</strong> the detector. The second<br />
generation InSb irradiance meters were built <strong>and</strong> used for two different applications. In the first<br />
one, the broad-b<strong>and</strong> detector was utilized as a working st<strong>and</strong>ard in a short-snout Dewar. In the
second application, a cold filter with a b<strong>and</strong>-pass from 3.2 µm to 3.6 µm (FWHM) was used in a<br />
long-snout Dewar to measure the very low irradiance levels in the infrared collimator (mentioned<br />
in Section 3). This irradiance mode working st<strong>and</strong>ard was used to calibrate the infrared<br />
collimator <strong>and</strong> it also measured the area <strong>of</strong> very small apertures (in the aperture wheel <strong>of</strong> the<br />
collimator) radiometrically relative to a large (mechanically measured) reference aperture. The<br />
details <strong>of</strong> the collimator calibration <strong>and</strong> its aperture area measurements are beyond the scope <strong>of</strong><br />
this paper. The power levels measured on the collimator were lower than 0.1 mW where the<br />
detector non-linearity is much less than 1%. 2,4 At 10 6 V/A gain <strong>and</strong> 800 °C BB temperature, the<br />
signal-to-noise ratio <strong>of</strong> this irradiance meter was 2 x 10 3 when the smallest collimator aperture<br />
(0.2 mm diameter) was tested.<br />
Response difference [%]<br />
0<br />
-2<br />
-4<br />
-6<br />
horizontal<br />
vertical<br />
-3 -2 -1 0 1 2 3<br />
Position [mm]<br />
Fig. 4. Horizontal <strong>and</strong> vertical response scans <strong>of</strong> the InSb-1 radiometer. The curves show the response<br />
differencies relative to the response in the detector center.<br />
Power responsivity [A/W]<br />
2.5<br />
2<br />
1.5<br />
1<br />
0.5<br />
100%<br />
EQE<br />
InSb-1<br />
InSb-0<br />
2.4<br />
1.6<br />
1.2<br />
0<br />
0.8<br />
2 2.5 3 3.5 4 4.5 5 5.5<br />
Wavelength [µm]<br />
Fig. 5. Spectral responsivity curves <strong>of</strong> the first generation (InSb-0) <strong>and</strong> second generation (InSb-1)<br />
radiometers are shown. The responsivities measured at the 4.2 µm absorption b<strong>and</strong> are shown where the<br />
curves become thinner. The thoretical limit <strong>of</strong> the responsivity is the 100 % EQE line. The two curves at<br />
the bottom are the uncertainties (scaled on the right-h<strong>and</strong> Y axis).<br />
2<br />
Relative uncertainty [%]
5.5. External quantum efficiency<br />
The external quantum efficiency is EQE = 1239.48 * s/λ where s is the responsivity <strong>and</strong> λ is the<br />
wavelength. Also, EQE = (1-ρ) * IQE where ρ is the reflectance <strong>and</strong> IQE is the internal quantum<br />
efficiency equal to the ratio <strong>of</strong> the number <strong>of</strong> collected electrons to the number <strong>of</strong> photons<br />
absorbed by the detector. The EQE <strong>of</strong> the second generation InSb detectors was almost twice that<br />
<strong>of</strong> the first generation devices. The highest EQE <strong>of</strong> 75% was calculated between 3.6 µm <strong>and</strong> 3.7<br />
µm for the InSb-1 detector. Both radiometer generations had sapphire windows with a<br />
transmittance <strong>of</strong> about 90% at 3 µm. The InSb-1 radiometer was equipped with a 1.8 µm cut-on<br />
(cold) filter. This filter has a transmittance <strong>of</strong> 90% to 95% for wavelengths longer than 2 µm.<br />
From the measured (<strong>and</strong> calculated) EQE <strong>and</strong> the signal loss caused by the window <strong>and</strong> the coldfilter,<br />
a reflectance <strong>of</strong> about 10% can be estimated for the InSb-1 detector. The IQE is close to<br />
unity. The InSb-0 (first generation) radiometer was not filtered.<br />
6. Uncertainties<br />
The uncertainties were evaluated <strong>and</strong> expressed according to the guidelines <strong>of</strong> the <strong>NIST</strong><br />
<strong>Technical</strong> <strong>Note</strong> 1297 11 <strong>and</strong> the ANSI/NCSL Z540-2-1997 U.S. Guide to the Expression <strong>of</strong><br />
Uncertainty in Measurement (GUM). 12 The modelling <strong>of</strong> the measur<strong>and</strong> (the spectral power<br />
responsivity) <strong>and</strong> its measurement procedure have been discussed in detail in the <strong>NIST</strong> Special<br />
Publication 250-42, 8 where the uncertainty components were evaluated for the spectral<br />
responsivity determination <strong>of</strong> the transfer st<strong>and</strong>ard cryogenic bolometer.<br />
In the present example, the power responsivity scale was derived from the cryogenic bolometer to<br />
the working st<strong>and</strong>ard InSb-1 radiometer. The responsivity scale uncertainty <strong>of</strong> the bolometer<br />
dominates the uncertainty budget <strong>of</strong> the InSb working st<strong>and</strong>ard. The additional uncertainty<br />
sources <strong>of</strong> this scale derivation are summarized in Table 1. The uncertainty components that<br />
contribute to the overall uncertainty are described below.<br />
The uncertainty components, caused by the spatial response non-uniformity <strong>of</strong> the bolometer <strong>and</strong><br />
InSb detector were calculated from spatial response scans as the st<strong>and</strong>ard deviation <strong>of</strong> the<br />
measured data points. All the utilized data points were located on the plateau <strong>of</strong> the response<br />
curves measured along the detector diameters, indicating that the incident beam was not clipped<br />
by the input optics <strong>of</strong> the radiometers. Because <strong>of</strong> the limitations in the vertical moving <strong>of</strong> the<br />
bolometer stage, only horizontal scans were made on the bolometer. The st<strong>and</strong>ard deviation from<br />
the horizontal scan represented the spatial response non-uniformity <strong>of</strong> the bolometer in the<br />
uncertainty budget.<br />
The measurement noise was obtained from the st<strong>and</strong>ard deviation <strong>of</strong> the average responsivity.<br />
The InSb radiometer was substituted for the bolometer at least four times at each wavelength.<br />
The measurement noise includes the signal changes due to component instabilities (e.g. source<br />
fluctuations) <strong>and</strong> wavelength dependent (r<strong>and</strong>om) uncertainties <strong>of</strong> the monochromator. The longterm<br />
drift <strong>of</strong> the source did not produce any additional uncertainty component because the<br />
detector substitution at each wavelength took care <strong>of</strong> this problem. Also, the chopper duty-factor<br />
(open-to-close ratio) related uncertainty components could be neglected because the same<br />
chopper was used for both the bolometer <strong>and</strong> the InSb radiometer.<br />
The frequency instability <strong>of</strong> the chopper produced an uncertainty component in the frequency<br />
dependent responsivity corrections. The InSb radiometer responsivity correction was determined<br />
from the data fits <strong>of</strong> multiple 3 dB signal roll-<strong>of</strong>f measurements at different photocurrent-to-
voltage gains. The photocurrent-to-voltage gains were measured against a st<strong>and</strong>ard current<br />
source (calibrator). The gain correction uncertainty includes the gain calibration uncertainty <strong>and</strong><br />
the gain instabilities as well.<br />
Table 1<br />
⎯⎯⎯⎯⎯⎯⎯⎯⎯⎯⎯⎯⎯⎯⎯⎯⎯⎯⎯⎯⎯⎯⎯⎯⎯⎯⎯⎯⎯⎯⎯⎯⎯⎯⎯⎯⎯<br />
Uncertainties <strong>of</strong> power responsivity calibration with the working st<strong>and</strong>ard InSb-1 radiometer<br />
outside <strong>of</strong> the atmospheric <strong>and</strong> Dewar absorption b<strong>and</strong>s<br />
⎯⎯⎯⎯⎯⎯⎯⎯⎯⎯⎯⎯⎯⎯⎯⎯⎯⎯⎯⎯⎯⎯⎯⎯⎯⎯⎯⎯⎯⎯⎯⎯⎯⎯⎯⎯⎯<br />
Uncertainty (k=1) [%]<br />
Uncertainty origin Type A 11 Type B<br />
Infrared spectral responsivity scale (on the bolometer) 8 0.8<br />
Bolometer spatial response non-uniformity 0.24<br />
InSb-1 spatial response non-uniformity (horizontal) 0.05<br />
InSb-1 spatial response non-uniformity (vertical) 0.36<br />
Noise <strong>of</strong> the bolometer responsivity measurement 0.19<br />
Noise <strong>of</strong> the InSb-1 radiometer responsivity measurement 0.15<br />
Responsivity correction <strong>of</strong> the InSb-1 radiometer to 0 Hz 0.07<br />
Bolometer preamplifier gain correction 8 0.18<br />
InSb-1 radiometer gain correction 0.07<br />
Lockin amplifier gain correction 8 0.12<br />
Bolometer responsivity corrections (temperature, bias,<br />
3 dB roll-<strong>of</strong>f measurements, <strong>and</strong> non-linearity) 0.2<br />
InSb response non-linearity 2,4 0.1<br />
Wavelength shift <strong>of</strong> the monochromator from 2 µm to 3.7 µm 0.3<br />
Wavelength shift <strong>of</strong> the monochromator from 3.7 µm to 5.1 µm 0.1<br />
⎯⎯⎯⎯⎯⎯⎯⎯⎯⎯⎯⎯⎯⎯⎯⎯⎯⎯⎯⎯⎯⎯⎯⎯⎯⎯⎯⎯⎯⎯⎯⎯⎯⎯⎯⎯⎯<br />
Relative combined st<strong>and</strong>ard uncertainty from 2 µm to 3.7 µm 1.0<br />
Relative combined st<strong>and</strong>ard uncertainty from 3.7 µm to 5.1 µm 0.95<br />
⎯⎯⎯⎯⎯⎯⎯⎯⎯⎯⎯⎯⎯⎯⎯⎯⎯⎯⎯⎯⎯⎯⎯⎯⎯⎯⎯⎯⎯⎯⎯⎯⎯⎯⎯⎯⎯<br />
Table 2<br />
⎯⎯⎯⎯⎯⎯⎯⎯⎯⎯⎯⎯⎯⎯⎯⎯⎯⎯⎯⎯⎯⎯⎯⎯⎯⎯⎯⎯⎯⎯⎯⎯⎯⎯⎯⎯⎯⎯⎯<br />
Uncertainties <strong>of</strong> irradiance responsivity calibration with the working st<strong>and</strong>ard InSb-1 radiometer<br />
⎯⎯⎯⎯⎯⎯⎯⎯⎯⎯⎯⎯⎯⎯⎯⎯⎯⎯⎯⎯⎯⎯⎯⎯⎯⎯⎯⎯⎯⎯⎯⎯⎯⎯⎯⎯⎯⎯⎯<br />
Uncertainty [%]<br />
Uncertainty origin Type A Type B<br />
Power responsivity <strong>of</strong> the InSb-1 radiometer 1.00<br />
Aperture area measurement <strong>of</strong> the InSb-1 radiometer 0.075<br />
Directional responsivity <strong>of</strong> the InSb-1 radiometer within f/4 0.18<br />
⎯⎯⎯⎯⎯⎯⎯⎯⎯⎯⎯⎯⎯⎯⎯⎯⎯⎯⎯⎯⎯⎯⎯⎯⎯⎯⎯⎯⎯⎯⎯⎯⎯⎯⎯⎯⎯⎯⎯<br />
Relative combined st<strong>and</strong>ard uncertainty (k=1) 1.024<br />
⎯⎯⎯⎯⎯⎯⎯⎯⎯⎯⎯⎯⎯⎯⎯⎯⎯⎯⎯⎯⎯⎯⎯⎯⎯⎯⎯⎯⎯⎯⎯⎯⎯⎯⎯⎯⎯⎯⎯<br />
The uncertainty components originating from the lockin amplifier gain calibrations, the bolometer<br />
temperature, bias voltage, 3 dB roll-<strong>of</strong>f frequency, <strong>and</strong> non-linearity corrections were discussed in<br />
our previous publication. 3,8 The uncertainty component caused by the InSb response nonlinearity<br />
was taken from previously published results on similar InSb detectors. 2,4
The uncertainty budget was determined for two wavelength ranges because the effect <strong>of</strong> the 5 nm<br />
maximum possible wavelength shift <strong>of</strong> the monochromator caused higher uncertainty between 2<br />
µm <strong>and</strong> 3.7 µm as compared to the uncertainty component between 3.7 µm <strong>and</strong> 5.1 µm. We have<br />
not specified any responsivity uncertainties between 4.2 µm <strong>and</strong> 4.3 µm. High accuracy<br />
measurements should not be done (without purging) within this wavelength b<strong>and</strong> where the<br />
atmospheric absorption is very high. All the uncertainty components in Table 1 are specified<br />
outside <strong>of</strong> the absorption b<strong>and</strong>s. The roughly 1% uncertainty components within the 2.7 µm <strong>and</strong><br />
3.2 µm absorption b<strong>and</strong>s produced peaks in the combined uncertainties in Fig. 5.<br />
Table 2 is an extension <strong>of</strong> Table 1 for irradiance responsivity measurements using the same<br />
working st<strong>and</strong>ard (InSb-1) radiometer. The aperture area was calculated from the average <strong>of</strong><br />
several diameter measurements. The diameters were measured with a collimated beam geometry<br />
on an optical microscope. The aperture is positioned less than 1 mm away from the detector. The<br />
International Commission on Illumination (CIE) recommended 13 directional error f2(ε) was<br />
calculated from directional (angular) response measurements <strong>of</strong> the InSb radiometer. The f2(ε)<br />
was smaller than 0.5% between -7° <strong>and</strong> 7° which is roughly the angular range <strong>of</strong> the f/4 incident<br />
beam. The st<strong>and</strong>ard deviation <strong>of</strong> the directional responses within this angular range was 0.18%.<br />
This uncertainty component is used for unknown source distribution if the angular range <strong>of</strong> the<br />
source is within f/4.<br />
7. Conclusion<br />
High electronic <strong>and</strong> radiometric performance InSb radiometers have been developed,<br />
characterized, <strong>and</strong> calibrated to hold the spectral power <strong>and</strong> irradiance responsivity scales between<br />
2 µm <strong>and</strong> 5.1 µm. The relative uncertainty (k=1) <strong>of</strong> the responsivity scales maintained by the<br />
working st<strong>and</strong>ard radiometers is about 1%. Test infrared radiometers can be calibrated against the<br />
working st<strong>and</strong>ard InSb radiometers in both power <strong>and</strong> irradiance measurement modes.<br />
8. References<br />
1. Nettleton, D.H., Prior, T.R., <strong>and</strong> Ward, T.H., “Improved Spectral Responsivity Scales at the<br />
NPL, 400 nm to 20 µm,” Metrologia, Vol. 30, 425-432, 1993.<br />
2. L-P Boivin, Properties <strong>of</strong> indium antimonide detectors for use as transfer st<strong>and</strong>ards for<br />
detector calibrations, Appl. Opt. Vol. 37, pp. 1924-1929, 1998.<br />
3. A. Migdall <strong>and</strong> G. Eppeldauer, “Realization <strong>of</strong> an Infrared Spectral Radiant Power Response<br />
Scale on a Cryogenic Bolometer”, Metrologia, Vol. 35, p. 307-315, 1998.<br />
4. G.P. Eppeldauer, A.L. Migdall, <strong>and</strong> L.M. Hanssen, “InSb Working St<strong>and</strong>ard Radiometers,”<br />
Metrologia, Vol. 35, p. 485-490, 1998.<br />
5. G. Eppeldauer, A. L. Migdall, <strong>and</strong> C. L. Cromer, “A cryogenic silicon resistance bolometer<br />
for use as an infrared transfer st<strong>and</strong>ard detector,” in HTD-Vol. 277, pp. 63-67, Thermal<br />
Phenomena at Molecular <strong>and</strong> in Cryogenic Infrared Detectors, M. Kaviany, D. A. Kaminski,<br />
A. Majumdar, P. E. Phelan, M.M. Yovanovich, <strong>and</strong> Z. M. Zhang, eds. (The American Society<br />
<strong>of</strong> Mechanical Engineers, New York), Book No. H00908-1994.
6. G. Eppeldauer, A.L Migdall., T.R. Gentile, <strong>and</strong> C.L Cromer., “Absolute response calibration<br />
<strong>of</strong> a transfer st<strong>and</strong>ard cryogenic bolometer,” in Proc. Vol. 2550, Photodetectors <strong>and</strong> Power<br />
Meters II, K. Muray <strong>and</strong> K. J. Kaufmann, eds. SPIE, pp. 36-46, 1995.<br />
7. Identification <strong>of</strong> commercial equipment to specify adequately an experimental problem does<br />
not imply recommendation or endorsement by the <strong>National</strong> <strong>Institute</strong> <strong>of</strong> <strong>St<strong>and</strong>ards</strong> <strong>and</strong><br />
Technology nor does it imply that the equipment identified is necessarily the best available<br />
for the purpose.<br />
8. A.L. Migdall <strong>and</strong> G.P. Eppeldauer, Spectroradiometric Detector Measurements: Part III -<br />
Infrared Detectors, <strong>NIST</strong> Special Publication 250-42, US Government Printing Office,<br />
Washington, DC, 1998.<br />
9. G.P. Eppeldauer, Noise-Optimized Silicon Radiometers, J. Res. Natl. Inst. St<strong>and</strong>. Technol.<br />
Vol. 105, pp.209-219, 2000.<br />
10. T.C. Larason, S.S. Bruce, <strong>and</strong> A.C. Parr, Spectroradiometric Detector Measurements: Part I -<br />
Ultraviolet Detectors <strong>and</strong> Part II - Visible <strong>and</strong> Near-Infrared Detectors, <strong>NIST</strong> Special<br />
Publication 250-41, pp. 35, US Government Printing Office, Washington, DC, 1998.<br />
11. B.N. Taylor <strong>and</strong> C.E. Kuyatt, Guidelines for Evaluating <strong>and</strong> Expressing the Uncertainty <strong>of</strong><br />
<strong>NIST</strong> Measurement Results, <strong>National</strong> <strong>Institute</strong> <strong>of</strong> <strong>St<strong>and</strong>ards</strong> <strong>and</strong> Technology, Tech. <strong>Note</strong><br />
1297, US Government Printing Office, Washington, DC, 1994.<br />
12. ANSI/NCSL Z540-2-1997, American <strong>National</strong> St<strong>and</strong>ard for Expressing Uncertainty – U.S.<br />
Guide to the Expression <strong>of</strong> Uncertainty in Measurement, <strong>National</strong> Conference <strong>of</strong> <strong>St<strong>and</strong>ards</strong><br />
Laboratories, Boulder, CO, 1998.<br />
13. CIE Publ. No. 53 (TC-2.2), Methods <strong>of</strong> Characterizing the Performance <strong>of</strong> Radiometers <strong>and</strong><br />
Photometers, Central Bureau <strong>of</strong> the CIE, A-1033 Vienna, P.O.Box 169, Austria, 1982.<br />
10
Spectral responsivity determination <strong>of</strong> a<br />
transfer-st<strong>and</strong>ard pyroelectric radiometer<br />
George Eppeldauer, Miklos Racz* <strong>and</strong> Leonard Hanssen<br />
Optical Technology Division<br />
<strong>National</strong> <strong>Institute</strong> <strong>of</strong> <strong>St<strong>and</strong>ards</strong> <strong>and</strong> Technology (<strong>NIST</strong>)<br />
Gaithersburg, Maryl<strong>and</strong> 20899–8441<br />
*Guest Researcher at <strong>NIST</strong> from the Hungarian Academy <strong>of</strong> Sciences,<br />
now at Konkoly Observatory, Budapest H-1121, Hungary<br />
ABSTRACT<br />
A <strong>NIST</strong>-developed pyroelectric radiometer was characterized <strong>and</strong> calibrated to extend the <strong>NIST</strong> high<br />
accuracy spectral responsivity scale from the visible range to the ultraviolet (UV) <strong>and</strong> infrared (IR). The<br />
transmission <strong>of</strong> the gold-black coated LiNbO3 pyroelectric material is negligibly small, therefore the<br />
absorptance, equal to (1-reflectance), is proportional to the responsivity <strong>of</strong> the detector. The spectral total<br />
reflectance <strong>of</strong> the coating was measured with integrating spheres <strong>and</strong> spectrophotometers to determine the<br />
relative spectral responsivity from the UV to the IR. The relative spectral responsivity was converted into<br />
absolute spectral power <strong>and</strong> irradiance responsivities by measuring the total power in a 442 nm stabilized<br />
laser beam. The reference device for absolute calibration was a Si trap-detector calibrated against the<br />
primary st<strong>and</strong>ard cryogenic radiometer. The calibrations were repeated with 31 months separation. A<br />
0.3 % long-term shift in the reflectance was measured between 800 nm <strong>and</strong> 19 µm. The 28 % reflectance<br />
at 10.6 µm increased the 0.1 % spatial responsivity non-uniformity in the visible (where the reflectance was<br />
0.4 %) to 8 %. The spectral power <strong>and</strong> irradiance responsivity scales <strong>of</strong> the pyroelectric radiometer have<br />
been realized between 250 nm <strong>and</strong> 2.5 µm with a relative st<strong>and</strong>ard uncertainty <strong>of</strong> less than 0.34 %<br />
(coverage factor k=1).<br />
Keywords: absolute responsivity, gold-black coating, infrared, irradiance, pyroelectric detector, radiant<br />
power, radiometer, reflectance, relative response, transfer st<strong>and</strong>ard, ultraviolet<br />
1. INTRODUCTION<br />
The subject <strong>of</strong> the present work is to extend the ambient-background detector-based responsivity scale <strong>of</strong><br />
<strong>NIST</strong> to a wide wavelength range with improved uncertainty. The present <strong>NIST</strong> responsivity scale<br />
uncertainty is about 1 % 1 in the 2 µm to 20 µm range [1, 2] <strong>and</strong> close to 1 % in the 250 nm to 400 nm range<br />
[3]. The uncertainty from 920 nm to 1.8 µm increases from 0.5 % to 1.8 %, respectively [4]. In the<br />
reference (silicon) spectral range, between 406 nm <strong>and</strong> 920 nm, the responsivity scale uncertainty is only<br />
0.03 % [5]. A new facility is being developed at <strong>NIST</strong> for Spectral Irradiance <strong>and</strong> Radiance Responsivity<br />
Calibrations with Uniform Sources (SIRCUS) [6]. The purpose <strong>of</strong> this facility is to decrease the<br />
uncertainty gap between the reference scale <strong>and</strong> the extended scales. In order to achieve this goal, a group<br />
<strong>of</strong> improved performance transfer st<strong>and</strong>ard radiometers is being developed. The SIRCUS facility operates<br />
in the 250 nm to 2500 nm range. This range is determined by the useful reflectance coverage <strong>of</strong> the<br />
Spectralon coating <strong>of</strong> the integrating sphere sources <strong>and</strong> the spectral coverage <strong>of</strong> the monitor <strong>and</strong> working<br />
st<strong>and</strong>ard silicon <strong>and</strong> extended InGaAs photodiodes. The design <strong>and</strong> most <strong>of</strong> the radiometric <strong>and</strong> electronic<br />
characterizations <strong>of</strong> a high performance LiNbO3 pyroelectric radiometer have already been published [7].<br />
We describe here the radiometric characterizations <strong>and</strong> calibrations needed to extend the high accuracy<br />
responsivity scale to the 250 nm to 2500 nm range. The gold-black reflectance measurements were made<br />
1 All uncertainties discussed in this paper are relative st<strong>and</strong>ard uncertainties with a coverage factor <strong>of</strong> one.<br />
Property <strong>of</strong> the United States Government. Not subject to copyright.
etween 250 nm <strong>and</strong> 19 µm. The reflectance measurements were repeated after 31 months to check the<br />
long-term stability <strong>of</strong> the transfer st<strong>and</strong>ard radiometer <strong>and</strong> the repeatability <strong>of</strong> the spectral reflectance<br />
measurements. Spatial responsivity tests are described at 10.6 µm where the high reflectance <strong>of</strong> the coating<br />
increases the spatial non-uniformity <strong>of</strong> responsivity. For the highest accuracy responsivity scale extension,<br />
a group <strong>of</strong> pyroelectric radiometers will be used. Here, the scale extension work is described only for the<br />
LiNbO3 pyroelectric transfer st<strong>and</strong>ard radiometer.<br />
2. SPECTRAL REFLECTANCE MEASUREMENTS<br />
The transmission <strong>of</strong> the gold-black coated detector is negligibly small, therefore the absorptance, equal to<br />
1-reflectance, is proportional to the responsivity <strong>of</strong> the detector. We measured the spectral near-normal<br />
(directional-hemispherical) reflectance <strong>of</strong> the gold-black coated detector to determine the relative spectral<br />
responsivity.<br />
The spectral reflectance <strong>of</strong> the gold-black coated pyroelectric detector had already been measured with a<br />
modified Perkin-Elmer 2 spectrophotometer between 800 nm <strong>and</strong> 1.8 µm [7]. Similar measurements were<br />
made on the same detector with a Cary-5E spectrophotometer between 250 nm <strong>and</strong> 830 nm. In both cases,<br />
the spectral reflectance was compared to a white polytetrafluoroethylene (PTFE) reflectance st<strong>and</strong>ard. The<br />
zero reflectance was obtained when a light trap replaced the pyroelectric detector at the sample port <strong>of</strong> the<br />
integrating sphere. The integrating sphere collected the diffuse radiation reflected back from the detector<br />
surface. The monochromatic input beam was directed to the surface <strong>of</strong> the detector at a 6° angle <strong>of</strong><br />
incidence. The 8 mm diameter detector-aperture was removed during the reflectance measurements to<br />
avoid beam clipping. The two spectral reflectance curves, measured on the different spectrophotometers,<br />
are shown in Fig. 1.<br />
Reflectance<br />
0.009<br />
0.008<br />
0.007<br />
0.006<br />
0.005<br />
0.004<br />
0.003<br />
0.002<br />
0.001<br />
200 400 600 800 1000 1200 1400 1600 1800<br />
Wavelength [nm]<br />
Fig. 1. Spectral reflectance <strong>of</strong> the gold-black coated pyroelectric detector.<br />
The dashed curve was measured on a Cary-5E spectrophotometer.<br />
The solid curve was measured on a modified Perkin-Elmer spectrophotometer.<br />
2 Certain commercial equipment, instruments, or materials are identified in this paper to foster underst<strong>and</strong>ing. Such<br />
identification does not imply recommendation or endorsement by the <strong>National</strong> <strong>Institute</strong> <strong>of</strong> <strong>St<strong>and</strong>ards</strong> <strong>and</strong> Technology,<br />
nor does it imply that the materials or equipment are necessariliy the best available for the purpose.
As the measurement was noisy between 800 nm <strong>and</strong> 1800 nm, a curve-fit is shown in that range. The<br />
uncertainty <strong>of</strong> the reflectance measurements was 0.1 % between 250 nm <strong>and</strong> 1600 nm <strong>and</strong> it increased to<br />
0.23 % at 1800 nm. These measurements were made in September, 1999.<br />
In order to extend the high accuracy responsivity scale to the infrared (IR) range, the absolute directionalhemispherical<br />
reflectance <strong>of</strong> the LiNbO3 pyroelectric detector was measured between 1 µm <strong>and</strong> 19 µm.<br />
The IR reflectance measurements were made on a Fourier Transform (FT) spectrometer in both September<br />
1999 <strong>and</strong> April 2002. The April 2002 results are shown in Fig. 2 to illustrate that the reflectance is higher<br />
than 50 % at 19 µm. A Quartz beam splitter <strong>and</strong> a tungsten halogen lamp source was used in the FT<br />
spectrometer for the 1 µm to 3.3 µm wavelength range. A Ge coated KBr beam splitter with a ceramic<br />
glow-bar source was used for wavelengths longer than 3.3 µm. The uncertainty <strong>of</strong> the IR reflectance<br />
measurements ranges from 0.1 % near 0.01 reflectance to 1.5% at 0.5 reflectance.<br />
Reflectance<br />
0.5<br />
0.4<br />
0.3<br />
0.2<br />
0.1<br />
0.0<br />
4 8 12 16<br />
Wavelength (um)<br />
Fig. 2. IR spectral reflectance <strong>of</strong> the gold-black coated pyroelectric detector. The beam splitter <strong>and</strong> the<br />
source <strong>of</strong> the FT spectrometer were changed at 3.3 µm.<br />
3. LONG TERM STABILITY OF SPECTRAL ABSORPTANCE<br />
The spectral absorptance (1-reflectance) values <strong>of</strong> the September, 1999 <strong>and</strong> the April <strong>and</strong> June 2002<br />
measurements are summarized in Fig. 3 between 250 nm <strong>and</strong> 3.5 µm. The measurements were made with<br />
a large time separation to check the long-term stability <strong>of</strong> the gold-black coated detector <strong>and</strong> the<br />
repeatability <strong>of</strong> the calibrations. The 1-reflectance curves are shown only up to 3.5 µm to show the<br />
measured differences on a more magnified scale. The FT spectrometer measurements start at 1 µm. The<br />
noise in all September 1999 measurements is averaged out. The April 2002 measurements started at<br />
500 nm to check the changes up to 1.5 µm. The noise at 800 nm increased due to a detector change (from<br />
photomultiplier tube to PbS detector) in the spectrophotometer. The noise in the FT measurement (April<br />
2002) at the 1µm region was caused by the poor signal-to-noise ratio. The graph shows a 0.3 % shift in the<br />
1-reflectance values between the September 1999 <strong>and</strong> the April 2002 measurements for wavelengths longer<br />
than 800 nm. The results obtained with the two independent reflectance measurement methods in April<br />
2002 agreed within 0.1 % in the 1 µm to 1.5 µm range where they overlap. The measured shift at 500 nm<br />
was negligibly small. In order to check for possible changes in the UV, the reflectance was measured from<br />
325 nm to 500 nm in June 2002. As the same 0.3 % shift was measured for wavelengths longer than 800
nm using two different methods, the reason <strong>of</strong> the shift was the change in the gold-black coated detector.<br />
The measured change in the 325 nm to 500 nm range was less than 0.1 %.<br />
4. SPATIAL RESPONSIVITY IN THE INFRARED<br />
In our September 1999 measurements, the reflectance <strong>of</strong> the gold-black coated LiNbO3 pyroelectric<br />
detector was less than 1 % between 800 nm <strong>and</strong> 1800 nm [7]. The spatial response non-uniformity was<br />
+/- 0.1 % at 633 nm. High reflectance can increase the spatial response non-uniformity resulting in a large<br />
uncertainty in radiant power measurements where the detector is underfilled by the incident beam.<br />
In order to determine the useful wavelength range <strong>of</strong> a responsivity scale extension with the LiNbO3<br />
pyroelectric radiometer, the non-uniformity <strong>of</strong> the spatial responsivity was measured at a wavelength where<br />
the reflectance <strong>of</strong> the gold-black coating was much higher than 1 %. Figure 4 shows the result <strong>of</strong> a spatial<br />
responsivity scan at 10.6 µm where the reflectance is about 28 %. The scanning beam diameter was<br />
0.4 mm. The contour plot shows an 8 % maximum-to-minimum change in the responsivity. The<br />
reflectance at 633 nm was about 0.4 % in September 1999 [7]. The 28 % reflectance at 10.6 µm is a factor<br />
<strong>of</strong> 70 higher. This is the reason that the non-uniformity <strong>of</strong> the spatial responsivity increased from the 0.1 %<br />
level to 8%. We can conclude that the increase in the non-uniformity <strong>of</strong> the spatial responsivity is<br />
proportional to the increase <strong>of</strong> the reflectance <strong>and</strong> the proportionality factor is one.<br />
1-Reflectance<br />
1.00<br />
0.995<br />
0.990<br />
0.985<br />
0.980<br />
0.975<br />
September 1999<br />
June 2002<br />
400 800 1200 1600 2000 2400 2800 3200<br />
Wavelength [nm]<br />
April 2002<br />
Fig. 3. The absorptance (1-reflectance) versus wavelength <strong>of</strong> the gold-black coated pyroelectric detector<br />
measured at two different times using two different measurement setups.<br />
If we do not improve the absorptance (e.g. by multiple reflections on the detector surface or with coatings<br />
<strong>of</strong> lower reflectance in the IR), the upper wavelength limit for high accuracy scale extension will be<br />
2.5 µm. The reflectance at this wavelength is 1.27 %, about 3 times higher than the 633 nm value. The<br />
uncertainty component at 2.5 µm, originating from the non-uniformity <strong>of</strong> the spatial responsivity, will be<br />
about 0.3%, equal to the 31 months reflectance change measured on the gold-black coated pyroelectric<br />
detector.<br />
5. SPECTRAL RESPONSIVITY<br />
The updated 1-reflectance curve is shown on the left Y axis <strong>of</strong> Fig. 5. This curve includes the April 2002<br />
measurement results between 500 nm <strong>and</strong> 2.5 µm. Since the long-term reflectance change was negligibly<br />
small between 325 nm <strong>and</strong> 500 nm, the 250 nm to 500 nm results measured in September 1999, are also
included in the curve. The small step at 1.5 µm shows the very small difference between the Cary-5E <strong>and</strong><br />
the FT reflectance measurements made in April 2002. The power responsivity scale is shown on the right<br />
Y axis. The absolute tie point is shown with an open triangle at 442 nm. The tie point was obtained from<br />
radiant power measurement on October 1, 1999 directly after the relative spectral responsivity<br />
determination. The detector substitution method was used on the SIRCUS facility. Both the py<br />
radiometer <strong>and</strong> the reference TS07 silicon (reflectance type) trap detector measured the same 23.6 µW total<br />
power in a collimated (<strong>and</strong> chopped) HeCd laser beam. The power <strong>of</strong> the 442 nm beam was controlled to a<br />
constant value using a laser beam stabilizer. The trap detector was calibrated against the primary st<strong>and</strong>ard<br />
cryogenic radiometer for radiant power responsivity. The 442 nm responsivity <strong>of</strong> the pyroelectric<br />
radiometer was 1.010 x 10 -7 A/W at 10 9 roelectic<br />
V/A gain <strong>and</strong> 10.1 Hz chopping frequency. The duty cycle <strong>of</strong> the<br />
chopped radiation was 50 %.<br />
Y (mm)<br />
-5<br />
-4<br />
-3<br />
-2<br />
-1<br />
0<br />
1<br />
2<br />
3<br />
4<br />
5<br />
0.97<br />
1.02<br />
0.96<br />
1.00<br />
1.02<br />
1.01<br />
0.97<br />
0.98<br />
1.00<br />
1.03<br />
0.96<br />
1.02<br />
1.02<br />
1.04<br />
1.01<br />
0.98<br />
-5 -4 -3 -2 -1 0 1 2 3 4 5<br />
X (mm)<br />
Fig. 4. Spatial response uniformity contour-plot <strong>of</strong> the gold-black coated LiNbO3<br />
pyroelectric radiometer at 10.6 µm. The scanning beam diameter was 0.4 mm.<br />
The<br />
temperature <strong>of</strong> the pyroelectric detector was monitored by a thermistor. As the temperature coefficient<br />
<strong>of</strong> the pyroelectric detector responsivity is 0.15 %/°C [7], the responsivity can be corrected for different<br />
measurements. The corrected responsivity will be:<br />
R = f R<br />
m c<br />
where<br />
Rc is the pyroelectric radiometer responsivity at the calibration temperature Tc <strong>and</strong> f is a correction<br />
factor. The f correction factor can be calculated from the temperature coefficient <strong>of</strong> the detector<br />
responsivity <strong>and</strong> the ΔT temperature difference:<br />
f = 1 + (0.0015 ΔT)<br />
where<br />
ΔT = Tc - Tm. Tm is the temperature <strong>of</strong> the detector in a measurement after the responsivity<br />
calibration. ΔT is determined from thermistor resistance measurements at calibration <strong>and</strong> then at a given<br />
application. The thermistor was attached to the pyroelectric detector [7] <strong>and</strong> its resistance was previously<br />
calibrated versus temperature.
The pyroelectric radiometer has a 60 Hz roll-<strong>of</strong>f in the responsivity when the highest gain is selected [7].<br />
Accordingly, the responsivity at a 10 Hz chopping frequency is not constant. For rotating choppers the<br />
frequency has to be controlled to a constant value. If the frequency changes, responsivity corrections are<br />
needed to minimize frequency dependent responsivity changes. Better stability was obtained when the<br />
rotating chopper was substituted by a tuning fork chopper. The tuning fork chopper was tuned to a stable<br />
10.1 Hz <strong>and</strong> frequency dependent responsivity corrections were not needed.<br />
1-Reflectance<br />
1.00<br />
0.996<br />
0.992<br />
0.988<br />
0.984<br />
0.980<br />
0.976<br />
0.972<br />
Y = M0 + M1*x + ... M8*x 8 + M9*x 9<br />
M0<br />
M1<br />
M2<br />
M3<br />
R<br />
500 1000 1500 2000 2500<br />
Wavelength [nm]<br />
0.996<br />
5.6222e-06<br />
-4.4275e-09<br />
2.9764e-13<br />
0.99934<br />
0.1012<br />
0.1008<br />
0.1004<br />
0.1<br />
0.0996<br />
0.0992<br />
0.0988<br />
0.0984<br />
Fig. 5. The April 2002 spectral power responsivity scale <strong>of</strong> the LiNbO3 pyroelectric detector.<br />
The<br />
uncertainty <strong>of</strong> the trap detector responsivity was 0.05 % [6]. The dashed line in Fig. 5 is a third order<br />
polynomial fit to the 1-reflectance curves. The overall responsivity variation <strong>of</strong> the pyroelectric detector<br />
was about 1 % between 250 nm <strong>and</strong> 2.5 µm.<br />
The uncertainty budget <strong>of</strong> the April 2002 spectral responsivity scale as extended by the LiNbO3<br />
pyroelectric radiometer is shown in Table 1. The relative combined st<strong>and</strong>ard uncertainty <strong>of</strong> the absolute<br />
<strong>and</strong> relative responsivity calibrations is 0.15 %. The non-uniformity <strong>of</strong> the spatial responsivity was<br />
wavelength dependent. The largest overall combined uncertainty <strong>of</strong> 0.34 % was dominated by the 0. 3 %<br />
spatial non-uniformity in the responsivity <strong>of</strong> the pyroelectric detector at 2.5 µm. The overall combined<br />
uncertainty was 0.18 % in the ultraviolet <strong>and</strong> 0.25 % between 1 µm <strong>and</strong> 2 µm.<br />
For<br />
irradiance responsivity measurements, a black-Nickel coated Copper aperture was mounted in front <strong>of</strong><br />
the pyroelectric detector. The 0.1 mm thick aperture was very close to the detector to minimize unwanted<br />
signal increase caused by reflections between aperture <strong>and</strong> detector. The area <strong>of</strong> the aperture was measured<br />
twice. The average area was 49.962 mm 2 with an uncertainty <strong>of</strong> 0.036 %. The irradiance responsivity is<br />
the product <strong>of</strong> the aperure area <strong>and</strong> the spectral power responsivity. The irradiance responsivity at the<br />
442 nm tie point was 5.05 x 10 -6 A mm 2 /W. The overall combined uncertainties <strong>of</strong> the irradiance<br />
responsivity scale realization are similar to the overall combined uncertainties <strong>of</strong> the radiant power<br />
responsivity scale realization.<br />
Responsivity [µA/W]
The long-term changes in the extended spectral responsivity scale, maintained by the LiNbO3 pyroelectric<br />
transfer st<strong>and</strong>ard radiometer, are shown in Table 2. The 0.3 % long-term change <strong>of</strong> the spectral<br />
responsivity is an uncertainty component that can be separated from the scale realization uncertainties.<br />
This component can be decreased by more frequent responsivity scale realizations.<br />
6. FUTURE SCALE EXTENSION TO THE INFRARED<br />
Our near-future goal is to extend the high accuracy spectral responsivity scale up to 20 µm. The high<br />
accuracy IR scale is needed for the SIRCUS-IR facility we have started to develop recently.<br />
One way to keep the dominant uncertainty component, the non-uniformity <strong>of</strong> the spatial responsivity, small<br />
is to mount a reflecting dome to the front <strong>of</strong> the detector. The dome can produce multiple reflections for<br />
the incident beam resulting in lower reflectance loss <strong>and</strong> higher signal absorption. The other way to<br />
improve the spatial uniformity is to make better coatings. Earlier made gold-black coatings, selected for<br />
low IR reflectance, showed less than 1 % reflectance even at 20 µm [2]. Using one or both <strong>of</strong> the two<br />
methods, the uncertainty component caused by the non-uniformity <strong>of</strong> the spatial responsivity can be<br />
significantly decreased.<br />
We have started realizing the high accuracy spectral responsivity scale from 200 nm to 20 µm using three<br />
pyroelectric transfer st<strong>and</strong>ard radiometers. Two LiTaO3 pyroelectric radiometers equipped with reflecting<br />
domes are being developed in addition to the LiNbO3 pyroelectric radiometer discussed in this paper.<br />
Table 1<br />
Uncertainty budget <strong>of</strong> the April 2002 spectral power/irradiance responsivity scales<br />
Uncertainty factor Type A Type B Combined<br />
[%] [%] [%]<br />
Absolute responsivity calibration:<br />
Trap detector spectral power responsivity 0.05<br />
Trap detector repeatability 0.04<br />
Trap current-to-voltage gain 0.04<br />
Laser beam instability 0.02<br />
Pyroelectric detector gain 0.04<br />
Pyroelectric detector temperature dependent<br />
response (at 0.1 °C change) 0.015<br />
Pyroelectric detector frequency dependent response<br />
with 0.025 Hz change at 10.1 Hz <strong>and</strong> 10 9 V/A gain 0.07<br />
Relative responsivity calibration:<br />
Spectral reflectance measurements 0.1<br />
Relative combined st<strong>and</strong>ard uncertainty 0.15<br />
Pyroelectric detector non-uniformity <strong>of</strong> spatial responsivity:<br />
250 nm to 1 µm 0.1 0.18<br />
1 µm to 2 µm 0.2 0.25<br />
2 µm to 2.5 µm 0.3 0.34<br />
Irradiance responsivity:<br />
Aperture area 0.036<br />
Multiple reflections between aperture <strong>and</strong> detector<br />
at 2.5 µm (worst case) 0.05<br />
250 nm to 1 µm 0.19<br />
1 µm to 2 µm 0.26<br />
2 µm to 2.5 µm 0.34
Table 2<br />
Long-term (31 months) responsivity changes<br />
for wavelengths longer than 800 nm 0.3 %<br />
from 500 nm to 800 nm 0.1 to 0.3 %<br />
for wavelengths shorter than 500 nm 0.1 %<br />
Using three transfer st<strong>and</strong>ard devices, individual long term response changes can be minimized by using<br />
the average responsivity <strong>of</strong> the group. The dominant uncertainty component <strong>of</strong> the total uncertainty will<br />
come from the spectral reflectance measurements. According to our preliminary measurements, the<br />
reflectance with a dome <strong>and</strong> improved coating can be less than 0.25 % at 19 µm. The small non-uniformity<br />
<strong>of</strong> the spatial responsivity, caused by the low reflectance, will result in an uncertainty component <strong>of</strong><br />
less than 0.1 %. At present, the temperature <strong>of</strong> the LiNbO3 pyroelectric detector is monitored for<br />
temperature dependent responsivity corrections. The temperature <strong>of</strong> the LiTaO3 pyroelectric detectors is<br />
controlled to a constant value. Accordingly, the temperature dependent uncertainty <strong>of</strong> the responsivity will<br />
be much smaller than 0.1 %. The signal will be chopped with a tuning-fork chopper to minimize frequency<br />
dependent responsivity changes. This is an important requirement for high signal-gain selections where the<br />
signal roll-<strong>of</strong>f <strong>of</strong> the photocurrent meters is at low (about 60 Hz) frequencies. Our realistic goal is to<br />
achieve an overall responsivity scale uncertainty <strong>of</strong> about 0.15 % outside <strong>of</strong> the 406 nm to 920 nm<br />
reference range.<br />
7. CONCLUSIONS<br />
The <strong>NIST</strong> high accuracy spectral responsivity scale from the 406 nm to 920 nm reference range was<br />
extended to a wider range <strong>of</strong> 250 nm to 2500 nm. The extension was made with a <strong>NIST</strong> developed high<br />
performance LiNbO3 pyroelectric transfer st<strong>and</strong>ard radiometer. As the transmission <strong>of</strong> the detector goldblack<br />
coating was negligibly small, the absorptance, equal to 1-reflectance, was proportional to the relative<br />
responsivity <strong>of</strong> the radiometer. Spectral reflectance measurements were made with an uncertainty <strong>of</strong> 0.1 %.<br />
The measurements were made twice, with 31 months separation. During this time, an 0.3 % constant<br />
reflectance decrease was obtained between 800 nm <strong>and</strong> 19 µm. The 0.1 % non-uniformity <strong>of</strong> the spatial<br />
responsivity at 633 nm, where the reflectance is 0.4 %, increased to 8 % at 10.6 µm where 28 % reflectance<br />
was measured. The large non-uniformity <strong>of</strong> the spatial responsivity limited the power responsivity scale<br />
extension to 2.5 µm. The relative spectral responsivity was converted into spectral power <strong>and</strong> irradiance<br />
responsivities by making an absolute tie point at 442 nm, where no long-term reflectance change was<br />
measured. In contrast to the 0.5 % to 1.8 % uncertainty <strong>of</strong> the present <strong>NIST</strong> (extended) responsivity scales,<br />
the uncertainty <strong>of</strong> the new wavelength-extended scales was less than 0.34 %.<br />
As a continuation <strong>of</strong> the above scale realization work, the high accuracy spectral responsivity scale is being<br />
extended to 20 µm using two additional <strong>NIST</strong> developed LiTaO3 pyroelectric radiometers. The two new<br />
radiometers have improved gold-black coatings <strong>and</strong> are equipped with reflecting domes to further increase<br />
absorption <strong>and</strong> uniformity <strong>of</strong> spatial responsivity. While the temperature <strong>of</strong> the LiNbO3 detector was<br />
monitored, the LiTaO3 detectors are temperature controlled to minimize temperature dependent response<br />
changes. The group average will be used to decrease the effect <strong>of</strong> individual response changes. The<br />
expected uncertainty <strong>of</strong> the planned responsivity scale extension is about 0.15 % from 200 nm to 20 µm.<br />
ACKNOWLEDGEMENTS<br />
The authors thank John Lehman for developing the high performance pyroelectric detectors, Haimei Gong<br />
for participating in the spatial responsivity characterizations, Edward Early <strong>and</strong> Simon Kaplan for their
participation in the spectral reflectance measurements. This work was supported by the U. S. Air Force<br />
Metrology under contract numbers CCG-461 <strong>and</strong> CCG-439.<br />
REFERENCES<br />
1. Eppeldauer G. <strong>and</strong> Racz M., Spectral power <strong>and</strong> irradiance responsivity calibration <strong>of</strong> InSb workingst<strong>and</strong>ard<br />
radiometers, Applied Optics, Vol. 39, No. 31, p. 5739-5744, 2000.<br />
2. Migdall A. <strong>and</strong> Eppeldauer G., Realization <strong>of</strong> an Infrared Spectral Radiant Power Response Scale on a<br />
Cryogenic Bolometer, Metrologia, Vol. 35, p. 307-315, 1998.<br />
3. Shaw P-S., Larason T. C., Gupta R, Brown S. W., Vest R. E., <strong>and</strong> Lykke K. R., The new ultraviolet<br />
spectral responsivity scale based on cryogenic radiometry at Synchrotron Ultraviolet Radiation Facility III,<br />
Rev, Sci. Instr., Vol. 72, No. 5, p. 2242-2247, 2001.<br />
4. Shaw P-S., Larason T. C., Gupta R, Brown S. W., <strong>and</strong> Lykke K. R., Improved near-infrared spectral<br />
responsivity scale, J. Res. <strong>NIST</strong>, Vol. 105, No. 5, p. 689-700, 2000.<br />
5. Gentile T. R., Houston J. M., <strong>and</strong> Cromer C. L., Realization <strong>of</strong> a scale <strong>of</strong> absolute spectral response using the<br />
<strong>NIST</strong> high accuracy cryogenic radiometer, Appl. Opt. Vol. 35, No. 22, p. 4392-4403, 1996.<br />
6. Brown S. W., Eppeldauer G. P., <strong>and</strong> Lykke K. R., <strong>NIST</strong> Facility for Spectral Irradiance <strong>and</strong> Radiance<br />
Response Calibrations with a Uniform Source, Metrologia, Vol. 37, p. 579-582, 2000.<br />
7. Lehman J., Eppeldauer G., Aust J. A., <strong>and</strong> Racz M., Domain-engineered pyroelectric radiometer,<br />
Applied Optics, Vol. 38, No. 34, p. 7047-7055, 1999.
Spectral irradiance responsivity measurements<br />
between 1 µm <strong>and</strong> 5 µm<br />
G. P. Eppeldauer, J. P. Rice, J. Zhang, <strong>and</strong> K. R. Lykke<br />
Optical Technology Division<br />
<strong>National</strong> <strong>Institute</strong> <strong>of</strong> <strong>St<strong>and</strong>ards</strong> <strong>and</strong> Technology<br />
Gaithersburg, Maryl<strong>and</strong>, 20899-8441<br />
ABSTRACT<br />
Infrared radiometers for irradiance measurement have been developed at the <strong>National</strong> <strong>Institute</strong> <strong>of</strong> <strong>St<strong>and</strong>ards</strong> <strong>and</strong><br />
Technology (<strong>NIST</strong>). These high performance irradiance meters are used to realize <strong>and</strong> maintain the spectral irradiance<br />
responsivity scale between 1 µm <strong>and</strong> 5 µm. They are also working st<strong>and</strong>ards that disseminate the infrared irradiance<br />
responsivity scale to other institutions <strong>and</strong> facilities. Both design considerations <strong>and</strong> responsivity scale transfer to the<br />
irradiance meters are discussed. The radiometers were calibrated for spectral irradiance responsivity on the new <strong>NIST</strong><br />
Infrared Facility for Spectral Irradiance <strong>and</strong> Radiance Responsivity Calibrations using Uniform Sources (IR-SIRCUS).<br />
The spectral irradiance responsivity calibrations described are derived from absolute cryogenic radiometers.<br />
1. INTRODUCTION<br />
In addition to InGaAs, Ge [1, 2], <strong>and</strong> InSb [3] working st<strong>and</strong>ard radiometers developed earlier, extended-InGaAs (EIGA)<br />
radiometers have been developed at the <strong>National</strong> <strong>Institute</strong> <strong>of</strong> <strong>St<strong>and</strong>ards</strong> <strong>and</strong> Technology (<strong>NIST</strong>) to fill a gap between<br />
1.8 µm <strong>and</strong> 2 µm in the infrared (IR) spectral responsivity scale. The radiometers can measure irradiance from about<br />
0.8 µm to 5.1 µm. The InGaAs irradiance meter was calibrated earlier [4] against the <strong>NIST</strong> detector spectral power<br />
responsivity scale [5] using the raster scan method [6]. The EIGA radiometer has been calibrated against an Electrical<br />
Substitution Bolometer (ESB) [7] that was calibrated against an electrical substitution type absolute cryogenic<br />
radiometer (ACR) using silicon trap detectors [8]. The InSb radiometers were calibrated earlier against a cryogenic<br />
bolometer [9] that was calibrated against the primary st<strong>and</strong>ard cryogenic radiometer (HACR) [10-12] <strong>of</strong> <strong>NIST</strong>.<br />
At present, on the Infrared Facility for Spectral Irradiance <strong>and</strong> Radiance Responsivity Calibrations using Uniform<br />
Sources (IR-SIRCUS) [13], spectral irradiance responsivity measurements are performed between 1 µm <strong>and</strong> 5 µm with<br />
an extended uncertainty (k=2) <strong>of</strong> 3 % using the above infrared radiometers. The irradiance responsivity scale transfers to<br />
both the EIGA radiometer <strong>and</strong> selective InSb radiometers are described below.<br />
2. DESIGN OF THE EXTENDED-InGaAs RADIOMETER<br />
The EIGA radiometer can measure irradiance between 1 µm <strong>and</strong> 2.5 µm. The design <strong>of</strong> the radiometer head that includes<br />
the input optics <strong>and</strong> housing is shown in Fig. 1. The 3 mm diameter photodiode is located in a sealed case. The case has<br />
a borosilicate window on the front. The window, a flashed opal glass (transmitting) diffuser, <strong>and</strong> a thin aperture are glued<br />
together (at the edges) <strong>and</strong> are plugged into an aluminum holder. There is a thread on the front side <strong>of</strong> the holder that<br />
makes it possible to either apply a protecting cap or to screw the whole radiometer head into a flange located on the top<br />
<strong>of</strong> the sphere source. The holder <strong>and</strong> the bottom surface <strong>of</strong> the photodiode-case are attached to a copper plate that<br />
delivers the dissipated heat to a heat sink. A thermo-electric (TE) cooler <strong>and</strong> a thermistor are also located inside <strong>of</strong> the<br />
photodiode-case to apply temperature controlled cooling for the photodiode. The leads from the TE cooler <strong>and</strong> the<br />
thermistor are connected to a 4-pin connector at the bottom <strong>of</strong> the aluminum housing. A temperature controller can be<br />
connected to this connector through a shielded cable. The operating temperature <strong>of</strong> the photodiode is -20 o C. The<br />
photodiode leads are connected to a BNC connector located also on the bottom plate <strong>of</strong> the housing. The preamplifier<br />
(discussed below) can be connected to the BNC connector using a short coaxial cable. The housing <strong>of</strong> the radiometer<br />
head is electrically shielded.
71 mm<br />
O 33 mm<br />
aperture<br />
diffuser<br />
cap<br />
holder<br />
photodiode with TE<br />
cooler <strong>and</strong> thermistor<br />
Cu plate<br />
heat sink<br />
cylinder<br />
4-pin<br />
connector<br />
BNC<br />
connector<br />
Fig. 1. Housing <strong>of</strong> the extended-InGaAs radiometer head.<br />
3. ELECTRONIC DESIGN CONSIDERATIONS<br />
A short-circuit current measuring preamplifier was needed that has a small enough input resistance for the low shunt<br />
resistance EIGA photodiode. It was also necessary to measure chopped radiation when the irradiance responsivity scale<br />
was derived from the ESB. The simplified circuit diagram <strong>of</strong> the photodiode current meter is shown in Fig. 2.<br />
P<br />
R S<br />
C J<br />
I P<br />
C<br />
OA<br />
Fig. 2. Simplified circuit diagram <strong>of</strong> the EIGA photodiode preamplifer.<br />
The photocurrent IP <strong>of</strong> photodiode P is measured by the current-meter. The current-to-voltage conversion in the current<br />
meter is realized by an operational amplifier OA that has a feedback impedance Z (parallel connected feedback resistor R<br />
<strong>and</strong> capacitor C). The OA has a low-frequency (DC) open-loop gain <strong>of</strong> about A=10 6 . The OA output voltage V is<br />
attenuated to its input by A, resulting in a very small voltage drop on photodiode P. The photodiode impedance ZP is the<br />
R<br />
V
parallel connection <strong>of</strong> its shunt resistance RS <strong>and</strong> junction capacitance CJ. The input impedance <strong>of</strong> the current meter will<br />
be [14]:<br />
Z<br />
Z R 1<br />
1<br />
= =<br />
=<br />
A A ( 1+<br />
jωCR)<br />
A<br />
+ jωAC<br />
R<br />
I (1)<br />
where ω is the angular frequency. The rewritten form <strong>of</strong> Eq. (1) shows that the input impedance <strong>of</strong> the current meter can<br />
be calculated as the parallel connection <strong>of</strong> the down-transformed R <strong>and</strong> the up-transformed C:<br />
( Z )<br />
−1<br />
I<br />
⎛ R ⎞<br />
= ⎜ ⎟<br />
⎝ A ⎠<br />
−1<br />
⎛ 1 ⎞<br />
+ ⎜<br />
⎟<br />
⎝ jωAC<br />
⎠<br />
The requirement for short-circuit current measurements is:<br />
−1<br />
ZI >1. When chopped radiation is measured, this condition must be achieved for the signal (chopping)<br />
frequency.<br />
The loop gain, which is the product <strong>of</strong> A <strong>and</strong> β (the feedback attenuation), can be written as [14]:<br />
1 1+<br />
jωτ<br />
G = A0<br />
β 0<br />
(5)<br />
1+<br />
jωτ<br />
1+<br />
jωτ<br />
i<br />
2<br />
where A0 is the 0 Hz (DC) open-loop voltage gain <strong>of</strong> the OA <strong>and</strong> β0=RS/(RS+R) is the DC feedback attenuation. The<br />
inverse feedback attenuation 1/β is equal to the voltage gain for the input noise <strong>and</strong> drift. If a photodiode with high RS is<br />
selected, the feedback attenuation β0 will be close to unity, resulting in high G <strong>and</strong> low voltage gain for noise <strong>and</strong> drift.<br />
The feedback resistors R <strong>of</strong> the OA can change in a wide range, from 1 kΩ to 100 MΩ to measure photocurrent in a<br />
wide dynamic range.<br />
The shunt resistance <strong>of</strong> the 3 mm diameter EIGA photodiode is only a few hundred οηµ at room temperature. At the<br />
operating temperature <strong>of</strong> -20 o C, we measured 25 kΩ <strong>and</strong> 40 kΩ shunt resistances for two photodiodes, respectively. The<br />
junction capacitance was CJ=1.8 nF. CJ will be increased significantly by the parallel connected, up-transformed<br />
feedback capacitor AC.<br />
In short-circuit current measurements, when photodiode with low junction capacitance is selected, the measurement time<br />
constant is determined by the feedback impedance:<br />
( C + AC)<br />
J R<br />
τ =<br />
= RC.<br />
(6)<br />
A<br />
(2)<br />
(4)
As a design example, in Eq. 5, the differentiating time constant τ can cancel the integrating time constant τ2. This is<br />
called full frequency compensation. The time constant τ2=RSCJ when R>>RS [14]. In our case, for RS=25 kΩ, τ2=45 µs,<br />
<strong>and</strong> for RS=40 kΩ, τ2=72 µs.<br />
At the maximum gain <strong>of</strong> R=10 8 Ω, the input resistance, equal to RI=100 Ω, will result in a non-linearity in the<br />
photocurrent measurement <strong>of</strong> 0.4 % for RS=25 kΩ <strong>and</strong> 0.25 % for RS=40 kΩ. At R=10 7 Ω, the non-linearity will decrease<br />
to significantly less than 0.1 %.<br />
As AC >> CJ for CJ=1.8 nF, a measurement time constant (for full frequency compensation) <strong>of</strong> τ = RC = 72 µs could be<br />
obtained at R=10 8 Ω if C was equal to 0.7 pF. However, it is difficult to achieve such a low parallel capacitance. A<br />
realistic stray (parallel) capacitance in a well designed circuit layout is about 2 pF. Consequently, only partial frequency<br />
compensation can be achieved at the highest signal gain <strong>of</strong> R=10 8 Ω, which will result in a 3 dB roll-<strong>of</strong>f frequency <strong>of</strong> 0.8<br />
kHz. (No external capacitor will be connected parallel to R=10 8 Ω.) However, at R=10 7 Ω, the 45 µs (or 72 µs)<br />
compensating RC time constant can be achieved. C = 4.5 pF will result in a signal 3 dB roll-<strong>of</strong>f frequency <strong>of</strong> 3.5 kHz.<br />
After this full compensation, the dominating integrating time constant <strong>of</strong> G will be τi from the fi=10 Hz roll-<strong>of</strong>f frequency<br />
<strong>of</strong> the OA open-loop voltage gain A. This roll-<strong>of</strong>f frequency is very convenient to obtain high G for all R at a chopping<br />
frequency <strong>of</strong> about 10 Hz. Usually, R is changed in decade steps to cover a wide dynamic signal range. The parallel C<br />
capacitors can be increased in decade steps (from 5 pF at 10 7 Ω) with the decade step decrease <strong>of</strong> R (from 10 7 Ω) to<br />
perform frequency compensations for all R. Care should be made at low R selections where the starting condition <strong>of</strong><br />
R>>RS cannot be achieved anymore. At these low gain selections, the full frequency compensations can be achieved only<br />
when τ2 is correctly calculated from the non-simplified equation [14]. Otherwise, partial frequency compensations will<br />
be performed that are still adequate to perform high enough G at the signal (chopping) frequency at these signal gain<br />
selections.<br />
The OA has to be selected to satisfy the noise, drift, input current, <strong>and</strong> b<strong>and</strong>width requirements [16].<br />
4. IRRADIANCE RESPONSIVITY SCALE TRANSFER TO 2.5 µm<br />
The reference spectral irradiance responsivity scale from a silicon trap detector that was tied to an ACR was transferred<br />
to a cryogenically cooled ESB. The ESB operates at liquid helium temperature <strong>and</strong> uses a chopper [7]. In the open<br />
position <strong>of</strong> the chopper, the optical radiation overfills the 5 mm diameter precision aperture <strong>of</strong> the ESB. This radiation is<br />
converted into heat on the gold-black-coated silicon bolometer. Through the action <strong>of</strong> an electronic servo loop, this heat<br />
is equalized with the electrical heat applied to the same bolometer in the closed position <strong>of</strong> the chopper. In equilibrium,<br />
the electrical heat power (output signal) is equal to the radiant power originating from the irradiance (input signal) <strong>of</strong> the<br />
overfilled aperture.<br />
The relative spectral responsivity <strong>of</strong> the ESB was determined from two spectral measurements. The directionalhemispherical<br />
spectral reflectance <strong>of</strong> the gold black coated bolometer surface was measured with an integrating sphere<br />
[17]. The absorption <strong>of</strong> the bolometer, equal to one minus reflectance, is proportional to its responsivity. The spectral<br />
absorption <strong>of</strong> the bolometer was multiplied by the spectral transmittance <strong>of</strong> the ESB dewar window to obtain the overall<br />
relative spectral responsivity. Three tie points from a silicon trap detector between 738 nm <strong>and</strong> 820 nm were measured.<br />
One <strong>of</strong> these (at 790.4 nm) was used to convert the relative spectral responsivity into absolute spectral irradiance<br />
responsivity. The other two were used to assess the uncertainty component due to choice <strong>of</strong> tie point wavelength. Figure<br />
3 shows the spectral irradiance responsivity <strong>of</strong> the ESB with the tie point at 790.4 nm. Curve fits were applied to the<br />
measured relative spectral response data. An 8 th order polynomial fit was applied below 1800 nm <strong>and</strong> a 4 th order<br />
polynomial fit was used above. The broad, smooth variations are caused by the spectral transmittance change <strong>of</strong> the<br />
coated KBr window <strong>of</strong> the ESB dewar.<br />
For the ESB irradiance measurements, a 15 Hz, 50 % duty-cycle chopper was used to modulate the laser beam<br />
introduced into an integrating sphere. The sphere exit port was used as a uniform monochromatic irradiance source.<br />
Both the ESB <strong>and</strong> the trap detector measured the irradiance from the sphere source. For the trap-detector measurements,<br />
the chopper was stopped in its open position <strong>and</strong> the measurements were made in DC mode. The demodulated DC<br />
output <strong>of</strong> the ESB <strong>and</strong> the DC output <strong>of</strong> the trap-detector were read out by a digital voltmeter.
0.187<br />
0.186<br />
0.185<br />
0.184<br />
0.183<br />
0.182<br />
0.181<br />
500 1000 1500 2000 2500 3000<br />
Wavelength (nm)<br />
Fig. 3. ESB spectral irradiance responsivity<br />
The ESB responds to the amplitude <strong>of</strong> the chopped radiation, which is the DC level that is present when the chopper is<br />
stopped. Thus, no chopper correction needs to be applied to the ESB output signal. Since the trap-detector was used in<br />
DC mode, no chopper correction needs to be applied to the trap-detector responsivity either.<br />
For the tie points, irradiance responsivity measurements <strong>of</strong> the ESB <strong>and</strong> trap-detector to the same sphere radiant<br />
intensity, Io, were made <strong>and</strong> recorded. The radiant intensity <strong>of</strong> the sphere is independent <strong>of</strong> which detector is viewing the<br />
sphere:<br />
o<br />
t<br />
2<br />
t<br />
e<br />
2<br />
e<br />
I = E d = E d<br />
(7)<br />
where Ee is the irradiance on the ESB, dt is the separation between source <strong>and</strong> trap-detector apertures, <strong>and</strong> de is the<br />
separation between source <strong>and</strong> ESB apertures. The irradiance Et at the trap-detector is known from the measured output<br />
signal Yt, the known responsivity st, the gain Gt, <strong>and</strong> the aperture area At <strong>of</strong> the trap detector:<br />
Yt<br />
E t = . (8)<br />
G s A<br />
t<br />
t<br />
t<br />
Combining Eqs. (7) <strong>and</strong> (8) leads to the measurement equation for the ESB irradiance responsivity:<br />
e<br />
t<br />
2<br />
e<br />
2<br />
t<br />
Pe<br />
Pe<br />
d<br />
s e = = Gt<br />
st<br />
At<br />
(9)<br />
E Y d<br />
where Pe is the ESB output signal (electric power). In practice, se is given in W/Wcm -2 , Pe in W (the product <strong>of</strong> the<br />
measured V <strong>and</strong> A <strong>of</strong> the ESB electrical heater), Ee in W/cm 2 , Yt in V, Gt in V/A, st in A/W, At in cm 2 , de <strong>and</strong> dt in cm.<br />
The spectral irradiance responsivity from the ESB was transferred to the EIGA#2 working st<strong>and</strong>ard radiometer. The<br />
irradiance responsivity scale transfer is shown below.<br />
Both the ESB <strong>and</strong> the detector-under-test (DUT, EIGA#2 in this case) measured the same radiant intensity from the<br />
laser-illuminated integrating sphere at the IR-SIRCUS facility. The chopping frequency was again 15 Hz. Similarly to<br />
Eq. (7):
where subscript d st<strong>and</strong>s for DUT.<br />
o<br />
e<br />
2<br />
e<br />
2<br />
dd<br />
d<br />
I = E d = E<br />
(10)<br />
Earlier, the ESB responsivity was referenced to the amplitude <strong>of</strong> the chopped radiation. In the present scale transfer,<br />
both the DUT <strong>and</strong> the monitor were photodiodes. Since they were chopped during measurements, a chopper correction<br />
must be applied to reference their values to the amplitude <strong>of</strong> the chopped radiation. That is for the ESB,<br />
P = s<br />
but for the DUT, as read out by a lock-in amplifier,<br />
e<br />
e<br />
E<br />
e<br />
(11)<br />
2<br />
Y d = sdGd<br />
Ed<br />
(12)<br />
π<br />
where Yd is the output signal <strong>of</strong> the DUT (EIGA#2). The pre-factor appears because the lock-in amplifier indicates the<br />
rms value <strong>of</strong> the fundamental Fourier sine-wave component [18] <strong>of</strong> a 50 % duty-cycle square-wave applied to its input.<br />
Gd is the gain <strong>of</strong> the DUT current-to-voltage converter.<br />
Combining Eqs. (10) through (12) leads to the measurement equation for the EIGA#2 irradiance responsivity:<br />
e<br />
2<br />
dd<br />
2<br />
dd<br />
e<br />
π Yd<br />
s d = se<br />
(13)<br />
2 P G<br />
Since the same monitor photodiode was used during both the ESB <strong>and</strong> the DUT output signal measurements, <strong>and</strong> output<br />
signal ratios were consistently used at IR-SIRCUS, we use a form <strong>of</strong> the measurement equation written in terms <strong>of</strong><br />
output signal ratios:<br />
Yd<br />
2<br />
π Ym<br />
d d<br />
s d = se<br />
(14)<br />
2<br />
2 Pe<br />
Gdd<br />
e<br />
Y<br />
m<br />
where Ym represents the monitor output signal. The spectral irradiance responsivity <strong>of</strong> the EIGA#2 was derived from the<br />
ESB in the overall wavelength range.<br />
The spectral irradiance responsivity <strong>of</strong> the EIGA#2 working st<strong>and</strong>ard is shown in Fig. 4. Interpolations were applied<br />
between the measured data points to obtain a continuous curve. Cubic spline interpolation was applied above 1800 nm<br />
<strong>and</strong> smooth-type interpolation was used for the shorter wavelength range (using KaleidaGraph Data Analysis <strong>and</strong><br />
Graphic Presentation [19] s<strong>of</strong>tware). The effect <strong>of</strong> the atmospheric absorptions b<strong>and</strong>s on the spectral responsivity <strong>of</strong> the<br />
EIGA#2 cannot be seen because the separations dd <strong>and</strong> de were roughly equal during the responsivity scale transfer.<br />
At present, there are not enough data points for the overall wavelength range to perform accurate responsivity<br />
interpolation everywhere. The largest gap is between 1989 nm <strong>and</strong> 2253 nm where the measurements were switched<br />
from using the signal output to the idler output <strong>of</strong> an optical parametric oscillator (OPO) based on a periodically-poled<br />
lithium niobate (PPLN) crystal. This OPO was pumped by a 1.064 µm quasi-cw (220 MHz, 7 ps) mode-locked<br />
Nd:YVO4 laser <strong>and</strong> the wavelength was tuned by changing the grating period <strong>and</strong> the temperature <strong>of</strong> the crystal. Also,<br />
the interpolation is poor around 2.4 µm where the slope <strong>of</strong> the responsivity change is steep.
The relative exp<strong>and</strong>ed uncertainty (coverage factor k=2) <strong>of</strong> the ESB spectral irradiance responsivity calibration) is 0.6 %.<br />
The uncertainty budget that applies only for the irradiance responsivity tie points <strong>of</strong> the working st<strong>and</strong>ard irradiance<br />
meter EIGA#2 is shown in Table 1.<br />
0.07<br />
0.06<br />
0.05<br />
0.04<br />
0.03<br />
0.02<br />
0.01<br />
1000 1200 1400 1600 1800 2000 2200 2400 2600<br />
Wavelength [nm]<br />
Fig. 4. Spectral irradiance responsivity <strong>of</strong> the EIGA#2 working st<strong>and</strong>ard.<br />
The uncertainty <strong>of</strong> the ESB output signal / monitor output signal dominated the uncertainty budget in Table 1 because <strong>of</strong><br />
the different time constants in the ESB <strong>and</strong> the monitor-detector.<br />
Table 1<br />
Uncertainty budget <strong>of</strong> the irradiance responsivity tie points<br />
<strong>of</strong> the working st<strong>and</strong>ard EIGA#2 irradiance meter<br />
_________________________________________________________________________<br />
Uncertainty component Type A Type B<br />
[%] [%]<br />
Absolute responsivity calibration:<br />
ESB position 0.23<br />
DUT position 0.3<br />
ESB irradiance responsivity 0.3<br />
ESB output signal/Monitor output signal 0.89<br />
DUT output signal/Monitor output signal 0.37<br />
DUT lockin amplifier measurement 0.13<br />
_________________________________________________________________________<br />
Relative combined st<strong>and</strong>ard uncertainty 1.1 %<br />
Relative exp<strong>and</strong>ed uncertainty with k=2 2.2 %<br />
5. IRRADIANCE RESPONSIVITY MEASUREMENTS TO 5 µm<br />
Selective InSb radiometers were calibrated for spectral irradiance responsivity on the IR-SIRCUS as well. The irradiance<br />
source this time was a 2.5 cm diameter Infragold-LF coated integrating sphere with an exit-port diameter <strong>of</strong> 6 mm. The<br />
output beam from the PPLN OPO was tunable between 1466 nm <strong>and</strong> 4920 nm. The beam was always chopped at 13 Hz<br />
before the entrance <strong>of</strong> the sphere source. Two baffles were located between the sphere source <strong>and</strong> the moving stage
where the reference <strong>and</strong> test (selective InSb) radiometers were mounted. The reference detector was the InSb1 irradiance<br />
meter calibrated earlier against a transfer st<strong>and</strong>ard cryogenic bolometer [9] that was calibrated against the HACR. The<br />
radiometers were placed at ≈1.1 m from the sphere source. The baffles minimized the stray radiation on the detectors. A<br />
monitor radiometer was mounted in front <strong>of</strong> the first baffle close to the optical axis but outside <strong>of</strong> the baffle opening. The<br />
output voltages from the current-to-voltage converters <strong>of</strong> the reference, test, <strong>and</strong> monitor radiometers were measured by<br />
sine-wave measuring digital lock-in amplifiers. The three lock-in amplifiers were attached to the computer <strong>of</strong> the IR-<br />
SIRCUS facility.<br />
The selective InSb radiometers were calibrated against the InSb1 radiometer using the substitution method described<br />
above for the EIGA#2 calibration. The difference between this <strong>and</strong> the above substitution method is that here both the<br />
reference <strong>and</strong> test radiometers are measured by the same kind <strong>of</strong> lock-in amplifier while above only the test radiometer<br />
(EIGA#2) signal was measured with a lock-in amplifier <strong>and</strong> the ESB was not. In this substitution, the lock-in gain factors<br />
are cancelled <strong>and</strong> the pre-factor (in Eqs. 13 <strong>and</strong> 14) is not needed in the measurement equation. In all measurements,<br />
both the test <strong>and</strong> reference radiometer signals were divided by the signal <strong>of</strong> the monitor detector. The ratio<br />
measurements were repeated 20 times at each wavelength to reduce the uncertainty contribution from the noise in the<br />
detector signals.<br />
The irradiance responsivity <strong>of</strong> the test detector is:<br />
where subscript r st<strong>and</strong>s for reference <strong>and</strong> subscript d for DUT.<br />
s<br />
d<br />
d<br />
2<br />
d<br />
2<br />
r<br />
Yd<br />
Gr<br />
d<br />
= sr<br />
(15)<br />
Y G d<br />
r<br />
The irradiance responsivity determination is made at each laser wavelength using this measurement equation.<br />
The spectral irradiance responsivity curves <strong>of</strong> the selective InSb radiometers are shown in both linear (left vertical axis)<br />
<strong>and</strong> logarithmic (right vertical axis) scales in Figs. 5 to 7. The dominant uncertainty <strong>of</strong> the spectral responsivity<br />
determinations originated from the effect <strong>of</strong> laser intensity noise. The relative exp<strong>and</strong>ed uncertainty (k=2) <strong>of</strong> the InSb<br />
spectral irradiance responsivities is 3 % at all wavelengths. The uncertainty is determined from the 2.05 % (k=2)<br />
responsivity uncertainty <strong>of</strong> the InSb1 reference irradiance meter [9], <strong>and</strong> additional uncertainty components. The<br />
additional components are the residuals <strong>of</strong> the source intensity fluctuations, photocurrent measurement uncertainty, gain<br />
switching uncertainty, stray radiation <strong>of</strong> irradiance measurements, length (detector-to-source separation) measurements,<br />
wavelength measurements, interpolation uncertainties, <strong>and</strong> background dominated detector noise.<br />
1.4 10 5<br />
1.2 10 5<br />
1 10 5<br />
8 10 4<br />
6 10 4<br />
4 10 4<br />
2 10 4<br />
0<br />
lin Y axis<br />
log Y axis<br />
4200 4300 4400 4500 4600 4700 4800 4900<br />
Wavelength [nm]<br />
Fig. 5. Spectral irradiance responsivity <strong>of</strong> InSb#5 at 2 x 10 5 V/A gain<br />
10 5<br />
10 4<br />
10 3<br />
10 2<br />
10 1<br />
10 0
The EIGA#2 was calibrated against the InSb1 reference radiometer at 2.35 µm to compare the above two different<br />
irradiance responsivity scales (where they overlap). The exp<strong>and</strong>ed relative uncertainty <strong>of</strong> this responsivity determination<br />
was 3 % (same as for the selective InSb irradiance meters). The responsivity obtained was 2.6 % higher than the<br />
0.0682 A/(Wcm -2 ) EIGA#2 responsivity derived from the ESB. This responsivity deviation is in accordance with the 2.2<br />
% (in Table 1) <strong>and</strong> 3 % relative exp<strong>and</strong>ed uncertainties <strong>of</strong> the two different EIGA#2 responsivity determinations.<br />
7 10 5<br />
6 10 5<br />
5 10 5<br />
4 10 5<br />
3 10 5<br />
2 10 5<br />
1 10 5<br />
0<br />
lin Y axis<br />
log Y axis<br />
3000 3200 3400 3600 3800 4000<br />
Wavelength [nm]<br />
Fig. 6. Spectral irradiance responsivity <strong>of</strong> InSb#6 at gain 10 6 V/A<br />
2 10 4<br />
1.5 10 4<br />
1 10 4<br />
5 10 3<br />
0 10 0<br />
0<br />
lin Y axis<br />
log Y axis<br />
3400 3600 3800 4000 4200<br />
Wavelength [nm]<br />
Fig. 7. Spectral irradiance responsivity <strong>of</strong> InSb#7 at gain 2.94 x 10 4 V/A.<br />
6. CONCLUSIONS<br />
The <strong>NIST</strong> spectral irradiance responsivity scale from the 405 nm to 920 nm wavelength range has been extended to 5 µm<br />
using improved performance irradiance meters. The transfer st<strong>and</strong>ard ESB was calibrated against the ACR through a<br />
silicon trap detector to convert its relative spectral irradiance responsivity into absolute. The ESB irradiance responsivity<br />
scale was transferred to the EIGA#2 working st<strong>and</strong>ard radiometer. The relative exp<strong>and</strong>ed uncertainty (k=2) <strong>of</strong> the<br />
irradiance responsivity at the calibration wavelength (tie) points is 2.2 % on the EIGA#2 radiometer. Spectrally selective<br />
InSb irradiance meters were calibrated with 3 % uncertainty (k=2) against the reference InSb1-new irradiance meter that<br />
10 6<br />
10 5<br />
10 4<br />
10 3<br />
10 2<br />
10 1<br />
10 4<br />
10 3<br />
10 2<br />
10 1<br />
10 0<br />
10 -1
has a traceable responsivity to the HACR. The different responsivity scales were compared at 2.35 µm by calibrating the<br />
EIGA#2 against both the ESB <strong>and</strong> the InSb1-new radiometer. The two scales were different by 2.6 % at 2.35 µm where<br />
they overlap. Work is being continued to extend the spectral irradiance responsivity scale <strong>of</strong> the IR-SIRCUS facility<br />
further in the infrared with decreased uncertainty.<br />
REFERENCES<br />
1. Eppeldauer, G., Electronic characteristics <strong>of</strong> Ge <strong>and</strong> InGaAs radiometers. SPIE proceedings, 1997. 3061-97: p. 833-<br />
838.<br />
2. Eppeldauer, G., Near Infrared Radiometer <strong>St<strong>and</strong>ards</strong>. SPIE proceedings, 1996. 2815: p. 42-54.<br />
3. Eppeldauer, G.P., Migdall, A.L., <strong>and</strong> Hanssen, L.M., InSb Working St<strong>and</strong>ard Radiometers. Metrologia, 1998. 35: p.<br />
485-490.<br />
4. Eppeldauer, G.P., Racz, M., <strong>and</strong> Larason, T.C., Optical characterization <strong>of</strong> diffuser-input st<strong>and</strong>ard irradiance<br />
meters. SPIE Proc., 1998. 3573: p. 220-224.<br />
5. Larason, T.C., Bruce, S.S., <strong>and</strong> Parr, A.C., Spectroradiometric detector measurements. <strong>NIST</strong> Special Publication,<br />
1998. 250-41.<br />
6. Cromer, C.L., et al., The <strong>NIST</strong> detector-based luminous intensity scale. J. Res. <strong>NIST</strong>, 1996. 101(2): p. 109-132.<br />
7. Rice, J.P., An electrically substituted bolometer as a transfer-st<strong>and</strong>ard detector. Metrologia, 2000. 37: p. 433-436.<br />
8. Eppeldauer, G.P. <strong>and</strong> Lynch, D.C., Opto-mechanical <strong>and</strong> electronic design <strong>of</strong> a tunnel-trap Si- radiometer. J. Res.<br />
<strong>NIST</strong>, 2000. 105(6): p. 813-828.<br />
9. Eppeldauer, G.P. <strong>and</strong> Racz, M., Spectral Power <strong>and</strong> irradiance responsivity calibration <strong>of</strong> InSb working st<strong>and</strong>ard<br />
radiometers. Appl. Opt., 2000. 39(31): p. 5739-5744.<br />
10. Gentile, T.R., et al., <strong>National</strong> <strong>Institute</strong> <strong>of</strong> <strong>St<strong>and</strong>ards</strong> <strong>and</strong> Technology high-accuracy cryogenic radiometer. Applied<br />
Optics, 1996. 35(7): p. 1056-1068.<br />
11. Gentile, T.R., et al., Calibration <strong>of</strong> a pyroelectric detector at 10.6 µm with the <strong>NIST</strong> High-Accuracy Cryogenic<br />
Radiometer. Applied Optics, 1997. 36: p. 3614-3621.<br />
12. Migdall, A.L., <strong>and</strong> G.P. Eppeldauer, Realization <strong>of</strong> an IR spectral radiant power response scale on a cryogenic<br />
radiometer. Metrologia, 1998. 35: p. 307-315.<br />
13. Lykke, K.R., et al., Development <strong>of</strong> a monochromatic, uniform source facility for calibration <strong>of</strong> radiance <strong>and</strong><br />
irradiance detectors from 0.2 to 12 microm. Metrologia, 1998. 35: p. 479-484.<br />
14. Eppeldauer, G., Chopped Radiation Measurement With Large Area Si Photodiodes. J. Res. <strong>NIST</strong>, 1998. 103: p. 153-<br />
162.<br />
15. Eppeldauer, G. <strong>and</strong> Hardis, J.E., Fourteen-decade photocurrent measurements with large-area silicon photodiodes<br />
at room temperature. Applied Optics, 1991. 30: p. 3091-3099.<br />
16. Eppeldauer, G., Noise-optimized silicon radiometers. J. Res. <strong>NIST</strong>, 2000. 105(2): p. 209-219.<br />
17. Eppeldauer, G.P., Racz, M., <strong>and</strong> Hanssen, L.M., Spectral responsivity determination <strong>of</strong> a transfer-st<strong>and</strong>ard<br />
pyroelectric radiometer. SPIE Proceedings, 2002. 4818: p. 118-126.<br />
18. Model SR830 DSP Lock-In Amplifier, Manual, Rev. 1.4. Stanford Research Systems, Inc., 1995.<br />
19. Disclaimer, The mention <strong>of</strong> certain commercial products in this paper is for information purposes only <strong>and</strong> does not<br />
constitute an endorsement <strong>of</strong> the product by the authors or their institutions.
Development <strong>and</strong> calibration <strong>of</strong> pyroelectric radiometer st<strong>and</strong>ards<br />
at <strong>NIST</strong><br />
G. P. Eppeldauer, J. Zeng, <strong>and</strong> L. M. Hanssen<br />
Optical Technology Division<br />
<strong>National</strong> <strong>Institute</strong> <strong>of</strong> <strong>St<strong>and</strong>ards</strong> <strong>and</strong> Technology<br />
Gaithersburg, Maryl<strong>and</strong> 20899<br />
ABSTRACT<br />
The reference spectral power responsivity scale <strong>of</strong> <strong>NIST</strong> is being extended from the silicon range to the infrared (IR)<br />
using pyroelectric radiometers. Two transfer st<strong>and</strong>ard pyroelectric radiometers have been developed at <strong>NIST</strong>. The main<br />
design consideration was to obtain only a minimal increase in the measurement uncertainty during the responsivity scale<br />
extension. Domain engineered LiNbO3 <strong>and</strong> regular LiTaO3 pyroelectric detectors were used in the two radiometers.<br />
Both detectors are gold-black coated <strong>and</strong> temperature controlled. Reflecting domes are attached to the radiometer inputs<br />
to decrease the reflectance loss <strong>and</strong> to improve the spatial uniformity <strong>of</strong> responsivity in the infrared. Four commercial<br />
pyroelectric detectors have been added to the group <strong>and</strong> used as working st<strong>and</strong>ards. The relative spectral responsivity <strong>of</strong><br />
all pyroelectric detectors was determined from spectral reflectance measurements. The radiant power responsivity tie<br />
points were derived from Si trap <strong>and</strong> single element detectors traceable to the <strong>NIST</strong> reference responsivity scale. The<br />
pyroelectric radiometers have been characterized for frequency <strong>and</strong> temperature dependent responsivity, noise, spatial<br />
non-uniformity <strong>of</strong> responsivity, angular responsivity, <strong>and</strong> linearity. The exp<strong>and</strong>ed (relative) uncertainty <strong>of</strong> the spectral<br />
power responsivity calibrations ranged between 0.5 % <strong>and</strong> 1.2 % (k=2) within the 1 μm to 19 μm range.<br />
1. INTRODUCTION<br />
Infrared detector st<strong>and</strong>ards are being developed for the 2 to 2.5 μm [1], the 3 to 5 μm [2], [3], <strong>and</strong> the 8 to 12 μm [4]<br />
atmospheric windows where the absorption lines will not affect the uncertainty <strong>of</strong> the responsivity measurements. The<br />
present work describes the development <strong>of</strong> pyroelectric transfer st<strong>and</strong>ard radiometers <strong>and</strong> also the use <strong>of</strong> commercially<br />
available pyroelectric detectors.<br />
The pyroelectric transfer st<strong>and</strong>ard radiometers were primarily developed to extend the reference radiant power<br />
responsivity scale from the end <strong>of</strong> the silicon wavelength range at 1 μm to the 8 to 12 μm range (<strong>and</strong> beyond) with the<br />
lowest possible measurement uncertainty. It was shown earlier that gold-black coated domain engineered LiNbO3<br />
pyroelectric detectors can be applied for responsivity measurements with about 0.1 % (k=1) responsivity uncertainty in<br />
the near infrared range [5]. As increased reflectance in the longer wavelength infrared results in increased nonuniformity<br />
<strong>of</strong> the spatial responsivity [1], reflecting domes are mounted at the inputs to minimize reflection losses [6],<br />
[7]. The commercial pyroelectric detectors are used as working st<strong>and</strong>ard radiometers to propagate the <strong>NIST</strong> infrared<br />
responsivity scale to different applications.<br />
2. RADIOMETER DESIGN<br />
The radiometers were designed <strong>and</strong> selected with optimum radiometric <strong>and</strong> electronic characteristics to minimize the<br />
increase in the uncertainty <strong>of</strong> spectral responsivity associated with transfer calibrations.<br />
2.1. Transfer st<strong>and</strong>ard radiometers<br />
The two transfer st<strong>and</strong>ard radiometers contain 1-cm diameter pyroelectric detector elements with gold-black coatings<br />
used to convert optical power into temperature change <strong>and</strong> then into current. In Radiometer #2, a domain-engineered<br />
LiNbO3 detector <strong>and</strong> in Radiometer #1, a regular LiTaO3 detector without domain engineering were used [5]. Each<br />
detector was extended to a radiometer. As it is shown in Fig. 1, the detector-case is attached to a thermoelectric (TE)<br />
cooler/heater <strong>and</strong> a thermistor, mounted inside <strong>of</strong> the detector case, is used as a temperature sensor. Using a temperature
controller, the temperature <strong>of</strong> the detector is controlled to a constant value slightly above room temperature. The gold<br />
coated reflecting dome has a hemisphere shape, with an internal diameter <strong>of</strong> 33 mm. It is mounted above the 20 o tilted<br />
pyroelectric detector. The dome has a 4 mm diameter opening at the optical axis. The figure shows how the specular<br />
components from a parallel incident radiation at the two ends <strong>of</strong> the input beam diameter are reflected back to the active<br />
area <strong>of</strong> the detector. A current-to-voltage converter with multiple signal-gain selections is mounted in an Aluminum<br />
box. The box is attached to the radiometer Aluminum housing using a connector. The overall housing <strong>of</strong> the radiometer<br />
is electrically shielded to minimize 60 Hz pickup. A photo <strong>of</strong> the radiometer is shown in Fig. 2.<br />
33 mm diameter<br />
gold-coated dome<br />
Incident radiation<br />
4mmdiameter<br />
opening<br />
Fig. 1. Input scheme <strong>of</strong> the transfer st<strong>and</strong>ard pyroelectric radiometer.<br />
Fig. 2. Photo <strong>of</strong> the transfer st<strong>and</strong>ard pyroelectric radiometer<br />
(the top cover is removed)
2.2. Working st<strong>and</strong>ard radiometers<br />
Four commercial pyroelectric detectors are used as working st<strong>and</strong>ards. These working st<strong>and</strong>ards propagate the <strong>NIST</strong><br />
infrared responsivity scale to different field applications. All four detectors are mounted in a housing where the detector<br />
temperature is monitored. The preamplifier is located inside the detector can where a fixed 10 GΩ feedback resistor is<br />
connected to an operational amplifier to convert the detector current into an output voltage. The detectors are coated<br />
with a black paint to convert optical radiation changes into temperature changes.<br />
3. RADIOMETER CHARACTERIZATION<br />
A set <strong>of</strong> characterizations were performed on the radiometers to establish the uncertainties associated with the<br />
radiometer’s responsivity during both calibration <strong>and</strong> the calibration-transfer to other radiometers. The frequency- <strong>and</strong><br />
temperature-dependent responsivity, signal-gain stability, <strong>and</strong> noise characteristics were measured in the Ambient<br />
Infrared Detector Characterization Facility. The Infrared Detector Evaluation Facility (IDEF) was used for measurement<br />
<strong>of</strong> the spatial non-uniformity <strong>of</strong> responsivity, linearity, angular responsivity, absolute responsivity, stability, <strong>and</strong><br />
repeatability. The Infrared Total Integrated Scatter Instrument (ITIS) was used to measure the reflectance at laser<br />
wavelengths. The Fourier Transform Infrared Spectrophotometry Facility (FTIS) was used to measure the spectral<br />
reflectance <strong>of</strong> the coated detectors to determine the relative spectral responsivity.<br />
3.1. Characterization <strong>of</strong> the transfer st<strong>and</strong>ard radiometers<br />
The detector-dome combination acts as a trap to provide near unity absorptance across the entire wavelength range <strong>of</strong><br />
use. Accordingly, the spatial uniformity <strong>of</strong> responsivity at long wavelengths is significantly improved over the bare<br />
detector case. The spatial scan results obtained for Radiometers #1 <strong>and</strong> #2 at 10.6 μm are shown in Fig. 3. The size <strong>of</strong><br />
the scanning spot was 0.2 mm. The maximum-to-minimum spatial non-uniformity <strong>of</strong> responsivity is less than 0.6 %<br />
within a 1.5 mm diameter center area <strong>of</strong> both radiometers. Without the reflecting dome, the spatial non-uniformity <strong>of</strong><br />
responsivity was found to be 10 % to 15 % at 10.6 μm.<br />
Y (mm)<br />
-2<br />
-1<br />
0<br />
1<br />
2<br />
0.978<br />
0.984<br />
0.982<br />
0.984<br />
0.988<br />
0.990<br />
0.993<br />
0.994<br />
0.992<br />
0.988<br />
0.990 0.994<br />
0.996 0.996<br />
0.993<br />
0.996<br />
0.997<br />
0.997<br />
0.998 0.997<br />
0.986<br />
0.995<br />
0.992<br />
0.996<br />
0.998<br />
0.999<br />
1.000<br />
0.997 0.995<br />
0.990<br />
0.998<br />
0.999<br />
0.999<br />
0.998<br />
0.996<br />
0.996<br />
0.994<br />
0.981<br />
0.990<br />
0.998 0.998<br />
0.993<br />
0.996<br />
0.997 0.996<br />
0.992<br />
0.998<br />
0.994<br />
0.990<br />
0.992<br />
0.992<br />
0.996<br />
0.994<br />
0.992<br />
0.990<br />
-2 -1 0<br />
X (mm)<br />
1 2<br />
Y (mm)<br />
-2<br />
-1<br />
0<br />
1<br />
2<br />
0.990<br />
0.985<br />
0.993<br />
0.984<br />
0.988<br />
0.987<br />
0.993 0.991<br />
0.993<br />
0.994<br />
0.988<br />
0.988<br />
0.993<br />
0.992<br />
0.995<br />
0.994<br />
0.995<br />
0.996<br />
0.994<br />
0.994<br />
0.990<br />
0.994<br />
0.989<br />
0.993<br />
0.995<br />
0.999 0.997<br />
0.994 0.990<br />
0.989<br />
0.994 0.996<br />
0.993<br />
0.997<br />
0.996<br />
0.994 0.983<br />
0.997<br />
0.989 0.997<br />
0.996<br />
0.992<br />
0.998 0.996<br />
0.999 0.997<br />
0.995 0.998<br />
0.997<br />
0.994<br />
0.997<br />
0.996<br />
0.994<br />
0.995<br />
0.997<br />
0.995<br />
0.999<br />
0.998<br />
0.993<br />
0.996<br />
0.998 0.997<br />
0.998<br />
0.996<br />
0.991<br />
0.990<br />
0.983<br />
-2 -1 0<br />
X (mm)<br />
1 2<br />
Fig. 3. Spatial (normalized) uniformity <strong>of</strong> responsivity <strong>of</strong> the dome-equipped transfer st<strong>and</strong>ard<br />
pyroelectric Radiometers #1 (left plot) <strong>and</strong> #2 (right plot) at 10.6 μm.
The noise equivalent power (NEP) is one <strong>of</strong> the most important characteristics <strong>of</strong> pyroelectric radiometers that are used<br />
to measure 1 μW signal levels from monochromators. Therefore, the noise characteristics <strong>of</strong> the two transfer st<strong>and</strong>ard<br />
radiometers were tested. Fig. 4 shows the measured output total noise <strong>of</strong> the domain engineered Radiometer (#2) on the<br />
left Y axis. The 1/f noise <strong>of</strong> the operational amplifier is the dominating noise up to a gain <strong>of</strong> 10 6 V/A. At higher gain<br />
levels the resistor (parallel connected detector resistance <strong>and</strong> feedback resistance) noise dominates the output noise <strong>of</strong><br />
the radiometer. The background produced photocurrent <strong>and</strong> its noise are negligibly small because <strong>of</strong> the very low<br />
responsivity (output photocurrent per input radiant power) <strong>of</strong> the pyroelectric detector (about six orders <strong>of</strong> magnitude<br />
lower than that <strong>of</strong> silicon photodiodes). This means that pyroelectric detectors do not operate in background limited<br />
condition as most <strong>of</strong> the high responsivity infrared detectors do. Because <strong>of</strong> the very low detector responsivity, the<br />
signal power to be measured has to be very high. While radiant power levels <strong>of</strong> 1 pW with a signal-to-noise (S/N) ratio<br />
<strong>of</strong> 100 or higher can be measured with silicon photodiodes, the radiant power for pyroelectric detectors must be about<br />
six orders <strong>of</strong> magnitude higher to get similar photocurrents <strong>and</strong> S/N ratios. The noise equivalent current (NEC) is<br />
calculated as the ratio <strong>of</strong> the output total noise voltage to the signal gain. The NEC is shown on the right Y axis. The<br />
noise measurements were made both in the dark <strong>and</strong> at 1.5 pA signal current originating from the chopped signal <strong>of</strong> a<br />
ceramic glower. The chopping frequency was 10.5 Hz <strong>and</strong> the lock-in time constant was 1 s. Each data point was<br />
obtained as the st<strong>and</strong>ard deviation <strong>of</strong> the mean from 20 measurements. The same output total noise voltage (as in Fig. 4)<br />
was measured for both cases with a relative measurement uncertainty <strong>of</strong> 25 % (k=1). The NEC at a signal gain <strong>of</strong> 10 9<br />
V/A is 6.5 fA. An NEP <strong>of</strong> 20 nW can be calculated as the ratio <strong>of</strong> the 6.5 μV output total noise (at 10 9 V/A) to the 326<br />
V/W responsivity <strong>of</strong> this radiometer at 1.32 μm <strong>and</strong> a 1 s lock-in time constant. The radiometer responsivity was<br />
measured by substitution against a Ge detector st<strong>and</strong>ard in a measurement <strong>of</strong> total power in the beam from a 1.32 μm<br />
diode laser. The 1 s time constant corresponds to a frequency b<strong>and</strong>width <strong>of</strong> 0.16 Hz. The NEP expressed for a 1 Hz<br />
electrical b<strong>and</strong>width is:<br />
10 -5<br />
10 -6<br />
10 -7<br />
10 -8<br />
10 4<br />
NEP = 20 nW x (1/0.16) 1/2 = 50 nW/Hz 1/2 .<br />
10 5<br />
10 6<br />
10 7<br />
Signal gain [V/A]<br />
Fig. 4. Noise characteristics <strong>of</strong> the domain engineered LiNbO3 pyroelectric Radiometer #2.<br />
The change <strong>of</strong> the NEP at a signal-gain <strong>of</strong> 10 9 V/A versus lock-in time constant is shown in Fig. 5 for the regular<br />
LiTaO3 Radiometer #1. The graph shows that the NEP decreases from 13 nW at a 1 s lock-in time constant to 3 nW at a<br />
10 s time constant. The large decrease in the NEP was obtained because <strong>of</strong> the 766 V/W responsivity <strong>of</strong> Radiometer #1<br />
at a gain <strong>of</strong> 10 9 V/A, which is more than two times higher than that <strong>of</strong> the domain engineered Radiometer #2 <strong>of</strong> 326<br />
V/W. (The pyroelectric coefficient <strong>of</strong> LiNbO3 is smaller than that <strong>of</strong> LiTaO3 <strong>and</strong> the domain engineered detector is<br />
about four times thicker than the regular LiTaO3.)<br />
10 8<br />
10 9<br />
10 -12<br />
10 -13<br />
10 -14
The frequency dependent responsivity <strong>of</strong> the radiometers was measured at a gain <strong>of</strong> 10 9 V/A. The measured 3 dB upper<br />
roll-<strong>of</strong>f frequency was 76 Hz for both transfer st<strong>and</strong>ards. This frequency was determined by the 2.1 pF stray capacitance<br />
connected in parallel with the 1 GΩ feedback resistor. In order to have an operating point on the plateau <strong>of</strong> the<br />
frequency dependent responsivity curve, the feedback resistor cannot be increased to a higher value than 10 9 Ω. In this<br />
case, chopping frequency <strong>of</strong> about 10 Hz can be used. Fig. 4 shows that the NEC (<strong>and</strong> hence the NEP) will decrease if<br />
the feedback resistor can be further increased. A feedback resistor <strong>of</strong> 10 GΩ could be used if the stray capacitance was<br />
decreased by an order <strong>of</strong> magnitude. In this case, sub 10 nW NEPs could be achieved with a 1 s lock-in time constant.<br />
4 10 -8<br />
3 10 -8<br />
2 10 -8<br />
1 10 -8<br />
0<br />
0 2 4 6 8 10<br />
Lock-in time constant [s]<br />
Fig. 5. NEP <strong>of</strong> the regular LiTaO3 pyroelectric Radiometer #1 at a signal-gain <strong>of</strong> 10 9 V/A versus lock-in time constant.<br />
For the two domed pyroelectric transfer st<strong>and</strong>ards, the results <strong>of</strong> the spatial non-uniformity <strong>of</strong> responsivity<br />
measurements together with the reflectance measurement results obtained on the ITIS <strong>and</strong> FTIS facilities are<br />
summarized in Table 1. The FTIS measurement provides the spectral dependence <strong>of</strong> the reflectance, whereas the ITIS<br />
measurement provides a more accurate (absolute reflectance) result, at a single wavelength. The table shows that 0.1 %<br />
to 0.2 % reflectance levels were measured on the domed detectors at 10.6 μm with the two different methods. The FTIR<br />
reflectance measurement indicated no wavelength dependence (leading to the spectrally flat responsivity seen in Fig.<br />
10). The low reflectance <strong>of</strong> the domed detector in the infrared range results in the low (0.5 % to 0.6 %) spatial nonuniformity<br />
<strong>of</strong> responsivity at 10.6 μm (as can also be seen in Fig. 3) for both domed detectors.<br />
Table 1. Experimental results <strong>of</strong> spatial non-uniformity <strong>of</strong> responsivity <strong>and</strong> reflectance measurements<br />
<strong>of</strong> the regular pyroelectric Radiometer #1 <strong>and</strong> the domain engineered pyroelectric Radiometer #2 at 10.6 μm<br />
Transfer st<strong>and</strong>ard<br />
pyroelectric<br />
radiometers<br />
Spatial<br />
non-uniformity<br />
<strong>of</strong> responsivity<br />
Spectral reflectance<br />
(from FTIS)<br />
Reflectance<br />
(from ITIS)<br />
#1 Bare 15% (max-min) 16% —<br />
#1 w/Dome < 0.6% — 0.18%<br />
#2 Bare — 7% —<br />
#2 w/Dome < 0.5% 0.1% 0.15%
To obtain the detector element absorptance, we also need to include loss sources other than reflectance: absorption by<br />
the dome <strong>of</strong> the detector reflected radiation, <strong>and</strong> radiation absorbed outside <strong>of</strong> the detector. We assume that the goldcoated<br />
dome reflectance is 98.5 ± 0.5 %. Ray-tracing results indicate that the radiation absorbed outside <strong>of</strong> the detector<br />
is < 0.05% <strong>and</strong> < 0.02 %, for Radiometers #1 <strong>and</strong> #2, respectively. Using these measurement results, the absorptance at<br />
10.6 μm is 99.6% <strong>and</strong> 99.8%, for Radiometers #1 <strong>and</strong> #2, respectively.<br />
3.2. Characterization <strong>of</strong> the working st<strong>and</strong>ard radiometers<br />
All four working st<strong>and</strong>ard radiometers have been fully characterized to operate them under application conditions so<br />
that the measurement uncertainty in use will not be significantly higher than when calibrated. The characterizations help<br />
the users to determine the optimum spot size <strong>of</strong> the incident beam, chopping frequency, <strong>and</strong> temperature dependent<br />
responsivity corrections for different applications.<br />
The radiometers were tested for frequency dependent responsivity at the 10 10 V/A (fixed) signal-gain. They measured<br />
the radiation from a ceramic glower from chopper frequencies ranging between 4.5 Hz <strong>and</strong> 200 Hz. The curve-fit to the<br />
measured data is shown for one <strong>of</strong> the test radiometers in Fig. 6. The fit equation is:<br />
y = m<br />
1<br />
⎡ ⎛ M<br />
⎢1+<br />
⎢<br />
⎜<br />
⎣ ⎝ m<br />
⎛ M<br />
1+<br />
⎜<br />
⎝ m<br />
0<br />
2<br />
0<br />
4<br />
⎞<br />
⎟<br />
⎠<br />
2<br />
2 ⎤⎡<br />
2<br />
⎞ ⎛ M ⎞ ⎤<br />
⎥⎢<br />
0 ⎜ ⎟ ⎥<br />
⎟ 1+<br />
⎥⎢<br />
⎜ ⎟<br />
⎠<br />
⎥<br />
⎦⎣<br />
⎝ m3<br />
⎠ ⎦<br />
where y is the signal gain (signal output / signal input), M0 is the frequency, m1 is the magnitude (amplitude) <strong>of</strong> the DC<br />
output voltage, m4 is a roll-on frequency produced by a differentiating time constant, m2 <strong>and</strong> m3 are roll-<strong>of</strong>f frequencies<br />
resulting from integrating time constants. The graph shows that the responsivity roll-on originating from m4 <strong>of</strong> the black<br />
paint can cancel the responsivity roll-<strong>of</strong>f produced by m2 <strong>of</strong> the current-to-voltage converter. The result is a 109 Hz<br />
upper roll-<strong>of</strong>f frequency originating from the remaining m3 time constant produced by the paint coating.<br />
60<br />
50<br />
40<br />
30<br />
20<br />
curve fit<br />
y = m1*sqrt(1+(M0/m4)^ 2)/sq...<br />
m1<br />
m2<br />
m3<br />
m4<br />
Chisq<br />
R<br />
Value<br />
51.909<br />
16.382<br />
109.48<br />
15.814<br />
0.30304<br />
0.99988<br />
Error<br />
0.10293<br />
2.4324<br />
0.74746<br />
2.3317<br />
NA<br />
NA<br />
10 100<br />
Frequency (Hz)<br />
Fig. 6. Frequency dependent responsivity <strong>of</strong> a working st<strong>and</strong>ard pyroelectric radiometer<br />
at a signal (current) gain <strong>of</strong> 10 10 V/A.
The spatial non-uniformity <strong>of</strong> responsivity was measured at 10.6 μm. The results in Fig. 7 show that the detector has a<br />
roughly 1 % spatial variation <strong>of</strong> responsivity in the center area which makes it possible to use it in radiant power<br />
measurement mode (where the detector is underfilled by the incident radiation) with low uncertainty. The incident<br />
radiation should avoid the detector corners, where the responsivity is highly non-uniform because <strong>of</strong> the contacts.<br />
Y (mm)<br />
-2<br />
-1<br />
0<br />
1<br />
2<br />
0.981<br />
0.989<br />
1.009 0.997 1.005<br />
0.981 1.005 1.001<br />
0.989<br />
1.005<br />
1.005<br />
0.981<br />
0.993<br />
1.001<br />
0.981<br />
1.005<br />
1.001<br />
1.005<br />
0.989<br />
0.997<br />
1.001<br />
1.005<br />
1.005<br />
1.005<br />
1.001<br />
1.009<br />
1.005<br />
1.005<br />
0.997<br />
1.017<br />
1.017<br />
1.001<br />
1.017<br />
1.001<br />
1.005<br />
0.993<br />
1.001<br />
0.993<br />
0.997<br />
0.993 1.001<br />
0.993<br />
0.993<br />
0.993<br />
0.989 1.001<br />
0.993 0.997<br />
1.005<br />
0.993<br />
0.997<br />
0.993<br />
0.997<br />
1.001 0.997<br />
1.001<br />
1.001<br />
1.001<br />
0.993<br />
1.005<br />
1.005<br />
0.997<br />
1.005<br />
1.001 1.001<br />
1.001<br />
1.017<br />
1.005<br />
1.017<br />
1.017<br />
0.997<br />
1.017 1.017<br />
1.017<br />
1.017<br />
1.017<br />
1.017<br />
0.997<br />
1.017<br />
1.001<br />
1.017<br />
1.001<br />
1.017<br />
1.017<br />
1.017<br />
1.017<br />
1.017<br />
1.017<br />
1.017<br />
1.017<br />
1.017<br />
1.017<br />
1.009<br />
-2 -1 0<br />
X (mm)<br />
1 2<br />
Fig. 7. Spatial non-uniformity <strong>of</strong> responsivity <strong>of</strong> one <strong>of</strong> the paint coated pyroelectric detectors at 10.6 μm.<br />
The responsivity is highly non-uniform at the corners because <strong>of</strong> the contacts.<br />
In order to determine the correct responsivity <strong>of</strong> the radiometers for all future applications, the temperature coefficient<br />
<strong>of</strong> responsivity (the relative responsivity change versus temperature) was measured for all four working st<strong>and</strong>ard<br />
radiometers. The radiometers were located in a temperature controlled box <strong>and</strong> measured the stable broad-b<strong>and</strong><br />
radiation from a tungsten lamp (located outside <strong>of</strong> the box) at different detector (box) temperatures. The slope <strong>of</strong> the<br />
output voltages versus temperature data points (from a linear fit) was divided by the output voltage at the predicted<br />
temperature reading <strong>of</strong> the future absolute responsivity calibration. A 0.19 %/ o C temperature coefficient <strong>of</strong> responsivity<br />
was obtained for three detectors <strong>and</strong> 0.26 %/ o C was obtained for one detector. The relative exp<strong>and</strong>ed uncertainty <strong>of</strong><br />
these measurements was 20 % (k=2).<br />
The noise floor <strong>of</strong> the working st<strong>and</strong>ard radiometers was measured in the dark at a chopping frequency <strong>of</strong> 10.5 Hz, with<br />
a lock-in integrating time constant <strong>of</strong> 2 s. The st<strong>and</strong>ard deviation was calculated from 32 data points. The calculated<br />
noise equivalent photocurrent ranged between 2 fA <strong>and</strong> 4 fA. With a 10 -6 A/W nominal responsivity at 10.6 μm, a noise<br />
equivalent power (NEP) <strong>of</strong> 2 to 4 nW was obtained for the working st<strong>and</strong>ard radiometers using the 2 s time constant.<br />
The angular responsivity <strong>of</strong> the test detectors was measured to obtain quantitative information about responsivity<br />
changes when the incident radiation geometry is varied. This enables corrections to be made for any specific geometry,<br />
such as for the converging beam from a monochromator. The 10.6 μm laser beam, in both s <strong>and</strong> then p polarization<br />
states, was focused to the working st<strong>and</strong>ard radiometers with a biconvex lens. The working st<strong>and</strong>ard radiometers were<br />
rotated about the detector center (coincident with the input beam). The working st<strong>and</strong>ard radiometer output signal was
divided by the signal <strong>of</strong> the monitor detector. The ratios were recorded versus angle <strong>of</strong> rotation. Fig. 8 shows the angular<br />
response for one <strong>of</strong> the working st<strong>and</strong>ard radiometers at 10.6 μm. The angular response change for the average s <strong>and</strong> p<br />
polarizations was less than 0.5 % within a +/- 15° angular range.<br />
A radiometer should have constant radiant power responsivity when the power level <strong>of</strong> the incident radiation changes.<br />
The working st<strong>and</strong>ard radiometers were measured from the maximum allowed radiant power level down to the low end<br />
limit, determined by the signal-to-noise ratio at the test radiometer output.<br />
10.4<br />
10.3<br />
10.2<br />
10.1<br />
10<br />
9.9<br />
9.8<br />
S<br />
P<br />
9.7<br />
-30 -20 -10 0 10 20 30<br />
Angle [ o ]<br />
Fig. 8. The angular response <strong>of</strong> the working st<strong>and</strong>ard Radiometer P8 at 10.6 μm.<br />
The response linearity <strong>of</strong> two working st<strong>and</strong>ard radiometers was measured using a collimated beam from a CO2 laser<br />
(tuned to 10.6 μm). The linearity measurement results are shown for both working st<strong>and</strong>ard radiometers in Fig. 9. The<br />
beam power was adjusted to different power levels at which measurements were made with the same filter, moved in<br />
<strong>and</strong> out <strong>of</strong> the beam <strong>and</strong> the ratio or filter transmittance calculated. A constant transmittance (which is proportional to<br />
the responsivity) indicates the linearity <strong>of</strong> the detector response versus incident radiant power. The beam power was<br />
changed using ND filters <strong>and</strong> a polarizer attenuator. The maximum power with the filter out <strong>of</strong> the laser beam was<br />
3 mW (shown in Fig. 9 with the large open circle). The results show that the working st<strong>and</strong>ard radiometers had linear<br />
response (constant responsivity) within a power range larger than three orders <strong>of</strong> magnitude. The small signal-to-noise<br />
ratios limited the linearity tests to a minimum incident power <strong>of</strong> about 0.1 μW.
1<br />
0.1<br />
P9570<br />
P9532<br />
0.01<br />
0.01 0.1 1 10 100 1000 10000<br />
Sample Power (μW)<br />
Fig. 9. Linearity measurement results <strong>of</strong> two working st<strong>and</strong>ard radiometers at 10.6 μm.<br />
4. CALIBRATION OF PYROELECTRIC RADIOMETERS<br />
The spectral power responsivities <strong>of</strong> the transfer <strong>and</strong> working st<strong>and</strong>ard pyroelectric radiometers were determined using<br />
the same calibration facilities <strong>and</strong> similar procedures.<br />
The facility for Spectral Irradiance <strong>and</strong> Radiance Responsivity Calibrations using Uniform Sources (SIRCUS) made it<br />
possible to improve the uncertainty <strong>of</strong> monochromator-based spectral radiant power responsivity measurements <strong>and</strong> to<br />
extend the calibrations from power mode to irradiance [2] <strong>and</strong> radiance measurement modes [8]. The high beam power<br />
<strong>and</strong> stability <strong>of</strong> the tunable IR lasers <strong>of</strong> the SIRCUS facility makes it possible to calibrate a wide range <strong>of</strong> IR detectors<br />
<strong>and</strong> radiometers for spectral power, irradiance, <strong>and</strong> radiance responsivity.<br />
After determination <strong>of</strong> the relative spectral responsivities using the ITIS <strong>and</strong> the FTIS facility results, radiant power<br />
responsivity tie points were made at a few wavelengths using the IDEF facility to convert the relative spectral<br />
responsivities into absolute. The tie points have been derived recently from a Si-trap detector <strong>and</strong> earlier from a single<br />
element Ge photodiode, both traceable to the <strong>NIST</strong> reference responsivity scale [9]. During the calibration <strong>of</strong> the first<br />
two working st<strong>and</strong>ard radiometers, more tie points have been derived from an earlier developed LiNbO3 pyroelectric<br />
radiometer st<strong>and</strong>ard [5] <strong>and</strong> also from a single element LiTaO3 pyroelectric transfer detector (PD2) calibrated against<br />
the primary st<strong>and</strong>ard cryogenic radiometer at 10.6 μm [10].<br />
The responsivity tie points were determined using the detector substitution method. The st<strong>and</strong>ard detector, having power<br />
responsivity sS, is placed into the laser beam, with its output current yS measured. A test detector is then placed into the<br />
same beam, with its output current yT measured. The power responsivity <strong>of</strong> the test detector is then given by<br />
y<br />
T<br />
sT = ⋅<br />
ys<br />
s<br />
s<br />
The signals yS <strong>and</strong> yT are corrected for the drift <strong>of</strong> the source intensity by using the monitor detector signal. All<br />
measurements were performed at an ambient temperature <strong>of</strong> 25 °C ± 1 °C.
4.1. Transfer st<strong>and</strong>ard radiometer responsivities<br />
The spectral power responsivity <strong>of</strong> the transfer st<strong>and</strong>ard pyroelectric Radiometer #2 at a signal gain <strong>of</strong> 10 9 V/A is shown<br />
as an example in Fig. 10 between 1 μm <strong>and</strong> 18 μm. The relative spectral responsivity function was determined from<br />
spectral reflectance measurements on the FTIR. The noise at the short wavelength end <strong>of</strong> each scan was caused by the<br />
small signal-to-noise ratios. The responsivity tie points are shown with open squares <strong>and</strong> a dot in the center. The<br />
absorptances at 10.6 μm (see Section 3.1) were used to determine the 10.6 μm tie point relative to the 785 nm reference<br />
tie point. The relative exp<strong>and</strong>ed (k=2) uncertainties are shown with error bars. The uncertainty <strong>of</strong> the 785 nm tie point<br />
propagated to 10.6 μm together with additional uncertainty components, shown in Table 2, increased the relative<br />
exp<strong>and</strong>ed uncertainty from 0.46 % to 0.58 % (k=2). This is the dominating uncertainty component for the overall<br />
spectral power responsivity function <strong>of</strong> the pyroelectric transfer st<strong>and</strong>ard Radiometer #2.<br />
4.2. Working st<strong>and</strong>ard radiometer responsivities<br />
As the working st<strong>and</strong>ard radiometers propagate the <strong>NIST</strong> detector responsivity scales to field applications, the increase<br />
in the responsivity uncertainty during the scale transfer has to be minimized. For the first two radiometers, a redundant<br />
responsivity scale transfer was developed to obtain low <strong>and</strong> reliable uncertainty <strong>of</strong> spectral power responsivity.<br />
The initial redundant responsivity scale transfer was made prior to the final calibration <strong>of</strong> the transfer st<strong>and</strong>ard<br />
Radiometers #1 <strong>and</strong> #2, when the Si-trap detector was not available for a low uncertainty tie point at the short<br />
wavelength end. The calibration results <strong>of</strong> the first two working st<strong>and</strong>ard pyroelectric radiometers are shown in Fig. 11.<br />
The plot shows the FTIS <strong>and</strong> ITIS determined relative spectral responsivity curves <strong>and</strong> the (absolute) power<br />
330<br />
328<br />
326<br />
324<br />
322<br />
320<br />
0 5 10 15<br />
Wavelength (μm)<br />
Fig. 10. Spectral power responsivity <strong>of</strong> the pyroelectric transfer st<strong>and</strong>ard Radiometer #2 at 10 9 V/A.
11000<br />
10500<br />
10000<br />
9500<br />
9000<br />
9570 Mid IR<br />
9532#2 Mid IR<br />
9570 Near IR<br />
9532#2 Near IR<br />
Pyroelectric<br />
Ge<br />
LiTaO3<br />
LiNbO3<br />
9570<br />
9532#2<br />
8500<br />
0 5 10 15 20<br />
Wavelength (μm)<br />
Fig. 11. Spectral power responsivities <strong>of</strong> the previously calibrated working st<strong>and</strong>ard<br />
Radiometers 9570 <strong>and</strong> 9532#2 at 10 10 V/A signal gains.<br />
responsivity (tie) points with error bars (corresponding to the exp<strong>and</strong>ed uncertainties) obtained from laser measurements<br />
at 1.32 µm <strong>and</strong> 10.6 µm. At 1.32 µm the working st<strong>and</strong>ard pyroelectric radiometers were compared to both Ge <strong>and</strong><br />
pyroelectric (LiNbO3) transfer st<strong>and</strong>ard radiometers. At 10.6 µm the same working st<strong>and</strong>ard radiometers were compared<br />
to three transfer st<strong>and</strong>ard radiometers (pyroelectric LiTaO3, LiNbO3, <strong>and</strong> another LiTaO3). The spectral curves are<br />
“tied” to the 1.32 µm <strong>and</strong> 10.6 µm responsivity points: i.e. they fall within the error bars at the overlap. The error bars<br />
represent the exp<strong>and</strong>ed uncertainties. For the 1 µm to 19 µm spectral range, this was 2.7% (k = 2).<br />
The other two working st<strong>and</strong>ard pyroelectric radiometers have been calibrated recently. These radiometers have tie<br />
points against a Si-trap detector (at 785 nm) <strong>and</strong> the transfer st<strong>and</strong>ard Radiometers #1 <strong>and</strong> #2 at 10.6 μm. The spectral<br />
power responsivity <strong>of</strong> the pyroelectric working st<strong>and</strong>ard Radiometer P8 is shown as an example in Fig. 12. Its 10.6 μm<br />
tie point was derived from the transfer st<strong>and</strong>ard Radiometer #2 using the detector substitution method. The responsivity<br />
is given in V/W at a signal-gain <strong>of</strong> 10 10 V/A, where the voltage was derived from the DC (un-chopped) responsivity <strong>of</strong><br />
the Si-trap detector. The combined relative exp<strong>and</strong>ed uncertainties, that include the relative uncertainty <strong>of</strong> the spectral<br />
reflectance measurements <strong>of</strong> about 0.3 % (k=2), are also shown with error bars in Fig. 12.
10000<br />
9500<br />
9000<br />
8500<br />
0 4 8 12 16<br />
Wavelength (μm)<br />
Fig. 12. Spectral power responsivity <strong>of</strong> the pyroelectric<br />
working st<strong>and</strong>ard Radiometer P8 at a signal-gain <strong>of</strong> 10 10 V/A.<br />
In applications, where these pyroelectric radiometers are used as working st<strong>and</strong>ards, the incident beam power at a given<br />
wavelength can be calculated from the reading <strong>of</strong> the lock-in amplifier (attached to the output <strong>of</strong> the working st<strong>and</strong>ard<br />
radiometer) divided by the responsivity at the given wavelength. This beam power will be measured by the test devices<br />
in a given application.<br />
The uncertainty budget <strong>of</strong> the spectral power responsivity determination (as an example) for the working st<strong>and</strong>ard<br />
Radiometer P8 is included in Table 2 at both 785 nm <strong>and</strong> 10.6 μm. The relative exp<strong>and</strong>ed uncertainty <strong>of</strong> the working<br />
st<strong>and</strong>ard Radiometer P8 is 0.6 % (k=2) at the 785 nm <strong>and</strong> 0.8 % (k=2) at the 10.6 μm tie points. As the uncertainties <strong>of</strong><br />
the new responsivity tie points were improved, the combined uncertainties <strong>of</strong> the two newer working st<strong>and</strong>ards are<br />
about three times lower than the uncertainties <strong>of</strong> the first two working st<strong>and</strong>ards discussed above.<br />
Table 2. Uncertainty budget as an example for the transfer st<strong>and</strong>ard pyroelectric Radiometer #2<br />
<strong>and</strong> the working st<strong>and</strong>ard pyroelectric Radiometer P8 at 785 nm <strong>and</strong> 10.6 μm.<br />
Uncertainty component, Transfer St<strong>and</strong>ard Radiometer #2 Working Std. Radiometer P8<br />
Type 785 nm 10.6 μm 785 nm 10.6 μm<br />
Si-trap detector, B 0.20% 0.23% 0.20% 0.30%<br />
Signal variations, A 0.09% 0.05% 0.04% 0.10%<br />
Spatial non-uniformity, B 0.06% 0.09% 0.20% 0.20%<br />
Angular (0-8 o ) resp. change, B 0.10% 0.10% 0.10% 0.10%<br />
Temperature changes, B 0.02% 0.02% 0.02% 0.02%<br />
Lock-in measurements, B 0.10% 0.10% 0.10% 0.10%<br />
TIS <strong>and</strong> ray-trace, B 0.08%<br />
Relative combined std. uncertainty 0.23% 0.29% 0.3% 0.4%<br />
Relative exp<strong>and</strong>ed uncertainty<br />
(k=2)<br />
0.46% 0.58% 0.6% 0.8%
5. CONCLUSIONS<br />
Two transfer st<strong>and</strong>ard pyroelectric radiometers have been developed at <strong>NIST</strong>. As a result <strong>of</strong> the enhanced absorption<br />
from the addition <strong>of</strong> a reflecting dome above the detector, the Radiometers #1 <strong>and</strong> #2 have approximately constant<br />
radiant power responsivities with less than a variation <strong>of</strong> 0.4 % <strong>and</strong> 0.2 %, respectively, between 1 μm <strong>and</strong> 11 μm, <strong>and</strong><br />
estimated to be approximately 0.5% for Radiometer #2 out to 18 μm. Additional radiometers with the same design,<br />
given knowledge <strong>of</strong> the bare detector reflectance at longer wavelengths, will not require spectral calibration. One<br />
responsivity tie point with low uncertainty is enough to perform the radiometer calibration for the above wavelength<br />
range. Four commercial pyroelectric detectors were also calibrated for spectral power responsivity. These radiometers<br />
are used as working st<strong>and</strong>ards in field applications. They have structured spectral responsivities due to the paint coating.<br />
Therefore, spectral reflectance measurements are needed to determine their relative spectral responsivities. A Si tunnel<br />
trap detector with a 0.2 % relative exp<strong>and</strong>ed uncertainty (k=2) was the reference radiometer for both the transfer <strong>and</strong> the<br />
working st<strong>and</strong>ard pyroelectric radiometer calibrations.<br />
The domed transfer st<strong>and</strong>ard pyroelectric radiometers were used to give the 10.6 μm responsivity tie point for the<br />
second set <strong>of</strong> working st<strong>and</strong>ard pyroelectric radiometers with a relative exp<strong>and</strong>ed uncertainty <strong>of</strong> about 0.6 % (k=2). The<br />
combined relative exp<strong>and</strong>ed uncertainties <strong>of</strong> the recently calibrated working st<strong>and</strong>ard pyroelectric radiometers were<br />
about 1 % (k=2) between 1 μm <strong>and</strong> 18 μm.<br />
6. ACKNOWLEDGEMENT<br />
The authors thank John Lehman for developing the high performance pyroelectric detectors used in the transfer st<strong>and</strong>ard<br />
radiometers described in this paper.<br />
REFERENCES<br />
1. Eppeldauer, G.P., Racz, M., <strong>and</strong> Hanssen, L.M., Spectral responsivity determination <strong>of</strong> a transfer-st<strong>and</strong>ard<br />
pyroelectric radiometer. SPIE Proceedings, 2002. 4818: p. 118-126.<br />
2. Eppeldauer, G.P., et al., Spectral irradiance responsivity measurements between 1 μm <strong>and</strong> 5 μm. SPIE<br />
proceedings, 2004. 5543(Society <strong>of</strong> Photo-Optical Instrumentation Engineers): p. 248-257.<br />
3. Eppeldauer, G.P. <strong>and</strong> Racz, M., Spectral Power <strong>and</strong> irradiance responsivity calibration <strong>of</strong> InSb working<br />
st<strong>and</strong>ard radiometers. Appl. Opt., 2000. 39(31): p. 5739-5744.<br />
4. Gong, H., Hanssen, L.M., <strong>and</strong> Eppeldauer, G.P., Spatial <strong>and</strong> angular responsivity measurements <strong>of</strong><br />
photoconductive HgCdTe LWIR radiometers. Metrologia, 2004. 41: p. 161-166.<br />
5. Lehman, J., et al., Domain-engineered pyroelectric radiometer. Appl. Opt., 1999. 38(34): p. 7047-7055.<br />
6. Day, G.W., Hamilton, A., <strong>and</strong> Pyatt, K.W., Spectral reference detector for the visible to 12- micrometer<br />
region; convenient, spectrally flat. Appl. Opt., 1976. 15(7): p. 1865-1868.<br />
7. Fox, N.P., Prior, T.R., <strong>and</strong> Theocharous, E., Radiometric calibration <strong>of</strong> infrared detectors <strong>and</strong> thermal imaging<br />
systems. SPIE Proceedings, 1995. 2474: p. 229-237.<br />
8. Eppeldauer, G.P., et al., Realization <strong>of</strong> a spectral radiance responsivity scale with a laser-based source <strong>and</strong> Si<br />
radiance meters. Metrologia, 2000. 37: p. 531-534.<br />
9. Larason, T.C., Bruce, S.S., <strong>and</strong> Parr, A.C. Spectroradiometric detector measurements. <strong>NIST</strong> Special<br />
Publication, 1998. 250-41.<br />
10. Gentile, T.R., et al., Calibration <strong>of</strong> a pyroelectric detector at 10.6 µm with the <strong>NIST</strong> High-Accuracy Cryogenic<br />
Radiometer. Appl. Opt., 1997. 36: p. 3614-3621.
Extension <strong>of</strong> the <strong>NIST</strong> infrared spectral responsivity scale to routine<br />
monochromator-based calibrations using improved-NEP pyroelectric detectors<br />
Abstract<br />
G. P. Eppeldauer, J. Zeng, H. W. Yoon, B. Wilthan, T. C. Larason, <strong>and</strong> L. M. Hanssen<br />
<strong>National</strong> <strong>Institute</strong> <strong>of</strong> <strong>St<strong>and</strong>ards</strong> <strong>and</strong> Technology<br />
Gaithersburg, Maryl<strong>and</strong> USA<br />
Routine <strong>NIST</strong> spectral responsivity calibrations are needed for the infrared range. Low<br />
NEP pyroelectric radiometers have been developed for traditional monochromator<br />
applications to extend the responsivity scale to the infrared. After NEP tests, the best<br />
pyroelectric detectors were converted to transfer-st<strong>and</strong>ard radiometers. The relative<br />
spectral responsivities were determined from spectral reflectance measurements <strong>of</strong> the<br />
organic black detector-coatings. The absolute tie points were measured against a domed<br />
pyroelectric radiometer st<strong>and</strong>ard <strong>and</strong> a sphere-input extended-InGaAs transfer st<strong>and</strong>ard<br />
radiometer. A single grating monochromator has been adapted to the calibration facility<br />
<strong>and</strong> used to characterize <strong>and</strong> calibrate infrared detectors.<br />
1. Introduction<br />
Since responsivity calibrations at the <strong>National</strong> <strong>Institute</strong> <strong>of</strong> <strong>St<strong>and</strong>ards</strong> <strong>and</strong> Technology<br />
(<strong>NIST</strong>) Spectral Irradiance <strong>and</strong> Radiance Responsivity Calibrations using Uniform<br />
Sources (SIRCUS) [1] facility are slow <strong>and</strong> expensive, a revisit <strong>of</strong> the traditional<br />
monochromator source applications was necessary. However, the noise-equivalent-power<br />
(NEP) <strong>of</strong> traditionally used pyroelectric detectors is too high for wide-wavelength-range<br />
measurements at the outputs <strong>of</strong> regular monochromators. Also, application <strong>of</strong> low NEP<br />
cryogenic bolometers is complicated, slow, <strong>and</strong> expensive [2]. Instead, improved NEP<br />
pyroelectric detectors with 5 mm detector-diameter have been developed to obtain high<br />
signal-to-noise ratios (SNR) at the output <strong>of</strong> regular monochromators [3]. The low-NEP<br />
pyroelectric detectors were extended to user friendly transfer st<strong>and</strong>ard radiometers that<br />
can extend the responsivity scale to the long-wave IR with low measurement uncertainty.<br />
Though the improved NEPs are about one order <strong>of</strong> magnitude lower than that <strong>of</strong><br />
traditional pyroelectric detectors, they are still high enough not to obtain any measurable<br />
signal contribution from the background radiation <strong>and</strong> the stray light <strong>of</strong> the<br />
monochromator. Traditionally used InSb, HgCdTe, <strong>and</strong> other IR detectors can be<br />
calibrated with low responsivity-uncertainty against the new pyroelectric transfer<br />
st<strong>and</strong>ard in the 0.3 μW to ~1 μW output beam <strong>of</strong> traditional monochromators. While the<br />
calibrations are performed in this limited power (signal) range, the traditionally used<br />
(very low-NEP) IR detectors (such as quantum detectors) will extend the spectral<br />
responsivity calibrations to low signal levels.<br />
2. Transfer st<strong>and</strong>ard pyroelectric radiometer<br />
For spectral responsivity scale extension <strong>and</strong> monochromator use, eight, low-NEP<br />
pyroelectric hybrid detectors have been characterized <strong>and</strong> selected. They were built from
100 μm thick LiTaO3 crystals <strong>and</strong> utilized a frequency compensation method [3]. The<br />
5 mm diameter active area <strong>of</strong> the detectors was coated with organic black paint. The paint<br />
introduced a differentiating time-constant that cancelled the large integrating time<br />
constant <strong>of</strong> the photocurrent-to-voltage converter (attached to the pyroelectric detector)<br />
[3]. The paint also introduced an integrating time-constant which is much smaller than<br />
the original (cancelled) integrating time-constant. As a result, the upper 3 dB roll-<strong>of</strong>f<br />
frequency could be extended by a factor <strong>of</strong> five (to about 100 Hz) at a signal-gain <strong>of</strong><br />
10 10 V/A which is an order <strong>of</strong> magnitude higher than the maximum signal-gain without<br />
this frequency compensation. Most <strong>of</strong> the tested pyroelectric detectors were extended to<br />
radiometers where the temperature <strong>of</strong> the detectors was monitored. One pyroelectric<br />
detector was extended to a radiometer where the detector temperature is stabilized at<br />
26 o C using thermoelectric heating/cooling. The picture <strong>of</strong> this transfer st<strong>and</strong>ard<br />
radiometer head is shown in Fig. 1.<br />
Fig. 1. A temperature-controlled pyroelectric transfer-st<strong>and</strong>ard radiometer head.<br />
3. Tests <strong>of</strong> the pyroelectric transfer st<strong>and</strong>ard radiometer<br />
The output beam-power <strong>of</strong> a single-grating monochromator together with the output<br />
signal-to-noise ratio (SNR) <strong>of</strong> the pyroelectric transfer-st<strong>and</strong>ard radiometer was tested to<br />
evaluate the achievable responsivity uncertainties. The arrangement <strong>of</strong> the<br />
monochromator-based setup is shown in Fig. 2.<br />
An alignment laser, a blackbody source for single beam operation, a ceramic glower, <strong>and</strong><br />
a tungsten-halogen lamp can be alternately selected with a rotating mirror. The selected<br />
beam is imaged to the entrance slit <strong>of</strong> the monochromator though order sorting filters.<br />
The total power in the output beam <strong>of</strong> the monochromator is measured by the reference<br />
<strong>and</strong> test detector using the detector substitution method.<br />
The output beam-power <strong>of</strong> the monochromator changed between 0.3 μW <strong>and</strong> 1.6 μW<br />
within the 900 nm to 2600 nm wavelength interval <strong>of</strong> a grating blazed at 1.25 μm. The<br />
st<strong>and</strong>ard deviation changed between 0.2 % <strong>and</strong> 0.4 % between 1000 nm <strong>and</strong> 2500 nm.<br />
This is equivalent to a signal-to-noise ratio (SNR) between 500 <strong>and</strong> 250 in the output<br />
signal <strong>of</strong> the radiometer [3]. This is the radiant power range where traditionally used InSb,<br />
MCT <strong>and</strong> other IR detectors can be calibrated against the pyroelectric transfer st<strong>and</strong>ard.
Optical Table<br />
Wavelength<br />
Drive Motor<br />
Absolute<br />
Encoder<br />
Single Grating Monochromator<br />
Detectors<br />
Mirror<br />
X-Y Translation Stages<br />
Order Sorting<br />
Filter Wheel<br />
Quartz-<br />
Halogen<br />
Lamp<br />
Glow Bar<br />
Chopper<br />
Fig. 2. Monochromator based detector responsivity calibrator.<br />
For the best pyroelectric detectors, less than 4 nW/Hz 1/2 NEPs were measured which is an<br />
order <strong>of</strong> magnitude smaller than the NEP <strong>of</strong> our earlier developed (traditional)<br />
pyroelectric detector st<strong>and</strong>ard [4]. The NEPs <strong>of</strong> the eight tested pyroelectric radiometers<br />
ranged between 3 nW/Hz 1/2 <strong>and</strong> 10 nW/Hz 1/2 [3]. The test results <strong>of</strong> the temperature<br />
controlled transfer-st<strong>and</strong>ard pyroelectric radiometer are shown in Table 1. The NEP was<br />
calculated as the ratio <strong>of</strong> the st<strong>and</strong>ard deviation (noise) <strong>of</strong> the output voltage (from twenty<br />
data points) to the radiometer responsivity. The responsivity value includes the 10 10 V/A<br />
gain <strong>of</strong> the current meter attached to the pyroelectric detector. A 785 nm responsivity tie<br />
point was made against a silicon trap detector <strong>and</strong> a 10.6 μm tie point was derived from<br />
our previously developed <strong>and</strong> calibrated dome-input pyroelectric radiometer [4]. These<br />
tie point derivations were made at a chopping frequency <strong>of</strong> 10.5 Hz. The frequency<br />
dependent responsivity <strong>of</strong> the pyroelectric transfer st<strong>and</strong>ard has been measured to<br />
determine the upper 3 dB roll-<strong>of</strong>f frequency <strong>and</strong> to apply responsivity corrections for<br />
different signal frequencies in different applications. The result <strong>of</strong> the frequency<br />
dependent responsivity measurement for the transfer st<strong>and</strong>ard is shown in Fig. 3. A three<br />
time-constant curve fit [4] was applied to the measured data after normalizing the data at<br />
low frequencies. The 3 dB upper roll-<strong>of</strong>f frequency is about 100 Hz, a decade higher than<br />
the suggested chopping frequency.<br />
Table 1.<br />
Test results <strong>of</strong> the transfer st<strong>and</strong>ard pyroelectric radiometer.<br />
St<strong>and</strong>ard deviation in dark 9.4 x 10 -6 V<br />
NEP (with 1 s time constant) 4.7 nW<br />
3 dB upper roll-<strong>of</strong>f frequency 100 Hz<br />
Responsivity, 785 nm, 10.5 Hz 5059 V/W<br />
Responsivity, 10.6 μm, 10.5 Hz 4995 V/W<br />
Blackbody<br />
Mirror &<br />
Rotation Stage<br />
Alignment<br />
Laser
1<br />
0.9<br />
0.8<br />
0.7<br />
0.6<br />
0.5<br />
y = m1*sqrt(1+(M0/m4)^ 2)/sq...<br />
Value Error<br />
m1 0.99645 0.0012236<br />
m2 120.29 0.53737<br />
m3 21.598 1.0632<br />
m4 23.354 1.1756<br />
Chisq 0.0002483 NA<br />
R 0.99993 NA<br />
0.4<br />
1 10 100 1000<br />
Frequency (Hz)<br />
Fig. 3. Frequency dependent responsivity <strong>of</strong> the pyroelectric transfer st<strong>and</strong>ard.<br />
4. Calibration <strong>of</strong> the pyroelectric transfer st<strong>and</strong>ard radiometer<br />
The spectral reflectance <strong>of</strong> the organic black coated transfer st<strong>and</strong>ard detector was<br />
measured on the <strong>NIST</strong> FTIR Spectrometer Facility. The spectral reflectance <strong>of</strong> this paintcoated<br />
detector is structured versus wavelength. The relative spectral responsivity <strong>of</strong> the<br />
detector was determined first. The spectral reflectance measurement results are shown in<br />
Fig. 4. The reflectance varied from 3.5 % to 5.5 % between 1.5 μm <strong>and</strong> 14.5 μm. The<br />
exp<strong>and</strong>ed uncertainty (k=2) <strong>of</strong> the spectral reflectance measurements is shown in the<br />
same graph. This reflectance uncertainty includes the noise <strong>and</strong> the signal loss due to the<br />
detector can. The loss is a systematic uncertainty component which will have a minimal<br />
contribution to the responsivity uncertainty budget since an absolute tie point to the<br />
relative spectral reflectance curve will take care <strong>of</strong> this problem. Since the responsivity is<br />
proportional to 1-reflectance, the exp<strong>and</strong>ed responsivity uncertainty component from the<br />
relative spectral reflectance is 0.5 % (k=2) between 2.5 μm <strong>and</strong> 13 μm.<br />
The 10.6 μm tie point was derived from the previously developed domed pyroelectric<br />
radiometer [4]. The exp<strong>and</strong>ed uncertainty <strong>of</strong> the 10.6 μm tie points is 0.8 % (k=2).<br />
The monochromator-based tie point was made against a sphere-input extended-InGaAs<br />
(EIGA) radiometer. The EIGA radiometer was calibrated against an electrical substitution<br />
cryogenic radiometer using the detector substitution method [5]. Both radiometers<br />
measured the same radiant power from intensity stabilized tunable lasers. Since the laser<br />
power levels were high, the EIGA radiometer was operated in a DC signal measurement<br />
mode. The calibrations were made between 1 μm <strong>and</strong> 2.5 μm with an exp<strong>and</strong>ed<br />
uncertainty <strong>of</strong> 0.4 % (k=2). The tie point at the monochromator-based facility was at
1790 nm. This tie point calibration was made at 0.5 μW radiant power output-radiation <strong>of</strong><br />
the monochromator. The other (longer wavelength) tie points from the monochromatorbased<br />
spectral measurements were not used because <strong>of</strong> the smaller signal-to-noise ratios.<br />
The radiation was chopped with 12 Hz <strong>and</strong> the radiometer (both reference <strong>and</strong> test)<br />
output signals were measured by a sine-wave measuring lock-in amplifier. This power<br />
level was selected to avoid non-linearity errors in the calibrations <strong>of</strong> the pyroelectric<br />
detectors.<br />
0.07<br />
0.06<br />
0.05<br />
0.04<br />
0.03<br />
0.02<br />
0.01<br />
0<br />
Absolute reflectance<br />
Exp<strong>and</strong>ed uncertainty<br />
2 4 6 8 10 12 14<br />
Wavelength [µm]<br />
Fig. 4. Spectral reflectance <strong>of</strong> the pyroelectric transfer st<strong>and</strong>ard detector.<br />
Before the tie point calibration, the frequency dependent responsivity <strong>of</strong> the EIGA<br />
sphere-detector was measured. Also, the signal attenuation <strong>of</strong> the pyroelectric transfer<br />
st<strong>and</strong>ard was checked between 12 Hz <strong>and</strong> 10.5 Hz. The signal attenuation <strong>of</strong> the EIGA<br />
sphere-radiometer was 0.3 % over-compensated by the increased signal responsivity <strong>of</strong><br />
the pyroelectric radiometer at 10.5 Hz (compared to 12 Hz) where the spectral<br />
responsivities are reported. The 0.3 % (k=2) over compensation has been corrected <strong>and</strong><br />
this uncertainty component is not included in the overall uncertainty budget. The reading<br />
<strong>of</strong> the sine-wave measuring lock-in amplifier was multiplied by 2.221 to obtain the<br />
correct responsivity value for the tie point. From three repeats <strong>of</strong> the absolute tie-point<br />
measurements <strong>of</strong> the pyroelectric transfer st<strong>and</strong>ard, an exp<strong>and</strong>ed measurement<br />
uncertainty <strong>of</strong> 0.5 % (k=2) was obtained. This uncertainty component is noise dominated.<br />
Figure 5 shows the measured spatial uniformities <strong>of</strong> the pyroelectric transfer st<strong>and</strong>ard at<br />
two different wavelengths. The roughly 2 % maximum-to-minimum non-uniformity in<br />
the center-area at 785 nm increased by about 50 % at 10.6 μm. The increase in the spatial<br />
non-uniformity is associated with the ~50 % higher reflectance at 10.6 μm. According to
Fig. 5, the uncertainty component that originates from the spatial non-uniformity <strong>of</strong><br />
responsivity is wavelength dependent. If the detector center-area is used <strong>and</strong> the incident<br />
beam diameter is between 1 mm <strong>and</strong> 2 mm <strong>and</strong> positioned into the detector center, the<br />
spatial non-uniformity uncertainty component can be decreased to 0.5 % (k=2).<br />
2.0<br />
Y (mm)<br />
1.0<br />
0.0<br />
-1.0<br />
-2.0<br />
-2.0<br />
2.0<br />
1.0<br />
0.0<br />
X (mm)<br />
-1.0<br />
1.0300<br />
1.0100<br />
0.9900<br />
3<br />
2<br />
1<br />
0<br />
Y (mm)<br />
-1<br />
-2<br />
-3<br />
-3<br />
-2<br />
-1<br />
0<br />
X (mm)<br />
1<br />
2<br />
1.01<br />
0.99<br />
0.97<br />
3<br />
Fig. 5. Spatial uniformity plots <strong>of</strong> the transfer st<strong>and</strong>ard at 785 nm <strong>and</strong> 10.6 μm.<br />
The responsivity uncertainty budget <strong>of</strong> the pyroelectric transfer st<strong>and</strong>ard radiometer at<br />
10.5 Hz signal frequency from 2.5 μm to 13 μm is shown in Table 2. The exp<strong>and</strong>ed<br />
uncertainty at 2 μm is 1.3 % (k=2) because <strong>of</strong> the increased noise in the spectral<br />
reflectance measurements. Because <strong>of</strong> the same reason, the exp<strong>and</strong>ed uncertainty at<br />
14 μm increased to 1.2 % (k=2).<br />
The spectral radiant power responsivity <strong>of</strong> the pyroelectric transfer st<strong>and</strong>ard radiometer is<br />
shown in Fig. 6. In addition to the 10.6 μm tie point, the tie point <strong>of</strong> the sphere-input<br />
EIGA radiometer is also shown in Fig. 6. The individual error bars represent the<br />
exp<strong>and</strong>ed uncertainties (k=2) <strong>of</strong> the tie points. The sphere-EIGA related error bar (full<br />
square) illustrates the overall exp<strong>and</strong>ed uncertainty summarized in Table 2.<br />
5. Spectral responsivity propagation from the pyroelectric transfer st<strong>and</strong>ard<br />
The scale from the transfer-st<strong>and</strong>ard pyroelectric radiometer can be transferred to other<br />
infrared test detectors using the detector substitution method. The substitution is<br />
performed in the 0.3 μW to 1.6 μW radiant power range using a detector-stage at the<br />
output <strong>of</strong> the single monochromator in Fig. 2. The monochromator has four gratings to<br />
continuously cover the spectral range to 24 μm. The total-power in the output beam <strong>of</strong><br />
the monochromator is measured by under-filling both the reference <strong>and</strong> the test<br />
detector(s). A stable 1000 C o blackbody source is imaged to the entrance slit <strong>of</strong> the<br />
monochromator to make wide consecutive wavelength-scans for both the test <strong>and</strong> the<br />
reference (transfer st<strong>and</strong>ard) detectors. The measurements also can be performed in twobeam<br />
mode where the signal <strong>of</strong> the test or reference detector is simultaneously divided by<br />
the signal from a monitor detector.
5250<br />
5200<br />
5150<br />
5100<br />
5050<br />
5000<br />
Relative responsivity<br />
Responsivity vs dome-pyro<br />
Responsivity vs sphere-EIGA<br />
4950<br />
0 2 4 6 8 10 12 14 16<br />
Wavelength (μm)<br />
Fig. 6. Spectral responsivity <strong>of</strong> the pyroelectric transfer st<strong>and</strong>ard radiometer.<br />
Traditional IR detectors, such as InSb <strong>and</strong> MCT detectors can be calibrated against the<br />
pyroelectric transfer st<strong>and</strong>ard to extend the radiant power range to low signal levels. All<br />
infrared responsivity measurements on the monochromator-based facility are performed<br />
in AC mode using individual lock-in amplifiers for the reference, test, <strong>and</strong> monitor<br />
detectors.<br />
Table 2. Uncertainty budget (k=2) for the spectral responsivity <strong>of</strong> the<br />
pyroelectric transfer st<strong>and</strong>ard at 10.5 Hz from 2.5 μm to 13 μm.<br />
Uncertainty factor Type Uncertainty<br />
(k=2) [%]<br />
Tie point absolute responsivity calibration:<br />
Sphere-EIGA radiometer responsivity A 0.4<br />
Pyroelectric radiometer gain B 0.04<br />
Pyroelectric temperature dependence B 0.04<br />
Pyroelectric radiometer frequency dependence B 0.08<br />
Pyroelectric spatial non-uniformity <strong>of</strong> responsivity B 0.5<br />
Pyroelectric noise dominated repeatability B 0.5<br />
Combined exp<strong>and</strong>ed uncertainty 0.82<br />
Relative responsivity calibration:<br />
Spectral reflectance measurement A 0.5<br />
Overall exp<strong>and</strong>ed uncertainty 0.96
6. Conclusions<br />
Traditional pyroelectric detectors need high incident radiant power, such as stabilized<br />
tunable lasers to obtain high signal-to-noise ratios for low uncertainty measurements. The<br />
laser-used spectral responsivity measurements are time consuming <strong>and</strong> expensive.<br />
Development <strong>of</strong> low-NEP pyroelectric radiometers was needed to use traditional<br />
monochromators for routine spectral responsivity calibrations in the infrared.<br />
Characterizations <strong>and</strong> calibration <strong>of</strong> a recently developed low-NEP pyroelectric transfer<br />
st<strong>and</strong>ard radiometer is described in detail. This transfer st<strong>and</strong>ard can be used at radiant<br />
power levels higher than 0.3 μW to obtain 1 % (k=2) responsivity uncertainties. It is<br />
operated in a limited power range (to a couple <strong>of</strong> μW) to avoid non-linearity errors in the<br />
pyroelectric detector. Traditional InSb, HgCdTe, <strong>and</strong> other very low-NEP infrared<br />
detectors can be calibrated against the pyroelectric transfer st<strong>and</strong>ard at the<br />
monochromator output to extend the spectral responsivities to sub pW radiant power<br />
levels. The new monochromator based responsivity scale can be used to 14 μm.<br />
References<br />
1. S. W. Brown, G. P. Eppeldauer, <strong>and</strong> K. R. Lykke, Facility for Spectral Irradiance <strong>and</strong><br />
Radiance Responsivity Calibrations using Uniform Sources, Applied Optics, Vol. 45, No.<br />
32, p. 8218-8237, 2006.<br />
2. G. Eppeldauer, A. L. Migdall, <strong>and</strong> C. L. Cromer, A cryogenic silicon resistance<br />
bolometer for use as an infrared transfer st<strong>and</strong>ard detector, 6th AIAA/ASME<br />
Thermophysics <strong>and</strong> Heat Transfer Conference, June 1994, Colorado Springs, CO. Proc.<br />
HTD-Vol. 277, Thermal Phenomena at Molecular <strong>and</strong> in Cryogenic Infrared Detectors, p.<br />
63-67 (Book No. H00908), 1994.<br />
3. G. P. Eppeldauer, J. Zeng, <strong>and</strong> H. W. Yoon, Low-NEP pyroelectric radiometer<br />
st<strong>and</strong>ards, SPIE Proc. Vol. 6940, pp. 694036-1 to 694036-8, 2008.<br />
4. G. P. Eppeldauer, J. Zeng, <strong>and</strong> L. M. Hanssen, Development <strong>and</strong> calibration <strong>of</strong><br />
pyroelectric radiometer st<strong>and</strong>ards at <strong>NIST</strong>, SPIE Proc. Vol. 6201, pp. 620119-1 to<br />
620119-12, 2006.<br />
5. G. P. Eppeldauer <strong>and</strong> H. W. Yoon, Short wave infrared radiometers design <strong>and</strong><br />
characterizations, SPIE Proc. Vol. 6542, pp. 65420O-1 to 65420O-9, 2007.
Preprint<br />
IEEE TRANSACTIONS ON INSTRUMENTATION AND MEASUREMENT, VOL. 50, NO. 2, APRIL 2001<br />
RESPONSIVITY CALIBRATION METHODS FOR 365 nm IRRADIANCE METERS<br />
T. C. Larason, S. W. Brown, G. P. Eppeldauer, <strong>and</strong> K. R. Lykke<br />
<strong>National</strong> <strong>Institute</strong> <strong>of</strong> <strong>St<strong>and</strong>ards</strong> <strong>and</strong> Technology 1<br />
Gaithersburg, MD 20899-8441, USA<br />
Key Words: detector, irradiance, photodiode, radiometer, spectral responsivity, <strong>and</strong> ultraviolet<br />
Abstract<br />
Two detector-based responsivity calibration methods have been compared at the <strong>National</strong> <strong>Institute</strong> <strong>of</strong> <strong>St<strong>and</strong>ards</strong> <strong>and</strong><br />
Technology (<strong>NIST</strong>) for ultraviolet (UV) irradiance meters in the 365 nm spectral region. Both methods are based on an<br />
electrical substitution High Accuracy Cryogenic Radiometer (HACR), but utilize different facilities <strong>and</strong> transfer<br />
st<strong>and</strong>ards. One facility is a monochromator-based, spectral power responsivity measuring system utilizing an aperture<br />
scanning method, while the second is a tunable laser <strong>and</strong> integrating sphere source system using a light-trapping silicon<br />
transfer detector with a known aperture area. The first reported comparison <strong>of</strong> these two fundamentally different<br />
methods agreed to 1 % to 2 % near the peak <strong>and</strong> long wavelength side <strong>of</strong> the b<strong>and</strong>pass curves which is comparable to<br />
their exp<strong>and</strong>ed (k = 2) uncertainties.<br />
I. INTRODUCTION<br />
UV irradiance meters have a broad range <strong>of</strong> industrial applications from semiconductor manufacturing<br />
(photolithography) to nondestructive testing to curing inks <strong>and</strong> coatings used in high volume printing. Increasing<br />
industrial application <strong>of</strong> UV irradiance measurements has led to a steady increase in the number <strong>of</strong> calibration requests<br />
to <strong>NIST</strong> for UV irradiance meters, particularly those used to measure 365 nm radiation. The measured signal from a<br />
given irradiance meter is the integral <strong>of</strong> the source distribution <strong>and</strong> the meter spectral responsivity,<br />
i = ∫ E(λ) ⋅ S(λ)⋅ dλ<br />
(1)<br />
λ<br />
where i is the signal, E(λ) is the spectral irradiance from the source measured <strong>and</strong> S(λ) is the spectral irradiance<br />
responsivity <strong>of</strong> the meter. Knowledge <strong>of</strong> the spectral irradiance responsivity <strong>of</strong> a meter is critical for high accuracy<br />
measurements <strong>of</strong> sources with different spectral power distributions. This is especially critical if more than one model<br />
<strong>of</strong> irradiance meter (i.e., different responsivities) is used in the measurement chain.<br />
<strong>NIST</strong> currently has two facilities for measuring the spectral responsivity <strong>of</strong> UV irradiance meters: the Ultraviolet<br />
Spectral Comparator Facility (UV SCF) [1] <strong>and</strong> the facility for Spectral Irradiance <strong>and</strong> Radiance Responsivity<br />
Calibrations with Uniform Sources (SIRCUS) [2]. Diagrams <strong>of</strong> these facilities are shown in Figures 1 <strong>and</strong> 2,<br />
respectively. The irradiance scale <strong>of</strong> each facility is based on the High Accuracy Cryogenic Radiometer (HACR), the<br />
<strong>NIST</strong> primary st<strong>and</strong>ard cryogenic radiometer. While similar methods have been reported elsewhere [3, 4] this is the<br />
first direct comparison <strong>of</strong> these two fundamentally different techniques.<br />
A number <strong>of</strong> 365 nm irradiance meters with different optical diffusers <strong>and</strong> spectral responsivities were measured in both<br />
<strong>NIST</strong> facilities <strong>and</strong> their responsivities compared to verify the irradiance calibration uncertainties <strong>of</strong> the UV SCF <strong>and</strong> to<br />
refine the SIRCUS irradiance calibration procedures. The results <strong>of</strong> this intercomparison are shown here for two<br />
representative irradiance meters. One irradiance meter, designated IM #1, was a commercial device with an<br />
approximately 50 nm b<strong>and</strong>pass (FWHM). The second, IM #2, was a <strong>NIST</strong> designed transfer st<strong>and</strong>ard with an<br />
approximately 25 nm b<strong>and</strong>pass (FWHM).<br />
1 Optical Technology Division, Physics Laboratory, Technology Administration, U.S. Department <strong>of</strong> Commerce. Official contribution <strong>of</strong> the <strong>National</strong><br />
<strong>Institute</strong> <strong>of</strong> <strong>St<strong>and</strong>ards</strong> <strong>and</strong> Technology, not subject to copyright in the United States.<br />
Page 1
Preprint<br />
IEEE TRANSACTIONS ON INSTRUMENTATION AND MEASUREMENT, VOL. 50, NO. 2, APRIL 2001<br />
Light Tight Enclosure<br />
UV WS<br />
Detector<br />
Carousel<br />
Baffle<br />
Beam Splitter<br />
Monitor<br />
Detector<br />
Scanning<br />
Carriage<br />
Order-<br />
Sorting<br />
Filter<br />
Shutter<br />
Wavelength<br />
Drive<br />
Double Grating<br />
Monochromator<br />
Page 2<br />
Alignment Laser<br />
Sources<br />
Figure 1. Ultraviolet Spectral Comparator Facility (UV SCF) Diagram. The irradiance meter-under-test is mounted on<br />
the scanning carriage. Spectral responsivity comparison is accomplished by rotating the detector carousel to place one<br />
<strong>of</strong> the UV working st<strong>and</strong>ards (WS) into the beam. The order-sorting filter removes 2 nd order light beyond 400 nm.<br />
Figure 2. Spectral Irradiance <strong>and</strong> Radiance Responsivity Calibrations with Uniform Sources (SIRCUS) Diagram. The<br />
irradiance meter calibration is performed by direct substitution with the irradiance transfer st<strong>and</strong>ard.<br />
II. UV SCF MEASUREMENTS<br />
The first facility, the UV SCF, is a monochromator-based system developed in the early 1990s to measure the absolute<br />
spectral responsivity <strong>and</strong> uniformity <strong>of</strong> photodetectors in the 200 nm to 500 nm spectral region. The principal<br />
component is a computer controlled 1/4 m focal length, f/5, double grating monochromator with a 3 nm b<strong>and</strong>pass. A<br />
variety <strong>of</strong> sources (typically an argon arc) can be selected using a computer controlled turning mirror to align the source<br />
with the spherical mirror that focuses the light onto the monochromator's entrance slit. The argon arc <strong>and</strong><br />
monochromator operate as a tunable monochromatic source. The typical entrance <strong>and</strong> exit slits are circular 1.5 mm<br />
apertures. A shutter is located just after the exit slit. Inside a light tight box, a rotary stage is used to place an irradiance<br />
meter or silicon working st<strong>and</strong>ard at the focal plane. The exit aperture is imaged onto the detectors resulting in an oval<br />
beam <strong>of</strong> axis diameters 2.0 mm <strong>and</strong> 2.5 mm. The beam was centered on, <strong>and</strong> underfilled the irradiance meter apertures<br />
<strong>and</strong> working st<strong>and</strong>ard detectors. A pair <strong>of</strong> orthogonal linear positioning stages translates the irradiance meters for both
Preprint<br />
IEEE TRANSACTIONS ON INSTRUMENTATION AND MEASUREMENT, VOL. 50, NO. 2, APRIL 2001<br />
alignment to the optical axis <strong>and</strong> scanning for uniformity measurements. The stages’ travel range is 50 mm with a<br />
manufacturer-specified resolution <strong>of</strong> 0.1 µm <strong>and</strong> an accuracy <strong>of</strong> 0.25 µm per 25 mm. Each detector is mounted to allow<br />
its position to be adjusted along the optical axis for focusing. A gimbal mount allows for the rotation <strong>and</strong> tilt <strong>of</strong> each<br />
detector to be adjusted for perpendicular alignment to the optical axis. The output current <strong>of</strong> each detector is converted<br />
to a voltage by a transimpedance amplifier <strong>and</strong> measured by a digital voltmeter. A beam splitter directs approximately<br />
10 % <strong>of</strong> the beam to a silicon monitor photodiode. Simultaneously measuring the monitor <strong>and</strong> detector signals<br />
compensates for any source fluctuations.<br />
The absolute spectral power responsivity <strong>of</strong> the irradiance meters was determined from 300 nm to 400 nm in 1 nm<br />
increments by direct substitution comparisons to the silicon photodiode working st<strong>and</strong>ards. The effective aperture area<br />
<strong>of</strong> each irradiance meter was determined by scanning the monochromator output beam over the irradiance meter’s<br />
entrance aperture in 0.2 mm increments to simulate a uniform irradiance. This method has been used by <strong>NIST</strong> since<br />
1991 [5]. It has been shown [6] that the effective aperture area is the ratio <strong>of</strong> the total signal, i, summed over the<br />
scanned area (total irradiance responsivity) to the product <strong>of</strong> the total beam power, Φ [W], <strong>and</strong> the average spectral<br />
power responsivity, s(λ), within the active area <strong>of</strong> the aperture,<br />
∑i(x, y)ΔxΔy<br />
A =<br />
(2)<br />
Φ⋅s(λ)<br />
where Δx <strong>and</strong> Δy are the small steps taken to completely overscan the aperture. The spectral irradiance responsivity<br />
was the product <strong>of</strong> the effective aperture area <strong>and</strong> the spectral power responsivity [7].<br />
The aperture scanning method can be applied to irradiance meters with non-uniform spatial responsivities. Figure 3<br />
shows the different spatial responsivity uniformities <strong>of</strong> the two irradiance meters. The large differences are due to<br />
different input geometries <strong>and</strong> diffuser materials. The data are from the UV SCF aperture scans at 0.2 mm steps.<br />
The exp<strong>and</strong>ed uncertainty for the UV SCF measurements varies with wavelength, is a minimum at the peak<br />
responsivity, <strong>and</strong> increases at other wavelengths due primarily to wavelength uncertainties <strong>and</strong> the decreasing signal-tonoise<br />
ratio. The exp<strong>and</strong>ed uncertainty (k = 2) for both irradiance meters at 365 nm was ≈ 2 %. The uncertainties<br />
increased in regions <strong>of</strong> low responsivity to ≈ 10 %. These higher uncertainties do not contribute significantly to the<br />
overall measurement uncertainty <strong>of</strong> broadb<strong>and</strong> sources.<br />
(a)<br />
-4<br />
-2<br />
0<br />
y [mm]<br />
2<br />
4<br />
-4<br />
-2<br />
2<br />
0<br />
x [mm]<br />
1.2<br />
1.0<br />
0.8<br />
0.6<br />
0.4 Relative Responsivity<br />
0.2<br />
4<br />
(b)<br />
-2.50<br />
-1.25<br />
0.00<br />
y [mm]<br />
1.25<br />
2.50<br />
Page 3<br />
1.00<br />
0.75<br />
0.50<br />
Relative Responsivity<br />
0.25<br />
0.00<br />
2.50<br />
1.25<br />
0.00<br />
x [mm]<br />
-1.25<br />
-2.50<br />
Figure 3. Surface (3D) plot <strong>of</strong> typical 365 nm detectors having different input geometries <strong>and</strong> diffuser materials.<br />
Figure 3a shows Irradiance Meter #1 <strong>and</strong> Figure 3b is Irradiance Meter #2.<br />
III. SIRCUS MEASUREMENTS<br />
Recently a second facility, the SIRCUS, has been developed. The SIRCUS employs a variety <strong>of</strong> tunable lasers<br />
(Ti:Sapphire <strong>and</strong> dye lasers) at both fundamental <strong>and</strong> frequency doubled wavelengths to cover the spectral range from<br />
275 nm to 1000 nm. The output <strong>of</strong> the laser was sent through an intensity stabilizer <strong>and</strong> a portion into a wavemeter.<br />
From the intensity stabilizer, the beam was sent through a lens into a 5 cm diameter integrating sphere. The 8 mm<br />
diameter exit port <strong>of</strong> the sphere approximated a point source, producing a uniform irradiance on the detectors. A beam<br />
splitter <strong>and</strong> monitor silicon photodiode were used to correct for source fluctuations during the measurements. A
Preprint<br />
IEEE TRANSACTIONS ON INSTRUMENTATION AND MEASUREMENT, VOL. 50, NO. 2, APRIL 2001<br />
computer controlled linear positioning stage positioned the detectors in front <strong>of</strong> the integrating sphere exit port at a<br />
distance <strong>of</strong> 25 cm.<br />
The spectral power responsivity <strong>of</strong> the silicon trap irradiance transfer st<strong>and</strong>ard was measured directly against the<br />
HACR. The transfer st<strong>and</strong>ard was equipped with a known-area aperture. The radiant intensity <strong>of</strong> the sphere was<br />
calculated from the transfer st<strong>and</strong>ard power responsivity, aperture area, <strong>and</strong> sphere to transfer st<strong>and</strong>ard distance. The<br />
irradiance meters were substituted for the transfer st<strong>and</strong>ard in the uniform irradiance <strong>of</strong> the integrating sphere source.<br />
The laser was tuned between 368 nm <strong>and</strong> 385 nm with roughly 2.5 nm steps. The uncertainty for the SIRCUS results<br />
was ≈ 1 %, mainly due to the measurement reproducibility.<br />
IV. RESULTS AND DISCUSSION<br />
The spectral irradiance responsivity, in A⋅mm 2 /W, <strong>of</strong> the two irradiance meters is presented in Figures 4 <strong>and</strong> 5.<br />
Absolute Irradiance Responsivity [A⋅mm 2 /W]<br />
0.020<br />
0.015<br />
0.010<br />
0.005<br />
0.000<br />
UV SCF<br />
Deconvolved Data<br />
-0.2 nm wavelength shift<br />
Irradiance Meter #1<br />
UV SCF Uncertainty [%]<br />
300 320 340 360 380 400<br />
Wavelength [nm]<br />
Page 4<br />
Difference [%]<br />
Figure 4. Plot <strong>of</strong> irradiance responsivity, UV SCF relative exp<strong>and</strong>ed (k = 2) uncertainties, <strong>and</strong> relative differences for<br />
the two methods for Irradiance Meter #1. Irradiance Meter #1 is a typical commercial 365 nm detector with an ≈ 50 nm<br />
b<strong>and</strong>pass (FWHM).<br />
Absolute Irradiance Responsivity [A⋅mm 2 /W]<br />
0.00040<br />
0.00035<br />
0.00030<br />
0.00025<br />
0.00020<br />
0.00015<br />
0.00010<br />
0.00005<br />
0.00000<br />
Deconvolved Data<br />
-0.1 nm wavelength shift<br />
UV SCF Uncertainty [%]<br />
SIRCUS<br />
Irradiance Meter #2<br />
UV SCF<br />
Difference [%]<br />
300 320 340 360 380 400<br />
Wavelength [nm]<br />
Figure 5. Plot <strong>of</strong> irradiance responsivity, UV SCF relative exp<strong>and</strong>ed (k = 2) uncertainties, <strong>and</strong> relative differences for<br />
the two methods for Irradiance Meter #2. Irradiance Meter #2 is a <strong>NIST</strong> designed transfer st<strong>and</strong>ard with a ≈ 25 nm<br />
b<strong>and</strong>pass (FWHM).<br />
SIRCUS<br />
12<br />
10<br />
8<br />
6<br />
4<br />
2<br />
0<br />
12<br />
10<br />
8<br />
6<br />
4<br />
2<br />
0<br />
<strong>and</strong> Relative Exp<strong>and</strong>ed Uncertainty ( k=2)<br />
[%]<br />
<strong>and</strong> Relative Exp<strong>and</strong>ed Uncertainty ( k=2)<br />
[%]
Preprint<br />
IEEE TRANSACTIONS ON INSTRUMENTATION AND MEASUREMENT, VOL. 50, NO. 2, APRIL 2001<br />
The relative exp<strong>and</strong>ed uncertainty (k = 2) in the SCF measurements <strong>and</strong> the relative difference between the SCF <strong>and</strong><br />
SIRCUS measurements are also shown in Figures 4 <strong>and</strong> 5. The two methods using the UV SCF <strong>and</strong> SIRCUS agreed to<br />
the 1 % to 2 % level in the peak portion <strong>of</strong> the b<strong>and</strong>pass curves as shown in Figures 4 <strong>and</strong> 5. This is within the<br />
exp<strong>and</strong>ed (k = 2) uncertainties for the responsivity measurements. The difference increases at the lower values <strong>of</strong> the<br />
responsivity to just greater than the exp<strong>and</strong>ed uncertainties. The UV SCF wavelength uncertainty is larger than that <strong>of</strong><br />
SIRCUS <strong>and</strong> may be a factor in the observed differences. Since the UV SCF data were taken in 1 nm intervals <strong>and</strong> the<br />
monochromator b<strong>and</strong>pass is 3 nm, the data were deconvolved using the monochromator slit-function. A 0.1 nm to<br />
0.2 nm wavelength shift in the deconvoluted UV SCF data brings the measurements between these two facilities into<br />
agreement on the 1 % to 2 % level over the entire spectral range. The calibration <strong>of</strong> the monochromator wavelength<br />
scale was checked with spectral line lamps <strong>and</strong> showed agreement to better than 0.1 nm over this spectral region. The<br />
wavelength shift was -0.2 nm for meter #1 <strong>and</strong> -0.1 nm for meter #2. One would expect the same shift for each<br />
irradiance meter if the wavelength scale were indeed the cause <strong>of</strong> the differences observed. A hypothesized cause is<br />
that the effective aperture area changes with wavelength. Thus, it may be necessary to scan the aperture not only at the<br />
peak responsivity, but also on either side <strong>of</strong> the peak. A definitive answer to the observed difference is currently under<br />
investigation.<br />
The two independent methods discussed both have advantages <strong>and</strong> disadvantages. The UV SCF can scan spectrally<br />
over a wide range easily but is limited by low flux levels, the relatively wide spectral b<strong>and</strong>width for filter cut<strong>of</strong>f regions,<br />
<strong>and</strong> the extremely long time intervals (4 h to 6 h) needed for the spatial scanning <strong>of</strong> the aperture. The SIRCUS facility<br />
has better wavelength accuracy, higher flux, faster measurement comparison (only a few minutes per data point since<br />
there is no spatial scanning), <strong>and</strong> most importantly, lower uncertainty. The lower uncertainty <strong>of</strong> the SIRCUS facility<br />
gives an independent verification <strong>of</strong> the aperture scanning method. The major disadvantage <strong>of</strong> the SIRCUS is the<br />
number <strong>of</strong> measurements needed to trace the responsivity <strong>of</strong> an irradiance meter. This is especially true over a broad<br />
wavelength range where several lasers may be needed.<br />
Because <strong>of</strong> the labor-intensive nature <strong>of</strong> the SIRCUS measurements, a third method is proposed combining the best<br />
features <strong>of</strong> the previous two methods. The UV SCF would measure the relative spectral responsivity over a wide<br />
wavelength range, then the SIRCUS facility would measure a relatively small number <strong>of</strong> “tie” points at selected<br />
wavelengths in the center <strong>of</strong> the irradiance meter b<strong>and</strong>pass, in the tails, <strong>and</strong> in the “cut-<strong>of</strong>f” regions. Measurements<br />
using this method would benefit from the lower uncertainties <strong>of</strong> the SIRCUS facility measurements <strong>and</strong> the broad<br />
spectral coverage <strong>of</strong> the UV SCF all within a fraction <strong>of</strong> the time required by the first two methods discussed here.<br />
V. CONCLUSION<br />
<strong>NIST</strong> can provide 365 nm irradiance meter spectral responsivity measurements to support a variety <strong>of</strong> industrial <strong>and</strong><br />
laboratory applications using either a monochromator-based facility or tunable laser <strong>and</strong> integrating sphere facility. The<br />
agreement between these two fundamentally different methods in this first reported comparison is 1 % to 2 % in the<br />
peak portion <strong>of</strong> the b<strong>and</strong>pass curves which is comparable to their exp<strong>and</strong>ed (k = 2) uncertainties. The SIRCUS<br />
uncertainties are lower than the UV SCF with the potential for 0.1 % uncertainties in the future. This will greatly<br />
reduce the calibration uncertainties <strong>NIST</strong> provides for UV irradiance meters in the future.<br />
References<br />
[1] T. C. Larason, S. S. Bruce, <strong>and</strong> A. C. Parr, Spectroradiometric Detector Measurements: Part I - Ultraviolet Detectors <strong>and</strong> Part II<br />
- Visible to Near-Infrared Detectors, Natl. Inst. St<strong>and</strong>. Technol., Spec. Publ. 250-41, U.S. Government Printing Office,<br />
Washington, D.C., 1998.<br />
[2] S. W. Brown, G. P. Eppeldauer, <strong>and</strong> K. R. Lykke, “<strong>NIST</strong> Facility for Spectral Irradiance <strong>and</strong> Radiance Response Calibrations<br />
with a Uniform Source,” Metrologia, vol. 37, pp. 579-582, 2000.<br />
[3] C. A. Schrama <strong>and</strong> H. Reijn, “Novel calibration method for filter radiometers,” Metrologia, vol. 36, pp. 179-182, 1999.<br />
[4] T. M. Hunt, N. P. Fox, W. S. Hartree, <strong>and</strong> N. M. Durant, “Evaluating the performance <strong>of</strong> filter radiometers as a means <strong>of</strong><br />
improving the uncertainty <strong>of</strong> ultraviolet measurements,” Metrologia, vol. 35, pp. 345-351, 1998.<br />
[5] J. M. Bridges <strong>and</strong> C. L. Cromer, “Final Report on Calibration <strong>and</strong> Characterization <strong>of</strong> I-Line Exposure Meters,” SEMATECH,<br />
2706 Montopolis Drive, Austin, TX 78741, SEMATECH Report 91090678A-ENG, October 17, 1991.<br />
[6] C. L. Cromer, G. Eppeldauer, J. E. Hardis, T. C. Larason, Y. Ohno, <strong>and</strong> A. C. Parr, “The <strong>NIST</strong> detector-based luminous<br />
intensity scale,” J. Res. Natl. Inst. St<strong>and</strong>. Technol., vol. 101, pp. 109-132, 1996.<br />
[7] G. P. Eppeldauer, M. Racz, <strong>and</strong> T. C. Larason, “Optical Characterization <strong>of</strong> Diffuser-Input St<strong>and</strong>ard Irradiance Meters,” in Proc.<br />
Int. Soc. Opt. Eng., vol. 3573, pp. 220-224, 1998.<br />
Page 5
Abstract<br />
Realization <strong>of</strong> a spectral radiance responsivity scale<br />
with a laser-based source <strong>and</strong> Si radiance meters<br />
George P. Eppeldauer, Steven W. Brown, Thomas C. Larason, Miklos Racz * , <strong>and</strong> Keith R. Lykke<br />
<strong>National</strong> <strong>Institute</strong> <strong>of</strong> <strong>St<strong>and</strong>ards</strong> <strong>and</strong> Technology<br />
Optical Technology Division<br />
Gaithersburg, Maryl<strong>and</strong> 20899<br />
* Guest researcher from the Hungarian Academy <strong>of</strong> Sciences<br />
Research <strong>Institute</strong> for <strong>Technical</strong> Physics <strong>and</strong> Materials Science<br />
Principal Contact: George P. Eppeldauer<br />
Phone: 301-975-2338; Fax: 301-869-5700<br />
Email: geppeldauer@nist.gov<br />
A spectral radiance responsivity (SRR) scale derived from the spectral irradiance responsivity scale has been<br />
realized on the newly developed <strong>NIST</strong> facility for Spectral Irradiance <strong>and</strong> Radiance Responsivity Calibrations with<br />
Uniform Sources (SIRCUS). The scales were directly derived from the primary st<strong>and</strong>ard cryogenic radiometer<br />
using transfer st<strong>and</strong>ard irradiance trap detectors <strong>and</strong> laser-based uniform sources. <strong>St<strong>and</strong>ards</strong> quality silicon radiance<br />
meters have been developed to hold the SRR scale. The radiance meters were characterized <strong>and</strong> optimized for size-<br />
<strong>of</strong>-source effects. The optimized meters were calibrated for SRR against the monochromatic uniform source. In<br />
addition to the SIRCUS calibrations, preliminary tests were made on the Spectral Comparator Facility (SCF) <strong>of</strong><br />
<strong>NIST</strong> as well. These relative SRR tests were made in both imaging <strong>and</strong> non-imaging measurement modes. The<br />
results <strong>of</strong> the different SRR calibrations are compared <strong>and</strong> evaluated.
1. Introduction<br />
The high accuracy <strong>of</strong> primary st<strong>and</strong>ard cryogenic radiometers [1] can be utilized only if improved quality<br />
radiometers are developed <strong>and</strong> calibrated directly against the primary st<strong>and</strong>ard. To achieve this goal, we are<br />
developing a reference (high accuracy) spectral irradiance <strong>and</strong> radiance responsivity calibration facility [2]. This<br />
facility utilizes uniform sources using integrating spheres <strong>and</strong> lasers [3, 4, 5] to obtain lower scale uncertainties<br />
compared to traditional monochromators [6]. This paper describes how the irradiance responsivity scale is<br />
propagated to the radiance responsivity scale on SIRCUS. Design <strong>and</strong> the basic radiometric characterizations <strong>of</strong> a<br />
broad-b<strong>and</strong> working st<strong>and</strong>ard Si radiance meter is discussed. This high performance radiance meter will hold the<br />
high accuracy SRR scale. Arrangements <strong>and</strong> considerations are discussed for accurate relative <strong>and</strong> absolute SRR<br />
measurements.<br />
2. Radiance responsivity scale derivation<br />
Figure 1 shows the scale propagation from the <strong>NIST</strong> High Accuracy Cryogenic Radiometer (HACR) to the SRR<br />
scale level. Si trap detectors are calibrated against the HACR at several laser lines. The response interpolation is<br />
done between 406 nm <strong>and</strong> 920 nm based on the physical model <strong>of</strong> the Hamamatsu 1337 Si photodiodes [7, 8]. The<br />
aperture area in front <strong>of</strong> the trap detector is measured with high accuracy using point source geometry [9]. The<br />
irradiance responsivity <strong>of</strong> the transfer st<strong>and</strong>ard Si trap detector is equal to its power responsivity times the aperture<br />
area.<br />
The SRR scale is derived from the spectral irradiance responsivity scale. First, the radiant intensity <strong>of</strong> the uniform<br />
source is determined from the detector irradiance responsivity <strong>and</strong> the distance between detector <strong>and</strong> source<br />
apertures. In this case, the distance is large (about 1 m), therefore the source is used as a point source. The radiance<br />
within the source aperture (at a laser wavelength) is the ratio <strong>of</strong> the radiant intensity to the source aperture area.<br />
When calibrating the radiance meter against the Lambertian (uniform) source, its target area (the measured spot) has
to be within the source aperture (<strong>of</strong> 5 cm diameter). The radiance responsivity <strong>of</strong> the meter is the ratio <strong>of</strong> its<br />
electrical output signal to the measured source radiance.<br />
3. Si radiance meter design<br />
HACR<br />
Radiant Power P(λ) [W]<br />
Irradiance<br />
Transfer St<strong>and</strong>ard<br />
Spectral Irradiance Responsivity<br />
output current/E(λ) [A*m2 /W]<br />
SIRCUS<br />
Spectral Irradiance Responsivity<br />
Calibrations<br />
sourcedetector<br />
distance D<br />
Spectral Radiant Intensity<br />
I(λ)=E(λ)*D2 [W/sr]<br />
Spectral Radiance L(λ)<br />
Radiance<br />
detector<br />
Spectral Radiance Responsivity<br />
output current/L(λ) [A*m 2 sr/W]<br />
Figure 1. SRR scale derivation.<br />
detector<br />
aperture<br />
area<br />
source<br />
aperture<br />
area<br />
Figure 2 shows the design <strong>of</strong> the transfer st<strong>and</strong>ard Si radiance meter. The input optics are attached to the radiometer<br />
base unit. A beveled aperture in the mirror serves as a field stop <strong>and</strong> it is positioned into the focus <strong>of</strong> the camera
lens. The surroundings <strong>of</strong> the source target area can be viewed through the eye-piece. The target radiation is imaged<br />
to the center <strong>of</strong> the Si photodiode through a second imaging optics producing a well defined field-<strong>of</strong>-view (FOV)<br />
<strong>and</strong> a very efficient out-<strong>of</strong>-target blocking. The aperture stop in front <strong>of</strong> the second imaging system keeps the flux<br />
response <strong>of</strong> the optics constant for different target distance (lens focus) adjustments. In order to eliminate<br />
interferences, we replaced the original plane-parallel window <strong>of</strong> the Si photodiode with a ground glass diffuser <strong>of</strong><br />
high transmittance.<br />
4. Characterization <strong>of</strong> the Si radiance meter<br />
Figure 3 shows the angular responsivity <strong>of</strong> the Si radiance meter. The measured source was a 1000 W tungsten<br />
halogen lamp equipped with a 5 mm aperture 4 cm away from the lamp. The distance between the radiometer <strong>and</strong><br />
the source aperture was about 2.5 m. The radiometer was rotated in the horizontal plane around a pivot point in the<br />
center <strong>of</strong> its camera lens. This scan was repeated after a 90° rotation <strong>of</strong> the radiometer around its axis to obtain the<br />
angular responsivity in the perpendicular (vertical) plane as well. The radiance measurement angle is 0.6° (FWHM)<br />
<strong>and</strong> the out-<strong>of</strong>-target blocking (the signal at zero rotation angle ratioed to the signals at different rotation angles) is 2<br />
x 10 3 at 0.5°, 10 4 at 1.5° <strong>and</strong> higher than 10 5 at 5°. The vertical <strong>and</strong> horizontal scans resulted in similar results
CAMERA LENS<br />
EYEPIECE<br />
Relative signal<br />
FIELD<br />
STOP<br />
MIRROR<br />
1.2<br />
1<br />
0.8<br />
0.6<br />
0.4<br />
0.2<br />
APERTURE<br />
STOP<br />
SECOND<br />
IMAGING<br />
SYSTEM<br />
ADAPTERS<br />
Figure 2. Working st<strong>and</strong>ard Si radiance meter.<br />
TEMPERATURE<br />
CONTROLLED<br />
BLOCK<br />
GROUND<br />
GLASS<br />
DIFFUSER<br />
0<br />
-4 -3 -2 -1 0 1 2 3 4<br />
Angle <strong>of</strong> rotation [degree]<br />
10 0<br />
10 -1<br />
10 -2<br />
10 -3<br />
10 -4<br />
10 -5<br />
ELECTRONIC<br />
UNIT<br />
WINDOWLESS<br />
SILICON<br />
PHOTODIODE<br />
Figure 3. Angular responsivity <strong>of</strong> the Si radiance meter. Horizontal response (dashed line, logarithmic scale)<br />
Relative signal
5. Absolute spectral radiance responsivity<br />
<strong>and</strong> vertical response (solid line, linear scale)<br />
The absolute SRR was measured on the SIRCUS using a 20 cm diameter Spectralon [8] coated integrating sphere.<br />
The sphere was irradiated by 98 laser lines <strong>of</strong> different wavelengths between 400 nm <strong>and</strong> 920 nm. The<br />
measurement steps followed the scale derivation chart in Figure 1. The solid line in Figure 5 shows the absolute<br />
SRR <strong>of</strong> the working st<strong>and</strong>ard radiance meter.<br />
6. Uncertainties<br />
The uncertainty budget <strong>of</strong> the SIRCUS radiance responsivity calibrations is summarized in Table 1. Type A <strong>and</strong><br />
Type B uncertainties [10] are shown for both the present (preliminary) <strong>and</strong> future calibrations. The source radiance<br />
uncertainties are separated from the uncertainties <strong>of</strong> the radiance transfer to test radiance meters. We plan to<br />
decrease the present (uncorrected) relative combined st<strong>and</strong>ard uncertainty (k=1) <strong>of</strong> 0.21 % to about 0.05 % after<br />
improving the uncertainties as indicated in the Table.<br />
7. Relative spectral radiance responsivity comparison to the SCF<br />
Independent relative SRR measurements were made on the SCF. We made two preliminary tests only with two<br />
different beam geometries. The first one was a simple, non-imaging method which can be used for high quality<br />
radiance meters where a second imaging optics projects the beam always into the same position on the detector. In<br />
this case, the target spot <strong>of</strong> the radiance meter was not defined. These test results are shown in Figure 5 (non-imaged<br />
SCF curves). With normalization at 705 nm, the obtained relative radiance responsivity curve agrees with the<br />
results <strong>of</strong> the absolute (SIRCUS) radiance responsivity measurements within 1 % between 475 nm <strong>and</strong> 920 nm. The<br />
repeatability uncertainty was equal to or less than 0.25 % from three relative spectral responsivity scans made with<br />
different (repeated) alignments. The relative st<strong>and</strong>ard uncertainties (k=1) <strong>of</strong> the SCF measurements are 0.78 % at
400 nm <strong>and</strong> 0.11 % from 450 nm to 900 nm in power responsivity mode [6] <strong>and</strong> 0.94 % at 400 nm <strong>and</strong> almost<br />
constant at 0.54 % in the visible up to 925 nm in irradiance responsivity mode [11].<br />
Table 1<br />
Relative combined st<strong>and</strong>ard uncertainty (k=1) <strong>of</strong> the SIRCUS present radiance responsivity calibrations [%]<br />
(future calibration uncertainties are shown with italic)<br />
⎯⎯⎯⎯⎯⎯⎯⎯⎯⎯⎯⎯⎯⎯⎯⎯⎯⎯⎯⎯⎯⎯⎯⎯⎯⎯⎯⎯⎯⎯⎯⎯⎯⎯⎯⎯⎯⎯⎯⎯⎯⎯⎯⎯⎯⎯<br />
Present measurements Planned (future) measurements<br />
Uncertainty origin Type A Type B Type A Type B<br />
Source radiance:<br />
Trap spectral power responsivity 0.03 0.02<br />
Trap aperture area 0.01 0.01<br />
Source to Trap distance squared 0.05 0.02<br />
Trap repeatibilty 0.05 0.02<br />
Source aperture area 0.04 0.02<br />
Amplifier gain 0.04 0.02<br />
Radiance transfer to test detector:<br />
Source spatial radiance nonuniformity<br />
(uncorrected) 0.1<br />
(corrected) 0.02 0.01<br />
Test detector repeatability 0.05 0.01<br />
Test detector size-<strong>of</strong>-source effect<br />
(uncorrected) 0.15<br />
(corrected) 0.02 0.01<br />
Amplifier gain 0.04 0.02<br />
⎯⎯⎯⎯⎯⎯⎯⎯⎯⎯⎯⎯⎯⎯⎯⎯⎯⎯⎯⎯⎯⎯⎯⎯⎯⎯⎯⎯⎯⎯⎯⎯⎯⎯⎯⎯⎯⎯⎯⎯⎯⎯⎯⎯⎯⎯<br />
Relative combined st<strong>and</strong>ard uncertainty:<br />
(uncorrected) 0.21<br />
(corrected) 0.12 0.054<br />
Because the non-imaging method is not correct for radiance responsivity measurements, we are suggesting here an<br />
imaging type test method. We made a preliminary test using this second method where the st<strong>and</strong>ard arrangement <strong>of</strong><br />
the SCF was modified to measure simple radiance meters where the detector may have spatially non-uniform<br />
responsivity <strong>and</strong> no second imaging optics are used. The modification is shown in Figure 4. The f/9 converging<br />
beam from the monochromator, before the two lenses, produces a 1.1 mm diameter spot (which is on the surface <strong>of</strong><br />
the power measuring detector in the st<strong>and</strong>ard SCF arrangement). In the modification, a camera lens <strong>of</strong> 35 mm focal<br />
length is used as a relay lens to magnify this spot into a 15 mm diameter image, inside <strong>of</strong> an achromatic collector<br />
lens <strong>of</strong> 350 mm focal length. The corrected lens collects the radiation exiting from the relay lens <strong>and</strong> projects it into<br />
the center <strong>of</strong> the camera lens <strong>of</strong> the radiance meter. The distance <strong>of</strong> the radiance meter from the collector lens has to
e adjusted until the diameter <strong>of</strong> the target spot <strong>of</strong> the radiance meter is equal to the diameter <strong>of</strong> the reference<br />
detector which is positioned directly after the collector lens. The reference detector has to be circular (e.g. a 1 cm 2<br />
silicon detector). In the eyepiece <strong>of</strong> the radiance meter, the black (measured) spot has to be in the center <strong>of</strong> the 15<br />
mm diameter image inside <strong>of</strong> the collector lens. The relative radiance responsivity <strong>of</strong> the meter will be the power<br />
responsivity <strong>of</strong> the reference detector times the ratio <strong>of</strong> the radiance meter output signal to the output signal <strong>of</strong> the<br />
reference detector.<br />
Figure 4. Optical arrangement for radiance meter relative responsivity measurement.<br />
In our preliminary test, an 18 mm by 18 mm reference Si detector was used <strong>and</strong> the above described target-spot <strong>and</strong><br />
detector-diameter match was not achieved. Because <strong>of</strong> lens chromatic abberations, the size <strong>of</strong> the magnified spot<br />
inside <strong>of</strong> the collector lens was wavelength dependent. The lenses were optimized for the visible range. Also, the<br />
irradiance distribution within the monochromator output spot depends on the wavelength. These problems caused<br />
relatively large uncertainties for wavelenghts shorter than 420 nm. In Figure 5, where the radiance responsivity<br />
measurement results are summarized, the normalization was made at 705 nm, the peak responsivity <strong>of</strong> the<br />
photodiode, resulting in about 2.5 % discrepancy (relative to the absolute radiance reponsivity) at 450 nm (imaged<br />
SCF curves).<br />
The two relative radiance responsivity curves are different not only because <strong>of</strong> the non-optimized arrangement <strong>of</strong><br />
the imaged SCF measurements (as mentioned above), but also because the transmittance <strong>of</strong> the anti-reflecting<br />
coating can be different for the different incident angles <strong>of</strong> the two cases. A systematic relative radiance<br />
responsivity uncertainty was measured at 420 nm. This problem, which requires further examination, significantly
increased the responsivity deviation <strong>of</strong> the non-imaged SCF measurements relative to the SIRCUS results for<br />
wavelengths shorter than 475 nm.<br />
Radiance responsivity [A mm 2 sr/W]<br />
4 10 -4<br />
3 10 -4<br />
2 10 -4<br />
1 10 -4<br />
0 10 0<br />
Non-imaged SCF<br />
SIRCUS<br />
Imaged SCF<br />
500 600 700 800 900<br />
Wavelength [nm]<br />
Figure 5. SRR <strong>of</strong> the <strong>NIST</strong> Radiance Meter #303. The relative radiance responsivity curves were measured on the<br />
SCF in both imaging <strong>and</strong> non-imaging modes <strong>and</strong> normalized to the absolute responsivity as measured on the<br />
SIRCUS. The normalizations were made at 705 nm. The responsivity ratios are shown relative to the SIRCUS<br />
results.<br />
8. Conclusion<br />
SRR calibrations were performed on the preliminary SIRCUS facility. The 0.21 % relative combined st<strong>and</strong>ard<br />
uncertainty (k=1) <strong>of</strong> the first radiance responsivity measurements (which is 3-4 times better than the SCF irradiance<br />
responsivity uncertainty in the same wavelength range) showed the dominating uncertainty components. We could<br />
1.06<br />
1.04<br />
1.02<br />
1<br />
0.98<br />
0.96<br />
SCF/SIRCUS
also estimate the achievable uncertainties <strong>and</strong> the necessary improvements (finalization) <strong>of</strong> the facility. Comparison<br />
<strong>of</strong> the SIRCUS responsivity measurements to the traditional monochromator based SCF measurements showed that<br />
systematic errors in the SCF SRR measurements can be verified. The SIRCUS, with the final control <strong>and</strong><br />
measurement system, including a variety <strong>of</strong> transfer- <strong>and</strong> working-st<strong>and</strong>ard radiometers <strong>and</strong> improved correction<br />
<strong>and</strong> calibration procedures, will serve as a high accuracy reference calibration facility for radiometry, photometry,<br />
<strong>and</strong> colorimetry.<br />
9. Acknowledgements<br />
The authors thank the Air Force Metrology for funding this project.<br />
References<br />
[1] T.R. Gentile, J.M. Houston, J.E. Hardis, C.L. Cromer, <strong>and</strong> A.C. Parr, “<strong>National</strong> <strong>Institute</strong> <strong>of</strong> <strong>St<strong>and</strong>ards</strong> <strong>and</strong><br />
Technology high accuracy cryogenic radiometer,” Appl. Opt. 35 (7), 1056-1068, 1996.<br />
[2] S.W. Brown, G.P. Eppeldauer, <strong>and</strong> K.R. Lykke, “<strong>NIST</strong> Facility for Spectral Irradiance <strong>and</strong> Radiance Response<br />
Calibrations with a Uniform Source,” Newrad’99, Madrid, Spain.<br />
[3] K.R. Lykke, P.S. Shaw, L.M. Hanssen, <strong>and</strong> G.P. Eppeldauer, “ Development <strong>of</strong> a Monochromatic Uniform<br />
Source Facility for Calibration <strong>of</strong> Radiance <strong>and</strong> Irradiance Detectors from 0.2 µm to 12 µm,” Metrologia, 36, p.<br />
141-146, 1999.<br />
[4] K.D. Mielenz, R.D. Saunders, <strong>and</strong> J.B. Shumaker, “Spectroradiometric determination <strong>of</strong> the freezing<br />
temperature <strong>of</strong> gold,” J. Res. Natl. St<strong>and</strong>. Technol. 95, 49-67, 1990.<br />
[5] V.E. Anderson, N.P. Fox, <strong>and</strong> D.H. Nettleton, “Highly stable, monochromatic <strong>and</strong> tunable optical radiation<br />
source <strong>and</strong> its application to high accuracy spectrophotometry,” Applied Optics, 31, No. 4, 536-545, 1992.
[6] T.C. Larason, S.S. Bruce, A.C. Parr, “Spectroradiometric Detector Measurements: Part I-Ultraviolet Detectors<br />
<strong>and</strong> Part II-Visible to Near-Infrared Detectors,” <strong>National</strong> <strong>Institute</strong> <strong>of</strong> <strong>St<strong>and</strong>ards</strong> <strong>and</strong> Technology Special<br />
Publication 250-41, 1998.<br />
[7] T.R. Gentile, J.M. Houston, <strong>and</strong> C.L. Cromer, “Realization <strong>of</strong> a scale <strong>of</strong> absolute spectral response using the<br />
<strong>National</strong> <strong>Institute</strong> <strong>of</strong> <strong>St<strong>and</strong>ards</strong> <strong>and</strong> Technology high-accuracy cryogenic radiometer,” Appl. Opt. 35, No. 22,<br />
4392-4403, 1996.<br />
[8] Identification <strong>of</strong> commercial equipment to specify adequately an experimental problem does not imply<br />
recommendation or endorsement by the <strong>National</strong> <strong>Institute</strong> <strong>of</strong> <strong>St<strong>and</strong>ards</strong> <strong>and</strong> Technology nor does it imply that<br />
the equipment identified is necessarily the best available for the purpose.<br />
[9] J.B. Fowler, R.S. Durvasula, <strong>and</strong> A.C. Parr, “High-accuracy aperture-area measurement facilities at the<br />
<strong>National</strong> <strong>Institute</strong> <strong>of</strong> <strong>St<strong>and</strong>ards</strong> <strong>and</strong> Technology,” Metrologia, 35, No. 4. 497-500, 1998.<br />
[10] B.N. Taylor <strong>and</strong> C.E. Kuyatt, “Guidelines for Evaluating <strong>and</strong> Expressing the Uncertainty <strong>of</strong> <strong>NIST</strong> Measurement<br />
Results,” Natl. Inst. St<strong>and</strong>. Technol., Tech. <strong>Note</strong> 1297, 1994.<br />
[11] G. Eppeldauer, M Racz, <strong>and</strong> T. Larason, “Optical characterization <strong>of</strong> diffuser-input st<strong>and</strong>ard irradiance meters,”<br />
SPIE 3573, 220-224, 1998.
Eppeldauer, et al. Spectral responsivity measurements<br />
UNCERTAINTIES OF SPECTRAL RESPONSIVITY MEASUREMENTS<br />
ABSTRACT<br />
G. P. Eppeldauer, G. Sauter 1 , <strong>and</strong> J. L. Gardner 2<br />
<strong>National</strong> <strong>Institute</strong> <strong>of</strong> <strong>St<strong>and</strong>ards</strong> <strong>and</strong> Technology<br />
Gaithersburg, Maryl<strong>and</strong>, USA<br />
1 PTB, Braunschweig, Germany<br />
2 <strong>National</strong> Measurement <strong>Institute</strong>, Lindfield, Australia<br />
Uncertainty estimates <strong>of</strong> detector spectral<br />
responsivity measurements are discussed.<br />
A model describes independent<br />
(uncorrelated) uncertainty components at a<br />
given wavelength based on the measurement<br />
equation for test detector calibrations.<br />
Systematic (correlated) components across<br />
wavelength are described briefly for spectrally<br />
integrated responsivity measurements.<br />
Propagation <strong>of</strong> the r<strong>and</strong>om <strong>and</strong> systematic<br />
components is discussed.<br />
1. INTRODUCTION<br />
The uncertainty analysis <strong>of</strong> spectral responsivity<br />
measurements should follow the<br />
“Guide to the Expression <strong>of</strong> Uncertainty in<br />
Measurement” (GUM) [1]. A <strong>Technical</strong> Report<br />
within the TC2-48 <strong>Technical</strong> Committee<br />
<strong>of</strong> the International Committee on Illumination<br />
(CIE) is being prepared to make recommendations<br />
for spectral responsivity<br />
measurements <strong>of</strong> detectors, radiometers,<br />
<strong>and</strong> photometers. The goal <strong>of</strong> the present<br />
work is to prepare a chapter for the CIE<br />
TC2-48 <strong>Technical</strong> Report on the uncertainty<br />
determination <strong>of</strong> spectral responsivity measurements<br />
using the GUM recommendations.<br />
Starting with the measurement equation,<br />
a model is described to evaluate the radiant<br />
power responsivity determination <strong>of</strong> a test<br />
detector at a given wavelength. Uncertainty<br />
in the measured value arises from the uncertainty<br />
<strong>of</strong> the spectral responsivity <strong>of</strong> the<br />
st<strong>and</strong>ard (reference) detector, <strong>and</strong> from uncertainties<br />
in the elements <strong>of</strong> the correction<br />
factor used to evaluate the radiant power<br />
responsivity <strong>of</strong> the test detector from the<br />
measurement (calibration) transfer. Following<br />
the description <strong>of</strong> contributions that are<br />
independent <strong>of</strong> wavelength, systematic (correlated)<br />
uncertainty components in the reference<br />
detector are described <strong>and</strong> propaga-<br />
tion <strong>of</strong> the components will be discussed for<br />
spectrally integrated measurements.<br />
2. THE MEASUREMENT PROCESS<br />
The relative st<strong>and</strong>ard uncertainty <strong>of</strong><br />
spectral responsivity values can be derived<br />
from the measurement equation <strong>of</strong> the detector<br />
substitution method. The substitution<br />
method transfers the radiometric responsivity<br />
<strong>of</strong> a st<strong>and</strong>ard detector to a test detector<br />
that has similar properties to the st<strong>and</strong>ard<br />
detector. When the st<strong>and</strong>ard detector measures<br />
the constant input flux (the total radiant<br />
power in the incident beam) Φ, its output<br />
signal IS is:<br />
I s ⋅Φ<br />
(1)<br />
S<br />
= S<br />
where s S is the known responsivity <strong>of</strong> the<br />
st<strong>and</strong>ard detector. In the following step, the<br />
test detector is substituted for the st<strong>and</strong>ard<br />
detector <strong>and</strong> measures the same radiant<br />
power in the same arrangement:<br />
I s ⋅Φ<br />
(2)<br />
T = T<br />
where IT<br />
is the output signal <strong>of</strong> the test detector<br />
<strong>and</strong> sT<br />
is the unknown radiant power<br />
responsivity <strong>of</strong> the test detector that can be<br />
calculated from Eqs. ( 1) <strong>and</strong> (2):<br />
IT<br />
sT = sS<br />
⋅<br />
(3)<br />
I<br />
When a monitor detector is used to decrease<br />
fluctuations in the radiant power, the<br />
modified measurement equation will be:<br />
IT<br />
IMT<br />
RT<br />
sT = sS<br />
⋅ = sS<br />
⋅<br />
(4)<br />
I I R<br />
S<br />
MS<br />
where instead <strong>of</strong> the electrical output signals<br />
IT,<br />
IS<br />
their ratios to the simultaneously<br />
measured monitor output signals IMT,<br />
IMS<br />
are used: R T = IT<br />
IMT<br />
, RS<br />
= IS<br />
IMS<br />
.<br />
S<br />
S
3. MODEL AT A GIVEN WAVELENGTH<br />
In Eq. (4) the radiant power responsivity <strong>of</strong><br />
the test detector is calculated as a product<br />
<strong>of</strong> at least three factors. If we ignore the<br />
measurement errors <strong>of</strong> the electrical signals,<br />
the relative st<strong>and</strong>ard uncertainty in the spectral<br />
radiant power responsivity <strong>of</strong> the test<br />
detector can be written as<br />
rel<br />
[ ] 2 / 1<br />
2<br />
2<br />
2<br />
( s ) u ( s ) + u ( R ) u ( R )<br />
u = +<br />
(5)<br />
T<br />
rel<br />
S<br />
rel<br />
In the brackets, the first contribution is the<br />
relative st<strong>and</strong>ard measurement uncertainty<br />
calculated from the certificate <strong>of</strong> the reference<br />
detector <strong>and</strong> the operational conditions<br />
during transfer. The other two contributions<br />
come from the measurement transfer.<br />
<strong>Note</strong> that at present, calibration certificates<br />
do not report correlation coefficients or uncorrelated<br />
<strong>and</strong> correlated components separately.<br />
While measurements at the one<br />
wavelength do not depend on these correlations,<br />
they become important when combining<br />
values at different wavelengths in spectrally<br />
integrated components; this is discussed<br />
in Section 4 below.<br />
The effective radiant power responsivity sS<br />
<strong>of</strong> the reference detector requires a small<br />
correction for a possible temperature deviation<br />
∆T<br />
(relative to the temperature during<br />
calibration), <strong>and</strong> for a relative nonuniformity<br />
β :<br />
S<br />
S = sS′<br />
⋅ ( 1 + α S ⋅ ∆T<br />
+ βS<br />
)<br />
s (6)<br />
where αS is the relative temperature coefficient<br />
for the responsivity. The relative st<strong>and</strong>ard<br />
measurement uncertainty <strong>of</strong> the radiant<br />
power responsivity s′ S <strong>of</strong> the reference detector<br />
is calculated from the exp<strong>and</strong>ed<br />
measurement uncertainty U sS′<br />
<strong>and</strong> the<br />
coverage factor k given in the calibra-<br />
( = 2)<br />
T<br />
rel<br />
( )<br />
tion certificate when the responsivity s′ S was<br />
measured at temperature TC<br />
<strong>and</strong> is given by<br />
rel<br />
( s ) = U(<br />
s′<br />
) ( 2s )<br />
u ′ ′ . (7)<br />
S<br />
S<br />
S<br />
The temperature deviation ∆ T = TS<br />
−TC<br />
is<br />
calculated from the temperature TC<br />
(nominal<br />
value, no uncertainty contribution) <strong>and</strong><br />
the measured ambient temperature TS<br />
during<br />
use. Often the st<strong>and</strong>ard deviation s ( TS<br />
)<br />
<strong>of</strong> repeated thermometer readings is smaller<br />
S<br />
than its resolution, which is an interval<br />
± res(<br />
TS<br />
) with rectangular probability distribution.<br />
The temperature is measured with<br />
the thermometer certified with an (absolute)<br />
exp<strong>and</strong>ed measurement uncertainty<br />
U T = δ k = 2 coverage interval<br />
( ) T<br />
S for a ( )<br />
<strong>and</strong> gives the st<strong>and</strong>ard variance ( ) 2<br />
T 2<br />
δ .<br />
The st<strong>and</strong>ard variance <strong>of</strong> the temperature<br />
deviation from the three contributions is:<br />
2<br />
2 ⎛ δT<br />
⎞ 2 res<br />
u ( ∆T<br />
) = ⎜ ⎟ + s ( TS<br />
) +<br />
⎝ 2 ⎠<br />
3<br />
2<br />
( T )<br />
S<br />
(8)<br />
The relative temperature coefficient α S is<br />
measured separately <strong>and</strong> the value can be<br />
determined with an associated relative st<strong>and</strong>ard<br />
measurement uncertainty u ( α S ) or<br />
taken from the related literature.<br />
Finally, the relative non-uniformity β S has a<br />
zero value (it is included in the responsivity<br />
value) but its variation contributes to the re-<br />
sponsivity measurement uncertainty within<br />
an interval ± ∆sS<br />
, having a rectangular probability<br />
distribution. Therefore, the st<strong>and</strong>ard<br />
2<br />
2<br />
variance is calculated as u ( β ) = ∆s<br />
3 .<br />
After these preparations <strong>and</strong> the two assumptions<br />
1 >> α S ⋅ ∆T<br />
+ β S <strong>and</strong> no correlations<br />
between the quantities, the relative<br />
combined variance associated to the responsivity<br />
<strong>of</strong> the st<strong>and</strong>ard detector can be<br />
written:<br />
2<br />
2<br />
2<br />
2 2<br />
urel<br />
( sS<br />
) = urel<br />
( sS′<br />
) + u ( β S ) + α S ⋅ u ( ∆T<br />
) +<br />
2<br />
u α ⋅ ∆T<br />
(9)<br />
2 ( S )<br />
If the temperature at the time <strong>of</strong> measurement<br />
is the same as that at the time <strong>of</strong> calibration,<br />
∆T = 0 . In this case, from second<br />
2<br />
order terms, the factor ∆ T has to be replaced<br />
by the associated st<strong>and</strong>ard variance<br />
2<br />
u ( ∆T<br />
) .<br />
For the test detector, similar contributions<br />
have to be taken into consideration. The<br />
corrected value <strong>of</strong> the radiant power responsivity<br />
s′ T <strong>of</strong> the test detector can be calcu-<br />
lated for the ambient temperature TC<br />
<strong>and</strong><br />
for zero contribution <strong>of</strong> its own nonuniformity:<br />
( + α ⋅ ∆ + )<br />
s ′<br />
(10)<br />
T = sT<br />
⋅ 1 T T β T<br />
S<br />
S
Similarly to the considerations before, the<br />
associated relative st<strong>and</strong>ard measurement<br />
uncertainty <strong>of</strong> sT can be determined assuming<br />
small corrections 1 >> α T ⋅ ∆T<br />
+ β T <strong>and</strong><br />
no correlation. Then the relative variance<br />
can be written:<br />
2<br />
2<br />
2<br />
2 2<br />
urel<br />
( sT<br />
) = urel<br />
( sT′<br />
) + u ( β T ) + α T ⋅ u ( ∆T<br />
) +<br />
2<br />
u α ⋅ ∆T<br />
(11)<br />
( ) 2<br />
T<br />
The combination <strong>of</strong> Eq. (4) with the corrections<br />
in Eq. (6) <strong>and</strong> (10) give a new model<br />
for the radiant power responsivity evaluation:<br />
⎡1+<br />
α S ⋅ ∆T<br />
+ β S ⎤ I<br />
sT′ = sS′<br />
⋅ ⎢<br />
⎥ ⋅<br />
⎣1+<br />
α T ⋅ ∆T<br />
+ β T ⎦ I<br />
T<br />
S<br />
I<br />
I<br />
MT<br />
MS<br />
(12)<br />
<strong>and</strong> taking the earlier assumptions into account<br />
(first order approach), the bracket is<br />
simplified to [ 1+ ( α S − α T ) ⋅ ∆T<br />
+ β S − β T ] .<br />
This approach directly shows that for very<br />
similar test <strong>and</strong> reference detectors the temperature<br />
<strong>and</strong> spatial uniformity errors will<br />
cancel out.<br />
The four photocurrents in Eq. (12), also contribute<br />
to the measurement uncertainty. The<br />
assumptions for the photocurrent measurements<br />
are:<br />
A. The same amplifier <strong>and</strong> Digital Voltmeter<br />
(DVM) are used for both the test <strong>and</strong> reference<br />
detectors assuming that the gain <strong>and</strong><br />
range settings are valid for both photocurrents.<br />
B. With the test detector in place <strong>and</strong> shutter<br />
open, a series <strong>of</strong> n ≥ 20 repeated readings<br />
are taken simultaneously for both the test<br />
( ) <strong>and</strong> the monitor ( I′ ) detectors.<br />
I′ T<br />
MT<br />
C. With the above conditions (especially for<br />
the amplifier gain <strong>and</strong> DVM range) but with<br />
the shutter closed, “dark measurements”<br />
( I′ T0 , I′ MT0 ) are taken.<br />
D. With the reference detector in place <strong>and</strong><br />
shutter open, n repeated readings are<br />
taken simultaneously for both the reference<br />
( ) <strong>and</strong> monitor ( I′ ) detectors.<br />
I′ S<br />
MS<br />
E. Under the same conditions, but with the<br />
shutter closed, “dark measurements” ( I′ S0 ),<br />
( I′ MS0 ) are taken.<br />
Mean values like I′ T <strong>and</strong> its related st<strong>and</strong>ard<br />
deviations <strong>of</strong> the mean ( I )<br />
s ′ are calculated<br />
T<br />
for all the measured quantities <strong>and</strong> the two<br />
ratios: R T ′ = IT′<br />
IMT<br />
′ ; RS′<br />
= IS′<br />
IMS<br />
′ . In principle,<br />
instead <strong>of</strong> these ratios, the dark current<br />
corrected ratios should be averaged. However,<br />
if the dark current is small <strong>and</strong> the<br />
measurement setup is fairly stable, then the<br />
measurement uncertainty evaluation can be<br />
simplified:<br />
1 I′ − ′ T, i IT0, i ⎛ I′ ′ ⎞<br />
T0 IMT0<br />
R = ≈ ′<br />
T ∑ RT⋅⎜1−<br />
+ ⎟<br />
n i I′ − ′ ⎝ ′<br />
MT, i IMT0, i IT IMT<br />
⎠ ′<br />
(13)<br />
The ratio for the reference detector readings<br />
can be calculated similarly. Finally, the double<br />
ratio in Eq. (4) will be:<br />
R<br />
R<br />
T<br />
S<br />
R ⎛ T′<br />
I ′<br />
⎜ S0 ′ IT0<br />
′ I<br />
≈ ⋅<br />
⎜<br />
1+<br />
− +<br />
RS′<br />
⎝ IS′<br />
IT′<br />
I′<br />
MT0<br />
MT<br />
I′<br />
−<br />
I′<br />
MS0<br />
MS<br />
⎞<br />
⎟<br />
(14)<br />
⎠<br />
Usually, there are four contributions to the<br />
measurement uncertainty from a series <strong>of</strong><br />
repeated readings <strong>of</strong> a radiometer: the st<strong>and</strong>ard<br />
deviations <strong>of</strong> the two mean values for<br />
light <strong>and</strong> dark readings; the calibration factor,<br />
that cancels out in Eq.(14); <strong>and</strong> the resolution<br />
± ∆I<br />
<strong>of</strong> the DVM. For all photocurrents,<br />
the st<strong>and</strong>ard measurement uncertainties<br />
are calculated similarly:<br />
( ) ( ) ( ) 2<br />
2<br />
IS0<br />
= s IS0<br />
′ + I / 3<br />
u ′ ∆<br />
(15)<br />
If a common amplifier is used for both the<br />
st<strong>and</strong>ard <strong>and</strong> the test detectors, then the<br />
currents I S0,I ′ T0 ′ for dark (<strong>and</strong> <strong>of</strong>fset) measurements<br />
are the same, as are their measurement<br />
uncertainties. As they are determined<br />
in a series, one after the other, there<br />
is no statistical correlation, even if recorded<br />
by the same amplifier.<br />
Finally, the model to evaluate the radiant<br />
power responsivity <strong>of</strong> the test detector is<br />
calculated from the combination <strong>of</strong> Eqs. (12)<br />
<strong>and</strong> (14) with the higher orders omitted:<br />
RT′<br />
sT′<br />
= sS′<br />
⋅ ⋅ corr<br />
RS′<br />
⎡1<br />
+ ( α S − α T ) ⋅ ∆T<br />
+ β S − β T + ⎤ (16)<br />
⎢<br />
⎥<br />
corr = ⎢ IS0<br />
′ IT0<br />
′ IMT0<br />
′ IMS0<br />
′ ⎥<br />
⎢<br />
− + −<br />
⎥<br />
⎣ IS′<br />
IT′<br />
IMT<br />
′ IMS<br />
′ ⎦<br />
All the contributions in the brackets are very<br />
small corrections <strong>and</strong> the associated relative<br />
st<strong>and</strong>ard measurement uncertainty is <strong>of</strong>ten
negligible. In a reduced form, the relative<br />
st<strong>and</strong>ard measurement uncertainty associated<br />
to the radiant power responsivity is<br />
combined from four dominant contributions:<br />
2 2 2 2<br />
( ′ ) = ( ′ ) + ( ′ ) + ( ′ ) + ( )<br />
u s u s u R u R u corr<br />
rel T rel S rel T rel S rel<br />
(17)<br />
The principles in the measurement equation<br />
<strong>of</strong> Eq. (16) are valid for each single wavelength<br />
λ . Accordingly, all quantities are<br />
wavelength dependent:<br />
( λ)<br />
( λ)<br />
RT′<br />
s′ ( λ) = sS′<br />
( λ)<br />
⋅ ⋅ corr<br />
R′<br />
( λ)<br />
T (18)<br />
S<br />
The correction factor includes contributions<br />
(originating from the measurement transfer)<br />
from temperature deviation ∆T<br />
, relative<br />
temperature coefficient <strong>of</strong> responsivities<br />
α S,α T , relative spatial non-uniformity <strong>of</strong><br />
responsivities S T ,β β , <strong>and</strong> dark (<strong>of</strong>fset) currents<br />
I S0 ′ , IT0<br />
′ , IMT0<br />
′ , IMS0<br />
′ <strong>of</strong> the st<strong>and</strong>ard, test,<br />
<strong>and</strong> monitor detectors, all <strong>of</strong> which are independent<br />
<strong>of</strong> wavelength (or their changes are<br />
very small between neighbouring wavelengths<br />
where the measurement transfer is<br />
made).<br />
′ are formed from<br />
I T λ S with simultaneously<br />
measured monitor output signals<br />
I MT ( λ) , IMS<br />
( λ)<br />
using the correlation between<br />
the related photocurrents to eliminate noise<br />
from possible fluctuations <strong>of</strong> the source.<br />
Usually this is totally independent <strong>of</strong> wavelength.<br />
The ratios R T ( λ) , RS′<br />
( λ)<br />
output signals ( ) , I ( λ)<br />
Typically, the contributions for the determination<br />
<strong>of</strong> any single responsivity value <strong>and</strong><br />
the associated uncertainty, are uncorrelated<br />
(at the given wavelength where the measurement<br />
transfer is made). These significant<br />
independent uncertainty components are<br />
added in quadrature. In case <strong>of</strong> independent<br />
variables, their covariances are zero. The<br />
quadrature sum can be applied to all r<strong>and</strong>om<br />
components at a given wavelength.<br />
One component that may correlate the test<br />
<strong>and</strong> st<strong>and</strong>ard measurements is that <strong>of</strong> wavelength<br />
uncertainty. R<strong>and</strong>om wavelength setting<br />
errors are correlated between test <strong>and</strong><br />
st<strong>and</strong>ard measurements if the wavelength is<br />
set <strong>and</strong> the test <strong>and</strong> st<strong>and</strong>ard detectors<br />
measured; they are not correlated if the<br />
spectral range is swept independently for<br />
the test detector <strong>and</strong> st<strong>and</strong>ard detectors.<br />
4. SPECTRALLY INTEGRATED<br />
RESPONSIVITY<br />
The values representing the responsivity<br />
function s′ S ( λ)<br />
listed in a calibration certificate<br />
may be calculated from realizations<br />
totally independent for the different wavelengths.<br />
In this case, the uncertainty components<br />
may not be correlated. However in<br />
practice, the responsivity function <strong>of</strong> the reference<br />
detector – usually a trap detector<br />
calibrated with a laser beam at a limited<br />
number <strong>of</strong> wavelengths - is interpolated<br />
based on the physical knowledge (quantum<br />
efficiency) or mathematical smoothness <strong>and</strong><br />
results in correlations. Similarly, the responsivity<br />
functions <strong>of</strong> detectors, calibrated with a<br />
trap detector, are corrected by mathematical<br />
procedures for wavelength setting, for errors<br />
due to output slit function or to smooth the<br />
values from wavelength to wavelength. All<br />
these procedures produce function values<br />
with uncertainties that are correlated. The<br />
correlations do not affect the individual values<br />
but become important if spectrally integrated<br />
quantities are calculated. Calibration<br />
transfer from the primary st<strong>and</strong>ard radiometer<br />
can also introduce correlated uncertainties<br />
to a working reference st<strong>and</strong>ard, due to<br />
systematic <strong>of</strong>fsets or scaling factors common<br />
to all measurement wavelengths. Calibration<br />
certificates usually state the total<br />
uncertainty at a given wavelength <strong>and</strong> rarely<br />
distinguish between effects that are r<strong>and</strong>om<br />
<strong>and</strong> systematic (correlated) between wavelengths.<br />
At the highest level (primary or secondary<br />
calibration laboratory) measurements, when<br />
combining spectral values over different<br />
wavelengths, it is usually the systematic<br />
components that determine the measurement<br />
uncertainty. For example. in a photodiode<br />
radiant power responsivity calibration,<br />
such systematic components (at all wavelengths)<br />
are the absolute responsivity <strong>of</strong> the<br />
reference detector, repeatability with beam<br />
position, <strong>and</strong> photodiode amplifier gain.<br />
The integrated responsivity <strong>of</strong> a detector<br />
when it measures a broad-b<strong>and</strong> light-source<br />
can be written as
∑<br />
n<br />
n n<br />
(19)<br />
R = s P<br />
where Pn is the spectral power distribution <strong>of</strong><br />
the light-source <strong>and</strong> sn is the measured<br />
spectral power responsivity <strong>of</strong> the detector<br />
all at the nth (equally-spaced) wavelength.<br />
The detector is usually optically filtered to<br />
obtain a known spectral power responsivity<br />
function in a well defined wavelength interval.<br />
The relative uncertainty <strong>of</strong> R has to be calculated.<br />
Uncertainties in sn are independent<br />
<strong>of</strong> those in Pn <strong>and</strong> hence<br />
2 2 2 2 2<br />
u ( R) = ∑ ( sn u ( Pn) + Pn u ( sn)<br />
) (20)<br />
n<br />
Often the spectral distribution <strong>of</strong> the source<br />
is a defined quantity (e.g. CIE St<strong>and</strong>ard Illuminant<br />
A) <strong>and</strong> its values carry no uncertainty.<br />
In the following discussion we assume<br />
that source uncertainty is negligible; if<br />
required, the principles used to propagate<br />
uncertainties from the spectral responsivity<br />
values to that <strong>of</strong> the integrated response are<br />
identical for those <strong>of</strong> the source uncertainties.<br />
As seen in Eqs. (3) <strong>and</strong> (4), determination <strong>of</strong><br />
spectral responsivity is a transfer from a reference<br />
st<strong>and</strong>ard to the device under test,<br />
s = s t<br />
(21)<br />
Tn , Sn , n<br />
where n denotes wavelength <strong>and</strong> t is the<br />
transfer ratio at the nth wavelength. Uncertainties<br />
in spectral responsivity <strong>of</strong> the test<br />
detector arise from those <strong>of</strong> the st<strong>and</strong>ard<br />
<strong>and</strong> from the transfer process; these are<br />
treated independently <strong>and</strong> then added in<br />
quadrature.<br />
4.1 Uncertainties <strong>of</strong> the st<strong>and</strong>ard detector<br />
From Eq. (21),<br />
us = tus<br />
s<br />
= us , ) (22)<br />
Tn ,<br />
( Tn , ) n ( Sn , ) ( Sn<br />
sSn<br />
,<br />
where the uncertainties in spectral responsivity<br />
<strong>of</strong> the reference detector are obtained<br />
from the calibration certificate. These may<br />
be complex, depending on the method <strong>of</strong><br />
generating the primary st<strong>and</strong>ard. In such<br />
cases, a full propagation using covariances<br />
between the reference values is required<br />
[1,2] – these must be sought from the supplier<br />
<strong>of</strong> the reference st<strong>and</strong>ard.<br />
Some certificates provide total r<strong>and</strong>om component<br />
uncertainties <strong>and</strong> total correlated<br />
uncertainties at each wavelength. Where the<br />
ratio (systematic component : total uncertainty)<br />
<strong>of</strong> these components is approximately<br />
constant through the spectral range <strong>of</strong> interest,<br />
the correlation coefficient r is also approximately<br />
constant <strong>and</strong> given by the<br />
square <strong>of</strong> the ratio <strong>and</strong> effective uncertainties<br />
that are r<strong>and</strong>om <strong>and</strong> fully-correlated between<br />
wavelengths are readily determined.<br />
The effective uncertainty in spectral responsivity<br />
that is r<strong>and</strong>om between wavelengths is<br />
then given by<br />
u ( s ) = 1 − r u( s ) (23)<br />
R n n<br />
<strong>and</strong> the total contribution <strong>of</strong> r<strong>and</strong>om effects<br />
to the uncertainty in the integrated spectral<br />
quantity is given by<br />
2 2 2<br />
uR ( R) = ( 1 −r)<br />
∑ Pn u ( sn)<br />
(24)<br />
The effective uncertainty in spectral responsivity<br />
that is fully correlated between wavelengths<br />
is given by<br />
u ( s ) r u( s )<br />
= (25)<br />
S n n<br />
The total contribution <strong>of</strong> the systematic effects<br />
is given by the linear sum:<br />
uS( R) = r∑ Pu n ( sn)<br />
(26)<br />
Alternatively, where the systematic <strong>and</strong> r<strong>and</strong>om<br />
components are given at each wavelength,<br />
or their wavelength dependence is<br />
given as a scaling <strong>of</strong> some parameter, each<br />
systematic component may be propagated<br />
separately as a linear sum, <strong>and</strong> the total<br />
r<strong>and</strong>om components propagated in quadrature.<br />
The total uncertainty contribution <strong>of</strong> the reference<br />
st<strong>and</strong>ard is the quadrature sum <strong>of</strong><br />
the systematic <strong>and</strong> r<strong>and</strong>om components.<br />
A further complication is that spectral responsivity<br />
values for the reference st<strong>and</strong>ard<br />
may require interpolation to the wavelength<br />
values <strong>of</strong> the measurement. Interpolation
introduces correlations <strong>and</strong> these must be<br />
taken into account when propagating the<br />
uncertainties <strong>of</strong> the st<strong>and</strong>ard detector. A<br />
simple process that avoids these complications<br />
is to interpolate the transfer ratio to the<br />
wavelengths at which the reference st<strong>and</strong>ard<br />
is calibrated <strong>and</strong> propagate uncertainties<br />
in the integral sum (including the change<br />
in wavelength spacing) using only those values<br />
[3].<br />
4.2 Uncertainties <strong>of</strong> transfer process<br />
Each effect contributing to uncertainty in the<br />
transfer can be classified as independent<br />
<strong>and</strong> either r<strong>and</strong>om between wavelengths or<br />
fully-correlated between wavelengths. These<br />
effects can also be separately determined<br />
for the numerator or denominator <strong>of</strong> the<br />
transfer ratio, as shown in Eqs. (3) <strong>and</strong> (4),<br />
<strong>and</strong> combined either linearly or in quadrature<br />
depending on whether the effects are<br />
correlated or r<strong>and</strong>om between test <strong>and</strong> reference<br />
signals at the one wavelength.<br />
Once the uncertainty in the transfer ratio <strong>and</strong><br />
hence its uncertainty in spectral responsivity<br />
u ( s ) = s u ( t ) (27)<br />
e T, n S, n e n<br />
is determined for each effect at each wavelength,<br />
its contribution to the integral sum is<br />
calculated. For r<strong>and</strong>om components,<br />
2 2 2<br />
ue ( R) = ∑ Pn ue ( sn)<br />
(28)<br />
For systematic components, uncertainties in<br />
the values <strong>of</strong> spectral responsivity at different<br />
wavelengths are generally positively correlated,<br />
<strong>and</strong> the contribution to the integral<br />
sum is given by<br />
ue( R) = ∑ Pu n e(<br />
sn)<br />
(29)<br />
However some effects (e.g. wavelength <strong>of</strong>fsets)<br />
can produce correlations that are positive<br />
or negative between wavelength pairs.<br />
These effects are properly h<strong>and</strong>led by attaching<br />
a sign, that <strong>of</strong> the sensitivity coefficient<br />
for the effect, to the uncertainty in the<br />
transfer ratio. For example, consider the<br />
transfer ratio shown in Eq. (21). In the presence<br />
<strong>of</strong> a wavelength uncertainty fully correlated<br />
between test <strong>and</strong> reference, the signed<br />
uncertainty in the transfer ratio test:st<strong>and</strong>ard<br />
signals at the nth wavelength is given by<br />
⎛ 1 ∂RTn , RTn , ∂R<br />
⎞ Sn ,<br />
ues , ( tn) = ⎜ −<br />
u(<br />
λ)<br />
⎜ 2 ⎟<br />
RSn , ∂λ RSn<br />
, ∂λ<br />
⎟<br />
⎝ ⎠<br />
(30)<br />
The signed uncertainty in spectral responsivity<br />
for this effect at the nth wavelength is<br />
then given by combining Eqs. (27) <strong>and</strong> (30):<br />
sRn , ⎛∂RTn , ∂RSn<br />
, ⎞<br />
ues , ( sT, n) = ⎜ −tn⎟u(<br />
λ)<br />
RSn<br />
, ⎝ ∂λ ∂λ<br />
⎠<br />
(31)<br />
This expression can be positive or negative<br />
depending on the slopes <strong>of</strong> the test <strong>and</strong> reference<br />
signals with respect to wavelength.<br />
The propagated uncertainty for a wavelength<br />
<strong>of</strong>fset applicable at all wavelengths,<br />
including these mixed correlations, is found<br />
by the linear sum<br />
ue( R) = ∑ Pu n e, s(<br />
sT,<br />
n)<br />
(32)<br />
Detailed discussions <strong>and</strong> examples for uncertainty<br />
contributions <strong>of</strong> different correlated<br />
combinations can be found in [2].<br />
5. CONCLUSION<br />
When reporting spectral responsivity measurement<br />
uncertainties, the total uncertainty<br />
contribution <strong>of</strong> effects systematic over wavelengths<br />
should be given at each wavelength,<br />
instead <strong>of</strong> the total uncertainty as is the<br />
usual practice.<br />
REFERENCES<br />
1. International Organization for St<strong>and</strong>ardization,<br />
“Guide to the Expression <strong>of</strong> Uncertainty<br />
in Measurement”, Geneva 1993<br />
2. J. L. Gardner, Chapter 6: Uncertainty<br />
estimates in radiometry, Experimental Methods<br />
in the Physical Sciences, 41 291-325,<br />
Elsevier Inc. 2005.<br />
3. J. L. Gardner, Uncertainties in interpolated<br />
spectral data, J. Res. Natl. Inst. St<strong>and</strong>.<br />
Technol. 108 69-78 (2003)
Realization <strong>of</strong> the <strong>National</strong> <strong>Institute</strong> <strong>of</strong> <strong>St<strong>and</strong>ards</strong><br />
<strong>and</strong> Technology detector-based spectral<br />
irradiance scale<br />
Howard W. Yoon, Charles E. Gibson, <strong>and</strong> Patricia Y. Barnes<br />
A detector-based spectral irradiance scale has been realized at the <strong>National</strong> <strong>Institute</strong> <strong>of</strong> <strong>St<strong>and</strong>ards</strong> <strong>and</strong><br />
Technology �<strong>NIST</strong>�. Unlike the previous <strong>NIST</strong> spectral irradiance scales, the new scale is generated<br />
with filter radiometers calibrated for absolute spectral power responsivity traceable to the <strong>NIST</strong> highaccuracy<br />
cryogenic radiometer instead <strong>of</strong> with the gold freezing-point blackbody. The calibrated filter<br />
radiometers are then used to establish the radiance temperature <strong>of</strong> a high-temperature blackbody<br />
�HTBB� operating near 3000 K. The spectral irradiance <strong>of</strong> the HTBB is then determined with knowledge<br />
<strong>of</strong> the geometric factors <strong>and</strong> is used to assign the spectral irradiances <strong>of</strong> a group <strong>of</strong> 1000-W<br />
free-electron laser lamps. The detector-based spectral irradiance scale results in the reduction <strong>of</strong> the<br />
uncertainties from the previous source-based spectral irradiance scale by at least a factor <strong>of</strong> 2 in the<br />
ultraviolet <strong>and</strong> visible wavelength regions. The new detector-based spectral irradiance scale also leads<br />
to a reduction in the uncertainties in the shortwave infrared wavelength region by at least a factor <strong>of</strong><br />
2–10, depending on the wavelength. Following the establishment <strong>of</strong> the spectral irradiance scale in the<br />
early 1960s, the detector-based spectral irradiance scale represents a fundamental change in the way<br />
that the <strong>NIST</strong> spectral irradiance scale is realized. © 2002 Optical Society <strong>of</strong> America<br />
OCIS codes: 120.3930, 120.3940, 120.4800, 120.5630.<br />
1. Introduction<br />
The development <strong>and</strong> use <strong>of</strong> cryogenic radiometers<br />
have led the trend toward decreasing uncertainties in<br />
the radiometric <strong>and</strong> the photometric scales because <strong>of</strong><br />
improvements in the absolute power measurements.<br />
1,2 Furthermore, detector-based scales <strong>of</strong>ten<br />
can be maintained with shorter measurement chains<br />
<strong>and</strong> lower uncertainties than source-based scales.<br />
For example, the photometric scale at the <strong>National</strong><br />
<strong>Institute</strong> <strong>of</strong> <strong>St<strong>and</strong>ards</strong> <strong>and</strong> Technology �<strong>NIST</strong>� has<br />
been detector based <strong>and</strong> traceable to the <strong>NIST</strong> highaccuracy<br />
cryogenic radiometer �HACR� since 1993, 3<br />
<strong>and</strong> the implementation <strong>of</strong> the detector-based photometric<br />
scale resulted in a factor <strong>of</strong> 2 reduction in the<br />
exp<strong>and</strong>ed uncertainties compared with the previous<br />
source-based photometric scale. 4 Because the radio-<br />
The authors are with the Division <strong>of</strong> Optical Technology, <strong>National</strong><br />
<strong>Institute</strong> <strong>of</strong> <strong>St<strong>and</strong>ards</strong> <strong>and</strong> Technology, Mail Stop 8441,<br />
Gaithersburg, Maryl<strong>and</strong> 20899. H. W. Yoon’s e-mail address is<br />
hyoon@nist.gov.<br />
Received 7 January 2002; revised manuscript received 6 June<br />
2002.<br />
0003-6935�02�285879-12$15.00�0<br />
© 2002 Optical Society <strong>of</strong> America<br />
metric quantities <strong>of</strong> spectral radiance <strong>and</strong> spectral<br />
irradiance require measurements at many different<br />
wavelengths compared with the single measurement<br />
in the assignment <strong>of</strong> a photometric quantity, the establishment<br />
<strong>of</strong> a detector-based spectroradiometric<br />
scale has proven more time-consuming.<br />
The spectral radiance <strong>and</strong> the radiance temperature<br />
scale at <strong>NIST</strong> have all been based on the absolute<br />
radiometric determination <strong>of</strong> the freezing<br />
temperature <strong>of</strong> gold, 5 <strong>and</strong> the spectral irradiance<br />
scale is in turn realized from the spectral radiance<br />
scale. 6 As shown in Fig. 1�a�, during the process <strong>of</strong><br />
scale realization, the radiance temperature at 655<br />
nm is assigned to a vacuum tungsten-filament lamp<br />
�gold-point lamp� operated to match the radiance<br />
temperature <strong>of</strong> the gold freezing-temperature blackbody.<br />
The radiance temperature <strong>of</strong> a tungsten lamp<br />
operated at a higher temperature �1530 K� is in turn<br />
determined with the gold-point lamp, <strong>and</strong> the radiance<br />
temperature <strong>of</strong> a variable-temperature blackbody<br />
�VTBB� is assigned. The VTBB has a small<br />
2-mm-diameter opening, <strong>and</strong> the estimated emissivity<br />
<strong>of</strong> the VTBB is 0.9990 � 0.0005 based on the<br />
geometry <strong>and</strong> temperature uniformity. 7 The spectral<br />
radiance <strong>of</strong> tungsten-filament lamps <strong>and</strong> integrating<br />
sphere sources is assigned by use <strong>of</strong> the<br />
1 October 2002 � Vol. 41, No. 28 � APPLIED OPTICS 5879
Fig. 1. �a� Measurement chain used to derive the source-based<br />
spectral irradiance scale used in the 1990 <strong>and</strong> 1992 scale realizations.<br />
�b� The measurement chain used in the new detector-based<br />
spectral irradiance scale <strong>of</strong> 2000.<br />
VTBB; <strong>and</strong> typically, the temperature <strong>of</strong> the VTBB is<br />
changed to match the spectral radiance <strong>of</strong> the sources<br />
to minimize the effects that are due to the nonlinear<br />
responsivities <strong>of</strong> the detectors. For spectral irradiance<br />
realizations, the spectral radiance <strong>of</strong> an<br />
integrating-sphere source �ISS� is assigned, <strong>and</strong> the<br />
ISS is fitted with a precision aperture for use as a<br />
source <strong>of</strong> known spectral irradiance to calibrate a set<br />
<strong>of</strong> 1000-W free-electron laser (FEL) lamps.<br />
The source-based spectral irradiance scale realization<br />
procedure is long <strong>and</strong> involves many separate<br />
steps to assign the spectral irradiance <strong>of</strong> a set <strong>of</strong><br />
lamps. The primary reason for the long calibration<br />
chain is the low spectral radiance output <strong>of</strong> the gold<br />
freezing temperature blackbody at 1337.33 K. 8 Because<br />
the 1000-W FEL lamps have spectral shapes<br />
similar to that <strong>of</strong> a 3000 K blackbody, the radiant<br />
output <strong>of</strong> the intermediate transfer artifacts must be<br />
progressively increased to eventually match the spectral<br />
irradiance output <strong>of</strong> the 1000-W FEL lamp.<br />
Furthermore, a major contribution to the final uncertainties<br />
in the spectral irradiance scale is due to the<br />
temporal drift <strong>of</strong> the ISS <strong>and</strong> the low signal <strong>of</strong> the<br />
ISS, especially in the shortwave infrared region.<br />
The temporal drift <strong>of</strong> the ISS also depended on the<br />
wavelength region, resulting in greater temporal<br />
changes in the ultraviolet wavelength region. The<br />
spectral irradiance scale was difficult to realize at<br />
many different wavelengths because <strong>of</strong> a possible<br />
temporal drift resulting from the additional time<br />
needed for realizations.<br />
In the past decade, new developments in the construction<br />
<strong>of</strong> high-temperature blackbodies �HTBBs�<br />
made from pyrolytic graphite have allowed prolonged<br />
��100 h� operations at or above 3000 K. 9 Further-<br />
5880 APPLIED OPTICS � Vol. 41, No. 28 � 1 October 2002<br />
more, at <strong>NIST</strong> the uncertainties in the detector power<br />
responsivity scale were reduced with the advent <strong>of</strong><br />
the HACR as the primary st<strong>and</strong>ard for spectral power<br />
responsivity calibrations. The advantages <strong>of</strong> the<br />
new detector-based scale realization are evident in<br />
Fig. 1�b�, with a much shorter chain from the cryogenic<br />
radiometer to the primary working st<strong>and</strong>ards<br />
compared with the measurement chain shown in Fig.<br />
1�a�. In the realization <strong>of</strong> the detector-based scale,<br />
the filter radiometers �FRs� are used to determine the<br />
temperature <strong>of</strong> the HTBB, <strong>and</strong> then the spectral irradiance<br />
output <strong>of</strong> the HTBB is used to directly calibrate<br />
the primary working st<strong>and</strong>ard lamps.<br />
In this paper we describe the realization <strong>of</strong> the<br />
<strong>NIST</strong> detector-based spectral irradiance scale.<br />
The FRs used to determine the radiance temperature<br />
<strong>of</strong> the HTBB are characterized, <strong>and</strong> the agreement<br />
between the absolute detector-based radiance<br />
temperatures are compared with those found by use<br />
<strong>of</strong> the International Temperature Scale <strong>of</strong> 1990<br />
�ITS-90�. 10 The agreement between the detectorbased<br />
<strong>and</strong> the gold freezing-temperature-based<br />
spectral radiances is also shown to verify that the<br />
HTBB spectral radiance does not deviate significantly<br />
from a single-temperature Planck radiance<br />
distribution. From the assignment <strong>of</strong> the radiance<br />
temperature with the FRs, the spectral irradiance<br />
<strong>of</strong> a set <strong>of</strong> FEL lamps is determined. The detectorbased<br />
<strong>and</strong> the gold freezing blackbody-based spectral<br />
irradiances are compared, <strong>and</strong> the uncertainties<br />
<strong>of</strong> the detector-based spectral irradiance scale are<br />
discussed.<br />
2. Experimental Approach<br />
A. Radiance Temperature Determinations with Filter<br />
Radiometers<br />
A schematic <strong>of</strong> the measurements is shown in Fig. 2.<br />
Both the spectroradiometer <strong>and</strong> the FRs reside on a<br />
common moving optical table. The FRs are first<br />
used to determine the radiance temperature <strong>of</strong> the<br />
HTBB; <strong>and</strong> thus with knowledge <strong>of</strong> the radiance temperature,<br />
the spectral irradiance responsivity <strong>of</strong> the<br />
spectroradiometer is assigned by use <strong>of</strong> a precision<br />
aperture on the integrating-sphere receiver �ISR�<br />
with the knowledge <strong>of</strong> the distance between the ISR<br />
<strong>and</strong> the precision aperture in front <strong>of</strong> the blackbody.<br />
The spectral irradiance <strong>of</strong> the 1000-W quartz<br />
tungsten–halogen lamp �type FEL� is then assigned<br />
by use <strong>of</strong> the spectral irradiance responsivity <strong>of</strong> the<br />
spectroradiometer.<br />
The FRs are constructed with broadb<strong>and</strong> filters<br />
<strong>and</strong> silicon detectors that are both temperature stabilized<br />
as shown in Fig. 3. A precision aperture is<br />
placed in front <strong>of</strong> the filter– detector package, <strong>and</strong><br />
the aperture area is measured separately in the<br />
<strong>NIST</strong> High-Accuracy Aperture Measurement Facility<br />
to a relative combined exp<strong>and</strong>ed �k � 2� uncertainty<br />
<strong>of</strong> 0.01%. 11 The precision apertures attached to<br />
the FRs range from 4.0 to 4.4 mm in diameter. The<br />
detectors are calibrated for absolute spectral power<br />
responsivity on the <strong>NIST</strong> Spectral Comparator Fa-
Fig. 2. Schematic <strong>of</strong> the laboratory setup used for the spectral<br />
irradiance scale realization showing the positions <strong>of</strong> the HTBB, the<br />
FRs, the spectroradiometer, <strong>and</strong> the FEL lamp.<br />
cility �SCF�, 12 <strong>and</strong> the power responsivity is converted<br />
to spectral irradiance responsivity from<br />
knowledge <strong>of</strong> the aperture area. A total <strong>of</strong> three<br />
detectors are used, <strong>and</strong> the absolute spectral power<br />
responsivities are shown in Fig. 4. Both filter radiometers<br />
FR2 <strong>and</strong> FR4 have photopic response filters<br />
resulting in a broad spectral responsivity.<br />
The FR3 has greater spectral responsivity to<br />
shorter wavelengths then the other two radiometers,<br />
with a drop in responsivity near 400 nm. The<br />
broadb<strong>and</strong> radiometers were chosen for increased<br />
long-term stability, as compared with narrowb<strong>and</strong><br />
interference filters. 13<br />
The radiance temperature <strong>of</strong> the HTBB is found<br />
with a measurement equation, which describes the<br />
optical flux transfer with circular <strong>and</strong> coaxial source<br />
Fig. 3. Schematic <strong>of</strong> the filter radiometers used for the absolute<br />
temperature determination <strong>of</strong> the HTBB.<br />
Fig. 4. Absolute spectral irradiance responsivities <strong>of</strong> the FRs<br />
used in the scale realization. Both filter radiometers FR2 <strong>and</strong><br />
FR4 are constructed with broadb<strong>and</strong> photopic response filters that<br />
differ in responsivity only slightly below 400 nm.<br />
<strong>and</strong> receiver apertures. 14 given by<br />
For a FR, the signal s is<br />
S � G�r 2 2<br />
BB �r �1 � ��<br />
D 2 � R���L��, T�d�, � (1)<br />
where � is the emissivity <strong>and</strong> R is the absolute spectral<br />
power responsivity. The geometric factors D<br />
<strong>and</strong> � are given by D 2 � d 2 � r 2 2<br />
� rBB <strong>and</strong> ��<br />
r 2 2 4<br />
rBB �D , where rBB <strong>and</strong> r are the radius <strong>of</strong> the<br />
blackbody aperture <strong>and</strong> the FR apertures, respectively,<br />
<strong>and</strong> d is the distance between the FR aperture<br />
<strong>and</strong> the blackbody aperture. G is the preamplifier<br />
gain <strong>and</strong> L is the spectral radiance found by use <strong>of</strong> the<br />
Planck radiation law. The radiance temperatures<br />
are found when we iteratively change the blackbody<br />
temperature in Eq. �1� until an exact match <strong>of</strong> the<br />
calculated signal to the measured signal is found.<br />
The uncertainties <strong>of</strong> the radiance temperatures<br />
found with the FRs are primarily determined by the<br />
uncertainties in the spectral power responsivity.<br />
Figure 5�a� plots the exp<strong>and</strong>ed uncertainties <strong>of</strong> the<br />
SCF in the spectral power responsivity measurements.<br />
The lowest uncertainties are maintained in<br />
the visible wavelength region from 400 to 900 nm<br />
where the spectral power responsivity <strong>of</strong> the Si-trap<br />
transfer detector can be smoothly interpolated between<br />
the discrete laser calibration wavelengths <strong>of</strong><br />
the HACR. The uncertainties <strong>of</strong> the spectral power<br />
responsivity can be converted directly to uncertainties<br />
in temperature by use <strong>of</strong> the derivative <strong>of</strong> the<br />
Wien approximation with respect to temperature:<br />
�L<br />
L � c2 �T<br />
� T 2<br />
is the relationship between the uncertainty in radiance<br />
L <strong>and</strong> the uncertainty in blackbody temperature<br />
T; c 2 is the second Planck’s constant, 1.4387752<br />
cm�K; <strong>and</strong> � is the wavelength. The Wien approximation<br />
is used to simplify the h<strong>and</strong>ling <strong>of</strong> equations.<br />
Under these experimental conditions, no appreciable<br />
(2)<br />
1 October 2002 � Vol. 41, No. 28 � APPLIED OPTICS 5881
Fig. 5. �a� Exp<strong>and</strong>ed uncertainties <strong>of</strong> the <strong>NIST</strong> SCF for spectral<br />
power responsivity showing the low exp<strong>and</strong>ed uncertainties<br />
�0.22%� between 400 <strong>and</strong> 900 nm. �b� The uncertainties in the<br />
spectral power responsivity converted to temperature uncertainties<br />
by use <strong>of</strong> the derivative <strong>of</strong> the Wien approximation at 3000 K.<br />
differences exist between Eq. �2� <strong>and</strong> the similar differential<br />
equation found when we use Planck’s radiance<br />
law in the wavelength between 250 <strong>and</strong> 2400<br />
nm. Because <strong>of</strong> the changes in the shape <strong>of</strong> the<br />
blackbody radiance with temperature as described in<br />
the Planck radiance law, the temperature uncertainties<br />
are both dependent on temperature as well as<br />
wavelength. The corresponding uncertainties in radiance<br />
temperatures are plotted in Fig. 5�b� for a<br />
blackbody temperature <strong>of</strong> 3000 K, where the lowest<br />
temperature uncertainties exist in the spectral region<br />
between 400 to 900 nm.<br />
B. Description <strong>of</strong> the Facility for Automated<br />
Spectroradiometric Calibrations<br />
All the experimental research described in this paper<br />
was performed in the Facility for Automated Spectroradiometric<br />
Calibrations �FASCAL�, with the exception<br />
<strong>of</strong> the spectral power responsivity<br />
measurements <strong>of</strong> the FRs. 6 Briefly, the detector system<br />
consists <strong>of</strong> a prism-grating double monochromator<br />
with custom-modified entrance <strong>and</strong> exit optics.<br />
A simplified schematic <strong>of</strong> FASCAL is shown in Fig. 2.<br />
The light is collected with an <strong>of</strong>f-axis spherical mirror<br />
with either an integrating receiver for spectral irradiance<br />
or a flat plane mirror for spectral radiance.<br />
The measurements from 250 to 900 nm were performed<br />
with a photomultiplier tube in dc measurement<br />
mode. We performed the measurements from<br />
800 to 2400 nm using an InGaAs detector in photovoltaic<br />
mode using a mechanical light chopper at 290<br />
Hz with phase-sensitive detection. A significant im-<br />
5882 APPLIED OPTICS � Vol. 41, No. 28 � 1 October 2002<br />
provement to the FASCAL detection system is due to<br />
the replacement <strong>of</strong> the PbS detector �D* � 4 � 10 11<br />
�cm�Hz 1�2 ��W� with the extended InGaAs detector<br />
�D* � 2 � 10 12 �cm�Hz 1�2 ��W�, resulting in a st<strong>and</strong>ard<br />
deviation <strong>of</strong> signals �0.05% when a 1000-W<br />
FEL lamp is measured from 800 to 2300 nm. The<br />
spectrometer <strong>and</strong> the detector enclosure are also continuously<br />
purged with air filtered to remove CO 2 <strong>and</strong><br />
H 2O, thus improving the long-term stability <strong>of</strong> the<br />
detector system.<br />
C. Description <strong>of</strong> the High-Temperature Blackbody<br />
One <strong>of</strong> the technological advances that makes possible<br />
the realization <strong>of</strong> the detector-based spectral irradiance<br />
scale is the development <strong>of</strong> pyrolytic<br />
graphite blackbodies, enabling extended operations<br />
near 3000 K without rapid degradation <strong>of</strong> the cavity.<br />
The HTBB used in this study consists <strong>of</strong> pyrolytic<br />
graphite rings with an inner diameter <strong>of</strong> 24 mm<br />
stacked to form a cavity with a depth <strong>of</strong> 14.5 cm.<br />
The cavity bottom consists <strong>of</strong> an inverted cone with<br />
an apex angle <strong>of</strong> approximately 150°, <strong>and</strong> the radiance<br />
at the backside <strong>of</strong> the cavity bottom is imaged<br />
through an opening at the rear <strong>of</strong> the cavity by use <strong>of</strong><br />
a fused-silica lens onto a temperature-stabilized photometer<br />
for operation in closed-loop configuration.<br />
The lens also serves to seal the rear <strong>of</strong> the blackbody<br />
cavity to atmosphere. The current <strong>of</strong> the HTBB<br />
power supply is adjusted with a control loop to maintain<br />
a constant output from the photometer. Although<br />
the spectral irradiance in the ultraviolet<br />
wavelength region could be increased with higher<br />
temperatures, the HTBB was operated near 2950 K<br />
to avoid possible changes in the spectral emissivity <strong>of</strong><br />
the blackbody that are due to the sublimation <strong>of</strong> the<br />
graphite. 15 Because the graphite rings exp<strong>and</strong> approximately<br />
10% from room temperature to near<br />
3000 K, the current was increased at 0.1 A�s to nearly<br />
510 A at 2950 K to allow gradual expansion <strong>of</strong> the<br />
cavity. The HTBB was also turned <strong>of</strong>f in a similar<br />
manner to avoid thermophysical shocks.<br />
Figure 6 is a plot <strong>of</strong> the radiance temperatures<br />
measured during a single day <strong>of</strong> measurements from<br />
9:30 to 14:00 with FR2, FR3, <strong>and</strong> FR4. The feedback<br />
detector is a temperature-stabilized Si photodiode<br />
with a photopic response filter. The optical feedback<br />
is found to stabilize the HTBB to �0.0004 V at a full<br />
signal <strong>of</strong> 4.4 V. Figure 6 shows that the HTBB temperature<br />
was stable to �0.5 K over the duration <strong>of</strong> the<br />
5-h measurement. The exp<strong>and</strong>ed uncertainties <strong>of</strong><br />
the temperatures are shown for the FR2 temperatures<br />
that overlap the temperatures measured with<br />
FR3 <strong>and</strong> FR4. The three FRs agree in radiance temperature<br />
determinations to �0.5 K, in agreement<br />
with the combined exp<strong>and</strong>ed uncertainty in temperature<br />
<strong>of</strong> 0.86 K at 2950 K.<br />
Each <strong>of</strong> the FR measurements is an independent<br />
determination <strong>of</strong> temperature when a primary thermometer<br />
is used. A primary thermometer is distinguished<br />
from a secondary thermometer in that the<br />
temperature is obtained by use <strong>of</strong> a primary thermometer<br />
without use <strong>of</strong> any adjustable parameters. 16
Fig. 6. Temporal stability measurement <strong>of</strong> radiance temperatures<br />
with the FRs. The exp<strong>and</strong>ed uncertainties in temperature<br />
<strong>of</strong> �0.86 K are shown for FR2. The temporal drift in the HTBB<br />
temperature is less than 0.5 K over the duration <strong>of</strong> the nearly 5-h<br />
monitoring time.<br />
The temperature <strong>of</strong> the HTBB increased at most by 1<br />
K over 20 h <strong>of</strong> continuous operation with constant<br />
optical feedback control by use <strong>of</strong> the optical output<br />
from the rear <strong>of</strong> the cavity. The slight increase in<br />
temperature over time is possibly attributable to the<br />
opening at the rear <strong>of</strong> the cavity that gets smaller<br />
from carbon deposits at the edges <strong>of</strong> the opening.<br />
The HTBB was operated with an open cavity with<br />
continuous 0.5-1�min purge <strong>of</strong> argon from the rear <strong>of</strong><br />
the housing <strong>and</strong> the argon exiting through the front<br />
opening <strong>of</strong> the cavity.<br />
D. Verification <strong>of</strong> the High-Temperature Blackbody as a<br />
Planckian Radiator<br />
To determine the spectral emissivity <strong>of</strong> the HTBB,<br />
the spectral radiance <strong>of</strong> the HTBB was measured<br />
from 250 to 2400 nm at discrete wavelengths by comparison<br />
with a VTBB with a high emissivity. Any<br />
temperature nonuniformity <strong>of</strong> the cavity would lead<br />
to deviations <strong>of</strong> the HTBB spectral radiance from a<br />
single-temperature Planck radiance. For these<br />
comparisons, the temperature <strong>of</strong> the VTBB was set at<br />
2687 K, <strong>and</strong> the temperature <strong>of</strong> the HTBB was set at<br />
2950 K. Although the temperatures are different,<br />
the radiance ratios did not differ even at 250 nm,<br />
where the differences are greatest, by more than a<br />
factor <strong>of</strong> 7. Furthermore, prior to these measurements,<br />
the linearity <strong>of</strong> the spectroradiometer was<br />
measured at various wavelengths with the portable<br />
Beamconjoiner 17 <strong>and</strong> was found to be linear under<br />
these experimental conditions. The spectral radiance<br />
determinations were performed before <strong>and</strong> after<br />
spectral irradiance transfer to a set <strong>of</strong> 1000-W FEL<br />
lamps. The checks <strong>of</strong> the HTBB as a Planckian radiator<br />
were performed to verify that the HTBB did<br />
not change in the spectral distribution because the<br />
FRs are used to measure over a relatively broad spectral<br />
region.<br />
The spectral radiance measurements <strong>of</strong> the HTBB<br />
were performed with the aperture in front <strong>of</strong> the<br />
spherical input mirror with the spectroradiometer<br />
reduced to 4 cm in diameter, resulting in F�25 focused<br />
at the opening <strong>of</strong> the HTBB at the plane <strong>of</strong> the<br />
water-cooled aperture. The reduction in the opening<br />
<strong>of</strong> the spherical input mirror resulted in a circular<br />
target <strong>of</strong> 12 mm in diameter at the bottom <strong>of</strong> the<br />
HTBB cavity. To keep the same target area constant<br />
for the measurements, in both the spectral irradiance<br />
<strong>and</strong> the spectral radiance modes, the HTBB<br />
was mounted on a motorized translation stage for<br />
control <strong>of</strong> the distance between the HTBB <strong>and</strong> the<br />
measuring instruments. If possible, the same area<br />
at the rear <strong>of</strong> the HTBB should be viewed for all<br />
measurements to avoid errors from the possible spatial<br />
nonuniformity <strong>of</strong> the HTBB.<br />
We determined the temperature <strong>of</strong> the VTBB using<br />
spectral radiance ratios at 655 nm to a vacuum<br />
tungsten-filament lamp maintained at the freezing<br />
temperature <strong>of</strong> gold as prescribed in the ITS-90.<br />
The spectral radiance <strong>of</strong> the HTBB was determined<br />
at discrete wavelengths by comparison with the<br />
VTBB <strong>and</strong> also determined from the radiance temperature<br />
found with the FRs. The radiance temperatures<br />
<strong>of</strong> the HTBB found with the FRs were in<br />
agreement with those found with the ITS-90 ratios to<br />
within 0.5 K in all cases in which such comparisons<br />
were performed. We compared the respective blackbodies<br />
using spectral radiance ratios:<br />
L �,HTBB � L �,VTBBf �<br />
S �,HTBB<br />
S �,VTBB<br />
. (3)<br />
The L � <strong>and</strong> the S � denote the spectral radiance <strong>and</strong><br />
the measured spectral radiance response <strong>of</strong> the<br />
HTBB <strong>and</strong> the VTBB, <strong>and</strong> f � is the possible linearity<br />
correction to the response ratios. The spectral radiances<br />
<strong>of</strong> the HTBB were found to conform to a singletemperature<br />
Planck radiance law to within the<br />
combined uncertainties <strong>of</strong> the measurements as<br />
shown in Fig. 7. Figure 7 shows the percent differences<br />
from a single-temperature Planck radiance law<br />
with the temperature <strong>of</strong> the HTBB determined with<br />
the FRs <strong>and</strong> the spectral radiances determined with<br />
the VTBB. The errors bars on the individual comparisons<br />
correspond to the exp<strong>and</strong>ed uncertainty <strong>of</strong><br />
0.86 K at 2943.4 K converted to a spectral radiance<br />
uncertainty by use <strong>of</strong> the derivative <strong>of</strong> the Wien approximation<br />
from Eq. �2�. As expected for comparison<br />
<strong>of</strong> two blackbodies, the differences in the spectral<br />
radiance become smaller with increasing wavelength,<br />
but there are no discernible increasing spectral<br />
differences toward the shorter wavelengths, as<br />
would be expected if either <strong>of</strong> the temperature assignments<br />
<strong>of</strong> the respective blackbodies were in error.<br />
The differences between the detector-based radiance<br />
temperatures <strong>and</strong> the source-based determinations<br />
also agree with the previous measurements, which<br />
also showed differences <strong>of</strong> �0.5% from 250 to 1000<br />
nm. 18<br />
E. Spectral Irradiance Transfer to 1000-W FEL Lamps<br />
The spectral irradiance assignment <strong>of</strong> twelve 1000-W<br />
FEL working st<strong>and</strong>ard lamps occurred over a two-<br />
1 October 2002 � Vol. 41, No. 28 � APPLIED OPTICS 5883
Fig. 7. Spectral radiance differences <strong>of</strong> the HTBB from a singletemperature<br />
Planck radiance as assigned by use <strong>of</strong> the FRs to the<br />
spectral radiances assigned by use <strong>of</strong> the VTBB. The error bars<br />
indicate the 0.86 K exp<strong>and</strong>ed temperature uncertainty at 2950 K<br />
converted to spectral radiance uncertainties, <strong>and</strong> the continuous<br />
curves indicate the exp<strong>and</strong>ed uncertainties <strong>of</strong> the spectral radiance<br />
scale.<br />
week period from 28 September to 12 October 2000.<br />
The spectral irradiances <strong>of</strong> a group <strong>of</strong> three lamps<br />
were assigned at one time, <strong>and</strong> the measurements<br />
were separated into the ultraviolet <strong>and</strong> the visible<br />
wavelength region �250–900 nm�, <strong>and</strong> the shortwave<br />
infrared region �800–2400 nm�. Because there are<br />
four separate FEL lamp measurement stations, each<br />
<strong>of</strong> the measurements <strong>of</strong> individual lamps was performed<br />
in a different station by use <strong>of</strong> different shunt<br />
resistors, power supplies, <strong>and</strong> lamp mounts. Each<br />
<strong>of</strong> the lamp stations was checked for possible position<br />
effects, <strong>and</strong> no perceptible effects from station-tostation<br />
variations were found.<br />
The HTBB was turned on at least 2 h before use<br />
<strong>and</strong> was temperature-stabilized by the optical feedback.<br />
The temperature <strong>of</strong> the HTBB was assigned<br />
by use <strong>of</strong> the FRs, <strong>and</strong> the spectral irradiance responsivity<br />
<strong>of</strong> the spectroradiometer was assigned by use <strong>of</strong><br />
the known spectral irradiance <strong>of</strong> the HTBB. All the<br />
spectral irradiance responsivity transfers to the spectroradiometer<br />
were done at a distance <strong>of</strong> 43.406 cm<br />
��0.005 cm� from the HTBB aperture to the 1-cm 2 -<br />
area aperture <strong>of</strong> the ISR, resulting in a 24.7-mmdiameter<br />
circular target area at the cavity bottom.<br />
The spectral irradiance responsivity <strong>of</strong> the spectroradiometer<br />
is assigned by use <strong>of</strong> the known spectral<br />
irradiance <strong>of</strong> the HTBB at the input aperture <strong>of</strong> the<br />
ISR:<br />
E�,HTBB � L��, T��r 2<br />
BB<br />
D 2 , (4)<br />
with the measurement parameters as defined in Eq.<br />
�1�.<br />
After the spectral irradiance responsivity assignment<br />
<strong>of</strong> the spectroradiometer, the spectral irradiance<br />
<strong>of</strong> a group <strong>of</strong> three FEL lamps was assigned with<br />
each lamp measured in three separate source posi-<br />
5884 APPLIED OPTICS � Vol. 41, No. 28 � 1 October 2002<br />
Fig. 8. Spectral irradiance <strong>of</strong> the HTBB at 2950 K with the measurement<br />
parameters as described with the spectral irradiances <strong>of</strong><br />
a typical 1000-W FEL lamp. The measurement parameters were<br />
chosen to closely match the signals <strong>of</strong> both sources.<br />
tions. The spectral irradiance <strong>of</strong> each lamp was assigned<br />
by<br />
E �,FEL � E �,HTBBf �<br />
S �,FEL<br />
S �,HTBB<br />
, (5)<br />
where E �,FEL�HTBB� is the spectral irradiance <strong>of</strong> the<br />
FEL lamp �HTBB�, S �,FEL�HTBB� is the net signal from<br />
the FEL lamp �HTBB� measured with the spectroradiometer,<br />
<strong>and</strong> f � is the linearity correction factor for<br />
the comparison. With use <strong>of</strong> a shutter, the background<br />
signals were subtracted from the total signals<br />
to obtain the net signals. The distance <strong>of</strong> the HTBB<br />
from the ISR was also chosen such that the same gain<br />
factors could be used to measure both the FEL <strong>and</strong><br />
the HTBB. Figure 8 is a plot <strong>of</strong> the calculated spectral<br />
irradiances <strong>of</strong> the 1000-W FEL along with the<br />
HTBB at 2950 K with the limiting aperture <strong>of</strong> 9.9933<br />
mm ��0.0002 mm� in diameter <strong>and</strong> the ISR aperture<br />
<strong>of</strong> 11.2838 mm ��0.0002 mm� in diameter separated<br />
by a distance <strong>of</strong> 43.406 cm ��0.005 cm�. At all wavelengths,<br />
Fig. 8 shows that the HTBB has a greater<br />
spectral irradiance than the FEL lamp. Although<br />
the spectral irradiance changes by a factor �10 3 from<br />
250 to 2400 nm, the HTBB�FEL signal ratio does not<br />
exceed 2.5. The close match <strong>of</strong> the irradiances was<br />
chosen to minimize possible errors resulting from<br />
signal-to-noise ratio, nonlinearity, <strong>and</strong> stray-light effects.<br />
3. Uncertainty Analysis <strong>of</strong> the Detector-Based Spectral<br />
Irradiance Scale<br />
The discussion <strong>of</strong> the uncertainties associated with<br />
the detector-based spectral irradiance scale realization<br />
is separated into parts. Because the absolute<br />
radiance temperature determination <strong>of</strong> the HTBB is<br />
performed with FRs with peak spectral responsivities<br />
near 550 nm, the exp<strong>and</strong>ed uncertainties in the spectral<br />
irradiance measurement at 550 nm is discussed<br />
first. The spectral irradiance uncertainties are converted<br />
into temperature uncertainties by use <strong>of</strong> the
Table 1. Exp<strong>and</strong>ed Component Uncertainties in the Spectral Irradiance<br />
Measurement with the FR at 550 nm<br />
Source <strong>of</strong> Uncertainty<br />
�550 nm�<br />
Spectral power responsivity,<br />
FR<br />
Solid-angle factor,<br />
HTBB�FR<br />
Area <strong>of</strong> detector aperture<br />
Area <strong>of</strong> HTBB aperture<br />
Measurement precision,<br />
HTBB�FR<br />
Amplifier gain<br />
Combined exp<strong>and</strong>ed<br />
uncertainty �k � 2�<br />
Fractional<br />
Uncertainty<br />
Exp<strong>and</strong>ed<br />
Uncertainty<br />
�%�<br />
derivative <strong>of</strong> the Wien approximation. The Wien approximation<br />
is used because the measurements are<br />
performed at short wavelengths from the peak wavelength<br />
<strong>of</strong> the 3000 K Planck spectral radiance. The<br />
uncertainties <strong>of</strong> the spectral irradiances <strong>of</strong> the primary<br />
working st<strong>and</strong>ards are assigned. Finally, the<br />
exp<strong>and</strong>ed uncertainties <strong>of</strong> the issued st<strong>and</strong>ards are<br />
assigned with additional uncertainty added to account<br />
for the temporal changes <strong>of</strong> the working st<strong>and</strong>ard<br />
lamps.<br />
The uncertainties associated with the detector-<br />
�R<br />
R<br />
�A<br />
A<br />
�A<br />
A<br />
�G<br />
G<br />
0.22<br />
0.026<br />
0.02<br />
0.02<br />
0.006<br />
0.006<br />
0.26<br />
based temperature determinations <strong>of</strong> the HTBB can<br />
be found from the uncertainty analysis <strong>of</strong> Eq. �1� as<br />
shown in Table 1. The individual components are<br />
listed in descending order <strong>of</strong> importance, with the<br />
uncertainty that is due to the spectral power responsivity<br />
dominating. Additional sources <strong>of</strong> uncertainty<br />
from the alignment <strong>and</strong> aperture area<br />
measurements are small. The exp<strong>and</strong>ed spectral irradiance<br />
responsivity uncertainty at 550 nm <strong>of</strong> 0.26%<br />
leads to an exp<strong>and</strong>ed temperature uncertainty <strong>of</strong> 0.86<br />
K at 2950 K.<br />
Table 2 describes the additional uncertainties associated<br />
with the HTBB spectral irradiance including<br />
the components that are due to spectral emissivity,<br />
spatial uniformity, <strong>and</strong> temporal stability. The first<br />
row shows the exp<strong>and</strong>ed uncertainty <strong>of</strong> the spectral<br />
irradiance that is due to the 0.86 K exp<strong>and</strong>ed temperature<br />
uncertainty at 2950 K. The uncertainties<br />
that are due to the spectral emissivity <strong>and</strong> the spatial<br />
uniformity <strong>of</strong> the HTBB are then assigned. The<br />
temporal stability <strong>of</strong> the HTBB was measured <strong>and</strong><br />
also constantly monitored by use <strong>of</strong> the optical feedback<br />
at the rear <strong>of</strong> the cavity. The uncertainties in<br />
the alignment <strong>of</strong> the apertures <strong>and</strong> in the distance<br />
measurements are included in the geometric factor<br />
uncertainty.<br />
The detectors used in the spectroradiometers have<br />
shown better than 0.1% �k � 2� stability during the<br />
spectral irradiance measurements. However, the<br />
increase <strong>of</strong> the uncertainty at 2400 nm because the<br />
stability <strong>of</strong> the spectroradiometer responsivity is due<br />
to the performance <strong>of</strong> the InGaAs detector. A substantial<br />
contribution to the total uncertainty comes<br />
Table 2. Exp<strong>and</strong>ed Uncertainties <strong>of</strong> the Detector-Based 2000 Spectral Irradiance Scales <strong>of</strong> the Primary Working <strong>St<strong>and</strong>ards</strong> <strong>and</strong> the<br />
Issued <strong>St<strong>and</strong>ards</strong> a<br />
Component<br />
Wavelength �nm�<br />
250 350 655 900 1600 2000 2300 2400<br />
HTBB temperature uncertainty<br />
�0.86 K at 2950 K�<br />
0.57 0.41 0.22 0.16 0.09 0.08 0.07 0.07<br />
HTBB spectral emissivity 0.1 0.1 0.1 0.1 0.1 0.1 0.1 0.1<br />
HTBB spatial uniformity 0.1 0.1 0.1 0.1 0.1 0.1 0.1 0.1<br />
HTBB temporal stability �0.1<br />
K�h�<br />
0.07 0.05 0.03 0.02 0.01 0.01 0.01 0.01<br />
Geometric factors in irradiance<br />
transfer<br />
0.1 0.1 0.1 0.1 0.1 0.1 0.1 0.1<br />
Spectroradiometer responsivity<br />
stability<br />
0.1 0.1 0.1 0.1 0.1 0.1 0.1 0.5<br />
Wavelength accuracy �0.1 nm� 0.58 0.38 0.18 0.005 0.011 0.013 0.011 0.011<br />
Lamp�spectroradiometer<br />
transfer<br />
0.1 0.1 0.1 0.1 0.1 0.1 0.1 0.1<br />
Lamp current stability 0.08 0.06 0.03 0.02 0.02 0.01 0.01 0.01<br />
Uncertainty <strong>of</strong> the primary<br />
working st<strong>and</strong>ards, total<br />
�k � 2�<br />
0.85 0.60 0.36 0.28 0.24 0.24 0.23 0.54<br />
Lamp-to-lamp transfer 0.1 0.1 0.1 0.1 0.1 0.1 0.1 0.1<br />
Long-term stability <strong>of</strong> working<br />
st<strong>and</strong>ards<br />
1.31 0.94 0.50 0.36 0.20 0.16 0.14 0.14<br />
Uncertainty <strong>of</strong> the issued<br />
st<strong>and</strong>ards, total �k � 2�<br />
1.56 1.12 0.63 0.47 0.33 0.31 0.29 0.57<br />
a Uncertainty �k � 2� �%�.<br />
1 October 2002 � Vol. 41, No. 28 � APPLIED OPTICS 5885
Fig. 9. Percent differences from the mean <strong>of</strong> three separate spectral<br />
irradiance scale realizations performed on four separate days.<br />
The differences are shown with the assigned exp<strong>and</strong>ed uncertainties<br />
<strong>of</strong> the working st<strong>and</strong>ards for the detector-based spectral irradiance<br />
scale.<br />
from the uncertainty in the absolute wavelength.<br />
The wavelength drive <strong>of</strong> the prism-grating spectroradiometer<br />
has an absolute optical encoder attached to<br />
the shaft, <strong>and</strong> piecewise continuous polynomial corrections<br />
are applied to achieve �0.05-nm st<strong>and</strong>ard<br />
uncertainty in the wavelength. For determination<br />
<strong>of</strong> the uncertainties on the issued st<strong>and</strong>ards, additional<br />
components arising from the lamp-to-lamp<br />
transfer <strong>and</strong> long-term stability <strong>of</strong> the working st<strong>and</strong>ards<br />
are added. A substantial increase in the total<br />
uncertainties arises from the possible temporal drift<br />
<strong>of</strong> the working st<strong>and</strong>ards. All lamp st<strong>and</strong>ards are<br />
subjected to a screening procedure for temporal drift,<br />
<strong>and</strong> lamps that change by more than 0.5% at 650 nm<br />
over the duration <strong>of</strong> 24 operational hours are rejected<br />
from further evaluation as possible st<strong>and</strong>ards. 6 The<br />
temporal drift is found to be inversely proportional to<br />
the wavelength <strong>and</strong> is accordingly larger at the<br />
shorter wavelengths.<br />
To determine whether the uncertainties were correctly<br />
estimated, data from separate independent<br />
scale realizations <strong>of</strong> a FEL lamp �F210� were analyzed.<br />
Figure 9 shows the percent differences from<br />
the mean in the detector-based spectral irradiance <strong>of</strong><br />
the lamp with three independent assignments from<br />
250 to 900 nm <strong>and</strong> from three other separate assignments<br />
from 800 to 2400 nm over four separate days.<br />
The spectral irradiance assignments show that the<br />
three independent scale realizations for a particular<br />
wavelength region are all within the assigned �k � 2�<br />
exp<strong>and</strong>ed uncertainties <strong>of</strong> the 2000 spectral irradiance<br />
scale. The temperature <strong>of</strong> the HTBB was determined<br />
on each <strong>of</strong> the days during the realization,<br />
<strong>and</strong> the spectral irradiance responsivity was assigned<br />
approximately 30 min after a temperature assignment<br />
by use <strong>of</strong> the FRs. The separate spectral irradiance<br />
assignments are all within the exp<strong>and</strong>ed<br />
uncertainties. The slight upturn in the uncertainties<br />
at 2400 nm is due to the rapidly decreasing spectral<br />
responsivity <strong>of</strong> the InGaAs detector near the<br />
5886 APPLIED OPTICS � Vol. 41, No. 28 � 1 October 2002<br />
Table 3. Comparison <strong>of</strong> the Exp<strong>and</strong>ed Uncertainties in the Spectral<br />
Irradiance Scales <strong>of</strong> the 1990 <strong>and</strong> 2000 Scale Realizations<br />
Wavelength<br />
�nm�<br />
Exp<strong>and</strong>ed Uncertainties<br />
in Spectral Irradiance<br />
�%� �k � 2�<br />
1990 2000<br />
250 1.8 1.56<br />
350 1.1 1.12<br />
655 0.9 0.63<br />
900 1.1 0.47<br />
1600 1.4 0.33<br />
2300 3.8 0.29<br />
2400 4.4 0.57<br />
b<strong>and</strong>gap energy <strong>of</strong> the material. The spectral shape<br />
<strong>of</strong> the exp<strong>and</strong>ed uncertainty follows the inverse<br />
wavelength dependence expected for a scale based on<br />
a temperature determination <strong>of</strong> a HTBB.<br />
4. Comparison <strong>of</strong> the Detector- <strong>and</strong> Source-Based<br />
Spectral Irradiance Scales<br />
Table 3 shows the total exp<strong>and</strong>ed uncertainties <strong>of</strong> the<br />
spectral irradiance scales from the 1990 <strong>and</strong> the 2000<br />
realizations. Figure 10 shows that the detectorbased<br />
spectral irradiance scale results in the reduction<br />
in the uncertainties in the 250–900-nm<br />
wavelength regions by a factor <strong>of</strong> 2 <strong>and</strong> a greater<br />
reduction up to a factor <strong>of</strong> 10 in the uncertainties<br />
from the 900- to 2400-nm wavelength region. The<br />
reduction in the uncertainties is primarily due to the<br />
elimination <strong>of</strong> the ISS that was used as a transfer<br />
artifact to obtain spectral irradiance from the spectral<br />
radiance assignment. The spectral irradiance<br />
<strong>of</strong> the ISS was lower than that <strong>of</strong> the 1000-W FEL<br />
<strong>and</strong> was especially difficult to measure in the infrared<br />
wavelength region with the previous PbS detector,<br />
resulting in the large uncertainties. The detectorbased<br />
spectral irradiance utilizes the HTBB, which<br />
has greater spectral irradiance than the 1000-W FEL<br />
lamp at all wavelengths, <strong>and</strong> the improved InGaAs<br />
detector in the infrared further reduces the measure-<br />
Fig. 10. Comparison <strong>of</strong> the exp<strong>and</strong>ed uncertainties <strong>of</strong> the 1990<br />
scale realization along with the exp<strong>and</strong>ed uncertainties <strong>of</strong> the 2000<br />
scale realization. The exp<strong>and</strong>ed uncertainties <strong>of</strong> the issued lamps<br />
are greater because <strong>of</strong> the additional component <strong>of</strong> the long-term<br />
temporal stability <strong>of</strong> the working st<strong>and</strong>ards.
Fig. 11. �a� Comparison from 250 to 900 nm <strong>of</strong> the spectral irradiance<br />
assigned to the check st<strong>and</strong>ard lamps in 1992 with the<br />
detector-based spectral irradiance assignments. The exp<strong>and</strong>ed<br />
uncertainties assigned in 1990 are shown as the dark curve. The<br />
st<strong>and</strong>ard deviations <strong>of</strong> the mean <strong>of</strong> the three lamps are shown as<br />
open diamonds, indicating the good agreement between the three<br />
lamps. �b� A comparison from 800 to 2400 nm <strong>of</strong> the three check<br />
st<strong>and</strong>ard lamps <strong>of</strong> the 1990 spectral irradiance assignment with<br />
the detector-based spectral irradiance assignment. The st<strong>and</strong>ard<br />
deviations <strong>of</strong> the mean <strong>of</strong> the three lamps are shown as open<br />
diamonds along with the exp<strong>and</strong>ed uncertainties <strong>of</strong> the 1990 scale<br />
shown by the dark curve.<br />
ment uncertainties. The spectral shape <strong>of</strong> the uncertainties<br />
also has the characteristic 1��<br />
dependence <strong>of</strong> the decrease in uncertainties with increasing<br />
wavelength that can be seen in Eq. �2�.<br />
The differences in the spectral irradiance between<br />
the source-based <strong>and</strong> the detector-based spectral irradiance<br />
scale are shown in Fig. 11�a� for a set <strong>of</strong><br />
check st<strong>and</strong>ard lamps �F34, F300, F315� in the wavelength<br />
region from 250 to 900 nm <strong>and</strong> in the wavelength<br />
region from 800 to 2400 nm in Fig. 11�b�. At<br />
<strong>NIST</strong>, a set <strong>of</strong> lamps �working st<strong>and</strong>ard lamps� are<br />
used for routine calibrations, <strong>and</strong> another set <strong>of</strong><br />
lamps �check st<strong>and</strong>ard lamps� are set aside to verify<br />
that the working st<strong>and</strong>ard lamps did not drift. The<br />
check st<strong>and</strong>ards were used approximately twice a<br />
year to verify that the working st<strong>and</strong>ard lamps did<br />
not changed; thus the total operational hours on the<br />
check st<strong>and</strong>ards are typically much less than the operational<br />
hours <strong>of</strong> the working st<strong>and</strong>ards.<br />
In Fig. 11�a� the comparison <strong>of</strong> the detector-based<br />
scale with the source-based scale shows that the difference<br />
<strong>of</strong> the <strong>NIST</strong> spectral irradiance assignments<br />
is greater than their assigned exp<strong>and</strong>ed uncertainties<br />
by �0.5%. The sawtooth oscillations that can be<br />
seen in the source-based spectral irradiance evident<br />
at �400 nm is correlated in all the lamps <strong>and</strong> is<br />
evident to a lesser extent at longer wavelengths.<br />
The correlated oscillations are attributed to the experimental<br />
procedure used in the previous spectral<br />
irradiance scale realization <strong>of</strong> 1992. In the realization<br />
<strong>of</strong> 1992, the ISS was assigned a spectral radiance<br />
at a particular wavelength, <strong>and</strong> the spectral irradiance<br />
<strong>of</strong> a set <strong>of</strong> three lamps was assigned immediately<br />
by use <strong>of</strong> the spectral irradiance <strong>of</strong> the ISS. Thus<br />
the spectral irradiance at each wavelength is realized<br />
separately <strong>and</strong> independently; <strong>and</strong> especially in the<br />
ultraviolet region, the oscillations could arise from a<br />
possible temporal drift <strong>of</strong> the ISS. Our ability to<br />
maintain the spectral irradiance over ten years using<br />
a set <strong>of</strong> stable lamps is shown by the agreement<br />
among lamps F34, F300, <strong>and</strong> F315 as compared with<br />
the detector-based spectral irradiance scale. The<br />
st<strong>and</strong>ard deviation <strong>of</strong> the mean found when we used<br />
the percent differences <strong>of</strong> the three lamps from the<br />
detector-based scale is plotted in Fig. 11�a� with the<br />
open diamonds <strong>and</strong> shows that the lamps have stayed<br />
together as a group to �0.5% from 1992.<br />
In the shortwave infrared wavelength region, the<br />
source-based spectral irradiance scale from 800 to<br />
2400 nm was last realized from the gold freezingpoint<br />
blackbody in 1990. A new spectral irradiance<br />
scale realization was attempted in 1992 from 250 to<br />
2400 nm with a more stable ISS, but the scale realization<br />
in the infrared region was not completed because<br />
<strong>of</strong> the insufficient spectral irradiance <strong>of</strong> the<br />
1992 ISS in the infrared <strong>and</strong> the low signal-to-noise<br />
ratio from the PbS detector. The discontinuity at<br />
800 <strong>and</strong> 900 nm for a common lamp is due to the<br />
separate scale realizations performed in 1990 <strong>and</strong> in<br />
1992. For assignment <strong>of</strong> spectral irradiance <strong>of</strong> the<br />
issued lamps, the different spectral irradiance values<br />
were averaged to obtain a single value at those wavelengths.<br />
As in the comparisons from 250 to 900 nm,<br />
the check st<strong>and</strong>ard lamps remained close together as<br />
a group with their spectral irradiances much better<br />
than �0.5% as shown in Fig. 11�b� by the open diamonds<br />
at the bottom <strong>of</strong> the figure. Two noticeable<br />
drops in the irradiances are observed at 1600 <strong>and</strong><br />
2100 nm in the comparison <strong>of</strong> the scales. The Consultative<br />
Committee on Photometry <strong>and</strong> Radiometry<br />
�CCPR� comparison <strong>of</strong> 1990 19 also showed that the<br />
1% drop at 1600 nm <strong>and</strong> the nearly 2% drop at 2100<br />
nm were seen in all comparisons with the other countries,<br />
indicating that the two spectral features were<br />
inherent to the <strong>NIST</strong> spectral irradiance scale <strong>of</strong><br />
1990. The differences <strong>of</strong> the detector-based spectral<br />
irradiance scale to the source-based scale <strong>of</strong> 1990<br />
show that the assignment <strong>of</strong> the spectral irradiances<br />
were within their stated uncertainties since 1990.<br />
These comparisons to the check st<strong>and</strong>ards should<br />
reflect the differences between the new detectorbased<br />
scale <strong>and</strong> the scale realized in 1992, <strong>and</strong> more<br />
1 October 2002 � Vol. 41, No. 28 � APPLIED OPTICS 5887
importantly, the scale realized in 1990 before <strong>and</strong><br />
after the international comparison <strong>of</strong> spectral irradiance<br />
organized by the CCPR. If the differences seen<br />
can be extrapolated to the CCPR comparisons in<br />
1990, then the <strong>NIST</strong> spectral irradiance scale for the<br />
comparison would have been approximately 1% low<br />
in the visible <strong>and</strong> approximately 2% low in the ultraviolet<br />
wavelength region. The large variations in<br />
the spectral irradiance scales <strong>of</strong> the individual countries<br />
preclude discerning whether the differences<br />
found between the detector-based scale <strong>and</strong> the 1990<br />
scale could be detected in the international intercomparison.<br />
5. Discussion<br />
Because <strong>of</strong> the long history <strong>of</strong> the spectral irradiance<br />
scale at <strong>NIST</strong> <strong>and</strong> the resulting wide usage <strong>of</strong> the<br />
FEL lamps issued by <strong>NIST</strong>, the one most important<br />
result is the relationship between the spectral irradiances<br />
from the detector-based scale realization <strong>of</strong><br />
2000 <strong>and</strong> the previously assigned spectral irradiances.<br />
Figures 12�a� <strong>and</strong> 12�b� show the means <strong>of</strong><br />
the spectral irradiances <strong>of</strong> the three working st<strong>and</strong>ards<br />
used to assign FEL lamps to the detector-based<br />
spectral irradiance scale along with the exp<strong>and</strong>ed<br />
uncertainties <strong>of</strong> the 1992 scale realization. In the<br />
wavelength region from 250 to 900 nm, only one<br />
point, at 250 nm, falls beyond the 0.5% <strong>of</strong> the exp<strong>and</strong>ed<br />
�k � 2� uncertainties; <strong>and</strong> if the uncertainties<br />
are increased to 3� �k � 3�, then all the values are<br />
within uncertainties. In the infrared region from<br />
900 to 2400 nm, only three values exceed the exp<strong>and</strong>ed<br />
uncertainties by more than 0.5%, <strong>and</strong> again<br />
all the differences fall within the 3� �k � 3� uncertainties.<br />
Because we have shown that the radiance temperature<br />
scale <strong>and</strong> the spectral radiance scale at <strong>NIST</strong><br />
are both in agreement with the detector-based scales<br />
within the combined uncertainties, what are the reasons<br />
for the observed discrepancies in the spectral<br />
irradiance scales? In the infrared wavelength region<br />
from 900 to 2400 nm, the spectral irradiances <strong>of</strong><br />
the check st<strong>and</strong>ard lamps are within the assigned<br />
exp<strong>and</strong>ed uncertainties, although the irradiances<br />
were assigned in 1990. The larger deviations <strong>of</strong> the<br />
working st<strong>and</strong>ards can be attributed to the longer<br />
operational hours <strong>and</strong> reveal that the spectral irradiances<br />
<strong>of</strong> the working st<strong>and</strong>ards should have been<br />
verified against the check st<strong>and</strong>ards at shorter time<br />
intervals.<br />
Some <strong>of</strong> the differences from 250 to 900 nm that<br />
can be seen in Fig. 12�a� can also be attributed to<br />
temporal drift <strong>of</strong> the working st<strong>and</strong>ards because <strong>of</strong><br />
longer operational hours, but the comparison with<br />
the check st<strong>and</strong>ards shows that much <strong>of</strong> the differences<br />
between the detector-based scale <strong>and</strong> the scale<br />
realized in 1992 are also apparent in lamps that have<br />
not been utilized extensively. The spectral irradiance<br />
scales <strong>of</strong> 1990 <strong>and</strong> 1992 are both dependent on<br />
the radiance temperature <strong>and</strong> the spectral radiance<br />
scales. Because both the radiance temperature<br />
scales <strong>and</strong> the spectral radiance scales were found to<br />
5888 APPLIED OPTICS � Vol. 41, No. 28 � 1 October 2002<br />
Fig. 12. �a� Comparison from 250 to 900 nm <strong>of</strong> the difference <strong>of</strong><br />
the average <strong>of</strong> the spectral irradiances assigned in 1992 <strong>of</strong> three<br />
working st<strong>and</strong>ards F234, F302, <strong>and</strong> F210 to the detector-based<br />
spectral irradiances. The curve indicates the exp<strong>and</strong>ed uncertainties<br />
<strong>of</strong> the 1992 spectral irradiance scale. �b� A comparison<br />
from 800 to 2400 nm <strong>of</strong> the working st<strong>and</strong>ard lamps <strong>of</strong> the differences<br />
<strong>of</strong> the 1990 spectral irradiance scale to the detector-based<br />
scale. The curve indicates the exp<strong>and</strong>ed uncertainties <strong>of</strong> the 1990<br />
spectral irradiance assignments.<br />
be in agreement with the detector-based scale within<br />
the combined uncertainties, possible differences between<br />
the source-based <strong>and</strong> the detector-based spectral<br />
irradiances scales could have arisen in the<br />
process <strong>of</strong> deriving the spectral irradiance scale from<br />
the spectral radiance scale.<br />
The long time period between the spectral irradiance<br />
scale realizations <strong>of</strong> 1992 <strong>and</strong> 2000 partly<br />
results from the experimental difficulties in the realizations<br />
<strong>of</strong> a spectral irradiance scale with the<br />
gold freezing-point blackbody. The need for numerous<br />
transfer artifacts <strong>and</strong> systematic corrections<br />
that are due to the less than optimal<br />
performance <strong>of</strong> these artifacts prohibited frequent<br />
scale realizations. The new detector-based spectral<br />
irradiance scale realization relies only on an<br />
accurate radiance temperature determination <strong>of</strong> a<br />
HTBB whose adherence to the Planck radiance law
was verified by comparison with a blackbody with a<br />
known high emissivity. Initially, the detectorbased<br />
spectral irradiance scale realizations will be<br />
performed on an annual basis in FASCAL. With<br />
sufficient evidence that the spectral irradiance<br />
scale can be maintained on working st<strong>and</strong>ard lamps<br />
without increases in the errors that are due to longterm<br />
drift, the scale realizations will be performed<br />
on a less frequent basis.<br />
In the past scale realizations, spectral irradiance<br />
assignments at additional wavelengths have been<br />
difficult because <strong>of</strong> the lengthy procedure needed<br />
for the realizations. The temporal drift <strong>of</strong> the<br />
transfer artifacts used in the realization resulted in<br />
the limited number <strong>of</strong> wavelengths <strong>of</strong> the spectral<br />
irradiance assignments <strong>of</strong> the working st<strong>and</strong>ards.<br />
Because the HTBB used in the detector-based spectral<br />
irradiance scale is temporally stable with a<br />
drift <strong>of</strong> �1 K in 20 h at 3000 K, spectral irradiance<br />
assignments <strong>of</strong> working st<strong>and</strong>ards are possible at<br />
many additional wavelengths if desired by the optical<br />
measurement community. These spectral irradiance<br />
calibrations at much finer wavelength<br />
intervals can help to resolve issues such as the<br />
optimal interpolation algorithm for use in the calibration<br />
<strong>of</strong> spectroradiometers. 20<br />
6. Effect <strong>of</strong> the Changes That Are Due to the<br />
Detector-Based Spectral Irradiance Scale<br />
The greatest changes <strong>of</strong> the detector-based spectral<br />
irradiance scale realization result from the lower uncertainties,<br />
enabling measurements to be made with<br />
higher accuracy <strong>and</strong> confidence. However, if the<br />
dominant sources <strong>of</strong> the total measurement uncertainties<br />
were not due to the intrinsic scale uncertainties<br />
<strong>of</strong> the transfer artifact, then it would be difficult<br />
to utilize the lower uncertainties achieved with the<br />
detector-based scale. In addition, the small differences<br />
between the detector-based <strong>and</strong> the sourcebased<br />
spectral irradiance scales are within the<br />
exp<strong>and</strong>ed uncertainties <strong>of</strong> many measurement systems,<br />
including the spectroradiometers used in the<br />
ultraviolet monitoring <strong>of</strong> terrestrial solar spectral irradiance.<br />
21<br />
In the photometric community, possible changes<br />
could arise in the calibration <strong>of</strong> sources for color temperature.<br />
22 At <strong>NIST</strong>, color temperatures are assigned<br />
in the Photometric Calibration Facility by use<br />
<strong>of</strong> the relative spectral irradiance <strong>of</strong> FEL lamps. Because<br />
the spectral shapes <strong>of</strong> the source-based <strong>and</strong> the<br />
detector-based spectral irradiances in the wavelength<br />
region from 350 to 700 nm differ at most by<br />
�0.5% �Fig. 12�a��, the changes to the color temperature<br />
assignments will be negligible.<br />
7. Conclusion<br />
The realization <strong>of</strong> the <strong>NIST</strong> detector-based spectral<br />
irradiance scale was described. The realization is<br />
based on the absolute detector-based radiance temperature<br />
determinations <strong>of</strong> a HTBB <strong>and</strong> is now traceable<br />
to the HACR instead <strong>of</strong> a fixed-point blackbody.<br />
The differences in the spectral irradiances between<br />
the gold-point blackbody-based <strong>and</strong> the detectorbased<br />
scales are discussed, <strong>and</strong> the differences are<br />
found to agree within the combined uncertainties <strong>of</strong><br />
the measurements. The detector-based scale results<br />
in the reduction <strong>of</strong> the uncertainties from 250 to<br />
2400 nm with the greatest reduction occurring in the<br />
spectral range from 1000 to 2400 nm with reductions<br />
by almost a factor <strong>of</strong> 10. The new detector-based<br />
spectral irradiance scale realization also corrects the<br />
correlated deviations from a smooth Planck radiance<br />
law that existed in the old spectral irradiance scale.<br />
Finally, the differences in the way that the scale is<br />
derived represent a fundamental change in the scale<br />
realization <strong>of</strong> spectroradiometric sources, <strong>and</strong> these<br />
results are only the beginning <strong>of</strong> the implementation<br />
<strong>of</strong> the detector-based source scales at <strong>NIST</strong>.<br />
The authors gratefully acknowledge the help <strong>and</strong><br />
encouragement <strong>of</strong> B. Carol Johnson, Robert Saunders,<br />
<strong>and</strong> Al Parr <strong>of</strong> the Optical Technology Division<br />
at all stages <strong>of</strong> this project. The authors also acknowledge<br />
the assistance <strong>of</strong> Tom Larason <strong>and</strong><br />
George Eppeldauer in the development <strong>and</strong> characterization<br />
<strong>of</strong> the filter radiometers used in the scale<br />
realization.<br />
References<br />
1. A. C. Parr, “A national measurement system for radiometry,<br />
photometry, <strong>and</strong> pyrometry based upon absolute detectors,”<br />
<strong>NIST</strong> Tech. <strong>Note</strong> 1421 �<strong>National</strong> <strong>Institute</strong> <strong>of</strong> <strong>St<strong>and</strong>ards</strong> <strong>and</strong><br />
Technology, Gaithersburg, Md., 1996�.<br />
2. T. R. Gentile, J. M. Houston, <strong>and</strong> C. L. Cromer, “Realization <strong>of</strong><br />
a scale <strong>of</strong> absolute spectral response using the <strong>National</strong> <strong>Institute</strong><br />
<strong>of</strong> <strong>St<strong>and</strong>ards</strong> <strong>and</strong> Technology high-accuracy cryogenic radiometer,”<br />
Appl. Opt. 35, 4392–4403 �1996�.<br />
3. C. L. Cromer, G. Eppeldauer, J. E. Hardis, T. C. Larason, <strong>and</strong><br />
A. C. Parr, “<strong>National</strong> <strong>Institute</strong> <strong>of</strong> <strong>St<strong>and</strong>ards</strong> <strong>and</strong> Technology<br />
detector-based photometric scale,” Appl. Opt. 32, 2936–2948<br />
�1993�.<br />
4. Y. Ohno, “Improved photometric st<strong>and</strong>ards <strong>and</strong> calibration<br />
procedures at <strong>NIST</strong>,” J. Res. Natl. Inst. St<strong>and</strong>. Technol. 102,<br />
323–331 �1997�.<br />
5. K. D. Mielenz, R. D. Saunders, A. C. Parr, <strong>and</strong> J. J. Hsia, “The<br />
1990 <strong>NIST</strong> scales <strong>of</strong> thermal radiometry,” J. Res. Natl. Inst.<br />
St<strong>and</strong>. Technol. 95, 621–629 �1990�.<br />
6. J. H. Walker, R. D. Saunders, J. K. Jackson, <strong>and</strong> D. A. Mc-<br />
Sparron, “Spectral irradiance calibrations,” NBS Measurement<br />
Services SP 250-20 �<strong>National</strong> Bureau <strong>of</strong> <strong>St<strong>and</strong>ards</strong>,<br />
Gaithersburg, Md., 1987�.<br />
7. H. J. Kostkowski, D. E. Erminy, <strong>and</strong> A. T. Hattenburg, “Highaccuracy<br />
spectral radiance calibration <strong>of</strong> tungten-strip lamps,”<br />
Adv. Geophys. 14, 111–127 �1970�.<br />
8. K. D. Mielenz, R. D. Saunders, <strong>and</strong> J. B. Shumaker, “Spectroradiometric<br />
determination <strong>of</strong> the freezing temperature <strong>of</strong><br />
gold,” J. Res. Natl. Inst. St<strong>and</strong>. Technol. 95, 49–67 �1990�.<br />
9. V. I. Sapritsky, “Black-body radiometry,” Metrologia 32, 411–<br />
427 �1995–1996�.<br />
10. H. Preston-Thomas, “The ITS-90,” Metrologia 27, 3–10 �1990�.<br />
11. J. B. Fowler, R. D. Saunders, <strong>and</strong> A. C. Parr, “Summary <strong>of</strong> the<br />
high-accuracy aperture-area measurement capabilities at the<br />
<strong>NIST</strong>,” Metrologia 37, 621–623 �2000�.<br />
12. T. C. Larason, S. S. Bruce, <strong>and</strong> A. C. Parr, “Spectroradiometric<br />
detector measurements: Part I—Ultraviolet detectors <strong>and</strong><br />
Part II—Visible to near-infrared detectors,” <strong>NIST</strong> Measurement<br />
Services SP 250-41 �<strong>National</strong> <strong>Institute</strong> <strong>of</strong> <strong>St<strong>and</strong>ards</strong> <strong>and</strong><br />
Technology, Gaithersburg, Md., 1998�.<br />
1 October 2002 � Vol. 41, No. 28 � APPLIED OPTICS 5889
13. P. Sperfeld, J. Metzdorf, S. Gala Yousef, K. D. Stock, <strong>and</strong> W.<br />
Möller, “Improvement <strong>and</strong> extension <strong>of</strong> the blackbody-based<br />
spectral irradiance scale,” Metrologia 35, 267–271 �1998�.<br />
14. H. W. Yoon <strong>and</strong> C. E. Gibson, “Determination <strong>of</strong> radiance<br />
temperatures using detectors calibrated for absolute spectral<br />
power response,” in Proceedings <strong>of</strong> the Seventh International<br />
Symposium on Temperature <strong>and</strong> Thermal Measurements in Industry<br />
<strong>and</strong> Science, J. Dubbeldam <strong>and</strong> M. J. de Groot, eds.<br />
�Edauw <strong>and</strong> Johannisen, The Netherl<strong>and</strong>s, 1999�, pp. 737–742.<br />
15. P. Sperfeld, S. Galal-Yousef, J. Metzdorf, B. Nawo, <strong>and</strong> W.<br />
Moller, “The use <strong>of</strong> self-consistent calibrations to recover absorption<br />
b<strong>and</strong>s in the black-body spectrum,” Metrologia 37,<br />
373–376 �2000�.<br />
16. T. J. Quinn, Temperature �Academic, London, 1990�.<br />
17. A. Thompson <strong>and</strong> H. M. Chen, “Beamcon III: a linearity measurement<br />
instrument for optical detectors,” J. Res. Natl. Inst.<br />
St<strong>and</strong>. Technol. 99, 751–755 �1994�.<br />
5890 APPLIED OPTICS � Vol. 41, No. 28 � 1 October 2002<br />
18. H. W. Yoon <strong>and</strong> C. E. Gibson, “Comparison <strong>of</strong> the absolute<br />
detector-based spectral radiance assignment with the current<br />
<strong>NIST</strong>-assigned spectral radiance <strong>of</strong> tungsten strip lamps,”<br />
Metrologia 37, 429–432 �2000�.<br />
19. J. H. Walker, R. D. Saunders, J. K. Jackson, <strong>and</strong> K. D. Mielenz,<br />
“Results <strong>of</strong> a CCPR intercomparison <strong>of</strong> spectral irradiance<br />
measurements by national laboratories,” J. Res. Natl. Inst.<br />
St<strong>and</strong>. Technol. 96, 647–668 �1991�.<br />
20. L. K. Huang, R. P. Cebula, <strong>and</strong> E. Hilsenrath, “New procedure<br />
for interpolating <strong>NIST</strong> FEL lamp irradiances,” Metrologia 35,<br />
381–386 �1998�.<br />
21. G. Bernhard <strong>and</strong> G. Seckmeyer, “Uncertainty <strong>of</strong> measurements<br />
<strong>of</strong> spectral solar UV irradiance,” J. Geophys. Res. 104,<br />
14321–14345 �1999�.<br />
22. Y. Ohno, “Photometric calibrations,” <strong>NIST</strong> Measurement Services<br />
SP 250-37 �<strong>National</strong> <strong>Institute</strong> <strong>of</strong> <strong>St<strong>and</strong>ards</strong> <strong>and</strong> Technology,<br />
Gaithersburg, Md., 1997�.
Volume 101, Number 2, March–April 1996<br />
Journal <strong>of</strong> Research <strong>of</strong> the <strong>National</strong> <strong>Institute</strong> <strong>of</strong> <strong>St<strong>and</strong>ards</strong> <strong>and</strong> Technology<br />
[J. Res. Natl. Inst. St<strong>and</strong>. Technol. 101, 109 (1996)]<br />
The <strong>NIST</strong> Detector-Based Luminous<br />
Intensity Scale<br />
Volume 101 Number 2 March–April 1996<br />
C. L. Cromer, G. Eppeldauer,<br />
J. E. Hardis 1 , T. C. Larason,<br />
Y. Ohno, <strong>and</strong> A. C. Parr<br />
<strong>National</strong> <strong>Institute</strong> <strong>of</strong> <strong>St<strong>and</strong>ards</strong> <strong>and</strong><br />
Technology,<br />
Gaithersburg, MD 20899-0001<br />
1. Introduction<br />
Traditionally, st<strong>and</strong>ardization in photometry was a<br />
discipline driven by primary light sources, first c<strong>and</strong>les,<br />
then flames [1], carbon-filament lamps, <strong>and</strong>, beginning<br />
in 1948, blackbody radiators operated at the freezingpoint<br />
temperature <strong>of</strong> molten platinum [2]. The latter<br />
marked a turning point, because the platinum-point<br />
blackbody, valued for its reproducibility <strong>and</strong> universality<br />
compared with the earlier alternatives, was the first<br />
st<strong>and</strong>ard photometric source with radiometric properties<br />
that could be readily calculated, in principle.<br />
Over time, dissatisfaction with platinum-point blackbody<br />
st<strong>and</strong>ards grew. For the few national laboratories<br />
that had them, they were difficult to maintain. They<br />
operated at a temperature <strong>of</strong> little technological interest<br />
1 To whom correspondence should be sent, jhardis@nist.gov.<br />
The Système International des Unités (SI)<br />
base unit for photometry, the c<strong>and</strong>ela,<br />
has been realized by using absolute detectors<br />
rather than absolute sources. This<br />
change in method permits luminous intensity<br />
calibrations <strong>of</strong> st<strong>and</strong>ard lamps to be<br />
carried out with a relative exp<strong>and</strong>ed uncertainty<br />
(coverage factor k = 2, <strong>and</strong> thus a<br />
2 st<strong>and</strong>ard deviation estimate) <strong>of</strong> 0.46 %,<br />
almost a factor-<strong>of</strong>-two improvement. A<br />
group <strong>of</strong> eight reference photometers has<br />
been constructed with silicon photodiodes,<br />
matched with filters to mimic the<br />
spectral luminous efficiency function for<br />
photopic vision. The wide dynamic range<br />
<strong>of</strong> the photometers aid in their calibra-<br />
109<br />
tion. The components <strong>of</strong> the photometers<br />
were carefully measured <strong>and</strong> selected to<br />
reduce the sources <strong>of</strong> error <strong>and</strong> to provide<br />
baseline data for aging studies. Periodic<br />
remeasurement <strong>of</strong> the photometers indicate<br />
that a yearly recalibration is required.<br />
The design, characterization, calibration,<br />
evaluation, <strong>and</strong> application <strong>of</strong> the photometers<br />
are discussed.<br />
Key words: calibration; c<strong>and</strong>ela; illuminance;<br />
lumen; luminous intensity; lux;<br />
measurement; photometer; photometry;<br />
scale; st<strong>and</strong>ards; units.<br />
Accepted: December 11, 1995<br />
[taken first as 2045 K, later 2042 K, on the International<br />
Practical Temperature Scale <strong>of</strong> 1968 (IPTS-68)], <strong>and</strong> the<br />
applicability <strong>of</strong> this broadb<strong>and</strong> radiation to spectroradiometry<br />
was poor. In 1975, Blevin <strong>and</strong> Steiner [3],<br />
reflecting the mood <strong>of</strong> the period, made two proposals.<br />
They sought first to redefine the photometric base unit<br />
in a manner to fix its relationship with other Système<br />
International des Unités (SI) base units, such as the<br />
meter <strong>and</strong> the ampere. Second, they argued that the<br />
photometric base unit should be changed from the c<strong>and</strong>ela<br />
to the lumen, considering the close relationship<br />
between luminous flux (lumen, lm) 2 <strong>and</strong> radiometric<br />
power measurements (watt, W).<br />
2 As an aid to the reader, the appropriate coherent SI unit in which a<br />
quantity should be expressed is indicated in parenthesis when the<br />
quantity is first introduced.
Volume 101, Number 2, March–April 1996<br />
Journal <strong>of</strong> Research <strong>of</strong> the <strong>National</strong> <strong>Institute</strong> <strong>of</strong> <strong>St<strong>and</strong>ards</strong> <strong>and</strong> Technology<br />
After additional study <strong>and</strong> due consideration, in 1979<br />
the 16th Conférence Générale des Poids et Mesures<br />
(CGPM) adopted the first <strong>of</strong> these proposals. They abrogated<br />
the definition <strong>of</strong> the c<strong>and</strong>ela (originally called<br />
the new c<strong>and</strong>le) first adopted by the 8th Conférence<br />
Générale in 1948, <strong>and</strong> redefined it as follows [4]:<br />
The c<strong>and</strong>ela is the luminous intensity, in a given direction,<br />
<strong>of</strong> a source that emits monochromatic radiation<br />
<strong>of</strong> frequency 540 � 10 12 hertz <strong>and</strong> that has a<br />
radiant intensity in that direction <strong>of</strong> (1/683) watt per<br />
steradian.<br />
The 1979 redefinition <strong>of</strong> the c<strong>and</strong>ela permitted diverse<br />
methods to be used in deriving luminous intensity<br />
scales. All the methods also rely on the principles governing<br />
photometry as compiled by the Bureau International<br />
des Poides et Mesures (BIPM) for the Comité<br />
Consultatif de Photométrie et Radiométrie (CCPR) [5].<br />
These include the Commission Internationale de<br />
L’Éclairage (CIE) spectral luminous efficiency function<br />
for photopic (cone) vision, V(�), which relates visual<br />
sensitivities at different wavelengths [6]. (The lone frequency<br />
<strong>of</strong> 540 � 10 12 Hz mentioned in the definition<br />
has a wavelength <strong>of</strong> 555.016 nm in st<strong>and</strong>ard air, which<br />
for almost all purposes can be taken to be 555 nm<br />
without affecting the accuracy <strong>of</strong> a real measurement.)<br />
Since the redefinition, national st<strong>and</strong>ards laboratories<br />
[7–14] <strong>and</strong> other research facilities [15] have been free<br />
to realize the c<strong>and</strong>ela by use <strong>of</strong> whatever radiometric<br />
means they found most suitable. Most have used detectors<br />
that were equipped with filters that were designed<br />
to match their spectral responsivity to the V(�) function.<br />
At <strong>NIST</strong> [then the <strong>National</strong> Bureau <strong>of</strong> <strong>St<strong>and</strong>ards</strong><br />
(NBS)] the luminous intensity scale remained based on<br />
a st<strong>and</strong>ard source, a blackbody radiator operating at the<br />
freezing-point temperature <strong>of</strong> molten gold (the gold<br />
point) [7].<br />
As shown in Fig. 1, the blackbody radiation at the<br />
gold point (1337.58 K on IPTS-68) was used to calibrate<br />
a variable temperature blackbody, which provided the<br />
NBS scale <strong>of</strong> spectral radiance [16]. From this the spectral<br />
irradiance scale was derived [17]. The luminous<br />
intensity scale was derived through spectral irradiance<br />
measurements <strong>of</strong> selected lamps forming a primary reference<br />
group, which maintained the c<strong>and</strong>ela with respect<br />
to the spectral irradiance scale. A secondary reference<br />
group <strong>of</strong> lamps, calibrated against the primary<br />
group, was used for routine c<strong>and</strong>ela calibrations.<br />
All the measurements in this lineage compared a light<br />
source with another light source. The final measurement<br />
uncertainty <strong>of</strong> 0.8 % (2 st<strong>and</strong>ard deviation estimate)<br />
[18] contained a relatively large component from the<br />
uncertainty in the gold-point temperature at the top <strong>of</strong><br />
110<br />
Fig. 1. Calibration chain for luminous intensity prior to the present<br />
study.<br />
the chain (comparing IPTS-68 with thermodynamic<br />
temperature), <strong>and</strong> it was further limited by the longterm<br />
behavior <strong>of</strong> the inc<strong>and</strong>escent lamps that were used.<br />
In 1990, the introduction <strong>of</strong> the new International<br />
Temperature Scale (ITS-90) caused changes. The gold<br />
point was redefined as 1337.33 K [19], which caused<br />
the <strong>NIST</strong> luminous intensity scale to shift, depending on<br />
the color temperature <strong>of</strong> the source, by approximately<br />
0.35 % [20]. More important, <strong>NIST</strong> revised its procedures<br />
to decouple the spectral radiance scale from ITS-<br />
90. <strong>NIST</strong> now considers the gold-point temperature to<br />
be a measured rather than a defined quantity. While the<br />
current <strong>NIST</strong> measurement <strong>of</strong> 1337.33 K � 0.23 K (restated<br />
from ‘‘3�’’ to k = 2) [21] is in exact agreement<br />
with ITS-90, the new policy allows for the possibility <strong>of</strong><br />
future scale revisions as experimental information becomes<br />
available. The current <strong>NIST</strong> gold-point temperature<br />
<strong>of</strong> 1337.33 K is detector based. That is, the result<br />
follows from measurements using absolute radiometric<br />
detectors, a silicon photodiode <strong>and</strong> an electrically calibrated<br />
radiometer.<br />
The purpose <strong>of</strong> this paper is to describe the considerable<br />
simplification that results by realizing the c<strong>and</strong>ela<br />
against the detector base directly. We exp<strong>and</strong> upon our<br />
previous reports on this subject [22,23], giving more<br />
details behind the new <strong>NIST</strong> scale for luminous intensity
Volume 101, Number 2, March–April 1996<br />
Journal <strong>of</strong> Research <strong>of</strong> the <strong>National</strong> <strong>Institute</strong> <strong>of</strong> <strong>St<strong>and</strong>ards</strong> <strong>and</strong> Technology<br />
<strong>and</strong> discussing our experience with it. The benefits <strong>of</strong><br />
this conversion include reduced uncertainty in our calibration<br />
services <strong>and</strong> the additional flexibility to provide<br />
new calibration services for detector-based devices.<br />
2. Experimental Approach<br />
2.1 Mathematical Framework<br />
The photometric analog <strong>of</strong> power in radiometry is<br />
luminous flux, �v, (lm), where<br />
�v = Km� �e(�) V(�) d�, (1)<br />
�<br />
where �e(�) is the spectral radiant flux <strong>of</strong> the light<br />
(W/nm) <strong>and</strong> Km is the proportionality constant in the<br />
definition <strong>of</strong> the c<strong>and</strong>ela. While a strict reading <strong>of</strong> the<br />
definition gives Km = 683.002 lm/W [6], for almost all<br />
purposes it is taken to be 683 lm/W without affecting<br />
the accuracy <strong>of</strong> any real measurement.<br />
A photometer is a device that can be used to help<br />
measure such a flux. Typically, it has an output current 3<br />
I (ampere, A), where<br />
I =� �e(�) s(�) d�, (2)<br />
�<br />
where s(�) (A/W) is its spectral responsivity. It is advantageous<br />
to factor<br />
s(�) =s(555) sn(�), (3)<br />
where s(555) (A/W) is the value <strong>of</strong> s(�) at 555 nm. This<br />
emphasizes the similarity <strong>of</strong> sn(�)toV(�), both dimensionless<br />
functions that are normalized at 555 nm. It also<br />
permits the overall uncertainty <strong>of</strong> the spectral responsivity<br />
scale to be associated with one number, s(555),<br />
with the function sn(�) consisting <strong>of</strong> relative measurements<br />
only.<br />
The luminous responsivity [24] <strong>of</strong> the photometer is<br />
sv (A/lm), where<br />
sv = I<br />
�v<br />
= s(555)<br />
Km<br />
� �<br />
�e(�) sn(�) d�<br />
. (4)<br />
� �e(�)V(�)d�<br />
�<br />
For a perfect photometer, sn(�) would equal V(�), <strong>and</strong><br />
its luminous responsivity would be independent <strong>of</strong> the<br />
power distribution <strong>of</strong> the light. In practice, this approach<br />
3 Current is used as an example; the output might be a voltage instead.<br />
111<br />
requires knowing �e(�) in order to calculate a spectral<br />
mismatch correction factor<br />
F =<br />
� �e(�) V(�) d�<br />
�<br />
� �e(�)sn(�)d�<br />
�<br />
. (5)<br />
In general, the closer sn(�) istoV(�), the better F will<br />
be known for the same incertitude about �e(�).<br />
Figure 2 illustrates the application <strong>of</strong> such a photometer<br />
to luminous intensity measurement. In Fig. 2a, it is<br />
supposed that the photometer intercepts a beam <strong>of</strong> light,<br />
<strong>and</strong> that all the light illuminates only a portion <strong>of</strong> the<br />
active area <strong>of</strong> the photometer. In this case, the photometer<br />
would have an output current I from which the luminous<br />
flux <strong>of</strong> the beam could be determined, presuming<br />
that s(�) is sufficiently invariant from point to point over<br />
the active area:<br />
�v = Km FI<br />
. (6)<br />
s(555)<br />
In Fig. 2b, it is further supposed that the photometer is<br />
fitted with an aperture <strong>of</strong> precisely known area. Then, if<br />
the light is not confined to a small spot but rather overfills<br />
the aperture uniformly, the photometer would have<br />
an output current I that is proportional to the illuminance<br />
Ev (lumen per square meter, lux, lx) on the aperture.<br />
For an aperture area A (square meter, m 2 ),<br />
Fig. 2. Application <strong>of</strong> a photometer to luminous intensity measurement<br />
as a progression. (a) When the light beam underfills the entrance<br />
aperture, the photometer measures luminous flux (lm), the photometric<br />
analog to radiant power. The responsivities <strong>of</strong> our detectors were<br />
tested in at least seven positions, as shown. (b) When the light beam<br />
overfills the entrance aperture, the photometer measures illuminance<br />
(lx). (c) When the photometer is used with a point light source at a<br />
distance, the aperture area <strong>and</strong> the distance to the source combine to<br />
define a solid angle. The photometer then measures the luminous<br />
intensity (cd) <strong>of</strong> the source.
Volume 101, Number 2, March–April 1996<br />
Journal <strong>of</strong> Research <strong>of</strong> the <strong>National</strong> <strong>Institute</strong> <strong>of</strong> <strong>St<strong>and</strong>ards</strong> <strong>and</strong> Technology<br />
Ev = Km FI<br />
. (7)<br />
s(555)A<br />
Figure 2c shows the overall geometry for luminous intensity<br />
measurement. A point light-source a distance r<br />
from the plane <strong>of</strong> the aperture <strong>and</strong> lying on the normal<br />
to its center would have a luminous intensity Iv (lumen<br />
per steradian, c<strong>and</strong>ela, cd), where<br />
Iv = Km FIr 2<br />
s(555)A<br />
. (8)<br />
The applicability <strong>of</strong> these geometric prerequisites to<br />
real measurements is explored below.<br />
2.2 Description <strong>of</strong> the Photometers<br />
To measure photometric quantities <strong>and</strong> to maintain<br />
the luminous intensity scale at <strong>NIST</strong>, a group <strong>of</strong> eight<br />
photometers has been developed. Many laboratories<br />
have used absolute detectors such as electrically calibrated<br />
thermal detectors <strong>and</strong> self-calibrated silicon<br />
photodiodes to realize the c<strong>and</strong>ela. We chose to use<br />
calibrated silicon photodiodes because <strong>of</strong> their wider<br />
dynamic range <strong>and</strong> simplicity <strong>of</strong> operation. The photo-<br />
meters contain specially selected silicon photodiodes<br />
with V(�) matching filters, as well as the electronics to<br />
implement the high-sensitivity, wide-dynamic-range<br />
circuit previously described [25]. With an integration<br />
time <strong>of</strong> 1.67 s, a measurement b<strong>and</strong>width <strong>of</strong> 0.3 Hz, <strong>and</strong><br />
an amplifier gain <strong>of</strong> 10 11 V/A, the output voltage noise<br />
in these devices corresponds to � 1 fA <strong>of</strong> photocurrent.<br />
This important feature <strong>of</strong> the <strong>NIST</strong> detectors permits<br />
precise measurement <strong>of</strong> sn(�) even in the regions where<br />
its values are small.<br />
Figure 3 depicts the photometer design. The silicon<br />
photodiode, the V(�) correcting-filter package, <strong>and</strong> a<br />
precision aperture are mounted in the front piece <strong>of</strong> a<br />
cylindrical housing. A PTFE 4 disk <strong>of</strong> low electrical conductivity<br />
supports the photodiode; small pin-terminals<br />
in the disk form a socket. The V(�) filter is glued to a<br />
holder <strong>and</strong> is positioned close to the photodiode. On the<br />
front side <strong>of</strong> the filter, the precision aperture is glued to<br />
a holder. This holder is carefully machined so that its<br />
front surface, the frontmost surface <strong>of</strong> the photometer, is<br />
3.00 mm from the plane <strong>of</strong> the aperture knife edge. All<br />
these components are marked in a manner that permits<br />
us to preserve their orientation during disassembly <strong>and</strong><br />
reassembly.<br />
Fig. 3. Photometer design. A filter modifies the spectral responsivity <strong>of</strong> a silicon photodiode to replicate as<br />
closely as possible the 1924 CIE spectral luminous efficiency function for phototopic vision.<br />
112<br />
4 PTFE, polytetrafluoroethylene, is more commonly known as Teflon,<br />
which is a br<strong>and</strong> name for such materials.
Volume 101, Number 2, March–April 1996<br />
Journal <strong>of</strong> Research <strong>of</strong> the <strong>National</strong> <strong>Institute</strong> <strong>of</strong> <strong>St<strong>and</strong>ards</strong> <strong>and</strong> Technology<br />
The cylindrical housing itself, which extends back<br />
from the front piece shown in Fig. 3, contains an amplifier<br />
that also acts as a photocurrent-to-voltage converter.<br />
A switch selects the transimpedance gain <strong>of</strong> the amplifier,<br />
decade values from 10 4 � through 10 10 �. (Photometers<br />
1 <strong>and</strong> 2 also have 10 11 � ranges.) The characteristics<br />
<strong>of</strong> the filter <strong>and</strong> photodiode change with<br />
temperature, so the operating temperature <strong>of</strong> the photometer<br />
is monitored by a sensor inserted in the front wall<br />
<strong>of</strong> the housing [26]. The housing contains all additional<br />
components necessary for signal <strong>and</strong> temperature outputs;<br />
it is lighttight <strong>and</strong> acts as an electrical shield.<br />
2.3 The New Luminous Intensity Scale<br />
It is simpler to realize the c<strong>and</strong>ela by this approach,<br />
diagramed in Fig. 4. The luminous intensity scale is<br />
derived by measuring s(�) <strong>of</strong> each photometer in the<br />
group directly against the <strong>NIST</strong> spectral responsivity<br />
scale. The spectral responsivity scale is derived from<br />
comparative measurements against absolute radiometric<br />
detectors; at the time <strong>of</strong> the initial study, 100 % quantum<br />
efficient detectors [27] were the basis <strong>of</strong> the scale. Today,<br />
the scale is based on cryogenic radiometry 5 [28].<br />
With the application <strong>of</strong> the V(�) curve in Eq. (5), <strong>and</strong><br />
the application <strong>of</strong> the geometric definitions in Eq. (8),<br />
the c<strong>and</strong>ela is determined. Additionally, since the photometers<br />
do not age in use as rapidly as lamps do, an<br />
additional step to form a working group <strong>of</strong> photometers<br />
for routine use is unnecessary.<br />
Fig. 4. Calibration chain for luminous intensity as revised by the<br />
present study.<br />
5 The photometers cannot be compared directly against the cryogenic<br />
radiometer since the radiometer requires a laser light source. The<br />
parallel surfaces <strong>of</strong> the optical elements in the photometers might<br />
cause errors due to interference effects with such illumination.<br />
113<br />
3. Characterization <strong>of</strong> the Photometers<br />
3.1 Instrumentation <strong>and</strong> General Procedures<br />
The principal apparatuses used to study the photometers<br />
<strong>and</strong> their components are shown in Fig. 5. They<br />
comprise the Spectral Comparator Facility (SCF),<br />
which holds the <strong>NIST</strong> spectral responsivity scale referenced<br />
in Figs. 1 <strong>and</strong> 4. An ultraviolet (UV) instrument<br />
spans 200 nm to 400 nm; a visible/near-infrared (IR)<br />
instrument spans 350 nm to 1800 nm. A detector under<br />
test is held in a carriage that can be translated under<br />
computer control. Any point on the active area <strong>of</strong> the<br />
detector can be positioned at the focus <strong>of</strong> a nearly circular<br />
spot, 1.1 mm or 1.5 mm in diameter for the visible<br />
or UV system, respectively. The carriage also holds reference<br />
detectors that serve as secondary st<strong>and</strong>ards <strong>and</strong><br />
that are measured alternately with the device being<br />
tested. Compensation for changes in the light source<br />
during the course <strong>of</strong> the measurement is made by using<br />
the signal from a monitor detector. The computer controls<br />
the monochromator, which has a b<strong>and</strong>pass <strong>of</strong> 4 nm<br />
for this spot size <strong>and</strong> a spectral st<strong>and</strong>ard uncertainty <strong>of</strong><br />
� 0.2 nm [29]. The apparatuses typically deliver a few<br />
microwatts <strong>of</strong> optical power to the detector.<br />
Before the photometers were assembled, the SCF was<br />
used to study their components, both to diagnose systematic<br />
effects <strong>and</strong> as the basis for aging studies. When<br />
the spectral responsivity <strong>of</strong> an individual photodiode or<br />
a photometer (the photodiode, filter, <strong>and</strong> aperture together)<br />
was measured, the device itself was mounted on<br />
the carriage. For the spectral transmittance <strong>of</strong> a filter<br />
alone to be determined, the filter was held on the carriage,<br />
but a photodiode behind it was not. (Filter transmittance<br />
is the ratio <strong>of</strong> the apparent detector responsivity<br />
with <strong>and</strong> without the filter interposed in the beam.)<br />
In this case, the photodiode was tilted to prevent interreflections.<br />
Care was taken to insulate thermally the devices from<br />
the carriage, which heats up during use because <strong>of</strong> its<br />
stepping motors. The ambient temperature during measurement<br />
was monitored; when applicable, the temperature<br />
circuitry <strong>of</strong> the device under test was used. This<br />
permitted a direct comparison between the temperatures<br />
at calibration <strong>and</strong> use. Generally, variations in ambient<br />
temperature were held within � 1 �C during the course<br />
<strong>of</strong> a measurement.<br />
In addition to the optical calibrations performed at the<br />
SCF, the transimpedance gains <strong>of</strong> the photometer amplifiers<br />
were calibrated electrically. With this procedure,<br />
the photodiode is replaced by a computer-controlled<br />
voltage source, VIN, <strong>and</strong> a resistor substitution box in<br />
series. Unlike the internal resistors Rf built into the<br />
photometer heads, the external resistors REXT are easily<br />
remeasured. (As explained in Ref. [25], Rf is the trans-
Volume 101, Number 2, March–April 1996<br />
Journal <strong>of</strong> Research <strong>of</strong> the <strong>National</strong> <strong>Institute</strong> <strong>of</strong> <strong>St<strong>and</strong>ards</strong> <strong>and</strong> Technology<br />
Fig. 5. Facility used to calibrate the photometric detectors: (a) with visible <strong>and</strong> IR<br />
radiation, (b) with UV radiation.<br />
impedance gain <strong>of</strong> the amplifier.) For many combinations<br />
<strong>of</strong> internal <strong>and</strong> external resistors (as selected by the<br />
photometer gain switch <strong>and</strong> the substitution box, respectively),<br />
the output <strong>of</strong> the photometer, VOUT, is measured<br />
for a series <strong>of</strong> VIN. The linear coefficient <strong>of</strong> this dependence,<br />
as obtained from a least-squares fit, is equal to<br />
the corresponding Rf/REXT. This permits the individual<br />
values <strong>of</strong> Rf to be determined with a relative exp<strong>and</strong>ed<br />
uncertainty <strong>of</strong> < 0.01 % by data fitting. Calibrations on<br />
the SCF, reported in the unit volt per watt for an individual<br />
photometer gain-switch setting, can be transferred<br />
between different settings when these data are used.<br />
3.2 Photodiodes<br />
For this project we used Hamamatsu S1226 <strong>and</strong><br />
S1227 series photodiodes6 [30]. They were selected for<br />
6 Certain commercial equipment, instruments, or materials are identified<br />
in this paper to foster underst<strong>and</strong>ing. Such identification does not<br />
imply recommendation or endorsement by the <strong>National</strong> <strong>Institute</strong> <strong>of</strong><br />
<strong>St<strong>and</strong>ards</strong> <strong>and</strong> Technology, nor does it imply that the materials or<br />
equipment identified are necessarily the best available for the purpose.<br />
114<br />
the largest shunt resistance that the manufacturer could<br />
provide, 2.5 G� to 7.0 G�, in order to minimize noise<br />
<strong>and</strong> drift in the circuit [25]. This type <strong>of</strong> photodiode has<br />
less infrared sensitivity than some others, which is advantageous<br />
for photometry. As a consequence, their infrared<br />
response is more temperature dependent than the<br />
alternatives. We used quartz rather than glass or resin<br />
windows, since we found that the former had less surface<br />
scatter. S1227-1010BQ photodiodes having 1 cm 2<br />
area were used in Photometers 1 <strong>and</strong> 2 because they<br />
contained larger V(�) filters. The other six photometers<br />
used S1226-8BQ 0.3 cm 2 photodiodes, with the exception<br />
<strong>of</strong> Photometer 4, which contained an S1227-66BQ.<br />
(The only difference was in the case.)<br />
Figure 6 shows the absolute spectral responsivity <strong>of</strong><br />
three <strong>of</strong> these photodiodes, at one spot in their centers,<br />
as measured at the SCF. The dashed curve is the measurement<br />
<strong>of</strong> Photodiode 1. Photodiode 2 behaved similarly.<br />
The solid <strong>and</strong> dotted curves, measurements <strong>of</strong><br />
Photodiodes 7 <strong>and</strong> 8 respectively, bound the responsivity<br />
curves <strong>of</strong> the remaining photodiodes.
Volume 101, Number 2, March–April 1996<br />
Journal <strong>of</strong> Research <strong>of</strong> the <strong>National</strong> <strong>Institute</strong> <strong>of</strong> <strong>St<strong>and</strong>ards</strong> <strong>and</strong> Technology<br />
Fig. 6. Absolute responsivity <strong>of</strong> the silicon photodiodes used in the<br />
detectors. The dashed curve is Photodiode 1, type S1227-1010BQ.<br />
Photodiode 2, <strong>of</strong> the same type, matches very closely. The solid curve<br />
is Photodiode 7 <strong>and</strong> the dotted curve is Photodiode 8, both <strong>of</strong> type<br />
S1226-8BQ. All other photodiode curves are bounded by the latter<br />
two <strong>and</strong> are similarly shaped. The relative st<strong>and</strong>ard uncertainty <strong>of</strong><br />
0.3 % is commensurate with the curve widths.<br />
The eight photodiodes were chosen after screening<br />
many more for uniformity over their active areas, particularly<br />
the portion that would be visible through an aperture.<br />
Uniformity maps such as the one shown in Fig. 7<br />
for Photodiode 2 were made for each device. To construct<br />
a uniformity map, the photodiode responsivity<br />
was measured on the SCF on a grid <strong>of</strong> points 0.5 mm<br />
apart at three different wavelengths. Mathematica [31]<br />
was used to generate surface plots. Typically, the great-<br />
est responsivity was at the edge <strong>of</strong> the photodiode, as in<br />
Fig. 7 where the most sensitive spot is the lower right<br />
corner. The responsivities over the interior ‘‘bowl’’ <strong>of</strong><br />
the selected photodiodes were generally constant to better<br />
than 0.2 %.<br />
The change in photodiode responsivity due to a<br />
change in temperature is shown in Fig. 8. Six photodiodes,<br />
most <strong>of</strong> which were included among the final<br />
eight, were tested in a temperature-controlled housing.<br />
At each wavelength, the spectral responsivities <strong>of</strong> the six<br />
were measured at the SCF at 25 �C, 30 �C, <strong>and</strong> 35 �C.<br />
Figure 8 shows the average <strong>of</strong> the six results, the linear<br />
temperature dependence as determined through leastsquares<br />
fitting. For the wavelengths <strong>of</strong> most interest in<br />
photometry, 400 nm to 700 nm, the temperature dependence<br />
<strong>of</strong> the photodiode responsivity was < 0.03 %/�C.<br />
3.3 Filters<br />
We obtained layered, colored glass filters from various<br />
sources to benefit from the experience that this<br />
diversity <strong>of</strong>fers. Filters 1 <strong>and</strong> 2 were provided through<br />
the courtesy <strong>of</strong> the <strong>National</strong> Research Council <strong>of</strong><br />
Canada (NRC), Filter 3 was provided courtesy <strong>of</strong> the<br />
<strong>National</strong> Physical Laboratory <strong>of</strong> the U.K. (NPL), <strong>and</strong><br />
Filters 4 to 8 were manufactured by PRC Krochmann<br />
(PRC)[32]. Such filters are individually made to achieve<br />
a good realization <strong>of</strong> the V(�) function. First, the<br />
glasses are carefully chosen [8,33], <strong>and</strong> then the thicknesses<br />
<strong>of</strong> the individual glass layers are determined<br />
Fig. 7. Responsivity map <strong>of</strong> a typical photodiode used in this study. The responsivity <strong>of</strong> a photodiode (A/W) was measured while scanning a<br />
monochromatic probe beam over the surface. This photodiode, which was used in Photometer 2, is 1 cm on a side. The grey scale shows the<br />
responsivity at a point, referenced to the greatest value on the device (100 %). The contours indicate changes <strong>of</strong> 0.05 % in responsivity.<br />
115
Volume 101, Number 2, March–April 1996<br />
Journal <strong>of</strong> Research <strong>of</strong> the <strong>National</strong> <strong>Institute</strong> <strong>of</strong> <strong>St<strong>and</strong>ards</strong> <strong>and</strong> Technology<br />
Fig. 8. Temperature dependence <strong>of</strong> the silicon photodiodes at 30 �C. Responsivities <strong>of</strong> six<br />
photodiodes <strong>of</strong> the types used in this work were measured at 25 �C, 30 �C, <strong>and</strong> 35 �C. The<br />
plot shows the linear change in responsivity, as a fraction <strong>of</strong> their nominal values, averaged<br />
over the six photodiodes. Individual variations among the six generally agreed within the<br />
measurement noise. The error bars represent the statistically estimated st<strong>and</strong>ard deviation,<br />
from the sample <strong>of</strong> six.<br />
through an iterative procedure including repeated polishing<br />
<strong>and</strong> transmittance measurements. Filters 1 <strong>and</strong> 2<br />
were originally designed to match QED-200 trap detectors;<br />
Filter 3 was designed to match Centronics OSD<br />
300-5 photodiodes. Filters 4 to 8 were optimized to<br />
match our type <strong>of</strong> silicon photodiode.<br />
While spectral match is important, so that Eq. (5) is<br />
insensitive to �e(�), other important filter properties<br />
include the spatial uniformity, birefringence, <strong>and</strong> temperature<br />
dependence. Filters 4 to 8 were selected from<br />
among 24 c<strong>and</strong>idates after visual inspection. Filters with<br />
obvious dislocations, scratches, bubbles, <strong>and</strong> other optical<br />
defects were rejected. The remaining filters were<br />
screened for uniformity by scanning them with a whitelight<br />
spot 1.5 mm to 2.0 mm in diameter. Those with the<br />
sharpest <strong>and</strong> largest changes were eliminated.<br />
Since the filters are composed <strong>of</strong> dissimilar layers<br />
cemented together, any resulting strains might cause<br />
birefringence or a polarization-dependent transmittance.<br />
(The light from a monochromator during calibration<br />
is partially polarized.) To verify the absence <strong>of</strong> such<br />
a problem, representative filters were tested. A plane<br />
polarizer was interposed between the photometers <strong>and</strong> a<br />
lamp operating at approximately 2856 K. No change in<br />
signal above noise was noted as the photometer was<br />
rotated, limiting the potential error to 0.01 %. Nevertheless,<br />
c<strong>and</strong>idate filters that showed the greatest birefringence<br />
were also rejected.<br />
116<br />
After selecting the most promising filters, more detailed<br />
diagnostics were performed. Transmittance measurements<br />
were made in 5 nm intervals, <strong>and</strong> at many<br />
positions on the filters to determine their spatial uniformity.<br />
Hexagonal patterns were used, consisting <strong>of</strong> 37<br />
spots for the larger filters (1 <strong>and</strong> 2), <strong>and</strong> 7 spots for the<br />
smaller (3 to 7). Figure 9 shows the average transmittances<br />
<strong>of</strong> all spots measured on representative filters,<br />
using the SCF. Figure 9a compares representative filters<br />
from the different sources; others from a common<br />
source would be indistinguishable on the graph. However,<br />
Filter 8 was from a different batch <strong>and</strong> provided a<br />
better spectral match than the other PRC filters. The<br />
small difference between it <strong>and</strong> the others is highlighted<br />
in Fig. 9b.<br />
Figure 10 shows the variation among the measurements<br />
at the different spots, expressed as the scatter <strong>of</strong><br />
the measurements. Scatter in excess <strong>of</strong> the measurement<br />
noise (the heavy curves) represents non-uniformity in<br />
the filter transmittance. Figure 10b provides a striking<br />
illustration <strong>of</strong> how the individual layers in these filters<br />
contribute differently at different wavelengths. Below<br />
525 nm, the change in transmittance between Filters 5<br />
<strong>and</strong> 8 (seen in Fig. 9b) is well correlated with the improved<br />
uniformity <strong>of</strong> Filter 8.<br />
Of particular concern is the temperature dependence<br />
<strong>of</strong> the filter transmittance. Figure 11 shows representative<br />
data obtained by using a commercial spectrophotometer<br />
equipped with a sample heater.A3mmby10mm
Volume 101, Number 2, March–April 1996<br />
Journal <strong>of</strong> Research <strong>of</strong> the <strong>National</strong> <strong>Institute</strong> <strong>of</strong> <strong>St<strong>and</strong>ards</strong> <strong>and</strong> Technology<br />
Fig. 9a. Transmittance <strong>of</strong> the matching filters used in the detectors.<br />
The st<strong>and</strong>ard deviation <strong>of</strong> the measurements, as the percent <strong>of</strong> the<br />
signal, is shown. Representative samples <strong>of</strong> the filters from the three<br />
sources: Filter 2, NRC, dashed curve; Filter 3, NPL, dotted curve;<br />
Filter 5, PRC, solid curve.<br />
Fig. 9b. Transmittance <strong>of</strong> the matching filters used in the detectors.<br />
The st<strong>and</strong>ard deviation <strong>of</strong> the measurements, as the percent <strong>of</strong> the<br />
signal, is shown. Comparison <strong>of</strong> the two batches <strong>of</strong> PRC filters: Filter<br />
6, first batch, solid curve; Filter 8, second batch, dotted curve.<br />
probe beam was used. For Filter 3, this data is consistent<br />
with the filters discussed in Ref. [8]. This data is also<br />
consistent with the broadb<strong>and</strong> temperature dependence<br />
<strong>of</strong> the complete photometers, which is discussed in detail<br />
below.<br />
117<br />
Fig. 10a. Transmittance uniformity <strong>of</strong> the matching filters, comparing<br />
several positions on the filters. The variation between the measurements<br />
is given by their st<strong>and</strong>ard deviations from their means. NRC <strong>and</strong><br />
NPL filters. The heavy curves are the limiting measurement noise:<br />
solid for NRC, broken for NPL. Filter 1 (NRC) is the light solid curve;<br />
Filter 2 (NRC) is the light dashed curve; Filter 3 (NPL) is the light<br />
dotted curve.<br />
Fig. 10b. Transmittance uniformity <strong>of</strong> the matching filters, comparing<br />
several positions on the filters. The variation between the measurements<br />
is given by their st<strong>and</strong>ard deviations from their means. PRC<br />
filters. The heavy curve is the measurement noise. Filter 6 (first batch)<br />
is the light solid curve, <strong>and</strong> is typical <strong>of</strong> the others in the batch. Filter<br />
8 (second batch) is the light dashed curve.<br />
3.4 Apertures<br />
The photometers were fitted with precision apertures,<br />
nominally 0.5 cm 2 for Photometers 1 <strong>and</strong> 2, <strong>and</strong> 0.1 cm 2<br />
for Photometers 3 to 8. They were electr<strong>of</strong>ormed out <strong>of</strong><br />
nickel-clad copper <strong>and</strong> given a black, nickel finish. The<br />
fabrication <strong>and</strong> properties <strong>of</strong> similar apertures are discussed<br />
in Ref. [34]. Most important to us is the resultant<br />
knife-edge from this process, sharp <strong>and</strong> without burrs.<br />
However, such apertures may depart from circularity.
Volume 101, Number 2, March–April 1996<br />
Journal <strong>of</strong> Research <strong>of</strong> the <strong>National</strong> <strong>Institute</strong> <strong>of</strong> <strong>St<strong>and</strong>ards</strong> <strong>and</strong> Technology<br />
Fig. 11. Temperature dependence <strong>of</strong> the V(�) matching filters. Transmittances<br />
at 23 �C <strong>and</strong>33�C were measured using a Cary 2390<br />
spectrophotometer. The small differences plotted are <strong>of</strong> the same<br />
magnitude as the uncertainties in the measurements—this data is<br />
shown to illustrate the overall trend. �, Filter 2 (NRC); �, Filter 3<br />
(NPL); �, Filter 5 (PRC).<br />
The Precision Engineering Division at <strong>NIST</strong> measured<br />
<strong>and</strong> certified the areas using a View Engineering<br />
Precis 3000 vision-based measuring machine [35]. After<br />
a pass was made to find the approximate center <strong>of</strong> the<br />
aperture, 720 radii were measured from the center to the<br />
lip at 0.5� angular intervals. The measurements were not<br />
sensitive to the method <strong>of</strong> lighting the aperture (i.e.,<br />
different forms <strong>of</strong> front <strong>and</strong> back lighting). The area was<br />
estimated from these radii by a polygonal approximation.<br />
The combined st<strong>and</strong>ard uncertainties <strong>of</strong> the radii<br />
measurement <strong>and</strong> the area estimation were given as<br />
0.02 % for the larger apertures <strong>and</strong> 0.05 % for the<br />
smaller. Since the coefficient <strong>of</strong> linear thermal expansion<br />
for copper is � 0.0017 %/�C, temperature corrections<br />
were unnecessary.<br />
3.5 Assembled Photometers<br />
After the photodiode, filter, <strong>and</strong> apertures were individually<br />
tested, they were assembled into photometers as<br />
shown in Fig. 3. The advantage to calibrating the components<br />
assembled is that internal reflections <strong>and</strong> scattering<br />
have similar effects during both calibration <strong>and</strong><br />
use. The essential role <strong>of</strong> the SCF is to calibrate the<br />
spectral responsivity s(�) <strong>of</strong> the photometers to determine<br />
s(555) [Eq. (3)] <strong>and</strong> F [Eq. (5)]. The small output<br />
spot from the SCF can be positioned at various places<br />
within the aperture.<br />
The first attempt at calibrating the photometers was<br />
to measure s(�) at seven positions within the aperture,<br />
comprising the vertices <strong>and</strong> center <strong>of</strong> a regular hexagon.<br />
(Photometers 1 <strong>and</strong> 2 were measured at 37 positions,<br />
which formed a larger, regular hexagonal pattern.) The<br />
average over these positions was taken to be s(�) for the<br />
photometer as a whole. However, consistency among the<br />
photometer calibrations was improved by a factor <strong>of</strong> two<br />
by using the following method.<br />
s(�) was first measured at 5 nm intervals at one<br />
position near the center <strong>of</strong> the aperture <strong>of</strong> each photometer.<br />
Data from representative photometers are shown<br />
in Fig. 12a. Of particular importance in these data is the<br />
degree <strong>of</strong> IR <strong>and</strong> UV suppression, the latter including<br />
both transmission <strong>and</strong> fluorescence signals.<br />
However, a correction was needed because s(�)<br />
varied over the aperture area. The spectral responsivity<br />
<strong>of</strong> each photometer, relative to the center point, was<br />
determined at 50 nm intervals on a fine, rectangular<br />
mesh <strong>of</strong> points. For the larger apertures (Photometers 1<br />
<strong>and</strong> 2) the step size was 0.25 mm; for the smaller apertures<br />
(Photometers 3 to 8) the step size was 0.2 mm.<br />
Measurements that were not affected by the aperture<br />
edge were averaged.<br />
Figure 12b shows such data, the ratio <strong>of</strong> the average<br />
responsivity to the responsivity <strong>of</strong> the center spot. Polynomial<br />
fits are made to these data in order to interpolate<br />
between them. This permits us to estimate the average<br />
responsivity, given the center point responsivity, at all<br />
wavelengths. After application to the data in Fig. 12a,<br />
the final spectral responsivities for representative photometers<br />
are shown in Fig. 12c. The scatter given in the<br />
lower part <strong>of</strong> the figure is only the statistical noise <strong>of</strong><br />
measuring s(�) at the center. Additional uncertainties<br />
also apply, <strong>and</strong> they are discussed below. During the<br />
calibration process the temperature <strong>of</strong> a photometer was<br />
monitored using its built-in thermometer. Variations<br />
were generally held to � 1 �C. The average temperature<br />
was recorded for each photometer to be used for temperature<br />
dependence corrections.<br />
Fig. 12a. Responsivity <strong>of</strong> the filtered photodiode packages with emphasis<br />
on their behavior in the UV <strong>and</strong> IR. One spot in the center <strong>of</strong><br />
the aperture is probed. The measurement uncertainty at this spot is<br />
commensurate with the width <strong>of</strong> the curve in the visible, with the<br />
apparent scatter <strong>of</strong> the data in the IR, <strong>and</strong> shown by error bars in the<br />
UV. Representative packages: Photometer 2, NRC, dashed curve; Photometer<br />
3, NPL, dotted curve; Photometer 5, PRC, solid curve.<br />
118
Volume 101, Number 2, March–April 1996<br />
Journal <strong>of</strong> Research <strong>of</strong> the <strong>National</strong> <strong>Institute</strong> <strong>of</strong> <strong>St<strong>and</strong>ards</strong> <strong>and</strong> Technology<br />
Fig. 12b. Comparison <strong>of</strong> responsivity at the center spot with the<br />
average <strong>of</strong> many spots over the face <strong>of</strong> the aperture. Data taken at 50<br />
nm intervals are interpolated by polynomial fits. The correction factor<br />
converts the responsivity at the center to the average responsivity over<br />
the face <strong>of</strong> the aperture. The curves are as in Fig. 12a.<br />
Fig. 12c. Responsivity <strong>of</strong> the filtered photodiode packages. The<br />
curves are as in Fig. 12a, after the corrections in Fig. 12b have been<br />
applied. The st<strong>and</strong>ard deviation <strong>of</strong> the measurements is shown below.<br />
Figure 13 shows the mesh <strong>of</strong> spectral responsivity<br />
measurements in more detail. Photometer 3 provides a<br />
striking illustration <strong>of</strong> how spatial nonuniformities may<br />
be associated with the individual glass layers in a filter,<br />
each affecting a particular wavelength b<strong>and</strong>. This data<br />
also helps to estimate the systematic error that might<br />
arise if the aperture is not fully <strong>and</strong> uniformly illuminated<br />
during a measurement.<br />
s(�) varies with the temperature <strong>of</strong> the photodiode<br />
<strong>and</strong> the filter, as shown in Figs. 8 <strong>and</strong> 11. We measured<br />
the overall temperature effect by operating representative<br />
photometers at elevated temperatures. Figure 14<br />
diagrams the experimental setup. A photometer was<br />
119<br />
placed in a heated, plastic foam box <strong>and</strong> left to reach<br />
thermal equilibrium overnight. It was illuminated in the<br />
normal manner by an inside-frosted lamp <strong>of</strong> the type<br />
formerly used at <strong>NIST</strong> for luminous intensity calibrations.<br />
The lamp had a color temperature � 2856 K. A<br />
temperature-controlled monitor detector with a V(�)<br />
filter was used to compensate for the variation in lamp<br />
output from lighting to lighting.<br />
Figure 15 shows the results. The luminous responsivity<br />
<strong>of</strong> the photometers decreased with increasing temperature,<br />
as measured with each photometer’s built-in<br />
thermometer. As expected, the data form clusters that<br />
depend on the filter construction. Therefore, all data<br />
concerning filters from the same source are considered<br />
together <strong>and</strong> fit to a common line. Compared with the<br />
value when the photometer was unheated, the responsivity<br />
<strong>of</strong> Photometer 3 decreased by 0.049 %/�C, the<br />
responsivities <strong>of</strong> Photometers 1 <strong>and</strong> 2 decreased by<br />
0.063 %/�C, <strong>and</strong> the rest decreased by 0.088 %/�C. The<br />
st<strong>and</strong>ard uncertainty <strong>of</strong> these results is < 0.002 %/�C.<br />
The temperature effect would be different when measuring<br />
sources with other spectral compositions.<br />
Direct comparison <strong>of</strong> these results with the data <strong>of</strong><br />
Fig. 11 is difficult because <strong>of</strong> the large uncertainties in<br />
the latter. Nevertheless, the spectral temperature dependence<br />
presented in Figs. 8 <strong>and</strong> 11 corresponds to broadb<strong>and</strong><br />
changes (as above) <strong>of</strong> 0.08 %/�C, 0.06 %/�C, <strong>and</strong><br />
0.10 %/�C, respectively. The largest discrepancy is for<br />
Photometer 3. Ref. [8] gives an independent measurement<br />
<strong>of</strong> 0.12 %/�C for a similar photometer.<br />
Pertinent aspects <strong>of</strong> the photometers are summarized<br />
in Table 1. As explained in Ref. [25], the higher the<br />
shunt resistance <strong>of</strong> the photodiode, the better can be the<br />
signal-to-noise ratio <strong>of</strong> the circuit. A limiting photocurrent<br />
noise � 1 fA in Photometers 1 <strong>and</strong> 2 corresponds to<br />
a sensitivity limit � 10 �7 lx. Besides the spectral correction<br />
factor F, a traditional metric <strong>of</strong> the match <strong>of</strong><br />
sn(�)toV(�)isf1'[24], which is also shown in the table.<br />
3.6 Illuminance Uncertainty<br />
Following Eq. (7), the relative combined st<strong>and</strong>ard uncertainty,<br />
uc,r, <strong>of</strong> the illuminance responsivity I/Ev <strong>of</strong> the<br />
photometers arises from the st<strong>and</strong>ard uncertainties <strong>of</strong><br />
s(555), F, <strong>and</strong>A. They are summarized in Table 2. By<br />
adopting the terminology <strong>of</strong> the BIPM [36] <strong>and</strong> ISO<br />
[18], the uncertainties are categorized as Type A, meaning<br />
those that were evaluated from the statistics <strong>of</strong> repeated<br />
measurements; <strong>and</strong> Type B, meaning those that<br />
were not (such as estimates <strong>of</strong> possible systematic effects<br />
based on scientific judgment). These uncertainties<br />
are reported in relative (that is, fractional) form, as percentages,<br />
because <strong>of</strong> the way the uncertainties scale <strong>and</strong><br />
combine in Eq. (7).
Volume 101, Number 2, March–April 1996<br />
Journal <strong>of</strong> Research <strong>of</strong> the <strong>National</strong> <strong>Institute</strong> <strong>of</strong> <strong>St<strong>and</strong>ards</strong> <strong>and</strong> Technology<br />
Fig. 13. Responsivity map <strong>of</strong> representative photometers. The responsivities (A/W) <strong>of</strong> the photometers were measured while scanning a monochromatic<br />
probe beam over the aperture area. Photometer 2 had an aperture diameter <strong>of</strong> 7.98 mm; the others had a diameter <strong>of</strong> 3.57 mm. The grey<br />
scale shows the responsivity at a point, referenced to the greatest value measured (100 %). The contours indicate changes <strong>of</strong> 0.05 % in responsivity.<br />
Fig. 14. Arrangement to determine the overall temperature dependence<br />
<strong>of</strong> the photometers. The photometer was allowed to reach thermal<br />
equilibrium overnight in an insulated box also containing a resistance<br />
heater. The photometric responsivity <strong>of</strong> the photometer was<br />
then measured, using a temperature-controlled detector to compensate<br />
for variations in the reference lamp.<br />
120<br />
The principal uncertainty in s(555) is that <strong>of</strong> the<br />
<strong>NIST</strong> spectral responsivity scale. The currently accepted<br />
relative st<strong>and</strong>ard uncertainty <strong>of</strong> 0.11 % [37]<br />
arises largely from the uncertainty in the absolute spectral<br />
responsivity <strong>of</strong> silicon photodiode trap detectors,<br />
with smaller additional contributions resulting from<br />
comparisons between the trap detectors <strong>and</strong> the working<br />
st<strong>and</strong>ards. The uncertainty that arose from r<strong>and</strong>om effects<br />
in comparing the photometers with the scale, obtained<br />
by averaging the st<strong>and</strong>ard uncertainties shown in<br />
Fig. 12c for the eight photometers, is 0.04 %.<br />
Calculation <strong>of</strong> F [Eq. (5)] requires knowledge or presumption<br />
<strong>of</strong> the spectral distribution <strong>of</strong> the source,<br />
�e(�). Since the photometers are normally illuminated<br />
by an inc<strong>and</strong>escent lamp operating with a color temper-
Volume 101, Number 2, March–April 1996<br />
Journal <strong>of</strong> Research <strong>of</strong> the <strong>National</strong> <strong>Institute</strong> <strong>of</strong> <strong>St<strong>and</strong>ards</strong> <strong>and</strong> Technology<br />
Fig. 15. Temperature dependence <strong>of</strong> photometer luminous responsivity<br />
when viewing a broadb<strong>and</strong> source at 2856 K. Photometer number<br />
(filter source): �, 3 (NPL); �, 1 (NRC); +, 2 (NRC); �, 5 (PRC); ◆,<br />
6 (PRC); �, 8 (PRC). Linear fits include all data from each filter<br />
source.<br />
ature <strong>of</strong> 2856 K (CIE Source-A), we begin by presuming<br />
Planckian distributions. Following Eq. (3), only the<br />
uncertainty <strong>of</strong> sn(�) relative to the <strong>NIST</strong> scale matters.<br />
The statistical noise <strong>of</strong> the responsivity measurements is<br />
shown in Fig. 12c. After adding their effects in quadrature,<br />
the resultant uncertainty <strong>of</strong> the �e(�)-weighted<br />
integral in F is 0.01 %. (This result presumes that the<br />
possible error that is accounted for under the 0.11 %<br />
spectral responsivity scale uncertainty is uniform for all<br />
wavelengths. If it varies with wavelength, the possible<br />
error in F may be greater than 0.01 %. Nevertheless, for<br />
the purpose <strong>of</strong> analysis <strong>of</strong> the combined uncertainty in<br />
illuminance calibration, this effect is accounted for by<br />
the spectral responsivity scale uncertainty already in the<br />
budget.)<br />
An uncertainty is also introduced from the correction<br />
polynomials, which do not pass directly through the data<br />
points in Fig. 12b, <strong>and</strong> which slightly differ in additional<br />
ways from the exact correction functions. This is, at<br />
worst, a 0.01 % effect. Further, there is an uncertainty<br />
as to how well the aperture averages are computed.<br />
Table 1. Summary <strong>of</strong> the photometers<br />
Patches <strong>of</strong> area within the apertures that were near the<br />
center were covered approximately five times by the<br />
probe beam. Portions near the rim <strong>of</strong> the aperture were<br />
covered no more than once. This center-weighting<br />
would tend to bias the average if the responsivity varied<br />
radially, which Fig. 13 shows to be the case at 500 nm<br />
for Photometers 2 <strong>and</strong> 3. While the uncertainties due to<br />
nonuniform responsivity are difficult to quantify, given<br />
the typical magnitudes shown in Figs. 12b <strong>and</strong> 13, we<br />
estimate that the nonuniformity causes an additional<br />
0.02 % relative st<strong>and</strong>ard uncertainty in determining<br />
s(�).<br />
When an actual lamp is used, its color temperature<br />
may be other than the desired 2856 K or its spectrum<br />
may be other than true Planckian. Figure 16 shows the<br />
sensitivity <strong>of</strong> F to variations in blackbody temperature<br />
for the different types <strong>of</strong> filters used. For an uncertainty<br />
in the temperature <strong>of</strong> � 10 K, the uncertainty in F<br />
amounts to no more than 0.02 %. To quantify the non-<br />
Planckian effect, we measured the spectral irradiance <strong>of</strong><br />
five inside-frosted lamps <strong>of</strong> the type formerly issued by<br />
<strong>NIST</strong> for luminous intensity st<strong>and</strong>ards. While their correlated<br />
color temperatures were � 2850 K, their distribution<br />
temperatures were within 3 K. Equation (5) was<br />
evaluated for each photometer <strong>and</strong> for each lamp using<br />
its actual spectra, <strong>and</strong> the results were no more than<br />
0.02 % greater than when presuming a 2856 K blackbody.<br />
The evaluation <strong>of</strong> F does not include infrared <strong>and</strong><br />
ultraviolet response beyond the domain <strong>of</strong> V(�). However,<br />
each is a potential problem. Evaluation <strong>of</strong> Eq. (2)<br />
using the spectral responsivity data <strong>of</strong> Fig. 12a shows<br />
that the infrared response (800 nm to 1100 nm) is less<br />
than 0.003 % <strong>of</strong> the signal for a 2856 K radiator. Ultraviolet<br />
response (200 nm to 400 nm) is less than 0.002 %.<br />
Two experimental factors characteristic <strong>of</strong> the SCF<br />
affect the responsivity calibration through both s(555)<br />
<strong>and</strong> F. First, the integral in Eq. (2) is dependent on the<br />
wavelength calibration <strong>of</strong> the SCF. Numerical simulation<br />
using the responsivities <strong>of</strong> the photometers (Fig.<br />
12c) <strong>and</strong> 2856 K blackbody sources shows that F/s(555)<br />
Shunt resistance Calibration F f1'<br />
Photometer Photodiode (G�) Filter source (nA/lx) (2856 K) (%)<br />
1 S1227-1010BQ 5 NRC 10.116 1.002 6.00<br />
2 S1227-1010BQ 5.2 NRC 10.067 1.003 5.97<br />
3 S1226-8BQ 7 NPL 2.821 0.954 7.26<br />
4 S1227-66BQ 6.6 PRC 2.350 0.990 2.55<br />
5 S1226-8BQ 7 PRC 2.335 0.989 2.35<br />
6 S1226-8BQ 7 PRC 2.331 0.990 2.37<br />
7 S1226-8BQ 7 PRC 2.341 0.987 2.79<br />
8 S1226-8BQ 4.3 PRC 2.334 1.000 1.43<br />
121
Volume 101, Number 2, March–April 1996<br />
Journal <strong>of</strong> Research <strong>of</strong> the <strong>National</strong> <strong>Institute</strong> <strong>of</strong> <strong>St<strong>and</strong>ards</strong> <strong>and</strong> Technology<br />
Table 2. Uncertainty budget for illuminance calibration<br />
Relative<br />
st<strong>and</strong>ard uncertainty (%)<br />
Source <strong>of</strong> uncertainty Type A Type B<br />
s(555)<br />
F<br />
Spectral responsivity scale 0.11<br />
Comparison <strong>of</strong> photometer with scale 0.04<br />
Measurement scatter (noise) 0.01<br />
Data fitting procedure 0.01<br />
Residual non-uniformity within aperture 0.02<br />
Color temperature <strong>of</strong> lamp(� 10 K) 0.02<br />
Planckian approximation for lamp 0.02<br />
Infrared leakage 0.003<br />
Ultraviolet leakage <strong>and</strong> fluorescence 0.002<br />
Correlated s(555) <strong>and</strong> F<br />
Wavelength calibration 0.04<br />
Numerical aperture 0.05<br />
A<br />
Additional<br />
Aperture area (as certified, small apertures) 0.05<br />
Temperature variation 0.03<br />
Polarization sensitivity 0.01<br />
Electrical current-to-voltage conversion 0.003<br />
Responsivity nonlinearity 0.001<br />
Other 0.12<br />
Combined st<strong>and</strong>ard uncertainty 0.19<br />
Exp<strong>and</strong>ed uncertainty (k = 2) 0.39<br />
Fig. 16. Effect on photometer calibration when sources at different<br />
temperatures T are viewed. The required correction is reported as<br />
F(T)/F(2856 K). Representative packages: Photometer 2, dashed<br />
curve; Photometer 3, dotted curve; Photometer 5, solid curve; Photometer<br />
8, dash-dot curve.<br />
varies by 0.69 %/nm <strong>of</strong> <strong>of</strong>fset. The wavelength calibration<br />
uncertainty <strong>of</strong> 0.2 nm leads to an uncertainty <strong>of</strong><br />
0.14 % in the calibration <strong>of</strong> the photometer.<br />
122<br />
Second, s(�) measurements can be affected by the<br />
angular convergence (to a focus) <strong>of</strong> the probe spot. The<br />
optical density <strong>of</strong> the filter would appear too large when<br />
a light ray from the monochromator intersects it<br />
obliquely, giving an erroneously low value <strong>of</strong> s(�).<br />
While the photometer is aligned normal to the beam axis<br />
within a few milliradians by retroreflecting the alignment<br />
laser shown in Fig. 5, the lamp sources are focused<br />
using f/9 optics, which have a maximal angle <strong>of</strong> incidence<br />
<strong>of</strong> 55 mrad. Presuming the sole effect <strong>of</strong> the filter<br />
is absorption, excluding front-surface reflection, the<br />
proportionately longer path length at that angle for the<br />
data in Fig. 9 would bias the integral in Eq. (2) by<br />
0.20 % (Photometers 1 <strong>and</strong> 2, the worst case). The actual<br />
bias would be less, considering the distribution <strong>of</strong><br />
angles within the ray bundle <strong>and</strong> the reflection that was<br />
ignored. Since the bias varies as � 2 , a uniform distribution<br />
<strong>of</strong> rays would give an overall bias <strong>of</strong> 0.10 %.<br />
To mitigate these two effects <strong>and</strong> to improve accuracy,<br />
we used both the SCF <strong>and</strong> the <strong>NIST</strong> Reference Spectrophotometer<br />
[38] to measure the transmittance <strong>of</strong> the<br />
V(�) filters. Comparison <strong>of</strong> the data, matching peak
Volume 101, Number 2, March–April 1996<br />
Journal <strong>of</strong> Research <strong>of</strong> the <strong>National</strong> <strong>Institute</strong> <strong>of</strong> <strong>St<strong>and</strong>ards</strong> <strong>and</strong> Technology<br />
position <strong>and</strong> shape, indicated that the two sources <strong>of</strong><br />
bias on the SCF fortuitously canceled each other. The<br />
residual uncertainty in the responsivity caused by the<br />
wavelength scale is 0.04 %, <strong>and</strong> that caused by the SCF<br />
optics is 0.05 %.<br />
The Precis 3000 aperture area measurements, for Eq.<br />
(7), are given in Table 3, <strong>and</strong> their uncertainty is included<br />
in Table 2. While these measurements were made<br />
while the apertures were detached, we also sought to<br />
confirm their behavior when they were installed in the<br />
photometers. For this, we used the SCF. Consider the<br />
output light beam from the monochromator as having a<br />
principle axis <strong>and</strong> an irradiance B(x', y') (W/m2 )ina<br />
plane more-or-less perpendicular to this axis, its coordinate<br />
origin at the intersection point. The photometers<br />
were mounted on the x-y carriage, in order to position<br />
the probe beam axis at point (x, y) in the aperture plane.<br />
If s(x, y) is the responsivity s(�) <strong>of</strong> the photometer at<br />
(x, y) with a wavelength setting � <strong>of</strong> the monochromator,<br />
the total signal from the photometer<br />
�<br />
I(x, y)=�� s(x +x', y + y') B(x', y') dx' dy'. (9)<br />
��<br />
Using the x-y carriage, the probe beam can be scanned<br />
over the photometer in fine steps, <strong>and</strong> the output<br />
summed, approximating<br />
�<br />
=��<br />
�<br />
�� I(x, y)dxdy=<br />
��<br />
�<br />
���� s(x +x', y + y') B(x', y') dx' dy' dx dy<br />
��<br />
�����<br />
�<br />
=����<br />
�<br />
��<br />
s(x +x', y + y') dxdy�B(x', y') dx' dy'<br />
�<br />
s(x, y)dxdy����<br />
B(x', y') dx' dy'. (10)<br />
Table 3. Aperture area measurements<br />
(The separation follows after transforming the inner integral,<br />
x→x � x'.) The first integral on the right is the<br />
product <strong>of</strong> the aperture area <strong>and</strong> the average photometer<br />
responsivity within that area. It is the important quantity<br />
for any sort <strong>of</strong> irradiance measurement instrument, including<br />
the photometer described in Eq. (7). The second<br />
integral is just the total beam power B(W). Given an<br />
independent determination <strong>of</strong> the average s(�) within<br />
the active area <strong>of</strong> the aperture, by completely overscanning<br />
the aperture with small step size �x <strong>and</strong> �y, the<br />
aperture area A is given by<br />
� I(x, y) �x �y<br />
A =<br />
. (11)<br />
Bs(�)<br />
This fine scanning was, in fact, the exercise reported<br />
in connection with Figs. 12b <strong>and</strong> 13. Such area computations,<br />
averaged over wavelength, are also shown in<br />
Table 3. The uncertainty due to the scatter <strong>of</strong> the data <strong>of</strong><br />
different wavelengths is shown as well.<br />
It is clear that there is an unresolved discrepancy<br />
between the two methods. It cannot be accounted for<br />
solely by temperature variations, the residual uncertainty<br />
in the average responsivity, or the reliability <strong>of</strong> the<br />
displacement measurements �x <strong>and</strong> �y. Numerical<br />
modeling indicates that a small portion <strong>of</strong> it may arise<br />
from reflections <strong>and</strong> scattering within the photometer,<br />
where the back side <strong>of</strong> the aperture traps light that<br />
would otherwise escape. The discrepancy does not cast<br />
doubt on the actual aperture areas, as the Precis 3000<br />
measurements differed on average by only 0.01 % from<br />
independent measurements made by the aperture manufacturer.<br />
Either the problem lies in this second method<br />
<strong>of</strong> determining areas, or there may be an unaccounted<br />
aspect <strong>of</strong> the photometers themselves. An additional<br />
uncertainty component <strong>of</strong> 0.12 % is included in the<br />
uncertainty budget to account for this <strong>and</strong> other possible<br />
influences.<br />
Photometer Precis 3000 SCF Ratio<br />
number (cm 2 ) (cm 2 ) SCF/Precis<br />
1 0.500044 (1 � 0.02 %) 0.500492 (1 � 0.03 %) 1.0009<br />
2 0.499756 (1 � 0.02 %) 0.501015 (1 � 0.04 %) 1.0025<br />
3 0.099964 (1 � 0.05 %) 0.100298 (1 � 0.08 %) 1.0033<br />
4 0.100065 (1 � 0.05 %) 0.100534 (1 � 0.05 %) 1.0047<br />
5 0.100042 (1 � 0.05 %) 0.100375 (1 � 0.02 %) 1.0033<br />
6 0.099969 (1 � 0.05 %) 0.100345 (1 � 0.05 %) 1.0038<br />
7 0.100065 (1 � 0.05 %) 0.100399 (1 � 0.06 %) 1.0033<br />
8 0.099857 (1 � 0.05 %) 0.100206 (1 � 0.06 %) 1.0035<br />
Average (3 to 8) 1.0037<br />
123
Volume 101, Number 2, March–April 1996<br />
Journal <strong>of</strong> Research <strong>of</strong> the <strong>National</strong> <strong>Institute</strong> <strong>of</strong> <strong>St<strong>and</strong>ards</strong> <strong>and</strong> Technology<br />
Additional small uncertainties arise from the method<br />
<strong>of</strong> temperature-correcting the photometers (0.03 %),<br />
from potential polarization selectivity <strong>of</strong> the photometers<br />
(0.01 %), <strong>and</strong> from the electrical calibration <strong>of</strong> the<br />
amplifier (0.003 %). There is also an uncertainty in the<br />
calibration due to a potential nonlinear response <strong>of</strong> the<br />
photometers, that is, whether the output voltage remains<br />
proportional to the illuminance for disparate values <strong>of</strong><br />
the same. We presume that the answer is spectrally<br />
independent, or at least insensitive to the color temperature<br />
<strong>of</strong> an inc<strong>and</strong>escent lamp that is attenuated by ‘‘neutral’’<br />
density filters. Figure 17 shows the results <strong>of</strong> a<br />
linearity test on a typical photometer using the beam<br />
conjoiner method previously described [39]. During<br />
calibration, the photocurrent peak (at 555 nm) is typically<br />
10 �6 to 10 �7 A. Clearly, nonlinearity effects contribute<br />
an error <strong>of</strong> less than 0.001 %.<br />
4. Realization <strong>of</strong> the C<strong>and</strong>ela<br />
4.1 Photometry Bench<br />
The application <strong>of</strong> a photometer, measuring illuminance,<br />
to the luminous intensity determination <strong>of</strong> a light<br />
source [Eq. (8)] is facilitated by the optical bench shown<br />
in Fig. 18. The base consists <strong>of</strong> three 1.8 m (6 ft) long,<br />
46 cm (18 in) thick, steel optical tables with a regular<br />
array <strong>of</strong> tapped holes. Upon it, rigid telescope mounts<br />
<strong>and</strong> upright, marked fiducial plates define the reference<br />
axes. The longitudinal axis runs parallel to rails upon<br />
which a carriage glides, holding a photometer. A support<br />
with cross hairs is substituted for the photometer to<br />
align the carriage <strong>and</strong> rails; lateral alignment within � 2<br />
mm is achieved at the end opposite the telescope. By<br />
substituting a flat mirror for the photometer <strong>and</strong> by<br />
viewing the telescope in itself, orthogonality is ensured<br />
to within 5 mrad. A lamp being measured is mounted on<br />
another carriage, which permits it to be placed at the<br />
intersection <strong>of</strong> the reference axes. With a side-viewing<br />
telescope, the lamp filament is aligned to the plane defined<br />
in combination with the vertical fiducial mark.<br />
(When frosted lamps are measured, such as the type<br />
previously issued by <strong>NIST</strong> as luminous intensity st<strong>and</strong>ards,<br />
a model is aligned rather than the lamp itself. The<br />
model contains additional fiducial marks both to set the<br />
filament plane <strong>and</strong> to locate the filament within that<br />
plane [7].)<br />
The lamp is powered by a constant-current source,<br />
which is set under computer control with a resolution <strong>of</strong><br />
0.15 mA. The current is independently monitored across<br />
an air-cooled, Leeds & Northrup 4360, 0.1 � precision<br />
shunt resistor [40], which is calibrated at <strong>NIST</strong> under<br />
operating conditions with a st<strong>and</strong>ard uncertainty <strong>of</strong><br />
0.002 %. The proper operating current for the color temperature<br />
<strong>of</strong> interest is determined by repeated measurements<br />
using a diode-array-type spectroradiometer. Additionally,<br />
the computer monitors the lamp voltage <strong>and</strong><br />
the photometer signal <strong>and</strong> temperature, <strong>and</strong> it operates<br />
the shutter under programmed control.<br />
The apparatus in Fig. 18 is covered by a plastic box<br />
lined with black velvet. Surfaces within the box, to the<br />
maximum extent possible, are either painted black or<br />
covered with black cloth. A baffled chimney above the<br />
lamp permits convective cooling without introducing<br />
Fig. 17. Relative responsivities <strong>of</strong> Photometer 2 as measured with the beam conjoiner at various<br />
input powers.<br />
124
Volume 101, Number 2, March–April 1996<br />
Journal <strong>of</strong> Research <strong>of</strong> the <strong>National</strong> <strong>Institute</strong> <strong>of</strong> <strong>St<strong>and</strong>ards</strong> <strong>and</strong> Technology<br />
stray light. A light trap is interposed in front <strong>of</strong> the<br />
longitudinal telescope during operation to minimize the<br />
light that is reflected back at the photometer. (The side<br />
telescope is blocked by black cloth.)<br />
To estimate the magnitude <strong>of</strong> stray light resulting<br />
from reflections <strong>and</strong> scattering, an additional photometer<br />
was used concurrently during testing <strong>and</strong> evaluation.<br />
It was placed outside the area illuminated through the<br />
baffles, but near, <strong>and</strong> oriented in the same general manner<br />
as, the photometer being used for measurement.<br />
With various arrangements, the stray light was consistently<br />
< 0.03 % <strong>of</strong> the signal. To estimate the stray light<br />
originating near the lamp, we covered the side <strong>of</strong> the<br />
lamp towards the photometer. This signal was<br />
< 0.001 % <strong>of</strong> the original. The box attenuated the ambient<br />
light from the laboratory by a factor on the order <strong>of</strong><br />
10 6 .<br />
4.2 Lamp-to-Photometer Distance<br />
The position <strong>of</strong> the photometer carriage is monitored<br />
by a computer-readable, absolute linear encoder with a<br />
resolution <strong>of</strong> 0.013 mm. The distance r between the<br />
photometer <strong>and</strong> the transverse reference axis, <strong>and</strong> a<br />
lamp filament, is fixed by sliding an attachment on the<br />
photometer carriage into the view <strong>of</strong> the telescope so<br />
that the zero position can be noted. The accuracy <strong>of</strong> the<br />
encoder was checked with a 2.75 m (9 ft) vernier caliper<br />
by moving the photometer carriage to various positions<br />
<strong>and</strong> measuring its distance mechanically from the telescope<br />
mount as well as electronically. These repeated<br />
measurements had a consistency between the methods<br />
<strong>of</strong> 0.18 mm, which we take to be the uncertainty in<br />
determining the distance. In actuality most <strong>of</strong> this scatter<br />
was associated with the use <strong>of</strong> the large caliper, <strong>and</strong><br />
Fig. 18. New <strong>NIST</strong> photometry bench.<br />
125<br />
it will not affect photometric measurements. A st<strong>and</strong>ard<br />
uncertainty <strong>of</strong> 0.18 mm in separation corresponds to a<br />
relative st<strong>and</strong>ard uncertainty in luminous intensity <strong>of</strong><br />
0.01 % when the photometer is 3.6 m from the lamp at<br />
the far end <strong>of</strong> the bench.<br />
More significantly, a lamp is not the point source<br />
envisioned in Fig. 2c. The size <strong>of</strong> the radiating volume<br />
requires that Iv in Eq. (8) be taken as the asymptotic<br />
value at large r. Typical inside-frosted lamps calibrated<br />
at <strong>NIST</strong> are tubular with a radius <strong>of</strong> 5 cm <strong>and</strong> extend 10<br />
cm below the center <strong>of</strong> the filament, which is 5 cm<br />
below the top <strong>of</strong> the lamp. Less important is the transverse<br />
extent <strong>of</strong> the radiating <strong>and</strong> scattering surfaces,<br />
away from the longitudinal axis. At a distance <strong>of</strong> 2mto<br />
the photometer, a lateral displacement <strong>of</strong> 10 cm by a<br />
point source would decrease its reading by only 0.38 %<br />
(0.25 % because <strong>of</strong> the increased distance <strong>and</strong> 0.13 %<br />
because <strong>of</strong> the increased angle <strong>of</strong> incidence). In comparison,a5cmlongitudinal<br />
displacement <strong>of</strong> a point<br />
source would affect the reading by 5 %. Clearly the<br />
model is most sensitive to the longitudinal location <strong>of</strong><br />
the origin <strong>of</strong> the light.<br />
For this study, the automation afforded by computerized<br />
instrumentation <strong>and</strong> data analysis permitted us to<br />
make rapid measurements with the photometer at many<br />
distances from the lamp. In this way, an effective origin<br />
<strong>of</strong> the light was found as the best-fit <strong>of</strong>fset ro in the<br />
expression<br />
Iv<br />
Ev =<br />
(r � ro) 2 , (12)<br />
given the measured illuminance Ev as a function <strong>of</strong> r.<br />
(Similarly, the best-fit luminous intensity Iv can be<br />
derived.)
Volume 101, Number 2, March–April 1996<br />
Journal <strong>of</strong> Research <strong>of</strong> the <strong>National</strong> <strong>Institute</strong> <strong>of</strong> <strong>St<strong>and</strong>ards</strong> <strong>and</strong> Technology<br />
Five inside-frosted lamps were measured in this fashion,<br />
each with two r<strong>and</strong>omly chosen photometers. The<br />
intensity <strong>of</strong> the lamp was monitored during these measurements<br />
by a stationary, unfiltered, temperature-controlled<br />
silicon photodiode. It was exposed to the lamp<br />
through a fiber-optic cable, the other end <strong>of</strong> which was<br />
mounted on the second baffle where shown in Fig. 18.<br />
The photodiode assembly itself was shadowed from direct<br />
radiation from the lamp. This data was used to<br />
compensate the output <strong>of</strong> the moving photometer for<br />
variations in the lamp intensity. Equation (12) was best<br />
fit by including only data taken with r between 270 cm<br />
<strong>and</strong> 370 cm, the maximum <strong>of</strong> the apparatus.<br />
Typical <strong>of</strong>fsets <strong>of</strong> 0.50 cm � 0.15 cm were found for<br />
<strong>NIST</strong> inside-frosted lamps, with a systematic tendency<br />
for the <strong>of</strong>fset to decrease by � 0.15 cm after a lamp had<br />
been burning for � 1 h. This may be attributed in part<br />
to imperfect compensation by the monitor if the spectral<br />
distribution <strong>of</strong> the lamp was changing, particularly in<br />
the infrared. Surprisingly, similar <strong>of</strong>fsets <strong>of</strong> 0.3 cm �<br />
0.2 cm were found in a set <strong>of</strong> five, unfrosted Osram WI<br />
41/G lamps. However, part <strong>of</strong> this (< 0.2 cm) can be<br />
attributed to the shape <strong>and</strong> thickness <strong>of</strong> the glass envelope,<br />
which, acting as a diverging lens, displaces the<br />
apparent position <strong>of</strong> the filament.<br />
The uncertainty <strong>of</strong> r in Eq. (8) is dependent both on<br />
the physical measurement <strong>of</strong> distance <strong>and</strong> on the applicability<br />
<strong>of</strong> the model Eq. (8) represents, that is, on how<br />
one wishes to treat the issue <strong>of</strong> the effective origin <strong>of</strong> the<br />
light. To ignore it means including a potential systematic<br />
error in r; to measure it means using up precious hours<br />
<strong>of</strong> a st<strong>and</strong>ard lamp’s life. For the purpose <strong>of</strong> defining the<br />
new <strong>NIST</strong> scale <strong>of</strong> luminous intensity, we presume that<br />
the <strong>of</strong>fset is determined <strong>and</strong> applied, either for the lamp<br />
being measured or from a collection <strong>of</strong> lamps <strong>of</strong> similar<br />
construction. The relative combined st<strong>and</strong>ard uncertainty<br />
<strong>of</strong> r, uc,r(r), is then dominated by the uncertainty<br />
in the <strong>of</strong>fset distance, typically 0.11 cm in our measurements.<br />
At r = 3.7 m, the corresponding relative uncertainty<br />
in luminous intensity is 0.06 %.<br />
4.3 Self-Consistency <strong>of</strong> Photometer Group<br />
The calibration errors due to r<strong>and</strong>om causes can be<br />
established for the photometers by measuring the same<br />
luminous intensities with all <strong>of</strong> them, under the same<br />
conditions. This was done with a group <strong>of</strong> five insidefrosted<br />
st<strong>and</strong>ard lamps, <strong>and</strong> the results are shown in<br />
Table 4. Some photometers gave results consistently<br />
above or below the group average for every lamp. This<br />
is because what were r<strong>and</strong>om effects during calibration<br />
become ‘‘frozen’’ into the responsivity assignment for<br />
each photometer. However, we can average out this variation<br />
by applying correction factors to the original calibrations<br />
in order to bring the set <strong>of</strong> calibrations into<br />
self-consistency. Such correction factors are given in the<br />
table.<br />
The correction factors are calculated by modeling<br />
each entry in Table 4 as the product <strong>of</strong> a true luminous<br />
intensity for the lamp in that column (five unknowns)<br />
<strong>and</strong> a correction factor for the true photometer responsivity<br />
in that row (eight unknowns). These 13 values are<br />
derived by data fitting; the full procedure will be published<br />
separately. In effect, each photometer calibration<br />
is compared with the average <strong>of</strong> them all, <strong>and</strong> each is<br />
slightly adjusted such that the adjusted values do not<br />
bias the group average. Strictly, the normalization condition<br />
for the correction factors is that their product must<br />
be 1. The results show that the r<strong>and</strong>om effects that arose<br />
during the calibration <strong>of</strong> the photometer responsivities<br />
affected the calibrations, on average, by 0.15 %. The<br />
residuals after the data fit show that the r<strong>and</strong>om error in<br />
making each luminous intensity measurements for the<br />
table had a relative st<strong>and</strong>ard deviation <strong>of</strong> 0.02 %.<br />
Table 4. Self-consistency check <strong>of</strong> photometer group. The luminous intensity (cd) <strong>of</strong> five lamps are determined with<br />
the eight photometers built to realize the scale. Each value was measured three times; the typical scatter was 0.02 %<br />
<strong>of</strong> the mean. The experimental st<strong>and</strong>ard deviations <strong>of</strong> the eight measurements <strong>of</strong> the lamps, with the different<br />
photometers, are given at the bottom. The correction coefficient is explained in the text.<br />
Lamp identification number<br />
Photometer 4975 4976 4977 4978 4979 Correction coefficient<br />
1 705.94 707.29 680.34 708.69 708.67 0.9980<br />
2 706.56 707.53 680.92 709.28 709.04 0.9987<br />
3 707.60 709.08 681.70 710.42 710.48 1.0004<br />
4 708.37 709.74 682.66 711.02 711.02 1.0014<br />
5 707.25 708.40 681.27 709.74 709.99 0.9997<br />
6 708.20 709.78 682.85 711.11 710.63 1.0012<br />
7 706.32 707.52 680.39 708.75 708.94 0.9984<br />
8 708.79 710.31 683.22 711.46 711.53 1.0021<br />
s 0.15 % 0.17 % 0.17 % 0.15 % 0.15 % 0.15 %<br />
126
Volume 101, Number 2, March–April 1996<br />
Journal <strong>of</strong> Research <strong>of</strong> the <strong>National</strong> <strong>Institute</strong> <strong>of</strong> <strong>St<strong>and</strong>ards</strong> <strong>and</strong> Technology<br />
The scatter in Table 4 can be reduced to 0.11 % by<br />
using the aperture areas measured by the SCF found in<br />
Table 3 for Eq. (8), but this may be deceiving. Photometers<br />
1 <strong>and</strong> 2 not only have the larger (hence better<br />
known) aperture areas, they also require the most severe<br />
uniformity corrections (Fig. 12b); this indicates a potential<br />
bias in this alternative.<br />
The same experiment was repeated with a set <strong>of</strong> five<br />
Osram WI 41/G lamps. The correction factors were<br />
found to be the same within 0.05 %, except for Photometer<br />
6, which was different by 0.1 %. The residuals<br />
had a relative st<strong>and</strong>ard deviation <strong>of</strong> 0.06 %. Since the<br />
inside-frosted lamps appeared to be better behaved, we<br />
henceforth apply the correction factors in Table 4 to the<br />
calibrations in Table 1 for routine use <strong>of</strong> individual photometers.<br />
The additional consistency between the<br />
groups <strong>of</strong> two different types <strong>of</strong> lamps was most encouraging.<br />
The result that the calibrations <strong>of</strong> a set <strong>of</strong> photometers<br />
had an actual r<strong>and</strong>om st<strong>and</strong>ard deviation <strong>of</strong> 0.15 % may<br />
be compared with Table 2. R<strong>and</strong>om influences noted in<br />
the Table 2 uncertainty budget (those <strong>of</strong> Type A, <strong>and</strong><br />
some fraction <strong>of</strong> the uncertainties in aperture area <strong>and</strong><br />
temperature) together amount to a relative st<strong>and</strong>ard uncertainty<br />
� 0.06 %. The difference is surprising, <strong>and</strong> is<br />
perhaps the result <strong>of</strong> 1/f noise in one <strong>of</strong> the measurement<br />
steps. However, in the end the conclusion <strong>of</strong> Table 2 is<br />
still meaningful. The r<strong>and</strong>om component <strong>of</strong> each photometer<br />
after averaging (the self-consistency correction)<br />
would have a relative st<strong>and</strong>ard deviation <strong>of</strong> (0.15/�8) %,<br />
Table 5. Uncertainty budget for luminous intensity measurements<br />
which is also � 0.06 %. That is, the combined relative<br />
st<strong>and</strong>ard uncertainty in Table 2 should be taken as applicable<br />
following the self-consistency step just described.<br />
4.4 Uncertainty Budget for Luminous Intensity<br />
Measurements<br />
In Table 5 the uncertainties for luminous intensity<br />
measurements <strong>of</strong> inside-frosted lamps are summarized.<br />
The starting point is the uncertainty budget in Table 2;<br />
uc,r for the illuminance responsivity <strong>of</strong> a photometer,<br />
0.19 %, carries over directly <strong>and</strong> becomes the dominant<br />
uncertainty in this budget. The measurement noise contributes<br />
0.02 %, as explained in Sec. 4.3.<br />
The photometers are operated through three cycles <strong>of</strong><br />
exposure <strong>and</strong> darkness. Each period <strong>of</strong> exposure or<br />
darkness is � 3 s, including settling time <strong>and</strong> an integration<br />
time <strong>of</strong> 1.67 s for the output voltage measurement.<br />
This provides sufficient noise reduction, yet is sufficiently<br />
quick to obviate worry about heating the filter<br />
because <strong>of</strong> optical absorption, a mechanism that would<br />
not be detected by the temperature probe. While a precise<br />
model would depend on detailed knowledge about<br />
the construction <strong>of</strong> the filters, we can demonstrate an<br />
order-<strong>of</strong>-magnitude estimate. Presuming that all power<br />
dissipated from a 500 W lamp is radiated, at a distance<br />
> 2 m the irradiance is < 4 mW/cm 2 . Taking a typical<br />
specific heat <strong>of</strong> glass to be � 1700 mJ/(K � cm 3 )<strong>and</strong>an<br />
optical depth <strong>of</strong> a temperature sensitive, thermally insulated,<br />
totally adsorbing layer to be � 0.1cm,a3s<br />
Relative<br />
st<strong>and</strong>ard uncertainty (%)<br />
Source <strong>of</strong> uncertainty Type A Type B<br />
Illuminance Responsivity<br />
Scale uncertainty from Table 2 0.19<br />
Measurement noise 0.02<br />
Filter absorption 0.006<br />
Lamp to Photometer Distance<br />
Size <strong>and</strong> construction <strong>of</strong> lamp 0.06<br />
Physical distance measurement 0.01<br />
Geometrical<br />
Photometer transverse placement<br />
a<br />
Photometer orthogonality 0.002<br />
Lamp Operation<br />
Current regulation 0.03<br />
Aging (per hour) 0.1<br />
Combined st<strong>and</strong>ard uncertainty 0.23<br />
Exp<strong>and</strong>ed uncertainty (k = 2) 0.46<br />
a Too small to list.<br />
127
Volume 101, Number 2, March–April 1996<br />
Journal <strong>of</strong> Research <strong>of</strong> the <strong>National</strong> <strong>Institute</strong> <strong>of</strong> <strong>St<strong>and</strong>ards</strong> <strong>and</strong> Technology<br />
exposure would raise the temperature <strong>of</strong> this layer by<br />
� 0.07 K. These severe assumptions show that the<br />
influence <strong>of</strong> absorption on one measurement is<br />
< 0.006 %. While any short-term drift <strong>of</strong> the photometer<br />
cannot be attributed to absorption by the filter at<br />
these power levels, errors might arise at higher irradiances<br />
or with longer integration times. (Possible tracking<br />
errors <strong>of</strong> the thermometer in an environment with a<br />
slowly changing ambient temperature were taken into<br />
account in the Table 2 uncertainty budget.)<br />
The uncertainties <strong>of</strong> the photometer to lamp distance,<br />
r in Eq. (8), are discussed in detail in Sec. 4.2. There is<br />
a 0.06 % relative st<strong>and</strong>ard uncertainty in luminous intensity<br />
measurements resulting from the difference between<br />
the geometric <strong>and</strong> effective position <strong>of</strong> the lamp<br />
filament. The relative st<strong>and</strong>ard uncertainty caused by<br />
the electronic ruler is < 0.01 %.<br />
The various geometrical uncertainties make negligible<br />
contributions to the overall uncertainty. A transverse<br />
misalignment <strong>of</strong> the photometer by � 2mmwouldaffect<br />
the measurement by only a few parts in 10 7 .A<br />
nonorthogonality to the longitudinal axis <strong>of</strong> 5 mrad<br />
would affect the measurement by < 0.002 %. Clearly the<br />
geometrical prerequisites <strong>of</strong> Eq. (8) are met. The angles<br />
<strong>of</strong> incidence on the photometer from the extended<br />
source are much less than those encountered during<br />
illuminance calibration, <strong>and</strong> this would tend only to reduce<br />
the possible systematic error in numerical aperture<br />
already accounted for.<br />
<strong>NIST</strong> originally elected to use inside-frosted lamps as<br />
luminous intensity st<strong>and</strong>ards because measurement results<br />
were less affected by small changes in the orientation<br />
<strong>of</strong> the lamps [41]. Variations <strong>of</strong> < 0.2 % were reported<br />
for misorientations in pitch (about the vertical<br />
lamp axis) <strong>of</strong> less than � 2�. Similarly, the fine-grained<br />
frosting aids in generating uniform illuminance in the<br />
far field, in the neighborhood <strong>of</strong> the photometer. We<br />
believe that any remaining local variations in illuminance<br />
will not contribute to possible measurement error<br />
beyond those already accounted for in connection with<br />
the spatial averaging <strong>of</strong> the responsivity <strong>of</strong> the photometers.<br />
Errors that may arise because <strong>of</strong> the differences in<br />
lamp orientation between <strong>NIST</strong> <strong>and</strong> other laboratories<br />
are beyond the scope <strong>of</strong> this paper.<br />
At the operating point, marginal fractional changes in<br />
lamp current cause magnified fractional changes in<br />
lamp output by factors <strong>of</strong> 6 to 8 [42,8]. Since the nominal<br />
current <strong>of</strong> an inside-frosted lamp is 3 A, the 0.15<br />
mA resolution in the current control implies a luminous<br />
stability <strong>of</strong> 0.02 %. The 0.002 % calibration relative<br />
st<strong>and</strong>ard uncertainty <strong>of</strong> the shunt resistor implies a reproducibility<br />
in output <strong>of</strong> 0.016 %. Together these imply<br />
a relative st<strong>and</strong>ard uncertainty component resulting<br />
from lamp current measurement <strong>of</strong> 0.03 %.<br />
128<br />
Before luminous intensity measurements were made,<br />
the lamp currents were ramped slowly up to the operating<br />
point, <strong>and</strong> the lamps were allowed an equilibration<br />
time <strong>of</strong> at least 10 min. Nevertheless, it is important to<br />
remember that lamps change with age rather than reach<br />
a stable equilibrium. Figure 19a shows the behavior <strong>of</strong><br />
three types <strong>of</strong> lamps over the course <strong>of</strong>2h<strong>of</strong>operation.<br />
The scatter in the data, or noise, was discussed in connection<br />
with Table 4. Figure 19b demonstrates that the<br />
effect spans separate lamp lightings. The gaps in the<br />
data correspond to ramping <strong>and</strong> equilibration periods<br />
during which no data were taken. While Fig. 19a shows<br />
that the lamps changed most rapidly for an additional 20<br />
min to 30 min after the initial warm-up period (as noted<br />
above in connection with the determination <strong>of</strong> ro), permanent<br />
changes in luminous intensity <strong>of</strong> 0.1 %/h contraindicate<br />
long equilibration times <strong>and</strong> are a severe<br />
limitation on a calibration service requiring lamps as<br />
transfer st<strong>and</strong>ards. More recently, modified FEL 1000<br />
W quartz-halogen lamps were further tested for suitability<br />
as photometric transfer st<strong>and</strong>ards, <strong>and</strong> they were<br />
shown to be stable to within 0.2 % � 0.6%over60h<strong>of</strong><br />
operation [43].<br />
4.5 Comparison <strong>of</strong> New <strong>and</strong> Old Scales<br />
Before this study the last full realization <strong>of</strong> the old<br />
luminous intensity scale (Fig. 1) occurred in 1985 in<br />
connection with the international intercomparison <strong>of</strong><br />
such scales [44]. At that time the NBS c<strong>and</strong>ela was<br />
found to be 0.58 % smaller than the world mean. (That<br />
is, lamps calibrated at NBS were given higher c<strong>and</strong>ela<br />
values than the average.) Of this, 0.35 % was later removed<br />
with the adoption <strong>of</strong> ITS-90 [20], making the<br />
<strong>NIST</strong> scale 0.23 % smaller than the world mean.<br />
Encouraging early results by Andor <strong>and</strong> Zalewski in<br />
1988 [45] showed that a detector-based c<strong>and</strong>ela gave<br />
results 0.07 % larger than the world mean. This was<br />
determined by measuring the primary lamp group with<br />
the prototype photometers similar to those reported in<br />
this study. Based on this <strong>and</strong> other indirect evidence, in<br />
Ref. [22] we concluded that the new scale realization<br />
described in this study did not cause a significant scale<br />
shift in comparison with the uncertainty <strong>of</strong> the old scale,<br />
<strong>and</strong> that it was perhaps on the order <strong>of</strong> 0.3 %.<br />
While studies continue at <strong>NIST</strong> to validate this result,<br />
additional confirming evidence has recently become<br />
available. In 1985, the luminous intensity scale <strong>of</strong> Germany<br />
maintained at the Physikalisch-Technische Bundesanstalt<br />
(PTB) was found to be 0.32 % larger than the<br />
world mean [44]. A comparison <strong>of</strong> the new <strong>NIST</strong> scale<br />
with the PTB scale [46] showed that the scale difference<br />
narrowed from 0.9 % in 1985 to 0.2 % in 1993. This<br />
implies that the new <strong>NIST</strong> scale is 0.12 % larger than the
Volume 101, Number 2, March–April 1996<br />
Journal <strong>of</strong> Research <strong>of</strong> the <strong>National</strong> <strong>Institute</strong> <strong>of</strong> <strong>St<strong>and</strong>ards</strong> <strong>and</strong> Technology<br />
Fig. 19a. Drift <strong>and</strong> noise in the output <strong>of</strong> representative st<strong>and</strong>ard lamps during one lighting<br />
<strong>of</strong> an: Osram Wi 41/G lamp, ●; FEL lamp, ❍; <strong>and</strong> Inside-frosted T-20 lamp, ▲.<br />
Fig. 19b. Drift <strong>and</strong> noise in the output <strong>of</strong> representative st<strong>and</strong>ard lamps during five<br />
consecutive lightings <strong>of</strong> the Osram lamp.<br />
1985 world mean, a 0.35 % shift from the old <strong>NIST</strong><br />
scale with the ITS-90 correction applied. Additionally,<br />
the Országos Mérésügyi Hivatal (OMH) in Hungary has<br />
maintained a scale based on the BIPM lamp group that<br />
holds the 1985 world mean. Preliminary data from a<br />
comparison <strong>of</strong> the new <strong>NIST</strong> scale with the OMH scale<br />
implies that the <strong>NIST</strong> scale is 0.03 % smaller than the<br />
world mean, a 0.2 % shift from the old <strong>NIST</strong> scale.<br />
Another international intercomparison is planned for<br />
1995 [47].<br />
129<br />
4.6 Long-Term Stability <strong>of</strong> the St<strong>and</strong>ard<br />
Photometers<br />
The calibration procedure described in Secs. 3.5 <strong>and</strong><br />
4.3 has been repeated twice to test the stability <strong>of</strong> the<br />
calibration result shown in Table 1. The results are<br />
shown in Table 6. For the purpose <strong>of</strong> comparison, the<br />
data are adjusted to correspond to a uniform temperature<br />
<strong>of</strong> 298 K <strong>and</strong> normalized to the calibration values<br />
in Table 1. The data shows that the group average<br />
changed by < 0.1 % in their first year, <strong>and</strong> then by an<br />
additional 0.4 % in the subsequent 2 years.
Volume 101, Number 2, March–April 1996<br />
Journal <strong>of</strong> Research <strong>of</strong> the <strong>National</strong> <strong>Institute</strong> <strong>of</strong> <strong>St<strong>and</strong>ards</strong> <strong>and</strong> Technology<br />
Table 6. Photometer calibration stability<br />
Relative illuminance responsivity<br />
Photometer Nov. 1991 Nov. 1992 Dec. 1994 After cleaning<br />
1 1.0000 0.9998 0.9939 1.0032<br />
2 1.0000 0.9996 0.9875 1.0056<br />
3 1.0000 0.9960 0.9926<br />
4 1.0000 0.9991 0.9964<br />
5 1.0000 0.9988 0.9976<br />
6 1.0000 0.9999 0.9977<br />
7 1.0000 1.0010 0.9987<br />
8 1.0000 0.9997 0.9969<br />
Average 1.0000 0.9992 0.9952<br />
One reason for this change appeared to be a surface<br />
film that had developed on the exterior side <strong>of</strong> the glass<br />
filters on Photometers 1 <strong>and</strong> 2. These filters were wiped<br />
gently with dry lens tissue, <strong>and</strong> their photometers were<br />
recalibrated. Indeed, their values shifted significantly.<br />
The average drift <strong>of</strong> Photometers 3 to 8 remained<br />
� 0.11%/yr.<br />
5. Conclusion<br />
Two major goals have been reached. A luminous<br />
intensity scale has been derived with detectors, <strong>and</strong> in a<br />
simpler <strong>and</strong> more direct manner than before. In the<br />
process the uncertainty <strong>of</strong> lamp calibration has been<br />
reduced.<br />
This change also puts <strong>NIST</strong> on good footing for future<br />
improvements. The principal uncertainties in the<br />
illuminance calibration, the uncertainty <strong>of</strong> the spectral<br />
responsivity scale <strong>and</strong> the uncertainty in the aperture<br />
area, will be reduced significantly by ongoing research<br />
<strong>and</strong> development in our Division. We can expect to reduce<br />
the smaller uncertainties as well by improvements<br />
in measurement technique. A 0.2 % relative exp<strong>and</strong>ed<br />
uncertainty (k = 2) in illuminance measurement appears<br />
to be achievable.<br />
Based on our experience, we believe that the detectorbased<br />
scale will prove more durable <strong>and</strong> stable than the<br />
lamp-based scale. Nevertheless, yearly recalibration <strong>of</strong><br />
the st<strong>and</strong>ard photometers will be required to maintain<br />
the accuracy <strong>of</strong> the scale, <strong>and</strong> frosted FEL lamps hold<br />
promise as an improved vehicle for disseminating the<br />
scale.<br />
This study is <strong>of</strong> particular benefit for those many<br />
applications where illuminance needs to be measured<br />
directly, including imaging (such as photography) <strong>and</strong><br />
ergonomics, where the effects <strong>of</strong> lighting rather than the<br />
light sources themselves matter. The st<strong>and</strong>ard photometers<br />
have enabled <strong>NIST</strong> to exp<strong>and</strong> its range <strong>of</strong> services to<br />
130<br />
include the calibration <strong>of</strong> luminance meters <strong>and</strong> illuminance<br />
meters [48]. In the field, secondary-st<strong>and</strong>ard illuminance<br />
meters can be used to calibrate other illuminance<br />
meters by substitution, eliminating the need for a<br />
long optical bench. Further, the st<strong>and</strong>ard photometers<br />
have been applied to realize a detector-based geometrically<br />
total luminous flux scale for the measurement <strong>of</strong><br />
lamps [49]. This important development brings the benefits<br />
<strong>of</strong> this study to the lighting industry, for which total<br />
luminous flux is perhaps the most important measurable<br />
quantity.<br />
While traditional photometry has always involved<br />
st<strong>and</strong>ard light sources, e.g., lamps in recent decades,<br />
detector-based st<strong>and</strong>ardization permits smaller uncertainties<br />
<strong>and</strong> <strong>of</strong>ten simpler procedures. Unlike lamps the<br />
photometers require no large power supplies, <strong>and</strong> they<br />
are useful over a wide dynamic range. Photometry<br />
benches need not be long to provide for 1/r 2 attenuations.<br />
Well-characterized photometers should prove especially<br />
useful for the calibration <strong>of</strong> modern, noninc<strong>and</strong>escent<br />
light sources, including self-luminous displays.<br />
(Care needs to be taken to know the spectrum <strong>of</strong> the<br />
source.) Stable photometers also permit the incidental<br />
use <strong>of</strong> lamps during calibration procedures without regard<br />
to their long-term stability. With st<strong>and</strong>ards-quality<br />
lamps difficult to procure, this alternate technology<br />
merits particular attention.<br />
Acknowledgments<br />
Many people, staff <strong>and</strong> visitors, contributed much to<br />
this project. We thank Ronald Wilkinson for many<br />
skilled photometric measurements, Joel Fowler <strong>and</strong><br />
Patrick Tobin for much assistance in the design <strong>and</strong><br />
construction <strong>of</strong> the new bench, H. Sun for many filter<br />
characterizations <strong>and</strong> extensive study <strong>of</strong> the temperature<br />
dependence <strong>of</strong> the photometers, Ambler Thompson <strong>and</strong><br />
Sally Bruce for stewardship <strong>and</strong> operation <strong>of</strong> the beam<br />
conjoiner, John Jackson for measuring the spectral irra-
Volume 101, Number 2, March–April 1996<br />
Journal <strong>of</strong> Research <strong>of</strong> the <strong>National</strong> <strong>Institute</strong> <strong>of</strong> <strong>St<strong>and</strong>ards</strong> <strong>and</strong> Technology<br />
diance <strong>of</strong> lamps at FASCAL, Gyula Dézsi <strong>and</strong> Georg<br />
Sauter for hospitality <strong>and</strong> fellowship in the tasks <strong>of</strong><br />
comparing the luminous intensity scales, Donna Bell<br />
<strong>and</strong> Jason H<strong>of</strong>fman for able assistance in many respects,<br />
Robert Saunders for many helpful discussions, <strong>and</strong><br />
Klaus Mielenz for support <strong>and</strong> encouragement throughout<br />
the project.<br />
6. References<br />
[1] J. W. T. Walsh, Chap. 1 in Photometry, 3rd Ed., Constable &<br />
Company, London (1958).<br />
[2] Comptes Rendus des Séances de la Neuvième Conférence Générale<br />
des Poids et Mesures (Bureau International des Poids et<br />
Mesures, Paris, 1948), session 9, p. 53.<br />
[3] W. R. Blevin <strong>and</strong> B. Steiner, Redefinition <strong>of</strong> the C<strong>and</strong>ela <strong>and</strong> the<br />
Lumen, Metrologia 11, 97–104 (1975).<br />
[4] Comptes Rendus des Séances de la 16 e Conférence Générale des<br />
Poids et Mesures (Bureau International des Poids et Mesures,<br />
F-92312 Sèvres, Cedex, France, 1979), session 16, p. 100; see<br />
also P. Giacomo, News from the BIPM, Metrologia 16, 55–61<br />
(1980). (Corrected English translation: Metrologia 17, 74<br />
(1981).)<br />
[5] G. Wyszecki, W. R. Blevin, K. G. Kessler, <strong>and</strong> K. D. Mielenz,<br />
Principles Governing Photometry (Bureau International des<br />
Poids et Mesures, F-92312 Sèvres, Cedex, France, 1983); see<br />
also Principles Governing Photometry, Metrologia 19, 97–101<br />
(1983).<br />
[6] The Basis <strong>of</strong> Physical Photometry, Publ. 18.2 (Commission Internationale<br />
de L’Éclairage, Paris, 1983). (Currently available<br />
through the U. S. <strong>National</strong> Committee <strong>of</strong> the CIE, c/o Mr.<br />
Thomas M. Lemons, TLA-Lighting Consultants, Inc., 7 Pond<br />
Street, Salem, MA 01970-4819.)<br />
[7] R. L. Booker <strong>and</strong> D. A. McSparron, Photometric Calibrations,<br />
Natl. Bur. St<strong>and</strong>. (U.S.), Spec. Publ. 250-15 (1987).<br />
[8] T. M. Goodman <strong>and</strong> P. J. Key, A radiometric realization <strong>of</strong> the<br />
c<strong>and</strong>ela, NPL Report QU 75 (<strong>National</strong> Physical Laboratory, Teddington,<br />
UK, February 1986); T. M. Goodman <strong>and</strong> P. J. Key, The<br />
NPL Radiometric Realization <strong>of</strong> the C<strong>and</strong>ela, Metrologia 25,<br />
29–40 (1988).<br />
[9] L. P. Boivin, A. A. Gaertner, <strong>and</strong> D. S. Gignac, Realization <strong>of</strong> the<br />
New C<strong>and</strong>ela (1979) at NRC, Metrologia 24, 139–152 (1987).<br />
[10] C. Carreras <strong>and</strong> A. Corrons, Absolute spectroradiometric <strong>and</strong><br />
photometric scales based on an electrically calibrated pyroelectric<br />
radiometer, Appl. Opt. 20, 1174–1177 (1981).<br />
[11] Z. Gao, Z. Wang, D. Piao, S. Mao, <strong>and</strong> C. Yang, Realization <strong>of</strong><br />
the C<strong>and</strong>ela by Electrically Calibrated Radiometers, Metrologia<br />
19, 85–92 (1983).<br />
[12] J. L. Gardner, Recent International Intercomparison <strong>of</strong> Basic<br />
Lighting <strong>St<strong>and</strong>ards</strong>, Lighting in Australia 7(4), 21–24 (1987).<br />
[13] V. I. Sapritski, A New St<strong>and</strong>ard for the C<strong>and</strong>ela in the USSR,<br />
Metrologia 24, 53–59 (1987); V. I. Sapritskii, <strong>National</strong> Primary<br />
Radiometric <strong>St<strong>and</strong>ards</strong> <strong>of</strong> the USSR, Metrologia 27, 53–60<br />
(1990).<br />
[14] V. Jediny, J. Krempasky, J. Zatkovic, <strong>and</strong> P. Nemecek, Luminous<br />
intensity measurement according to the new definition <strong>of</strong> the<br />
c<strong>and</strong>ela, Cesk. Cas. Fyz. A 38(6), 601–611 (1988).<br />
[15] G. Eppeldauer, Longterm changes <strong>of</strong> silicon photodiodes <strong>and</strong><br />
their use for photometric st<strong>and</strong>ardization, Appl. Opt. 29, 2289–<br />
2294 (1990).<br />
131<br />
[16] J. H. Walker, R. D. Saunders, <strong>and</strong> A. T. Hattenburg, The NBS<br />
Scale <strong>of</strong> Spectral Radiance, Metrologia 24, 79–88 (1987); J. H.<br />
Walker, R. D. Saunders, <strong>and</strong> A. T. Hattenburg, Spectral Radiance<br />
Calibrations, Natl. Bur. St<strong>and</strong>. (U.S.), Spec. Publ. 250-1 (1987).<br />
[17] J. H. Walker, R. D. Saunders, J. K. Jackson, <strong>and</strong> D. A. McSparron,<br />
Spectral Irradiance Calibrations, Natl. Bur. St<strong>and</strong>. (U.S.),<br />
Spec. Publ. 250-1 (1987).<br />
[18] The present study follows, to the extent possible, the ISO Guide<br />
to the Expression <strong>of</strong> Uncertainty in Measurement, International<br />
Organization for St<strong>and</strong>ardization, Geneva, Switzerl<strong>and</strong> (1993).<br />
Since 1994, <strong>NIST</strong> policy has been to conform to the Guide in<br />
reporting its activities, using an exp<strong>and</strong>ed uncertainty coverage<br />
factor (as defined in the Guide) <strong>of</strong> k = 2. Prior work at <strong>NIST</strong> was<br />
generally reported with ‘‘3 �’’ uncertainties. For consistency in<br />
this paper, when a st<strong>and</strong>ard uncertainty <strong>of</strong> the present study is<br />
compared with an earlier result, the latter is restated to a ‘‘1 �’’<br />
basis. Earlier results are restated to a ‘‘2 �’’ basis when the<br />
context calls for an exp<strong>and</strong>ed uncertainty; see also B. N. Taylor<br />
<strong>and</strong> C. E. Kuyatt, Guidelines for Evaluating <strong>and</strong> Expressing the<br />
Uncertainty <strong>of</strong> <strong>NIST</strong> Measurement Results, Natl. Inst. St<strong>and</strong>.<br />
Technol. <strong>Note</strong> 1297, 2nd ed. (1994).<br />
[19] H. Preston-Thomas, The International Temperature Scale <strong>of</strong><br />
1990 (ITS-90), Metrologia 27, 3–10 (1990). (Erratum, ibid. p.<br />
107.)<br />
[20] K. D. Mielenz, R. D. Saunders, A. C. Parr, <strong>and</strong> J. J. Hsia, The<br />
1990 <strong>NIST</strong> Scales <strong>of</strong> Thermal Radiometry, J. Res. Natl. Inst.<br />
St<strong>and</strong>. Technol. 95, 621–629 (1990).<br />
[21] K. D. Mielenz, R. D. Saunders, <strong>and</strong> J. B. Shumaker, Spectroradiometric<br />
Determination <strong>of</strong> the Freezing Temperature <strong>of</strong> Gold,<br />
J. Res. Natl. Inst. St<strong>and</strong>. Technol. 95, 49–67 (1990).<br />
[22] C. L. Cromer, G. Eppeldauer, J. E. Hardis, T. C. Larason, <strong>and</strong><br />
A. C. Parr, <strong>National</strong> <strong>Institute</strong> <strong>of</strong> <strong>St<strong>and</strong>ards</strong> <strong>and</strong> Technology Detector-Based<br />
Photometric Scale, Appl. Opt. 32(16), 2936–2948<br />
(1993).<br />
[23] Y. Ohno, C. L. Cromer, J. E. Hardis, <strong>and</strong> G. Eppeldauer, The<br />
Detector-Based C<strong>and</strong>ela Scale <strong>and</strong> Related Photometric Calibration<br />
Procedures at <strong>NIST</strong>, J. Illum. Eng. Soc. 23(1), 89–98 (1994).<br />
[24] Methods <strong>of</strong> Characterizing the Performance <strong>of</strong> Radiometers<br />
<strong>and</strong> Photometers, Publ. 53, Commission Internationale de<br />
L’Éclairage, Paris (1982). (See Ref. [6] for availability.)<br />
[25] G. Eppeldauer <strong>and</strong> J. E. Hardis, Fourteen-decade photocurrent<br />
measurements with large-area silicon photodiodes at room temperature,<br />
Appl. Opt. 30, 3091–3099 (1991).<br />
[26] G. Eppeldauer, Temperature Monitored/Controlled Silicon<br />
Photodiodes for St<strong>and</strong>ardization, in Surveillance Technologies,<br />
S. Gowrinathan, R. J. Mataloni, <strong>and</strong> S. J. Schwartz, eds., Proc.<br />
Soc. Photo-Opt. Instrum. Eng. 1479, 71–77 (1991).<br />
[27] E. F. Zalewski <strong>and</strong> C. R. Duda, Silicon photodiode device with<br />
100 % external quantum efficiency, Appl. Opt. 22, 2867–2873<br />
(1983).<br />
[28] J. M. Houston, C. L. Cromer, J. E. Hardis, <strong>and</strong> T. C. Larason,<br />
Comparison <strong>of</strong> the <strong>NIST</strong> High Accuracy Cryogenic Radiometer<br />
<strong>and</strong> the <strong>NIST</strong> Scale <strong>of</strong> Detector Spectral Response, Metrologia<br />
30, 285–290 (1993). T. C. Larason, S. S. Bruce, <strong>and</strong> C. L.<br />
Cromer, The <strong>NIST</strong> High Accuracy Scale for Absolute Spectral<br />
Response from 406 nm to 920 nm, J. Res. Natl. Inst. St<strong>and</strong>.<br />
Technol. 101, 133 (1996).<br />
[29] The characteristics <strong>of</strong> the same model <strong>of</strong> monochromator are<br />
described in R. D. Saunders <strong>and</strong> J. B. Shumaker, Apparatus<br />
function <strong>of</strong> a prism-grating double monochromator, Appl. Opt.<br />
25, 3710–3714 (1986).<br />
[30] Hamamatsu Corporation, 360 Foothill Road, P. O. Box 6910,<br />
Bridgewater, NJ 08807-0910.<br />
[31] Mathematica s<strong>of</strong>tware is a product <strong>of</strong> Wolfram Research, 100<br />
Trade Center Dr., Champaign, IL 61820-7237.
Volume 101, Number 2, March–April 1996<br />
Journal <strong>of</strong> Research <strong>of</strong> the <strong>National</strong> <strong>Institute</strong> <strong>of</strong> <strong>St<strong>and</strong>ards</strong> <strong>and</strong> Technology<br />
[32] The authors extend special thanks to Phil Boivin, <strong>National</strong> Research<br />
Council <strong>of</strong> Canada, <strong>and</strong> David Nettleton, <strong>National</strong> Physical<br />
Laboratory <strong>of</strong> Great Britain, for kindness <strong>and</strong> generosity in<br />
supplying some <strong>of</strong> the filters used in this project. We also thank<br />
G. Czibula, PRC Krochmann (Geneststrasse, 6, D-1000 Berlin<br />
62, Germany), for cooperation <strong>and</strong> assistance in developing the<br />
additional filters.<br />
[33] G. Czibula, Producing a Detector with Predetermined Spectral<br />
Responsivity, presented at the International Measurement Confederation<br />
10th International Symposium <strong>of</strong> the <strong>Technical</strong> Committee<br />
on Photon-Detectors, 20–22 Sept. 1982, Berlin (OMIKK<br />
Technionform, Budapest, 1983) pp. 189–199.<br />
[34] T. M. Goodman, J. E. Martin, B. D. Shipp, <strong>and</strong> N. P. Turner, The<br />
Manufacture <strong>and</strong> Measurement <strong>of</strong> Precision Apertures, in Proceedings<br />
<strong>of</strong> the Second International Conference on New Developments<br />
<strong>and</strong> Applications in Optical Radiometry, M. P. Fox <strong>and</strong><br />
D. H. Nettleton, eds., Vol. 92 <strong>of</strong> <strong>Institute</strong> <strong>of</strong> Physics Conference<br />
Series, <strong>Institute</strong> <strong>of</strong> Physics, Bristol, UK (1989) pp. 121–128.<br />
[35] View Engineering, 1650 N. Voyager Ave., Simi Valley, CA<br />
93063-3385.<br />
[36] P. Giacomo, News from the BIPM, Metrologia 17, 69–74 (1981);<br />
see also H. H. Ku, Uncertainty <strong>and</strong> Accuracy in Physical Measurements,<br />
Natl. Inst. St<strong>and</strong>. Technol. Spec. Publ. 805 (1990).<br />
[37] C. L. Cromer, A New Spectral Response Calibration Method<br />
using a Silicon Photodiode Trap Detector, presented at the 1991<br />
Measurement Science Conference.<br />
[38] K. L. Eckerle, J. J. Hsia, K. D. Mielenz, <strong>and</strong> V. R. Weidner,<br />
Regular Spectral Transmittance, Natl. Bur. St<strong>and</strong>. (U.S.), Spec.<br />
Publ. 250-6 (1987).<br />
[39] R. D. Saunders <strong>and</strong> J. B. Shumaker, Automated radiometric<br />
linearity tester, Appl. Opt. 23, 3504–3506 (1984).<br />
[40] Leeds & Northrup, 351 N. Sumneytown Pike, North Wales, PA<br />
19454-2531.<br />
[41] E. F. Zalewski, A. R. Schaefer, K. Mohan, <strong>and</strong> D. A. McSparron,<br />
Optical Radiation Measurements: Photometric Instrumentation<br />
<strong>and</strong> Research (1970 to 1971), Natl. Bur. St<strong>and</strong>. (U.S.), Tech.<br />
<strong>Note</strong> 594-2 (1972) pp. 22–33.<br />
[42] Inc<strong>and</strong>escent Lamps, Publ. TP-110, General Electric Company,<br />
Nela Park, Clevel<strong>and</strong>, OH (1964).<br />
[43] Y. Ohno <strong>and</strong> J. K. Jackson, Characteristics <strong>of</strong> Modified FEL<br />
Quartz-Halogen Lamps for Photometric <strong>St<strong>and</strong>ards</strong>, Metrologia<br />
(in press).<br />
[44] J. Bonhoure, Metrologia 24, 157–162 (1987); see also Rapport<br />
de la 11 e Session, Comité Consultatif de Photométrie et Radiométrie,<br />
Bureau International des Poids et Mesures, F-92312<br />
Sèvres Cedex, France (1986).<br />
[45] G. Andor <strong>and</strong> E. F. Zalewski, (personal communication).<br />
[46] Y. Ohno <strong>and</strong> G. Sauter, 1993 Intercomparison <strong>of</strong> Photometric<br />
Units Maintained at <strong>NIST</strong> (USA) <strong>and</strong> PTB (Germany), J. Res.<br />
Natl. Inst. St<strong>and</strong>. Technol. 100, 227–239 (1995).<br />
[47] Rapport de la 12 e Session, Comité Consultatif de Photométrie<br />
et Radiométrie, Bureau International des Poids et Mesures,<br />
F-92312 Sèvres Cedex, France (1990).<br />
[48] <strong>NIST</strong> Calibration Services Users Guide 1995, Natl. Inst. St<strong>and</strong>.<br />
Technol. Spec. Publ. 250 (1995).<br />
[49] Y. Ohno, Realization <strong>of</strong> <strong>NIST</strong> 1995 Luminous Flux Scale using<br />
Integrating Sphere Method, J. Illum. Eng. Soc. 25(1), 13–22<br />
(1996).<br />
132<br />
About the authors: Albert Parr serves as Chief <strong>of</strong> the<br />
Optical Technology Division <strong>of</strong> the <strong>NIST</strong> Physics Laboratory.<br />
Christopher Cromer manages the Optical Sensor<br />
Group in the Optical Technology Division. Yoshihiro<br />
Ohno is the project leader in the Optical Technology<br />
Division for photometry <strong>and</strong> provides luminous intensity<br />
<strong>and</strong> other photometric calibrations. G. Eppeldauer, J. E.<br />
Hardis, <strong>and</strong> T. C. Larason are scientists in the Optical<br />
Technology Division. The <strong>National</strong> <strong>Institute</strong> <strong>of</strong> <strong>St<strong>and</strong>ards</strong><br />
<strong>and</strong> Technology is an agency <strong>of</strong> the Technology<br />
Administration, U. S. Department <strong>of</strong> Commerce.
Volume 103, Number 6, November–December 1998<br />
Journal <strong>of</strong> Research <strong>of</strong> the <strong>National</strong> <strong>Institute</strong> <strong>of</strong> <strong>St<strong>and</strong>ards</strong> <strong>and</strong> Technology<br />
[J. Res. Natl. Inst. St<strong>and</strong>. Technol. 103, 615 (1998)]<br />
Spectral Response Based Calibration Method<br />
<strong>of</strong> Tristimulus Colorimeters<br />
Volume 103 Number 6 November–December 1998<br />
George Eppeldauer<br />
<strong>National</strong> <strong>Institute</strong> <strong>of</strong> <strong>St<strong>and</strong>ards</strong> <strong>and</strong><br />
Technology,<br />
Gaithersburg, MD 20899-0001<br />
1. Introduction<br />
Tristimulus colorimetry is based on light measurement<br />
using three or more receivers with spectral responsivities<br />
matched to the Commission Internationale de<br />
l’Eclairage (CIE) x¯(�), y¯(�), <strong>and</strong> z¯(�) color matching<br />
functions [1]. To achieve accurate measurements for a<br />
large variety <strong>of</strong> light sources, the spectral matches<br />
should be as close as possible to the color matching<br />
functions. The receivers are usually realized with silicon<br />
photodiodes <strong>and</strong> attached filter packages [2]. Usually,<br />
the spectral mismatch between the realized <strong>and</strong> the color<br />
matching functions give the dominant uncertainties in<br />
tristimulus color measurements.<br />
At present, tristimulus colorimeters are calibrated<br />
with st<strong>and</strong>ard lamps. The calibration <strong>of</strong> the most frequently<br />
used color temperature st<strong>and</strong>ard lamps is<br />
derived from source-based spectral irradiance scales.<br />
<strong>NIST</strong> reported a 0.67 % relative exp<strong>and</strong>ed uncertainty<br />
A new method is described to calibrate<br />
tristimulus colorimeters for high accuracy<br />
color measurements. Instead <strong>of</strong> traditional<br />
lamp st<strong>and</strong>ards, modern, high accuracy<br />
detector st<strong>and</strong>ards are suggested for calibration.<br />
After high accuracy absolute spectral<br />
response determination <strong>of</strong> the tristimulus<br />
receivers, color (spectral) correction<br />
<strong>and</strong> peak (amplitude) normalization can<br />
minimize uncertainties caused by imperfect<br />
realizations <strong>of</strong> the Commission Internationale<br />
de l’Eclairage (CIE) color matching<br />
functions. As a result <strong>of</strong> the corrections,<br />
stable light sources <strong>of</strong> different spectral<br />
615<br />
power distributions can be measured with<br />
an accuracy dominated by the sub tenths<br />
<strong>of</strong> a percent uncertainty <strong>of</strong> novel spectral<br />
response determinations.<br />
Key words: chromaticity coordinates;<br />
color calibration; color temperature; colorimetry;<br />
detector st<strong>and</strong>ard; photometry;<br />
spectral response; tristimulus values.<br />
Accepted: August 19, 1998<br />
Available online: http://www.nist.gov/jres<br />
(k =2) 1 for the disseminated spectral irradiance st<strong>and</strong>ard<br />
lamps in the visible range <strong>and</strong> a relative 0.59 %<br />
long-term reproducibility [3]. Research is being conducted<br />
at <strong>NIST</strong> to decrease the 0.67 % uncertainty by a<br />
factor <strong>of</strong> three still using st<strong>and</strong>ard lamps [4]. The accuracy<br />
<strong>of</strong> the st<strong>and</strong>ard lamp influences the photometric<br />
[receiver matched to y¯(�)] accuracy <strong>of</strong> the tristimulus<br />
colorimeter. The wavelength dependent (e.g., burning<br />
time caused) changes <strong>of</strong> the st<strong>and</strong>ard lamp influence the<br />
colorimetric accuracy <strong>of</strong> the tristimulus meter.<br />
Several commercially available colorimeters were<br />
compared for accuracy by measuring nine different<br />
laser lines (saturated colors) by Berns et al. [6]. The<br />
differences between the theoretical <strong>and</strong> the measured<br />
chromaticity coordinates were reported. The lowest rms<br />
1 Throughout this paper uncertainties are given as relative exp<strong>and</strong>ed<br />
uncertainties with a coverage factor k = 2 unless otherwise stated [5].
Volume 103, Number 6, November–December 1998<br />
Journal <strong>of</strong> Research <strong>of</strong> the <strong>National</strong> <strong>Institute</strong> <strong>of</strong> <strong>St<strong>and</strong>ards</strong> <strong>and</strong> Technology<br />
errors in x <strong>and</strong> y (0.0042 <strong>and</strong> 0.0051, respectively) were<br />
observed on a tristimulus colorimeter employing partial<br />
(mosaic) filters. The errors are expected to decrease to<br />
a large extent for white light sources, such as tungsten<br />
lamps. The reported errors were dominated by spectral<br />
response deviations (mismatch) <strong>of</strong> the receivers relative<br />
to the CIE recommended color matching functions. The<br />
uncertainties <strong>of</strong> the calibrating st<strong>and</strong>ard lamps also contributed<br />
to the results.<br />
In contrast to source st<strong>and</strong>ards, primary st<strong>and</strong>ard detectors<br />
(cryogenic radiometers) can measure optical (radiant)<br />
power with an uncertainty <strong>of</strong> 10 �4 [7, 8]. Certain<br />
type silicon detectors, in a light-trap arrangement, can<br />
be calibrated against primary st<strong>and</strong>ard radiometers using<br />
several intensity stabilized lasers [9]. With interpolation<br />
between the laser lines, a 0.06 % uncertainty in<br />
spectral responsivity was reported on light-trap Si detectors<br />
between 406 nm <strong>and</strong> 920 nm [10]. This uncertainty<br />
is about one fourth <strong>of</strong> the uncertainties reported<br />
for traditional monochromator based detector spectral<br />
response measurements [11].<br />
Achievable total uncertainty <strong>of</strong> spectral transmittance<br />
measurements on high quality color filters is reported to<br />
be 2 � 10 �4 [12].<br />
A narrow-b<strong>and</strong> filter-radiometer was calibrated for<br />
spectral irradiance response in the visible region against<br />
a trap detector with an uncertainty <strong>of</strong> 0.07 % [13] for<br />
measured irradiance. In that report, the dominant uncertainty<br />
components were the uncertainties <strong>of</strong> the trap<br />
detector response, 0.036 %, the area <strong>of</strong> the trap aperture,<br />
0.034 %, <strong>and</strong> the wavelength reproducibility,<br />
0.026 %.<br />
If the uncertainties <strong>of</strong> the receiver response measurements<br />
are very small, the spatial response non-uniformities<br />
<strong>of</strong> the filter-detector packages could limit the accuracy<br />
<strong>of</strong> the tristimulus measurements. This problem can<br />
be avoided if apertures are used in front <strong>of</strong> the filter-detector<br />
packages <strong>and</strong> the apertures are overfilled with the<br />
uniform field <strong>of</strong> the (point) source to be measured. The<br />
area <strong>of</strong> the apertures can be measured with an uncertainty<br />
<strong>of</strong> 0.026 % [14].<br />
The motivation behind the development <strong>of</strong> a detectorbased<br />
calibration method for tristimulus colorimeters<br />
was to utilize the significantly lower uncertainty <strong>of</strong> new<br />
detector st<strong>and</strong>ards compared with traditional lamp st<strong>and</strong>ards.<br />
The goal <strong>of</strong> the method described in this paper is<br />
to determine broad-b<strong>and</strong> calibration factors for all receivers<br />
in a tristimulus colorimeter to minimize measurement<br />
uncertainty. If the spectral response determination<br />
<strong>of</strong> the receivers is accurate, application <strong>of</strong> the<br />
calibration factors for different source distributions will<br />
result in high colorimetric accuracy. This multiple receiver<br />
method is an extension <strong>of</strong> the single receiver<br />
spectral mismatch correction used in our detector-based<br />
illuminance scale realization [15, 16].<br />
616<br />
2. Theoretical Basis<br />
In order to determine x, y chromaticity coordinates <strong>of</strong><br />
a light source, the CIE tristimulus values <strong>of</strong> the source<br />
are to be obtained by<br />
X = k� �S(�) x¯(�) d�<br />
Y = k� �S(�) y¯(�) d� (1)<br />
Z = k� �S(�) z¯(�) d�,<br />
where S(�) is the spectral power distribution <strong>of</strong> the<br />
source to be measured; x¯(�), y¯(�), <strong>and</strong> z¯(�) are the 1931<br />
CIE color-matching functions; <strong>and</strong> k is a normalization<br />
factor. In practice, x¯(�) is realized by two receivers,<br />
x¯L(�) <strong>and</strong>x¯S(�):<br />
x¯S(�) =0 <strong>and</strong> x¯L(�) =x¯(�) if the wavelength is<br />
longer than 504 nm, <strong>and</strong><br />
x¯L(�) =0 <strong>and</strong> x¯S(�) =x¯(�) if the wavelength is<br />
shorter than 504 nm.<br />
(<strong>Note</strong> that the subscripts L <strong>and</strong> S mean long <strong>and</strong> short,<br />
respectively.)<br />
The CIE tristimulus value X can be written as:<br />
where<br />
X = X1 + X2, (2)<br />
X1 = k� �S(�) x¯L(�) d�, <strong>and</strong><br />
X2 = k� �S(�) x¯S(�) d�.<br />
Y in Eq. (1) will give an absolute photometric quantity<br />
(e.g., in lux) [15] if<br />
k = Km = 683 lm/W. (3)<br />
The measured photodiode output currents <strong>of</strong> the four<br />
separate receivers are<br />
IX1 = � �S(�) sXL(�) d�<br />
IX2 = � �S(�) sXS(�) d�<br />
IY = � �S(�) sY(�) d�<br />
IZ = � �S(�) sZ(�) d�. (4)<br />
where sXL(�), sXS(�), sY(�), <strong>and</strong> sZ(�) are the absolute<br />
spectral responsivities <strong>of</strong> the receivers.<br />
When measuring a light source <strong>of</strong> known spectral<br />
power distribution S(�), the receiver calibration factors<br />
can be determined from the ratio <strong>of</strong> Eq. (1) to Eq. (4):
Volume 103, Number 6, November–December 1998<br />
Journal <strong>of</strong> Research <strong>of</strong> the <strong>National</strong> <strong>Institute</strong> <strong>of</strong> <strong>St<strong>and</strong>ards</strong> <strong>and</strong> Technology<br />
kX1 = X1<br />
IX1<br />
kX2 = X2<br />
IX2<br />
kY = Y<br />
IY<br />
kZ = Z<br />
IZ<br />
= Km� �S(�) x¯L(�) d�<br />
� �S(�) sXL(�) d�<br />
= Km� �S(�) x¯S(�) d�<br />
� �S(�) sXS(�) d�<br />
= Km� �S(�) y¯(�) d�<br />
� �S(�) sY(�) d�<br />
= Km� �S(�) z¯(�) d�<br />
� �S(�) sZ(�) d� .<br />
(5)<br />
By normalizing the color matching functions to their<br />
peak values, the receiver calibration factors can be written<br />
as:<br />
kX1 = 1.06291 Km FX1<br />
sXL(599)<br />
kX2 = 0.3501 Km FX2<br />
sXS(442)<br />
kY = Km FY<br />
sY(555)<br />
kZ = 1.78297 Km FZ<br />
sZ(446)<br />
by introducing the color correction factors:<br />
FX1 = � �S(�) x¯Ln(�) d�<br />
� �S(�) sXLn(�) d�<br />
FX2 = � �S(�) x¯Sn(�) d�<br />
� �S(�) sXSn(�) d�<br />
FY = � �S(�) V(�) d�<br />
� �S(�) sYn(�) d�<br />
FZ = � �S(�) z¯n(�) d�<br />
� �S(�) sZn(�) d� ,<br />
(6)<br />
(7)<br />
where sXL(599), sXS(442), sY(555), <strong>and</strong> sZ(446) are the<br />
absolute responses <strong>of</strong> the realized receivers at the peak<br />
wavelengths <strong>of</strong> the color matching functions; <strong>and</strong><br />
sXLn(�), sXSn(�), sYn(�), <strong>and</strong> sZn(�) are the relative responses<br />
<strong>of</strong> the realized receivers normalized also at the<br />
peak wavelengths <strong>of</strong> the color matching functions. The<br />
peak wavelengths <strong>of</strong> the realized receivers are not necessarily<br />
equal to the peak wavelengths <strong>of</strong> the color matching<br />
functions.<br />
A color correction factor will be unity if the normalized<br />
channel response is equal to the normalized CIE<br />
color matching function.<br />
617<br />
Once the tristimulus colorimeter is calibrated for kX1,<br />
kX2, kY, <strong>and</strong>kZ, the tristimulus values <strong>of</strong> a test light<br />
source can be measured as<br />
X'=X1' + X2' where X1' = kX1IX1' <strong>and</strong> X2' = kX2 IX2'<br />
Y' = kY IY' (8)<br />
Z' = kZ IZ'<br />
where IXl', IX2', IY', <strong>and</strong>IZ' are the measured output<br />
currents <strong>of</strong> the receivers.<br />
The calibration procedure can be applied to various<br />
measurement geometries (e.g., illuminance, luminance,<br />
luminous flux, or luminous intensity) depending on the<br />
units in which sXL(599), sXS(442), sY(555), <strong>and</strong> sZ(446)<br />
are expressed.<br />
3. Achievable Accuracy<br />
In order to obtain the highest color measurement accuracy,<br />
the receiver calibration factors are to be redetermined<br />
for all S(�) source distributions to be measured.<br />
The spectral mismatch <strong>of</strong> the receivers, relative to the<br />
CIE functions, should be small to allow for relatively<br />
large uncertainties when determining S(�). It was<br />
shown in an earlier work [16] that the change <strong>of</strong> FY with<br />
a high quality spectral match <strong>of</strong> f1' = 1.43 % [2], was<br />
0.1 % for a color temperature change from 2600 K to<br />
3200 K <strong>of</strong> a Planckian radiator. With a lower quality<br />
spectral match <strong>of</strong> f1' = 3.4 %, which is typical for the red<br />
<strong>and</strong> blue receivers, the change in FY would be larger, still<br />
allowing for a large enough uncertainty <strong>of</strong> S(�). The<br />
final S(�) for tungsten lamps, which are more or less<br />
similar to Planckian radiators [17], can be obtained by<br />
iterating the Planckian function (at different temperatures)<br />
<strong>and</strong> the tristimulus measurements, until the<br />
highest color measurement accuracy is reached. For<br />
other types <strong>of</strong> sources with smoothly varying spectral<br />
power distribution (e.g., many kinds <strong>of</strong> paints, color<br />
tiles, etc.), S(�) can be measured with a low accuracy<br />
spectroradiometer, <strong>and</strong> the color measurement accuracy<br />
still remains high.<br />
According to the references in the Introduction, the<br />
presently achievable relative exp<strong>and</strong>ed uncertainty <strong>of</strong><br />
absolute spectral response determinations is on the order<br />
<strong>of</strong> 0.1 %. The uncertainty <strong>of</strong> relative spectral response<br />
measurements can be lower because <strong>of</strong> the<br />
smaller number <strong>of</strong> uncertainty components. The uncertainties<br />
<strong>of</strong> the tristimulus values propagate to the uncertainties<br />
<strong>of</strong> the chromaticity coordinates. The chromaticity<br />
coordinates can be calculated from the tristimulus<br />
values via
Volume 103, Number 6, November–December 1998<br />
Journal <strong>of</strong> Research <strong>of</strong> the <strong>National</strong> <strong>Institute</strong> <strong>of</strong> <strong>St<strong>and</strong>ards</strong> <strong>and</strong> Technology<br />
X<br />
Y<br />
x = , y = . (9)<br />
X + Y + Z X + Y + Z<br />
Now, assume that the relative uncertainties <strong>of</strong> X, Y, <strong>and</strong><br />
Z are all 0.1 %. For a St<strong>and</strong>ard Illuminant A, where<br />
x = 0.4476 <strong>and</strong> y = 0.4074, the worst case scenario<br />
(�X = + 0.1 %, �Y = � 0.1 %, <strong>and</strong> �Z = 0 %) shows a<br />
chromaticity coordinate change <strong>of</strong> ≅0.0004 for both x<br />
<strong>and</strong> y, resulting in a ≅10 K change in the correlated<br />
color temperature. These exp<strong>and</strong>ed uncertainties are<br />
similar to those reported for the source-based <strong>NIST</strong><br />
color temperature scale [18]. With improvements <strong>of</strong><br />
spectral response determinations (as suggested below),<br />
the accuracy <strong>of</strong> detector-based tristimulus color measurements<br />
can be further increased.<br />
4. Suggested Realizations<br />
The described detector-based calibration method can<br />
be applied to the calibration <strong>of</strong> existing tristimulus colorimeters<br />
where the spectral response <strong>of</strong> the receivers<br />
can be measured. The achievable color measurement<br />
accuracy will depend on the uncertainty <strong>of</strong> the spectral<br />
response measurements.<br />
St<strong>and</strong>ard quality tristimulus colorimeters can be constructed<br />
using high accuracy detector st<strong>and</strong>ards such as<br />
trap detectors. The advantage <strong>of</strong> using silicon trap detector<br />
st<strong>and</strong>ards is that the spectral response <strong>of</strong> the trap<br />
detector can be determined directly against a primary<br />
st<strong>and</strong>ard cryogenic radiometer [10]. Further advantages<br />
<strong>of</strong> trap detectors are relative response non-uniformities<br />
<strong>of</strong> less than 0.02 % [19] <strong>and</strong> very low reflectance in the<br />
visible wavelength range [9], especially for transmission<br />
type versions [20, 21]. The filter packages can be measured<br />
separately if they are used with transmission-type<br />
trap detectors because <strong>of</strong> zero back reflection from<br />
these detectors.<br />
We have started developing a new facility to calibrate<br />
illuminance measuring photometers <strong>and</strong> tristimulus colorimeters<br />
against irradiance measuring trap detectors.<br />
These trap detectors will be calibrated against the cryogenic<br />
radiometer in the power (detector is underfilled by<br />
the laser beam) measurement mode. The trap detectors<br />
are equipped with precision apertures <strong>and</strong> will measure<br />
the well-collimated radiation (within the aperture) from<br />
point sources to obtain the highest accuracy. The point<br />
sources are being realized with small integrating<br />
spheres illuminated by tunable lasers. The aperture areas<br />
are also measured with point sources. The accuracy<br />
<strong>of</strong> our cryogenic radiometer is being improved to<br />
achieve radiant power measurements with an uncertainty<br />
<strong>of</strong> between 0.01 % <strong>and</strong> 0.02 %. The expected<br />
spectral irradiance response uncertainty <strong>of</strong> the irradi-<br />
618<br />
ance trap detectors (for point sources) is about 0.03 %.<br />
All <strong>of</strong> our existing illuminance-type meters can be calibrated<br />
against the irradiance trap detectors with substitution<br />
in the uniform field <strong>of</strong> the tunable monochromatic<br />
point source. After spectral response calibrations, the<br />
described correction method will be applied. A tristimulus<br />
colorimeter calibrated this way will have a chromaticity<br />
coordinate measurement uncertainty (exp<strong>and</strong>ed<br />
but not relative) <strong>of</strong> about 0.0003. The accuracy<br />
<strong>of</strong> matrix corrected tristimulus colorimeters [22, 23, 24]<br />
can also be improved if they are calibrated against the<br />
suggested response corrected reference tristimulus colorimeters.<br />
Further analysis is suggested to establish a<br />
relationship between the f1' <strong>of</strong> the receivers <strong>and</strong> the colorimetric<br />
accuracy when spectrally structured <strong>and</strong><br />
changing source spectral power distributions (e.g., color<br />
TV monitors) are measured.<br />
5. Conclusion<br />
The significant decrease <strong>of</strong> uncertainties in detector<br />
spectral response measurements in the past 5 years motivated<br />
the development <strong>of</strong> a detector-based calibration<br />
method for tristimulus colorimeters.<br />
A method for color (spectral mismatch) correction<br />
<strong>and</strong> peak (amplitude) normalization <strong>of</strong> color measuring<br />
tristimulus receivers has been developed. Broad-b<strong>and</strong><br />
calibration factors, based on spectral response measurements<br />
<strong>of</strong> the receivers, can be determined to minimize<br />
the color measurement uncertainties caused by the imperfect<br />
receiver response realizations. The method utilizes<br />
the lower uncertainty <strong>of</strong> new detector st<strong>and</strong>ards<br />
relative to traditional lamp st<strong>and</strong>ards. The calibration<br />
factors can be determined for sources <strong>of</strong> different spectral<br />
power distributions.<br />
Application <strong>of</strong> the described detector-based calibration<br />
method will result in chromaticity coordinate exp<strong>and</strong>ed<br />
uncertainties (not relative) <strong>of</strong> less than 0.001.<br />
This corresponds to a color temperature measurement<br />
accuracy equal to or better than that <strong>of</strong> presently used<br />
primary lamp st<strong>and</strong>ards.<br />
Acknowledgments<br />
The author thanks Y. Ohno <strong>and</strong> M. Racz for their<br />
helpful advice.<br />
6. References<br />
[1] Publication CIE No 15.2 (1986). Central Bureau <strong>of</strong> the CIE,<br />
A-1033 Vienna, P.O. Box 169, Austria.<br />
[2] Publication CIE No 69 (1987). Central Bureau <strong>of</strong> the CIE, A-<br />
1033 Vienna, P.O.Box 169, Austria, pp. 5, 9.
Volume 103, Number 6, November–December 1998<br />
Journal <strong>of</strong> Research <strong>of</strong> the <strong>National</strong> <strong>Institute</strong> <strong>of</strong> <strong>St<strong>and</strong>ards</strong> <strong>and</strong> Technology<br />
[3] J. H. Walker, R. D. Saunders, J. K. Jackson, <strong>and</strong> D. A. McSparron,<br />
Spectral irradiance calibrations. NBS Special Publication<br />
250-20 (1987).<br />
[4] B. K. Tsai, Developments in the New Spectral Irradiance Scale<br />
at the <strong>National</strong> <strong>Institute</strong> <strong>of</strong> <strong>St<strong>and</strong>ards</strong> <strong>and</strong> Technology, NCSL<br />
Workshop <strong>and</strong> Symposium, Session 3E (1996) pp. 325–341.<br />
[5] B. N. Taylor <strong>and</strong> C. E. Kuyatt, Guidelines for Evaluating <strong>and</strong><br />
Expressing the Uncertainty <strong>of</strong> <strong>NIST</strong> Measurement Results,<br />
<strong>NIST</strong> <strong>Technical</strong> <strong>Note</strong> 1297 (1994).<br />
[6] R. S. Berns, M. E. Gorzynski, <strong>and</strong> R. J. Motta, CRT Colorimetry,<br />
Part II: Metrology, Color Res. Appl. 18 (3), 315–325 (1993).<br />
[7] J. E. Martin, N. P. Fox, <strong>and</strong> P. J. Key, Metrologia 21, 147–155<br />
(1985).<br />
[8] K. D. Stock <strong>and</strong> H. H<strong>of</strong>er, PTB primary st<strong>and</strong>ard for optical<br />
radiant power: transfer-optimized facility in the clean-room center,<br />
Metrologia 32(6), 545–549 (1996).<br />
[9] T. R. Gentile, J. M. Houston, J. E. Hardis, C. L. Cromer, <strong>and</strong> A.<br />
C. Parr, <strong>National</strong> <strong>Institute</strong> <strong>of</strong> <strong>St<strong>and</strong>ards</strong> <strong>and</strong> Technology high<br />
accuracy cryogenic radiometer, Appl. Opt. 35, 1056–1068<br />
(1996).<br />
[10] T. R. Gentile, J. M. Houston, <strong>and</strong> C. L. Cromer, Realization <strong>of</strong><br />
a scale <strong>of</strong> absolute spectral response using the <strong>NIST</strong> high accuracy<br />
cryogenic radiometer, Appl. Opt. 35, 4392–4403 (1996).<br />
[11] T. C. Larason, S. S. Bruce, <strong>and</strong> C. L. Cromer, The <strong>NIST</strong> High<br />
Accuracy Scale for Absolute Spectral Response from 406 nm to<br />
920 nm, J. Res. Natl. Inst. St<strong>and</strong>. Technol. 101(2), 133–140<br />
(1996).<br />
[12] K. L. Eckerle, J. J. Hsia, K. D. Mielenz, <strong>and</strong> V. R. Weidner, NBS<br />
Special Publication 250-6, Regular Spectral Transmittance<br />
(1987) p. 34.<br />
[13] R. Friedrich, J. Fischer, <strong>and</strong> M. Stock, Accurate calibration <strong>of</strong><br />
filter radiometers against a cryogenic radiometer using a trap<br />
detector, Metrologia 32(6), 509–513 (1996).<br />
[14] E. Ikonen <strong>and</strong> P. Toivanen, A new optical method for high-accuracy<br />
determination <strong>of</strong> aperture area (preprint).<br />
[15] C. L. Cromer, G. Eppeldauer, J. E. Hardis, T. C. Larason, <strong>and</strong> A.<br />
C. Parr, <strong>National</strong> <strong>Institute</strong> <strong>of</strong> <strong>St<strong>and</strong>ards</strong> <strong>and</strong> Technology Detector-based<br />
Photometric Scale, Appl. Opt. 32(16), 2936–2948<br />
(1993).<br />
[16] C. L. Cromer, G. Eppeldauer, J. E. Hardis, T. C. Larason, Y.<br />
Ohno, <strong>and</strong> A. C. Parr, The <strong>NIST</strong> Detector-Based Luminous<br />
Intensity Scale, J. Res. Natl. Inst. St<strong>and</strong>. Technol. 101, 109–132<br />
(1996).<br />
[17] Y. Ohno <strong>and</strong> M. Navarro, Improved Photometric <strong>and</strong> Colorimetric<br />
Calibrations at <strong>NIST</strong>, Proc. <strong>of</strong> the NCSL Workshop <strong>and</strong><br />
Symposium, Session 1E (1997) pp. 99–110.<br />
[18] Y. Ohno, Photometric Calibrations, <strong>NIST</strong> Special Publication<br />
250-37 (1997).<br />
[19] R. Kohler, R. Goebel, M. Stock, <strong>and</strong> R. Pello, An international<br />
comparison <strong>of</strong> cryogenic radiometers, in Optical Radiation Measurements<br />
III, J. M. Palmer, ed., Proc. SPIE2815 (1996) pp.<br />
22–30.<br />
[20] J. L. Gardner, Transmission trap detectors, Appl. Opt. 33(25),<br />
5914–5918 (1994).<br />
[21] T. Kubarsepp, P. Karha, <strong>and</strong> E. Ikonen, Characterization <strong>of</strong> a<br />
polarization-independent transmission trap detector, Appl. Opt.<br />
36(13), 2807–2812 (1997).<br />
[22] G. Eppeldauer <strong>and</strong> J. Sch<strong>and</strong>a, Colorimeter with matrix transformation,<br />
AIC Conference on Color Dynamics, Budapest, Hungary,<br />
Proc. (1976) pp. 403–413.<br />
[23] E 1455-92, St<strong>and</strong>ard Practice for Obtaining Colorimetric Data<br />
from a Visual Display Unit Using Tristimulus Colorimeters,<br />
ASTM <strong>St<strong>and</strong>ards</strong> on Color <strong>and</strong> Appearance Measurement, 4th<br />
Ed. (Available from ASTM, 100 Barr Harbor Dr., Wet Conshohocken,<br />
PA 19428-2959.)<br />
619<br />
[24] Y. Ohno <strong>and</strong> J. E. Hardis, Improved Matrix Method for Tristimulus<br />
Colorimetry <strong>of</strong> Displays, AIC Color’97, Kyoto, May 26-30,<br />
1997.<br />
About the author: George Eppeldauer is a Ph.D. Electronics<br />
Engineer in the Optical Technology Division <strong>of</strong><br />
the <strong>NIST</strong> Physics Laboratory. The <strong>National</strong> <strong>Institute</strong> <strong>of</strong><br />
<strong>St<strong>and</strong>ards</strong> <strong>and</strong> Technology is an agency <strong>of</strong> the Technology<br />
Administration, U.S. Department <strong>of</strong> Commerce.
Design <strong>and</strong> characterization <strong>of</strong> a<br />
photometer–colorimeter st<strong>and</strong>ard<br />
George P. Eppeldauer <strong>and</strong> Miklós Rácz<br />
A photometer <strong>and</strong> tristimulus colorimeter has been developed at the <strong>National</strong> <strong>Institute</strong> <strong>of</strong> <strong>St<strong>and</strong>ards</strong> <strong>and</strong><br />
Technology �<strong>NIST</strong>� to realize a color scale. A novel construction was developed to implement the<br />
spectral-responsivity-based scale with small uncertainty. The new device can be used as a reference<br />
illuminance <strong>and</strong> luminance meter as well. Temperature-controlled filter combinations, with 5–8 layers<br />
in one package, are used to match the responsivity <strong>of</strong> a silicon tunnel-trap detector to the CIE colormatching<br />
functions with small spectral mismatch values � f 1��. Design considerations to extend the<br />
tunnel-trap detector with replaceable single <strong>and</strong> double apertures <strong>and</strong> changeable filter combinations are<br />
described. The design <strong>and</strong> fabrication <strong>of</strong> the filter packages <strong>and</strong> the dependence <strong>of</strong> the f 1� values on the<br />
thickness <strong>of</strong> the filter layers are discussed. The colorimeter was characterized for angular, spatial, <strong>and</strong><br />
spectral responsivity. An improved preamplifier can convert current to voltage in an 11-decade dynamic<br />
range with 0.01% uncertainty. © 2004 Optical Society <strong>of</strong> America<br />
OCIS codes: 040.5160, 330.1730, 120.4800, 120.5240.<br />
1. Introduction<br />
In our earlier publication 1 a method was suggested<br />
for calibrating tristimulus colorimeters against detector<br />
st<strong>and</strong>ards instead <strong>of</strong> traditional lamp st<strong>and</strong>ards.<br />
In this new calibration method, spectral<br />
corrections are applied to the broadb<strong>and</strong> calibration<br />
factors <strong>of</strong> the tristimulus channels <strong>of</strong> a colorimeter.<br />
As a result <strong>of</strong> the spectral <strong>and</strong> amplitude corrections,<br />
the imperfect realizations <strong>of</strong> the Commission Internationale<br />
de l’Eclairage �CIE� x����, y����, <strong>and</strong> z����<br />
color-matching functions can be compensated. It is<br />
the uncertainty <strong>of</strong> the spectral responsivity measurement<br />
<strong>of</strong> the channels that will dominate the uncer-<br />
G. P. Eppeldauer �george.eppeldauer@nist.gov� is with the <strong>National</strong><br />
<strong>Institute</strong> <strong>of</strong> <strong>St<strong>and</strong>ards</strong> <strong>and</strong> Technology, Optical Technology<br />
Division, Gaithersburg, Maryl<strong>and</strong> 20899. M. Rácz is with the<br />
Konkoly Observatory, Hungarian Academy <strong>of</strong> Sciences, P.O. Box<br />
67, 1525 Budapest, Hungary, <strong>and</strong> the Hungarian Academy <strong>of</strong> Sciences,<br />
Research <strong>Institute</strong> for <strong>Technical</strong> Physics <strong>and</strong> Materials Science,<br />
Magyar Tudomanyos Akademia �Hungarian Academy <strong>of</strong><br />
Sciences�, Muszaki Fizikai es Anyagtudomanyi Kutatointezet �Research<br />
<strong>Institute</strong> for <strong>Technical</strong> Physics <strong>and</strong> Material Science�, P.O.<br />
Box 49, 1525 Budapest, Hungary, <strong>and</strong> was a <strong>National</strong> <strong>Institute</strong> <strong>of</strong><br />
<strong>St<strong>and</strong>ards</strong> <strong>and</strong> Technology guest researcher when this research<br />
was begun.<br />
Received 30 July 2003; revised manuscript received 17 February<br />
2004; accepted 18 February 2004.<br />
0003-6935�04�132621-11$15.00�0<br />
© 2004 Optical Society <strong>of</strong> America<br />
tainty <strong>of</strong> tristimulus color measurements. The<br />
present paper describes the design considerations<br />
<strong>and</strong> characterizations <strong>of</strong> a special tristimulus colorimeter<br />
construction with which the spectral responsivity<br />
<strong>of</strong> the colorimeter channels can be determined<br />
with extremely low uncertainty.<br />
To make it possible to measure a light source with<br />
a known spectral power distribution S���, the channel<br />
calibration factors can be determined from the<br />
ratio <strong>of</strong> the CIE tristimulus values to the measured<br />
output currents <strong>of</strong> the four channels:<br />
kX1 � X1 �<br />
IX1 Km �� S���x� 1���d�<br />
�� S���sX1���d� � 1.06291KmF X1<br />
,<br />
sX1�599� kX2 � X2 �<br />
IX2 Km �� S���x� 2���d�<br />
�� S���sX2���d� � 0.3501KmF X2<br />
,<br />
sX2�442� kY � Y<br />
�<br />
IY Km �� S���y����d �<br />
�� S���sY���d� � KmF Y<br />
sY�555� ,<br />
kZ � Z<br />
�<br />
IZ Km �� S���z����d�<br />
�� S���sZ���d� � 1.78297KmF Z<br />
.<br />
sZ�446� As x���� has two lobes, it is realized by two channels,<br />
x� 1��� <strong>and</strong> x� 2���. The right-h<strong>and</strong> side <strong>of</strong> the equations<br />
was obtained by normalizing the color-matching<br />
(1)<br />
1 May 2004 � Vol. 43, No. 13 � APPLIED OPTICS 2621
functions to their peak values <strong>and</strong> introducing the<br />
color correction factors:<br />
F X1 � � � S���x� 1n���d�<br />
� � S���s X1n ���d� ,<br />
F X2 � � � S���x� 2n���d�<br />
� � S���s X2n ���d� ,<br />
F Y � � � S���V���d�<br />
� � S���s Yn���d� ,<br />
FZ � �� S���z� n���d�<br />
, (2)<br />
�� S���sZn���d� where s X1 �599�, s X2 �442�, s Y�555�, <strong>and</strong> s Z�446� are the<br />
absolute responsivities <strong>of</strong> the realized channels at the<br />
peak wavelengths <strong>of</strong> the color-matching functions,<br />
x� 1n���, x� 2n���, <strong>and</strong> z� n��� are the color-matching functions<br />
normalized to one at their peaks, V��� is the<br />
spectral luminous efficiency function for photopic vision<br />
�also normalized to one at its peak�, <strong>and</strong> s X1n ���,<br />
s X2n ���, s Yn���, <strong>and</strong> s Zn��� are the relative spectral<br />
responsivities <strong>of</strong> the realized channels normalized to<br />
one at their peak wavelengths.<br />
After the tristimulus colorimeter is calibrated for<br />
k X1 , k X2 , k Y, <strong>and</strong> k Z, the tristimulus values <strong>of</strong> a test<br />
light source can be measured as<br />
X� � X 1� � X 2�, where X 1� � k X1 I X1 �, X 2� � k X2 I X2 �,<br />
Y� � kYI Y�,<br />
Z� � kZI Z�, (3)<br />
where I X1 �, I X2 �, I Y�, <strong>and</strong> I Z� are the measured output<br />
currents <strong>of</strong> the tristimulus channels.<br />
This calibration procedure can be applied to either<br />
illuminance or luminance measurement geometry by<br />
use <strong>of</strong> the relevant units <strong>of</strong> s X1 �599�, s X2 �442�, s Y�555�,<br />
<strong>and</strong> s Z�446� in the equations.<br />
According to the above procedure, the photometric<br />
<strong>and</strong> colorimetric measurement uncertainties will depend<br />
only on the uncertainty <strong>of</strong> the spectral responsivity<br />
determination <strong>of</strong> the colorimeter channels.<br />
An advantage <strong>of</strong> the method is that accurate color<br />
<strong>and</strong> photometric measurements can be made even if<br />
the CIE functions are poorly realized �with large<br />
spectral mismatch� in the channels <strong>of</strong> a colorimeter.<br />
For perfect realizations, the color <strong>of</strong> any source distributions<br />
could be measured accurately with one set<br />
<strong>of</strong> calibration factors shown in Eq. �1�. In this case,<br />
all the color correction factors in Eq. �2� would become<br />
unity. We have decided to keep the CIE f 1��spectral<br />
mismatch� values 2 <strong>of</strong> the realized channels small so<br />
that one set <strong>of</strong> calibration factors can be used for<br />
sources with similar spectral distributions. Also,<br />
rough knowledge <strong>of</strong> the source distribution is enough<br />
to perform accurate color measurements. Even with<br />
small f 1� values, an additional set <strong>of</strong> calibration factors<br />
will be needed to measure very different source<br />
distributions, such as gas discharge lamps or display<br />
monitors.<br />
2622 APPLIED OPTICS � Vol. 43, No. 13 � 1 May 2004<br />
Our goal was to design <strong>and</strong> fabricate a photometer–<br />
colorimeter for which the spectral responsivity <strong>of</strong> the<br />
channels can be determined with an exp<strong>and</strong>ed uncertainty<br />
�k � 2� <strong>of</strong> 0.1% or less. 3 A 0.1% change in the<br />
spectral irradiance responsivity <strong>of</strong> any one channel<br />
will result in a chromaticity coordinate change <strong>of</strong><br />
0.0002 for both x <strong>and</strong> y �for a Planckian radiator� <strong>and</strong><br />
a change in the illuminance responsivity <strong>of</strong> 0.1%.<br />
These expected colorimeter uncertainties are equivalent<br />
to the uncertainties <strong>of</strong> current primary lamp<br />
st<strong>and</strong>ards. While intensity <strong>and</strong> spectral distribution<br />
<strong>of</strong> lamp st<strong>and</strong>ards may change significantly with<br />
burning time, the responsivity change <strong>of</strong> colorimeter<br />
channels can be much smaller versus time.<br />
In order to satisfy the above expectations, a silicon<br />
tunnel-trap detector is used in our colorimeter st<strong>and</strong>ard.<br />
This detector does not have back reflections to<br />
the filters, <strong>and</strong> its spectral responsivity can be determined<br />
with an uncertainty <strong>of</strong> 0.1%. The four filter<br />
combinations that modify the spectral responsivity <strong>of</strong><br />
the trap detector �to be similar to the CIE functions�<br />
needed individual design <strong>and</strong> fabrication to achieve<br />
small f 1� values. The small f 1� values make it possible<br />
to avoid frequent change �redetermination� <strong>of</strong><br />
the channel calibration factors even for significant<br />
changes in the measured source distribution. Temperature<br />
stabilization <strong>of</strong> the filter combinations<br />
�packages� is necessary to eliminate changes in their<br />
spectral transmittances.<br />
The photometric <strong>and</strong> tristimulus color scale realizations<br />
have been studied. 4 The photometer–<br />
colorimeter, when equipped with different filters, can<br />
be used as a radiometric st<strong>and</strong>ard as well. We have<br />
also studied the application <strong>of</strong> the filter-trap radiometer<br />
for ultraviolet <strong>and</strong> visible calibrations. 5<br />
2. Trap-Detector-Based Photometer–Colorimeter<br />
The silicon tunnel-trap detector we developed recently<br />
6 was extended by a temperature-controlled filter<br />
wheel with four selectable filter combinations, a removable<br />
luminance measuring tube, <strong>and</strong> an improved<br />
current-to-voltage converter. The details <strong>of</strong><br />
the trap-detector extension are discussed below.<br />
The goal was to develop a versatile tunnel-trapdetector-based<br />
photometer–colorimeter for which the<br />
channel spectral responsivities can be determined<br />
with low uncertainties.<br />
A. Silicon Tunnel-Trap Detector<br />
A significant advantage <strong>of</strong> a tunnel-trap detector is<br />
that no light is reflected back from the detector to the<br />
input optics �such as filters <strong>and</strong> aperture�. Consequently,<br />
the filter combinations <strong>and</strong> the trap detector<br />
can be calibrated either separately or as a combined<br />
package. The nonabsorbed light �i.e., light transmitted<br />
through the trap� can be easily measured to<br />
apply the physical model <strong>of</strong> internal quantum efficiency<br />
for responsivity determination. 7 The other<br />
advantage <strong>of</strong> a trap detector is that the uniformity <strong>of</strong><br />
spatial responsivity can be high if the internal quantum<br />
efficiency <strong>of</strong> the photodiodes is uniform over the<br />
active area. These features can make well-designed
Fig. 1. Beam propagation in the triangular tunnel-trap detector.<br />
The converging incident beam is focused to the aperture.<br />
<strong>and</strong> precisely fabricated trap detectors suitable for<br />
accurate measurement <strong>of</strong> beam power.<br />
The scheme <strong>of</strong> a recently designed tunnel-trap detector<br />
is shown in Fig. 1. Two 10 mm � 10 mm <strong>and</strong><br />
four 18 mm � 18 mm silicon photodiodes, equivalent<br />
to the Hamamatsu S1337 model, 8 were packed in a<br />
light-trapping arrangement. We used this photodiode<br />
type to utilize the physical model <strong>of</strong> internal<br />
quantum efficiency for spectral responsivity extrapolation<br />
<strong>and</strong> interpolation. 7 This photodiode model<br />
has a high �close to unity� <strong>and</strong> spatially uniform internal<br />
quantum efficiency. The beam propagates in<br />
the tunnel-trap detector from the first photodiode �behind<br />
the aperture� to the last �sixth� photodiode.<br />
Photodiodes 3 <strong>and</strong> 6 are not shown for better illustration.<br />
The output beam from the trap detector can<br />
be utilized for alignment or for detector transmittance<br />
measurements in spectral responsivity determination.<br />
A second light trap can be attached to the<br />
trap-detector output to absorb transmitted radiation<br />
<strong>and</strong> to minimize ambient stray light.<br />
The implementation <strong>of</strong> the scheme <strong>of</strong> Fig. 1 is<br />
shown in Fig. 2. The photodiodes are mounted in a<br />
triangular tunnel. Choosing different size <strong>of</strong> photodiodes<br />
allowed the aperture area <strong>and</strong> the field <strong>of</strong> view<br />
�FOV� to be maximized. Temperature control for<br />
the photodiodes was not needed because the temperature<br />
coefficient <strong>of</strong> responsivity <strong>of</strong> the photodiodes is<br />
close to zero in the visible range.<br />
This trap detector is suitable for both radiant<br />
power <strong>and</strong> irradiance measurements. In power<br />
mode measurements, the aperture is underfilled, <strong>and</strong><br />
in irradiance mode measurements the aperture is<br />
overfilled by the incident radiation. In power mode<br />
measurements, the incident beam must be focused to<br />
the front surface <strong>of</strong> the aperture. Radiance or luminance<br />
can be measured by attaching a radiance–<br />
luminance measuring tube �see below� to the front <strong>of</strong><br />
the trap detector.<br />
B. Trap Detector Extended with a Filter Wheel<br />
The inside arrangement <strong>of</strong> the extended trap detector<br />
is illustrated in Fig. 3. The incident beam �originat-<br />
Fig. 2. Construction <strong>of</strong> the triangular tunnel-trap detector. The<br />
aperture is drawn to be semitransparent in the figure.<br />
ing from a baffled point source� overfills the common<br />
aperture mounted on the front panel <strong>of</strong> the cover box.<br />
The aperture front surface <strong>and</strong> the front surface <strong>of</strong><br />
the cover box are in the same plane. This is the<br />
reference plane <strong>of</strong> the photometer–colorimeter for illuminance<br />
mode measurements. The replaceable<br />
filter combinations �packages� are mounted in a<br />
temperature-controlled filter wheel. The wheel can<br />
be heated slightly above room temperature with a<br />
thermoelectric cooler–heater. This regulated temperature<br />
will ensure stable spectral transmittances<br />
for the filters without condensation. The wheel has<br />
five well-defined positions with filter-mounting holes.<br />
The filter combinations are mounted in the first four<br />
holes. The last hole in the fifth position is empty for<br />
Fig. 3. Filter wheel between the aperture <strong>and</strong> the trap detector.<br />
The outside edge <strong>of</strong> the aperture can be seen where the incident<br />
beam from a baffled point source overfills the aperture.<br />
1 May 2004 � Vol. 43, No. 13 � APPLIED OPTICS 2623
Fig. 4. Picture <strong>of</strong> the photometer–colorimeter equipped with a<br />
radiance–luminance measuring tube.<br />
spectral responsivity determination <strong>of</strong> the trap detector<br />
itself.<br />
The filter wheel is located between the aperture<br />
<strong>and</strong> the front end <strong>of</strong> the tunnel-trap detector. A rotating<br />
knob is mounted on the shaft <strong>of</strong> the wheel <strong>and</strong><br />
located on the back <strong>of</strong> the cover box. The length <strong>of</strong><br />
the filter combinations is limited to 10 mm by the<br />
thickness <strong>of</strong> the filter wheel. The space for the<br />
wheel, between the aperture <strong>and</strong> the trap detector, is<br />
�12 mm. This separation did not decrease the FOV<br />
<strong>of</strong> the meter.<br />
C. Radiance–Luminance Measuring Tube<br />
While illuminance �or irradiance� can be measured<br />
with one aperture, luminance �or radiance� mode<br />
measurements need two apertures. An input tube<br />
with two baffles between the apertures can be attached<br />
to the front <strong>of</strong> the photometer–colorimeter for<br />
radiance <strong>and</strong> luminance mode measurements. The<br />
aperture in the front plate <strong>of</strong> the housing <strong>and</strong> the<br />
front aperture <strong>of</strong> the tube will determine the radiance<br />
�luminance� measurement angle. Figure 4 shows<br />
the picture <strong>of</strong> the photometer–colorimeter when it is<br />
equipped with the radiance–luminance measuring<br />
tube.<br />
2624 APPLIED OPTICS � Vol. 43, No. 13 � 1 May 2004<br />
The FOV scheme <strong>of</strong> the radiance–luminance measuring<br />
tube is shown in Fig. 5. The diameter <strong>of</strong> the<br />
trap-detector �illuminance measuring� aperture is d.<br />
The diameter <strong>of</strong> the front aperture is D.<br />
The radiant power � d entering the trap detector in<br />
radiance measurement mode is<br />
� d � L t� mA d, (4)<br />
where L t is the radiance <strong>of</strong> the target surface measured<br />
by the meter, � m is the viewing solid angle<br />
�measurement angle� <strong>of</strong> the meter, <strong>and</strong> A d is the �acceptance�<br />
area <strong>of</strong> the trap-detector aperture. Using<br />
the symbols <strong>of</strong> Fig. 5,<br />
A d � d 2 ��4, (5)<br />
� m � 2��1 � cos���2��. (6)<br />
When D � 11.29 mm, <strong>and</strong> the separation between the<br />
two apertures is s � 165 mm, the nominal �or effective�<br />
viewing angle can be calculated:<br />
� � 2 tan �1 �D�2s� � 3.919°. (7)<br />
From the above values <strong>and</strong> for d � 5 mm,<br />
Fig. 5. FOV design <strong>of</strong> radiance–luminance measurement.<br />
Ad � 0.1964 cm 2 ,<br />
�m � 0.003674 sr.<br />
When the trap detector �calibrated for power responsivity�<br />
measures radiant power, the radiance <strong>of</strong> the<br />
target surface can be calculated from Eq. �4�. Determination<br />
<strong>of</strong> � m from the nominal viewing angle � is<br />
an accurate approximation when A d is small. If we<br />
integrate the radiant power reaching the detector<br />
�from a uniform source <strong>of</strong> L t � constant radiance� for<br />
an ideal � angle �d � 0� <strong>and</strong> the real case �d � 0�,<br />
using the same detector aperture �A d�, the integrated<br />
difference �ideal radiance minus real radiance� will<br />
be �0.012% for d � 5 mm <strong>and</strong> �0.006% for d � 3.5<br />
mm. These systematic radiance �luminance� measurement<br />
errors are very small. For a detector aperture<br />
<strong>of</strong> d � 5 mm, the integrated difference can be<br />
utilized as a correction factor for the measured radiance<br />
�luminance�. A detailed analysis with the<br />
achievable uncertainties <strong>of</strong> radiance measuring tubes
Fig. 6. Baffle �B1, B2� arrangement inside the radiance–luminance tube <strong>and</strong> FOV <strong>and</strong> out-<strong>of</strong>-FOV rays <strong>of</strong> an extended source measurement.<br />
with different input geometries will be discussed in a<br />
following paper.<br />
The unvignetted FOV <strong>of</strong> the radiance �luminance�<br />
measuring tube is<br />
D � d<br />
�1<br />
� � 2 tan .<br />
2s<br />
For the above geometry �with d � 5mm�, � is 2.18°.<br />
The full radiance-measurement angle is<br />
D � d<br />
�1<br />
� � 2 tan .<br />
2s<br />
For the above tube design, ��5.65°, which is smaller<br />
than the 8° FOV <strong>of</strong> the trap detector �discussed below�.<br />
With this design, the unvignetted target spot<br />
diameter �the plateau <strong>of</strong> the output signal� will be<br />
40% <strong>of</strong> the full spot diameter seen by the radiance–<br />
luminance meter.<br />
The design <strong>of</strong> the baffle arrangement inside the<br />
tube is shown separately in Fig. 6 to illustrate the<br />
separation <strong>of</strong> rays from an extended source. Baffles<br />
B1 <strong>and</strong> B2 minimize the effect <strong>of</strong> stray light <strong>and</strong> reject<br />
radiation from light sources outside the FOV. For<br />
simplicity, three rays are shown outside the two FOV<br />
rays �producing �� to illustrate this situation for a<br />
large extended source.<br />
For the above tube design, B1 had a diameter <strong>of</strong> 8.0<br />
mm, <strong>and</strong> it was located at a distance not too far from<br />
the detector aperture to avoid any decrease �by clipping�<br />
in the FOV. This baffle was fabricated with<br />
the same procedure as the other two FOV-limiting<br />
apertures. They were all made <strong>of</strong> copper, coated<br />
with black nickel. The aperture thickness is 0.15<br />
mm. The position <strong>of</strong> B2 is not critical. It has a<br />
larger diameter <strong>and</strong> stops radiation entering the<br />
front aperture at large incidence angles.<br />
As an alternative to the geometrical radiance �or<br />
radiance responsivity� determination described<br />
above, the radiance responsivity <strong>of</strong> the photometer–<br />
colorimeter can be determined from radiance measurement<br />
<strong>of</strong> a calibrated sphere source. The radiant<br />
intensity <strong>of</strong> the sphere source can be determined<br />
against an irradiance meter st<strong>and</strong>ard �such as another<br />
trap detector� when the trap detector <strong>and</strong><br />
source separation is large enough to take the source<br />
as a point source. The source radiance measured by<br />
the photometer–colorimeter will be equal to the ratio<br />
<strong>of</strong> the radiant intensity <strong>and</strong> the output area <strong>of</strong> the<br />
source. 9 The radiance responsivity will be the ratio<br />
<strong>of</strong> the output signal <strong>of</strong> the photometer–colorimeter<br />
<strong>and</strong> the source radiance.<br />
The above tube design can be utilized in measurements<br />
for which the target spot �determined by the<br />
full radiance measurement angle� <strong>of</strong> the photometer–<br />
colorimeter can be positioned within the radiating<br />
surface <strong>of</strong> the source to be measured. A calibration<br />
source should be spatially uniform �such as a sphere<br />
exit port� to yield low measurement uncertainties.<br />
3. Spatial Characteristics<br />
Three spatial characteristics were measured to verify<br />
the design expectations in the three measurement<br />
modes. The uniformity <strong>of</strong> spatial responsivity was<br />
measured in flux �power� mode with the trap detector<br />
underfilled by an incident beam scanned over the<br />
aperture. The angular responsivity was measured<br />
in illuminance mode with the aperture <strong>of</strong> the trap<br />
detector overfilled by the incident radiation. The<br />
FOV was measured in radiance mode to determine<br />
the measurement angle <strong>and</strong> the out-<strong>of</strong>-target blocking<br />
<strong>of</strong> the photometer–colorimeter for luminance<br />
measurements.<br />
A. Spatial Uniformity <strong>of</strong> Responsivity<br />
To minimize uncertainty in flux measurement mode,<br />
a good spatial uniformity <strong>of</strong> responsivity is needed<br />
from the trap detector. The spatial uniformity was<br />
tested by scanning the incident beam over the active<br />
area <strong>of</strong> the tunnel-trap detector. The f�9 output<br />
beam �6.4° full angle� <strong>of</strong> a monochromator was focused<br />
on the plane <strong>of</strong> the removed aperture. The<br />
diameter <strong>of</strong> the beam spot was 1.1 mm. The beam<br />
was not clipped by any <strong>of</strong> the six photodiodes inside<br />
the trap detector. The scan was made with 0.5-mm�<br />
step increments. The wavelength <strong>of</strong> the beam was<br />
500 nm. The 0.05% nonuniformity contours are<br />
shown in Fig. 7. The real acceptance area is at least<br />
0.55 mm �but not more than 1.05 mm� larger than the<br />
measured uniform area �shown in the plot�. Accordingly,<br />
the maximum diameter <strong>of</strong> the trap detector<br />
aperture is 5 mm.<br />
1 May 2004 � Vol. 43, No. 13 � APPLIED OPTICS 2625
Fig. 7. Nonuniformity <strong>of</strong> spatial responsivity <strong>of</strong> the tunnel trap<br />
detector. The 0.05% contours are shown at a wavelength <strong>of</strong> 500<br />
nm. The detector was moved by 0.5-mm�step increments, <strong>and</strong><br />
the beam spot diameter was 1.1 mm.<br />
B. Angular Responsivity<br />
The normalized angular responsivities <strong>of</strong> the tunneltrap<br />
detector, when equipped with a 3.5-mm diameter<br />
aperture, were measured in two perpendicular<br />
planes. The results are shown in Fig. 8. 6 During<br />
the horizontal scan, the trap detector was rotated in<br />
the horizontal plane around its aperture center. It<br />
measured the radiation from a luminous intensity<br />
lamp �considered a point source� at a separation <strong>of</strong><br />
3 m. Thereafter, the radiometer was rotated 90°<br />
around its optical axis <strong>and</strong> the vertical scan was done<br />
in the same way as the horizontal one. The graph<br />
shows that the deviation <strong>of</strong> the realized angular responsivities<br />
from the expected cosine function is less<br />
than 0.02% within a 5° FOV <strong>and</strong> �0.05% at 8° FOV.<br />
Accordingly, the allowed maximum convergence �full�<br />
Fig. 8. Normalized angular responsivities <strong>of</strong> the tunnel-trap detector<br />
when equipped with a 3.5-mm diameter aperture. The<br />
expected �cosine� responsivity is shown as well.<br />
2626 APPLIED OPTICS � Vol. 43, No. 13 � 1 May 2004<br />
Fig. 9. Point-spread response <strong>of</strong> the radiance measuring trap<br />
detector on both linear <strong>and</strong> logarithmic scales.<br />
angle <strong>of</strong> an incident beam is 8°. In Subsection 2.C,<br />
the largest beam convergence angle is ��5.65°.<br />
The measurement results discussed above verified<br />
the optical <strong>and</strong> mechanical design expectations for<br />
the tunnel trap detector.<br />
C. Radiance–Luminance Measurement FOV<br />
The point-spread function <strong>of</strong> the trap detector with<br />
the radiance–luminance tube was measured with a<br />
small inc<strong>and</strong>escent lamp <strong>of</strong> �5-mm diameter at a<br />
distance <strong>of</strong> 1 m. The lamp was mounted in an optical<br />
axis <strong>and</strong> the photometer–colorimeter was moved<br />
in a plane perpendicular to that optical axis. The<br />
filter combinations were moved away from the input<br />
<strong>of</strong> the trap detector, <strong>and</strong> the open channel was measured.<br />
The measurement results are shown in Fig.<br />
9 on both linear <strong>and</strong> logarithmic scales. As a result<br />
<strong>of</strong> the optimized input geometry <strong>of</strong> the radiance–<br />
luminance tube, an out-<strong>of</strong>-field blocking <strong>of</strong> more than<br />
4 orders <strong>of</strong> magnitude was measured.<br />
4. Tristimulus Filters<br />
The four channels <strong>of</strong> the photometer–colorimeter are<br />
spectrally matched to the x� 1���, x� 2���, y����, <strong>and</strong> z����<br />
color-matching functions by individually realizing<br />
four filter combinations that are alternately used<br />
with the tunnel-trap detector. The responsivity <strong>of</strong> a<br />
channel is the trap-detector spectral responsivity<br />
multiplied by the spectral transmittance <strong>of</strong> the selected<br />
filter combination.<br />
A. Design <strong>of</strong> the Filter Combinations<br />
Different spectral transmittances were needed from<br />
the filter combinations to modify the spectral responsivity<br />
<strong>of</strong> the trap detector according to the CIE colormatching<br />
functions. Our goal was to achieve the<br />
smallest possible CIE f 1� values �discussed in Subsection<br />
4.C� for the realized tristimulus channels. The<br />
achievable f 1� value is limited by several factors, such<br />
as the availability <strong>of</strong> certain filter types, the thickness<br />
limit <strong>of</strong> the filter combination �package�, the thick-
ness uncertainty <strong>of</strong> the individual layers during fabrication,<br />
temperature differences between design <strong>and</strong><br />
applications, <strong>and</strong> the uncertainty <strong>of</strong> the spectral<br />
transmittance determinations.<br />
All possible color filters that seemed to be promising<br />
for the realization <strong>of</strong> the four filter combinations<br />
were purchased. Unfortunately, the number <strong>of</strong> commercially<br />
available filter types is decreasing. The<br />
fabrication <strong>of</strong> many filter types has been discontinued<br />
because <strong>of</strong> the decreasing dem<strong>and</strong> in the market. A<br />
database was generated from the spectral transmittance<br />
measurements <strong>of</strong> the collected filters. The<br />
most suitable filter types �models� were chosen for the<br />
tristimulus filter combinations. Filters were purchased<br />
only from Schott <strong>and</strong> Hoya. 8<br />
The thicker �longer� the filter combination, the<br />
lower the transmittance. The maximum thickness<br />
<strong>of</strong> a filter combination was limited to 10 mm because<br />
<strong>of</strong> the space available between the aperture <strong>and</strong> the<br />
front end <strong>of</strong> the trap detector. The peak transmittance<br />
maximization <strong>of</strong> the individual filter combinations<br />
was a secondary concern because <strong>of</strong> the wide<br />
signal �dynamic� range <strong>of</strong> the trap detector. The<br />
peak transmittance <strong>of</strong> each filter combination was<br />
limited to a minimum <strong>of</strong> 1.5%.<br />
In each filter combination, after optimization for<br />
the spectral transmittance, five to eight filter disks<br />
�layers� were cemented together. The ends <strong>of</strong> all<br />
combinations were evenly aligned to the front surface<br />
<strong>of</strong> the filter wheel �facing the aperture�. All filterdisk<br />
diameters were 9.5 mm. This diameter, with<br />
the 10 mm maximum thickness <strong>of</strong> a combination, was<br />
a good compromise to avoid limiting the original FOV<br />
�acceptance angle� <strong>of</strong> the trap detector.<br />
The optimum thickness <strong>of</strong> all filters within a filter<br />
combination was calculated with an interactive program.<br />
A similar optimization method, to obtain the<br />
best spectral fit, has already been published. 10 After<br />
the initial filter type <strong>and</strong> thickness selections, the<br />
program finds a local minimum <strong>of</strong> the f 1� value by<br />
individually changing the thickness <strong>of</strong> the other filter<br />
layers inside <strong>of</strong> the same package. The f 1� optimization<br />
is an iterative method where the filters are<br />
remeasured several times for spectral transmittance<br />
after they are polished to the desired thickness calculated<br />
by the computer program. As the uncertainty<br />
<strong>of</strong> our filter thickness realization was 3 �m, the<br />
fabrication <strong>of</strong> the filter combination �the first filter<br />
realization� started with the thinnest filter. Several<br />
pieces <strong>of</strong> the thinnest filters were made �polished�<br />
<strong>and</strong> then the thickness <strong>of</strong> each piece was measured.<br />
The filter that gave the best results was selected for<br />
the combination, <strong>and</strong> the thickness <strong>of</strong> the other layers<br />
�in the same combination� was recalculated. The<br />
less critical filter <strong>of</strong> the combination was calculated<br />
last. The program continuously displayed the peak<br />
transmittance <strong>and</strong> the total thickness <strong>of</strong> the filter<br />
combination being optimized. The uncertainty <strong>of</strong><br />
the spectral transmittance measurements was 0.2%.<br />
The spectral responsivity <strong>of</strong> the filter–detector<br />
combination was calculated with the following equation:<br />
S n��� � �1 � ��exp�log 10S d��� � � i<br />
where<br />
t i<br />
log 10<br />
m<br />
�i ���<br />
1 � �<br />
m<br />
ti � is wavelength,<br />
� is the surface reflection,<br />
Sd��� is the spectral responsivity <strong>of</strong> the detector,<br />
i is the filter index,<br />
ti is the thickness <strong>of</strong> the ith filter in the package,<br />
m<br />
�i ��� is the measured spectral transmittance <strong>of</strong><br />
the ith filter,<br />
m<br />
ti is the measured thickness <strong>of</strong> the ith filter,<br />
m superscript shows that the value was measured.<br />
The surface �Fresnel� reflection depends on the refractive<br />
index <strong>of</strong> the filter material. The refractive<br />
indices <strong>of</strong> the filters are similar to one another with a<br />
significant wavelength dependence in the visible<br />
range. The internal transmittance <strong>of</strong> the filter layers<br />
dominates the spectral transmittance <strong>of</strong> the realized<br />
filter combination. For all separate filters <strong>and</strong><br />
cemented filter combinations, a ��0.08 was used in<br />
the calculations. Ultraviolet <strong>and</strong> infrared blocking<br />
filters were used to attenuate the incident radiation<br />
for wavelengths shorter than 360 nm <strong>and</strong> longer than<br />
830 nm. The blocking was necessary for all filter<br />
combinations because <strong>of</strong> the broad sensitivity range<br />
<strong>of</strong> the silicon trap detector.<br />
To yield optical-quality filter combinations, both<br />
sides <strong>of</strong> the individually made filters were polished.<br />
The individual filters were glued together with optical<br />
cement that has constant spectral transmittance<br />
in the visible range �Lens Bond Optical Cement, Type<br />
F65, Modified RD3-74 from Summers Laboratories,<br />
Inc.�. The refractive index <strong>of</strong> the optical cement is<br />
very similar to that <strong>of</strong> the glass filters <strong>and</strong> should<br />
almost eliminate internal reflections.<br />
B. Responsivity <strong>of</strong> the Realized Filter Combinations<br />
The spectral power responsivities <strong>of</strong> the colorimeter<br />
channels were determined to characterize the filter<br />
combinations for f 1� values. The spectral irradiance<br />
responsivity calibrations <strong>of</strong> the channels will be performed<br />
later on the combined filter–detector channels.<br />
The four channels with a common aperture at<br />
the front will be calibrated against an irradiance<br />
mode reference trap detector when both measure the<br />
same irradiance from a monochromatic �point�<br />
source. Irradiance measuring reference trap detectors<br />
are available with 0.1% responsivity uncertainty.<br />
The calibrations will be made at the <strong>National</strong> <strong>Institute</strong><br />
<strong>of</strong> <strong>St<strong>and</strong>ards</strong> <strong>and</strong> Technology �<strong>NIST</strong>� Spectral<br />
Irradiance <strong>and</strong> Radiance Responsivity Calibrations<br />
with Uniform Sources �SIRCUS� facility with an irradiance<br />
responsivity uncertainty <strong>of</strong> close to 0.1%.<br />
� ,<br />
(8)<br />
1 May 2004 � Vol. 43, No. 13 � APPLIED OPTICS 2627
Fig. 10. Absolute responsivities <strong>of</strong> the realized tristimulus channels.<br />
Spectral responsivity on �a� a linear scale <strong>and</strong> �b� a logarithmic<br />
scale.<br />
The photometer–colorimeter calibrations will be described<br />
in a future publication.<br />
The absolute spectral responsivities <strong>of</strong> the realized<br />
channels are shown in Fig. 10�a� on a linear scale <strong>and</strong><br />
Fig. 10�b� on a logarithmic scale. The logarithmic<br />
graph shows the sharp cut<strong>of</strong>f <strong>of</strong> the filters at the sides<br />
<strong>of</strong> the responsivity curves. These spectral responsivities<br />
were determined from piecewise measurements.<br />
The filter transmittances were measured<br />
separately in the 360–830 nm wavelength range<br />
with 5-nm increments. The measurements were<br />
made with a prism-grating spectrometer. The spectral<br />
responsivity <strong>of</strong> the trap detector was derived<br />
from another trap detector calibrated against the primary<br />
st<strong>and</strong>ard cryogenic radiometer. 7 The CIE-<br />
2628 APPLIED OPTICS � Vol. 43, No. 13 � 1 May 2004<br />
Fig. 11. CIE x����, y����, <strong>and</strong> z���� color-matching functions �solid<br />
curves� <strong>and</strong> the realized <strong>and</strong> then normalized channel responsivities<br />
�dashed curves�.<br />
defined color-matching functions <strong>and</strong> the realized<br />
<strong>and</strong> then normalized channel responsivities are<br />
shown in Fig. 11.<br />
C. Spectral Mismatch <strong>of</strong> the Channels<br />
The spectral mismatch <strong>of</strong> the realized channel responsivities<br />
relative to the CIE st<strong>and</strong>ard functions<br />
can be calculated from the above determined channel<br />
responsivities. The spectral responsivity mismatch<br />
<strong>of</strong> a realized channel relative to the CIE<br />
defined function can be described by the CIEdefined<br />
spectral mismatch index 2 f 1�. According to<br />
the definition, f 1� can be used to define the degree <strong>of</strong><br />
spectral mismatch <strong>of</strong> photometers when the goal is<br />
to equalize the realized spectral responsivity curve<br />
to the V��� function.<br />
According to the definition,<br />
f1� � � �<br />
o �s*���rel � V����d�<br />
� � 100%, (9)<br />
�o V���d�<br />
s*���rel � � �<br />
o S���AV���d�<br />
�<br />
�o S���As���reld� s���rel, (10)<br />
where s*��� rel is called the normalized relative spectral<br />
responsivity, S��� A is the spectral distribution <strong>of</strong><br />
the St<strong>and</strong>ard Illuminant A 11 �used in the measurement�,<br />
V��� is the spectral luminous efficiency <strong>of</strong> photopic<br />
vision, <strong>and</strong> s��� rel is the relative spectral<br />
responsivity <strong>of</strong> the realized channel. Here we extended<br />
the CIE f 1� definition from the original photometric<br />
channel to all four tristimulus channels by<br />
substituting the x� 1���, x� 2���, y����, <strong>and</strong> z���� colormatching<br />
functions for the V��� function.<br />
A mismatch <strong>of</strong> f 1��1.39% has been reported 12 for<br />
a V��� function realization fabricated with a similar<br />
�s<strong>and</strong>wich layer� method. This f 1� can be misleading,<br />
because the wavelength increments were 10 nm
Fig. 12. f 1� value dependence <strong>of</strong> the four channels as functions <strong>of</strong> the thickness change <strong>of</strong> the filter layers.<br />
in a shorter wavelength range <strong>of</strong> 400–750 nm. In<br />
the present work the design-related transmittance<br />
measurements <strong>and</strong> the f 1� optimizations were made<br />
between 360 <strong>and</strong> 830 nm with 5-nm increments.<br />
These measurements followed the CIE definitions for<br />
the color-matching functions. However, our final filter<br />
combination measurements were made between<br />
380 <strong>and</strong> 780 nm with 5-nm increments.<br />
D. Analysis <strong>of</strong> the f 1� Values for Fabrication<br />
It was an important design criterion to underst<strong>and</strong><br />
how the f 1� values <strong>of</strong> the realized channels depend<br />
on the thickness changes <strong>of</strong> the individual filter<br />
layers inside <strong>of</strong> a filter combination. Figure 12<br />
shows the changes <strong>of</strong> the f 1� values for partial thickness<br />
changes <strong>of</strong> the layers for all <strong>of</strong> the realized<br />
channels. The graphs show that the fabrication <strong>of</strong><br />
the thinnest filters is the most critical �see Table 1�.<br />
This was the reason that we started the layer fab-<br />
rications within a filter combination with the thinnest<br />
filters.<br />
The filter models <strong>of</strong> the four realized filter combinations<br />
with the designed �calculated� <strong>and</strong> realized<br />
thickness <strong>of</strong> the layers <strong>and</strong> combinations are summarized<br />
in Table 1. Table 1 shows that the fabricated<br />
thickness <strong>of</strong> the filter layers can be equal to or very<br />
different from the calculated �designed� values. The<br />
allowed thickness deviation was dependent on filter<br />
type <strong>and</strong> filter combination. We controlled the layer<br />
polishing tolerances according to the results <strong>of</strong> Fig.<br />
12. The calculated �designed� <strong>and</strong> realized f 1� <strong>and</strong><br />
peak transmittance �� max� values are also shown in<br />
the table. The f 1� values were calculated from the<br />
spectral responsivities <strong>of</strong> the channels after the realization<br />
<strong>of</strong> the filter combinations. The channel responsivities<br />
were determined from separate<br />
transmittance �for the filter combinations� <strong>and</strong> responsivity<br />
�for the trap-detector� measurements.<br />
1 May 2004 � Vol. 43, No. 13 � APPLIED OPTICS 2629
X 1<br />
Table 1. Filter Types with Designed �Calculated� <strong>and</strong> Realized<br />
Thickness <strong>of</strong> Layers, Spectral Mismatch Values, <strong>and</strong> Maximum<br />
Transmittances for the Four Filter Combinations<br />
Filter<br />
Thickness ��m�<br />
Thickness ��m�<br />
Calculated Realized Filter Calculated Realized<br />
BG 40 a<br />
3100 3093 BG 1 a<br />
3120 3149<br />
OG 570 a<br />
54 60 BG 39 a<br />
2028 2031<br />
RG 610 a<br />
42 42 FG 15 a<br />
4236 4250<br />
UG 3 a<br />
1215 1143 GG 435 a<br />
170 169<br />
LA 120 b<br />
1556 1728 UG 3 a<br />
162 148<br />
Y52 b<br />
2850 2531 Total 9716 9747<br />
Total 8817 8597 f1� 3.83% 4.12%<br />
f1� 1.55% 1.63% �max 3.41% 3.36%<br />
�max 8.15% 8.93%<br />
Y Z<br />
BG 7A a<br />
288 297 BG 4 a<br />
376 375<br />
BG 40 a<br />
2623 2585 BG 7A a<br />
644 433<br />
FG 3 a<br />
63 63 BG 24 a<br />
1945 1857<br />
FG 13 a<br />
1506 1563 BG 39 a<br />
2028 2028<br />
OG 515 a<br />
43 44 FG 13 a<br />
676 654<br />
Y52 b<br />
120 115 GG 435 a<br />
153 156<br />
Total 4643 4667 LA 120 b<br />
2820 2969<br />
f1� 1.47% 1.58% LB 200 b<br />
1226 1265<br />
�max 38.04% 36.43% Total 9868 9737<br />
f1� 3.31% 3.57%<br />
�max 1.65% 1.79%<br />
a Schott filter.<br />
b Hoya filter.<br />
E. Spectral Transmittance Differences<br />
As a result <strong>of</strong> our rigorous filter fabrication procedure,<br />
the relative transmittance curves <strong>of</strong> the filter<br />
combinations are very similar to the designed transmittance<br />
curves. However, the differences between<br />
the realized �<strong>and</strong> designed� curves <strong>and</strong> the CIE functions<br />
are significantly larger. The performed transmittance<br />
differences are illustrated in Fig. 13 for the<br />
Fig. 13. Transmittance differences �left Y axis� <strong>of</strong> the realized<br />
photometric channel relative to the CIE <strong>and</strong> designed �normalized�<br />
spectral transmittances. The CIE function is shown to illustrate<br />
where the significant differences are.<br />
2630 APPLIED OPTICS � Vol. 43, No. 13 � 1 May 2004<br />
X 2<br />
photometric channel. The calculated transmittance<br />
was normalized to the measured values. The CIE<br />
function is shown to illustrate where the significant<br />
differences are. A highest transmittance difference<br />
�between the realized function <strong>and</strong> the CIE function�<br />
<strong>of</strong> 0.07 was obtained at 535 nm. The spectral transmittance<br />
differences relative to the CIE functions<br />
were dominated by the availability <strong>of</strong> filter components.<br />
Table 1 shows that the maximum �peak�<br />
transmittance, � max, values after the realizations<br />
were r<strong>and</strong>omly different for the four filter combinations.<br />
This variation was caused by the fabrication<br />
thickness tolerance that we allowed for the thick filter<br />
layers.<br />
The Table also shows that the f 1� values <strong>of</strong> the<br />
fabricated filter combinations are all somewhat<br />
higher than the designed values. The increase was<br />
obtained for a few reasons. The largest change was<br />
caused by the temperature difference between the<br />
design <strong>and</strong> final transmittance measurements. The<br />
f 1� values depend on the temperature because the<br />
cut-on edges <strong>of</strong> the filters, used on the shortwavelength<br />
sides <strong>of</strong> the transmittance curves, are<br />
temperature dependent. During the design measurements<br />
the temperature <strong>of</strong> the filters was not controlled.<br />
The lack <strong>of</strong> temperature-controlled filter<br />
holders made the design measurements simpler <strong>and</strong><br />
faster. The transmittance <strong>of</strong> the realized filter combinations<br />
was measured at 26 °C in the temperaturecontrolled<br />
filter wheel. Here temperature<br />
stabilization was necessary to achieve high stability.<br />
The temperature <strong>of</strong> the filter wheel was controlled to<br />
�3 °C above room temperature to avoid condensation.<br />
The increase in the f 1� values can be less if the<br />
filters are measured <strong>and</strong> used at the same temperature<br />
�for both design <strong>and</strong> applications�.<br />
Also, significant f 1� changes were obtained because<br />
<strong>of</strong> the limited sensitivity <strong>of</strong> the transmittancemeasuring<br />
spectrophotometer. Sometimes filter<br />
transmittances had to be calculated from transmittances<br />
measured with different filter thicknesses <strong>and</strong><br />
limited signal resolution. The thin filters needed<br />
special attention. The transmittance <strong>of</strong> a thin filter<br />
has to be measured, because it cannot be calculated<br />
from the transmittance measurement <strong>of</strong> the same<br />
thick filter. Also, when thin filters <strong>of</strong> large diameter<br />
are to be made, they should be cemented to a transparent<br />
glass substrate before polishing. The thick<br />
substrate �with spectrally constant transmittance�<br />
helps avoid cracks <strong>and</strong> can make polishing <strong>and</strong> thickness<br />
measurements easier. The final transmittance<br />
<strong>of</strong> a filter combination will be a product <strong>of</strong> the spectral<br />
transmittances <strong>of</strong> the five to eight individual layers,<br />
the glass substrate, <strong>and</strong> the optical cement between<br />
the layers.<br />
Without careful filter combination design <strong>and</strong> fabrication,<br />
the f 1� can be several percent or higher.<br />
With the careful design <strong>and</strong> fabrication procedure<br />
described above, the f 1� <strong>of</strong> the y���� <strong>and</strong> x� 1��� channels<br />
was less than 2% for the 380–780 nm wavelength<br />
range with 5-nm increments. The implementation<br />
<strong>of</strong> the blue channels is more difficult because <strong>of</strong> the
smaller number <strong>of</strong> suitable filters available for this<br />
range. Eight filters were needed for the z���� channel<br />
to achieve an f 1��3.57%. An f 1� <strong>of</strong> �4% seems to be<br />
the best realization for the x� 2��� channel.<br />
5. Photocurrent Measurement Uncertainty<br />
The design <strong>of</strong> the photocurrent-to-voltage converter for<br />
the silicon tunnel-trap detector has already been published.<br />
6 The improvement introduced in the present<br />
design resulted in an uncertainty reduction in the<br />
current-to-voltage conversion for all signal gains. We<br />
used feedback resistors with 0.01% uncertainties <strong>of</strong><br />
their decadic nominal values <strong>and</strong> temperature coefficients<br />
<strong>of</strong> 10 parts in 10 6 �°C. Accordingly, calibrations<br />
for the individual signal gains were not necessary anymore.<br />
The dynamic signal range <strong>of</strong> the photometer–<br />
colorimeter is 11 decades in dc measurement mode<br />
with a noise-equivalent photocurrent <strong>of</strong> 32 fA at a<br />
b<strong>and</strong>width <strong>of</strong> 0.3 Hz.<br />
6. Conclusion<br />
A new photometer <strong>and</strong> tristimulus colorimeter has<br />
been developed to implement the first detector-based<br />
tristimulus color scale we published recently. 1 The<br />
design considerations <strong>of</strong> a silicon tunnel-trap detector<br />
that was extended by a temperature-controlled filter<br />
wheel, an aperture, a removable luminance measuring<br />
tube, <strong>and</strong> an improved current-to-voltage converter<br />
have been described. Four filter<br />
combinations were made to implement the CIE colormatching<br />
functions with f 1� values whose small size<br />
constitutes a benchmark for subsequent work. The<br />
main goal was to realize a colorimeter in which the<br />
channel spectral responsivities could be determined<br />
with uncertainties <strong>of</strong> 0.1%.<br />
The characterization results on the uniformity <strong>of</strong><br />
spatial responsivity, angular responsivity, FOV, <strong>and</strong><br />
out-<strong>of</strong>-field blocking verified the optical <strong>and</strong> mechanical<br />
design expectations. Photocurrents from the<br />
trap detector could be measured with an uncertainty<br />
<strong>of</strong> 0.01% in a dynamic range <strong>of</strong> 11 decades. The<br />
spectral transmittance <strong>of</strong> the realized filter combinations<br />
<strong>and</strong> the spectral responsivity <strong>of</strong> the trap detector<br />
were measured to determine the f 1� values <strong>of</strong> the<br />
realized channels. An analysis showed the f 1� dependence<br />
on the thickness change <strong>of</strong> the filter layers<br />
inside <strong>of</strong> a filter combination. As a result <strong>of</strong> the<br />
rigorous filter realization procedure, the f 1� values <strong>of</strong><br />
the realized channels were dominated by the limited<br />
number <strong>and</strong> availability <strong>of</strong> suitable filter components.<br />
Very small f 1� values were realized to allow<br />
us to use the same set <strong>of</strong> calibration factors for the<br />
colorimeter channels <strong>and</strong> to obtain small color measuring<br />
uncertainties even when the spectral distribution<br />
<strong>of</strong> the measured source is different �e.g., when it<br />
changes� from the distribution used to determine the<br />
calibration factors. The colorimeter can measure<br />
sources with all kinds <strong>of</strong> spectral distribution. A<br />
new set <strong>of</strong> calibration factors will be needed only for<br />
very different source distributions, such as discharge<br />
lamps or displays �cathode ray tube or liquid crystal�.<br />
The described design <strong>and</strong> realization consider-<br />
ations, the results <strong>of</strong> measurements <strong>and</strong> characterizations,<br />
<strong>and</strong> the planned <strong>and</strong> available calibration<br />
methods, devices, <strong>and</strong> setup promise a real possibility<br />
for determining the spectral irradiance <strong>and</strong> radiance<br />
responsivities <strong>of</strong> the colorimeter channels with the<br />
expected 0.1% uncertainty. After calibration, the<br />
reference photometer–colorimeter will be used to<br />
propagate <strong>NIST</strong> realized detector-based scales to<br />
field-level applications. We hope to discuss the spectral<br />
irradiance responsivity calibration <strong>of</strong> the channels<br />
<strong>and</strong> the determination <strong>of</strong> the calibration factors<br />
for different source distributions in a future paper.<br />
The authors thank Don Lynch <strong>of</strong> Reyer Corporation<br />
for the mechanical fabrication <strong>and</strong> filter wheel<br />
design, Thomas Larason for the detector spatial response<br />
uniformity test, Steve Brown for the pointspread<br />
response test, Edward Early for measuring<br />
the spectral transmittance <strong>of</strong> the filter packages, <strong>and</strong><br />
David Wilmering <strong>and</strong> John Fuller for fabricating the<br />
filter packages.<br />
References <strong>and</strong> <strong>Note</strong>s<br />
1. G. Eppeldauer, “Spectral response based calibration method <strong>of</strong><br />
tristimulus colorimeters,” J. Res. Natl. Inst. St<strong>and</strong>. Technol.<br />
103, 615 �1998�.<br />
2. Publication CIE No. 69 �Central Bureau <strong>of</strong> the CIE, Vienna,<br />
1987�.<br />
3. All uncertainties discussed in this paper are relative exp<strong>and</strong>ed<br />
uncertainties with a coverage factor <strong>of</strong> two.<br />
4. G. P. Eppeldauer, S. W. Brown, C. C. Miller, <strong>and</strong> K.R. Lykke,<br />
“Improved accuracy photometric <strong>and</strong> tristimulus-color scales<br />
based on spectral irradiance responsivity,” in Proceedings <strong>of</strong><br />
the Twenty-Fifth Session <strong>of</strong> the CIE �Central Bureau <strong>of</strong> the<br />
CIE, Vienna, 2003�, Vol. 1, pp. D2-30–D2-33.<br />
5. D. W. Allen, G. P. Eppeldauer, S. W. Brown, E. A. Early, B. C.<br />
Johnson, <strong>and</strong> K. R. Lykke, “Calibration <strong>and</strong> characterization <strong>of</strong><br />
trap detector filter radiometers,” in Earth Observing Systems<br />
VIII, W. L. Barnes, ed., Proc. SPIE 5151, 471–479 �2003�.<br />
6. G. P. Eppeldauer <strong>and</strong> D. C. Lynch, “Opto-mechanical <strong>and</strong> electronic<br />
design <strong>of</strong> a tunnel-trap Si-radiometer,” J. Res. Natl. Inst.<br />
St<strong>and</strong>. Technol. 105, 813–828 �2000�.<br />
7. T. R. Gentile, J. M. Houston, <strong>and</strong> C. L. Cromer, “Realization <strong>of</strong><br />
a scale <strong>of</strong> absolute spectral response using the <strong>NIST</strong> high accuracy<br />
cryogenic radiometer,” Appl. Opt. 35, 4392–4403 �1996�.<br />
8. The mention <strong>of</strong> certain commercial products in this paper is for<br />
information purposes only <strong>and</strong> does not constitute an endorsement<br />
<strong>of</strong> the product by the authors or their institutions.<br />
9. G. P. Eppeldauer, S. W. Brown, T. C. Larason, M. Racz, <strong>and</strong><br />
K. R. Lykke, “Realization <strong>of</strong> a spectral radiance responsivity<br />
scale with a laser-based source <strong>and</strong> Si radiance meters,” Metrologia<br />
37, 531–534 �2000�.<br />
10. G. Czibula, “Producing a detector with predetermined spectral<br />
responsivity,” in Proceedings <strong>of</strong> the International Measurement<br />
Confederation �IMEKO� 10th International Symposium <strong>of</strong> the<br />
<strong>Technical</strong> Committee on Photon Detectors �IMEKO Secretariat,<br />
Budapest, 1982�, Vol. 1, pp. 189–199.<br />
11. Publication CIE No. 15.2 �Central Bureau <strong>of</strong> the CIE, Vienna,<br />
1986�.<br />
12. J. P. Makai, G. Czibula, <strong>and</strong> J. Sch<strong>and</strong>a, “The importance <strong>of</strong><br />
the spectral responsivity correction in case <strong>of</strong> photoelectrical<br />
elements,” in Proceedings <strong>of</strong> the International Measurement<br />
Confederation �IMEKO� 11th International Symposium <strong>of</strong> the<br />
<strong>Technical</strong> Committee on Photon Detectors �IMEKO Secretariat,<br />
Budapest� �1984�, pp. 215–225.<br />
1 May 2004 � Vol. 43, No. 13 � APPLIED OPTICS 2631
NEW PHOTOMETER STANDARDS FOR LOW UNCERTAINTY<br />
ILLUMINANCE SCALE REALIZATION<br />
G. P. Eppeldauer, C. C. Miller, <strong>and</strong> Y. Ohno<br />
<strong>National</strong> <strong>Institute</strong> <strong>of</strong> <strong>St<strong>and</strong>ards</strong> <strong>and</strong> Technology, USA<br />
ABSTRACT<br />
Improved performance photometers have been developed at the <strong>National</strong> <strong>Institute</strong> <strong>of</strong> <strong>St<strong>and</strong>ards</strong><br />
<strong>and</strong> Technology (<strong>NIST</strong>) to utilize the low spectral responsivity uncertainty <strong>of</strong> spectral irradiance<br />
responsivity measurements performed on the facility <strong>of</strong> Spectral Irradiance <strong>and</strong> Radiance<br />
Responsivity Calibrations using Uniform Sources (SIRCUS). Based on the improved design <strong>of</strong><br />
the transfer st<strong>and</strong>ard photometers, a lower uncertainty detector-based photometric scale is being<br />
realized with an uncertainty goal <strong>of</strong> 0.1 % (k=2). The existing photometer st<strong>and</strong>ards that maintain<br />
the present <strong>NIST</strong> illuminance unit can be calibrated against the new transfer st<strong>and</strong>ards. In<br />
addition, new generation working st<strong>and</strong>ard photometers have been developed to utilize the<br />
extended group policy to better monitor <strong>and</strong> correct responsivity changes. The working st<strong>and</strong>ards<br />
propagate the new reference scales from the transfer st<strong>and</strong>ards with a minimal increase in<br />
measurement uncertainty. Design issues <strong>of</strong> the new photometers <strong>and</strong> the improved scale<br />
realization <strong>and</strong> transfer are discussed.<br />
Keywords: detector-based calibration, illuminance, photometry, spectral responsivity, st<strong>and</strong>ard<br />
1. INTRODUCTION<br />
The present <strong>NIST</strong> illuminance unit is maintained on a group <strong>of</strong> eight photometer st<strong>and</strong>ards with a<br />
relative exp<strong>and</strong>ed uncertainty (k=2) <strong>of</strong> 0.39 % [1]. Several components in the uncertainty budget<br />
are related to the determination <strong>of</strong> the photometer relative spectral responsivities using the<br />
traditional lamp/monochromator system <strong>of</strong> the <strong>NIST</strong> Spectral Comparator Facility (SCF). The<br />
dominant uncertainties originate from the converging beam geometry, the small spot size on the<br />
photometers, wavelength errors, aperture area measurement error, <strong>and</strong> the spatial non-uniformity<br />
<strong>of</strong> the detector <strong>and</strong> filter combination. A significant long-term uncertainty component originates<br />
from stain settlement (build-up <strong>of</strong> a layer) on the front surface <strong>of</strong> a filter package that decreases<br />
the responsivity <strong>of</strong> the photometer. The st<strong>and</strong>ard photometers, built in 1990, cannot be calibrated<br />
on the SIRCUS facility because the coherence in the laser-based sphere sources results in 10 %<br />
level interference fringes in the output signals. Instead, new generation transfer st<strong>and</strong>ard<br />
photometers with optimized optical, photometric, <strong>and</strong> electronic characteristics have been<br />
developed. The improved scale is realized on the new transfer st<strong>and</strong>ard photometers. The old<br />
photometer st<strong>and</strong>ards, together with the new generation working st<strong>and</strong>ard photometers, can be<br />
calibrated against the new transfer st<strong>and</strong>ard photometers by measuring the illuminance from a<br />
2856 K color temperature st<strong>and</strong>ard lamp. The working st<strong>and</strong>ard photometers will be recalibrated<br />
yearly against the transfer st<strong>and</strong>ards <strong>and</strong> their long term stability will be monitored. The extended<br />
group <strong>of</strong> working st<strong>and</strong>ards is used for routine photometer calibrations <strong>and</strong> photometric scale<br />
dissemination.<br />
2. TRANSFER STANDARDS<br />
The transfer st<strong>and</strong>ards were designed such that it is the uncertainty <strong>of</strong> the spectral irradiance<br />
responsivity calibrations that determines the photometric scale uncertainty <strong>and</strong> not limitations in<br />
the performance <strong>of</strong> the photometers themselves. New filter combinations have been designed<br />
with a minimum allowed thickness <strong>of</strong> 4.5 mm to avoid interference fringes. They are individually<br />
fabricated to closely match the responsivity <strong>of</strong> the silicon detector to the CIE V(λ) function [2]. The<br />
filter combinations are in a filter wheel located between the common detector <strong>and</strong> aperture. The<br />
wheel temperature is controlled at 25 o C where the spectral mismatch errors were minimized.<br />
Two types <strong>of</strong> transfer st<strong>and</strong>ard photometers were designed <strong>and</strong> built. The first type, as shown<br />
in Fig. 1, uses windowless silicon photodiodes in a tunnel trap configuration [3]. The cut-outs<br />
were made for better illustration. The long-term stability <strong>of</strong> this photometer is regularly monitored<br />
to see if any responsivity changes happen due to either stain settlement on the filter surfaces or
ecause the photodiodes are exposed to the ambient air. A few tenths <strong>of</strong> a percent changes have<br />
been observed by us earlier on open Si trap detectors at 400 nm. The changes gradually<br />
decreased <strong>and</strong> became negligibly small at 500 nm. In this tunnel-trap detector, light is not<br />
reflected back to the filters.<br />
In the improved (newer) transfer st<strong>and</strong>ard, a single-element silicon photodiode is used which<br />
has a sealed wedged-window to avoid fringes. The picture <strong>of</strong> the new transfer st<strong>and</strong>ard (with the<br />
front panels removed) is shown in Fig. 2. The front panels are removed for better illustration. The<br />
photo shows the light tight box with the detector <strong>and</strong> the filter-wheel inside. The photocurrent<br />
meter is attached to the side <strong>of</strong> the box. The current measuring electronics are matched to the<br />
electronic characteristics <strong>of</strong> the photodiode for low-noise performance over a signal dynamic<br />
range <strong>of</strong> 12 decades. The uncertainty <strong>of</strong> the current-to-voltage conversion is 0.02 % (k=2).<br />
Fig. 1. The filter-trap transfer st<strong>and</strong>ard. Fig. 2. The new generation transfer st<strong>and</strong>ard<br />
3. WORKING STANDARDS<br />
The illuminance responsivities <strong>of</strong> the present working st<strong>and</strong>ard photometers have been<br />
determined yearly based on their spectral power responsivity measurements at the SCF. Figure 3<br />
shows the long-term changes normalized to unity in 1991. Yearly scale realizations were made to<br />
determine the actual responsivities based on the SCF scale realizations. The thick line shows a<br />
0.3 % maximum responsivity change for the group average <strong>of</strong> photometers 4, 6, <strong>and</strong> 8. The front<br />
surfaces <strong>of</strong> the filters in photometers 1 <strong>and</strong> 2 were cleaned first in 1994. The other photometers<br />
were not cleaned until 2006, when the front surfaces <strong>of</strong> all photometer filters were cleaned. The<br />
results show that the long term stability <strong>of</strong> the individual photometers can be improved to +/-<br />
0.1 % if the front surfaces <strong>of</strong> the filters are cleaned on a regular basis. Change <strong>of</strong> photometer 5<br />
after 2003 is due to repairs.<br />
Ten-year long changes <strong>of</strong> 0.02 % were<br />
measured at the SCF on silicon photodiodes<br />
sealed with fused silica windows used in<br />
these working st<strong>and</strong>ards. It can be<br />
concluded that change-free photometer<br />
st<strong>and</strong>ards can be made if the photometer<br />
head is sealed with a fused silica window.<br />
The stability <strong>of</strong> the working st<strong>and</strong>ards should<br />
be matched to the lower uncertainty <strong>of</strong> the<br />
SIRCUS-based scale to obtain an overall<br />
uncertainty improvement in the disseminated<br />
scale. A package design was applied for<br />
both the old <strong>and</strong> the new working st<strong>and</strong>ard<br />
photometers to obtain a uniform temperature<br />
distribution for the filter combination <strong>and</strong> the<br />
silicon photodiode. The spectral<br />
transmittance <strong>of</strong> the V(λ) curve is<br />
temperature dependent. Also, the applied<br />
infrared-suppressed silicon photodiode has<br />
a significant temperature coefficient <strong>of</strong><br />
1.01<br />
1.005<br />
1<br />
0.995<br />
0.99 Ph.1<br />
Ph.2<br />
0.985 Ph.3<br />
Ph.4<br />
Ph.5<br />
0.98<br />
Ph.6<br />
Ph.7<br />
0.975 Ph.8<br />
Avg <strong>of</strong> 4,6,8<br />
0.97<br />
1991 1993 1995 1997 1999 2001 2003 2005<br />
Year<br />
Fig. 3. Long-term changes <strong>of</strong> the old photometers.<br />
All photometers were cleaned in 2006 <strong>and</strong> Ph.1<br />
<strong>and</strong> Ph.2 were cleaned in 1994 <strong>and</strong> 1997.
Fig. 4. Structure <strong>of</strong> a photometer package Fig. 5. A new generation working st<strong>and</strong>ard.<br />
responsivity at wavelengths longer than 630 nm. These two components are mounted in a metal<br />
housing, <strong>and</strong> the uniform temperature is monitored in the existing (old) photometers [1], <strong>and</strong><br />
stabilized in the new working st<strong>and</strong>ards. As shown in Fig. 4, the aperture (1), the filter<br />
combination (2), <strong>and</strong> the photodiode (3) are close to each other inside <strong>of</strong> a Copper pot (4). While<br />
there is a small gap between the photodiode <strong>and</strong> the filter, the very thin aperture is mounted on<br />
the front surface <strong>of</strong> the filter to avoid inter-reflections. In order to simplify cleaning the front<br />
surface <strong>of</strong> the filter, the aperture is fixed in a holder (5) that can be easily removed <strong>and</strong> relocated<br />
into the same position using an asymmetric screw arrangement. A temperature sensor (6) is<br />
plugged into the copper pot. A ring shape thermoelectric cooler (7) is mounted to the bottom <strong>of</strong><br />
the copper pot in the new working st<strong>and</strong>ards to keep the temperature constant, just above the<br />
ambient.<br />
The field-<strong>of</strong>-view (FOV) <strong>of</strong> the illuminance meter depends on the diameter <strong>of</strong> the aperture <strong>and</strong><br />
the photodiode active area. It is always kept small (e.g. 11 o ) to reject ambient light as well as<br />
reflections <strong>and</strong> stray light from a test source. The base unit, as shown on the right side <strong>of</strong> Fig. 5,<br />
can be equipped with a bayonet mount at the front to attach an input optic for luminance<br />
measurement. In this example, the filter can be removed; therefore its temperature is<br />
independently controlled from the temperature <strong>of</strong> the photodiode. The photocurrent meter is<br />
located inside <strong>of</strong> another cylindrical housing attached to the bottom <strong>of</strong> the base unit. The<br />
electronic characteristics <strong>of</strong> the current-to-voltage converter are matched to the high shunt<br />
resistance <strong>of</strong> the silicon photodiode to obtain low output noise <strong>and</strong> wide signal range.<br />
4. RESPONSIVITIES<br />
The spectral irradiance responsivities <strong>of</strong> the transfer st<strong>and</strong>ards were determined against two<br />
irradiance-measuring reference trap detectors.<br />
As an example, the spectral irradiance 0.035<br />
responsivity <strong>of</strong> one <strong>of</strong> the transfer st<strong>and</strong>ards, as<br />
measured on the SIRCUS, is shown in Fig. 6.<br />
The left-Y axis shows the measured data on a<br />
linear scale. The right-Y axis is a logarithmic<br />
scale to show the out-<strong>of</strong>-b<strong>and</strong> responsivity <strong>of</strong><br />
the realized V(λ) curve.<br />
0.030<br />
0.025<br />
0.020<br />
10 -3<br />
10 -2<br />
10 -1<br />
The illuminance responsivity se, which is the<br />
ratio <strong>of</strong> the photometer output current to the<br />
illuminance measured by the photometer, was<br />
determined from the SIRCUS measured<br />
spectral irradiance responsivity sE(λ) <strong>and</strong> the<br />
incident irradiance E(λ) from a CIE St<strong>and</strong>ard<br />
Illuminant A source:<br />
0.015<br />
0.010<br />
0.005<br />
0.000<br />
400 500 600 700 800<br />
10 -4<br />
10 -5<br />
10 -6<br />
Fig. 6. Spectral irradiance responsivity <strong>of</strong><br />
the filter-trap transfer st<strong>and</strong>ard.
s<br />
e<br />
∫ sE<br />
=<br />
K ∫<br />
m<br />
( λ)<br />
E(<br />
λ)<br />
dλ<br />
V ( λ)<br />
E(<br />
λ)<br />
dλ<br />
where Km is the maximum spectral luminous efficacy, 683 lm/W <strong>and</strong> λ is the wavelength.<br />
The illuminance responsivity has also been measured against the SCF-based scale. The<br />
illuminance responsivity <strong>of</strong> the new generation transfer st<strong>and</strong>ard was measured against the<br />
average illuminance responsivity <strong>of</strong> a selected group <strong>of</strong> the old photometer st<strong>and</strong>ards. The<br />
photometers measured the same illuminance from a 2856 K color temperature lamp. The<br />
preliminary ratio <strong>of</strong> the SIRCUS-based illuminance responsivity to the SCF-based illuminance<br />
responsivity at gain 10 8 V/A is ≈ 1.004. The relative exp<strong>and</strong>ed uncertainty <strong>of</strong> the SIRCUS-based<br />
illuminance responsivity is estimated to be 0.1 % (k=2). This preliminary uncertainty is dominated<br />
by a constant 0.08 % irradiance responsivity difference in the visible wavelength range between<br />
the two reference trap detectors used to calibrate the transfer st<strong>and</strong>ards. Also, the ratio obtained<br />
at the previous photometric scale comparison in 2003, using the filter-trap transfer st<strong>and</strong>ard, was<br />
1.0038. At present, the data evaluation for the filter-trap transfer st<strong>and</strong>ard is still being done.<br />
There will be further comparisons <strong>of</strong> the two scales after the annual SCF-based calibration <strong>of</strong> the<br />
old photometers.<br />
5. CONCLUSIONS<br />
The results <strong>of</strong> a research work to improve the uncertainty <strong>of</strong> the <strong>NIST</strong> detector-based photometric<br />
scale are presented. Transfer st<strong>and</strong>ard illuminance meters have been developed <strong>and</strong> calibrated<br />
on the SIRCUS facility with decreased spectral irradiance responsivity uncertainty. In order to<br />
decrease the long-term responsivity changes <strong>of</strong> the old (presently used) working st<strong>and</strong>ard<br />
photometers that maintain the <strong>NIST</strong> photometric scale, the old group has been extended with<br />
new-generation photometers. The extended group can be calibrated against the new transfer<br />
st<strong>and</strong>ards. Repeated scale realizations since 1991 verified that the long term responsivity<br />
changes <strong>of</strong> the photometers are caused by the development <strong>of</strong> stain layers at the front surface <strong>of</strong><br />
the V(λ) filter packages. The instabilities <strong>of</strong> the old photometer st<strong>and</strong>ards could be decreased to<br />
within +/- 0.1 % <strong>of</strong> their original (clean) responsivities after the front surfaces <strong>of</strong> the filters were<br />
cleaned. It was suggested that photometer working st<strong>and</strong>ards, free <strong>of</strong> responsivity changes<br />
(without any cleaning), can be made if the front <strong>of</strong> the photometer head is sealed with a fused<br />
silica window. The working st<strong>and</strong>ard group policy was utilized to determine <strong>and</strong> then to minimize<br />
the long term responsivity changes. Using the SIRCUS-based lower scale uncertainty <strong>and</strong> the<br />
minimized long-term change in the average responsivity <strong>of</strong> a selected working st<strong>and</strong>ard group,<br />
the uncertainty <strong>of</strong> routine illuminance meter calibrations can be reduced by about a factor <strong>of</strong> two.<br />
ACKNOWLEDGEMENTS<br />
The authors thank R. Bousquet, S. Brown, <strong>and</strong> K. Lykke for help with the SIRCUS<br />
measurements.<br />
REFERENCES<br />
1. Cromer, C.L., et al., The <strong>NIST</strong> detector-based luminous intensity scale. J. Res. <strong>NIST</strong>, 1996.<br />
101(2): p. 109-132.<br />
2. CIE, The Basis <strong>of</strong> Physical Photometry. Publication CIE Central Bureau, A-1033 Vienna, P. O.<br />
Box 169, Austria, 1983. 18.2.<br />
3. Eppeldauer, G.P. <strong>and</strong> D.C. Lynch, Opto-mechanical <strong>and</strong> electronic design <strong>of</strong> a tunnel-trap Siradiometer.<br />
J. Res. Nat'l. Inst. St<strong>and</strong>. Technol., 2000. 105(6): p. 813-828.<br />
Authors:<br />
George Eppeldauer Cameron Miller<br />
<strong>National</strong> <strong>Institute</strong> <strong>of</strong> <strong>St<strong>and</strong>ards</strong> <strong>and</strong> Technology <strong>National</strong> <strong>Institute</strong> <strong>of</strong> <strong>St<strong>and</strong>ards</strong> <strong>and</strong> Technology<br />
Gaithersburg, Maryl<strong>and</strong> 20899 USA Gaithersburg, Maryl<strong>and</strong> 20899 USA<br />
Phone: 301-975-2338 Phone: 301-975-4713<br />
e-mail: george.eppeldauer@nist.gov e-mail: ccmiller@nist.gov<br />
Yoshi Ohno
Eppeldauer, et al. New photometer st<strong>and</strong>ards...<br />
<strong>National</strong> <strong>Institute</strong> <strong>of</strong> <strong>St<strong>and</strong>ards</strong> <strong>and</strong> Technology<br />
Gaithersburg, Maryl<strong>and</strong> 20899 USA<br />
Phone: 301-975-2321<br />
e-mail: ohno@nist.gov<br />
5
IMPROVED ACCURACY PHOTOMETRIC AND TRISTIMULUS-COLOR<br />
SCALES BASED ON SPECTRAL IRRADIANCE RESPONSIVITY<br />
ABSTRACT<br />
George P. Eppeldauer, Steven W. Brown, C. Cameron Miller, <strong>and</strong> Keith R. Lykke<br />
<strong>National</strong> <strong>Institute</strong> <strong>of</strong> <strong>St<strong>and</strong>ards</strong> <strong>and</strong> Technology<br />
Optical Technology Division<br />
Gaithersburg, Maryl<strong>and</strong>, 20899 USA<br />
A new spectral irradiance <strong>and</strong> radiance responsivity calibration with uniform sources (SIRCUS) facility has<br />
been developed at the <strong>National</strong> <strong>Institute</strong> <strong>of</strong> <strong>St<strong>and</strong>ards</strong> <strong>and</strong> Technology (<strong>NIST</strong>) that can calibrate radiometers in<br />
irradiance measurement mode with exp<strong>and</strong>ed uncertainties (k=2) <strong>of</strong> 0.15 %. A reference tristimulus<br />
colorimeter/photometer has been developed to reduce the uncertainty in the <strong>NIST</strong> photometric units <strong>and</strong> to<br />
realize a detector-based color scale. A novel, spectrally tunable, solid-state source has also been developed<br />
to transfer the illuminance responsivity <strong>and</strong> tristimulus color scales from the reference colorimeter/photometer<br />
to test photometers <strong>and</strong> colorimeters that measure light sources with specific spectral distributions. By setting<br />
the transfer source distribution to approximate a particular target distribution, test photometers <strong>and</strong><br />
colorimeters, without knowing their relative spectral responsivities, can be calibrated against the reference<br />
instrument with almost no spectral mismatch errors resulting in low photometric <strong>and</strong> color measurement<br />
uncertainties.<br />
Keywords: colorimetry, detector-based calibration, illuminance, irradiance, photometry, spectral responsivity,<br />
st<strong>and</strong>ard, transfer-source, tristimulus<br />
1. INTRODUCTION<br />
Improvements in detector technology over the past decade have opened a new era in the field <strong>of</strong> radiometric<br />
<strong>and</strong> photometric calibrations. Lower measurement uncertainties can be achieved with modern detector<br />
st<strong>and</strong>ards than with traditionally used source st<strong>and</strong>ards. Consequently, fundamental photometric <strong>and</strong><br />
radiometric scales at <strong>NIST</strong> are currently realized <strong>and</strong> maintained using detector-based st<strong>and</strong>ards [1, 2]. The<br />
detector-based approach is being extended to colorimetry as well [3]. In the present <strong>NIST</strong> photometric units, a<br />
major source <strong>of</strong> uncertainty is the spectral responsivity measurements <strong>of</strong> the photometers using the <strong>NIST</strong><br />
Spectral Comparator Facility (SCF) [4] that utilizes a monochromator <strong>and</strong> a lamp.<br />
A calibration facility for Spectral Irradiance <strong>and</strong> Radiance Responsivity Calibrations using Uniform Sources<br />
(SIRCUS) has been developed at <strong>NIST</strong> to overcome the limitations <strong>of</strong> the SCF, in particular for calibrating<br />
irradiance <strong>and</strong> radiance meters [5, 6]. The facility introduces the output from tunable lasers into integrating<br />
spheres, producing a monochromatic, high-power uniform source. The responsivity scale is transferred from<br />
the <strong>NIST</strong> High-Accuracy Cryogenic Radiometer [7] <strong>and</strong> maintained on irradiance st<strong>and</strong>ard 6-element<br />
transmission trap detectors [8]. Their spectral power responsivity is determined using a cryogenic electrical<br />
substitution radiometer, <strong>and</strong> their irradiance responsivity is derived by placing a calibrated aperture at the input<br />
plane. The SIRCUS facility has several advantages over conventional lamp-monochromator systems to<br />
realize photometric <strong>and</strong> colorimetric scales. It provides high-power, low wavelength uncertainty, <strong>and</strong> the ability<br />
to produce a monochromatic Lambertian radiation that enables calibration <strong>of</strong> instruments directly for irradiance<br />
or radiance responsivity.<br />
The overall relative combined exp<strong>and</strong>ed (k=2) uncertainty for the <strong>NIST</strong> illuminance unit realization using the<br />
SCF is currently 0.39 % [1]. There are several components in the uncertainty budget related to the<br />
determination <strong>of</strong> the photometer spectral responsivity in the SCF [1]. These uncertainty components can be<br />
significantly reduced or eliminated by realizing the illuminance scale on SIRCUS.<br />
It is expected that the st<strong>and</strong>ard uncertainty in the spectral responsivity scale will be reduced from 0.11 %<br />
(measured on the SCF) to 0.075 % due to the reduction <strong>of</strong> transfer steps from the absolute cryogenic<br />
radiometer. The CIE spectral luminous efficiency, V(λ), is a strong function <strong>of</strong> wavelength. The SIRCUS<br />
wavelength scale, with uncertainties reduced to 0.001 nm from the current SCF’s wavelength uncertainty <strong>of</strong><br />
0.1 nm, will reduce the relative st<strong>and</strong>ard uncertainty for this component from 0.04 % to less than 0.001 %. A<br />
significant set <strong>of</strong> uncertainty components results from the geometry <strong>of</strong> the SCF output beam. The SCF uses<br />
f/9 optics to focus the light to a 1 mm spot that is used to calibrate the photometers. The photometers are<br />
used in a far field condition. SIRCUS can calibrate photometers in a geometrical configuration identical to the<br />
application geometry. In addition, since SIRCUS calibrates the detector in irradiance mode instead <strong>of</strong> power<br />
mode, the uncertainty <strong>of</strong> the aperture area <strong>and</strong> the uncertainty due to the non-uniform spatial response <strong>of</strong> the<br />
photometer will be eliminated. The combined uncertainty from these components related to measurement<br />
geometry can be reduced from 0.12 % [1] to less than 0.01 %. The overall relative exp<strong>and</strong>ed uncertainty (k=2)<br />
for the <strong>NIST</strong> illuminance unit realization is expected to be reduced to 0.24 %, a 40 % reduction in the
uncertainty in the current scale, when the new illuminance scale is realized. The new illuminance scale will<br />
lead to an expected overall relative exp<strong>and</strong>ed uncertainty <strong>of</strong> 0.27 % (k=2) for the <strong>NIST</strong> c<strong>and</strong>ela.<br />
Similar reductions in the uncertainty <strong>of</strong> the color scale may be expected as well. Typically, a 0.1 %<br />
uncertainty in the spectral irradiance responsivity <strong>of</strong> any one channel <strong>of</strong> the tristimulus colorimeter will result in<br />
a change <strong>of</strong> 0.0004 in the x, y chromaticity coordinates (for a Planckian radiator). These expected colorimeter<br />
uncertainties are equivalent to the uncertainties <strong>of</strong> the current primary lamp st<strong>and</strong>ards. Though it may be<br />
challenging to further reduce color uncertainties with the detector-based calibration, it leaves future possibility<br />
with further improvement <strong>of</strong> the spectral irradiance responsivity uncertainty.<br />
The SIRCUS facility is used to calibrate primary photometers <strong>and</strong> colorimeters spectrally. Generally, the<br />
scale is transferred from the primary reference instruments to test photometers <strong>and</strong> colorimeters by direct<br />
substitution against inc<strong>and</strong>escent lamp sources (typically operated at 2856 K). Test instruments are <strong>of</strong>ten<br />
used to measure sources with markedly different spectral distributions, e.g. discharge lamps, displays, light<br />
emitting diodes (LEDs), etc. Because the instrument’s responsivity does not exactly match the V(λ) or the<br />
color-matching functions, correction factors need to be applied to the instruments to maintain low uncertainty<br />
[9]. For such a spectral mismatch correction, however, the relative spectral responsivity <strong>of</strong> the test instruments<br />
must be known. In many cases, such data are not available <strong>and</strong> it would be <strong>of</strong>ten too costly for users to<br />
measure them. To avoid such difficulties, test instruments with unknown relative spectral responsivity can be<br />
calibrated with st<strong>and</strong>ard photometers/colorimeters (with known relative spectral responsivity) using the<br />
particular light source to be measured by the test instrument. It is not practical to maintain artifacts <strong>of</strong> all<br />
possible types <strong>of</strong> specialty sources at <strong>NIST</strong>. To solve this problem, we have developed a spectrally tunable<br />
transfer source based on light emitting diodes (LEDs) [10]. This source is designed to mimic the spectral<br />
distributions <strong>of</strong> both traditional <strong>and</strong> special test sources. It will be used to propagate the <strong>NIST</strong> reference scales<br />
to field level photometers <strong>and</strong> colorimeters with small increases in the uncertainties.<br />
2. REFERENCE TRISTIMULUS COLORIMETER/PHOTOMETER<br />
Improved performance photometer <strong>and</strong> tristimulus colorimeter st<strong>and</strong>ards were developed using temperaturestabilized,<br />
filtered single-element <strong>and</strong> tunnel-trap silicon detectors to utilize the very low uncertainties <strong>of</strong> the<br />
new SIRCUS spectral responsivity scales [5]. Four filter combinations with the trap detector implement the<br />
CIE color matching functions [11]. The spectral mismatch <strong>of</strong> the realized channels is characterized by the CIE<br />
f1 ’ values [12]. The realized f1 ’ values are 1.6 % for the x 1(λ) <strong>and</strong> V(λ), 3.6 % for the z (λ), <strong>and</strong> 4.1 % for the<br />
x 2(λ) channels. The filter combinations are mounted in a temperature controlled (heated) filter wheel placed<br />
between the trap detector <strong>and</strong> the front aperture. The aperture plane is the reference plane <strong>of</strong> the illuminance<br />
mode photometer/colorimeter. A current-to-voltage converter can be plugged to the top <strong>of</strong> the light tight box <strong>of</strong><br />
the photometer/colorimeter. Electronic <strong>and</strong> radiometric characterizations, including current-to-voltage<br />
conversion uncertainty <strong>and</strong> spatial, angular, <strong>and</strong> spectral responsivity, showed that the prototype<br />
photometer/colorimeter had satisfied the design expectations <strong>and</strong> it will be possible to determine the channel<br />
spectral irradiance responsivities with 0.1 % relative st<strong>and</strong>ard uncertainty.<br />
A single photometer has also been developed where the photodiode <strong>and</strong> the filter combination are mounted<br />
inside <strong>of</strong> a temperature-controlled copper block. Care was taken in the design - <strong>and</strong> the front surface <strong>of</strong> the<br />
V(λ) filter was s<strong>and</strong>ed - to avoid interference fringes in the SIRCUS calibrations. The f1 ’ was 1.85 %. An<br />
aperture mounted in front <strong>of</strong> the filters gives the reference plane <strong>of</strong> irradiance <strong>and</strong> illuminance measurements.<br />
3. SPECTRAL RESPONSIVITY MEASUREMENTS<br />
Depending on the application, a variety <strong>of</strong> different integrating spheres are used on SIRCUS. For irradiance<br />
responsivity calibrations, the source is a 2.5 cm diameter sphere with variable precision exit-apertures that<br />
mimics the beam geometry <strong>of</strong> luminous intensity lamp measurements. In this case, the interreflection effects<br />
within a photometer will not change from calibration to application. Also, because <strong>of</strong> the uniform irradiance,<br />
the non-uniformity <strong>of</strong> spatial responsivity <strong>of</strong> detectors, filters, <strong>and</strong> diffusers will not contribute to the uncertainty<br />
<strong>of</strong> measurements. Corrections for b<strong>and</strong>pass will not be necessary, as the b<strong>and</strong>width from the lasers is<br />
negligible. Comparisons <strong>of</strong> the spectral responsivities determined on the SIRCUS <strong>and</strong> the SCF are done on a<br />
regular basis to minimize uncertainties.<br />
4. ILLUMINANCE RESPONSIVITY<br />
The photometer illuminance responsivity is the ratio <strong>of</strong> the photometer output current to the illuminance<br />
measured by the photometer:<br />
s Ei =<br />
∫ E(λ)s<br />
λ E(λ)dλ<br />
∫ E (λ)V(λ)dλ<br />
λ<br />
K m<br />
(1)
where E(λ) is the incident spectral irradiance on the photometer, V(λ) is the CIE spectral luminous efficiency,<br />
Km is the maximum spectral luminous efficacy, 683 lm/W, sE(λ) is the spectral irradiance responsivity <strong>of</strong> the<br />
photometer as measured on the SIRCUS, <strong>and</strong> λ is the wavelength.<br />
The broad-b<strong>and</strong> (illuminance) calibration factor <strong>of</strong> the photometer is:<br />
C cal = 1<br />
s Ei<br />
, [lx/A] (2)<br />
5. CALIBRATION FACTORS FOR THE TRISTIMULUS COLORIMETER<br />
Similar to the above illuminance responsivity calibration <strong>of</strong> a single photometer, the channel calibration factors<br />
<strong>of</strong> the tristimulus colorimeter can be determined from the ratio <strong>of</strong> the CIE tristimulus values to the measured<br />
output currents <strong>of</strong> the four channels:<br />
k X 1 = X 1<br />
I X 1<br />
= Km ∫λ<br />
E(λ)x 1(λ)dλ<br />
∫ E (λ)s (λ)dλ<br />
λ X 1<br />
= 1.06291K m F X 1<br />
s X1 (599)<br />
kY = Y<br />
=<br />
IY Km ∫λ<br />
E (λ)V(λ)dλ<br />
=<br />
∫ E(λ)s Y (λ)dλ<br />
λ<br />
KmF Y<br />
sY (555)<br />
k Z = Z<br />
I Z<br />
kX 2 = X 2<br />
I X2<br />
= Km ∫ E(λ)x2 (λ)dλ<br />
λ<br />
=<br />
∫ E (λ)s (λ)dλ<br />
λ X 2 0.3501K mFX 2<br />
s (442)<br />
X 2<br />
= Km ∫ E (λ)z(λ)dλ<br />
λ<br />
=<br />
∫ E(λ)s (λ)dλ<br />
λ Z 1.78297K mFZ s (446) Z<br />
(3)<br />
The right side <strong>of</strong> the equations was obtained by normalizing the x1(λ) , x2(λ) , V(λ) , <strong>and</strong><br />
their peak values <strong>and</strong> introducing the color correction factors for all tristimulus channels:<br />
∫ E(λ)x1n (λ)dλ<br />
λ<br />
FX 1 =<br />
∫<br />
F Y =<br />
E(λ)s X 1n (λ)dλ<br />
λ<br />
∫ E(λ)V (λ)dλ<br />
λ<br />
∫ E (λ)s (λ)dλ<br />
λ Yn<br />
∫ E(λ)x2n (λ)dλ<br />
λ<br />
FX 2 =<br />
∫<br />
F Z =<br />
E(λ)s X 2n (λ)dλ<br />
λ<br />
∫ E (λ)zn (λ)dλ<br />
λ<br />
∫ E (λ)s (λ)dλ<br />
λ Zn<br />
z(λ) functions to<br />
where sX1(599), sX2(442), sY(555), <strong>and</strong> sZ(446) are the absolute irradiance responsivities <strong>of</strong> the realized<br />
channels at the peak wavelengths <strong>of</strong> the color matching functions, x 1n(λ), x 2n(λ), <strong>and</strong> z n(λ) are the color<br />
matching functions normalized to one at their peaks, sX1n(λ), sX2n(λ), sYn(λ), <strong>and</strong> sZn(λ) are the relative spectral<br />
irradiance responsivities <strong>of</strong> the realized channels normalized to one at their peak wavelengths.<br />
After the tristimulus colorimeter is calibrated for kX1, kX2, kY, <strong>and</strong> kZ, the tristimulus values <strong>of</strong> a test light<br />
source can be measured as<br />
X'=X1'+X2', where X1'= kX1 I Xl' <strong>and</strong> X2' = k X2 IX2' Y' = kY IY', <strong>and</strong> Z' = kZ IZ' (5)<br />
where I Xl', IX2', IY', <strong>and</strong> IZ' are the measured output currents <strong>of</strong> the tristimulus channels. This calibration<br />
procedure can be applied to either illuminance or luminance measurement geometry using the relevant units<br />
<strong>of</strong> sX1(599), sX2(442), sY(555), <strong>and</strong> sZ(446) in the equations.<br />
From the procedures described above, the photometric <strong>and</strong> colorimetric measurement uncertainties will<br />
depend only on the uncertainty <strong>of</strong> the spectral responsivity determination <strong>of</strong> the channels. An advantage <strong>of</strong><br />
the method is that accurate color <strong>and</strong> photometric measurements can be made even if the CIE functions are<br />
poorly realized (with large spectral mismatch in the channels).<br />
If the CIE f1 ’ (spectral mismatch) values <strong>of</strong> the realized channels are small, the color correction factors can<br />
be kept very close to unity even if the source distribution changes (between the calibration source <strong>and</strong> the test<br />
’<br />
source) are significant. However, even with small f1 values, an additional set <strong>of</strong> calibration factors may be<br />
needed to accurately measure very different source distributions, such as gas discharge lamps or display<br />
monitors. In this case, rough knowledge <strong>of</strong> the source distribution is enough to derive correction factors<br />
enabling accurate photometric <strong>and</strong> color measurements. This is the principle behind the development <strong>of</strong> a<br />
spectrally tunable source.<br />
6. SCALE DERIVATIONS USING A TUNABLE OUTPUT LED TRANSFER SOURCE<br />
By setting the transfer source distribution equal, or very similar, to that <strong>of</strong> the test source to be measured, the<br />
photometric <strong>and</strong> color scales can be transferred from the primary st<strong>and</strong>ard photometers <strong>and</strong> colorimeters<br />
calibrated on SIRCUS to field meters with minimal increase in uncertainties. In our recently developed<br />
(4)
spectrally tunable solid-state source [10] the radiant flux from a sufficient number <strong>of</strong> light emitting diodes<br />
(LEDs) with different spectral distributions is introduced into an integrating sphere. A reference<br />
spectroradiometer is mounted on the sphere that measures the radiance (luminance) at the sphere exit port.<br />
The LEDs are individually controlled by adjustable current sources <strong>and</strong> are tuned - according to the<br />
spectroradiometer reading – to approximate a target source distribution. St<strong>and</strong>ard <strong>and</strong> test photometers <strong>and</strong><br />
colorimeters then measure the irradiance from the source at a given distance. The source can be rapidly<br />
tuned to match any desired spectral distribution. Customers no longer need to send the source artifact (e.g.<br />
discharge lamp or display), only its spectral distribution(s). Knowledge <strong>of</strong> the relative spectral responsivity <strong>of</strong><br />
the test instruments is not needed when they are calibrated against the reference instruments by measuring<br />
the transfer source tuned to the source distribution to be measured. In this case, the spectral mismatch errors<br />
are very small resulting in low measurement uncertainties.<br />
The initial prototype source was built using a total <strong>of</strong> 40 LED’s, 4 LED’s each with 10 different spectral<br />
distributions. While this is a transfer source, in principle only requiring that the radiance be stable over the<br />
course <strong>of</strong> a measurement, it is desirable to know <strong>and</strong> underst<strong>and</strong> the radiometric characteristics <strong>of</strong> the LEDs.<br />
This knowledge will impact the ultimate design <strong>of</strong> the source. LED’s were tested for stability <strong>and</strong> dependence<br />
on drive current. The effect <strong>of</strong> LED seasoning for luminance <strong>and</strong> chromaticity was studied. Also, the<br />
luminance, chromaticity, <strong>and</strong> spectral distribution changes versus LED drive current were analyzed for<br />
representative red, green, <strong>and</strong> blue LEDs [10]. The prototype source demonstrated the feasibility <strong>of</strong> a<br />
spectrally tunable LED-based source.<br />
Simulations showed that a 40-channel source could approximate the CIE st<strong>and</strong>ard illuminant A within 0.1 %<br />
<strong>and</strong> the D65 within 5 % deviation over the visible spectral range from 380 nm to 780 nm. Consequently, we<br />
have started the development <strong>of</strong> a 40-channel source. The source has 4 LED heads, with 10 channels per<br />
head. There are typically 3 LEDs per channel, though for certain spectral regions only low power LEDs are<br />
available <strong>and</strong> in those cases additional LEDs are added to the channel.<br />
7. SUMMARY<br />
Recently performed irradiance responsivity calibrations with exp<strong>and</strong>ed uncertainties (k=2) <strong>of</strong> 0.15 % motivated<br />
the development <strong>of</strong> a detector-based tristimulus colorimetric scale <strong>and</strong> the improvement <strong>of</strong> the present <strong>NIST</strong><br />
photometric units. A reference tristimulus colorimeter/photometer has been developed to implement the first<br />
detector-based color scale <strong>and</strong> to study the uncertainty decrease <strong>of</strong> illuminance responsivity calibrations on<br />
the new SIRCUS facility. A novel, spectrally tunable, solid-state source was developed to transfer the high<br />
accuracy illuminance responsivity <strong>and</strong> tristimulus color scales from the reference tristimulus<br />
colorimeter/photometer to working st<strong>and</strong>ard <strong>and</strong> field photometers <strong>and</strong> tristimulus meters. By setting the<br />
transfer source distribution to approximate a particular target distribution, the photometric <strong>and</strong> color scales can<br />
be transferred to field meters with minimal increase in uncertainties.<br />
REFERENCES<br />
[1] Cromer, C. L., Eppeldauer, G., Hardis, J. E., Larason, T. C., Ohno, Y., <strong>and</strong> Parr, A. C., The <strong>NIST</strong> Detector-<br />
Based Luminous Intensity Scale, J. Res. <strong>of</strong> the <strong>NIST</strong>, Vol. 101, No 2, p.109-132, 1996.<br />
[2] Yoon, H. W., Gibson, C. E., <strong>and</strong> Barnes, P. Y., Realization <strong>of</strong> the <strong>National</strong> <strong>Institute</strong> <strong>of</strong> <strong>St<strong>and</strong>ards</strong> <strong>and</strong><br />
Technology detector-based spectral irradiance scale, Appl. Opt. Vol. 41, No. 28, 5879-5890, 2002.<br />
[3] Eppeldauer G., Spectral Response Based Calibration Method <strong>of</strong> Tristimulus Colorimeters, J. Res. <strong>of</strong> the<br />
<strong>NIST</strong> Vol. 103, No. 6. 615-619, 1998.<br />
[4] Larason, T. C., Bruce, S. S., <strong>and</strong> Parr, A. C., Spectroradiometric Detector Measurements: Part I-Ultraviolet<br />
Detectors <strong>and</strong> Part II-Visible to Near-Infrared Detectors, <strong>NIST</strong> Special Publ. 250-41, 1998.<br />
[5] Brown, S. W., Eppeldauer, G. P., <strong>and</strong> Lykke, K. R., <strong>NIST</strong> Facility for Spectral Irradiance <strong>and</strong> Radiance<br />
Response Calibrations with a Uniform Source, Metrologia, Vol. 37, 579-582, 2000.<br />
[6] Eppeldauer, G. P., Brown, S. W., Larason, T. C., Racz, M., <strong>and</strong> Lykke, K. R., Realization <strong>of</strong> a spectral<br />
radiance responsivity scale with a laser-based source <strong>and</strong> Si radiance meters, Metrologia, Vol. 37, 531-534,<br />
2000.<br />
[7] Gentile, T. R., Houston, J. M., Hardis, J. E., Cromer, C. L., <strong>and</strong> Parr, A. C., <strong>National</strong> <strong>Institute</strong> <strong>of</strong> <strong>St<strong>and</strong>ards</strong><br />
<strong>and</strong> Technology high-accuracy cryogenic radiometer, App. Opt. Vol. 35, No. 7, 1056-1068, 1996.<br />
[8] Eppeldauer, G. P. <strong>and</strong> Lynch, D. C., Opto-mechanical <strong>and</strong> electronic design <strong>of</strong> a tunnel-trap Si-radiometer, J.<br />
Res. Natl. Inst. St<strong>and</strong>. Technol. Vol. 105, No. 6, p. 813-828, 2000.<br />
[9] Brown, S. W., Zong, Y., <strong>and</strong> Ohno, Y., <strong>NIST</strong> Calibrations <strong>of</strong> Colorimeters for Display Measurements,<br />
Information Display, Vol. 15, 30-34, 1999.<br />
[10] Brown, S. W., Santana, C., <strong>and</strong> Eppeldauer, G. P., Development <strong>of</strong> a Tunable LED-based Colorimetric<br />
Source, J. Res. <strong>NIST</strong>, Vol. 107, No. 4, 363-371, 2002.<br />
[11] Publication CIE No. 15. 2 (1986), Central Bureau <strong>of</strong> the CIE, A-1033 Vienna, P.O. Box 169, Austria.<br />
[12] Publication CIE No. 69 (1987), Central Bureau <strong>of</strong> the CIE, A-1033 Vienna, P.O. Box 169, Austria.<br />
4
Realization <strong>and</strong> application <strong>of</strong> a detector-based tristimulus color scale<br />
at the <strong>National</strong> <strong>Institute</strong> <strong>of</strong> <strong>St<strong>and</strong>ards</strong> <strong>and</strong> Technology, USA<br />
ABSTRACT<br />
G. P. Eppeldauer, S. W. Brown, K. R. Lykke, <strong>and</strong> Y. Ohno<br />
<strong>National</strong> <strong>Institute</strong> <strong>of</strong> <strong>St<strong>and</strong>ards</strong> <strong>and</strong> Technology, Optical Technology Division<br />
Gaithersburg, Maryl<strong>and</strong> (USA)<br />
Corresponding author: G. P. Eppeldauer (george.eppeldauer@nist.gov)<br />
The recently introduced detector-based calibration method for tristimulus colorimeters has<br />
been realized. The <strong>NIST</strong> reference colorimeter has been calibrated for spectral irradiance responsivity<br />
with an uncertainty <strong>of</strong> 0.15 % (coverage factor k=2) resulting in a chromaticity uncertainty <strong>of</strong> 0.0004<br />
(k=2) in the x <strong>and</strong> y chromaticity coordinates when a CIE Illuminant A source is measured. The color<br />
scale is realized <strong>and</strong> maintained by reference colorimeters rather than reference lamps. The color<br />
measurement uncertainty increases when sources other than Illuminant A are measured due to spectral<br />
mismatch errors <strong>of</strong> the channels. Variable reference source models have been developed so that the<br />
reference source for the colorimeter can be automatically matched to the measured test source <strong>of</strong><br />
certain types. A model using Planckian radiation with a variable temperature has been tested <strong>and</strong><br />
proved to be effective in eliminating the mismatch errors for inc<strong>and</strong>escent lamps. Another model<br />
based on primary colors <strong>of</strong> a display has also been tested <strong>and</strong> shown to be effective.<br />
1. INTRODUCTION<br />
A reference tristimulus colorimeter has been developed at the <strong>National</strong> <strong>Institute</strong> <strong>of</strong> <strong>St<strong>and</strong>ards</strong><br />
<strong>and</strong> Technology (<strong>NIST</strong>) to implement the recently developed tristimulus colorimeter calibration<br />
method based on detector st<strong>and</strong>ards [1, 2]. The reference tristimulus colorimeter was designed such<br />
that the combined uncertainty <strong>of</strong> the color <strong>and</strong> photometric measurements is dominated by the<br />
uncertainty <strong>of</strong> the spectral responsivity calibrations. The spectral responsivities <strong>of</strong> the four colorimeter<br />
channels are closely matched to the CIE color matching functions (the f1’ values are 1.6 % for the Y<br />
<strong>and</strong> X1, 3.6 % for the Z, <strong>and</strong> 4.1 % for the X2 channels) to minimize additional uncertainties in color<br />
measurement. The channel spectral irradiance responsivities were determined with the lowest possible<br />
uncertainty using our laser-based facility to produce uniform monochromatic irradiance [3].<br />
Based on the spectral irradiance responsivity <strong>of</strong> the channels, a colorimetric scale has been<br />
realized <strong>and</strong> maintained by the reference colorimeters instead <strong>of</strong> st<strong>and</strong>ard lamps. The detector-based<br />
color scale can be calculated for any given spectral distribution <strong>of</strong> a reference source, which can be<br />
either theoretical or real. Generally, CIE Illuminant A is used as the reference source. In this case, the<br />
uncertainty <strong>of</strong> measurement increases when sources other than Illuminant A are measured due to<br />
inherent spectral mismatch <strong>of</strong> the colorimeter channels (to the CIE functions). To avoid spectral<br />
mismatch errors, an approximate spectral distribution <strong>of</strong> the test source is needed. A need for a<br />
spectroradiometer for this purpose would negate the benefit <strong>of</strong> tristimulus colorimeters.<br />
To solve this problem, a variable reference source model has been developed. This method,<br />
applied to certain types <strong>of</strong> source, avoids or reduces the spectral mismatch errors without knowledge<br />
<strong>of</strong> the spectral distribution <strong>of</strong> the test source. The spectral distribution <strong>of</strong> a model, used as the<br />
reference source in the colorimeter calibration equation (see below), is adjusted based on the color<br />
temperature or tristimulus values <strong>of</strong> the test source as measured by the colorimeter. A model using<br />
Planckian radiation at a variable temperature has been tested <strong>and</strong> shown to be effective for the<br />
measurement <strong>of</strong> inc<strong>and</strong>escent lamps. A model based on the spectral distribution <strong>of</strong> each primary<br />
color <strong>of</strong> a liquid crystal display (LCD) has also been tested <strong>and</strong> shown to be effective for display color<br />
measurements.
2. DETECTOR-BASED CALIBRATION OF TRISTIMULUS COLORIMETERS<br />
The spectral irradiance responsivities <strong>of</strong> the four colorimeter channels were determined on the<br />
new <strong>NIST</strong> facility for Spectral Irradiance <strong>and</strong> Radiance Responsivity Calibrations using Uniform<br />
Sources (SIRCUS) [3]. The measurement is traceable to an absolute cryogenic radiometer that<br />
maintains the <strong>NIST</strong> primary unit for optical power.<br />
The continuously tunable output from<br />
several different tunable lasers was consecutively<br />
introduced into a small integrating sphere to<br />
produce uniform, monochromatic irradiance [3] at<br />
the reference planes <strong>of</strong> the tristimulus colorimeter<br />
<strong>and</strong> the reference trap detector. The spectral<br />
irradiance responsivity scale from the trap detector<br />
was transferred to the channels <strong>of</strong> the tristimulus<br />
colorimeter using the detector substitution method.<br />
The colorimeter signal gain was 10 8 V/A for all<br />
5 10<br />
channels. The results are shown in Fig. 1; cubic-<br />
0<br />
spline fits were applied for interpolation between<br />
6<br />
1 10 7<br />
1.5 10 7<br />
2 10 7<br />
2.5 10 7<br />
3 10 7<br />
5 10<br />
0<br />
7<br />
1 10 8<br />
1.5 10 8<br />
2 10 8<br />
2.5 10 8<br />
3 10 8<br />
3.5 10 8<br />
Y<br />
X2<br />
Z<br />
X1<br />
400 450 500 550 600 650 700 750<br />
the laser-measured data points.<br />
The responsivity transfer in the uniform<br />
monochromatic irradiance makes the calibration<br />
<strong>and</strong> application beam geometries equal.<br />
Wavelength [nm]<br />
Furthermore, the uncertainty components caused by the changing internal reflectance patterns in the<br />
colorimeter (between calibration <strong>and</strong> applications) <strong>and</strong> spatial non-uniformities <strong>of</strong> the channel<br />
responsivities are reduced compared to lamp-monochromator-based calibrations. The relative<br />
combined exp<strong>and</strong>ed uncertainty (k=2) <strong>of</strong> the spectral irradiance responsivity transfer to the<br />
colorimeter was 0.15 %.<br />
Figure 1: SIRCUS measured spectral irradiance<br />
responsivities <strong>of</strong> the reference tristimulus meter.<br />
The low responsivity uncertainty made it possible to accurately calibrate the colorimeter<br />
channels for responsivity to tristimulus values. The channel broad-b<strong>and</strong> (spectrally integrated)<br />
calibration factors have been calculated [2]:<br />
X K ∫ E(<br />
λ)<br />
x ( λ)<br />
dλ<br />
1 m λ 1<br />
X K ∫ E(<br />
λ)<br />
x ( λ)<br />
dλ<br />
2 m λ 2<br />
kX<br />
1 = =<br />
kX<br />
2 = =<br />
I X1<br />
∫ E(<br />
λ)<br />
s ( λ)<br />
dλ<br />
λ X1<br />
I X2<br />
∫ E(<br />
λ)<br />
s ( λ)<br />
dλ<br />
λ X2<br />
Y K m ∫ E(<br />
λ)<br />
V ( λ)<br />
dλ<br />
λ<br />
Z K m ∫ E(<br />
λ)<br />
z(<br />
λ)<br />
dλ<br />
λ<br />
kY<br />
= =<br />
kZ<br />
= =<br />
(1)<br />
I Y ∫ E(<br />
λ)<br />
s ( λ)<br />
dλ<br />
λ Y<br />
I Z ∫ E(<br />
λ)<br />
s ( λ)<br />
dλ<br />
λ Z<br />
where E(λ) is the relative spectral distribution <strong>of</strong> the reference source, x 1( λ)<br />
, x 2 ( λ)<br />
, V (λ)<br />
,<br />
<strong>and</strong> z(λ) are the CIE color matching functions, Km is the maximum spectral luminous efficacy,<br />
683 lm/W, sX1(λ), sX2(λ), sY(λ), <strong>and</strong> sZ(λ) are the channel spectral irradiance responsivities, <strong>and</strong> λ is<br />
the wavelength. Both the responsivity measurements <strong>and</strong> the integrals were made between 360 nm<br />
<strong>and</strong> 1000 nm (the responsivity limit <strong>of</strong> silicon detectors). The calibration factors obtained for CIE<br />
Illuminant A are: Y 2.<br />
036 lx/V,<br />
= k 359 . 8 X 1 = k , 769 . 8 X 2 = k , <strong>and</strong> 96 . 108 Z = k . The tristimulus<br />
values <strong>of</strong> test light sources were determined using these calibration factors:<br />
X'=X1'+X2', where X1'= kX1I Xl' <strong>and</strong> X2' = kX2 IX2', Y' = kY IY', <strong>and</strong> Z' = kZ IZ' (2)<br />
where I Xl', IX2', IY', <strong>and</strong> IZ' are the output signals <strong>of</strong> the channels for a given test source.<br />
The 0.15 % responsivity uncertainty propagates to the tristimulus values <strong>of</strong> the measured test<br />
sources <strong>and</strong> result in uncertainties in the x, y chromaticity coordinates <strong>of</strong> 0.0004 when a CIE<br />
Illuminant A source is measured.
3. VARIABLE REFERENCE SOURCE MODEL<br />
The low uncertainty <strong>of</strong> spectral responsivity measurements <strong>and</strong> the small spectral mismatch<br />
<strong>of</strong> the channel responsivities to the CIE color matching functions makes it possible to provide an<br />
accurate color scale to a tungsten lamp realizing CIE Illuminant A. However, when sources other than<br />
Illuminant A are measured, spectral mismatch errors are inevitable even with well-matched channel<br />
spectral responsivities. With the developed <strong>NIST</strong> colorimeter, the chromaticity errors for Planckian<br />
radiation from 2300 K to 3200 K are within 0.001. The errors for light sources other than tungsten<br />
lamps are estimated to be within 0.003 in x, y.<br />
An advantage <strong>of</strong> the detector-based calibration method is that the calibration factors <strong>of</strong> the<br />
colorimeter can be determined for any spectral distribution including theoretical models. The error<br />
will be significantly reduced if an approximate spectral distribution <strong>of</strong> the test source is used as E(λ)<br />
in Eqs. (1). However, use <strong>of</strong> a spectroradiometer for this purpose will negate the benefit <strong>of</strong> tristimulus<br />
colorimeters. An attempt has been made to use spectral distribution models to reduce or eliminate<br />
spectral mismatch errors with no prior information <strong>of</strong> the spectrum <strong>of</strong> the test source.<br />
A model using Planckian radiation with a variable temperature T [K] has been introduced <strong>and</strong><br />
tested. E(λ) in Eqs. (1) is given by<br />
[<br />
−5<br />
−1<br />
λ ) = kλ<br />
exp( c2<br />
/ T ) −1]<br />
(c2=1.4388×10 -2 m·K, k: normalization constant) (3)<br />
E( λ<br />
The calibration factors in Eqs. (1) are initially calculated for T=2856 K (CIE Illuminant A). Then a<br />
test lamp is measured with the colorimeter <strong>and</strong> the color temperature T1 is obtained. Next, T1 is<br />
replaced in Eqs. (1) <strong>and</strong> the calibration factors in Eqs. (1) are recalculated, <strong>and</strong> the color quantities <strong>of</strong><br />
the test source are recalculated. With this recalculation, the CCT (<strong>and</strong> thus the spectral distribution) <strong>of</strong><br />
the reference source is nearly equal to that <strong>of</strong> the test source, realizing the condition <strong>of</strong> strict<br />
substitution. One time recalculation removes most <strong>of</strong> the errors for inc<strong>and</strong>escent lamps, but two or<br />
three iterations can remove the mismatch error completely. There are only small remaining errors due<br />
to the small deviation <strong>of</strong> the spectral distribution <strong>of</strong> the test source from the theoretical Planckian<br />
curve. The residual errors for a quartz halogen lamp at color temperatures <strong>of</strong> 2300 K to 3200 K were<br />
found to be negligible (< 0.00002 in x,y) for our <strong>NIST</strong> reference colorimeter.<br />
This model works perfectly for Planckian sources, <strong>and</strong> is also effective to some extent for<br />
other general sources, depending on the relative spectral responsivity <strong>of</strong> the channels.<br />
Another model has been tested for display calibration. The spectral distribution <strong>of</strong> displays<br />
are very similar within each type <strong>of</strong> display,<br />
therefore their spectral distribution can be modeled.<br />
A model for a display is prepared as:<br />
E λ) = k S ( λ)<br />
+ k S ( λ)<br />
+ k S ( λ)<br />
(4)<br />
( B B<br />
G G<br />
R R<br />
where SB(λ), SG(λ), SR(λ) are the relative spectral<br />
distribution <strong>of</strong> each primary color in a typical LCD<br />
or CRT. The mixing factors kB , kG , kR are initially<br />
determined so that E(λ) gives a white point at<br />
6500 K <strong>and</strong> a test display is measured with the<br />
colorimeter. Based on the first tristimulus values<br />
measured, the mixing factors kB are<br />
recalculated to give E(λ) the same chromaticity<br />
coordinates as the measured values <strong>of</strong> the test<br />
source. Based on the new E(λ), the color quantities<br />
<strong>of</strong> the test source are recalculated. A single iteration<br />
is sufficient. Additional iterations did not converge<br />
in our test. Using this process, the spectral<br />
distribution <strong>of</strong> the reference source E(λ) is adjusted<br />
to be nearly equal to the test source. Although the<br />
, kG , kR 0.006 CIE Illuminant A<br />
6500 K white<br />
0.005<br />
variable LCD model<br />
0.004<br />
0.003<br />
0.002<br />
0.001<br />
0<br />
Figure 2: Chromaticity error Δxy = Δx 2 + Δy 2<br />
in the measurement <strong>of</strong> various display colors due<br />
to spectral mismatch <strong>of</strong> the <strong>NIST</strong> colorimeter,<br />
with various reference sources including the<br />
variable LCD model.
spectral distribution <strong>of</strong> each primary color <strong>of</strong> the measured display may not be exactly the same, they<br />
are very similar within each type <strong>of</strong> display, <strong>and</strong> most <strong>of</strong> the spectral mismatch errors are removed for<br />
a given type <strong>of</strong> display, regardless <strong>of</strong> the color measured. As a demonstration, Fig. 2. shows a<br />
simulation <strong>of</strong> measurements <strong>of</strong> three different LCD displays <strong>and</strong> one CRT, where the reference source<br />
model is based on the primary color spectra <strong>of</strong> LCD1. The results are shown for three cases where<br />
displays are measured with colorimeter calibration using Illuminant A, LCD1 white (6500 K), <strong>and</strong> the<br />
variable LCD model. The results for LCD1, shown as zero for all colors, are for verification. The<br />
results for LCD2 <strong>and</strong> LCD3, having slightly different spectra from LCD1, show that errors are<br />
reduced by an order <strong>of</strong> magnitude <strong>and</strong> kept within 0.001 in Δxy. The results for CRT, having very<br />
different spectra, are not improved as much.<br />
4. TRANSFER CALIBRATION<br />
Test colorimeters can be calibrated against the detector-based reference colorimeter under<br />
illumination by a reference (transfer) source. For a simple case, a CIE illuminant A source is used,<br />
but when the test colorimeter is used to measure other various sources, the spectral mismatch error<br />
can be significant. To avoid such errors, the transfer calibration needs to be done with the same type<br />
<strong>of</strong> source that is to be measured by the test colorimeter (strict substitution). If the source is one <strong>of</strong> the<br />
types described in the reference source models above (inc<strong>and</strong>escent lamp, display), then such a real<br />
source can be used for calibration transfer. For other source types, the transfer calibration needs to be<br />
performed with a known approximate spectral distribution Ea(λ) <strong>of</strong> the source to be measured. The<br />
reference colorimeter is calibrated with Ea(λ) replaced in Eqs. (1), <strong>and</strong> determines the tristimuls<br />
values Xr, Yr, Zr <strong>of</strong> the source. The test colorimeter is calibrated against the Xr, Yr, Zr values. Such<br />
transfer calibrations for various sources can be done effectively by using a spectrally tunable source<br />
(STS) as reported in Ref. 4. The STS is set to simulate a given test source spectrum Em(λ), <strong>and</strong> the<br />
test colorimeter is calibrated against the reference colorimeter under that illumination. The STS can<br />
produce as many spectra as needed, <strong>and</strong> transfer calibration can be done for each type <strong>of</strong> source with<br />
small spectral mismatch errors, without knowing the spectral responsivity <strong>of</strong> the test colorimeter.<br />
5. CONCLUSIONS<br />
The <strong>NIST</strong> reference tristimulus colorimeter has been calibrated for absolute spectral<br />
irradiance responsivity on our tunable-laser-based spectral calibration facility. The four channels <strong>of</strong><br />
the colorimeter were calibrated with an uncertainty <strong>of</strong> 0.15 % (coverage factor k=2), which results in<br />
an uncertainty <strong>of</strong> 0.0004 (k=2) in the x, y chromaticity when measuring a CIE Illuminant A source.<br />
The color scale is realized <strong>and</strong> maintained by the reference colorimeters. For measurement <strong>of</strong> sources<br />
other than Illuminant A, variable reference source models have been developed to avoid or reduce<br />
spectral mismatch errors. The model using Planckian radiation at a variable temperature has been<br />
introduced <strong>and</strong> tested. Using this model, the spectral mismatch errors for inc<strong>and</strong>escent lamps are<br />
practically eliminated. Another model based on the primary colors <strong>of</strong> a display has also been tested<br />
<strong>and</strong> shown to be effective. Other models are being explored to measure LEDs <strong>and</strong> other sources. The<br />
transfer calibration to test colorimeters can be performed with real sources used in the variable<br />
reference source models or by using a spectrally tunable source to avoid spectral mismatch errors.<br />
References<br />
1. Eppeldauer, G. P. <strong>and</strong> Racz, M., Design <strong>and</strong> characterization <strong>of</strong> a photometer-colorimeter<br />
st<strong>and</strong>ard. Applied Optics, 2004. 43(13) p. 2621-2631.<br />
2. Eppeldauer, G. P., Spectral response based calibration method <strong>of</strong> tristimulus colorimeters. J. Res.<br />
<strong>NIST</strong>, 1998. 103(6): p. 615-619.<br />
3. Brown, S. W., Eppeldauer, G. P., <strong>and</strong> Lykke, K. R., <strong>NIST</strong> Facility for spectral irradiance <strong>and</strong><br />
radiance responsivity calibrations with uniform sources. Metrologia, 2000. 37: p. 579-582.<br />
4. Fryc, I., Brown, S. W., Eppeldauer, G. P., <strong>and</strong> Ohno, Y., A spectrally tunable solid-state source<br />
for radiometric, photometric, <strong>and</strong> colorimetric applications, Proc. SPIE, 2004. 5530, p. 150-159.
Eppeldauer, et al. Detector-based calibration procedures for tristimulus<br />
DETECTOR-BASED CALIBRATION PROCEDURES FOR<br />
TRISTIMULUS COLORIMETER STANDARDS<br />
ABSTRACT<br />
Two reference <strong>and</strong> three working st<strong>and</strong>ard<br />
tristimulus colorimeters have been developed<br />
at the <strong>National</strong> <strong>Institute</strong> <strong>of</strong> <strong>St<strong>and</strong>ards</strong><br />
<strong>and</strong> Technology (<strong>NIST</strong>) to utilize the recently<br />
introduced detector-based colorimeter calibration<br />
method [1]. The tristimulus colorimeters<br />
are calibrated on three reference calibration<br />
facilities <strong>of</strong> <strong>NIST</strong>. The preliminary<br />
calibration procedures are described <strong>and</strong><br />
the obtained results are evaluated. Future<br />
work to improve the uncertainty <strong>of</strong> detectorbased<br />
tristimulus color measurements is<br />
discussed.<br />
Keywords: calibration, colorimetry, color<br />
temperature, spectral responsivity, tristimulus<br />
1. INTRODUCTION<br />
At present, routine calibrations <strong>of</strong> tristimulus<br />
colorimeters are performed against lamp<br />
st<strong>and</strong>ards. The exp<strong>and</strong>ed uncertainty using<br />
the <strong>NIST</strong> primary st<strong>and</strong>ard color temperature<br />
lamp st<strong>and</strong>ards is 8 K (k=2). This<br />
source-based calibration uncertainty can<br />
increase with the burning hours <strong>of</strong> the lamp<br />
st<strong>and</strong>ards. Both the long-term stability <strong>and</strong><br />
the spectral distribution <strong>of</strong> the lamps can<br />
significantly change versus burning time.<br />
When the tristimulus colorimeter calibrations<br />
are performed against detector st<strong>and</strong>ards<br />
the uncertainty <strong>of</strong> the spectral responsivity<br />
calibrations <strong>of</strong> the colorimeter channels can<br />
dominate the color measurement uncertainty<br />
[2]. Also, long-term changes in the measurement<br />
uncertainty can be significantly decreased.<br />
The goal <strong>of</strong> this work is to utilize<br />
the advantages <strong>of</strong> the detector-based calibrations<br />
<strong>and</strong> to improve the present sourcebased<br />
color calibration uncertainty by at<br />
least a factor <strong>of</strong> two.<br />
G. P. Eppeldauer, C. C. Miller, <strong>and</strong> Y. Ohno<br />
<strong>National</strong> <strong>Institute</strong> <strong>of</strong> <strong>St<strong>and</strong>ards</strong> <strong>and</strong> Technology<br />
Gaithersburg, Maryl<strong>and</strong>, USA<br />
2. <strong>NIST</strong> TRISTIMULUS COLORIMETERS<br />
First, a silicon trap-detector based reference<br />
tristimulus colorimeter was developed [2]<br />
with a temperature controlled filter-wheel for<br />
the <strong>NIST</strong> developed four filter combinations.<br />
The second reference tristimulus colorimeter,<br />
Model F100, was a similar design but<br />
the detector was a large area single-element<br />
silicon photodiode [2]. The picture <strong>of</strong> this<br />
colorimeter, with the front cover (where the<br />
aperture is mounted) removed, is shown in<br />
Fig. 1. Five equally designed <strong>and</strong> fabricated<br />
sets <strong>of</strong> filter combinations were purchased<br />
<strong>and</strong> installed in a temperature controlled<br />
copper filter-wheel. Since the blue filter<br />
combinations (Xs <strong>and</strong> Z) had significant<br />
leakage in the near-IR, they have recently<br />
been replaced with improved-blocking filter<br />
packages. One filter set was installed in the<br />
second reference tristimulus colorimeter <strong>and</strong><br />
three sets have been installed in three additionally<br />
fabricated working st<strong>and</strong>ard colorimeters<br />
<strong>of</strong> the same design.<br />
Figure 1. Picture <strong>of</strong> the prototype singleelement-Si<br />
based colorimeter
3. <strong>NIST</strong> CALIBRATION FACILITIES<br />
Both reference colorimeters were calibrated<br />
at the Spectral Irradiance <strong>and</strong> Radiance Responsivity<br />
Calibrations using Uniform<br />
Sources (SIRCUS) facility. The colorimeter<br />
channels were calibrated for spectral irradiance<br />
responsivity. The exp<strong>and</strong>ed responsivity<br />
uncertainty goal is 0.1 % (k=2) or less.<br />
The monochromator-based Spectral Comparator<br />
Facility (SCF) was used to measure<br />
the channels <strong>of</strong> the second reference tristimulus<br />
colorimeter <strong>and</strong> the three working<br />
st<strong>and</strong>ard colorimeters for spectral power<br />
responsivity. These measurements were<br />
needed to check if the relative spectral responsivities<br />
<strong>of</strong> the corresponding channels<br />
<strong>of</strong> the four colorimeters agree. This spectral<br />
comparison is needed because the three<br />
working st<strong>and</strong>ard colorimeters will be calibrated<br />
against the second reference colorimeter<br />
in broad-b<strong>and</strong> mode. The SCF measurements<br />
were made with an exp<strong>and</strong>ed<br />
relative uncertainty <strong>of</strong> 0.2 % (k=2). The SCF<br />
measured the near-IR leakage <strong>of</strong> the filter<br />
packages to 1300 nm.<br />
The <strong>NIST</strong> Photometry Facility was used to<br />
measure the illuminance from lamp st<strong>and</strong>ards<br />
with the two reference tristimulus colorimeters.<br />
4. SPECTRAL RESPONSIVITIES<br />
After measuring the channel spectral responsivities<br />
on the SIRCUS <strong>and</strong> SCF, the<br />
results were evaluated.<br />
In the channel-responsivities <strong>of</strong> the trapdetector<br />
based colorimeter, the rejection for<br />
near-infrared radiation was about four orders<br />
<strong>of</strong> magnitude <strong>and</strong> no fluorescence<br />
could be measured.<br />
The spectral irradiance responsivity curves<br />
<strong>of</strong> the four channels <strong>of</strong> the second reference<br />
tristimuls colorimeter with the leaky blue filter<br />
combinations are shown in Fig. 2. The<br />
spectral irradiance responsivity measurements<br />
on the SIRCUS were made between<br />
360 nm <strong>and</strong> 960 nm. The SCF spectral<br />
power responsivity measurements were<br />
used to extend the responsivity curves to<br />
1300 nm, the sensitivity limit <strong>of</strong> the applied<br />
silicon detector. The logarithmic scale<br />
shows that the blue (Xs <strong>and</strong> Z) filter combinations<br />
have significant leakage in the near-<br />
IR range.<br />
The wavelength shift <strong>of</strong> the monochromator<br />
was less than 0.1 nm.<br />
The relative spectral responsivities measured<br />
on the SIRCUS <strong>and</strong> SCF were compared.<br />
As an example, Fig. 3 shows the percent<br />
differences between the SIRCUS <strong>and</strong><br />
SCF measured <strong>and</strong> then normalized spectral<br />
responses for the Y channel. The left-Y<br />
axis shows the normalized response at the<br />
peak wavelength <strong>of</strong> 555 nm. The right-Y axis<br />
shows the percent difference between the<br />
SIRCUS <strong>and</strong> SCF normalized responses.<br />
10 -1<br />
10 -2<br />
10 -3<br />
10 -4<br />
10 -5<br />
10 -6<br />
10 -7<br />
10 -8<br />
10 -9<br />
Xs<br />
Z<br />
Xl<br />
Y<br />
400 600 800 1000 1200<br />
Wavelength [nm]<br />
Figure 2. Spectral irradiance responsivities<br />
<strong>of</strong> the single-element-Si based colorimeter<br />
(F100) with the leaky blue filters.<br />
1<br />
0.8<br />
0.6<br />
0.4<br />
0.2<br />
0.5<br />
-0.5<br />
Y-channel<br />
0<br />
-1<br />
450 500 550 600 650<br />
Wavelength [nm]<br />
Figure 3. Percent differences between the<br />
SIRCUS <strong>and</strong> SCF measured <strong>and</strong> then normalized<br />
F100 spectral responses.<br />
1<br />
0
The difference curve has structures. The<br />
differences around the peak are at the 0.1 %<br />
level. However, at the sides <strong>of</strong> the curve, the<br />
structures are larger but their effect is lower.<br />
The structures originate from the SIRCUS<br />
calibrations <strong>and</strong> are caused by laser fluctuations<br />
<strong>and</strong> calibration protocol errors. Recent<br />
SIRCUS calibration procedures have been<br />
improved <strong>and</strong> results verified that spectral<br />
responsivity measurements can be performed<br />
with 0.05 % (k=2) uncertainty.<br />
The SIRCUS measured a 0.08 % higher<br />
absolute responsivity value at the 555 nm<br />
peak <strong>of</strong> the Y-channel than the SCF.<br />
The spectral responsivity <strong>of</strong> the Y-channel<br />
was re-measured at the SCF after the Y filter<br />
package was flipped over (the front surface<br />
became the back surface) in the temperature<br />
controlled filter wheel. Figure 4<br />
shows the normalized spectral responsivities<br />
before <strong>and</strong> after the flip on a log scale.<br />
An increased responsivity was measured in<br />
the blue between 380 nm <strong>and</strong> 450 nm. The<br />
responsivity increase was caused by the<br />
fluorescence <strong>of</strong> the thin cut-on filter-layer.<br />
The change in the fluorescent signal, after<br />
reversing the filter package in the filterwheel,<br />
indicates that the exciting blue-light<br />
(producing the fluorescence) is attenuated<br />
differently at the two different orientations <strong>of</strong><br />
the Y filter package. An f1’ <strong>of</strong> 1.4 % was calculated<br />
with the lower fluorescence <strong>and</strong><br />
1.7 % with the higher fluorescence for the Y<br />
channel.<br />
10 0<br />
10 -1<br />
10 -2<br />
10 -3<br />
10 -4<br />
10 -5<br />
after flipping Y-filter<br />
f1'=1.7<br />
before flipping Y-filter<br />
f1'=1.4<br />
CIE Y 1931<br />
400 450 500 550 600 650 700<br />
Wavelength [nm]<br />
Figure 4. Fluorescence caused responsivity<br />
change in the F100 Y-channel before <strong>and</strong><br />
after reversing the filter in its holder.<br />
Figure 5 shows the fluorescence caused<br />
responsivity changes in the Y-channel in a<br />
linear scale. The magnitude <strong>of</strong> the fluorescence<br />
caused contribution to the responsivity<br />
increase is not known. The increased<br />
responsivity at the original filter orientation,<br />
relative to the CIE Y 1931 function, can also<br />
be caused by the realized filter transmittance.<br />
The responsivity <strong>of</strong> the Y-channel is<br />
about 0.4 % higher (relative to the unity<br />
peak responsivity <strong>of</strong> the Y-channel) with the<br />
turned over filter compared to the original<br />
filter orientation at 410 nm. At 400 nm, at the<br />
original filter orientation, the responsivity is<br />
about 0.4 % higher than the target (Y 1931)<br />
responsivity.<br />
0.040<br />
0.035<br />
0.030<br />
0.025<br />
0.020<br />
0.015<br />
0.010<br />
0.005<br />
0.000<br />
Y channel with<br />
original filter mount<br />
Y channel responsivity<br />
after reversing filter<br />
400 450<br />
Wavelength [nm]<br />
Y 1931<br />
0.4 % difference<br />
Figure 5. Fluorescence caused responsivity<br />
change in the F100 Y-channel on a linear<br />
scale at two different filter orientations.<br />
Similar, but smaller, responsivity changes<br />
were measured in the Xs <strong>and</strong> Z channels<br />
below 400 nm. These changes were also<br />
caused by the fluorescence inside <strong>of</strong> the<br />
blue filter packages. The responsivity, after<br />
reversing the filter-package, changed from<br />
0.1 % to close to 1 % (relative to the peakresponsivity<br />
at 445 nm) at 390 nm. After the<br />
flip, the f1’ <strong>of</strong> the Z channel decreased from<br />
3.9 % to 3.8 %. The f1’ <strong>of</strong> the Xs channel,<br />
after the flip, increased from 2.9 % to 3 %.<br />
The reason <strong>of</strong> the responsivity changes is<br />
again the different attenuation <strong>of</strong> the excitation<br />
light between the two (starting <strong>and</strong> reversed)<br />
filter positions. All filter packages<br />
were used at the orientations where the responsivity<br />
increase was smaller (lower fluorescence).<br />
The f1’ <strong>of</strong> the Xl channel was<br />
4.3 % <strong>and</strong> no fluorescence could be measured.<br />
After eliminating the near-IR leakages in the<br />
blue filter combinations, the goal to achieve<br />
a 0.1 % (k=2) exp<strong>and</strong>ed relative uncertainty
for the channel spectral responsivity measurements<br />
is feasible.<br />
5. COLORIMETER CALIBRATIONS<br />
5.1 Reference colorimeters<br />
The spectral irradiance responsivities <strong>of</strong> the<br />
channels <strong>of</strong> the F100 reference colorimeter<br />
(shown in Fig. 2) were determined against<br />
two silicon tunnel-trap detectors [3]. The picture<br />
<strong>of</strong> the calibration arrangement at the<br />
SIRCUS is shown in Fig. 6. The trapdetector<br />
reference st<strong>and</strong>ards were calibrated<br />
previously against the primaryst<strong>and</strong>ard<br />
electrical-substitution cryogenicradiometer<br />
in radiant power measurement<br />
mode. The aperture areas were determined<br />
at the <strong>NIST</strong> aperture measurement facility<br />
[4]. The aperture area times the power responsivity<br />
is equal to the irradiance responsivity<br />
<strong>of</strong> the trap detector. The two reference<br />
colorimeters were calibrated against the two<br />
trap detectors in irradiance measurement<br />
mode using the detector substitution<br />
method.<br />
The (broad-b<strong>and</strong>) calibration factor <strong>of</strong> a colorimeter<br />
channel can be calculated as the<br />
ratio <strong>of</strong> the CIE tristimulus value to the<br />
measured output signal (current) <strong>of</strong> the<br />
same (realized) channel [1]:<br />
k<br />
k<br />
k<br />
X 1<br />
X 2<br />
Y<br />
X<br />
=<br />
I<br />
X<br />
=<br />
I<br />
=<br />
Y<br />
I<br />
1 K m ∫λ<br />
E(<br />
λ)<br />
x 1(<br />
λ)<br />
d<br />
=<br />
X1<br />
∫λ<br />
E(<br />
λ)<br />
s X1(<br />
λ)<br />
d<br />
λ<br />
λ<br />
2 K m ∫λ<br />
E(<br />
λ)<br />
x 2 ( λ)<br />
d<br />
=<br />
X2<br />
∫λ<br />
E(<br />
λ)<br />
s X2<br />
( λ)<br />
d<br />
K m ∫λ<br />
E(<br />
λ)<br />
V(<br />
λ)<br />
d<br />
=<br />
Y ∫λ<br />
E(<br />
λ)<br />
s Y ( λ)<br />
d<br />
λ<br />
λ<br />
λ<br />
λ<br />
Z K m ∫λ<br />
E(<br />
λ)<br />
z(<br />
λ)<br />
dλ<br />
k Z = =<br />
(1)<br />
I Z ∫λ<br />
E(<br />
λ)<br />
s Z ( λ)<br />
dλ<br />
where E(λ) is the relative spectral distribution<br />
<strong>of</strong> the reference source (which is not a<br />
st<strong>and</strong>ard in this detector-based calibration),<br />
x 1( λ)<br />
, x 2( λ)<br />
, V (λ)<br />
, <strong>and</strong> z(λ) are the CIE<br />
color matching functions, Km is the maximum<br />
spectral luminous efficacy, 683 lm/W,<br />
sX1(λ), sX2(λ), sY(λ), <strong>and</strong> sZ(λ) are the measured<br />
spectral responsivities <strong>of</strong> the realized<br />
channels (shown in Fig. 2), <strong>and</strong> λ is the<br />
wavelength. The integrals were made from<br />
360 nm to 1300 nm (involving the near-IR<br />
leakage) to correct for spectral mismatch<br />
<strong>and</strong> amplitude errors. As an example, the<br />
channel calibration factors calculated for the<br />
F100 reference colorimeter using E(λ ) =<br />
2300 K, 2856 K, <strong>and</strong> 3200 K Planckian reference<br />
distributions are shown in Table 1.<br />
The detector-based calibration factors in the<br />
Table were calculated with Planckian temperatures<br />
that are close to the color temperatures<br />
<strong>of</strong> the lamp-st<strong>and</strong>ard also measured<br />
by the F100 reference colorimeter.<br />
Figure 6. Arrangement <strong>of</strong> the two reference<br />
tristimulus colorimeters (right) <strong>and</strong> the two<br />
silicon trap-detectors (left) at the SIRCUS.<br />
Table 1. Channel calibration factors <strong>of</strong> the<br />
F100 reference tristimulus colorimeter<br />
Temp.<br />
[K]<br />
kX1 kX2 kY kZ<br />
2300 27082<br />
6<br />
5568 19225 54720<br />
2856 27182<br />
9<br />
9310 19247 59072<br />
3200 27216<br />
3<br />
10315 19252 59719<br />
Table 1 shows that kX2 <strong>of</strong> the XS blue channel,<br />
where the near-IR leakage is the highest,<br />
changed almost a factor <strong>of</strong> two for a<br />
900 K temperature change. The change in<br />
the leaky Z channel is close to 10 % for the<br />
same temperature change. The change <strong>of</strong><br />
kX1 for the Xl channel is 0.5 % <strong>and</strong> kY <strong>of</strong> the<br />
Y channel is only 0.14 % for the 900 K<br />
change <strong>of</strong> the lamp.<br />
It is expected that after eliminating the near-<br />
IR leakage <strong>of</strong> the blue filter packages, the<br />
large changes in kX2 <strong>and</strong> kZ will dramatically
decrease <strong>and</strong> one set <strong>of</strong> calibration factors,<br />
calculated with the 2856 K reference source<br />
distribution, will be enough to make wide<br />
temperature-range measurements <strong>of</strong> tungsten<br />
lamps.<br />
In order to compare the detector-based <strong>and</strong><br />
source-based color temperature calibrations,<br />
the F100 colorimeter measured a<br />
color-temperature lamp-st<strong>and</strong>ard. The<br />
measurements were made inside <strong>of</strong> a lighttight<br />
photometer bench, with two baffles between<br />
the lamp st<strong>and</strong>ard <strong>and</strong> the F100 colorimeter.<br />
From the measured output signals<br />
<strong>of</strong> the four channels, using the above calibration<br />
factors, the tristimulus values were<br />
calculated for all four channels:<br />
r<br />
r<br />
X1 = k X1I<br />
X1<br />
r<br />
r<br />
X 2 = k X 2I<br />
X 2<br />
r<br />
Y =<br />
k<br />
r<br />
YIY<br />
r<br />
r<br />
Z = k ZI<br />
Z<br />
(2)<br />
where superscript r indicates that the measurements<br />
were made with the F100 reference<br />
colorimeter.<br />
From the tristimulus values the color temperatures<br />
are calculated using iterations.<br />
First, the u’,v’ chromaticity coordinates are<br />
calculated for a range a blackbody temperatures<br />
from 1000 K to 20000 K. From the<br />
chromaticity coordinates <strong>of</strong> the test source,<br />
the distance is calculated to the blackbody<br />
curve (coordinates). The closest distance is<br />
chosen along with its neighbors. In a second<br />
step, the set <strong>of</strong> blackbody temperatures are<br />
extended to 20 points centered on the previous<br />
closest point <strong>and</strong> bounded by the<br />
neighbors. Again, the smallest distance is<br />
chosen along with its neighbors. This process<br />
is repeated four more times. The last<br />
step will calculate the correlated color temperature<br />
to within 0.01 K <strong>of</strong> the F100 measured<br />
chromaticity coordinate.<br />
The color temperatures were also determined<br />
from spectral irradiance measurements<br />
(<strong>of</strong> the same lamp) at the Facility for<br />
Automated Spectral Calibrations (FASCAL).<br />
The exp<strong>and</strong>ed relative uncertainty <strong>of</strong> the<br />
FASCAL color-temperature calibrations at<br />
2856 K is 2 K (k=2).<br />
The color temperature values obtained with<br />
the source-based lamp <strong>and</strong> detector-based<br />
F100 calibrations are shown in Table 2. The<br />
last column shows the differences at three<br />
different temperatures. The difference at<br />
2300 K is higher than at higher lamp temperatures<br />
because the near-IR leakage <strong>of</strong><br />
the blue filter-combinations plays a more<br />
significant role at the low temperature<br />
(2300 K) color measurement.<br />
The color temperature uncertainty when<br />
propagated from the FASCAL calibrated<br />
lamp st<strong>and</strong>ard to the F100 on the photometer<br />
bench (at 2856 K) increases to 8 K (k=2).<br />
The lamp was calibrated on the FASCAL at<br />
a distance <strong>of</strong> 0.5 m. When it is used in the<br />
photometer bench with a 2 m separation<br />
from the F100 colorimeter, the spatial non-<br />
Table 2. Color temperature measurements<br />
(in K) using detector-based (F100) <strong>and</strong><br />
source-based (FASCAL) calibrations.<br />
Source<br />
Based<br />
FASCAL<br />
F100<br />
ref =<br />
2300K<br />
F100<br />
ref =<br />
2856K<br />
F100<br />
ref =<br />
3200K<br />
F10<br />
0<br />
-<br />
FAS-<br />
CAL<br />
2292.9 2304.4 11.5<br />
2857.2 2862.2 5.0<br />
3198.4 3201.7 3.3<br />
uniformity <strong>of</strong> the irradiance (in the reference<br />
plane <strong>of</strong> the colorimeter) significantly<br />
changes versus lamp alignment. This spatial<br />
non-uniformity causes the large uncertainty<br />
increase in the source-based calibration <strong>of</strong><br />
the F100 colorimeter.<br />
The uncertainty goal for the detector-based<br />
reference colorimeter calibrations is 4 K<br />
(k=2).<br />
5.2 Working st<strong>and</strong>ard colorimeters<br />
The three working st<strong>and</strong>ard colorimeters are<br />
not calibrated at the SIRCUS facility to save<br />
the long <strong>and</strong> expensive calibration time.<br />
Their channels will be measured for spectral<br />
power responsivity at the SCF <strong>and</strong> then<br />
compared to the channels <strong>of</strong> the reference<br />
colorimeter. All the filter combinations <strong>and</strong><br />
the Si detectors were taken from the same<br />
batches. Before the SCF spectral responsivity<br />
measurements, it is important to check<br />
the wavelength accuracy <strong>of</strong> the monochromator<br />
to avoid responsivity errors when
measuring the steep sides <strong>of</strong> the channel<br />
responsivity curves.<br />
The working st<strong>and</strong>ard colorimeters will be<br />
calibrated against the reference colorimeter<br />
(<strong>of</strong> the same type) in broad-b<strong>and</strong> mode using<br />
the illumination from a stable 2856 K<br />
lamp. The calibration factors can be transferred<br />
from the channels <strong>of</strong> the reference<br />
colorimeter to the equivalent channels <strong>of</strong> the<br />
working st<strong>and</strong>ard (test) colorimeters by<br />
measuring the signal-ratios. The ratios give<br />
the corrections to the calibration factors <strong>of</strong><br />
the reference colorimeter to obtain the channel<br />
calibration factors for the working st<strong>and</strong>ard<br />
colorimeter. The working st<strong>and</strong>ard colorimeters<br />
are used as test colorimeters in<br />
this calibration transfer. Since a working<br />
st<strong>and</strong>ard colorimeter should measure the<br />
same tristimulus values for a CIE Illuminant<br />
A as the reference colorimeter, it can be<br />
written for the X1 channel:<br />
r t<br />
r t t<br />
X 1 X 1 = k X1I<br />
X1<br />
= k X1<br />
I X1<br />
= (3)<br />
k<br />
r<br />
t k X1I<br />
X1<br />
X1<br />
= (4)<br />
t<br />
I X1<br />
where superscript t indicates testcolorimeter<br />
which is the working st<strong>and</strong>ard in<br />
this case. The other three calibration factors<br />
<strong>of</strong> the test-colorimeter can be derived in the<br />
same way. These calibration factors also<br />
include the spectral mismatch <strong>and</strong> channelamplitude<br />
corrections. However, this scale<br />
transfer will result in low color-temperature<br />
measurement uncertainty for different<br />
source distributions if the relative spectral<br />
responsivities <strong>of</strong> the corresponding channels<br />
are very similar to each other.<br />
6. CONCLUSIONS<br />
The above described reference colorimeters<br />
<strong>and</strong> calibration considerations, with the obtained<br />
preliminary measurement results indicate<br />
that tristimulus color calibrations <strong>of</strong><br />
tungsten lamps on a detector-base can decrease<br />
the 8 K (k=2) uncertainty <strong>of</strong> traditional<br />
source-based calibrations. The<br />
achievable small f1’ values are also promising<br />
to apply the detector-based calibration<br />
method for special test sources with spectral<br />
distributions other than tungsten. In order to<br />
achieve these goals, the infrared leakage <strong>of</strong><br />
the blue filters must be dramatically decreased<br />
<strong>and</strong> the uncertainty <strong>of</strong> the meas-<br />
ured spectral responsivity data should be<br />
improved by about a factor <strong>of</strong> two.<br />
ACKNOWLEDGEMENTS<br />
The authors thank the US Air Force<br />
AFMETCAL for funding this project, <strong>and</strong> also<br />
Steve Brown, Thomas Larason, <strong>and</strong> Jeanne<br />
Houston for participating in the responsivity<br />
data evaluations.<br />
REFERENCES<br />
1. G. Eppeldauer, Spectral Response<br />
Based Calibration Method <strong>of</strong> Tristimulus<br />
Colorimeters, J. Res. Natl. Inst. St<strong>and</strong>.<br />
Technol. Vol. 103, No. 6. p. 615, 1998.<br />
2. G. Eppeldauer <strong>and</strong> Y. Ohno, Development<br />
<strong>of</strong> the <strong>NIST</strong> Detector-based Color<br />
Temperature Scale, Proc. ISCC/CIE Expert<br />
Symposium ’06 “75 Years <strong>of</strong> CIE<br />
St<strong>and</strong>ard Colorimetric Observer”, p. 55-<br />
58, CIE Central Bureau, 27, Kegelgasse,<br />
A-1030, Vienna, Austria, 2006.<br />
3. S. W. Brown, G. P. Eppeldauer, <strong>and</strong> K.<br />
R. Lykke, Facility for Spectral Irradiance<br />
<strong>and</strong> Radiance Responsivity Calibrations<br />
using Uniform Sources, Applied Optics,<br />
Vol. 45, No. 32, p. 8218-8237, 2006.<br />
4. J. Fowler <strong>and</strong> M. Litorja, Geometric area<br />
measurements <strong>of</strong> circular apertures for<br />
radiometry at <strong>NIST</strong>, Metrologia, Vol. 40,<br />
No. 1, S9-S12, 2003.<br />
AUTHORS<br />
G. P. Eppeldauer, C. C. Miller, <strong>and</strong> Y. Ohno<br />
<strong>National</strong> <strong>Institute</strong> <strong>of</strong> <strong>St<strong>and</strong>ards</strong> <strong>and</strong> Technology<br />
100 Bureau Drive<br />
Gaithersburg, Maryl<strong>and</strong> 20899, USA<br />
Phone: 301-975-2338, FAX: 301-869-5700,<br />
Email: george.eppeldauer @nist.gov
Directional error correction <strong>of</strong><br />
radiometric <strong>and</strong> photometric st<strong>and</strong>ard detectors<br />
Miklós Rácz<br />
Hungarian Academy <strong>of</strong> Sciences Research <strong>Institute</strong> for <strong>Technical</strong> Physics <strong>and</strong> Materials Science<br />
H-1525 Budapest-114, P.O.Box 49, Hungary<br />
Abstract<br />
George Eppeldauer<br />
<strong>National</strong> <strong>Institute</strong> <strong>of</strong> <strong>St<strong>and</strong>ards</strong> <strong>and</strong> Technology, Optical Technology Division<br />
Gaithersburg, MD 20899<br />
Changes in beam geometry during the calibration <strong>and</strong> subsequent testing <strong>of</strong> optical detector st<strong>and</strong>ards can cause errors<br />
which appear as uncertainties in the responsivities <strong>of</strong> the detectors. These uncertainties, caused by non-ideal detector<br />
input characteristics <strong>and</strong> changes in input beam geometry, can be decreased significantly if the detector response is<br />
always corrected to a reference beam geometry such as a collimated beam normally incident on the detector surface.<br />
An integral directional error can be determined for radiant power, luminous flux, irradiance <strong>and</strong> illuminance detectors<br />
by calculating the weighted integral <strong>of</strong> the product <strong>of</strong> the measured source radiance <strong>and</strong> the directional error over the<br />
solid angle produced by the light source. A conical directional error is introduced, <strong>and</strong> used to describe the case <strong>of</strong><br />
circular <strong>and</strong> uniform radiant sources (e.g. exit port <strong>of</strong> an integrating sphere) <strong>and</strong> circularly symmetric detectors.<br />
Evaluation <strong>of</strong> the conical directional error <strong>and</strong> the directional response correction factor, the results <strong>of</strong> directional<br />
response measurements, <strong>and</strong> directional response correction factors for practical st<strong>and</strong>ard detectors (such as<br />
diffuser-input InGaAs <strong>and</strong> integrating-sphere-input silicon irradiance meters, silicon photodiode, <strong>and</strong> pyroelectric<br />
radiant power <strong>and</strong> irradiance measuring detectors) are presented.<br />
Keywords: calibration, directional error, f2 error, conical directional error, st<strong>and</strong>ard detector<br />
1. Introduction<br />
The accuracy <strong>of</strong> primary st<strong>and</strong>ard radiometers has significantly improved in the last few years [1, 2, 3]. In order to<br />
benefit fully from these improvements, the accuracy <strong>of</strong> the derived radiometric scales needs to be improved. Greater<br />
accuracy in the scales means that some effects, formerly negligible, have become more important. One such effect is<br />
the directional response error <strong>of</strong> the detectors. At calibration the directional distribution <strong>of</strong> optical radiation (beam<br />
geometry) from a source may differ from that in subsequent tests <strong>of</strong> optical detector st<strong>and</strong>ards. These changes in beam<br />
geometry can be significant: here they are treated as equivalent to uncertainties in detector responsivity. Such<br />
uncertainties can be reduced by correcting the detector response to a reference input beam geometry. A collimated<br />
beam normally incident on the detectorsurface makes a practical choice for reference geometry. This paper introduces<br />
a conical directional error, fd(α), <strong>and</strong> a directional response correction factor, Cd, which can easily be derived from the<br />
directional error, f2(ε,ϕ), as defined by the International Commission on Illumination (CIE), for spatially uniform <strong>and</strong><br />
circularly symmetric calibration sources. [4].<br />
2. Calculation <strong>of</strong> directional response correction factor<br />
The directional response correction factor Cd <strong>of</strong> a radiometric detector is a quantity that corrects the detector response<br />
measured for the beam geometry Sb to the collimated beam response Sc:<br />
Sc = Sb Cd<br />
. (1)<br />
An integral directional error quantity f2 (defined in the CIE Publ. No 53) is given by:<br />
f = S S − 1.<br />
(2)<br />
2<br />
b c
It follows from Eqs. (1) <strong>and</strong> (2) that<br />
C = + f<br />
d<br />
1 2 . (3)<br />
References [4] <strong>and</strong> [5] describe a method for determining the directional characteristics <strong>of</strong> irradiance, illuminance, <strong>and</strong><br />
radiance meters by the directional error f2(ε,ϕ). For irradiance <strong>and</strong> illuminance meters, the CIE defined directional<br />
error is:<br />
f<br />
2<br />
( εϕ , ) =<br />
E<br />
E reading ( ε, ϕ)<br />
− 1,<br />
(4a)<br />
( ε = 0°<br />
) ⋅cosε<br />
reading<br />
where ϕ is the azimuth angle (rotation around the detector axis), <strong>and</strong> ε is the angle <strong>of</strong> incidence. Ereading(ε,ϕ) <strong>and</strong><br />
Ereading(ε=0°) are the readings for an irradiance or illuminance, E, arriving at the angles <strong>of</strong> incidence ε <strong>and</strong> 0°,<br />
respectively.<br />
As the denominator shows, the response <strong>of</strong> an ideal irradiance or illuminance meter follows the cosine function. For<br />
radiant power <strong>and</strong> directional luminous flux meters, where ideally the response is independent <strong>of</strong> the direction, the<br />
directional error f2(ε,ϕ) is:<br />
f<br />
2<br />
E<br />
( εϕ , ) =<br />
E<br />
reading<br />
reading<br />
( εϕ , )<br />
− 1.<br />
(4b)<br />
( ε = 0°<br />
)<br />
References [4] <strong>and</strong> [5] describe how to calculate the integral directional error f2 from the directional error f2(ε,ϕ). The<br />
integral directional error f2 describes the response measurement error originating from the directional error <strong>of</strong> the<br />
detector. The CIE defined integral directional error f2 for irradiance <strong>and</strong> illuminance meters is:<br />
∫ ∫<br />
f = f ( εϕ , ) ⋅L( εϕ , ) ⋅cos ε⋅dΩ L( εϕ , ) ⋅cosε⋅dΩ, (5a)<br />
2 2<br />
Ω Ω<br />
where L(ε,ϕ) is the source radiance, dΩ is the elementary solid angle, <strong>and</strong> Ω is the total acceptance solid angle (field<br />
<strong>of</strong> view) <strong>of</strong> the detector.<br />
For radiant power <strong>and</strong> directional luminous flux meters, where ideally the response is independent <strong>of</strong> the direction, the<br />
error f2 is:<br />
∫ ∫<br />
f = f ( εϕ , ) ⋅L( εϕ , ) ⋅dΩ<br />
L( εϕ , ) ⋅ dΩ.<br />
(5b)<br />
2 2<br />
Ω Ω<br />
Using only angles ε <strong>and</strong> ϕ, Eq (5a) can be written as:<br />
π / 2 2π<br />
π / 2 2π<br />
⎡<br />
⎤ ⎡<br />
⎤<br />
f2 = ∫ ⎢∫<br />
f2( εϕ , ) ⋅L( εϕ , ) ⋅cosε⋅2π⋅sin ε⋅dϕ⎥⋅dε∫⎢∫ L( εϕ , ) ⋅cosε⋅2π⋅sinε⋅dϕ⎥⋅d ε.<br />
(6)<br />
0 ⎣ 0<br />
⎦ 0 ⎣ 0<br />
⎦<br />
References [4] <strong>and</strong> [5] describe the cases where the irradiation comes from the Ω=2π hemisphere or the total Ω=4π<br />
sphere. For detector calibrations, spatially uniform <strong>and</strong> circularly symmetrical calibration sources should be used<br />
where the source center is on the optical axis <strong>of</strong> the detector. For irradiance <strong>and</strong> illuminance meter calibrations, such<br />
radiation sources can be realized with integrating spheres. The radiance or luminance <strong>of</strong> the exit port <strong>of</strong> a high-quality<br />
integrating sphere can be considered spatially uniform. In this case L(ε,ϕ)=L, for εα, where α<br />
is the half viewing angle determined by the radius <strong>of</strong> the light source (the exit port <strong>of</strong> the integrating sphere) <strong>and</strong> the<br />
distance to the aperture center <strong>of</strong> the detector.<br />
In case <strong>of</strong> spatially uniform <strong>and</strong> circularly symmetrical calibration sources, the integral directional error f2 depends on<br />
the viewing half angle α <strong>of</strong> the radiation (extended) source, that is, f2=f2(α). To avoid confusion with the CIE f2(ε,ϕ)<br />
(<strong>and</strong> later f2(ε)), we introduce the conical directional error fd(α) instead <strong>of</strong> f2(α).<br />
The conical directional error fd(α), using spatially uniform <strong>and</strong> circularly symmetrical sources, for irradiance <strong>and</strong><br />
illuminance meters is:
α 2π<br />
α 2π<br />
⎡<br />
⎤ ⎡<br />
⎤<br />
fd( α) = ∫⎢∫f2( ε, ϕ) ⋅cosε⋅2π⋅sin ε⋅dϕ⎥⋅dε ∫ ⎢∫cosε⋅2π⋅sin<br />
ε⋅dϕ⎥⋅dε . (7)<br />
0 ⎣ 0<br />
⎦ 0 ⎣ 0<br />
⎦<br />
The calculation becomes simpler if the detector directional response is also circularly symmetrical (i.e. the response is<br />
independent <strong>of</strong> azimuth angle ϕ) resulting in f2(ε,ϕ)=f2(ε). In this case, the conical directional error for irradiance <strong>and</strong><br />
illuminance meters is:<br />
α α<br />
∫ ∫<br />
f ( ) d α = f2ε ⋅ 2ε⋅dε 2ε⋅d<br />
( ) sin sin ε . (8a)<br />
0 0<br />
Similar evaluation <strong>of</strong> Eq. (5b) will result in the conical directional error for radiant power <strong>and</strong> directional luminous<br />
flux meters:<br />
α α<br />
∫ ∫<br />
d ( α) = 2 ε ⋅ ε⋅ ε ε<br />
f f ( ) sin d sin ⋅ dε . (8b)<br />
0 0<br />
For radiant power <strong>and</strong> directional luminous flux meter calibrations, where the incident beam underfills the detector<br />
aperture, the uniform source can be realized by projecting a point source onto the detector entrance with a lens.<br />
In accordance with Eq. (3), the conical directional error can be compensated for all kinds <strong>of</strong> radiometers by applying<br />
the directional response correction factor Cd:<br />
( )<br />
C = 1+ f α (9)<br />
d d<br />
3. Application <strong>of</strong> conical directional error <strong>and</strong> directional response correction factor<br />
At <strong>NIST</strong>, determination <strong>of</strong> detector directional response characteristics is done on a regular basis. Several <strong>of</strong> our<br />
measurements have been published by Eppeldauer et al. [6] <strong>and</strong> Lehman et al. [7].<br />
For practical applications, the directional response correction factor Cd is used to correct the detector response for the<br />
reference beam geometry, which is the axially incident parallel beam. Because the directional response correction<br />
factor Cd is close to unity, the conical directional error fd(α) gives better visual information.<br />
The CIE f2(ε) directional errors were measured, the conical directional errors fd(α), <strong>and</strong> the directional response<br />
correction factors Cd were calculated for a number <strong>of</strong> detector st<strong>and</strong>ards. The results <strong>of</strong> four tested detectors are<br />
summarized in table . Here, directional error curves are shown as an example for a diffuser-input InGaAs irradiance<br />
meter only. This radiometer has an InGaAs photodiode with input optics consisting <strong>of</strong> a flashed opal glass diffuser, a<br />
precision aperture, <strong>and</strong> a field-<strong>of</strong>-view limiter. The characterization <strong>of</strong> the input optics <strong>and</strong> the directional response<br />
measurement results <strong>of</strong> this irradiance st<strong>and</strong>ard have been published by Eppeldauer et al. [6]. The detector directional<br />
response characteristics were measured with an inc<strong>and</strong>escent lamp irradiation. The CIE directional error f2(ε) <strong>and</strong> the<br />
conical directional error fd(α) <strong>of</strong> the detector can be seen in figure .<br />
figure can be used to determine the directional response correction factor Cd. If the viewing half angle α <strong>of</strong> the source<br />
from the detector center is known, the value <strong>of</strong> the conical directional error fd(α) can be read from the right vertical<br />
axis. Thereafter, the directional response correction factor can be calculated using Eq. (9). The corrected detector<br />
response can be calculated from Eq. (1).
CIE directional error f 2 ( ε )<br />
0,2%<br />
0,1%<br />
0,0%<br />
-0,1%<br />
-0,2%<br />
-0,3%<br />
-0,4%<br />
f 2 ( ε )<br />
f d ( α)<br />
0 2 4 6 8 10 12<br />
Incidence angle ε <strong>and</strong> source half viewing angle α [degree]<br />
0,10%<br />
0,05%<br />
0,00%<br />
-0,05%<br />
-0,10%<br />
-0,15%<br />
-0,20%<br />
Figure 1. The directional error f2(ε) (dotted line with open circles) <strong>and</strong> the conical directional error fd(α) (solid line<br />
with black diamonds) <strong>of</strong> a diffuser input InGaAs irradiance meter. The uncertainties are less than 0.025 % for f2(ε)<br />
when ε≤6° <strong>and</strong> less than 0.023 % for fd(α) when α≤9° (k=1).<br />
Table 1. Conical directional errors fd(α) <strong>and</strong> directional response correction factors Cd <strong>of</strong> several irradiance <strong>and</strong><br />
radiant power detector st<strong>and</strong>ards for f/9 <strong>and</strong> f/4 incidence beam geometry. The relative uncertainties <strong>of</strong> the error<br />
determinations are also given, k=1.<br />
Irradiance mode Radiant flux (power) mode<br />
Detector type f/9 beam, α=3.18º f/4 beam, α=7.13º f/9 beam, α=3.18º f/4 beam, α=7.13º<br />
Sphere-input Si +0.033 %<br />
(1)<br />
±0.007 %<br />
Diffuser-input +0.055 %<br />
InGaAs<br />
±0.010 %<br />
Gold-black coated +0.036 %<br />
pyroelectric (2) ±0.046 %<br />
Si photodiode with +0.076 %<br />
window (3) ±0.033 %<br />
fd Cd fd Cd fd Cd fd Cd<br />
1.00033 +0.166 %<br />
±0.005 %<br />
1.00055 +0.081 %<br />
±0.016 %<br />
1.00036 +0.022 %<br />
±0.033 %<br />
1.00076 +0.175 %<br />
±0.026 %<br />
1.00166<br />
1.00081<br />
1.00022 -0.003 %<br />
±0.005 %<br />
1.00175 -0.009 %<br />
±0.038 %<br />
Conical directional error f d ( α)<br />
0.99997 -0.006 %<br />
±0.004 %<br />
0.99991 +0.037 %<br />
±0.026 %<br />
In addition to the InGaAs radiometer, the test results <strong>of</strong> the following detectors are summarized in table :<br />
0.99994<br />
1.00037<br />
(1) Integrating-sphere-input silicon irradiance meter. A Si photodiode was attached to the exit port <strong>of</strong> a 50 mm<br />
diameter integrating sphere. An early design <strong>of</strong> this irradiance meter has been published by Eppeldauer [8]. In the<br />
present version, a smaller (3.5 mm diameter) input aperture is used, <strong>and</strong> an additional light-tight cover is added to<br />
the housing. The directional characteristics were measured with an inc<strong>and</strong>escent lamp.<br />
(2) Pyroelectric radiant power <strong>and</strong> irradiance measuring detector. A gold black coated LiNbO3 pyroelectric detector,<br />
published by Lehman et al. [7], was further tested here. The detector has an 8 mm diameter aperture with 1 mm<br />
separation from the detector surface. The power-mode directional measurements were performed with a laser<br />
beam focused onto the detector. The irradiance-mode directional characteristics were measured with an<br />
inc<strong>and</strong>escent lamp source.<br />
(3) Silicon photodiode. The most frequently used transfer st<strong>and</strong>ards are silicon photodiodes for the near UV, visible,<br />
<strong>and</strong> near IR spectral ranges, as described by Larason et al. [9]. The directional characteristics were measured on a<br />
widely used st<strong>and</strong>ard photodiode. This device has a window in front <strong>of</strong> the circular, 1 cm 2 area photodiode. The<br />
tests were made with inc<strong>and</strong>escent lamp irradiation.<br />
The results show that even for well-designed (optimized) radiometer st<strong>and</strong>ards, the conical directional error fd(α) can
exceed the 0.1 % level (k=1). In order to achieve uncertainties below 0.1 %, application <strong>of</strong> the directional response<br />
correction factors can be necessary even for high-performance radiometer st<strong>and</strong>ards. In some cases, the uncertainties<br />
<strong>of</strong> our directional response measurements were too high to determine the directional response correction factors with<br />
the desired low uncertainty.<br />
4. Conclusions<br />
The conical directional error, fd(α), has been introduced <strong>and</strong> used to evaluate the effect <strong>of</strong> the CIE defined directional<br />
error, f2(ε,φ), for transfer st<strong>and</strong>ard radiometers. For a given incident beam geometry, fd(α), can be determined as a<br />
weighted integral <strong>of</strong> the CIE f2(ε,φ) directional error. A directional response correction factor, Cd, has also been<br />
calculated. The uncertainty budget <strong>of</strong> detector response measurements can be decreased by applying this response<br />
correction. The CIE directional error can thus be replaced by the directional response correction factor determination,<br />
which has a smaller uncertainty. The suggested calculation can be applied to all irradiance, illuminance, power, <strong>and</strong><br />
directional luminance flux meters. For the most frequently used beam geometries at the <strong>NIST</strong>, the conical directional<br />
error fd(α) ranged between +0.022 % <strong>and</strong> +0.175 % for irradiance meters, <strong>and</strong> from -0.003 % to +0.037 % for radiant<br />
power meters. In order to simplify the calculation <strong>of</strong> Cd, circularly symmetric radiometers should be designed for<br />
st<strong>and</strong>ardization. A high-accuracy measurement setup is required to determine the directional response correction<br />
factor with a small enough uncertainty for the needs <strong>of</strong> st<strong>and</strong>ards-quality detectors. The described response correction<br />
method can be applied for medium-performance detector st<strong>and</strong>ards as well.<br />
Acknowledgements<br />
The authors thank Eric L. Shirley <strong>of</strong> the <strong>NIST</strong> Optical Technology Division <strong>and</strong> Jack J. Hsia <strong>of</strong> the <strong>NIST</strong> Office <strong>of</strong><br />
International <strong>and</strong> Academic Affairs for their valuable advices, <strong>and</strong> Yuqin Zong <strong>of</strong> the <strong>NIST</strong> Optical Technology<br />
Division for helping in the directional response measurements.<br />
References<br />
1. Gentile T. R., Houston J. M., Hardis J. E., Cromer C. L., <strong>and</strong> Parr A. C., <strong>National</strong> <strong>Institute</strong> <strong>of</strong> <strong>St<strong>and</strong>ards</strong> <strong>and</strong><br />
Technology high-accuracy cryogenic radiometer, Applied Optics Vol. 35, No. 7, 1 March 1996. p. 1056-1068.<br />
2. Goebel R., Pello R., Stock K. D. <strong>and</strong> H<strong>of</strong>er H., Direct comparison <strong>of</strong> cryogenic radiometers from the BIPM <strong>and</strong><br />
the PTB, Metrologia, 1997, 34, p. 257-259.<br />
3. Köhler R, Goebel R <strong>and</strong> Pello R., Experimental procedures for the comparison <strong>of</strong> cryogenic radiometers at the<br />
highest accuracy, Metrologia, 1996, 33, p. 549-554.<br />
4. Publication CIE 53-1982 Methods <strong>of</strong> Characterizing the Performance <strong>of</strong> Radiometers <strong>and</strong> Photometers.<br />
5. Publication CIE 69-1987 Methods <strong>of</strong> Characterizing Illuminance Meters <strong>and</strong> Luminance Meters.<br />
6. Eppeldauer G., Rácz M., <strong>and</strong> Larason T., Optical characterization <strong>of</strong> diffuser-input st<strong>and</strong>ard irradiance <strong>and</strong><br />
illuminance meters, Optika’98, 14-17 Sep. 1998, Budapest, Hungary, SPIE 3573, p. 220-224, 1998.<br />
7. Lehman J., Eppeldauer G., Aust J. A., <strong>and</strong> Rácz M., Domain-engineered pyroelectric radiometer, 1999, In press.<br />
8. Eppeldauer G., Near Infrared Radiometer <strong>St<strong>and</strong>ards</strong>, Optical Radiation Measurements, 8-9 Aug. 1996, Denver,<br />
Colorado, SPIE Vol. 2815, p. 42-54, 1996.<br />
9. Larason T. C., Bruce S. S., <strong>and</strong> Parr A. C., Spectroradiometric Detector Measurements: Part I-Ultraviolet<br />
Detectors <strong>and</strong> Part II-Visible to Near-Infrared Detectors, <strong>NIST</strong> Special Publication 250-41.
THE REALIZATION AND THE DISSEMINATION OF THE<br />
DETECTOR-BASED KELVIN<br />
Howard W. Yoon, Charles E. Gibson, David W. Allen, Robert D. Saunders, Maritoni Litorja,<br />
Steven W. Brown, George P. Eppeldauer, Keith R. Lykke<br />
ABSTRACT<br />
Optical Technology Division<br />
<strong>National</strong> <strong>Institute</strong> <strong>of</strong> <strong>St<strong>and</strong>ards</strong> <strong>and</strong> Technology<br />
Gaithersburg, MD 20899<br />
USA<br />
In the International Temperature Scale <strong>of</strong> 1990 (ITS-90), temperatures above the freezing temperature <strong>of</strong> silver<br />
are determined with radiation thermometers calibrated using spectral radiance ratios to one <strong>of</strong> the Ag-, Au- or<br />
Cu-freezing temperature blackbodies <strong>and</strong> the Planck radiance law. However, due to the use <strong>of</strong> spectral radiance<br />
ratios, the temperature uncertainties <strong>of</strong> the ITS-90 increase as the square <strong>of</strong> the temperature ratios, <strong>and</strong> recent<br />
acoustic-gas thermometry measurements have also shown that the underlying thermodynamic temperatures used<br />
in the radiance ratios in determining the Ag- <strong>and</strong> Au-fixed point temperatures could be in error. Since the<br />
establishment <strong>of</strong> ITS-90, much progress has been made in the development <strong>of</strong> radiation thermometers <strong>and</strong><br />
blackbody sources. Cryogenic electrical-substitution radiometry is widely used in detector <strong>and</strong> radiometer<br />
calibrations, <strong>and</strong> stable, high-temperature metal-carbon eutectic blackbodies are under development. Radiation<br />
thermometers can be calibrated for absolute radiance responsivity, <strong>and</strong> blackbody temperatures determined from<br />
the amount <strong>of</strong> optical power without the use <strong>of</strong> any fixed points thus making possible direct dissemination <strong>of</strong><br />
thermodynamic temperatures. We show that these temperatures can be measured with lower final uncertainties<br />
than the ITS-90 derived temperatures. We have shown that these “Absolute Pyrometers” can be used to<br />
determine the thermodynamic temperatures <strong>of</strong> the ITS-90 fixed points as well as also being used in bilateral<br />
comparisons <strong>of</strong> temperature scales. Many leading national measurement institutes are already utilizing detectorbased<br />
temperatures in establishing spectroradiometric source scales. We believe, that due to these developments,<br />
the international temperature scale should be revised so that a thermodynamic temperature scale can be directly<br />
disseminated.<br />
1. INTRODUCTION<br />
The development <strong>of</strong> an international temperature scale <strong>and</strong> the periodic adjustments <strong>of</strong> the scale are<br />
attempts to disseminate <strong>and</strong> best reproduce thermodynamic temperatures. Thermodynamic<br />
temperatures can be determined by primary thermometry using equations <strong>of</strong> state which relate<br />
temperatures with measurable quantities without any temperature-dependent parameters such as in<br />
pressure-volume <strong>and</strong> acoustic gas thermometry, noise thermometry <strong>and</strong> detector-based radiation<br />
thermometry [1]. Due to the difficulties in developing facilities <strong>and</strong> performing experiments for<br />
primary thermometry, various phase transitions <strong>of</strong> material have been assigned temperatures based<br />
upon available thermodynamic temperature measurements, <strong>and</strong> these fixed-points cells <strong>and</strong><br />
blackbodies are in-turn used to calibrate secondary thermometers or sensors whose output changes in<br />
response to temperature. Almost all the national measurement institutes (NMI) rely upon a set <strong>of</strong> these<br />
fixed-points to generate the international temperature scale instead <strong>of</strong> performing their own primary<br />
thermometry, <strong>and</strong> thus the current International Temperature Scale <strong>of</strong> 1990 (ITS-90) with its system <strong>of</strong><br />
fixed-points <strong>and</strong> defining instruments is an attempt at achieving closest agreement with the<br />
thermodynamic temperature scale [2].<br />
Although there are no fundamental, inherent temperature limitations in the equations describing the<br />
relationship between measurables <strong>and</strong> thermodynamic temperatures in primary thermometry, in<br />
practice, experimental concerns limit these primary thermometers to a range <strong>of</strong> temperatures. Since
the experimental upper temperature limit for the lowest uncertainty constant-volume gas thermometry<br />
<strong>and</strong> acoustic-gas thermometry is < 900 K, these temperature limitations have impacted the higher<br />
temperatures uncertainties <strong>of</strong> the ITS-90 [3]. Due to the conflicting results <strong>of</strong> two constant-volume<br />
gas thermometry measurements, the mean <strong>of</strong> the two results were used as reference values at 743 K<br />
for radiation thermometry in determining the Al-, Ag- <strong>and</strong> Au-freezing temperatures used in the ITS-<br />
90 [1]. The latest acoustic-gas thermometry measurements have been found to be consistent with the<br />
work <strong>of</strong> Edsinger <strong>and</strong> Schooley that would conclude that the current ITS-90 assignments for the each<br />
<strong>of</strong> the high-temperature fixed-points have inherent temperature biases [4]. There have also been<br />
recent efforts in noise-thermometry in measurements <strong>of</strong> the Ag- <strong>and</strong> Pd-freezing temperatures, but the<br />
uncertainties <strong>of</strong> the noise-thermometry determinations are comparable to those assigned to the ITS-90<br />
values <strong>of</strong> these fixed points [5]. Even with new efforts in noise thermometry using super-conducting<br />
junctions to generate noise st<strong>and</strong>ards, the thermodynamic temperature uncertainties above the Agpoint<br />
are not expected to be greatly reduced below the present uncertainties [6].<br />
Detector-based radiation thermometry can used for thermodynamic temperature determinations which<br />
are applicable over a wide range <strong>of</strong> temperatures from 60 K to > 3000 K. With the development <strong>of</strong><br />
cryogenic electrical substitution radiometers (ESR), accurate measurements <strong>of</strong> optical power by<br />
comparison to electrical power resulted in the determinations <strong>of</strong> the Stefan-Boltzmann constant from<br />
total radiation thermometry [7]. As the temperatures <strong>of</strong> blackbodies are increased, spectrally-selective<br />
radiation thermometers calibrated using ESR-based radiometry can be used to determine the<br />
thermodynamic temperatures with low uncertainties using Si-diode based radiation thermometers [8].<br />
Recognizing that these detector-based radiation thermometers be used to obtain lower temperature<br />
uncertainties than ITS-90 based radiation thermometers, many leading national measurement institutes<br />
have developed calibration facilities for detector-based temperatures [9]. The needs for the lowest<br />
uncertainties in temperature > 900 K arise chiefly from the spectroradiometric community where<br />
sources are used to calibrate remote-sensing instruments.<br />
With the development <strong>of</strong> high-temperature metal-carbon <strong>and</strong> metal carbide-carbon eutectics, these<br />
stable sources can be used as fixed points for redefinition <strong>of</strong> the ITS [10]. However, for the lowest<br />
thermodynamic uncertainties needed for the scale, detector-based radiation thermometry should be<br />
used to determine the transition temperatures <strong>of</strong> the eutectics since the any practical temperature scale<br />
should be in agreement with the thermodynamic scale.<br />
Although detector-based radiation thermometry is increasingly being used in the international<br />
radiometric community, the international temperature community still utilizes the source-based ITS-90<br />
derived temperatures, leading to a possible inconsistency in the disseminated radiometric <strong>and</strong><br />
temperature scales from a common NMI. The situation is analogous to that in the photometry with the<br />
transition from the platinum-point based c<strong>and</strong>ela to the redefinition <strong>of</strong> the c<strong>and</strong>ela based upon optical<br />
power in 1979 [11]. If a general redefinition <strong>of</strong> the ITS-90 over all temperatures is not feasible or<br />
needed at the present time, then the ITS-90 above the Ag-point or perhaps above the Al-point should<br />
be redefined to reflect the maturity <strong>of</strong> detector-based radiation thermometry.<br />
In this paper, we describe the facilities <strong>and</strong> the experimental procedures in calibrating detector-based<br />
radiation thermometer traceable to a cryogenic electrical substitution radiometer. The radiation<br />
thermometer, Absolute Pyrometer 1 (AP1), has been constructed at <strong>NIST</strong> to be temporally stable <strong>and</strong><br />
is characterized for linearity, size-<strong>of</strong>-source effect (SSE) <strong>and</strong> detector-based radiance responsivity.<br />
The AP1 was used to determine the thermodynamic temperatures <strong>of</strong> the Ag- <strong>and</strong> Au-freezing<br />
temperatures <strong>and</strong> was also used for a bilateral comparison <strong>of</strong> temperature scales with the <strong>National</strong><br />
Physical Laboratory (United Kingdom) using high-temperature metal-carbon eutectic blackbodies.<br />
With these measurements, we demonstrate that primary thermometers such as the AP1 can be used to<br />
directly disseminate thermodynamic temperatures with lower uncertainties that any ITS-90 based<br />
thermometer. We describe improvements to radiation thermometer designs to reduce the SSE to<br />
< 5x10 -5 with long-term stability <strong>of</strong> the responsivity from the use <strong>of</strong> graphite reference rods in the
construction. We believe that these results along with further advances at other NMIs will result in the<br />
adoption <strong>of</strong> detector-based thermodynamic temperature scale above the Ag-freezing temperature with<br />
possible extension down to the Al-freezing temperature.<br />
2. DETECTOR-BASED RADIANCE RESPONSIVITY CALIBRATIONS<br />
Without the development <strong>of</strong> facilities to derive radiance <strong>and</strong> irradiance responsivity from electrical<br />
substitution radiometers, detector-based radiation thermometry would not be possible. Radiation<br />
thermometers can be constructed to measure irradiance or radiance, <strong>and</strong> simple filter radiometers with<br />
a precision aperture can be used to measure the irradiance <strong>of</strong> the source if the source also has a<br />
defining aperture. If the spatial uniformity <strong>of</strong> the filter radiometer is quantified, then power<br />
responsivity measurements along with the aperture area will provide the irradiance responsivity.<br />
However, typical radiation thermometers are constructed using lenses to define a target area to<br />
measure in radiance mode, <strong>and</strong> blackbody temperatures can be determined using the detector-based<br />
radiance responsivities <strong>and</strong> Planck’s law by the use <strong>of</strong><br />
ic L<br />
( λ,<br />
T ) λ<br />
= ∫ S ⋅ε<br />
⋅ L d , (1)<br />
where ic is the calculated photocurrent, SL is the radiance responsivity, <strong>and</strong> L(λ,T) is the Planck<br />
radiance law, ε is the emissivity <strong>of</strong> the blackbody. With the use Eq. 1, blackbody temperatures can be<br />
determined directly with no adjustable parameters in the measurement equation relating the radiance<br />
responsivity to the thermodynamic temperature. Since there is a unique relationship between the<br />
calculated current <strong>and</strong> the blackbody temperatures in Eq. 1, then integrations can be performed to find<br />
a match between the calculated <strong>and</strong> the measured photocurrents to determine blackbody temperatures.<br />
At <strong>NIST</strong>, the radiance <strong>and</strong> irradiance responsivities <strong>of</strong> radiometers are calibrated using the <strong>NIST</strong><br />
Spectral Irradiance <strong>and</strong> Radiance responsivity Calibrations using Uniform Sources (SIRCUS)<br />
facility [12]. Briefly, the 6-element trap detectors used in this facility are calibrated for power<br />
responsivity using the <strong>NIST</strong> High-Accuracy Cryogenic Radiometer (HACR) [13], <strong>and</strong> from the<br />
knowledge <strong>of</strong> the spatial uniformity <strong>and</strong> the precision aperture area <strong>of</strong> the trap detectors [14], the<br />
detector-based spectral irradiance responsivity is determined as shown in Fig. 1.<br />
Length <strong>St<strong>and</strong>ards</strong><br />
Aperture Area,<br />
Distance<br />
Integrating Sphere<br />
Source<br />
Filter Radiometer,<br />
Radiation Thermometer<br />
Blackbody<br />
Temperatures<br />
HACR<br />
Si-trap Detectors<br />
Figure 1. The realization chain for thermodynamic temperatures based upon detector-based radiation thermometry.
With the irradiance responsivity <strong>of</strong> the Si-trap detectors calibrated from the power responsivity, the<br />
spectral irradiance <strong>of</strong> the laser-illuminated integrating sphere source (ISS) can be determined.<br />
Knowing the distance between the Si-trap detector <strong>and</strong> the precision aperture <strong>of</strong> the ISS determines the<br />
detector-based spectral radiance <strong>of</strong> the ISS. The above procedure is repeated with changing laser<br />
wavelengths, <strong>and</strong> thus the radiance or the irradiance responsivity <strong>of</strong> the filter radiometer or the<br />
radiation thermometer can be determined. Since the radiation thermometer is calibrated as a system,<br />
knowledge <strong>of</strong> the lens transmittances in not needed, <strong>and</strong> complex radiation thermometers with many<br />
optical elements can also be calibrated in the SIRCUS facility.<br />
3.<br />
THE DESIGN AND CHARACTERIZATION OF THE AP1<br />
With<br />
very few exceptions, the performances <strong>of</strong> commercial radiation thermometers are quite limited in<br />
the temporal stability, size-<strong>of</strong>-source <strong>and</strong> optical imaging so that new types <strong>of</strong> radiation thermometers<br />
need to be constructed. A schematic <strong>of</strong> the AP1 in front <strong>of</strong> the gold-point blackbody is shown in<br />
Fig. 2. The dimension <strong>of</strong> the AP1 from outside <strong>of</strong> the front plate to the back plate is 53 cm. The<br />
optical elements are attached to three 50 cm long, 12.5 mm diameter invar rods for stability. A<br />
gradient-index singlet lens is chosen for the objective to minimize the possible scattered light from the<br />
lens interfaces <strong>and</strong> to improve the image quality. The objective distance is set at 50 cm using a fixed-<br />
Figure 2. The schematic <strong>of</strong> the AP1 in front <strong>of</strong> the gold-point blackbody.<br />
focus<br />
singlet lens distance <strong>of</strong> 33.3 cm. A 0.5 mm diameter, blackened bi-metal pinhole is used as the<br />
field stop, which results in a nominal target size <strong>of</strong> 0.75 mm diameter. The size <strong>of</strong> the target area was<br />
chosen such that tungsten-strip lamps <strong>and</strong> fixed-point blackbodies could be compared to variabletemperature<br />
blackbodies with larger cavity apertures.<br />
The<br />
re-imaging <strong>of</strong> the field stop is performed using an achromatic lens, which collimates the light.<br />
The collimated light passes through the interference filters <strong>and</strong> is incident on the 5.8 mm by 5.8 mm<br />
square Si photodiode. The spot size on the diode is estimated to be 5 mm diameter from ray-trace<br />
analysis. The spectral selection is performed using an ion-assisted deposited interference filter with<br />
center wavelength at 650 nm. The spectral selection filter is temperature stabilized near room<br />
temperature, <strong>and</strong> the hermetically sealed Si photodiode has a 2-stage thermo-electric cooler for<br />
operation at –15 °C to achieve a noise-equivalent power <strong>of</strong> 10 fW. The entire pyrometer can be<br />
purged with dry air or nitrogen to reduce effects due to humidity on the optical elements.
3.1 RADIANCE RESPONSIVITY CALIBRATION OF THE AP1<br />
The AP1 was calibrated for radiance responsivity using the <strong>NIST</strong> SIRCUS facility. The detectorbased<br />
radiance responsivity <strong>of</strong> the AP1 is shown in Fig. 3. The interference filter used in the AP1<br />
Radiance Responsivity, S L [ A/W/(cm 2 sr) ]<br />
10 -4<br />
10 -6<br />
10 -8<br />
10 -10<br />
10 -12<br />
1337.33 K<br />
10<br />
400 500 600 700 800 900 1000<br />
-14<br />
Wavelength [ nm ]<br />
Figure 3: The radiance responsivity <strong>of</strong> the AP1 measured in the SIRCUS facility plotted with the Planck radiance at<br />
1337.33 K. The center wavelength is 650 nm with a FWHM <strong>of</strong> 10 nm. The out-<strong>of</strong>-b<strong>and</strong> suppression <strong>of</strong> < 1x10 ed<br />
-7 is achiev<br />
in the wavelength region from 700 nm to 1000 nm.<br />
as < 1x10 -7 h suppression in the out-<strong>of</strong>-b<strong>and</strong> region from the peak value <strong>of</strong> the responsivity. The fullwidth<br />
at half-maximum (FWHM) <strong>of</strong> the radiance responsivity is 10 nm. The calibration <strong>of</strong> the<br />
detector-based radiance responsivity is performed with the AP1 as a system <strong>and</strong> thus any other<br />
radiation thermometer can be calibrated similarly. The total exp<strong>and</strong>ed uncertainty <strong>of</strong> the radiance<br />
responsivity is 0.15 % (k=2).<br />
3.2 DETERMINATION OF DETECTOR-BASED TEMPERATURES<br />
The calculated photocurrents from the use <strong>of</strong> Eq. 1 <strong>and</strong> the responsivity in Fig. 3 are plotted versus the<br />
respective blackbody temperatures in Fig. 4 <strong>and</strong> shows that the photocurrents range from < 10 -10 A to<br />
Photocurrent [ A ]<br />
10 -5<br />
10 -6<br />
10 -7<br />
10 -8<br />
10 -9<br />
10 -10<br />
10 -11<br />
10 -4<br />
10 -6<br />
10 -8<br />
10 -10<br />
10 -12<br />
10 -14<br />
10<br />
1000 1500 2000 2500 3000<br />
-12<br />
Temperature [ K ]<br />
Figure 4. The calculated photocurrent from the use <strong>of</strong> Eq. 1 with emissivity <strong>of</strong> 1. The temp ature <strong>of</strong> the blackbody is<br />
er<br />
determined using the relationship between the calculated photocurrent <strong>and</strong> the temperature.<br />
Spectral Radiance, L [ W/(cm 2 sr) nm ]
10 -6 A from the Ag- <strong>and</strong> Au-point temperatures to 3000 K. The range in photocurrent from the Agfreezing<br />
temperature to > 3000 K is in the linear photocurrent region for Si diodes if the radiation is<br />
not incident on the edges <strong>of</strong> the photodiode [15]. The photocurrent <strong>of</strong> < 10 -10 A near the Ag-freezing<br />
temperatures indicates the need for low noise photodiodes <strong>and</strong> preamplifiers for these measurements.<br />
3.3 LINEARITY CHARACTERIZATION OF THE AP1<br />
Since<br />
the measurement <strong>of</strong> the radiance responsivity was performed in SIRCUS using gain 8, the<br />
normalization factors to the other gains are needed if the AP1 is used at different gain settings. Instead<br />
<strong>of</strong> the traditional determination <strong>of</strong> radiometer linearity using radiation sources, the preamplifier was<br />
measured separately with a programmable constant-current source <strong>and</strong> compared to the current-tovoltage<br />
conversions using the <strong>NIST</strong> Precision Preamplifier (NPP) as shown in Table 1. The NPP is a<br />
current meter whose the nominal decade values <strong>of</strong> the feedback resistors have a tolerance <strong>of</strong> 0.01 %.<br />
The temperature coefficients <strong>of</strong> the resistances are 10x10 -6 / °C. The AP1 preamplifier was calibrated<br />
against the NPP using an input-current on/<strong>of</strong>f switch to eliminate the output <strong>of</strong>fset voltages <strong>of</strong> the test<br />
<strong>and</strong> st<strong>and</strong>ard preamplifiers. As the noise <strong>and</strong> ripple pickup was minimized in the preamplifier<br />
st<strong>and</strong>ard, the test preamplifier could be calibrated with 0.022 % (k=1) uncertainty even at gain 10.<br />
Table<br />
1: AP1 preamplifier gains determined by reference to <strong>NIST</strong> Precision Preamplifier with 0.01 % precision resistors<br />
used as feedback resistors.<br />
Gain Gain factors [V/A] Uncertainty (k=2) [%] Ratios Normalization factors to gain10 8<br />
6 1.00010E+06 0.02 10 8 /10 6 = 9.95920E+01<br />
7 1.00008E+07 0.014 10 8 /10 7 = 9.95940E+00<br />
8 9.96020E+07 0.014 10 8 /10 8 = 1.00000E+00<br />
9 9.94820E+08 0.022 10 8 /10 9 = 1.00121E-01<br />
10 9.94330E+09 0.022 10 8 /10 10 = 1.00170E-02<br />
4 . DETERMINATION OF THE AG- AND AU-FREEZING TEMPERATURES One<br />
<strong>of</strong> the most critical tests <strong>of</strong> the detector-based radiation thermometer is the comparison <strong>of</strong> the<br />
thermodynamic temperatures <strong>of</strong> the Ag- <strong>and</strong> Au-freezing temperatures to the ITS-90 [16]. If the<br />
detector-based measurements are not within the combined uncertainties <strong>of</strong> the experiment then some<br />
unknown systematic uncertainty component could be improperly assigned. The AP1 was used to<br />
compare the thermodynamic Ag- <strong>and</strong> Au-freezing temperatures to the ITS-90 assigned values [17]. A<br />
summary <strong>of</strong> the measurements is listed in Table 2.<br />
Table<br />
2. Summary <strong>of</strong> the Ag- <strong>and</strong> Au-freezing temperature determinations with the ITS-90 assignments.<br />
Freezing<br />
Material<br />
T (AP1) [ K ] Uncertainty T<br />
(AP1)<br />
[ K ] (k=2)<br />
T90 [ K ] Uncertainty T<br />
(ITS-90) [ K ]<br />
(k=2)<br />
T-T90 [ K ]<br />
Ag 1234.956 0.106 1234.93 0.080 0.026<br />
Au 1337.344 0.121 1337.33 0.100 0.014<br />
rom Table 2, the dominant uncertainty component is from the radiance responsivity uncertainty <strong>of</strong><br />
F<br />
0.15 % (k=2) which corresponds to an exp<strong>and</strong>ed temperature uncertainty <strong>of</strong> 0.121 K <strong>and</strong> 0.106 K at<br />
the Ag- <strong>and</strong> Au-freezing temperatures, respectively. Since the center wavelength <strong>of</strong> the AP1 is in the<br />
wavelength <strong>and</strong> temperature region where the Wien approximation is applicable, the uncertainty <strong>of</strong> the<br />
temperature from the uncertainty <strong>of</strong> radiance is found from the derivative <strong>of</strong> the Wien approximation,<br />
<strong>and</strong> the differences, T-T90, are found to be within the combined uncertainties.
5. COMPARISON OF NPL ITS-90 AND <strong>NIST</strong> THERMODYNAMIC TEMPERATURES<br />
The<br />
<strong>NIST</strong> thermodynamic temperature scale based on the AP1 was also used for bi-lateral comparison<br />
<strong>of</strong> temperature scales with the <strong>National</strong> Physical Laboratory (NPL), United Kingdom, using a set <strong>of</strong><br />
metal-carbon eutectics [18]. The temperatures <strong>of</strong> the eutectics were assigned at the NPL using ITS-90<br />
temperatures <strong>and</strong> then compared by transporting the crucibles to <strong>NIST</strong> for measurements with the<br />
AP1. The results are shown Fig. 5. The solid lines are the combined uncertainties <strong>of</strong> the<br />
measurements <strong>and</strong> the dotted lines are the uncertainties <strong>of</strong> the AP1 measurements. The differences are<br />
T NPL -T <strong>NIST</strong>, AP1 [ K ]<br />
1.0<br />
0.5<br />
0.0<br />
-0.5<br />
-1.0<br />
Combined uncertainties (k=2)<br />
AP1 uncertainties (k=2)<br />
1600 1800 2000 2200 2400 2600 2800<br />
Temperature [ K ]<br />
Figure 5. The differences between the NPL (ITS-90) assigned temperatures <strong>and</strong> the <strong>NIST</strong> thermodynamic temperatures <strong>of</strong><br />
the<br />
metal-carbon eutectics. The solid line is the combined temperature uncertainties <strong>and</strong> the dotted line denotes only the AP1<br />
uncertainties.<br />
within<br />
the combined uncertainties <strong>of</strong> the comparison <strong>and</strong> within the uncertainties <strong>of</strong> the detector-based<br />
temperatures as well. The uncertainties <strong>of</strong> the <strong>NIST</strong> detector-based temperature scale is about x2<br />
smaller than the ITS-90 based scale <strong>of</strong> NPL.<br />
6.<br />
NEW DESIGNS FOR RADIATION THERMOMETERS<br />
Our<br />
experience with the AP1 <strong>and</strong> further analysis <strong>of</strong> the contributions to the SSE in radiation<br />
thermometers have lead to new designs for future <strong>NIST</strong> radiation thermometers. These radiometers<br />
will be used for detector-based radiation thermometry <strong>and</strong> for ratio radiation thermometry to obtain the<br />
lowest uncertainties at temperatures to the Sn-point. A design to be used for detector-based radiation<br />
thermometry from 350 nm to 2500 nm utilizing different detectors <strong>and</strong> lenses is shown in Fig. 6. The<br />
outer case is constructed with 25 cm diameter anodized aluminum, <strong>and</strong> the large outer case is for<br />
suppression <strong>of</strong> scatter from internal reflections. The internal walls are covered with low-reflective<br />
black appliqué, <strong>and</strong> the field stop is tilted to avoid direct reflections back onto the objective lens. For<br />
temporal stability, the optical elements are attached to graphite reference rods which have low<br />
coefficient <strong>of</strong> thermal expansion. If the mechanical stability <strong>of</strong> the graphite rods are not deemed<br />
adequate, then the reference rods can be exchanged with those constructed from invar. The radiometer<br />
is also designed for removal <strong>of</strong> the objective lens from the outside for easy cleaning <strong>and</strong> replacement if<br />
the objective lens becomes damaged. Our goal for the uncertainty due to long-term stability <strong>of</strong> the<br />
radiance responsivity is 0.01 % or 100 ppm.<br />
The<br />
optical design <strong>of</strong> the radiometer has been influenced by our studies <strong>of</strong> the contributions to the<br />
SSE [19]. The main source <strong>of</strong> the SSE has been determined to be the scatter from the objective lens.<br />
The scatter can be reduced by the placement <strong>of</strong> the Lyot stop or the aperture stop behind the field stop
such that the image <strong>of</strong> the objective lens is formed on the Lyot stop by the collimating lens. The<br />
optical<br />
Figure 6. A side-view schematic <strong>of</strong> the graphite-rod referenced radiation thermometer. The outer diameter <strong>of</strong> the radiation<br />
thermometer is 25 cm.<br />
imaging<br />
<strong>and</strong> chromatic aberrations have been assessed for various different types <strong>of</strong> lenses using a<br />
commercial<br />
optical modeling s<strong>of</strong>tware. We have found that for radiation thermometry, the simplest<br />
objective lens design leads to the lowest SSE as shown in Fig. 7.<br />
SSE<br />
6.0x10 -4<br />
5.0x10 -4<br />
4.0x10 -4<br />
3.0x10 -4<br />
2.0x10 -4<br />
1.0x10 -4<br />
LP3<br />
<strong>NIST</strong><br />
0.0<br />
0 10 20 30 40 50 60<br />
Diameter [ mm ]<br />
Figure 7. A comparison <strong>of</strong> the SSE between the <strong>NIST</strong> radiation thermometer design <strong>and</strong> the LP3.<br />
In Figure 7, the optical design utilized in the <strong>NIST</strong> radiation thermometers is compared against the<br />
SSE from the Linear Pyrometer 3 (LP3)*. The simpler objective lens can lead to > 10 reduction<br />
in the<br />
SSE.<br />
Custom lens designs are being assessed to obtain both optical performance as well as low<br />
surface scatter.
8. THE DEVELOPMENT OF A FUTURE TEMPERATURE SCALE<br />
One <strong>of</strong> the dominant factors in the increase in the ITS-90 temperature uncertainties above the Agfreezing<br />
point is the lack <strong>of</strong> higher-temperature fixed points above 1400 K. Recent developments in<br />
high-temperature metal-carbon <strong>and</strong> metal-carbide-carbon eutectic blackbodies could lead to lower<br />
temperature uncertainties if the eutectic blackbodies are determined to be suitable for use as high<br />
temperature fixed-points [20]. Spectral radiances <strong>of</strong> the new metal- carbon <strong>and</strong> metal carbide-carbon<br />
eutectic blackbodies are shown along with the Au- <strong>and</strong> the Ag-fixed points in Fig. 8. For any future<br />
temperature scale to be closely in agreement with the thermodynamic scale, the temperatures <strong>of</strong> the<br />
high temperature eutectic blackbodies must be determined using absolute detector-based techniques.<br />
If radiance ratios from the Au-point temperature are used to determine the temperatures <strong>of</strong> the<br />
eutectics then the uncertainties would be unacceptably large, since the uncertainties are found by using<br />
( T )<br />
BB<br />
( TREF<br />
) 2<br />
T<br />
2 BB<br />
TREF<br />
u<br />
u = , (2)<br />
with TREF denoting the fixed point blackbody, <strong>and</strong> TBB the unknown temperature <strong>of</strong> the eutectic-point<br />
blackbody.<br />
Spectral Radiance [ μW / cm 2 nm / sr ]<br />
10 6<br />
10 5<br />
10 4<br />
10 3<br />
10 2<br />
10 1<br />
10 0<br />
10 -1<br />
10 -2<br />
365 nm<br />
TiC-C (3034 K)<br />
650 nm<br />
Au (1337 K)<br />
Al (933 K)<br />
Re-C (2747 K)<br />
Ag (1235 K)<br />
900 nm<br />
300 400 500 600 700 800 900 1000 1100<br />
Wavelength [ nm ]<br />
Figure 8. The spectral radiances <strong>of</strong> the blackbodies at the respective temperatures. The measurements <strong>of</strong> the Au- <strong>and</strong> the<br />
Ag-freezing points at 650 nm are compared with the planned measurements <strong>of</strong> the eutectic points at shorter wavelengths.<br />
However, there is still a role for ratio radiometry in the new temperature scale. If the temperature <strong>of</strong><br />
the reference fixed-point blackbody described in Eq. 2 is greater than the temperatures <strong>of</strong> the<br />
blackbodies under measurement, then the temperature uncertainties <strong>of</strong> the lower temperature<br />
blackbodies become smaller by the ratio <strong>of</strong> the squares <strong>of</strong> the respective temperatures. A possible<br />
future temperature scale could be based upon an absolute temperature determination <strong>of</strong> several hightemperature<br />
metal-carbon eutectic blackbodies ~ 3000 K with the temperatures <strong>of</strong> the lowertemperature<br />
fixed point determined using radiance ratios.<br />
Table 5 shows the temperature uncertainties both using absolute detector-based techniques <strong>and</strong><br />
radiance ratios to the TiC-C blackbody, <strong>and</strong> the uncertainties <strong>of</strong> the detector-based temperature<br />
determinations can be estimated from the derivative <strong>of</strong> the Wien approximation to Planck’s radiance<br />
law,
ΔL<br />
c2<br />
ΔT<br />
L 2<br />
T<br />
= ,<br />
λ<br />
which shows the relationship between the uncertainty in radiance, L, to the uncertainty in blackbody<br />
temperature, T, where c2 is the second Planck’s constant, <strong>and</strong> λ is the wavelength. If the temperatures<br />
<strong>of</strong> the respective blackbodies are measured at the wavelengths shown in Col. 3, then the radiance<br />
uncertainties shown in Col. 4 lead to the uncertainties in Col. 5 as found using Eq. 3. However, if the<br />
temperatures <strong>of</strong> the lower temperature fixed points are determined using radiance ratios to the TiC-C,<br />
then the temperature uncertainties decrease as in Eq. 2 thus leading to lower uncertainties as shown in<br />
Col. 6. For the lowest uncertainties in the temperature scale, both types <strong>of</strong> temperature determinations<br />
are needed to verify the assigned uncertainties in addition to the ratio radiometry based on the lowertemperature<br />
acoustic-gas thermometry.<br />
Table<br />
5. A comparison <strong>of</strong> the temperature uncertainties found using absolute detector-based techniques <strong>and</strong> radiance ratios.<br />
Radiance Detector-based Ratio to TiC-C<br />
Uncertainty Temperature Ratio Pyrometry<br />
Wavelength (%) Uncertainty (K) (K)<br />
Material Temperature (K) (nm) (k = 2) (k = 2) (k = 2)<br />
TiC-C 3034 365 0.1 0.234 ---<br />
Re-C 2748 400 0.1 0.210 0.172<br />
Cu 1357.77 650 0.1 0.083 0.042<br />
Au 1337.33 650 0.1 0.081 0.041<br />
Ag 1234.93 800 0.1 0.069 0.035<br />
Al 933.473 900 0.1 0.055 0.020<br />
Zn 692.677 1250 0.3 0.125 0.011<br />
9. DISCUSSION<br />
With the improvements in radiation thermometer designs for long-term stability <strong>and</strong> low SSE, the total<br />
radiance responsivity uncertainty in detector-based thermometry is expected to decrease to 0.1 %<br />
(k=2) in the wavelength region from 350 nm to 1000 nm. Although, even with the current design <strong>of</strong><br />
the AP1, the detector-based determinations <strong>of</strong> the Ag- <strong>and</strong> Au-freezing temperature are in agreement<br />
with the combined uncertainties, further reduced uncertainties will lead to the thermodynamic<br />
uncertainties as shown in Table 6. The present thermodynamic uncertainties in the ITS-90 assigned<br />
temperatures are listed. Although the uncertainties appear comparable, the limiting uncertainties in<br />
n oise-thermometry are due to r<strong>and</strong>om uncertainties, while the dominant uncertainties in detector-based<br />
th<br />
ermometry are due to systematic uncertainties, indicating that even lower total uncertainties are<br />
achievable with detector-based thermometry.<br />
Table 6. A comparison <strong>of</strong> the thermodynamic temperature uncertainties obtained using noise <strong>and</strong> detector-based<br />
thermometry with the current uncertainties in the ITS-90 assignments. The detector-based thermometry is determined using<br />
0.1 % (k = 2) uncertainty in the radiance responsivity at 650 nm.<br />
Metal T90 [K] T90, Thermodynamic<br />
temperature uncertainty<br />
Noise thermometry<br />
uncertainty<br />
Detector-based<br />
thermometry<br />
[mK] (k = 2)<br />
[mK] (k = 2) uncertainties [mK]<br />
(k = 2)<br />
Al 933.473 50 -- 55<br />
Ag 1234.93 80 80 68<br />
Au 1337.33 100 -- 81<br />
Cu 1357.77 120 126 83<br />
Pd 1827.95 200 212 151<br />
(3)
We have shown that detector-based thermometry can achieve comparable uncertainties to the ITS-90<br />
uncertainties near the Ag- <strong>and</strong> Au-freezing temperatures<br />
<strong>and</strong> can attain lower uncertainties than any<br />
ITS-90<br />
based radiation thermometry at higher temperatures. The promise <strong>of</strong> lower uncertainties <strong>and</strong><br />
the requirements for determining the metal-carbon eutectic transitions with the lowest uncertainties<br />
have led to efforts at NPL, PTB, NMIJ/BIPM, CSIRO <strong>and</strong> HUT, among others, to set up similar<br />
detector-based radiance responsivity calibration facilities, <strong>and</strong> with such facilities, direct<br />
disseminations <strong>of</strong> thermodynamic temperatures are possible with either calibrated radiation<br />
thermometers or secondary transfer st<strong>and</strong>ard sources.<br />
We believe that these developments will lead to a reassessment <strong>of</strong> the ITS-90 <strong>and</strong> the future<br />
international temperature scale. Since it is possible, with detector-based radiation thermometry, to<br />
directly disseminate thermodynamic temperatures, the present Ag-, Au-, Cu- <strong>and</strong> even the Al-freezing<br />
points<br />
will not remain as fixed points but will be allowed to vary within the uncertainty <strong>of</strong> the<br />
thermodynamic temperature determinations. Remaining within the framework <strong>of</strong> ITS-90 could result<br />
in higher temperature uncertainties than is possible with a detector-based scale, <strong>and</strong> <strong>NIST</strong> has already<br />
recognized the restrictions that a fixed-point scale places upon<br />
the temperature<br />
uncertainties. The<br />
current situation is analogous to the time-period<br />
when the IPTS-68 was utilized<br />
prior to ITS-90.<br />
Although the deviations from the thermodynamic temperature scale <strong>of</strong> the IPTS-68 was recognized,<br />
restrictions <strong>of</strong> a fixed-point based scale meant that<br />
the discrepancies could not be resolved without<br />
new temperatures assigned to the fixed points.<br />
Recognizing these restrictions,<br />
<strong>NIST</strong> has been<br />
detector-based since 1990 with a separate, independent, thermodynamic temperature d etermination <strong>of</strong><br />
the Au-freezing temperature [21],<br />
<strong>and</strong> with the new generation <strong>of</strong> radiation thermometers, will soon be<br />
completely detector-based. If the ITS-90 scale<br />
is desired, then correction factors can be applied to the<br />
<strong>NIST</strong> detector-based s cale for international compari sons <strong>and</strong> to c omply with mutual recognition<br />
arrangeme nts.<br />
10.<br />
CONCLUSION<br />
We<br />
show that much progress has been made toward an implementation <strong>of</strong> a detector-based<br />
thermodynamic temperature scale. The impetus for such progress has arisen from the<br />
spectroradiometric community <strong>and</strong> the need for the lowest-uncertainty temperature measurements <strong>of</strong><br />
the new metal-carbon eutectic blackbodies. These detector-based primary radiation thermometers<br />
have been used to determine the Ag- <strong>and</strong> Au-freezing temperatures <strong>and</strong> even for bilateral comparison<br />
<strong>of</strong> temperature scales. With continuing efforts at many different NMIs, direct dissemination <strong>of</strong><br />
thermodynamic temperatures will be possible in the near future. We believe that a reassessment <strong>of</strong> the<br />
ITS-90 is needed to reflect the developments in detector-based radiation thermometry.<br />
REFERENCES<br />
* Certain commercial equipment, instruments, or materials are identified in this paper to foster<br />
underst<strong>and</strong>ing. Such identification does not imply recommendation or endorsement by the <strong>National</strong><br />
<strong>Institute</strong> <strong>of</strong> <strong>St<strong>and</strong>ards</strong> <strong>and</strong> Technology, nor does it imply that the material or equipment are necessarily<br />
the best available for the purpose.<br />
[1] Quinn T. J., Temperature, 2 nd ed., London, Academic Pre ss Ltd., 1990.<br />
[2] Preston-Thomas H., “The International Temperature Scale <strong>of</strong> 1990 (ITS-90)”, Metrol ogia 27,<br />
1990,<br />
pp.<br />
3-10.<br />
[3] Re f [1] pp.<br />
56-57.<br />
[4] Str ouse G. F., Defibaugh D. R., Moldover M. R., Ripple D. C., ”Progress in primary acoustic<br />
thermome try at <strong>NIST</strong>: 273 K to 50 5 K”, TMCSI, Vol. 7, Chicago, edited by Ripple D. C., 2003,
pp. 31-36.<br />
[5] Edler F., Kühne M., Tegeler E., ”Noise Thermometry above 960 °C”, Proceedings <strong>of</strong> TEMPMEKO<br />
1999,<br />
Delft, edited by Dubbeldam J. F., de Groot, M. J., 1999, pp. 394 -399.<br />
[6] Nam S. W., Benz S. P., Martinis J. M., Dresselhaus P., Tew W. L., White D. R., ”A Ratiometric<br />
Method for Johnson Noise Thermometry Using a Quantized Voltage Noise Source”, TMCSI, Vol. 7,<br />
Chicago, edited by Ripple D. C., 2003, pp. 37 -42.<br />
[7] Quinn T. J., Martin, J. E., ”A radiometric determination <strong>of</strong> the Stefan-Boltzmann constant <strong>and</strong><br />
thermodynamic temperatures between -40 °C <strong>and</strong> +100<br />
°C”, Philosophical Transactions <strong>of</strong> the Royal<br />
Society <strong>of</strong> London A 316, 1985, pp. 85 -189.<br />
[8] Allen D. W., Saunders R. D., Johnson B. C., Gibson C. E., Yoon H. W., “The Development <strong>and</strong><br />
Characterization <strong>of</strong> an Absolute Pyrometer Calibrated for Radiance Responsivity”, TMCSI, Vol. 7,<br />
Chicago, edited by Ripple D. C., 2003, pp. 577 -582<br />
[9] Fox N. P., Metrologia 32, 1995/1996, pp. 535 -543.; Taubert D. R., Hartmann J., Holl<strong>and</strong>t J., Fischer J.,<br />
”Investigation <strong>of</strong> the Accuracy <strong>of</strong> the ITS-90 with Reference to Thermodynamic Temperature in the<br />
Range from 400 °C up to 600 °C”, TMCSI, Vol. 7, Chicago, edited by Ripple D. C., 2003, pp. 7 –12.<br />
[10] Yamada Y., Sakate H., Sakuma F., Ono A., “A Possibility <strong>of</strong> Practical High Temperature Fixed Points<br />
above the Copper Point, Proceedings <strong>of</strong> TEMPMEKO1999, Delft, edited by Dubbeldam J. F., de Groot,<br />
M. J., 1999, pp. 535 -540.<br />
[11] Blevin W. R., <strong>and</strong> Steiner B., “Redefinition <strong>of</strong> the C<strong>and</strong>ela <strong>and</strong> Lumen”, Metrologia 11, 1975, pp. 97-<br />
104.<br />
[12] Brown S. W., Eppeldauer G. P., Lykke K. R., “<strong>NIST</strong> Facility for Spectral Irradiance <strong>and</strong> Radiance<br />
Responsivity Calibrations with Uniform Sources”, Metrologia 37, 2000, pp. 579-582.<br />
[13] Gentile T. R., Houston J. M., Cromer C. L., “<strong>National</strong> <strong>Institute</strong> <strong>of</strong> <strong>St<strong>and</strong>ards</strong> <strong>and</strong> Technology Highaccuracy<br />
Cryogenic Radiometer”, Appl. Opt. 35, 1996, pp. 4392-4403.<br />
[14] Fowler J. <strong>and</strong> Litorja M., “Geometric Area Measurements <strong>of</strong> Circular Apertures for Radiometry at<br />
<strong>NIST</strong>”, Metrologia 40, 2003, pp. S9-S12.<br />
[15] Battuello M., Bloembergen P., Girard F., Ricolfi, “A Comparison <strong>of</strong> Two Methods for Measuring the<br />
Nonlinearity <strong>of</strong> Infrared Radiation Thermometers”, Temperature: Its Measurement <strong>and</strong> Control in<br />
Science <strong>and</strong> Industry, Vo l. 7, edited<br />
by D. C. Ripple, 2003, pp. 613-618.<br />
[16] Yoon H. W., Allen D. W., Gibson C. E., Litorja M., Saunders R. D., Brown S. W., Eppeldauer G. P.,<br />
Lykke K. R., “Temperature Determination <strong>of</strong> the Ag- <strong>and</strong> Au-freezing points using a Detector-based<br />
Radiation Thermometer”, submitted to the Proceedings <strong>of</strong> Tempmeko 2004, Croatia, 2004.<br />
[17] Ref. [1] p. 59.<br />
[18] Machin G., Gibson C. E., Low D., Allen D.W., Yoon H.W., “A Comparison <strong>of</strong> ITS-90 <strong>and</strong> Detectorbased<br />
Scales between NPL <strong>and</strong> <strong>NIST</strong> Using Metal-carbon Eutectics ”, submitted to the Proceedings <strong>of</strong><br />
Tempmeko 2004, Croatia, 2004.<br />
[19] Yoon H.W., Allen D.W. Saunders R.D., “Methods to reduce the size-<strong>of</strong>-source effect in radiation<br />
thermometers”, submitted to the Proceedings <strong>of</strong> Tempmeko 2004, Croatia, 2004.<br />
[21] Bloembergen P., Yamada Y., Yamamoto N., Hartmann J., “Realizing the High-temperature<br />
Part <strong>of</strong> a<br />
Future ITS with the Aid <strong>of</strong> Eutectic Metal-Carbon Fixed Points”, Temperature: Its Measurement <strong>and</strong><br />
Control in Science <strong>and</strong> Industry, Vol. 7, edited by D. C. Ripple, 2003, pp. 291-296.<br />
[21] Mielenz K.<br />
D., Saunders R. D., Shumaker J. B., “Spectroradiometric Determination <strong>of</strong> the Freezing<br />
Temperature <strong>of</strong> Gold”, J. Res. Natl. Inst. St<strong>and</strong>. Technol. 95, 1990, pp. 45-67.<br />
Ad dress <strong>of</strong> the Principal Author: Howard W. Yoon, Optical Technology Division, <strong>NIST</strong>, 100 Bureau Drive<br />
Gaithersburg,<br />
MD 20899-8441, USA, tel. (301) 610-0094, fax (301) 869-5700, e-mail: hyoon@nist.gov
Thermodynamic-temperature determinations <strong>of</strong> the Ag<br />
<strong>and</strong> Au freezing temperatures using a detector-based<br />
radiation thermometer<br />
Howard W. Yoon, David W. Allen, Charles E. Gibson, Maritoni Litorja, Robert D. Saunders,<br />
Steven W. Brown, George P. Eppeldauer, <strong>and</strong> Keith R. Lykke<br />
The development <strong>of</strong> a radiation thermometer calibrated for spectral radiance responsivity using cryogenic,<br />
electrical-substitution radiometry to determine the thermodynamic temperatures <strong>of</strong> the Ag- <strong>and</strong> Aufreezing<br />
temperatures is described. The absolute spectral radiance responsivity <strong>of</strong> the radiation thermometer<br />
is measured in the <strong>NIST</strong> Spectral Irradiance <strong>and</strong> Radiance Responsivity Calibrations using Uniform<br />
Sources (SIRCUS) facility with a total uncertainty <strong>of</strong> 0.15% �k � 2� <strong>and</strong> is traceable to the electrical watt,<br />
<strong>and</strong> thus the thermodynamic temperature <strong>of</strong> any blackbody can be determined by using Planck radiation<br />
law <strong>and</strong> the measured optical power. The thermodynamic temperatures <strong>of</strong> the Ag- <strong>and</strong> Au-freezing<br />
temperatures are determined to be 1234.956 K ��0.110 K� �k � 2� <strong>and</strong> 1337.344 K ��0.129 K� �k � 2�<br />
differing from the International Temperature Scale <strong>of</strong> 1990 (ITS-90) assignments by 26 mK <strong>and</strong> 14 mK,<br />
respectively, within the stated uncertainties. The temperatures were systematically corrected for the<br />
size-<strong>of</strong>-source effect, the nonlinearity <strong>of</strong> the preamplifier <strong>and</strong> the emissivity <strong>of</strong> the blackbody. The<br />
ultimate goal <strong>of</strong> these thermodynamic temperature measurements is to disseminate temperature scales<br />
with lower uncertainties than those <strong>of</strong> the ITS-90. These results indicate that direct disseminations <strong>of</strong><br />
thermodynamic temperature scales are possible. © 2007 Optical Society <strong>of</strong> America<br />
OCIS codes: 120.6780, 120.3940.<br />
1. Introduction<br />
The measurements <strong>of</strong> temperature can be classified<br />
into primary <strong>and</strong> secondary thermometry. 1 Primary<br />
thermometry is defined as determining thermodynamic<br />
temperatures using equations <strong>of</strong> state <strong>and</strong> physical constants<br />
without any adjustable temperature-dependent<br />
parameters; some examples are constant-volume gas<br />
thermometry, 2 speed-<strong>of</strong>-sound measurements in<br />
gases, 3 or noise thermometry. 4 Primary measurements<br />
based on the measurements using gases, however,<br />
are limited in temperature range owing to the<br />
deviation <strong>of</strong> the gas from ideal behavior <strong>and</strong> other<br />
experimental limitations, 5 <strong>and</strong> noise thermometry is<br />
limited by the need for long measurement times required<br />
for sufficient statistical precision. 6<br />
The authors are with the Optical Technology Division, <strong>National</strong><br />
<strong>Institute</strong> <strong>of</strong> <strong>St<strong>and</strong>ards</strong> <strong>and</strong> Technology, Gaithersburg, Maryl<strong>and</strong><br />
20899-8441, USA. H. Yoon’s e-mail address is hyoon@nist.gov.<br />
Received 14 November 2006; accepted 18 December 2006; posted<br />
17 January 2007 (Doc. ID 77061); published 1 May 2007.<br />
0003-6935/07/152870-11$15.00/0<br />
© 2007 Optical Society <strong>of</strong> America<br />
2870 APPLIED OPTICS � Vol. 46, No. 15 � 20 May 2007<br />
Since primary thermometers are not easily transportable<br />
<strong>and</strong> are difficult to use, secondary thermometers<br />
are used as transfer devices. Because <strong>of</strong> the<br />
difficulties in maintaining primary thermometers for<br />
routine calibrations, the International Temperature<br />
Scale <strong>of</strong> 1990 (ITS-90) assigns fixed values for the<br />
phase-transition temperatures <strong>of</strong> various pure materials<br />
based upon the best thermodynamic temperature<br />
determinations available at the time <strong>of</strong><br />
specifying the scale. 7 Secondary interpolating thermometers<br />
are based upon these fixed points, <strong>and</strong><br />
the assigned temperatures are ultimately traceable<br />
to primary thermometers through the fixed points.<br />
Some examples <strong>of</strong> secondary thermometers are st<strong>and</strong>ard<br />
platinum resistance thermometers <strong>and</strong> thermocouples.<br />
Another type <strong>of</strong> primary thermometer is the total<br />
<strong>and</strong> the spectral radiometer, calibrated using electrical<br />
substitution radiometry <strong>and</strong> used in conjunction<br />
with a blackbody. Such total radiometers in the past<br />
have determined the Stefan–Boltzmann constant using<br />
the wavelength integrated Planck’s radiance law<br />
to a relative combined uncertainty <strong>of</strong> 0.013%. 8 If only<br />
a narrow spectral region is selected by the use <strong>of</strong><br />
spectral filters, then the spectral radiometer can be
used to determine the temperatures <strong>of</strong> blackbodies<br />
with the use <strong>of</strong> Planck’s radiation law within the<br />
spectrally selected region.<br />
In the past, detector-based radiance temperature<br />
measurements have been performed using filter<br />
radiometers calibrated for spectral irradiance responsivity.<br />
9 These filter radiometers with precision<br />
apertures are typically used in nonimaging applications<br />
to measure the temperatures <strong>of</strong> blackbodies,<br />
but such optical flux techniques are difficult to use<br />
to measure the fixed-point blackbodies with subcentimeter<br />
diameter cavity openings. The nonimaging<br />
radiometers are used to measure spectral irradiance<br />
using double-aperture flux transfer techniques, <strong>and</strong><br />
the small, 1 cm internal apertures <strong>of</strong> fixed-point blackbodies<br />
make it difficult to define a source aperture.<br />
Such techniques can also result in large uncertainties<br />
in the diffraction corrections needed from the use <strong>of</strong> the<br />
small defining apertures. However, small aperture<br />
blackbodies can be measured by using imaging radiometers<br />
in which the field stop defines the area <strong>of</strong><br />
measurement. In the past, absolute imaging radiometers<br />
or pyrometers have been constructed from filter<br />
radiometers by using a lens with a measured transmittance,<br />
10 but similar component-based calibrations<br />
cannot be used with low final uncertainties if a number<br />
<strong>of</strong> optical elements such as lenses <strong>and</strong> filters are introduced<br />
into the optical path.<br />
The ultimate goal <strong>of</strong> detector-based radiance temperatures<br />
is the direct dissemination <strong>of</strong> thermodynamic<br />
temperatures without the use <strong>of</strong> physical<br />
artifacts such as fixed-point blackbodies. Such a transition<br />
occurred for the definition <strong>of</strong> the c<strong>and</strong>ela in<br />
1979 when it was changed from being derived from<br />
the Pt-freezing point to that <strong>of</strong> optical power, 11 <strong>and</strong><br />
the uncertainties in the realization <strong>of</strong> the c<strong>and</strong>ela can<br />
be improved with the development <strong>of</strong> new detectors<br />
<strong>and</strong> procedures.<br />
In this work, measurements <strong>of</strong> the thermodynamic<br />
temperatures <strong>of</strong> the Ag- <strong>and</strong> Au-freezing points using<br />
the <strong>NIST</strong> Absolute Pyrometer (AP1) are described in<br />
which the radiation thermometer is calibrated at the<br />
system level. The AP1 is designed <strong>and</strong> constructed at<br />
the <strong>NIST</strong> <strong>and</strong> is calibrated for radiance responsivity<br />
as a system using a cryogenic, electrical-substitution<br />
radiometer-based method. The characterization <strong>of</strong><br />
the AP1 for size-<strong>of</strong>-source effect <strong>and</strong> linearity are de-<br />
scribed, <strong>and</strong> the measured temperatures are corrected<br />
for these systematic effects. The thermodynamic temperatures<br />
are compared to the previous temperature<br />
measurements <strong>and</strong> found to be in agreement within<br />
the combined uncertainties. This work demonstrates<br />
that the thermodynamic temperatures can be directly<br />
disseminated in this range using detector-based calibrations<br />
with comparable or lower uncertainties than<br />
that <strong>of</strong> the ITS-90.<br />
2. Experimental Section<br />
A. Description <strong>of</strong> the Absolute Pyrometer<br />
A schematic <strong>of</strong> the AP1 in front <strong>of</strong> the gold-point<br />
blackbody is shown in Fig. 1. The dimension <strong>of</strong> the<br />
AP1 from outside <strong>of</strong> the front plate to the back plate<br />
is 53 cm. The optical elements are attached to three,<br />
50 cm long, 12.5 mm diameter Invar rods for structural<br />
stability with a low-temperature coefficient <strong>of</strong><br />
expansion. The radiometer uses an on-axis design with<br />
a plano–convex singlet lens �focal length � 20 cm� for<br />
the front objective with the aperture stop (AS) in<br />
front <strong>of</strong> the lens. For the objective lens, a gradientindex<br />
singlet lens was chosen to minimize the possible<br />
scattered light from the lens interfaces <strong>and</strong> to<br />
improve the image quality. The 50 mm diameter objective<br />
lens is set at a fixed object distance <strong>of</strong> 50.0 cm<br />
with the field stop (FS) at an image distance <strong>of</strong><br />
33.3 cm. A 0.5 mm diameter blackened bimetal aperture<br />
is used as the field stop, which results in a<br />
nominal target size <strong>of</strong> 0.75 mm diameter. The actual<br />
field <strong>of</strong> view was measured by raster scanning a<br />
source with a small 10 �m pinhole aperture. The size<br />
<strong>of</strong> the target area was chosen such that tungsten-strip<br />
lamps <strong>and</strong> fixed-point blackbodies could be compared<br />
to variable-temperature blackbodies with larger cavity<br />
opening apertures.<br />
The reimaging <strong>of</strong> the field stop is performed using<br />
a gradient-index achromatic lens (RL), which collimates<br />
the light. The light passing through the interference<br />
filters (IF) is collimated, <strong>and</strong> no further lenses<br />
are used between the filters <strong>and</strong> the 5.8 mm by<br />
5.8 mm square Si photodiode (PD) with the diode<br />
suppression <strong>of</strong> the near-infrared power responsivity.<br />
The spot size on the diode is estimated to be 5 mm<br />
diameter from the ray-trace analysis. The spectral<br />
selection is performed using ion-assisted-deposited<br />
Fig. 1. (Color online) Schematic <strong>of</strong> the AP1 placed in front <strong>of</strong> the gold-point blackbody. The aperture stop (AS), field stop (FS), relay lens<br />
(RL), interference filter (IF), <strong>and</strong> the photodiode (PD) are shown.<br />
20 May 2007 � Vol. 46, No. 15 � APPLIED OPTICS 2871
interference filters 12 with the center wavelengths at<br />
650 nm for at least 10 �7 suppression <strong>of</strong> the responsivity<br />
in the out-<strong>of</strong>-b<strong>and</strong> region to 1100 nm. The spectral<br />
selection filter is temperature stabilized using a<br />
thermoelectric (TE) cooler near room temperature,<br />
<strong>and</strong> the hermetically sealed Si photodiode has a twostage<br />
TE cooler for operation at �15 °C to achieve a<br />
noise-equivalent power (NEP) <strong>of</strong> �10 fW. The AP1<br />
can be purged with dry air or nitrogen to reduce<br />
effects attributable to humidity on the interference<br />
filters.<br />
B. Radiance Responsivity Calibration <strong>of</strong> the Absolute<br />
Pyrometer<br />
The AP1 was calibrated for absolute radiance responsivity<br />
using the <strong>NIST</strong> Spectral Irradiance <strong>and</strong> Radiance<br />
Responsivity Calibrations using Uniform Sources<br />
(SIRCUS) facility 13 as illustrated in the sequence <strong>of</strong><br />
measurements in Figs. 2(a)–2(d). The optical power <strong>of</strong><br />
the power-stabilized <strong>and</strong> collimated laser source is<br />
measured using a cryogenic electrical substitution radiometer,<br />
the <strong>NIST</strong> Primary Optical Power Radiometer<br />
(POWR) in Fig. 2(a). Since the POWR is difficult to<br />
use on a daily basis, the power responsivity is transferred<br />
to six-element Si-trap detectors in Fig. 2(b).<br />
From the knowledge <strong>of</strong> the spatial uniformity <strong>and</strong> the<br />
area <strong>of</strong> the precision defining aperture on the trap<br />
detectors, the detector-based spectral irradiance responsivity<br />
is determined. The laser is input into an<br />
integrating sphere to obtain a spatially uniform <strong>and</strong><br />
Lambertian source in Fig. 2(c), <strong>and</strong> the spectral irradiance<br />
<strong>of</strong> the source is determined using the Si-trap<br />
detector. The spatial uniformity at the exit aperture <strong>of</strong><br />
the integrating sphere is mapped to determine the<br />
uncertainties attributable to the nonuniformity <strong>of</strong><br />
the sphere. The power-stabilized laser is transmitted<br />
through a fiber, which is agitated in a water-filled ultrasonic<br />
bath. The rapid vibrations in the ultrasonic<br />
bath remove the laser speckle in the sphere output<br />
since the integration times <strong>of</strong> the detectors are much<br />
longer than the time duration <strong>of</strong> the speckle pattern. A<br />
small 38.1 mm diameter integrating sphere is used to<br />
increase the throughput <strong>of</strong> the sphere, <strong>and</strong> the 5 mm<br />
diameter exit port <strong>of</strong> the integrating sphere source is<br />
chosen to approximate the 6 mm diameter opening <strong>of</strong><br />
the fixed-point blackbody cavities. With precision apertures<br />
on both the output port <strong>of</strong> the integrating<br />
sphere <strong>and</strong> the entrance <strong>of</strong> the Si-trap detector combined<br />
with the knowledge <strong>of</strong> the distance separating<br />
the sphere <strong>and</strong> the trap detector, the monochromatic<br />
spectral radiance <strong>of</strong> the integrating sphere can be<br />
assigned from the detector-calibrated irradiance responsivity<br />
<strong>of</strong> the trap detector. The aperture area <strong>and</strong><br />
the distance measurement device are traceable to<br />
length st<strong>and</strong>ards. The AP1 is then calibrated for spectral<br />
radiance responsivity by substitution with the<br />
trap detector as shown in Fig. 2(d). Once the monochromatic,<br />
spectral radiance <strong>of</strong> the integrating-sphere<br />
source is known, any radiometer or radiation thermometer<br />
can be calibrated at the system level. The<br />
procedure is repeated at other wavelengths until the<br />
full spectrum <strong>of</strong> the radiance responsivity is obtained.<br />
The detector-based radiance responsivity <strong>of</strong> the<br />
AP1 is shown along with the spectral radiance <strong>of</strong><br />
the gold-point blackbody in Fig. 3. The interference<br />
filter used in the AP1 shows �1 � 10 �7 suppression<br />
in the out-<strong>of</strong>-b<strong>and</strong> region relative to the peak value<br />
<strong>of</strong> the responsivity. The FWHM <strong>of</strong> the radiance responsivity<br />
is 10 nm with the centroid wavelength <strong>of</strong><br />
649.115 nm. The total exp<strong>and</strong>ed uncertainty <strong>of</strong> the<br />
radiance responsivity at a single wavelength is<br />
0.15% �k � 2�.<br />
Fig. 2. (Color online) Procedure for detector-based spectral radiance responsivity calibrations with the use <strong>of</strong> the electrical substitution<br />
radiometer. (a) Measurement <strong>of</strong> the spectral power <strong>of</strong> the laser with the cryogenic electrical substitution radiometer; (b) determination <strong>of</strong><br />
the spectral power responsivity <strong>of</strong> the Si-trap detector; (c) measurement <strong>of</strong> the spectral irradiance <strong>of</strong> the integrating sphere source; (d)<br />
determination <strong>of</strong> the radiance responsivity <strong>of</strong> the radiation thermometer as a system.<br />
2872 APPLIED OPTICS � Vol. 46, No. 15 � 20 May 2007
Fig. 3. (Color online) Radiance responsivity <strong>of</strong> the AP1 measured in the SIRCUS facility plotted with the Planck radiance at 1337.33 K.<br />
The center wavelength is 650 nm with a FWHM <strong>of</strong> 10 nm. The out-<strong>of</strong>-b<strong>and</strong> suppression <strong>of</strong> �1 � 10 �7 is achieved in the wavelength region<br />
from 700 to 1000 nm.<br />
The wavelength spacing between calibrations was<br />
decreased near the peak <strong>of</strong> the spectral responsivity<br />
since interference effects from interreflections can<br />
lead to oscillations in the spectral responsivity, which<br />
are wavelength dependent, as seen in Fig. 4. The<br />
sources <strong>of</strong> the interference effects are from the remaining<br />
coherence <strong>of</strong> the laser through the integrat-<br />
Fig. 4. (Color online) Spectral radiance responsivity near the peak<br />
<strong>of</strong> the responsivity function showing the interference fringes. The<br />
fringes arise from the interference <strong>of</strong> the radiation with the planar<br />
reflective surfaces in the AP1. The presences <strong>of</strong> the fringes require<br />
measurements at sufficient wavelength intervals to resolve them.<br />
ing sphere source combined with the interreflections<br />
between the optical elements in the radiation thermometer.<br />
Although an effort was made to reduce the<br />
interference effects by designing the optical filter<br />
with a 5° tilt <strong>of</strong> one <strong>of</strong> the surfaces from the optical<br />
axis, the interference effects are evident as �1% peak<br />
oscillations <strong>of</strong> the responsivity. Since the radiation<br />
thermometer is used to measure the radiance from a<br />
blackbody, which is an incoherent source, the convolved<br />
radiance will not exhibit the interference effects,<br />
<strong>and</strong> the interference effects in the radiance<br />
responsivity will depend on the spatial coherence <strong>of</strong><br />
the incident radiation. The increase in the uncertainties<br />
attributable to the interference effects can be<br />
minimized by performing measurements at closely<br />
spaced wavelength intervals.<br />
The thermodynamic temperatures <strong>of</strong> blackbodies<br />
are found from the radiance responsivity <strong>and</strong> Planck’s<br />
law by the use <strong>of</strong><br />
i c ��S LL��, T�d�, (1)<br />
where ic is the calculated photocurrent, SL is the absolute<br />
radiance responsivity, <strong>and</strong> L��, T� is the spectral<br />
radiance given by Planck radiance law. Planck<br />
radiance law is<br />
L��, T� � c1L n 2 � 5<br />
1<br />
, (2)<br />
exp�c2��n�T�� � 1<br />
20 May 2007 � Vol. 46, No. 15 � APPLIED OPTICS 2873
Fig. 5. (Color online) Calculated photocurrent as a function <strong>of</strong> the<br />
blackbody temperature. The calculation is performed with no adjustable<br />
parameters.<br />
where c 1L <strong>and</strong> c 2 are the first <strong>and</strong> second radiation<br />
constants, T is the thermodynamic temperature, � is<br />
the wavelength <strong>of</strong> the radiation in air, <strong>and</strong> n is the<br />
refractive index. For these calculations, the CODATA<br />
values 14 for the radiation constants <strong>and</strong> the refractive<br />
index <strong>of</strong> air <strong>of</strong> n � 1.00029 were utilized.<br />
There are no adjustable parameters in the measurement<br />
equation relating the radiance responsivity<br />
<strong>of</strong> the AP1 to the thermodynamic temperature, <strong>and</strong><br />
Eq. (2) can be used to generate a curve <strong>of</strong> photocurrent<br />
to blackbody temperatures. The one-to-one relationship<br />
is shown in Fig. 5. The photodiode used in<br />
the AP1 is operated in the photovoltaic mode without<br />
any bias voltages, <strong>and</strong> this type <strong>of</strong> photodiode in the<br />
photovoltaic mode has been shown to be linear over a<br />
wide dynamic range. 15 The range <strong>of</strong> calculated photocurrents<br />
<strong>of</strong> the AP1 are from 1 � 10 �11 A at the Ag<br />
point to 1 � 10 �6 A near 3000 K, which is in the linear<br />
regime for photodiodes. The plot in Fig. 5 also indicates<br />
the need for low-noise current-to-voltage amplifiers to<br />
measure the low photocurrents near the Ag- <strong>and</strong> Aufreezing<br />
temperatures. Other corrections such as the<br />
size-<strong>of</strong>-source effect, the nonlinearity <strong>of</strong> the preamplifier,<br />
<strong>and</strong> the emissivity <strong>of</strong> the blackbody will be applied<br />
as corrections to the measured photocurrents before<br />
comparison to the calculated photocurrents in Fig. 5.<br />
The relationship between photocurrent <strong>and</strong> blackbody<br />
temperatures can be fit with an interpolation function<br />
16 to facilitate conversions from signals to temperatures.<br />
3. Instrumental Characterizations <strong>of</strong> the Absolute<br />
Pyrometer<br />
A. Gain Linearity<br />
To reduce the uncertainties in the linearity corrections,<br />
the same preamplifier was used for both AP1<br />
calibrations <strong>and</strong> the temperature determinations.<br />
The SIRCUS calibrations were performed at a gain <strong>of</strong><br />
2874 APPLIED OPTICS � Vol. 46, No. 15 � 20 May 2007<br />
Table 1. AP1 Preamplifier Gain Corrections Measured 11 June 2002<br />
Gain<br />
Gain Factors<br />
[V�A]<br />
6 1.00010 � 10 6<br />
7 1.00008 � 10 7<br />
8 9.96020 � 10 7<br />
9 9.94820 � 10 8<br />
10 9.94330 � 10 9<br />
Uncertainty<br />
(k � 2)<br />
[%] Ratios<br />
Normalization<br />
Factors to Gain<br />
10 8<br />
0.02 10 8 �10 6 � 9.9592 � 10 1<br />
0.014 10 8 �10 7 � 9.9594<br />
0.014 10 8 �10 8 � 1.0000<br />
0.022 10 8 �10 9 � 1.0012 � 10 �1<br />
0.022 10 8 �10 10 � 1.0017 � 10 �2<br />
10 8 V�A. If the AP1 is used with any other gain setting<br />
on the preamplifier, then the gain normalization<br />
factors to the 10 8 V�A gain are needed to compare<br />
the measurements at the different gains. These gain<br />
factors were measured at the beginning <strong>of</strong> the study<br />
<strong>and</strong> the values used through the measurements.<br />
Since the gain factor nonlinearities primarily arise<br />
from the deviation <strong>of</strong> the feedback resistance values<br />
from their precision stated values, the resistances<br />
values are not expected to change during the operational<br />
lifetime <strong>of</strong> the radiation thermometer. The<br />
gain factors for the AP1 preamplifier were determined<br />
by comparison to the <strong>NIST</strong> Precision Preamplifier<br />
(NPP) with 0.01% precision resistors used as<br />
feedback resistors, <strong>and</strong> the gain correction factors are<br />
listed in Table 1. These gain factors can also be obtained<br />
by the use <strong>of</strong> a stable radiation source such as<br />
a light-emitting diode whose intensity can be varied<br />
by neutral density filters. A programmable-current<br />
source was used to provide constant current for the<br />
ratio measurements between the AP1 preamplifier<br />
<strong>and</strong> the NPP. The linearity <strong>of</strong> the NPP <strong>and</strong> the AP1<br />
preamplifier depends upon the accuracy <strong>of</strong> the electrical<br />
resistance measurements as compared to the<br />
optical linearity characterizations used for other radiation<br />
thermometers. Since the AP1 is used at gain<br />
10 10 V�A to10 8 V�A, the normalization factors are<br />
found by using ratios <strong>of</strong> gains <strong>and</strong> are found to be<br />
1.00170 � 10 �2 ��0.022% �k � 2��. The linearity <strong>of</strong><br />
the Si diode in the AP1 was not measured separately<br />
since the Si diode has been demonstrated to have<br />
linear response over a 14-decade ratio <strong>of</strong> photocurrents.<br />
15<br />
B. Size-<strong>of</strong>-Source Effect Characterization<br />
Since the integrating sphere source used for the<br />
detector-based spectral radiance responsivity calibration<br />
<strong>and</strong> the Ag- <strong>and</strong> Au-freezing temperature blackbody<br />
have different spatial distributions, systematic<br />
corrections are needed. The size-<strong>of</strong>-source effect was<br />
characterized by using two different techniques. First,<br />
the point-spread function <strong>of</strong> the AP1 was measured<br />
using a 10 �m diameter pinhole aperture, which was<br />
illuminated by a laser diode centered at 650 nm. A<br />
microscope objective was used to collect the collimated<br />
radiation from the laser diode <strong>and</strong> made incident<br />
on the pinhole. The 10 �m source was translated<br />
on the x <strong>and</strong> y axis stages in 100 �m steps at the<br />
object plane <strong>of</strong> the AP1, <strong>and</strong> the point-spread function<br />
determined, as shown in Fig. 6. The FWHM was
Fig. 6. (Color online) Spatial responsivity <strong>of</strong> the AP1 measured<br />
using an illuminated 10 �m pinhole scanned across the object<br />
plane.<br />
determined to be 0.78 mm ��0.01 mm� with a difference<br />
between 10% <strong>and</strong> 90% <strong>of</strong> the peak value <strong>of</strong><br />
0.11 mm ��0.01 mm�. The measured spot size is in<br />
agreement with the expected spot size based on geometric<br />
optics.<br />
Since the point-spread function determines only<br />
the optical imaging quality <strong>of</strong> the AP1, a large-area,<br />
radiance source was used to determine the size-<strong>of</strong>source<br />
effect (SSE). The AP1 was characterized for<br />
SSE using a LED illuminated radiance source with a<br />
5 mm diameter conical, central obscuration using the<br />
so-called indirect technique. The outer diameter <strong>of</strong><br />
the source was changed with a variable-diameter iris.<br />
The SSE is plotted in Fig. 7 using<br />
��d, do� � v�L, d� � v�L, do� , (3)<br />
v�L�<br />
where d is the diameter <strong>of</strong> the uniform radiance<br />
source, d o is the diameter <strong>of</strong> the central obscuration,<br />
<strong>and</strong> L is the radiance <strong>of</strong> the source. The signal measured<br />
while viewing the unobstructed radiance source<br />
Fig. 7. (Color online) SSE measured for the AP1 using an LED<br />
radiance source with a 5 mm diameter central obscuration.<br />
Fig. 8. (Color online) Spatial scans <strong>of</strong> the Au-freezing temperature<br />
blackbody during the freeze for use in SSE corrections.<br />
is v�L�, <strong>and</strong> the signal measured while viewing the<br />
central obscuration with the diameter <strong>of</strong> the radiance<br />
source, d, isv�L, d�. The signal measured with<br />
the diameter <strong>of</strong> the variable aperture at the diameter<br />
<strong>of</strong> the central obscuration, d o,isv�L, d o�.<br />
With knowledge <strong>of</strong> the SSE using a uniform source,<br />
the SSE must be corrected for the nonuniform blackbody<br />
source by spatial scans during the freeze. The<br />
spatial scans <strong>of</strong> the Au-freezing temperature blackbody<br />
is shown in Fig. 8. The scans were performed<br />
with the AP1 on a motorized stage while the Au-point<br />
blackbody was in the freeze plateau. Since the electrical<br />
heating is reduced during the freeze, there is<br />
contrast observed between the central cavity <strong>and</strong> the<br />
surrounding graphite crucible seen as a reduction in<br />
the signal past 7 mm.<br />
The SSE corrections for the Ag <strong>and</strong> Au freezes were<br />
determined using the spatial distribution <strong>of</strong> the radiance<br />
from Fig. 8 measured by scanning the AP1<br />
convolved with the SSE measurements shown in Fig.<br />
7 along with Eq. (3) according to<br />
���r, r o� �� i<br />
L���<br />
L o �<br />
�� i��, r o�<br />
�� ���, (4)<br />
where a modified SSE, ��, is found from the product<br />
<strong>of</strong> the differential increase in the SSE, �� i, <strong>and</strong> the<br />
measured relative radiance distribution as a function<br />
<strong>of</strong> the radius, L���. Since the Ag <strong>and</strong> Au furnaces<br />
utilize the same designs <strong>and</strong> components, the spatial<br />
scans <strong>of</strong> the Au-point furnace was also used to correct<br />
the Ag-point furnace.<br />
4. Blackbody Design<br />
The physical diagram <strong>of</strong> the blackbody <strong>and</strong> the furnace<br />
is shown in Fig. 9. The graphite crucible is held<br />
in an alumina tube with an argon purge at the rear.<br />
The alumina tube is placed in a Na-heatpipe liner<br />
constructed from Inconel 601 for temperature uniformity<br />
<strong>and</strong> is sealed except for the front opening. The<br />
20 May 2007 � Vol. 46, No. 15 � APPLIED OPTICS 2875
Fig. 9. Schematic <strong>of</strong> the <strong>NIST</strong> furnace showing the (1) graphite cavity <strong>and</strong> the (2) crucible, which is surrounded by the (3) cylindrical heat<br />
pipe, which is heated by the (4) semicylindrical heater elements. The alumina tube separates the crucible from the Inconel liner, <strong>and</strong> the<br />
argon purge enters from the rear <strong>and</strong> exits at the front opening <strong>of</strong> the furnace to reduce oxidation <strong>of</strong> the graphite elements.<br />
heatpipe is heated using two cylindrical heaters that<br />
surround the heatpipe, <strong>and</strong> the alumina tube separates<br />
the crucible from the heatpipe to avoid possible<br />
contamination <strong>of</strong> the pure metal in the crucible from<br />
the Inconel heatpipe liner. The remaining space in<br />
the furnace is filled with fiberglass-insulation material,<br />
<strong>and</strong> the outer jacket is water cooled. Both the Ag<strong>and</strong><br />
Au-freezing points utilize the same furnace <strong>and</strong><br />
crucible designs. The temperature uniformity <strong>of</strong> the<br />
crucible is increased with the use <strong>of</strong> graphite spacer<br />
rings, which restrict the field <strong>of</strong> view to f�6. The temperature<br />
<strong>of</strong> the crucible is monitored for electrical<br />
heating with a thermocouple encased in a fused-silica<br />
holder in contact with the rear <strong>of</strong> the crucible. The<br />
furnace is operated as a two-level power control with<br />
different constant-current levels to either initiate the<br />
melt from the solid or to initiate the freeze from the<br />
melt.<br />
A detailed view <strong>of</strong> the crucible is shown in Fig. 10.<br />
The crucible is constructed <strong>of</strong> graphite <strong>and</strong> filled with<br />
1.3 kg <strong>of</strong> high-purity (99.999% mass fraction) gold.<br />
Although the opening <strong>of</strong> the blackbody can be made<br />
smaller than a 6 mm diameter with graphite apertures,<br />
none were used during these measurements.<br />
The emissivity <strong>of</strong> the blackbody was determined using<br />
Monte Carlo calculations 17 based upon the geometry<br />
shown in Fig. 10, <strong>and</strong> the calculated emissivities<br />
are listed in Table 2 for graphite emissivity <strong>of</strong> 0.86<br />
(col. 2) <strong>and</strong> 0.80 (col. 3), showing the relative insen-<br />
Fig. 10. (Color online) Design <strong>of</strong> the Ag- <strong>and</strong> Au-freezing temperature<br />
crucibles. The graphite crucible is operated inside a furnace<br />
with Na-heatpipe liner for temperature uniformity. The conical<br />
cavity has an apex angle <strong>of</strong> 57°.<br />
2876 APPLIED OPTICS � Vol. 46, No. 15 � 20 May 2007<br />
sitivity <strong>of</strong> the emissivity calculation with initial conditions.<br />
The graphite surface is expected to increase<br />
in emissivity with increasing operational hours owing<br />
to surface roughening, <strong>and</strong> thus the higher<br />
graphite emissivity value was used for this study. A<br />
uniform temperature distribution was assumed for<br />
the calculations with the emissivity <strong>of</strong> graphite <strong>of</strong><br />
0.86 at room temperature. 18 These calculated emissivities<br />
are in agreement with experimental measurements<br />
19 <strong>and</strong> with other calculations. 20<br />
5. Summary <strong>of</strong> Systematic Corrections to Absolute<br />
Pyrometer<br />
The correction factors listing the dominant systematic<br />
corrections to the AP1 signals are listed in Table<br />
3. The AP1 signals were corrected prior to the application<br />
<strong>of</strong> Eq. (1) by using<br />
i � G �<br />
� i m, (5)<br />
where i m is the measured photocurrent, i is the corrected<br />
photocurrent, G is the gain correction, � is the<br />
emissivity, <strong>and</strong> � is the SSE correction. The corrected<br />
photocurrent can then be directly compared to the<br />
calculated photocurrents in Fig. 5. The gain correction<br />
factor is the normalization factor <strong>of</strong> gain 10 10 to<br />
gain 10 8 as shown in Table 1 since the responsivity<br />
calibrations were performed at gain 10 8 while the Ag<strong>and</strong><br />
Au-freezing temperatures were measured at gain<br />
10 10 . The SSE correction will have the effect <strong>of</strong> reduc-<br />
Table 2. Calculated Emissivity <strong>of</strong> the Graphite Blackbody Cavity with<br />
50 mm Depth <strong>and</strong> 57° Conical Bottom <strong>and</strong> ��650 nm with Two<br />
Different Initial Conditions for the Graphite Emissivity<br />
Aperture<br />
Diameter<br />
[mm]<br />
Emissivity with<br />
Graphite Emissivity<br />
��0.86<br />
Emissivity with<br />
Graphite Emissivity<br />
��0.80<br />
6.0 0.99964 0.99943<br />
2.0 0.99996 0.99993<br />
1.5 0.99998 0.99996<br />
1.0 0.99999 0.99998
Table 3. Systematic Correction Factors to the AP1 Signal<br />
Type <strong>of</strong> Correction Gain, G Emissivity, � SSE, �<br />
Signal correction factor 1.0017 0.99964 0.99963<br />
Uncertainty (k � 2) 0.022% 0.02% 0.02%<br />
ing the measured signal since the responsivity calibration<br />
was used with a 5 mm diameter opening <strong>of</strong><br />
the integrating sphere source with no other source<br />
<strong>of</strong> radiation outside the opening. The emissivity <strong>of</strong><br />
blackbodies will also reduce the radiance, <strong>and</strong> thus<br />
compensation can be made using Eq. (5).<br />
6. Measurements <strong>of</strong> the Ag <strong>and</strong> Au Melts <strong>and</strong> Freezes<br />
The Au-freezing temperatures were measured over a<br />
2 week period from 15 May 2003 to 28 May 2003.<br />
Since the blackbody power supply can be operated<br />
under computer control, measurements were made<br />
over a 24 h period for each <strong>of</strong> the runs listed in Tables<br />
4 <strong>and</strong> 5. A representative Au melt <strong>and</strong> freeze temperature<br />
measurement is shown in Fig. 11. Here the<br />
operation <strong>of</strong> the furnace is briefly described. Since the<br />
heatpipe furnace liner provides temperature uniformity<br />
over the length <strong>of</strong> the blackbody cavity, the<br />
furnace is operated with two-level constant-current<br />
control <strong>of</strong> the furnace power supply for inducing either<br />
the melting or the freezing transition. The temperature<br />
<strong>of</strong> the blackbody is held initially at approximately<br />
15 K below the melting temperature, <strong>and</strong> then the<br />
melting transition is induced by ramping the current<br />
to approximately 9 A <strong>and</strong> then holding the current at<br />
that level. The time response <strong>of</strong> the furnace is much<br />
slower than the change in the current due to the thermal<br />
capacity <strong>of</strong> the furnace. The temperature rises up<br />
to the melting temperature <strong>and</strong> then is made constant<br />
until all the metal is melted. If there are temperature<br />
gradients in the furnace or impurities in the pure<br />
metal, then the rapid temperature rise above the melting<br />
temperature is expected to be rounded or less<br />
sharp. After the metal has completely melted with the<br />
temperature <strong>of</strong> the molten metal at approximately<br />
20 K above the transition temperature, the current is<br />
lowered to approximately 5 A, inducing the freeze. The<br />
temperature <strong>of</strong> the molten metal decreases until the<br />
supercool, <strong>and</strong> the freezing transition occurs at slightly<br />
higher temperatures from the supercool. The time duration<br />
<strong>of</strong> the freeze plateau is typically 20 min, <strong>and</strong> the<br />
duration <strong>of</strong> the freeze plateau depends on the amount<br />
<strong>of</strong> the metal, the furnace parameters, <strong>and</strong> the power<br />
supply setting, among other parameters.<br />
Table 4. Summary <strong>of</strong> the Au-Freezing Temperature Measurements<br />
Date No. <strong>of</strong> Freezes<br />
Temperature<br />
[K]<br />
T-T 90<br />
[K]<br />
15 May 2003 12 1337.372 0.042<br />
23 May 2003 12 1337.329 �0.001<br />
28 May 2003 10 1337.332 0.002<br />
Average 1337.344 0.014<br />
Table 5. Summary <strong>of</strong> the Ag-Freezing Temperature Measurements<br />
Date No. <strong>of</strong> Freezes<br />
Temperature<br />
[K]<br />
T-T 90<br />
[K]<br />
3 June 2003 9 1235.010 0.080<br />
9 June 2003 8 1234.901 �0.029<br />
Average 1234.956 0.026<br />
A more detailed view <strong>of</strong> the melts <strong>and</strong> freezes with<br />
an exp<strong>and</strong>ed temperature scale is shown in Fig. 12.<br />
The melts <strong>and</strong> freezes are plotted with the thermodynamic<br />
temperature scale from the AP1, <strong>and</strong> a line<br />
at the ITS-90 temperature shows the agreement between<br />
the detector-based scale <strong>and</strong> the ITS-90. Slight<br />
temperature differences <strong>of</strong> 20 mK are observed between<br />
the melting <strong>and</strong> the freezing temperatures. We<br />
believe that these differences are attributable to the<br />
temperature gradients in the furnace since the differences<br />
between the melting <strong>and</strong> freezing temperatures<br />
became �2 mK with a new heatpipe liner <strong>and</strong><br />
heating elements. The gradual increase in the freezing<br />
temperatures is attributable to the drift in the<br />
dark current in the preamplifier <strong>of</strong> the AP1 <strong>and</strong> is not<br />
caused by changes in the Au-freezing temperature.<br />
The dark current correction to the signal was measured<br />
only at the beginning <strong>of</strong> the cycles, <strong>and</strong> the same<br />
correction was applied to the following melt <strong>and</strong> freeze<br />
cycles. At the high gains <strong>of</strong> 10 10 V�A used for these<br />
measurements, the circuit in the transimpedance amplifier<br />
could be susceptible to room-temperature drift<br />
or humidity changes, <strong>and</strong> dark-current corrections for<br />
each melt <strong>and</strong> freeze transition led to a reduction in the<br />
temperature drift <strong>of</strong> less than 10 mK in later studies.<br />
For each freeze, as shown in Fig. 13, a mean temperature<br />
was determined with the uncertainties attributable<br />
to the averaging process estimated to be less than<br />
5 mK. The noise-equivalent temperature at the Aufreezing<br />
temperature is less than 3 mK leading to a<br />
noise-equivalent power <strong>of</strong> �4 fW. The summaries <strong>of</strong><br />
Fig. 11. (Color online) Repeat temperature cycle <strong>of</strong> melts <strong>and</strong><br />
freezes <strong>of</strong> the Au-point blackbody measured with the AP1 showing<br />
the melt, slight supercool, <strong>and</strong> the freeze.<br />
20 May 2007 � Vol. 46, No. 15 � APPLIED OPTICS 2877
Fig. 12. (Color online) Plot <strong>of</strong> the melts <strong>and</strong> freezes <strong>of</strong> the Au point on an exp<strong>and</strong>ed temperature scale. The slight drift in the temperatures<br />
is attributable to the changes in the dark signal <strong>of</strong> the AP1.<br />
the all the Ag- <strong>and</strong> Au-freezing temperature measurements<br />
are shown in Figs. 14 <strong>and</strong> 15, respectively, along<br />
with the ITS-90 temperatures <strong>and</strong> associated uncertainties.<br />
The discussion <strong>of</strong> the uncertainties <strong>of</strong> the measurements<br />
must start from the initial uncertainties<br />
arising from the initial realization to the cryogenic<br />
electrical substitution radiometer in the <strong>NIST</strong><br />
SIRCUS facility, <strong>and</strong> the component uncertainties<br />
are listed in Table 6. The component uncertainties<br />
arise from the individual transfers <strong>and</strong> steps as<br />
shown in Fig. 2. The two largest components, lines 4<br />
<strong>and</strong> 7, are attributable to the spatial uniformity <strong>and</strong><br />
the uniformity <strong>of</strong> the angular output <strong>of</strong> the integrating<br />
sphere <strong>and</strong> the long-term stability <strong>of</strong> the trap<br />
detectors. Since the windows in the multielement diode<br />
trap detectors are removed to above the multiple<br />
reflections between the windows <strong>and</strong> the diode surfaces,<br />
the power responsivities <strong>of</strong> the diodes can<br />
Fig. 13. (Color online) Representative Au melt <strong>and</strong> freeze temperatures<br />
measured using the AP1. The slight positive slope in the<br />
melt <strong>and</strong> the negative slope in the freeze is likely attributable to<br />
the size-<strong>of</strong>-source effect <strong>of</strong> the AP1.<br />
2878 APPLIED OPTICS � Vol. 46, No. 15 � 20 May 2007<br />
change owing to contamination or surface damage.<br />
The final total uncertainty leads to the uncertainties<br />
in Table 7. Additional information on the uncertainties<br />
in the detector-based realizations can be found in<br />
Ref. 13.<br />
The individual uncertainties are listed in Table 7 as<br />
a percentage <strong>of</strong> the signals <strong>and</strong> then converted to temperature<br />
uncertainties. The dominant contribution to<br />
the exp<strong>and</strong>ed temperature uncertainties is the uncertainty<br />
in the radiance responsivity <strong>of</strong> 0.15% �k � 2�.<br />
Since the center wavelength <strong>of</strong> the AP1 is in the<br />
wavelength <strong>and</strong> temperature region where the Wien<br />
approximation is applicable, the uncertainty <strong>of</strong> the<br />
temperature from the uncertainty <strong>of</strong> radiance is<br />
found from the derivative <strong>of</strong> the Wien approximation<br />
dL<br />
L � c2 �<br />
dT<br />
2 , (6)<br />
T<br />
Fig. 14. (Color online) Summary <strong>of</strong> the Au-point measurements<br />
with the AP1 with the line indicating the ITS-90 assigned<br />
temperature.
Fig. 15. (Color online) Summary <strong>of</strong> AP1 measurements <strong>of</strong> the Ag<br />
point along with the ITS-90 assigned temperature.<br />
where L is the radiance, � is the centroid wavelength,<br />
T is the temperature, <strong>and</strong> c 2 is the second radiation<br />
constant.<br />
7. Discussion<br />
Our detector-based Ag- <strong>and</strong> Au-freezing temperatures<br />
are in agreement with the measurements <strong>of</strong> Fox<br />
et al. 21 who also used a detector-based filter radiometer<br />
to measure the Ag- <strong>and</strong> Au-freezing temperatures to be<br />
1235.009 K ��0.088 K� <strong>and</strong> 1337.330 K ��0.098 K�<br />
respectively. The differences between our temperature<br />
determinations <strong>and</strong> the earlier results by Fox<br />
et al. 21 are within the combined uncertainties. The<br />
Au-freezing temperature is also in agreement with<br />
the detector-based measurements <strong>of</strong> Mielenz et al. 22<br />
Our results are also in agreement with the ITS-90<br />
temperatures. The ITS-90 temperature assignments <strong>of</strong><br />
the respective freezing temperatures are primarily<br />
from the ratio pyrometry work <strong>of</strong> Jung <strong>and</strong> Fischer 23<br />
with radiance ratios taken from a lower temperature<br />
blackbody at 730 K. The thermodynamic temperature<br />
<strong>of</strong> the blackbody was assigned from two conflicting<br />
constant-volume gas thermometry measurements 24<br />
with differences <strong>of</strong> 30 mK at 730 K. Since the difference<br />
could not be resolved at the assignments <strong>of</strong> the<br />
ITS-90 fixed points, a decision was made to compro-<br />
Table 6. Total Uncertainty <strong>of</strong> the Spectral Radiance Responsivity<br />
Calibrations in the <strong>NIST</strong> SIRCUS Facility Broken Down into the<br />
Component Uncertainties<br />
SIRCUS Uncertainty Components (k � 1) Type<br />
1 Trap a responsivity B 0.025%<br />
2 Aperture areas B 0.004%<br />
3 Distance B 0.010%<br />
4 Sphere spatial <strong>and</strong> angular uniformity B 0.050%<br />
5 Amplifier gain A 0.010%<br />
6 Temperature coefficient <strong>of</strong> trap B 0.003%<br />
7 Temporal stability <strong>of</strong> trap B 0.050%<br />
Combined st<strong>and</strong>ard uncertainty (k � 1) 0.076%<br />
Exp<strong>and</strong>ed total uncertainty (k � 2) 0.153%<br />
a Trap refers to the Si-diode trap detector used for the realization.<br />
Table 7. Uncertainty Components for the Ag- <strong>and</strong> Au-Freezing<br />
Temperature Measurements<br />
Signal Uncertainty Component<br />
[%] (k � 2) Ag Au<br />
1 Spectral radiance responsivity 0.15 0.15<br />
2 Temporal stability <strong>of</strong><br />
responsivity<br />
0.03 0.03<br />
3 Plateau identification 0.01 0.01<br />
4 Emissivity 0.02 0.02<br />
5 Nonlinearity 0.022 0.022<br />
6 Dark current drift 0.03 0.03<br />
7 Size-<strong>of</strong>-source effect 0.02 0.02<br />
Total uncertainty in signal 0.16 0.16<br />
Temperature uncertainty<br />
[K] (k � 2)<br />
0.110 0.129<br />
mise between the two results <strong>and</strong> agree upon a compromise<br />
<strong>of</strong> 15 mK at 730 K, or half the value <strong>of</strong> the<br />
30 mK difference. Since the uncertainties in temperature<br />
increase as<br />
�Ta � T 2<br />
a<br />
2<br />
Tb �Tb, (7)<br />
where �T a <strong>and</strong> �T b are the uncertainties <strong>of</strong> the blackbody<br />
at temperatures T a <strong>and</strong> T b, the resulting thermodynamic<br />
temperature <strong>of</strong>fset at 1337 K resulting<br />
from ratio pyrometry is expected to be 50 mK.<br />
In addition to the thermodynamic temperature<br />
uncertainties, the uncertainties in realizing a temperature<br />
scale using fixed points include uncertainties<br />
due to material purity, emissivity <strong>of</strong> the cavity,<br />
furnace-temperature uniformity, <strong>and</strong> furnace operation.<br />
Even if the fixed point is filled initially with<br />
ultrapure �99.999%� metal, the metal in the blackbody<br />
can become contaminated due to operations at<br />
high temperatures, <strong>and</strong> any contamination will suppress<br />
the freezing temperature. To have reproducible<br />
<strong>and</strong> stable freeze plateaus, the furnace should have<br />
a uniform temperature distribution. The electrical<br />
power heating <strong>of</strong> the furnace also has to be optimized<br />
to achieve reproducible <strong>and</strong> flat freeze plateaus. The<br />
dependence <strong>of</strong> the freezing temperature on the impurities<br />
<strong>and</strong> the operational parameters can lead to<br />
realization uncertainties <strong>of</strong> 50 mK �k � 2�, 24 <strong>and</strong> temperature<br />
scale comparisons can require side-by-side<br />
operation <strong>of</strong> the respective fixed points to achieve<br />
lower temperature uncertainties.<br />
The transition to detector-based radiance temperatures<br />
would lead to better agreement with thermodynamic<br />
temperatures <strong>and</strong> lead to direct dissemination<br />
<strong>of</strong> thermodynamic temperatures. This transition would<br />
be in accordance with the movement to having defined<br />
quantities or fixed values for the fundamental<br />
constants as the basis for the SI units instead <strong>of</strong> fixed<br />
artifacts as has already occurred for the c<strong>and</strong>ela in<br />
1979. The dissemination <strong>of</strong> detector-based temperatures<br />
would also result in having a common basis, the<br />
electrical watt <strong>and</strong> length units, for photometric, ra-<br />
20 May 2007 � Vol. 46, No. 15 � APPLIED OPTICS 2879
diometric, <strong>and</strong> temperature scales possibly leading to<br />
a resolution <strong>of</strong> any inconsistencies in the national<br />
scales. The uncertainties in the SIRCUS-based radiance<br />
responsivity calibrations are expected to be near<br />
0.05% �k � 2� in the near future with more frequent<br />
cryogenic radiometer realizations <strong>and</strong> finer wavelength<br />
intervals in the realized wavelengths. The resulting<br />
temperature uncertainty at the Au-freezing<br />
temperatures from such improvements is expected to<br />
result in �50 mK �k � 2� uncertainties.<br />
8. Conclusions<br />
The thermodynamic temperatures <strong>of</strong> the Ag- <strong>and</strong><br />
Au-freezing temperatures are determined to be<br />
1234.956 K ��0.110 K �k � 2�� <strong>and</strong> 1337.344 K<br />
��0.129 K �k � 2�� differing from the ITS-90 assigned<br />
values <strong>of</strong> 1234.93 K ��80 mK �k � 2�� <strong>and</strong><br />
1337.33 K ��90 mK �k � 2�� by 26 mK <strong>and</strong> 14 mK,<br />
respectively. The temperatures are in agreement<br />
with the thermodynamic temperature uncertainties<br />
<strong>of</strong> the ITS-90 assigned values. The temperatures<br />
were systematically corrected for the size-<strong>of</strong>-source<br />
effect, the linearity <strong>of</strong> the preamplifier, <strong>and</strong> the emissivity<br />
<strong>of</strong> the blackbody. The ultimate goal <strong>of</strong> these<br />
thermodynamic temperature measurements is to disseminate<br />
temperature scales with lower uncertainties<br />
than those <strong>of</strong> the ITS-90. These results indicate<br />
that direct disseminations <strong>of</strong> thermodynamic temperature<br />
scales are possible.<br />
Certain commercial equipment, instruments, or<br />
materials are identified in this paper to foster underst<strong>and</strong>ing.<br />
Such identification does not imply recommendation<br />
or endorsement by the <strong>National</strong> <strong>Institute</strong><br />
<strong>of</strong> <strong>St<strong>and</strong>ards</strong> <strong>and</strong> Technology nor does it imply that<br />
the material or equipment are necessarily the best<br />
available for the purpose.<br />
References<br />
1. T. J. Quinn, Temperature (Academic, 1990), pp. 20–22.<br />
2. L. A. Guildner <strong>and</strong> R. E. Edsinger, “Deviation <strong>of</strong> the international<br />
practical temperatures from thermodynamic temperatures<br />
in the temperature range from 273.16 K to 730 K,” J. Res.<br />
Natl. Bur. St<strong>and</strong>. 80A, 703–738 (1976).<br />
3. M. R. Moldover, S. J. Boyes, C. W. Meyer, <strong>and</strong> A. R. H. Goodwin,<br />
“Thermodynamic temperatures <strong>of</strong> the triplepoints <strong>of</strong> mercury<br />
<strong>and</strong> Gallium in the interal 217 K to 303 K,” J. Res. Natl.<br />
Inst. St<strong>and</strong>. Technol. 104, 11–46 (1999).<br />
4. L. Crovini <strong>and</strong> A. Actis, “Noise thermometry in the range<br />
630 °C to 962 °C,” Metrologia 14, 69–78 (1978).<br />
5. R. E. Edsinger <strong>and</strong> J. F. Schooley, “Differences between thermodynamic<br />
temperature <strong>and</strong> t (IPTS-68) in the range 230 °C to<br />
660 °C,” Metrologia 26, 95–106 (1989).<br />
6. D. R. White, R. Galleano, A. Actis, H. Brixy, M. De Groot, J.<br />
Dubbeldam, A. L. Reesink, F. Edler, H. Sakurai, R. L. Shepard,<br />
<strong>and</strong> J. C. Gallop, “The status <strong>of</strong> Johnson noise thermometry,”<br />
Metrologia 33, 325–335 (1996).<br />
7. Supplementary Information for the International Tempera-<br />
2880 APPLIED OPTICS � Vol. 46, No. 15 � 20 May 2007<br />
ture Scale <strong>of</strong> 1990, Sèvres, Bureau International des Poids et<br />
Mesures, 1990.<br />
8. T. J. Quinn <strong>and</strong> J. E. Martin, “A radiometric determination <strong>of</strong><br />
the Stefan–Boltzmann constant <strong>and</strong> thermodynamic temperatures<br />
between �40 °C <strong>and</strong> �100 °C,” Philos. Trans. R. Soc.<br />
316, 85–189 (1985).<br />
9. H. W. Yoon <strong>and</strong> C. E. Gibson, in Proceedings <strong>of</strong> TEMPMEKO’99,<br />
J. F. Dubbledam <strong>and</strong> M. J. de Groot, eds., Vol. II (IMEKO�Nmi<br />
Van Swinden Laboratorium, Delft, 1999, pp. 737–742.<br />
10. N. P. Fox, J. E. Martin, <strong>and</strong> D. H. Nettleton, “Radiometric<br />
aspects <strong>of</strong> an experiment to determine the melting�freezing<br />
temperature <strong>of</strong> gold,” Metrologia 28, 221–227 (1991).<br />
11. W. R. Blevin <strong>and</strong> B. Steiner, “Redefinition <strong>of</strong> the c<strong>and</strong>ela <strong>and</strong><br />
lumen,” Metrologia 11, 97–104 (1975).<br />
12. P. J. Martin, H. A. Macleod, R. P. Netterfield, C. G. Pacey, <strong>and</strong><br />
W. G. Sainty, “Ion-beam-assisted deposition <strong>of</strong> thin films,”<br />
Appl. Opt. 22, 178–184 (1983).<br />
13. S. W. Brown, G. P. Eppeldauer, <strong>and</strong> K. R. Lykke, “Facility for<br />
spectral irradiance <strong>and</strong> radiance responsivity calibrations using<br />
uniform sources,” Appl. Opt. 45, 8218–8237 (2006).<br />
14. P. J. Mohr <strong>and</strong> B. N. Taylor, “CODATA recommended values<br />
<strong>of</strong> the fundamental physical constants: 2002,” Rev. Mod. Phys.<br />
77, 1–108 (2005).<br />
15. G. P. Eppeldauer <strong>and</strong> J. E. Hardis, “Fourteen-decade photocurrent<br />
measurements with large-area silicon photodiodes at<br />
room temperature,” Appl. Opt. 30, 3091–3099 (1991).<br />
16. F. Sakuma <strong>and</strong> S. Hattori, “Establishing a practical temperature<br />
st<strong>and</strong>ard by using a narrow-b<strong>and</strong> radiation thermometer<br />
with a silicon detector,” in Temperature: Its Measurement <strong>and</strong><br />
Control in Science <strong>and</strong> Industry, J. F. Schooley, ed. (AIP, 1982),<br />
Vol. 5, pp. 421–427.<br />
17. V. I. Sapritsky <strong>and</strong> A. V. Prokhorov, “Spectral effective emissivities<br />
<strong>of</strong> nonisothermal cavities calculated by the Monte<br />
Carlo method,” Appl. Opt. 34, 5645–5652 (1995).<br />
18. G. Bauer <strong>and</strong> K. Bisch<strong>of</strong>f, “Evaluation <strong>of</strong> the emissivity <strong>of</strong> a<br />
cavity source by reflection measurements,” Appl. Opt. 10,<br />
2639–2643 (1971).<br />
19. C. K. Ma, “Method for the measurement <strong>of</strong> the effective emissivity<br />
<strong>of</strong> a cavity,” in Proceedings <strong>of</strong> TEMPMEKO’04, D.<br />
Zvizdic, ed. (Laboratory for Process Measurement, Zagreb,<br />
2005), pp. 575–580.<br />
20. F. Sakuma <strong>and</strong> L. Ma, “Evaluation <strong>of</strong> the fixed-point cavity<br />
emissivity at NMIJ,” in Proceedings <strong>of</strong> TEMPMEKO’04, D.<br />
Zvizdic, ed. (Laboratory for Process Measurement, Zagreb,<br />
2005), pp. 563–568.<br />
21. N. P. Fox, J. E. Martin, <strong>and</strong> D. H. Nettleton, “Absolute spectral<br />
radiometric determination <strong>of</strong> the thermodynamic temperatures<br />
<strong>of</strong> the melting�freezing points <strong>of</strong> gold, silver, <strong>and</strong> aluminum,”<br />
Metrologia 28, 357–374 (1991).<br />
22. K. D. Mielenz, R. D. Saunders, <strong>and</strong> J. B. Shumaker, “Spectroradiometric<br />
determination <strong>of</strong> the freezing temperature <strong>of</strong><br />
gold,” J. Res. Natl. Inst. St<strong>and</strong>. Technol. 95, 49–67 (1990).<br />
23. R. L. Rusby, R. P. Hudson, M. Durieux, J. F. Schooley, P. P. M.<br />
Steur, <strong>and</strong> C. A. Swenson, “Thermodynamic basis <strong>of</strong> the ITS-<br />
90,” Metrologia 28, 9–18 (1991).<br />
24. J. Fischer, M. Battuello, M. Sadli, M. Ballico, S. N. Park, P.<br />
Saunders, Y. Zundong, B. C. Johnson, E. Van der Ham, F.<br />
Sakuma, G. Machin, N. Fox, W. Li, S. Ugur, <strong>and</strong> M. Matveyev,<br />
“Uncertainty budgets for realization <strong>of</strong> ITS-90 by radiation<br />
thermometry,” in Temperature: Its Measurement <strong>and</strong> Control<br />
in Science <strong>and</strong> Industry, D. C. Ripple, ed. (AIP, 2003), Vol. 7,<br />
pp. 631–638.
29 4A Vol. 29, № 4A<br />
2008 10 ACTA METROLOGICA SINICA October, 2008<br />
Uncertainty Analysis <strong>and</strong> Maintenance <strong>of</strong> the <strong>NIST</strong> Detectorbased<br />
Temperature Scale<br />
H. W. Yoon, C. E. Gibson, G. P. Eppeldauer, A. W. Smith,<br />
S. W. Brown, K. R. Lykke<br />
(Optical Technology Division<br />
<strong>National</strong> <strong>Institute</strong> <strong>of</strong> <strong>St<strong>and</strong>ards</strong> <strong>and</strong> Technology<br />
Gaithersburg, MD 20899 USA)<br />
Abstract: Thermodynamic temperatures can be directly determined using the Planck radiance law <strong>and</strong> detector-based<br />
radiation thermometers. Although the final uncertainties in the detector-based radiation thermometry can be lower than<br />
in the ITS-90 based temperatures, detailed uncertainty analyses for each step <strong>of</strong> the detector-based realization are needed<br />
to validate these low uncertainties. We list the measurement steps in the detector-based temperatures <strong>and</strong> also describe<br />
the characterizations in determining the measurement uncertainties for each <strong>of</strong> the steps. We further describe measures<br />
to maintain the low uncertainties obtained from the radiometric calibrations.<br />
Key words: Thermodynamic temperature; Temperature measurement; Radiation Thermometry; Uncertainty Analysis<br />
CLC number: TB94 Document code: A Article ID: 1000-1158(2008)04A-0000-00<br />
1. Introduction<br />
A fundamental goal in the establishment <strong>of</strong> the<br />
Système International d'Unités (SI) is to base the SI<br />
units on constants which are invariant in space <strong>and</strong><br />
time. The movement to define the SI units based upon<br />
fundamental physical constants <strong>and</strong>, in particular, to<br />
adopt a fixed Boltzmann constant as the basis <strong>of</strong> the<br />
unit <strong>of</strong> temperature, the kelvin, is in pursuit <strong>of</strong> this<br />
goal [1]. With the redefinition <strong>of</strong> the kelvin, work is<br />
underway in the Consultative Committee on Thermometry<br />
(CCT) to give guidance on the practical realization<br />
<strong>of</strong> the kelvin or the mise en practique (MeP).<br />
The new MeP will include descriptions <strong>and</strong> references<br />
to all primary thermometry techniques including,<br />
among others, constant-volume gas thermometry,<br />
acoustic thermometry, noise thermometry, dielectric-<br />
Received: 2008-00-00<br />
Corresponding e-mail address: hyoon@nist.gov<br />
constant gas thermometry, <strong>and</strong> detector-based radiation<br />
thermometry [2]. The MeP will also list the uncertainties<br />
associated with each <strong>of</strong> these primary<br />
thermometry techniques. The common value linking<br />
these different methods is the fixed Boltzmann constant<br />
which also fixes the kelvin temperature scale.<br />
Presently, the International Temperature Scale <strong>of</strong><br />
1990 (ITS-90) defines the kelvin scale <strong>and</strong> is used<br />
successfully in most applications. However, the<br />
greatest weakness <strong>of</strong> the ITS-90 is recognized to be at<br />
temperatures above the Ag freezing temperatures<br />
where temperatures are defined by the use <strong>of</strong> Planck<br />
radiance ratios from either the Ag-, Au- or the Cufreezing<br />
temperature blackbodies [3]. This weakness<br />
is due to the use <strong>of</strong> extrapolations to higher temperatures<br />
from the defining fixed point using radiation<br />
thermometers which can have many systematic biases<br />
which, in turn, can lead to large temperature differ-
ences. Detector-based radiation thermometry is primary<br />
thermometry which can lead to lower uncertainties<br />
than in ITS-90 based temperatures, but the uncertainty<br />
components need to be characterized <strong>and</strong> measured.<br />
In this work, we describe the uncertainty components<br />
in the detector-based radiation thermometry<br />
where the radiance responsivity <strong>of</strong> the radiation thermometer<br />
is measured using a tunable laser-irradiated,<br />
integrating sphere source. The uncertainty analysis<br />
is separated into those related to the calibrations <strong>of</strong> the<br />
radiance responsivity <strong>and</strong> the characterizations <strong>of</strong> the<br />
radiation thermometer. Both spatial <strong>and</strong> angular uniformity<br />
characterizations <strong>of</strong> the integrating sphere<br />
used in the realization are described. The interference<br />
fringes observed at the peak <strong>of</strong> the radiance responsivity<br />
is analyzed to determine the thickness <strong>of</strong><br />
the layer causing the interference fringes. This listing<br />
<strong>of</strong> the uncertainty components will assist other<br />
laboratories attempting to develop similar primary<br />
thermometry capabilities.<br />
2. Detector-based Radiance Responsivity<br />
Calibrations<br />
The spectral radiance responsivity calibrations are<br />
performed in the <strong>NIST</strong> Spectral Irradiance <strong>and</strong> Radiance<br />
responsivity Calibrations using Uniform Sources<br />
(SIRCUS) facility [4]. In Tab. 1, the uncertainty<br />
Tab. 1 The total uncertainty <strong>of</strong> the radiance responsivity calibrations<br />
in the <strong>NIST</strong> SIRCUS facility broken down into the<br />
component uncertainties. Trap refers to the Si-diode trap detector<br />
used for the realization.<br />
SIRCUS Uncertainty<br />
Components<br />
(k = 1) Type [ % ]<br />
1 Trap responsivity A 0.025<br />
2 Aperture Area A 0.004<br />
3 Distance<br />
Sphere Spatial <strong>and</strong><br />
B 0.01<br />
4 Angular Uniformity B 0.025<br />
5 Amplifier gain<br />
Temperature coeffi-<br />
A 0.005<br />
6 cient <strong>of</strong> Trap<br />
Temporal Stability <strong>of</strong><br />
B 0.002<br />
7 Trap<br />
Combined St<strong>and</strong>ard<br />
B 0.013<br />
Uncertainty (k = 1)<br />
Exp<strong>and</strong>ed Uncer-<br />
0.040<br />
tainty (k = 2) 0.080<br />
components <strong>of</strong> the detector-based radiance responsivity<br />
calibrations are listed. Although these uncertainties<br />
are discussed in Ref. 4, additional measurements<br />
to support the uncertainties have been further performed<br />
since the initial publication about the SIRCUS<br />
facility.<br />
2.1 Si-trap detector responsivity<br />
At <strong>NIST</strong>, the detector-based radiation thermometry<br />
begins with the calibration <strong>of</strong> detectors using the Primary<br />
Optical Watt Radiometer (POWR) [5] which is a<br />
cryogenic electrical substitution radiometer. Cryogenic<br />
radiometers have been compared against each<br />
other using Si-trap detectors <strong>and</strong> have been found to<br />
be in agreement to within 0.012 % (k=1). In the<br />
wavelength region from 400 nm to 920 nm, the Sitrap<br />
detector is calibrated against the POWR in the<br />
<strong>NIST</strong> SIRCUS facility for spectral power responsivity<br />
at many different laser wavelengths as shown in Fig. 1.<br />
Since there is some scatter in the measurements, multiple<br />
measurements at various wavelengths are fitted<br />
using a modified Gaussian-Lorentzian fit <strong>and</strong> the residuals<br />
from this fit are shown in Fig. 1. Although<br />
the physical model <strong>of</strong> the quantum efficiencies is<br />
typically used to fit the spectral power responsivity <strong>of</strong><br />
the trap detectors [6], such fitting is not needed if<br />
many laser wavelengths are used for the calibrations.<br />
The residuals <strong>of</strong> the measurements from the fitted<br />
functions are distributed evenly about the zero crossing.<br />
Residuals from fit<br />
1.5x10 -3<br />
1.0x10 -3<br />
5.0x10 -4<br />
0.0<br />
-5.0x10 -4<br />
-1.0x10 -3<br />
-1.5x10<br />
200 400 600 800 1000 1200<br />
-3<br />
Wavelength [ nm ]<br />
Fig. 1 The residuals <strong>of</strong> the fitted spectral power responsivity<br />
<strong>of</strong> the trap detector from the individual measurements
2.2 Aperture area uncertainties<br />
The uncertainties in row 2 <strong>of</strong> Tab. 1 are due to the<br />
aperture areas on both the trap detector <strong>and</strong> the integrating<br />
sphere sources (ISS), <strong>and</strong> the uncertainties in<br />
row 3 are due to the uncertainty in the separation distance<br />
between the precision aperture on the ISS <strong>and</strong><br />
the trap detector. An international key comparison <strong>of</strong><br />
aperture areas was recently completed to determine<br />
the whether the measurements at the different national<br />
measurement institutes (NMI) were within their stated<br />
uncertainties [7]. The comparison showed that the<br />
uncertainties <strong>of</strong> an individual laboratory for certain<br />
type <strong>of</strong> apertures could be at the value cited in Tab. 1<br />
but the differences between the NMIs could be larger<br />
than the uncertainties cited by the NMIs.<br />
2.3 Distance measurement uncertainties<br />
The distance between the ISS <strong>and</strong> the trap detectors<br />
are determined through a modified 1/r 2 fit,<br />
S<br />
o<br />
( ) 2<br />
r − r<br />
o<br />
(1)<br />
where both the amplitude, So, <strong>and</strong> the <strong>of</strong>fset distance,<br />
r0, are fitted parameters using <strong>and</strong> the uncertainties are<br />
determined from the residuals <strong>of</strong> the fit. Furthermore,<br />
presence <strong>of</strong> scattered radiation from improper baffling<br />
can be determined from the residuals <strong>of</strong> the 1/r 2 fit.<br />
2.4 Amplifier gain uncertainties<br />
The uncertainties in the amplifier gains are attributed<br />
to the uncertainties in the current-to-voltage conversion<br />
<strong>of</strong> the transimpedance amplifiers. The current<br />
measurements are performed with custom-designed<br />
preamplifiers with gains determined by high-precision,<br />
metal-film, feedback resistors in the operational amplifier<br />
circuit. The preamplifier gains are determined<br />
from electrical resistance calibrations <strong>of</strong> the feedback<br />
resistors. Care should be taken that the current-tovoltage<br />
conversion is linear since the parallel connections<br />
<strong>of</strong> the Si diodes in the trap detector results in a<br />
shunt resistance <strong>of</strong> the trap detector being lower than<br />
the shunt resistance <strong>of</strong> any single diode element.<br />
2.5 Si-trap detector temperature dependence <strong>and</strong><br />
long-term stability<br />
The next two rows in Table 1 are due to the temperature<br />
dependence <strong>of</strong> the trap detector responsivity<br />
<strong>and</strong> the long-term stability <strong>of</strong> the trap detector. Since<br />
the trap detector is constructed from three or more Si<br />
diodes which could have a temperature dependence,<br />
change in the spectral power responsivity could result<br />
from the temperature difference between the calibration<br />
against the cryogenic radiometer <strong>and</strong> the subsequent<br />
use <strong>of</strong> the trap detector. Such temperature dependence<br />
is expected to be greater near the b<strong>and</strong>-gap<br />
energy <strong>of</strong> the Si diode.<br />
Since the trap detectors are only calibrated on an<br />
annual or biennial basis, the responsivity could<br />
change over time. The trap detectors are constructed<br />
using Si diodes without any windows, <strong>and</strong> any change<br />
in the reflectance <strong>of</strong> Si diodes due to oxide accumulation<br />
would be compensated by the increase in the<br />
photocurrent <strong>of</strong> the other Si diodes. Although, the<br />
trap detectors are stored in dust-free containers when<br />
not in use, any particulate contamination would lead<br />
to a change in the responsivity. Such contamination<br />
is evident in the change in the spatial uniformity <strong>of</strong><br />
the trap detector or changes in the power responsivity<br />
when compared to the other sets <strong>of</strong> trap detectors.<br />
The results <strong>of</strong> the annual calibrations <strong>of</strong> the working<br />
st<strong>and</strong>ard trap detectors T-01 <strong>and</strong> T-02 are shown in<br />
Table 2. The power responsivities are determined by<br />
comparison against the cryogenic radiometer <strong>and</strong> the<br />
Tab. 2 The external quantum efficiencies <strong>of</strong> trap detectors T-<br />
01 <strong>and</strong> T-02 with repeat calibrations in 2005, 2006 <strong>and</strong> 2007.<br />
T-01 Exter-<br />
T-02 External<br />
Ratio<br />
nal Quantum Quantum (T-1<br />
Wavelength Efficiency Efficiency EQE/T-<br />
Year [ nm ] (EQE) (EQE) 02 EQE)<br />
2005 649.906 0.99573 0.99772 0.99801<br />
2005 649.9 0.99583 0.99778 0.99804<br />
2006 647.1600 0.99543 0.99766 0.99777<br />
2006 647.1400 0.99545 0.99766 0.99778<br />
2006 647.1200 0.99545 0.99768 0.99777<br />
2007 653.81 0.99566 0.99783 0.99783<br />
2007 653.84 0.99564 0.99785 0.99779<br />
external-quantum efficiencies (EQE) are determined.
The slight differences in the wavelengths <strong>of</strong> the measurements<br />
<strong>and</strong> the resulting differences in the EQE are<br />
not significant, <strong>and</strong> if the trap detector has remained<br />
temporally stable, then the EQE’s are expected to repeat<br />
within the assigned uncertainties. One way to<br />
determine if the trap detectors have remained stable is<br />
to plot the ratios <strong>of</strong> the EQE’s <strong>of</strong> the trap detectors<br />
over time as shown in Fig. 2. The mean value <strong>of</strong> the<br />
ratios is indicated by the middle line <strong>and</strong> the exp<strong>and</strong>ed<br />
uncertainties assigned to the temporal stability <strong>of</strong><br />
0.026 % is shown by the bracketing dotted lines.<br />
The data indicates that the temporal stabilities <strong>of</strong> the<br />
trap detectors are adequately accounted by the assigned<br />
uncertainties.<br />
Ratio ( T-01 EQE / T-02 EQE )<br />
0.9984<br />
0.9982<br />
0.9980<br />
0.9978<br />
0.9976<br />
0.9974<br />
0.9972<br />
2005 2006 2007<br />
Year<br />
Fig. 2 The ratios <strong>of</strong> the EQE’s <strong>of</strong> the trap detectors T-01 <strong>and</strong><br />
T-02 over time shown with the mean <strong>and</strong> the assigned exp<strong>and</strong>ed<br />
uncertainties <strong>of</strong> 0.026 % indicated by dotted lines.<br />
3. Spatial Uniformity <strong>of</strong> the Integrating<br />
Sphere Source<br />
One <strong>of</strong> the most important characterization steps in<br />
the detector-based radiance responsivity is the measurements<br />
<strong>of</strong> the spatial <strong>and</strong> angular uniformity <strong>of</strong> the<br />
ISS. When the radiation thermometer is calibrated<br />
for radiance responsivity, the ISS acts as a monochromatic<br />
substitute for a blackbody, <strong>and</strong> the radiance<br />
output <strong>of</strong> the ISS, in turn, must be as uniform <strong>and</strong><br />
lambertian as a Planckian source. It is difficult to<br />
have the ISS achieve the spatial <strong>and</strong> angular uniformity<br />
<strong>of</strong> a blackbody, since unlike a blackbody, the radiation<br />
enters from one or few ports <strong>and</strong> is reflected.<br />
The high emissivity <strong>of</strong> the blackbody is achieved by<br />
having every surface inside the blackbody emitting at<br />
a uniform temperature.<br />
The spatial uniformity <strong>of</strong> the ISS can be measured<br />
with a radiometer which can be limited to a small<br />
field <strong>of</strong> view. The spatial uniformities <strong>of</strong> different<br />
diameter integrating sphere sources with 5 mm diameter<br />
openings measured with a radiometer limited to<br />
1 mm spot size at f/12 geometry are shown. Fig. 3<br />
shows the spatial uniformity <strong>of</strong> the 25 mm diameter<br />
sphere with the 5 mm diameter opening. All the ISS<br />
used in this study are internally coated with sintered<br />
polytetrafluoroethylene (PTFE) for the highest reflectance<br />
over a wide range <strong>of</strong> wavelengths. The laser is<br />
introduced into the ISS with a fiber input at 90 ° at the<br />
side <strong>of</strong> the sphere. Due to the small size <strong>of</strong> the<br />
sphere, the bright illumination <strong>of</strong> the initial bounce<br />
from the laser can be seen as a spatial non-uniformity<br />
<strong>of</strong> 0.1 % toward the upper right <strong>of</strong> the figure.<br />
-5<br />
-4<br />
-3<br />
-2<br />
-1<br />
0<br />
1<br />
X axis [ mm ]<br />
2<br />
3<br />
4<br />
5<br />
4.5<br />
4<br />
3.5<br />
3<br />
2.5<br />
2<br />
1.5<br />
1<br />
0.5<br />
0<br />
-0.5<br />
-1<br />
-1.5<br />
-2<br />
-2.5<br />
-3<br />
-3.5<br />
-4<br />
-4.5<br />
5 -5<br />
Y axis [ mm ]<br />
1.0045-1.005<br />
1.004-1.0045<br />
1.0035-1.004<br />
1.003-1.0035<br />
1.0025-1.003<br />
1.002-1.0025<br />
1.0015-1.002<br />
1.001-1.0015<br />
1.0005-1.001<br />
1-1.0005<br />
0.9995-1<br />
0.999-0.9995<br />
0.9985-0.999<br />
0.998-0.9985<br />
0.9975-0.998<br />
0.997-0.9975<br />
0.9965-0.997<br />
0.996-0.9965<br />
Fig. 3 The spatial uniformity <strong>of</strong> the 25 mm diameter PTFE<br />
sphere with a 5 mm diameter opening. The insufficient mixing<br />
<strong>of</strong> the radiation can be observed from the non-uniformity <strong>of</strong><br />
0.1 % toward the upper right side.<br />
Two other PTFE-lined ISS with 38 mm <strong>and</strong> 300 mm<br />
diameters have also been measured for spatial uniformity<br />
as shown in Figs. 4 <strong>and</strong> 5 with the same intensity<br />
scales as in Fig. 3. As expected, the spatial uniformity<br />
is found to increase with the diameter <strong>of</strong> the<br />
sphere. The throughput <strong>of</strong> the sphere decreases with<br />
increasing diameter so that the incident laser power<br />
must be increased to obtain the same irradiances or<br />
radiances as with the smaller diameter spheres.
-5<br />
-4<br />
-3<br />
-2<br />
-1<br />
0<br />
1<br />
X axis [ mm ]<br />
2<br />
3<br />
4<br />
5<br />
4.5<br />
4<br />
3.5<br />
3<br />
2.5<br />
2<br />
1.5<br />
1<br />
0.5<br />
0<br />
-0.5<br />
-1<br />
-1.5<br />
-2<br />
-2.5<br />
-3<br />
-3.5<br />
-4<br />
-4.5<br />
5 -5<br />
Y axis [ mm ]<br />
1.0045-1.005<br />
1.004-1.0045<br />
1.0035-1.004<br />
1.003-1.0035<br />
1.0025-1.003<br />
1.002-1.0025<br />
1.0015-1.002<br />
1.001-1.0015<br />
1.0005-1.001<br />
1-1.0005<br />
0.9995-1<br />
0.999-0.9995<br />
0.9985-0.999<br />
0.998-0.9985<br />
0.9975-0.998<br />
0.997-0.9975<br />
0.9965-0.997<br />
0.996-0.9965<br />
Fig. 4 The spatial uniformity <strong>of</strong> the 38 mm diameter PTFE<br />
sphere with a 5 mm diameter opening. A center spot introduces<br />
a nonuniformity <strong>of</strong> 0.05 %.<br />
-5<br />
-4<br />
-3<br />
-2<br />
-1<br />
0<br />
1<br />
X axis [ mm ]<br />
2<br />
3<br />
4<br />
5<br />
4.5<br />
4<br />
3.5<br />
3<br />
2.5<br />
2<br />
1.5<br />
1<br />
0.5<br />
0<br />
-0.5<br />
-1<br />
-1.5<br />
-2<br />
-2.5<br />
-3<br />
-3.5<br />
-4<br />
-4.5<br />
5 -5<br />
Y axis [ mm ]<br />
1.0045-1.005<br />
1.004-1.0045<br />
1.0035-1.004<br />
1.003-1.0035<br />
1.0025-1.003<br />
1.002-1.0025<br />
1.0015-1.002<br />
1.001-1.0015<br />
1.0005-1.001<br />
1-1.0005<br />
0.9995-1<br />
0.999-0.9995<br />
0.9985-0.999<br />
0.998-0.9985<br />
0.9975-0.998<br />
0.997-0.9975<br />
0.9965-0.997<br />
0.996-0.9965<br />
Fig. 5 The spatial uniformity <strong>of</strong> the 300 mm diameter PTFE<br />
sphere with a 5 mm diameter opening. The large sphere with<br />
a small opening results in uniformity <strong>of</strong> 0.025 %.<br />
4. Angular Uniformity <strong>of</strong> the Integrating Sphere<br />
Source<br />
The angular uniformity <strong>of</strong> the ISS can be measured<br />
with a trap detector with a characterized angular responsivity.<br />
If the internal diodes which form the trap<br />
configuration are not well aligned, then the angular<br />
responsivity <strong>of</strong> the trap detector will not be symmetric<br />
<strong>and</strong> be independent <strong>of</strong> the angular direction. Once<br />
the trap detector has been characterized, the ISS can<br />
be measured for angular output. The optical layout<br />
<strong>of</strong> the radiometric measurements is shown in Fig. 6.<br />
The integrating-sphere source is shown at left <strong>and</strong> the<br />
precision aperture <strong>of</strong> the trap detector is shown on the<br />
right. If the two apertures are translated in a perpendicular<br />
plane then the closest distance between the<br />
two apertures is indicated by the distance d, <strong>and</strong> the<br />
distance between the apertures when the trap detector<br />
is out <strong>of</strong> the plane is given by the distance r. For the<br />
optical configuration shown in Fig. 6, the relationship<br />
between r <strong>and</strong> d is given by d = r cos θ, where θ is the<br />
angle between the centers <strong>of</strong> the ISS <strong>and</strong> the trap detector.<br />
In addition to the change in the distance between<br />
the ISS <strong>and</strong> the trap detector, the projected areas<br />
<strong>of</strong> both the source <strong>and</strong> the detector apertures decrease<br />
by the cos θ, leading to a relationship between<br />
the irradiance at r as compared to the irradiance at<br />
position d,<br />
4<br />
E r = E d cos . (2)<br />
( ) ( ) θ<br />
Thus, a plot <strong>of</strong> the normalized signal versus angle can<br />
A cosθ<br />
θ<br />
r<br />
d<br />
θ<br />
B cosθ<br />
Fig. 6 The optical schematic for determining the angular uniformity<br />
<strong>of</strong> the irradiance at the plane <strong>of</strong> the trap detector.<br />
be fitted with Eq. 2 to determine any deviations from<br />
lambertian output <strong>of</strong> the ISS. The irradiance ratios<br />
are plotted in Fig. 7 <strong>and</strong> shown to be in agreement<br />
with Eq. 2 within ± 0.05 radian.<br />
Irradiance ratio [E δ /E o ]<br />
1.001<br />
1.000<br />
0.999<br />
0.998<br />
0.997<br />
0.996<br />
0.995<br />
0.994<br />
0.993<br />
cos 4 δ<br />
Measured<br />
50 mm diameter at 500 mm<br />
0.992<br />
-0.06 -0.04 -0.02 0.00 0.02 0.04 0.06<br />
Angle δ [ radian ]<br />
Fig. 7 The irradiance ratios to the center measured by scanning<br />
the trap detector. Although the detector was scanned in<br />
the x <strong>and</strong> y planes, a one dimensional plot is shown to better<br />
demonstrate the fit to cos 4 θ dependence.
5. Radiation thermometer uncertainties<br />
The uncertainties for the use <strong>of</strong> the radiation thermometer<br />
in measuring the temperature <strong>of</strong> fixed-point<br />
blackbodies are shown in Tab. 3. The uncertainty <strong>of</strong><br />
the spectral radiance responsivity is transferred from<br />
Tab. 1, but additional uncertainties arise in the specific<br />
use <strong>of</strong> the radiation thermometer. One <strong>of</strong> the<br />
largest uncertainty components is due to the temporal<br />
stability <strong>of</strong> the responsivity arising from the change in<br />
the radiation thermometer throughput. The change in<br />
the throughput could be due to many factors such as<br />
the changes from the filter transmittance, the detector<br />
responsivity, contamination <strong>of</strong> the optics or structural<br />
changes <strong>of</strong> the radiation thermometer related to<br />
changes in the ambient temperature, among others.<br />
Although care is taken to design the radiation thermometer<br />
to minimize such unpredicted changes, it is<br />
difficult to eliminate all sources <strong>of</strong> temporal changes.<br />
Tab. 3 Uncertainty components for a fixed-point blackbody<br />
temperature determination.<br />
Uncertainty Component [ % ]<br />
1 Spectral Radiance Responsivity 0.040<br />
2 Temporal Stability <strong>of</strong> Responsivity 0.050<br />
3 Plateau Identification 0.005<br />
4 Emissivity 0.010<br />
5 Preamplifier Gain 0.025<br />
6 Dark current drift 0.015<br />
7 Size-<strong>of</strong>-source effect 0.010<br />
Total Uncertainty in Signal 0.072<br />
Exp<strong>and</strong>ed Uncertainty (k =2) 0.144<br />
Temperature Uncertainty [ K ] (k =2) 0.116<br />
The low uncertainty <strong>of</strong> the wavelength <strong>and</strong> dynamic<br />
range <strong>of</strong> the responsivity calibrations are made possible<br />
by the use <strong>of</strong> laser-based responsivity calibrations.<br />
However, due to the narrow linewidth <strong>of</strong> the lasers,<br />
interference fringes can be present in the responsivity<br />
calibrations. The radiance responsivity <strong>of</strong> the <strong>NIST</strong><br />
Absolute Pyrometer 1 (AP1) is shown in Fig. 8. The<br />
interference fringes are observed at the peak <strong>of</strong> the<br />
responsivity, <strong>and</strong> the additional modulation can be<br />
Radiance Responsivity, A / W / cm 2 nm sr<br />
3.0x10 -4<br />
2.5x10 -4<br />
2.0x10 -4<br />
1.5x10 -4<br />
1.0x10 -4<br />
5.0x10 -5<br />
0.0<br />
645 650 655<br />
Wavelength [ nm ]<br />
Fig. 8 The radiance responsivity <strong>of</strong> the <strong>NIST</strong> Absolute Py-<br />
rometer 1 (AP1) showing the interference fringes at the peak.<br />
observed from the chang es in the amplitude <strong>of</strong> the<br />
interference fringes. The thickness <strong>of</strong> the material<br />
responsible for the interference fringes can be determined<br />
from<br />
mλ = 2nd<br />
cosϕ<br />
(3)<br />
where m is an integer, λ is the wavelength <strong>of</strong> the radiation,<br />
n is the refractive index, d is the thickness <strong>of</strong><br />
the material, <strong>and</strong> ϕ is the incident angle <strong>of</strong> the radiation.<br />
For determining the cause <strong>of</strong> the interference<br />
fringes, an exp<strong>and</strong>ed plot <strong>of</strong> the peak responsivity is<br />
shown in Fig. 9. In Fig. 9, the interference fringes<br />
are found to be temporally stable with repeated calibrations<br />
from 2003 to 2006. Since the wavelength<br />
interval between the fringes can be measured from Fig.<br />
9, the thickness <strong>of</strong> the material can be found using<br />
1<br />
d = , (4)<br />
2nΔχ<br />
where<br />
1 1<br />
Δχ<br />
= − . (5)<br />
λ λ<br />
m<br />
m+<br />
1<br />
If the refractive index is assumed to be 1.55 then the<br />
thickness <strong>of</strong> the material which results in the interference<br />
fringes seen in Fig. 9 is estimated to be 0.67 mm.<br />
Although the interferences could arise from several<br />
different sources, the fringes in the AP1 are determined<br />
to be from an element in the interference filter<br />
centered at 649.5 nm. At first, the protective window
on the thermo-electrically cooled diode was postulated<br />
to cause the interference fringes. Both roughening<br />
the window surface <strong>and</strong> increasing the thickness<br />
<strong>of</strong> the window by gluing an additional glass window<br />
did not affect the fringes. However, when the Lyot<br />
stop diameter was increased, the amplitudes <strong>of</strong> the<br />
fringes were reduced, <strong>and</strong> the amplitudes increased<br />
with a decrease in the Lyot stop diameter. Since the<br />
Lyot stop is placed directly in front <strong>of</strong> the interference<br />
filter, one explanation for this behavior is that a layer<br />
within the filter is the cause <strong>of</strong> the fringes. The total<br />
thickness <strong>of</strong> the interference filter is about 11 mm so<br />
that the front <strong>and</strong> back surfaces <strong>of</strong> the filter are not the<br />
source <strong>of</strong> the fringes as estimated from Eq. 4. If this<br />
layer inside the filter has interfaces which are not parallel<br />
over the entire area <strong>of</strong> the filter, then the radiation<br />
is expected to have a greater degree <strong>of</strong> destructive<br />
interference when the radiation is transmitted over a<br />
larger surface <strong>of</strong> the filter.<br />
Radiance Responsivity, A / W / cm 2 nm sr<br />
2.70x10 -4<br />
March 2005<br />
June 2003<br />
November 2006<br />
June 2005<br />
2.60x10<br />
647 648 649 650 651 652<br />
-4<br />
Wavelength, nm<br />
Fig. 9 An exp<strong>and</strong>ed plot <strong>of</strong> radiance responsivity showing the<br />
changes with each calibration <strong>and</strong> the persistence <strong>of</strong> the interference<br />
fringes.<br />
The<br />
presence <strong>of</strong> the fringes are not problematic if<br />
the radiance<br />
responsivity calibrations can adequately<br />
measure the peaks <strong>and</strong> valleys <strong>of</strong> the fringes, but the<br />
number <strong>of</strong> calibrations at the different wavelengths<br />
could be extremely time consuming. Furthermore, if<br />
the amplitude <strong>of</strong> the fringes were much larger than the<br />
< 2 % observed, then the sharp radiance responsivity<br />
changes with wavelength would require lower wavelength<br />
uncertainties. Any wavelength fluctuations <strong>of</strong><br />
the source would be magnified by the amplitude<br />
changes <strong>of</strong> the responsivity function resulting in large<br />
uncertainties.<br />
6. Blackbody<br />
uncertainties<br />
For fixed-point blackbodies the uncertainty due to the<br />
plateau<br />
identification is low due to the long time dura-<br />
tion <strong>of</strong> the freeze. Since the cavity is also surrounded<br />
by a constant temperature material undergoing the<br />
phase transition, the emissivity <strong>of</strong> the cavity is high<br />
<strong>and</strong> can be determined with low uncertainties. The<br />
uncertainties related to the use <strong>of</strong> fixed point blackbodies<br />
are well understood [8].<br />
7. Systematic uncertainties<br />
<strong>of</strong> the radiation<br />
thermometer<br />
Since the preamplifier<br />
gain during the calibration <strong>of</strong><br />
the<br />
radiance responsivity <strong>and</strong> the use <strong>of</strong> radiation<br />
thermometer can be different, uncertainties arise when<br />
the RT is used to measure blackbody temperatures<br />
which can vary widely in radiance. The size-<strong>of</strong>source<br />
effect can be controlled to low levels by using<br />
clean, low-scatter optics <strong>and</strong> a Lyot stop [9]. The<br />
additional sources <strong>of</strong> uncertainties are discussed in a<br />
prior publication [10]. The total uncertainties at the<br />
bottom <strong>of</strong> Tab. 3 are then converted to temperature<br />
uncertainties using the derivative <strong>of</strong> the Wien approximation<br />
as discussed in Ref. 10.<br />
8. Conclusions<br />
The uncertainties in the detector-based radiation ther-<br />
mometry<br />
have been discussed <strong>and</strong> the experimental<br />
results for determining those uncertainties have been<br />
shown. The critical characterizations related to the<br />
fitting <strong>of</strong> the quantum efficiencies <strong>of</strong> the trap detectors<br />
<strong>and</strong> their long-term stabilities are shown. The spatial<br />
<strong>and</strong> angular uniformity <strong>of</strong> the integrating sphere<br />
sources are shown <strong>and</strong> found to be dependent on the<br />
ratio <strong>of</strong> the opening <strong>of</strong> the sphere to its internal surface<br />
area. The interference fringes observed in the<br />
radiance responsivities are described <strong>and</strong> minimized<br />
by increasing the radiated area on the spectrally selective<br />
filter. These characterizations are needed if the<br />
direct realizations <strong>of</strong> thermodynamic temperatures are<br />
to achieve lower uncertainties than the ITS-90 based<br />
temperatures.
8 ACTA METROLOGICA SINICA 2008, October<br />
REFERENCES<br />
1. I. M. Mills, P. J. Mohr, T. J. Quinn, B. N. Taylor, <strong>and</strong> E. R.<br />
Williams. Metrologia. 2006, 43 (3): 227-246.<br />
2. B. Fellmuth, Ch. Gaiser, <strong>and</strong> J. Fischer. Meas. Sci. Technol.<br />
2006. 17 (10): R145-R159.<br />
3. Supplementary Information for the International Temperature<br />
Scale <strong>of</strong> 1990, H. Preston-Thomas, P. Bloembergen, T. J.<br />
Quinn, Sèvres, Bureau International des Poids et Mesures,<br />
1990.<br />
4. S. W. Brown, G. P. Eppeldauer, K. R. Lykke. Applied Optics.<br />
2006, 45(32): 8218-8237.<br />
5. J. M. Houston, J. P. Rice. Metrologia. 2006. 43(2): S31-<br />
S35.<br />
6. T. R. Gentile, J. M. Houston, <strong>and</strong> C. L. Cromer. Applied<br />
Optics. 1996, 35(22): 4392-4403.<br />
7. M. Litorja et al. Metrologia. 2007, 44: 02002.<br />
8. P. Saunders et al. International Journal <strong>of</strong> Thermophysics.<br />
2008, 29:1066–1083.<br />
9. H. W. Yoon, D. W. Allen, <strong>and</strong> R. D. Saunders. Metrologia.<br />
2005, 42(2): 89-96.<br />
10. H. W. Yoon, D. W. Allen, C. E. Gibson, M. Litorja, R. D.<br />
Saunders, S. W. Brown, G. P. Eppeldauer, K. R. Lykke, Applied<br />
Optics. 2007, 46(15): 2870-2880.
SSE- <strong>and</strong> noise-optimized InGaAs radiation thermometer<br />
H W Yoon , C E Gibson , V Khromchenko, G P Eppeldauer<br />
Optical Technology Division<br />
<strong>National</strong> <strong>Institute</strong> <strong>of</strong> <strong>St<strong>and</strong>ards</strong> <strong>and</strong> Technology, Gaithersburg, USA<br />
Abstract<br />
For the measurements <strong>of</strong> radiance temperatures in the range from 150 °C to 1000 °C, low<br />
uncertainties in the temperature measurements can be achieved by using near-infrared InGaAs<br />
radiation thermometers. We describe the design <strong>and</strong> construction <strong>of</strong> the <strong>NIST</strong> near-infrared<br />
radiation thermometer (NIRT) which is optimized for low size-<strong>of</strong>-source effect <strong>and</strong> noise-<br />
equivalent temperatures. The NIRT utilizes a 50 mm diameter achromatic objective lens with<br />
low scatter which images a 4.5 mm diameter spot at a distance <strong>of</strong> 50 cm away from the objective<br />
in an on-axis design. A Lyot stop is implemented in the design with the aperture stop placed after<br />
the field stop resulting in a collection f/# = 12. A 3 mm diameter InGaAs detector is cooled to –<br />
85 °C using a 4-stage thermoelectric cooler to obtain high-shunt resistance for linear, low-noise<br />
operation at high trans-impedance amplifier gains. For thermal <strong>and</strong> structural stability, the optical<br />
components are placed on four 15 mm diameter graphite-epoxy rods making the optical<br />
throughput stable. Optical ray tracing using a commercial program was used to determine the<br />
Strehl ratio <strong>and</strong> other imaging parameters. We discuss a possible approach for detector-based<br />
temperature scale in this range which could result in 10 mK (k = 2) thermodynamic temperature<br />
uncertainties at the In-point.<br />
KEY WORDS: radiance temperature, ITS-90, thermodynamic temperature, size-<strong>of</strong>-source<br />
effect, near-infrared radiation thermometer, noise-equivalent temperature difference
1. INTRODUCTION<br />
Accurate determinations <strong>of</strong> radiance temperatures from 150 °C to 1000 °C are important for<br />
calibration <strong>of</strong> radiation thermometers which are used in turn for process control or used to<br />
transfer the calibration to other radiation thermometers. In this temperature range, one can<br />
establish a scale on radiation thermometers from the International Temperature Scale <strong>of</strong> 1990<br />
(ITS-90) using the ITS-90 fixed-point blackbodies (FPBBs) from the In-point to the Ag-point <strong>and</strong><br />
applying an interpolation functional fit or by the use <strong>of</strong> a variable-temperature blackbody (VTBB)<br />
whose temperatures are determined using contact platinum resistance thermometers (PRT) [1].<br />
In both approaches, the FPBB or the VTBB emissivity has to be measured or modeled so that the<br />
lowest uncertainties in the transfer to the radiation thermometer can be achieved. International<br />
comparisons <strong>of</strong> scales in this temperature range has revealed that the lowest uncertainties in<br />
radiance temperatures can be achieved using the fixed-point interpolation technique instead <strong>of</strong><br />
using a variable-temperature blackbody [ 2]. The lower uncertainties by utilizing the fixed-points<br />
are possible since the temperature is well known with high spatial uniformity <strong>of</strong> the cavity.<br />
Variable-temperature blackbodies are expected to have greater issues with achieving uniform<br />
temperature distributions within the cavity.<br />
Although the method <strong>of</strong> calibrations using fixed-points is well established, commercial radiation<br />
thermometers which are temporally stable <strong>and</strong> able to view the small cavity openings <strong>of</strong> the<br />
FPBBs are not readily available. Furthermore, custom InGaAs radiation thermometers<br />
constructed by the national measurement institutes have conflicting designs [3,4]. Although<br />
reduction <strong>of</strong> size-<strong>of</strong>-source effect is a critical design feature due to the comparison <strong>of</strong> small-area
fixed point blackbody cavities to large variable-temperature blackbody openings, implementation<br />
<strong>of</strong> the Lyot stop has been lacking.<br />
In this paper, we describe a generalized design for an InGaAs-based radiation thermometer (RT)<br />
capable <strong>of</strong> measurements from the In-point to the Ag-point. The radiation thermometer also<br />
incorporates a Lyot stop while utilizing a low-scatter objective lens. The construction utilizes<br />
carbon-epoxy rods for structural stability with temporal stability <strong>of</strong> the responsivity increased by<br />
the use <strong>of</strong> room temperature-stabilized filter <strong>and</strong> cooled detector. The detector is contained in a<br />
hermetically sealed package to decrease the detector temperature in order to increase the shunt<br />
resistance for low-noise operations. It is hoped that instrumental designs discussed in this paper<br />
can be adopted in future radiation thermometer designs to improve the performance <strong>of</strong> transfer<br />
st<strong>and</strong>ard radiation thermometers.<br />
2. RADIATION THERMOMETER CHARACTERIZATION<br />
2.1 Physical Design<br />
The schematic <strong>of</strong> the radiation thermometer is shown in Fig. 1. The internal elements are<br />
mounted on four 15 mm diameter graphite-epoxy rods for structural stability. The graphite-<br />
epoxy rods have a coefficient <strong>of</strong> thermal expansion (CTE) <strong>of</strong> -0.5 x10 -6 mm/mm which is smaller<br />
than that <strong>of</strong> fused silica [5]. The rods are attached to the front plate holding the objective lens<br />
<strong>and</strong> the various separation between the optical elements can be smoothly adjusted by sliding the<br />
through rods. The angled field stop is constructed from polished stainless steel with a beveled<br />
3 mm diameter hole. The field stop angled to reduce the back reflection <strong>of</strong> the image onto the<br />
objective lens thus reducing the SSE. The specular reflection from the field stop is directed to a<br />
flat mirror for viewing through the telescope objective. The radiation through the field stop is
collimated by the 70 mm focal length achromat <strong>and</strong> the plane <strong>of</strong> the objective lens is focussed<br />
onto the Lyot stop. The presence <strong>of</strong> the Lyot stop is critical in reducing the SSE.<br />
DETECTOR<br />
AMPLIFIER DIODE<br />
FILTER<br />
LYOT<br />
LENS<br />
LASER <strong>and</strong> SPLITTER LENS<br />
STOP<br />
Eye-<br />
piece<br />
50.0 [1.969]<br />
130.0 [5.118]<br />
100.0 [3.937]<br />
Figure 1. The schematic <strong>of</strong> the InGaAs-based radiation thermometer. The outer diameter <strong>of</strong> the main<br />
Ø3.0 [Ø0.118]<br />
FIELD<br />
STOP<br />
333<br />
MAIN LENS<br />
body is 20.3 cm with a total length <strong>of</strong> 75 cm excluding the front baffle.<br />
The room-temperature stabilized interference filter is constructed using hard, ion-assisted<br />
deposited layers at a center wavelength <strong>of</strong> 1550 nm. The full-width at half-maximum b<strong>and</strong>pass<br />
<strong>of</strong> the filter is 100 nm. Due to the 4-stage thermoelectric cooler which limits the maximum size<br />
<strong>of</strong> the regular InGaAs detector, a 3 mm diameter detector is used. The detector lens focusses the<br />
3 mm diameter object at the field stop onto a 1.5 mm diameter region on the detector, leading to<br />
an underfilled detector.<br />
The outer case <strong>of</strong> the radiation thermometer is floating from the optical elements which are<br />
attached to the graphite rods <strong>and</strong> is only fixed at the middle supporting plate. The case is<br />
constructed using 1.83 mm thick anodized aluminum tubing. The use <strong>of</strong> the al tube facilitates<br />
rapid thermal equilibrium between the laboratory temperature <strong>and</strong> the internal temperatures. The<br />
SHUTTER
heat-sink plate for the InGaAs detector is additional thermally connected to the external tubing<br />
with copper-braided contacts which work to dissipate the heat generated from the TE cooler. We<br />
are able to achieve -85 °C with only passive cooling without the use <strong>of</strong> fans. Additional<br />
information on the construction <strong>of</strong> the radiation thermometer is given in Table 1.<br />
Table 1. The design parameters <strong>of</strong> the InGaAs radiation thermometer (RT).<br />
2.2 Detector optimization<br />
Object Distance 50 cm<br />
Image Distance 33.3 cm<br />
Objective Focal Length 20 cm<br />
Field Stop Diameter 3.0 mm<br />
Target Diameter 4.5 mm<br />
f/# 12<br />
Lyot Stop Diameter 8 mm<br />
Detector Type InGaAs<br />
Detector Diameter 3 mm<br />
Detector Temperature -85 °C<br />
Filter Center Wavelength 1550 nm<br />
Filter FWHM b<strong>and</strong>pass 100 nm<br />
Filter Temperature 22 °C<br />
Collimator Lens Focal Length 70 mm<br />
Detector Lens Focal Length 35 mm<br />
Image Diameter on Detector 1.5 mm<br />
RT Diameter 20.3 cm<br />
RT Length 76.2 cm<br />
The most important aspect <strong>of</strong> radiation thermometer design is the selection <strong>of</strong> the detector to be<br />
used in the radiation thermometer. Due to the linearity <strong>and</strong> the wavelength region <strong>of</strong> the spectral<br />
power responsivity, regular InGaAs diode was chosen. Since the small target diameter <strong>and</strong> the<br />
f/# limits the throughput <strong>of</strong> the RT, the preamplifier should have a dynamic range from 10 10 V/A<br />
to 10 5 V/A for measurements <strong>of</strong> blackbodies from the In-point to the Ag-point. In a trans-<br />
impedance amplifier circuit, the shunt resistance <strong>of</strong> the input diode should have a value greater or
equal to the feedback resistance for linear, low noise amplification <strong>of</strong> the current. The<br />
measurement <strong>of</strong> the shunt resistances <strong>of</strong> both 1 mm diameter <strong>and</strong> 3 mm diameter InGaAs diodes<br />
in Fig. 2 shows that the shunt resistances have a semi-logarithmic relationship to temperature.<br />
Shunt Resistance, Ω<br />
10 11<br />
10 10<br />
10 9<br />
10 8<br />
10 7<br />
10 6<br />
IGA3mm<br />
IGA1mm<br />
IGA3mm2<br />
-40 -20 0 20 40<br />
Temperature, o C<br />
Fig. 2. The temperature-dependent shunt resistances <strong>of</strong> 1 mm <strong>and</strong> 3 mm diameter<br />
InGaAs diodes. The shunt resistance <strong>of</strong> the diode should be comparable to the feedback<br />
resistance <strong>of</strong> the preamplifier circuit for low noise, linear operation.<br />
The shunt resistances also increase as linear function <strong>of</strong> the detector area as expected for a defects<br />
with a uniform surface density. The Fig. 2 shows that for 1 mm diameter diodes, shunt<br />
resistances <strong>of</strong> > 10 10 Ω are achieved at detector temperatures <strong>of</strong> - 20 °C which is possible with 2-<br />
stage TE cooling. For 3 mm diameter diodes, detector temperatures <strong>of</strong> at least - 40 °C are needed<br />
to achieve > 10 10 Ω shunt resistance. Unless the diode material quality is improved, larger diode<br />
are expected to require greater cooling to obtain the same shunt resistances.
2.3 Temperature-dependent detector performance<br />
The importance <strong>of</strong> the ability to cool the detector to below ambient temperature is shown by<br />
Fig. 3. The equivalent dark current (calculated from the output <strong>of</strong>fset voltage in dark) <strong>and</strong> its<br />
st<strong>and</strong>ard deviation at a preamplifier gain <strong>of</strong> 10 10 V/A are shown. The st<strong>and</strong>ard deviations are<br />
measured using 10 measurements at number <strong>of</strong> power-line cycles (NPLC) <strong>of</strong> 10 or 0.13 Hz. The<br />
equivalent dark current is only weakly dependent on the detector temperature with a decrease<br />
from 3 pA to about 1 pA as the detector is cooled from room temperature to -70 °C. The change<br />
in the dark current with decreasing temperature indicates that the stabilizing the detector<br />
temperature is important in avoiding dark-current drift, especially at the In point where the net<br />
photocurrent is only about 23 pA. With cooling <strong>of</strong> the detector, the st<strong>and</strong>ard deviation <strong>of</strong> the<br />
equivalent dark current changes much more, from about 100 fA to 2.4 fA.<br />
Dark Current, pA<br />
3.5<br />
3.0<br />
2.5<br />
2.0<br />
1.5<br />
1.0<br />
0.5<br />
0.0<br />
1<br />
-80 -60 -40 -20 0 20 40<br />
Detector Temperature, o C<br />
Fig. 3. Equivalent dark current <strong>and</strong> its st<strong>and</strong>ard deviation versus temperature.<br />
100<br />
10<br />
St. Dev., fA
Although the detector was cooled to lower temperatures than -70 °C, the heat generated from the<br />
TE coolers could not be readily dissipated which lead to self heating <strong>of</strong> the detector. We<br />
observed a slow drift <strong>of</strong> the equivalent dark current when the temperature <strong>of</strong> the detector was set<br />
to lower temperatures which precluded stable measurements <strong>of</strong> st<strong>and</strong>ard deviations <strong>of</strong> the<br />
equivalent dark current. These measurements indicate that close to Si-type performance <strong>of</strong> few<br />
fA noise-equivalent current [6] is possible with 4-stage TE cooling. This low-noise performance<br />
is especially important at the In-point where any decrease in the noise-equivalent power directly<br />
leads to a decrease in the noise-equivalent temperatures.<br />
2.4 Size-<strong>of</strong>-source effect<br />
Since the radiation thermometer is designed for transfer <strong>of</strong> the ITS-90 temperatures to other<br />
blackbodies, the suppression <strong>of</strong> the SSE in comparing small fixed-point cavities to larger area<br />
variable temperature blackbody cavities is critical. In the design <strong>of</strong> a radiation thermometer to<br />
have small SSE, it is important to use a low-scatter objective lens in addition to the incorporation<br />
<strong>of</strong> a Lyot stop [7]. Although SSE can be changed by removing the objective lens, such drastic<br />
steps will result in decrease <strong>of</strong> the entrance pupil leading to extremely low throughput <strong>and</strong><br />
inability to measure at low temperatures due to the high noise. Furthermore, the introduction <strong>of</strong><br />
any element which can lead to further scatter into the field stop should be discouraged such as<br />
protective windows or viewing beamsplitters which are directly in the optical path <strong>of</strong> the<br />
radiation. The SSE measured using a 10 mm diameter central obscuration is shown in Fig. 4.<br />
The measurements are performed using a high-power 1 W LED source as described<br />
previously [8]. The LED source has sufficient output in the near infrared wavelength region for<br />
these measurements. The low SSE measured at 50 mm source diameter indicates that our design<br />
is effective at suppressing internal scatter. The comparison <strong>of</strong> the SSE in terms <strong>of</strong> temperature
corrections are shown in Table 2 with SSE <strong>of</strong> 7x10 -5 <strong>and</strong> 1x10 -3 converted to their temperature<br />
corrections at the respective fixed points. If the SSE can be reduced to 7x10 -5 then the<br />
corrections can be included as terms in the total uncertainty budget, while larger SSE require<br />
systematic correction terms as shown in Table 2.<br />
SSE<br />
8.0x10 -5<br />
6.0x10 -5<br />
4.0x10 -5<br />
2.0x10 -5<br />
0.0<br />
0 5 10 15 20 25 30 35 40 45 50 55<br />
Diameter, δ , mm<br />
Fig. 4. The SSE measured using a central obscuration <strong>of</strong> 10 mm diameter with the outer diameter<br />
opened up to 50 mm. The use <strong>of</strong> low scatter objective with a tilted field stop along with a Lyot<br />
stop results in low SSE.
Table 2. The SSE = 7x10 -5 <strong>and</strong> 1x10 -3 converted to temperature corrections. The smaller SSE<br />
corrections can be folded into the uncertainty budget while the larger SSE requires a correction<br />
factor.<br />
SSE = 7x10<br />
Fixed Point Temperature [ °C ]<br />
-5<br />
SSE = 1x10<br />
[ K ]<br />
-3<br />
[ K ]<br />
In 156.5985 0.001 0.020<br />
Sn 231.928 0.002 0.027<br />
Zn 419.527 0.004 0.052<br />
Al 660.323 0.007 0.094<br />
Ag 961.78 0.011 0.164<br />
2.5 Optical Performance<br />
The InGaAs radiation thermometer utilizes a commercial 50 mm diameter achromat with a focal<br />
length <strong>of</strong> 200 mm with nearly 1:1 finite-conjugate imaging. Since commercial achromatic lenses<br />
are designed for infinite-conjugate imaging, the imaging performance suffers as shown by the<br />
Strehl ratio in Table 3. The Strehl ratio for a perfect point source imaging will be 1.0, <strong>and</strong> the<br />
ratio will approach this value as the imaging performance improves. The Strehl ratio increases as<br />
the wavelength increases which indicates that imaging performance is better at 1550 nm than at<br />
500 nm. Furthermore, achromatic lenses will generally have two wavelengths were the images<br />
distances will be equal for a set object distance with the chromatic focal shift depending on the<br />
lens material <strong>and</strong> thickness. Since the radiation thermometer is designed to transfer a temperature<br />
scale from one blackbody to another without any desired spatial structure within the cavity, the<br />
need for imaging performance is much reduced. Although a single achromat will have much<br />
worse imaging performance than that <strong>of</strong> multi-element photographic-type lenses, the single,<br />
cemented achromat will have reduced scatter <strong>and</strong> consequently much lower SSE than that <strong>of</strong><br />
multi-element lenses. All these optical performance metrics can be modeled using a commercial
modeling program. Table 3 shows that although the alignment <strong>of</strong> the radiation thermometer can<br />
be performed in the visible wavelength, the object distances to have the same image distance at<br />
1550 nm <strong>and</strong> at 500 nm differ by 25 mm. Since the internal focus is difficult to adjust, the object<br />
distance can be <strong>of</strong>fset by this difference due to chromatic aberrations.<br />
Table 3. The optical parameters <strong>of</strong> the 200 mm focal length achromatic objective lens.<br />
Moving the object distance for 1550 nm results comparable image distance to the<br />
500 nm wavelength. The Strehl ratio also improves at 1550 nm as compared to 500 nm<br />
indicating better imaging performance.<br />
Object Distance Image Distance Strehl<br />
Wavelength [ nm ] [ mm ]<br />
[ mm ]<br />
Ratio<br />
500 500 323.91 0.0738<br />
1550 500 334.49 0.213<br />
1550 525 324 0.238<br />
2.6 Preamplifier Gain Corrections<br />
Since the InGaAs radiation thermometer should have a linear signal versus radiance <strong>of</strong> the<br />
blackbody, the preamplifier gain settings need to be normalized against each other. In this<br />
radiation thermometer, precision, metal-film-on-ceramic resistors are used in the trans-impedance<br />
amplifier. The resistors are chosen to have low temperature variation <strong>of</strong> resistance. The<br />
preamplifier was attached to a Si detector with high shunt resistance <strong>and</strong> placed in front <strong>of</strong> a<br />
broad-b<strong>and</strong> white LED source. The 1 W, high-power LED source was chosen for its temporally<br />
stable output so that the gain ratios can be determined with low uncertainty. The optical power <strong>of</strong><br />
the LED source incident on the detector was varied by using a combination <strong>of</strong> diffusers, variable
source apertures or by changing the distance between the source <strong>and</strong> the detector. The LED<br />
source, for the most stable operations, was left on for about 24 hours to reach a thermal<br />
equilibrium. The ratios <strong>of</strong> gain factors shown in Table 4 indicate that at the lower gain settings,<br />
the ratios between two gains different by 10 are at this value within the uncertainties <strong>of</strong> the<br />
measurements <strong>and</strong> the resistances. The greatest deviation is present at gain factors <strong>of</strong> 10 10 V/A<br />
<strong>and</strong> 10 9 V/A where the resistors used in the preamplifer deviate more from their assigned values.<br />
Table 4. The gain ratios <strong>of</strong> the preamplifier measured using a<br />
3. BLACKBODY MEASUREMENTS<br />
1 W white LED source with a Si detector.<br />
Gains<br />
Measurement<br />
Uncertainty<br />
Compared Gain Ratios (k = 2)<br />
10 6 /10 5 9.998 0.002<br />
10 7 /10 6 10.001 0.002<br />
10 8 /10 7 10.000 0.002<br />
10 8 /10 9 10.000 0.002<br />
10 9 /10 10 9.957 0.002<br />
The InGaAs radiation thermometer was placed in front <strong>of</strong> a variable-temperature blackbody<br />
(VTBB) which was set at the respective ITS-90 fixed-point temperatures. The measurements on<br />
actual fixed-points could not be performed in time for this submission. These measurements are<br />
used to determine the gain settings <strong>of</strong> the preamplifier, the throughput <strong>of</strong> the radiation<br />
thermometer <strong>and</strong> to measure the noise-equivalent temperature difference at the fixed-point<br />
temperatures. Work is planned to measure the freezing-points directly using the InGaAs<br />
radiation thermometer. The measured NETD could be affected by the temporal stability <strong>of</strong> the
VTBB, <strong>and</strong> our measurements shown in Table 5 give the upper value <strong>of</strong> this parameter. The<br />
photocurrent at the In-point is comparable to InGaAs radiation thermometers developed at other<br />
national measurement institutes indicating that the throughputs are comparable. The lower<br />
NETD exhibited by the <strong>NIST</strong> design is due to the optimization <strong>of</strong> the preamplifier <strong>and</strong> detector,<br />
especially by 4-stage cooling <strong>of</strong> the detector <strong>and</strong> the resultant decrease in the noise-equivalent<br />
photocurrent seen in Fig. 5. Once the <strong>NIST</strong> InGaAs radiation thermometer is calibrated using the<br />
ITS-90 fixed points, a modified 3-parameter Planck equation will be used for the interpolation.<br />
Photocurrent , A<br />
1E-4<br />
1E-5<br />
1E-6<br />
1E-7<br />
1E-8<br />
1E-9<br />
0.005<br />
0.004<br />
0.003<br />
0.002<br />
1E-10<br />
0.001<br />
1E-11<br />
0 100 200 300 400 500 600 700 800 900 1000 1100<br />
Temperature, o C<br />
Fig. 5. The measured photocurrents <strong>of</strong> the InGaAs radiation thermometer at the various fixed<br />
point temperatures. For convenience, the measurements were performed using a variable-<br />
temperature blackbody set to the ITS-90 temperatures. The NETD was determined from the<br />
st<strong>and</strong>ard deviation <strong>of</strong> the measurements.<br />
NETD, K
Table 5. The gains <strong>and</strong> the photocurrents at the fixed-point temperatures measured<br />
using a variable-temperature blackbody set at the respective temperatures.<br />
Fixed Point Temperature [ °C ] Gain [ V/A ] Signal [ A ] NETD [ °C ]<br />
In 156.5985 10 10 2.26251E-11 0.0050<br />
Sn 231.928 10 9 5.36748E-10 0.0011<br />
Zn 419.527 10 7 7.45110E-08 0.0015<br />
Al 660.323 10 6 2.23358E-06 0.0009<br />
Ag 961.78 10 5 2.63766E-05 0.0013<br />
We have also tried to use alternating-current (AC) mode measurements using a 10.1 Hz tuning-<br />
fork chopper placed directly in front <strong>of</strong> the field stop with a lock-in detection system. With the<br />
AC mode, lower blackbody temperatures, to 80 °C, could be measured, although with the added<br />
complexities <strong>of</strong> using the lock-in amplifier. Further work is pursued to make low uncertainty AC<br />
mode measurements.<br />
4. DISCUSSION AND FUTURE WORK<br />
Thus far, radiation thermometers with InGaAs detectors have only been used to transfer the<br />
source-based ITS-90 scale to other sources or blackbodies. Due to the developments <strong>of</strong> laser-<br />
based calibration facilities <strong>and</strong> low-noise <strong>and</strong> high linearities <strong>of</strong> InGaAs detectors, the possibility<br />
<strong>of</strong> detector-based thermodynamic temperature determinations are being explored. The detector-<br />
based calibration <strong>of</strong> the InGaAs radiation thermometer would proceed in a similar way as with Si-<br />
diode based radiation thermometer [9]. A transfer radiometer would need to be calibrated for<br />
spectral power responsivity by comparison to the cryogenic electrical–substitution radiometer<br />
using infrared lasers, <strong>and</strong> thus the optical power scale would be derived from the electrical power.<br />
The transfer radiometer would need a precision aperture <strong>and</strong> known spatial uniformity <strong>of</strong><br />
responsivity so that the power responsivity can be converted to spectral irradiance responsivity.
The conversion to irradiance responsivity can be performed with detectors in a trap configuration<br />
or with detectors which are attached to integrating sphere inputs. With a laser-irradiated sphere<br />
along with the calibrated transfer radiometer, the InGaAs radiation thermometer can be calibrated<br />
for absolute detector-based radiance responsivity. Since Spectralon <strong>and</strong> other sintered or packed<br />
polytetrafluoroethylene (PTFE) materials have a high reflectance at 1.55 μm, integrating spheres<br />
have high throughput <strong>and</strong> spatial uniformity. It is anticipated that such a detector-based radiation<br />
thermometer could be calibrated to 0.05 % (k = 2) [10]. The resulting thermodynamic<br />
temperature uncertainties are shown in Table 6. Although these uncertainties are much larger<br />
than those obtained using gas thermometry, the uncertainties are lower than those achieved by<br />
noise-thermometry.<br />
Table 6. The thermodynamic temperature uncertainties for total uncertainty<br />
5. CONCLUSIONS<br />
<strong>of</strong> 0.05 % (k = 2) at the respective fixed-point temperatures.<br />
Total Uncertainty = 0.05%<br />
Fixed Point Temperature [ °C ] (k = 2) [ K ]<br />
In 156.5985 0.0099<br />
Sn 231.928 0.0137<br />
Zn 419.527 0.0258<br />
Al 660.323 0.0469<br />
Ag 961.78 0.0821<br />
We described a noise-optimized InGaAs radiation thermometer operating at 1550 nm which is<br />
capable <strong>of</strong> < 5 mK NETD at 157 °C. The SSE has also been reduced to < 7 x 10 -5 at 50 mm<br />
which leads to low uncertainties when comparing fixed-point blackbodies to other larger-area
variable-temperature blackbodies. These results are due to the implementation <strong>of</strong> 4-stage cooling<br />
<strong>of</strong> the diode resulting in high shunt resistances along with a Lyot stop which acts as an aperture<br />
stop. A stable chassis design is shown using graphite-epoxy rods for long-term stability <strong>of</strong><br />
radiance responsivity. The preamplifier gain ratios are measured for use over the 5-decade<br />
dynamic range required <strong>of</strong> the radiation thermometer as the blackbody temperatures range from<br />
150 °C to 1000 °C. In addition to the use <strong>of</strong> this radiation thermometer as an ITS-90 transfer<br />
radiation thermometer, we outline a possible approach to directly measuring thermodynamic<br />
temperature using an absolute detector-based radiance responsivity calibration.<br />
REFERENCES<br />
1<br />
T. Ricolfi, M. Battuello, F. Girard, G. Machin, H. McEvoy, S. Ugur, A. Diril, Meas. Sci. Technol. 13,<br />
2090 (2002)<br />
2 F.Girard, T. Ricolfi, in Proceedings TEMPMEKO 2004, 9th International Symposium on Temperature<br />
<strong>and</strong> Thermal Measurements in Industry <strong>and</strong> Science, ed. by D. Zvizdi´c (FSB/LPM, Zagreb, Croatia,<br />
2005), pp. 827–832<br />
3 T. Ricolfi, F. Girard, in Proceedings <strong>of</strong> TEMPMEKO ’99, 7th International Symposium on Temperature<br />
<strong>and</strong> Thermal Measurements in Industry <strong>and</strong> Science, ed. by J.F. Dubbeldam, M.J. de Groot (Edauw<br />
Johannissen bv, Delft, 1999), pp. 593–598<br />
4 B. Gutschwager, S. Schiller, J. Hartmann, J. Holl<strong>and</strong>t, in Proceedings TEMPMEKO 2004, 9th<br />
International Symposium on Temperature <strong>and</strong> Thermal Measurements in Industry <strong>and</strong> Science, ed.<br />
by D. Zvizdi´c (FSB/LPM, Zagreb, Croatia, 2005), pp. 605–610<br />
5 G. Romeo, G. Frulla, J. Compos. Mater. 29, 751 (1995)<br />
6 G.P. Eppeldauer, J. Res. Natl. Bur. St<strong>and</strong>. (U.S.) 105, 29 (2000)<br />
7 H.W. Yoon, D.W. Allen, R.D. Saunders, Metrologia 42, 89 (2005)<br />
8 D.W. Allen, G. Dezsi, H.W. Yoon, in Proceedings TEMPMEKO 2004, 9th International Symposium<br />
on Temperature <strong>and</strong> Thermal Measurements in Industry <strong>and</strong> Science, ed. by D. Zvizdi´c (FSB/LPM,<br />
Zagreb, Croatia, 2005), pp. 817–822<br />
9<br />
H.W. Yoon, D.W. Allen, C.E. Gibson, M. Litorja, R.D. Saunders, S.W. Brown, G.P. Eppeldauer, K.R.<br />
Lykke, Appl. Optics 46, 2870 (2007)<br />
10 S.W. Brown, G.P. Eppeldauer, K.R. Lykke, Appl. Optics 45, 8218 (2006)<br />
16
INSTITUTE OF PHYSICS PUBLISHING METROLOGIA<br />
Metrologia 40 (2003) S154–S158 PII: S0026-1394(03)56889-X<br />
Linearity <strong>of</strong> InGaAs photodiodes<br />
H W Yoon, J J Butler, T C Larason <strong>and</strong> G P Eppeldauer<br />
Optical Technology Division, <strong>NIST</strong>, Gaithersburg, MD 20899-8441, USA<br />
Published 7 February 2003<br />
Online at stacks.iop.org/Met/40/S154<br />
Abstract<br />
In radiometry or pyrometry, radiometers are <strong>of</strong>ten used to assign the spectral<br />
radiance or radiance temperatures <strong>of</strong> sources using ratios <strong>of</strong> signals which<br />
can differ by several decades. For performing ratios between such sources<br />
with low uncertainties, the linearity <strong>of</strong> the detectors used in the transfer<br />
radiometers needs to be characterized. The linearity <strong>of</strong> InGaAs photodiodes<br />
has been studied using the flux-addition method using a broadb<strong>and</strong> infrared<br />
source with a visible-blocking filter. Using this technique, 18 InGaAs<br />
photodiodes from four different vendors were studied without spectral<br />
filtering in a broad wavelength region from 900 nm to 1700 nm with the<br />
diodes underfilled by the incident flux. The linearity <strong>of</strong> InGaAs photodiodes<br />
was determined within the range <strong>of</strong> photocurrents from 10 −8 Ato10 −4 A.<br />
All the InGaAs photodiodes demonstrated linearity from 10 −7 Ato10 −4 A<br />
within the exp<strong>and</strong>ed uncertainties <strong>of</strong> 0.08% (k = 2). The uncertainty in the<br />
linearity measurement below 10 −8 A is increased due to the increased noise<br />
in the photocurrent arising from the feedback resistance <strong>of</strong> the<br />
transimpedance amplifier being greater than the shunt resistance <strong>of</strong> the<br />
photodiode.<br />
1. Introduction<br />
InGaAs photodiodes are critical components in optical networks,<br />
<strong>and</strong> as the manufacturing process for InGaAs improves,<br />
they are being increasingly used as detectors in thermal imaging,<br />
pyrometry [1] <strong>and</strong> spectroradiometry [2]. Previously, the<br />
electronic characteristics <strong>of</strong> InGaAs <strong>and</strong> Ge photodiodes using<br />
current preamplifiers were compared, <strong>and</strong> the InGaAs photodiodes<br />
were found to have much a smaller temperature dependence<br />
<strong>and</strong> lower noise floor than Ge photodiodes [3]. Although<br />
InGaAs photodiodes are widely used as receivers in<br />
optical networks, they have not been extensively evaluated for<br />
use in spectroradiometry. Since the detector could be used to<br />
assign the spectral radiances <strong>of</strong> vastly different sources using<br />
radiance ratios or signal ratios from one source to another, the<br />
linearity <strong>of</strong> the detectors must be quantified for use in spectroradiometry.<br />
In addition, these particular photodiodes have<br />
been used as working st<strong>and</strong>ards in the key comparison K2.a <strong>of</strong><br />
the Consultative Committee on Photometry <strong>and</strong> Radiometry<br />
for the intercomparison <strong>of</strong> spectral power responsivity from<br />
900 nm to 1600 nm [4]. Since each laboratory participating<br />
in the intercomparison could use different optical power levels<br />
to assign the spectral responsivity, the determination <strong>of</strong><br />
the linearity <strong>of</strong> these InGaAs photodiodes is critical. To our<br />
knowledge, there has not been a study <strong>of</strong> InGaAs photodiode<br />
linearity although the linearity <strong>of</strong> these detectors is an<br />
important issue in many applications. The different InGaAs<br />
diodes studied <strong>and</strong> their electrical characterizations are listed in<br />
table 1.<br />
The linearity <strong>of</strong> detectors can be measured with several<br />
different techniques. A common technique is to insert a filter<br />
into the optical path at different optical power levels. The nonlinearity<br />
is measured as a change in the filter-in to the filter-out<br />
signal ratios. Another well-known method is the beam-flux<br />
addition using double apertures. In this study, we use the<br />
combination <strong>of</strong> these two methods with the Beamconjoiner III<br />
apparatus developed at the <strong>National</strong> <strong>Institute</strong> <strong>of</strong> <strong>St<strong>and</strong>ards</strong> <strong>and</strong><br />
Technology [5].<br />
Although the linearity <strong>of</strong> photodiodes can also be<br />
dependent on the wavelength <strong>of</strong> the measurements, such<br />
wavelength dependences were not investigated during this<br />
study. The InGaAs photodiode was illuminated using a<br />
broadb<strong>and</strong> source, an FEL lamp, <strong>and</strong> only a single visible<br />
blocking filter was placed in front <strong>of</strong> the photodiode. All the<br />
photodiodes studied had active areas <strong>of</strong> 5 mm diameter, <strong>and</strong><br />
the incident flux was made to underfill the diode. Wavelengthdependent<br />
non-linearities are possible, especially near the<br />
b<strong>and</strong>-gap wavelength <strong>of</strong> the InGaAs around 1.7 µm.<br />
The linearity <strong>of</strong> InGaAs photodiodes was determined to<br />
an exp<strong>and</strong>ed uncertainty <strong>of</strong> 0.08% (k = 2) within the range<br />
<strong>of</strong> photocurrents from 10 −8 Ato10 −4 A. Below 10 −8 A, the<br />
uncertainty in the linearity measurement is larger due to the<br />
increased noise in the photocurrent arising from the feedback<br />
resistance <strong>of</strong> the transimpedance amplifier being greater than<br />
0026-1394/03/SS0154+05$30.00 © 2003 BIPM <strong>and</strong> IOP Publishing Ltd Printed in the UK S154
Linearity <strong>of</strong> InGaAs photodiodes<br />
Table 1. The shunt resistances <strong>and</strong> the shunt capacitances <strong>of</strong> all the tested photodiodes are shown. The shunt capacitance <strong>of</strong> the <strong>NIST</strong> 14<br />
photodiode could not be measured.<br />
Shunt Shunt<br />
Serial resistance/ capacitance/<br />
Detector Manufacturer <strong>and</strong> model number M� nF<br />
<strong>NIST</strong> 01 Fermionics 123 17.50 1.41<br />
<strong>NIST</strong> 02 Fermionics 124 12.80 1.43<br />
<strong>NIST</strong> 03 Fermionics 125 15.40 1.42<br />
<strong>NIST</strong> 04 GPD GAP5000, D/C 9812 1 1.78 1.33<br />
<strong>NIST</strong> 05 GPD GAP5000, D/C 9812 2 2 1.1<br />
<strong>NIST</strong> 06 GPD GAP5000, D/C 9812 3 1.9 1.14<br />
<strong>NIST</strong> 07 GPD GAP5000, D/C 9812 4 1.8 1.2<br />
<strong>NIST</strong> 08 EG&G Optoelec. C30723G 6 3.75 0.826<br />
<strong>NIST</strong> 09 EG&G Optoelec. C30723G 9 5.00 1.50<br />
<strong>NIST</strong> 10 EG&G Optoelec. C30723G 11 5.71 1.58<br />
<strong>NIST</strong> 11 EG&G Optoelec. C30723G 13 4.44 1.67<br />
<strong>NIST</strong> 12 TDC P/N: 35PD5M-TO 2 5 1.8<br />
<strong>NIST</strong> 13 TDC P/N: 35PD5M-TO 3 2.5 1.87<br />
<strong>NIST</strong> 14 TDC P/N: 35PD5M-TO 4 0.00125 —<br />
<strong>NIST</strong> 15 TDC P/N: 35PD5M-TO 5 5 1.85<br />
<strong>NIST</strong> 16 GPD GAP5000, D/C 9849 11 1.80 1.27<br />
<strong>NIST</strong> 17 GPD GAP5000, D/C 9849 12 0.58 1.37<br />
<strong>NIST</strong> 18 GPD GAP5000, D/C 9841 13 1.40 1.44<br />
the shunt resistance <strong>of</strong> the photodiode. The shunt resistances<br />
<strong>and</strong> the junction capacitances <strong>of</strong> the photodiodes have also<br />
been measured, <strong>and</strong> the increased noise at the low power<br />
levels is correlated with the differences in the respective shunt<br />
resistances.<br />
2. Experimental method<br />
The linearity <strong>of</strong> the InGaAs photodiodes was determined<br />
using the Beamconjoiner III apparatus. Our method utilizes<br />
a visible-blocking filter (Hoya R72) 1 <strong>and</strong> reflective neutral<br />
density filters to provide 40 different flux values, resulting<br />
in 120 different combinations to attenuate the light source, a<br />
current-stabilized FEL lamp. The incident light on the InGaAs<br />
diodes is broadb<strong>and</strong> infrared with the visible range filtered.<br />
The neutral density filters were constructed using metallized<br />
quartz substrates for transmission from 0.2 µmto2.5µm. The<br />
optical diagram <strong>of</strong> the Beamconjoiner III is shown in figure 1.<br />
The incident flux is introduced into the opening <strong>of</strong> the lighttight<br />
box <strong>and</strong> is split into two directions by the beamsplitter 1.<br />
Each <strong>of</strong> the filter wheels 1 <strong>and</strong> 2 has four different reflective<br />
neutral density filters with circular openings <strong>of</strong> 4 cm diameter,<br />
<strong>and</strong> the filter wheel 3 has five filters. Combined with the<br />
blocked value for each <strong>of</strong> the filter wheels, a total <strong>of</strong> (5×5×6)<br />
150 different combinations can be formed. The filter wheel<br />
3 acts to reduce the total level <strong>of</strong> the combined flux, <strong>and</strong><br />
the dynamic range in the optical flux <strong>of</strong> the highest level to<br />
the lowest level is about 500 : 1. The rotation <strong>of</strong> the filter<br />
wheels is controlled using three separate stepper motors, <strong>and</strong><br />
the rotational positions <strong>of</strong> the filter wheels are verified with a<br />
check <strong>of</strong> the home position optical switch each time the stepper<br />
motor is rotated. The change in the optical flux is performed<br />
in the collimated beam before the imaging <strong>of</strong> the flux onto the<br />
detector by the spherical mirror.<br />
1 Certain commercial equipment, instruments or materials are identified<br />
in this paper to foster underst<strong>and</strong>ing. Such identification does not imply<br />
recommendation or endorsement by the <strong>National</strong> <strong>Institute</strong> <strong>of</strong> <strong>St<strong>and</strong>ards</strong> <strong>and</strong><br />
Technology, nor does it imply that the material or equipment are necessarily<br />
the best available for the purpose.<br />
imaging<br />
mirror<br />
filter<br />
wheel 3<br />
detector<br />
mirror 1<br />
beam<br />
splitter 2<br />
filter<br />
wheel 2<br />
filter<br />
wheel 1<br />
mirror 2<br />
beam<br />
splitter 1<br />
light-tight<br />
box<br />
visible<br />
blocking<br />
filter<br />
source<br />
Figure 1. Optical diagram <strong>of</strong> the Beamconjoiner III apparatus. The<br />
source is split into two directions using the beamsplitter 1 <strong>and</strong><br />
recombined at the detector using beamsplitter 2. The combination<br />
<strong>of</strong> the three filter wheels can produce 120 different signal levels<br />
using 40 different flux levels. The optical flux is changed in the<br />
collimated beam before imaging onto the detector.<br />
In the measurement protocol, each <strong>of</strong> the filter wheel<br />
positions is assigned a distinct value i, k, j corresponding to<br />
the positions <strong>of</strong> the filter wheel 1, 2, 3, respectively. Each <strong>of</strong><br />
the 120 different filter combinations is in turn also assigned<br />
a distinct number, <strong>and</strong> the sequence <strong>of</strong> filter wheel positions<br />
for each run is determined using a r<strong>and</strong>om number generator<br />
prior to each run. Every group <strong>of</strong> four measurements is<br />
followed by a dark measurement, resulting in 30 separate dark<br />
measurements for each run. Since each dark signal has a time<br />
stamp, any change in the dark signal can be monitored. None<br />
<strong>of</strong> the InGaAs photodiodes discussed in this study showed any<br />
evidence <strong>of</strong> dark signal drift.<br />
Since each run could take up to 1.5 h or longer depending<br />
upon the signal averaging needed for optimal signal-to-noise<br />
ratios, the source flux has to be temporally stable. The<br />
lamp was stabilized by measuring the voltage drop across a<br />
calibrated resistor to determine the current, <strong>and</strong> a closed-loop<br />
Metrologia, 40 (2003) S154–S158 S155
HWYoonet al<br />
current stabilization was used, which adjusted the current every<br />
5 s to the desired value.<br />
Although the power responsivity <strong>of</strong> the InGaAs<br />
photodiodes is temperature sensitive, the photodiodes used<br />
in the CCPR K2.a were not operated with temperature<br />
stabilization. The temperature was monitored using a<br />
thermistor held in contact with the back <strong>of</strong> the photodiode,<br />
<strong>and</strong> each photodiode was allowed sufficient time to come<br />
to temperature equilibrium with the ambient laboratory<br />
environment. Temperature changes <strong>of</strong> the photodiode <strong>of</strong> few<br />
degrees resulted in noisy signal/flux values since the doublebeam<br />
flux method requires both the source <strong>and</strong> the detector to<br />
be stable during the 120 different measurements.<br />
3. Linearity analysis<br />
Although 150 different signals are possible, only 120 signals<br />
are measurements <strong>of</strong> fluxes from the source. Each signal can<br />
be written as a response to the incident flux, or conversely, each<br />
flux results in signal as a function <strong>of</strong> the flux,<br />
φ(i,j,k) = φ(i,j) + φ(j,k)<br />
= r0 + s(i,j,k) + r2s 2 (i,j,k)+ ···+ rns n (i,j,k) (1)<br />
where φ(i,j,k) denote the flux, s(i,j,k) is the measured<br />
signal at the detector, <strong>and</strong> r0,r2,...,rn are the coefficients<br />
which relate the signal to the flux. The total flux at the detector<br />
is a sum <strong>of</strong> the individual fluxes, φ(i,j) <strong>and</strong> φ(j,k), <strong>and</strong><br />
flux addition is inherently linear. Since each flux can be an<br />
independent flux or sums <strong>of</strong> independent fluxes, <strong>and</strong> although<br />
120 signals are measured along with 30 dark signals, only 40<br />
different fluxes exist with 20 fluxes from each <strong>of</strong> the two paths.<br />
Thus equation (1) becomes an over-determined equation with<br />
40 unknown fluxes <strong>and</strong> one or many unknown coefficients, r0,<br />
r2,...,rn, but with 120 equations. The unknown fluxes are<br />
found by setting up a system <strong>of</strong> linear equations <strong>and</strong> performing<br />
a least-squares fit <strong>of</strong> the signals for the 40 unknown fluxes <strong>and</strong><br />
the coefficients.<br />
Due to the complexity <strong>of</strong> the matrix inversion <strong>and</strong> the<br />
possibility <strong>of</strong> errors in the convergence, the analysis program<br />
was tested using artificial data sets which simulated the<br />
experimental results from the Beamconjoiner. Different<br />
constant values were used in the simulations, <strong>and</strong> second-order<br />
correction factors were also simulated. The analysis program<br />
was able to correctly converge on all <strong>of</strong> the coefficients in the<br />
artificial data sets.<br />
The determination <strong>of</strong> linearity is measured using the<br />
residuals <strong>of</strong> the fluxes found using the fit to the measured signal<br />
corrected by the appropriate coefficients. Initially, only the<br />
constant correction, r0, is applied <strong>and</strong> the residuals <strong>of</strong> the fit,<br />
φ(i,j,k) − [r0 + s(i,j,k)] (2)<br />
are plotted against the signals <strong>and</strong> examined for indications<br />
<strong>of</strong> the need for higher order corrections. The linearity <strong>of</strong> the<br />
signals is determined from a plot <strong>of</strong> the ratio <strong>of</strong> the measured<br />
signal to the calculated flux,<br />
s(i,j,k)<br />
φ(i,j,k)<br />
<strong>and</strong> the ratios are fitted using a linear function to determine the<br />
uncertainty component <strong>of</strong> the total signal due to non-linearity.<br />
(3)<br />
Since flux is inherently linear, <strong>and</strong> the signals could be nonlinear,<br />
any non-linearity <strong>of</strong> the signal will be evident from the<br />
curvature <strong>of</strong> the ratios.<br />
4. Discussion<br />
A plot <strong>of</strong> the ratios <strong>of</strong> the measured signals to the fluxes<br />
versus the signals for the <strong>NIST</strong> 01 photodiode is shown<br />
in figure 2. The plot shows signal/flux ratios from three<br />
separate runs, each consisting <strong>of</strong> 120 signal measurements.<br />
The measurements were performed using an additional neutral<br />
density filter between the filter wheel 3 <strong>and</strong> the detector to<br />
reduce the overall signal such that the wide dynamic range<br />
could be spanned from 10 −9 Ato10 −4 A. The symmetry <strong>of</strong><br />
the residuals above <strong>and</strong> below the y = 0 axis in figure 2<br />
indicates the goodness <strong>of</strong> fit, since any non-linearity would<br />
be manifest in deviations from a symmetric distribution. From<br />
the plot, the detector is determined to be linear from 1×10 −8 A<br />
to 1 × 10 −4 A in photocurrent with an uncertainty <strong>of</strong> 0.08%<br />
(k = 2). The uncertainty is determined from the goodness <strong>of</strong><br />
a linear fit to the values in the same range.<br />
All the InGaAs photodiodes examined showed linear behaviour<br />
with an uncertainty <strong>of</strong> 0.08% between 5 × 10 −8 A <strong>and</strong><br />
1 × 10 −4 A. Some <strong>of</strong> the photodiodes also exhibited increased<br />
noise below 5 × 10 −8 A with decreasing photocurrent. A plot<br />
<strong>of</strong> the signal/flux is shown for the detector <strong>NIST</strong> 18 in figure 3<br />
<strong>and</strong> shows that the signal to flux ratios below 5 × 10 −8 A become<br />
noisy as compared to the same measurements <strong>of</strong> <strong>NIST</strong><br />
01. The reasons for the increase in the signal noise will be explored<br />
in the noise analysis section <strong>of</strong> this paper. For example,<br />
the Beamconjoiner was used to measure the linearity <strong>of</strong> silicon<br />
photodiodes from 10 −11 Ato10 −3 A to within 0.054% (k = 2),<br />
since Si diodes have typical shunt resistances <strong>of</strong> 1 G� [5].<br />
In conjunction with the linearity testing, all the InGaAs<br />
photodiodes were also measured for shunt resistance <strong>and</strong> shunt<br />
capacitance. Table 1 shows the measured shunt resistances <strong>and</strong><br />
the shunt capacitances <strong>of</strong> the individual InGaAs photodiodes.<br />
With the exception <strong>of</strong> two diodes, <strong>NIST</strong> 08 <strong>and</strong> <strong>NIST</strong> 14, all<br />
Signal * Flux -1<br />
1.010<br />
1.005<br />
1.000<br />
0.995<br />
<strong>NIST</strong> 01<br />
0.990<br />
1E-10 1E-9 1E-8 1E-7 1E-6 1E-5 1E-4 1E-3<br />
Photocurrent / A<br />
Figure 2. The ratios <strong>of</strong> the signal divided by the calculated flux<br />
plotted versus the signal for the <strong>NIST</strong> 01 photodiode (17.5 M�<br />
shunt resistance). A total <strong>of</strong> three runs are plotted with each run<br />
consisting <strong>of</strong> 120 different signal levels. The ratios can be measured<br />
with
Signal * Flux -1<br />
1.010<br />
1.005<br />
1.000<br />
0.995<br />
<strong>NIST</strong> 18<br />
0.990<br />
1E-10 1E-9 1E-8 1E-7 1E-6 1E-5 1E-4 1E-3<br />
Photocurrent / A<br />
Figure 3. The ratios <strong>of</strong> the signal divided by the calculated flux<br />
plotted versus the signal for the <strong>NIST</strong> 18 photodiode (1.40 M�<br />
shunt resistance). The ratios can be measured within the
HWYoonet al<br />
linearity could be measured from 10 −8 Ato10 −4 A with an<br />
exp<strong>and</strong>ed uncertainty <strong>of</strong> 0.08% (k = 2). When the shunt<br />
resistance was increased by cooling one <strong>of</strong> the photodiodes,<br />
the linearity measurement range could be extended a decade<br />
due to the increase <strong>of</strong> the shunt resistance.<br />
References<br />
[1] Gutschwager B <strong>and</strong> Fischer J 1999 An InGaAs radiation<br />
thermometer with an accurate reference function as transfer<br />
st<strong>and</strong>ard Proc. TEMPMEKO ’99 (Delft, Netherl<strong>and</strong>s)<br />
ed J F Dubbledam <strong>and</strong> M J deGroot<br />
[2] Yoon H W, Proctor J E <strong>and</strong> Gibson C E 2003 FASCAL 2:<br />
A new <strong>NIST</strong> facility for the calibration <strong>of</strong> the spectral<br />
irradiance <strong>of</strong> sources Metrologia 40 S30–4<br />
[3] Eppeldauer G 1997 Electronic characteristics <strong>of</strong> Ge <strong>and</strong> InGaAs<br />
radiometers Proc. SPIE 3061 833–8<br />
[4] Larason T C, Brown S W <strong>and</strong> Lykke K R 2002 InGaAs<br />
photodiodes used in a CCPR near-infrared key comparison<br />
Proc. NEWRAD02 (Gaithersburg, MD)<br />
[5] Thompson A <strong>and</strong> Chen H M 1994 Beamcon III, a linearity<br />
measurement instrument for optical detectors J. Res. Natl.<br />
Inst. St<strong>and</strong>. Technol. 99 751–5<br />
[6] Eppeldauer G <strong>and</strong> Hardis J E 1991 Fourteen-decade<br />
photocurrent measurements with large-area silicon<br />
photodiodes at room temperature Appl. Opt. 30 3091–9<br />
S158 Metrologia, 40 (2003) S154–S158
Short-wave infrared radiometers design <strong>and</strong> characterizations<br />
George P. Eppeldauer <strong>and</strong> Howard W. Yoon<br />
<strong>National</strong> <strong>Institute</strong> <strong>of</strong> <strong>St<strong>and</strong>ards</strong> <strong>and</strong> Technology<br />
Gaithersburg, MD USA 20899<br />
ABSTRACT<br />
Short-wave infrared (SW-IR) radiometers have been developed to extend the <strong>National</strong> <strong>Institute</strong> <strong>of</strong> <strong>St<strong>and</strong>ards</strong><br />
<strong>and</strong> Technology (<strong>NIST</strong>) reference responsivity scales from the silicon wavelength range to 2500 nm. In<br />
addition to spectral power responsivity measurements, where 5 mm diameter extended-InGaAs (EIGA)<br />
detectors are underfilled by the incident radiation, irradiance responsivity calibrations are needed. Irradiance<br />
measuring radiometers are used as reference detectors to calibrate field radiometers in both irradiance <strong>and</strong><br />
radiance measurement modes. In irradiance mode, smaller detectors with high shunt resistance, such as 1 mm<br />
diameter short-wave HgCdTe <strong>and</strong> EIGA detectors are used. Mechanical, optical, thermal, <strong>and</strong> electronic design<br />
considerations <strong>of</strong> SW-IR radiometers are discussed. Noise equivalent currents (NEC) were measured to<br />
evaluate noise equivalent power (NEP) <strong>and</strong> D*.<br />
Keywords: detectivity, extended-InGaAs, infrared, infrared detectors, noise equivalent power, short-wave infrared,<br />
shunt resistance, spectral responsivity, thermoelectric cooling<br />
1. INTRODUCTION<br />
While Si, Ge, <strong>and</strong> InGaAs detector applications, characterizations, <strong>and</strong> calibrations have been described in detail [1, 2],<br />
underst<strong>and</strong>ing <strong>of</strong> radiometer design issues, characterizations <strong>and</strong> calibrations for short-wave infrared (SW-IR) detectors<br />
is still lacking. Photovoltaic extended-InGaAs (EIGA) <strong>and</strong> short-wave HgCdTe (PV-MCT) detectors are commercially<br />
available with high detector shunt resistance [3]. These detectors do not have large ambient-background-produced<br />
signals because their upper wavelength cut-<strong>of</strong>f is low. Consequently, higher radiometer responsivity <strong>and</strong> lower<br />
radiometer output noise can be achieved, which is an important requirement for the SW-IR range where the radiant flux<br />
from ambient temperature targets is lower than at longer wavelengths [3]. Using small-area detectors the shunt<br />
resistance can be further increased, which is important to make radiometers with decreased output noise, linear<br />
operation, <strong>and</strong> low photocurrent-to-voltage conversion uncertainty [1]. The main goal in designing SW-IR radiometers<br />
is to increase the detectivity (D*) close to the background-noise-produced theoretical limit. These improved D* SW-IR<br />
radiometers can be used for ambient temperature measurements [4]. It is anticipated that <strong>NIST</strong>, in the near future, will<br />
begin to issue detector calibration services in the SW-IR wavelength region to 2.5 µm utilizing these st<strong>and</strong>ards.<br />
The design <strong>of</strong> high-D* SW-IR radiometers needs special considerations. Cryogenic cooling is not needed for these<br />
detectors, but 4-stage thermoelectric (TE) coolers must be used to operate the detectors at temperatures close to -80 o C<br />
in order to obtain high shunt resistance. Delivering the dissipated heat away from the TE coolers is an additional<br />
problem compared to traditional temperature control <strong>of</strong> Si, Ge, <strong>and</strong> InGaAs detectors.<br />
Applying SW-IR detectors in a new radiometer design, the <strong>NIST</strong> spectral power responsivity scale can be extended to<br />
2.5 µm. Also, in addition to spectral radiant power responsivity, spectral irradiance <strong>and</strong> radiance responsivities can be<br />
measured by changing the input optics <strong>of</strong> these radiometers. Characterization <strong>of</strong> SW-IR radiometers for measuring the<br />
different radiometric quantities is necessary to keep the measurement uncertainty low. SW-IR transfer st<strong>and</strong>ard<br />
radiometers have also been developed within this project to convert power responsivity into irradiance responsivity.<br />
These irradiance mode radiometers will be used as reference st<strong>and</strong>ards to calibrate both irradiance <strong>and</strong> radiance<br />
Infrared Technology <strong>and</strong> Applications XXXIII, edited by Bjørn F. Andresen, Gabor F. Fulop, Paul R. Norton,<br />
Proc. <strong>of</strong> SPIE Vol. 6542, 65420O, (2007) · 0277-786X/07/$18 · doi: 10.1117/12.720548<br />
Proc. <strong>of</strong> SPIE Vol. 6542 65420O-1
measuring SW-IR radiometers. The calibrated SW-IR radiometers are used as working st<strong>and</strong>ards to disseminate the<br />
pyroelectric radiometer realized <strong>NIST</strong> infrared responsivity scales in the 1 µm to 2.5 µm wavelength range [5, 6].<br />
2. SW-IR DETECTORS<br />
Photovoltaic EIGA detectors are available with 1.9 µm, 2.2 µm, 2.4 µm, <strong>and</strong> 2.6 µm (50 %) wavelength cut-<strong>of</strong>fs. The<br />
wavelength cut-<strong>of</strong>f <strong>of</strong> PV-MCT detectors can be tuned by changing the material composition [3]. The PV-MCT<br />
detectors, tested in this work, have a 2.8 µm wavelength cut-<strong>of</strong>f. While the diameter <strong>of</strong> the EIGA detectors can be as<br />
large as 5 mm, PV-MCT detectors are usually not larger than 2 mm.<br />
The custom-made detector can for a 5 mm diameter EIGA detector is shown in Fig. 1. The sapphire window that has a<br />
4 o wedge angle is positioned above the detector-chip tilted by 4 o (both are shown within circle C). The non-parallel<br />
surfaces serve to eliminate interference effects in the detector response. In case <strong>of</strong> traditional detector cans (such as<br />
Model 3CN), the side walls can absorb heat from the thermal energy rejected by the TE cooler. To avoid this problem, a<br />
cold field-<strong>of</strong>-view limiter (e.g. with 30 o acceptance angle) can be applied to 3CN cans to keep the background signal<br />
low. The main advantage <strong>of</strong> the shown custom-made detector can is that the front <strong>and</strong> side surfaces around the detector<br />
will not warm up because <strong>of</strong> the heat conducted from the hot side <strong>of</strong> the 4-stage TE cooler <strong>and</strong> there will be no excess<br />
background radiation for the detector.<br />
Fig. 1. SW-IR detector can with a wedged window <strong>and</strong> a tilted 5 mm diameter detector.<br />
Shunt resistance is one <strong>of</strong> the most important detector characteristics [1, 3]. High shunt resistance is required to obtain<br />
low noise at a radiometer output, high signal-gain in the photocurrent meter, <strong>and</strong> high stability <strong>and</strong> repeatability in<br />
signal measurements. In order to achieve a high shunt resistance, the detectors have to be operated at a low <strong>and</strong> stable<br />
temperature. Figure 2 shows that the shunt resistance changes exponentially with the detector temperature (the Y scales<br />
are logarithmic <strong>and</strong> the X scale is linear). While the shunt resistance <strong>of</strong> a 1 mm diameter regular InGaAs (IGA) detector,<br />
that has a 1.7 µm wavelength cut-<strong>of</strong>f, can reach 10 GΩ at a temperature close to -20 o C, 1 mm diameter SW-IR<br />
detectors (EIGA <strong>and</strong> PV-MCT) need cooling to about -80 o C to obtain a shunt resistance close to 10 MΩ. The IGA<br />
detector needs only two-stage thermoelectric (TE) cooling to obtain that high shunt resistance. For SW-IR detectors<br />
four-stage TE coolers must be used to achieve about -80 o C detector temperature. While 3 mm diameter EIGA detectors<br />
can have shunt resistances between 1 MΩ <strong>and</strong> 3 MΩ at -70 o C, shunt resistances only between 70 kΩ <strong>and</strong> 90 kΩ were<br />
measured on 5 mm diameter EIGA detectors at this same temperature. Material quality problems were the reasons <strong>of</strong><br />
these lower-than-expected shunt resistances.<br />
Proc. <strong>of</strong> SPIE Vol. 6542 65420O-2
10 8<br />
10 7<br />
10 6<br />
10 5<br />
10 4<br />
PV MCT 1mm<br />
EIGA 1 mm<br />
-80 -60 -40 -20 0 20<br />
Temperature [ o C]<br />
IGA 1mm<br />
Fig. 2. Shunt resistance versus temperature <strong>of</strong> regular IGA <strong>and</strong> SW-IR (EIGA <strong>and</strong> PV-MCT) photodiodes.<br />
10 11<br />
10 10<br />
10 9<br />
10 8<br />
10 7<br />
3. SW-IR RADIOMETER DESIGN<br />
The radiometer measuring-head design for SW-IR detectors needs several important considerations. The measuring<br />
head includes input optics, a heat removing attachment for the TE cooler, temperature control for the detector (using the<br />
TE cooler <strong>and</strong> the temperature sensor), <strong>and</strong> a photocurrent-to-voltage converter.<br />
3.1. Measuring head<br />
The cross section <strong>of</strong> an irradiance mode measuring head is shown in Fig. 3 to illustrate the input optics <strong>and</strong> the side fan<br />
for cooling. An aperture is usually located at the front. There is an IR diffuser between the aperture <strong>and</strong> the 3 mm<br />
diameter EIGA detector to maintain the angular responsivity close to the theoretical cosine function <strong>of</strong> irradiance<br />
measurements [7]. While the aperture is underfilled by the incident radiation (beam) in power mode measurements, it is<br />
overfilled in irradiance measurement mode. In this measuring head design, the 4-stage TE cooled detector is inside <strong>of</strong> a<br />
traditional (Model 3CN) can which is mounted on a thick copper plate. The plate conducts the heat from the hot side <strong>of</strong><br />
the TE cooler to the heat sink, which is part <strong>of</strong> the cylindrical Aluminum housing. The fan attached to the side <strong>of</strong> the<br />
housing produces forced air cooling for the heat sink. The thermistor pins <strong>and</strong> the pins <strong>of</strong> the 4-stage TE cooler are<br />
connected from the bottom <strong>of</strong> the detector can to a multiple-pin connector on the side <strong>of</strong> the housing. An external<br />
temperature controller that regulates the detector temperature to a low (about -85 o C) <strong>and</strong> constant value is attached to<br />
this connector. The detector leads are connected to the inputs <strong>of</strong> a photocurrent-to-voltage converter through a 4-pin<br />
connector located at the right side <strong>of</strong> the shown housing. The converter is inside <strong>of</strong> another cylindrical housing (not<br />
shown here) which can be attached to the bottom (on the right) <strong>of</strong> the shown housing <strong>and</strong> has the same outside diameter.<br />
Another measuring head design is shown in Fig. 4 using the detector-can <strong>of</strong> Fig. 1. In this head design, the heat removal<br />
is performed with water cooling. The water coolant that delivers the heat away from the 4-stage TE cooler <strong>of</strong> the 5 mm<br />
diameter detector is circulated with a heat exchanger (radiator). A selectable-speed fan is built into the heat exchanger<br />
that removes the heat from the water coolant. The temperature stabilization is done by an external temperature<br />
controller. The side view <strong>of</strong> the measuring head is shown on the left side <strong>and</strong> the cross section is shown on the right side<br />
<strong>of</strong> the figure. The different heat dumping solutions shown on Figs. 3 <strong>and</strong> 4 can work equally well. As a result <strong>of</strong> the<br />
efficient heat removal, the external temperature controller can regulate the detector temperature to < 0.01 o C.<br />
Proc. <strong>of</strong> SPIE Vol. 6542 65420O-3<br />
vol ww jo [wqo] eoue;s!sei ;unqs
EXT InGoAs DETECTOR<br />
IR DIFFUSER\<br />
APERTURE<br />
AIR FLOW<br />
OUT<br />
AIR FLOW<br />
INTAKE<br />
Fig. 3. Radiometer head for a 3 mm EIGA detector using fan produced air flow for heat removal.<br />
Fig. 4. Side view <strong>and</strong> cross-section <strong>of</strong> a radiometer head built for a 5 mm EIGA detector. The detector can<br />
shown in Fig. 1 is used <strong>and</strong> water-coolant is circulated for heat removal.<br />
3.2. Electronic design considerations<br />
The photocurrent meter characteristics are matched to the electrical characteristics <strong>of</strong> the SW-IR detector. The shunt<br />
resistance <strong>of</strong> SW-IR detectors (as discussed above) is significantly lower than that <strong>of</strong> Si <strong>and</strong> cooled regular InGaAs<br />
photodiodes. In case <strong>of</strong> high shunt resistance (such as with Si <strong>and</strong> cooled regular InGaAs detectors) <strong>and</strong> high signal gain<br />
(feedback resistor <strong>of</strong> the current-to-voltage converter) selections, the output noise <strong>of</strong> a radiometer (measuring head) is<br />
dominated by the resistor noise [1]. The equivalent source-resistance <strong>of</strong> a photodiode photocurrent meter can be<br />
calculated as a parallel connected shunt resistance <strong>and</strong> feedback resistance. For instance, when the shunt resistance is<br />
Proc. <strong>of</strong> SPIE Vol. 6542 65420O-4
3 MΩ <strong>and</strong> the feedback resistance is higher, the 3 MΩ shunt resistance will shunt the feedback resistance <strong>and</strong> will<br />
dominate the resultant source-resistance. This means that the resistor noise will remain small <strong>and</strong> constant for feedback<br />
resistors higher than the 3 MΩ shunt resistance. In this case, the resistor noise will not be the dominating noise<br />
component <strong>of</strong> this radiometer. The dominating output noise, in contrast to other IR (such as InSb) detector applications,<br />
will be the amplified input voltage noise <strong>of</strong> the operational amplifier <strong>of</strong> the current-to-voltage converter. This input<br />
noise has both white noise <strong>and</strong> 1/f noise components. In contrast to Si photodiode current meters, where low inputcurrent<br />
operational amplifiers are used (for the 2 GΩ to 5 GΩ optimum shunt resistances), low input voltage noise<br />
operational amplifiers are to be selected for SW-IR detectors. The amplification for the input voltage noise is shunt<br />
resistance dependent [1]. The higher the shunt resistance the lower the voltage amplification (for feedback resistors<br />
higher than the shunt resistance). Accordingly, increasing shunt resistance will decrease the dominant output voltage<br />
noise component for the radiometer output. At the same time (using the same feedback resistor), the background current<br />
noise will not change at the output. The goal is to decrease the output voltage noise, by increasing the shunt resistance,<br />
until the background current noise will be the dominating noise component. In this case, there will be a reasonable limit<br />
for increasing the detector shunt resistance. AC mode Si radiometer noise-performance will not be achieved with SW-<br />
IR radiometers even if the shunt resistances were increased to GΩ values <strong>and</strong> a cold field-<strong>of</strong>-view limiter was applied<br />
for the EIGA detector. In case <strong>of</strong> an optimized SW-IR radiometer design, the noise performance will be limited by the<br />
background noise, which is small in the SW-IR wavelength range but never as small as the noise-equivalent-power<br />
(NEP) <strong>of</strong> noise-optimized AC mode Si radiometers [1]. Test measurements can determine the reasonable limit for the<br />
shunt resistance increase.<br />
In case <strong>of</strong> SW-IR detectors, the background current is orders <strong>of</strong> magnitude smaller than with InSb detectors. However, it<br />
still can be comparable to the photocurrent <strong>of</strong> the optical signal to be measured. High sensitivity can be achieved if the<br />
useful signal (to be measured) is chopped <strong>and</strong> is measured by a lock-in amplifier. In this case, the DC background signal<br />
<strong>and</strong> its changes will not be measured because it will not have any frequency components that the chopping frequency<br />
synchronized lock-in amplifier could measure. Because <strong>of</strong> the low DC background current, the feedback resistor can be<br />
two orders <strong>of</strong> magnitude higher than with background optimized InSb detectors. Accordingly, the responsivity <strong>of</strong> SW-<br />
IR radiometers can be much higher than InSb radiometers. The highest value for the feedback resistor in the current-tovoltage<br />
converter is limited by the required upper roll-<strong>of</strong>f frequency <strong>of</strong> the radiometer. The upper roll-<strong>of</strong>f is determined<br />
by the time constant <strong>of</strong> the feedback impedance (the product <strong>of</strong> the feedback resistance <strong>and</strong> the feedback capacitance). It<br />
is important to keep the parallel stray (feedback) capacitance low if high roll-<strong>of</strong>f frequencies are needed at high signalgains.<br />
In an optimum design, the chopping frequency is about one order <strong>of</strong> magnitude lower than the upper roll-<strong>of</strong>f<br />
frequency, to obtain an operating point on the flat (constant) signal-gain versus frequency function <strong>of</strong> the photodiode<br />
current-meter. Accordingly, the chopping frequency should be high enough to be near the elbow <strong>of</strong> the 1/f noise<br />
spectrum <strong>of</strong> the current-to-voltage converter <strong>and</strong> small enough to avoid problems when optimizing the feedback<br />
capacitance during frequency compensations. Partial frequency compensations are needed in AC measurement modes<br />
to optimize the three fundamental gains <strong>of</strong> photodiode current meters. These gains are the signal-gain (discussed above),<br />
the closed-loop voltage gain (that gives the amplification for the input voltage noise), <strong>and</strong> the loop gain (product <strong>of</strong> the<br />
operational amplifier open-loop gain <strong>and</strong> the feedback attenuation produced by the feedback resistor <strong>and</strong> the detector<br />
shunt resistance) that determines the uncertainty <strong>of</strong> the current-to-voltage conversion [1].<br />
4. CHARACTERIZATIONS<br />
In order to verify the above design considerations, test radiometers have been made <strong>and</strong> their performance<br />
characteristics were measured. First, tests were made to evaluate the minimum signal (photocurrent) that can be<br />
measured in DC mode with a reasonably low uncertainty. This information is needed for high signal (such as laserbased<br />
source) measurements which is typical in responsivity scale transfers. However, the main goal <strong>of</strong> the performed<br />
tests was to determine the noise equivalent current (NEC), the noise-equivalent power (NEP), <strong>and</strong> the D* values <strong>of</strong> the<br />
newly developed SW-IR radiometers.<br />
The DC tests were made at detector temperatures <strong>of</strong> -85 o C. The background current measured on a 3 mm EIGA<br />
detector was 17 nA. The background current <strong>of</strong> a 1 mm EIGA detector, equipped with a cold 30 o field-<strong>of</strong>-view limiter,<br />
was only 0.6 nA. These small DC currents can be easily compensated in the current-to-voltage converter. The DC mode<br />
NEC will depend on the fluctuations <strong>of</strong> the background current if the temperature <strong>of</strong> the detector is kept constant. The<br />
Proc. <strong>of</strong> SPIE Vol. 6542 65420O-5
3 mm detector, which has a shunt resistance <strong>of</strong> 3 MΩ, was measured at a signal-gain <strong>of</strong> 10 7 V/A. A 40 µV st<strong>and</strong>ard<br />
deviation was obtained from 20 measurements. Each measurement was taken using an integrating digital voltmeter with<br />
a measurement integration time <strong>of</strong> 100 power line cycles. At this 0.3 Hz b<strong>and</strong>width [1], a DC mode NEC= 4 pA can be<br />
calculated from the ratio <strong>of</strong> the measured 40 µV output noise to the 10 7 V/A signal-gain. The minimum signal will be 4<br />
nA to receive a signal-to-noise ratio <strong>of</strong> 1000 for performing a 0.1 % measurement uncertainty. The DC mode NEC <strong>of</strong><br />
the 1 mm EIGA detector has not been tested but it is estimated to be significantly lower because <strong>of</strong> the higher shunt<br />
resistance (15.3 MΩ) <strong>and</strong> the 30 times lower background current.<br />
In AC measurement mode, the output total noise voltage <strong>of</strong> the EIGA radiometers was measured at different signalgains.<br />
The output noise voltage was measured with a lock-in amplifier attached to the output <strong>of</strong> the current-to-voltage<br />
converter. The chopping frequency was 7.5 Hz <strong>and</strong> the integrating time constant <strong>of</strong> the lock-in amplifier was 1 s. The<br />
measured voltage noise changed from 0.1 µV at gain 10 6 V/A to 20 µV at gain 10 9 V/A. Figure 5 shows the measured<br />
output voltage noise on the left-Y axis. The right-Y axis shows the NEC which was calculated as the ratio <strong>of</strong> the output<br />
voltage noise to the selected feedback resistor. A constant NEC=20 fA was obtained for the high signal gains from<br />
10 7 V/A to 10 9 V/A. The NEC <strong>of</strong> the 1 mm EIGA detector was tested at a signal-gain <strong>of</strong> 10 8 V/A, a chopping frequency<br />
<strong>of</strong> 9 Hz, <strong>and</strong> an electrical b<strong>and</strong>width <strong>of</strong> 0.16 Hz. This detector has five times larger (15.3 MΩ) shunt resistance <strong>and</strong><br />
about 30 times lower background current. The obtained NEC was 7 fA.<br />
Output voltage noise<br />
10<br />
1<br />
0.1<br />
10 6<br />
10 7<br />
NEC<br />
Voltage noise<br />
10 8<br />
Feedback resistor [Ω]<br />
Fig. 5. The output voltage noise <strong>and</strong> the noise equivalent current (NEC) <strong>of</strong> a<br />
3 mm EIGA radiometer with a shunt resistance <strong>of</strong> 3 MΩ.<br />
The NEP <strong>of</strong> a SW-IR radiometer can be calculated from its NEC:<br />
10 9<br />
NEC<br />
NEP = (1)<br />
R<br />
where R is the peak responsivity <strong>of</strong> the detector in A/W. Using a typical 1.3 A/W peak responsivity (manufacturer’s<br />
data), an NEP=15.4 fW can be calculated for the above discussed 3 mm EIGA radiometer. An NEP=5.4 fW was<br />
calculated for the radiometer using the 1 mm EIGA detector with the cold FOV limiter. This result is very close to the<br />
3 fW DC-mode NEP <strong>of</strong> well-designed silicon radiometers [8].<br />
The detectivity D* <strong>of</strong> a SW-IR radiometer (with detector area A) can be calculated as:<br />
A<br />
D* = (2)<br />
NEP<br />
Proc. <strong>of</strong> SPIE Vol. 6542 65420O-6<br />
100<br />
10
The wavelength dependence <strong>of</strong> the D* <strong>of</strong> several high quality AC measurement-mode radiometers, such as photovoltaic<br />
Si <strong>and</strong> InGaAs, EIGA, PV-MCT <strong>and</strong> InSb are shown in Fig. 6. The background-limited power (BLIP) curve, that gives<br />
the theoretical limit for the D* was calculated with an f/2 detector field-<strong>of</strong>-view (FOV) for a 295 K background<br />
radiation. The noise due to the ambient background at temperature, T, is given by the mean square deviation in the total<br />
rate <strong>of</strong> photon arrival per unit area <strong>and</strong> per unit interval given by<br />
2πν<br />
2<br />
2 ( ∆N<br />
) =<br />
2<br />
2<br />
c<br />
⎛<br />
⎜e<br />
⎝<br />
e<br />
hν<br />
kT<br />
hν<br />
kT<br />
⎞<br />
− 1⎟<br />
⎠<br />
, (3)<br />
where c is the speed <strong>of</strong> light, ν is the frequency, h is the Planck constant <strong>and</strong> k is the Boltzmann constant. The BLIP is<br />
then given by<br />
D<br />
*<br />
BLIP<br />
⎡<br />
⎤<br />
⎢∞<br />
hν<br />
2 ⎥<br />
cη<br />
ν e kT<br />
=<br />
⎥<br />
1 ⎢∫<br />
dν<br />
2 ⎥<br />
2 2<br />
⎢ 0 ⎛ hν<br />
π hν<br />
⎞<br />
⎜e<br />
kT − 1⎟<br />
⎥<br />
⎢⎣<br />
⎝ ⎠ ⎥⎦<br />
( T,<br />
λ)<br />
⎢ η(<br />
ν )<br />
− 1<br />
2<br />
, (4)<br />
where η is the quantum efficiency <strong>of</strong> the detector [9]. The graph shows that the D* <strong>of</strong> a room temperature (RT) E-IGA<br />
radiometer was increased by almost three orders <strong>of</strong> magnitude when the detector was cooled to –85 o C. As a result <strong>of</strong><br />
the above discussed design considerations, the obtained D* value <strong>of</strong> 3 x 10 13 cm Hz 1/2 /W is very close to the given<br />
background noise theoretical limit. The PV-MCT radiometer, that has a 2.8 µm cut-<strong>of</strong>f, is also very close to the BLIP<br />
curve. The D* <strong>of</strong> an InSb radiometer (with optimized background rejection) is about two orders <strong>of</strong> magnitude lower.<br />
The AC mode Si <strong>and</strong> InGaAs radiometers have very high D* values but they are not suited for detection <strong>of</strong> IR radiation<br />
since there is insufficient signal at these wavelengths (the BLIP is > 10 18 cm Hz 1/2 /W). We note that the detectivities <strong>of</strong><br />
the TE-cooled SW-IR detectors greatly exceed that <strong>of</strong> the liquid nitrogen-cooled InSb detectors.<br />
, cm Hz 1/2 /W<br />
Detectivity D *<br />
λ<br />
C<br />
10 16<br />
10 15<br />
10 14<br />
10 13<br />
10 12<br />
10 11<br />
-85 o C<br />
RT<br />
10<br />
0 2 4 6 8 10<br />
10<br />
Wavelength , µm<br />
-85 o C IGA<br />
-85 o C PV-MCT<br />
-85 o C EIGA<br />
77 K InSb<br />
22 o C EIGA<br />
22 o C Si<br />
295 K BLIP<br />
Fig. 6. D* <strong>of</strong> AC mode Si, InGaAs, EIGA, PV-MCT <strong>and</strong> InSb radiometers with the background-limited<br />
power curve at 295 K calculated with an f/2 detector FOV <strong>and</strong> electrical b<strong>and</strong>width <strong>of</strong> 0.16 Hz.<br />
Proc. <strong>of</strong> SPIE Vol. 6542 65420O-7
5. CALIBRATION TRANSFER<br />
The spectral responsivity calibration <strong>of</strong> the above discussed SW-IR radiometers will be derived from the <strong>NIST</strong><br />
electrical-substitution cryogenic radiometer (ESR). The ESR measures the total radiant power in the incident laser beam<br />
with a relative exp<strong>and</strong>ed uncertainty <strong>of</strong> 0.02 % (k=2). In order to propagate the radiant power responsivity scale with a<br />
minimal increase in the uncertainty, transfer st<strong>and</strong>ard SW-IR radiometers have been developed. These radiometers are<br />
expected to measure the total beam power with uncertainties <strong>of</strong> about 0.1 % (k=2). The spatial non-uniformity <strong>of</strong><br />
response <strong>of</strong> EIGA detectors (as measured by the manufacturer) is between 0.5 % <strong>and</strong> 1 %. This non-uniformity is too<br />
high to propagate the responsivity scale with the expected measurement uncertainty. In order to improve the spatial nonuniformity<br />
<strong>of</strong> response, two <strong>of</strong> the EIGA radiometers (with 3 mm diameter detectors) were modified. Spectralon # coated<br />
integrating spheres <strong>of</strong> 38 mm diameter with 5 mm diameter input apertures were attached to the front <strong>of</strong> the<br />
radiometers. This attachment makes it possible to convert an EIGA radiometer from power measurement mode into<br />
irradiance measurement mode. The irradiance responsivity is equal to the product <strong>of</strong> the power responsivity <strong>and</strong> the<br />
aperture area. The picture <strong>of</strong> a modified EIGA radiometer head is shown in Fig. 7. The picture shows not only the<br />
entrance aperture in the sphere, but also the side connector for the temperature controller <strong>and</strong> the tube-connector on the<br />
heat sink for circulating the water-coolant. The uniformity was tested by scanning a 1 mm diameter beam over the 8 mm<br />
diameter sphere entrance port (with the 5 mm aperture removed). The precision aperture was removed during this test.<br />
The measurement results are shown in Fig. 8. The input sphere improved the spatial non-uniformity <strong>of</strong> the EIGA<br />
radiometer by about a factor <strong>of</strong> five. This improvement is needed to perform 0.1 % (k=2) responsivity uncertainty in<br />
power measurement mode even if different beam positions <strong>and</strong> different beam diameters are used. Using these<br />
optimized transfer st<strong>and</strong>ard radiometers, a factor <strong>of</strong> three uncertainty decrease can be expected compared to the present<br />
near-IR detector spectral responsivity calibrations [2]. Also, these radiometers make it possible to extend the <strong>NIST</strong><br />
spectral responsivity calibrations to 2.5 µm with close to 0.1 % (k=2) responsivity uncertainties in both radiant power<br />
<strong>and</strong> irradiance measurement modes.<br />
Fig. 7. Transfer st<strong>and</strong>ard EIGA radiometer head with an aperture equipped integrating sphere.<br />
Proc. <strong>of</strong> SPIE Vol. 6542 65420O-8
y [mm]<br />
-3.5<br />
-2.5<br />
-1.5<br />
-0.5<br />
0.5<br />
1.5<br />
2.5<br />
3.5<br />
1.002<br />
Fig. 8. Spatial non-uniformity <strong>of</strong> response <strong>of</strong> a sphere-input radiometer at 1250 nm.<br />
6. CONCLUSIONS<br />
Radiant power <strong>and</strong> irradiance measuring transfer- <strong>and</strong> working-st<strong>and</strong>ard SW-IR radiometers have been developed to<br />
extend the <strong>NIST</strong> spectral responsivity scale to 2.5 µm with close to 0.1 % (k=2) responsivity uncertainty. Instead <strong>of</strong><br />
cryogenic cooling, 4-stage thermoelectric coolers were used to stabilize the temperature <strong>of</strong> the applied 5 mm, 3 mm, <strong>and</strong><br />
1 mm diameter detectors at -85 o C. The dissipated heat from the TE coolers was removed using heat sinks constructed<br />
with either air flow or circulated water cooling. As a result <strong>of</strong> an additional analog control loop, the temperature <strong>of</strong> the<br />
applied SW-IR detectors could be stabilized at temperatures as low as -85 o C. The radiometers were characterized in<br />
both DC <strong>and</strong> AC measurement modes. In DC mode, at a b<strong>and</strong>width <strong>of</strong> 0.3 Hz, an NEC <strong>of</strong> 4 pA was measured with a<br />
3 mm diameter EIGA detector. In AC mode, an NEC=7 fA was measured with a 1 mm diameter EIGA detector (using a<br />
cold FOV limiter) at a b<strong>and</strong>width <strong>of</strong> 0.16 Hz. This corresponds to an AC-mode NEP = 5.4 fW which is close to the<br />
3 fW DC-mode NEP <strong>of</strong> silicon photodiodes.<br />
7. ACKNOWLEDGEMENTS<br />
This project was funded by the U.S. Air Force Primary <strong>St<strong>and</strong>ards</strong> Laboratory in the Calibration Coordination Group.<br />
The authors thank C. R. Lustenberger <strong>of</strong> Gamma Scientific, Inc. for participating in the design <strong>of</strong> the radiometers <strong>and</strong> T.<br />
C. Larason <strong>of</strong> <strong>NIST</strong> for measuring the spatial uniformity <strong>of</strong> response <strong>of</strong> the sphere radiometers.<br />
# Certain commercial equipment, instruments, or materials are identified in this paper to foster underst<strong>and</strong>ing. Such<br />
identification does not imply recommendation or endorsement by the <strong>National</strong> <strong>Institute</strong> <strong>of</strong> <strong>St<strong>and</strong>ards</strong> <strong>and</strong> Technology,<br />
nor does it imply that the material or equipment are necessarily the best available for the purpose.<br />
REFERENCES<br />
1. G. P. Eppeldauer, <strong>NIST</strong> <strong>Technical</strong> <strong>Note</strong> 1438, Optical Radiation Measurement with Selected Detectors <strong>and</strong> Matched<br />
Electronic Circuits Between 200 nm <strong>and</strong> 20 µm, U.S. Government Printing Office, Washington, DC, 20402, 2001.<br />
2. T. C. Larason, S. S. Bruce, <strong>and</strong> A. C. Parr, Spectroradiometric Detector Measurements: Part II – Visible to Near-<br />
Infrared Detectors, Special Publication 250-41, U.S. Department <strong>of</strong> Commerce, February, 1998.<br />
1.000<br />
-3.5 -2.5 -1.5 -0.5 0.5 1.5 2.5 3.5<br />
x [mm]<br />
Proc. <strong>of</strong> SPIE Vol. 6542 65420O-9
3. H. W. Yoon, M. C. Dopkiss, <strong>and</strong> G. P. Eppeldauer, Performance comparisons <strong>of</strong> InGaAs, extended InGaAs <strong>and</strong><br />
short-wave HgCdTe detectors between 1 µm <strong>and</strong> 2.5 µm. SPIE, Vol. 6297, p. 629703-1 to 629703-10, 2006.<br />
4. G. P. Eppeldauer <strong>and</strong> H. W. Yoon, AC-Mode SW-IR Radiation Thermometers for Measurement <strong>of</strong> Ambient<br />
Temperatures, Tempmeko 2007, to be published.<br />
5. G. P. Eppeldauer, J. Zeng, <strong>and</strong> L. M. Hanssen, Development <strong>and</strong> calibration <strong>of</strong> pyroelectric radiometer st<strong>and</strong>ards at<br />
<strong>NIST</strong>, SPIE Proc. Vol. 6201, pp. 620119-1 to 620119-12, 2006.<br />
6. G. P. Eppeldauer, M. Racz, <strong>and</strong> L.M. Hanssen, Spectral responsivity determination <strong>of</strong> a transfer-st<strong>and</strong>ard<br />
pyroelectric radiometer, SPIE Infrared Spaceborne Remote Sensing X., Symposium Proc. Volume 4818, p. 118-126,<br />
Seattle, Washington, July 10-11, 2002.<br />
7. G. Eppeldauer, M. Racz, <strong>and</strong> T. Larason, Optical Characterization <strong>of</strong> Diffuser-input St<strong>and</strong>ard Irradiance Meters,<br />
Optika’98, 5th Congress on Modern Optics, 14-17 September, Budapest, Hungary. SPIE Proc. Vol. 3573, p. 220-224,<br />
1998.<br />
8. G. Eppeldauer, Noise-optimized silicon radiometers, J. Res. Natl. Inst. St<strong>and</strong>. Technol. Vol. 105, No. 209, p. 209-<br />
219, 2000.<br />
9. P. R. Norton, in “Photodetectors,” H<strong>and</strong>book <strong>of</strong> Optics, ed. By M. Bass, 1995 (McGraw-Hill, New York) P. 15.11<br />
to 15.13.<br />
Proc. <strong>of</strong> SPIE Vol. 6542 65420O-10
Measurement <strong>of</strong> thermal radiation using regular<br />
glass optics <strong>and</strong> short-wave infrared detectors<br />
H. W. Yoon 1* , G. P. Eppeldauer 1<br />
1 Optical Technology Division<br />
<strong>National</strong> <strong>Institute</strong> <strong>of</strong> <strong>St<strong>and</strong>ards</strong> <strong>and</strong> Technology<br />
100 Bureau Drive<br />
Gaithersburg, MD 20899, USA<br />
*Corresponding author: hyoon@nist.gov<br />
Abstract: The measurement <strong>of</strong> thermal radiation from ambienttemperature<br />
objects using short-wave infrared detectors <strong>and</strong> regular glass<br />
optics is described. The detectors are chosen to operate in the 2.0 μm to<br />
2.5 μm atmospheric window. Selection <strong>of</strong> detectors with high shunt<br />
resistance along with the 4-stage thermo-electric cooling <strong>of</strong> the detectors to<br />
-85 o C results in detectivity, D*, <strong>of</strong> 4 x 10 13 cm Hz 1/2 /W which is near the<br />
back-ground limited performance at 295 K. Furthermore, the use <strong>of</strong> the<br />
regular-glass commercial optics to collect the thermal radiation results in<br />
diffraction-limited imaging. The use <strong>of</strong> a radiation thermometer<br />
constructed with these elements for the measurement <strong>of</strong> a blackbody from<br />
20 o C to 50 o C results in noise-equivalent temperature difference (NETD) <strong>of</strong><br />
< 3 mK at 50 °C. The operation at shorter wavelengths than traditional<br />
thermal imagers also leads to lower sensitivity to the emissivity <strong>of</strong> the<br />
object in determining the temperature <strong>of</strong> the object. These elements are<br />
used to construct a calibrator for an infrared collimator, <strong>and</strong> such a system<br />
demonstrates noise-equivalent irradiances <strong>of</strong> < 5 fW/cm 2 . These results<br />
indicate that thermal imagers using short-wave infrared sensors could be<br />
constructed utilizing commercial glass optics with possible better imaging<br />
performance <strong>and</strong> lower NETD than existing, cryogenically-cooled thermal<br />
imagers.<br />
© 2007 Optical Society <strong>of</strong> America<br />
OCIS codes: (040.3060) Infrared Detectors; (120.4640) Optical Instrumentation<br />
____________________________________________________________________<br />
References <strong>and</strong> links<br />
1. A. Rogalski <strong>and</strong> K. Chrzanowski, Infrared devices <strong>and</strong> technique, Opto-Electronics Review 10(2): 111(2002).<br />
2. D.G. Crowe, P.R. Norton, T. Limperis <strong>and</strong> J. Mudar, “Detectors,” in Electro-Optical Components, W. D.<br />
Rogatto ed., Infrared Information Analysis Center, Michigan, 1993.<br />
3. Schott glass designations.<br />
4. H.W. Yoon, D.W. Allen, <strong>and</strong> R.D. Saunders, “Methods to reduce the size-<strong>of</strong>-source effect in<br />
radiometers,” Metrologia 42, 89-96 (2005).<br />
# Certain commercial equipment, instruments, or materials are identified in this paper to foster underst<strong>and</strong>ing.<br />
Such identification does not imply recommendation or endorsement by the <strong>National</strong> <strong>Institute</strong> <strong>of</strong> <strong>St<strong>and</strong>ards</strong> <strong>and</strong><br />
Technology, nor does it imply that the material or equipment are necessarily the best available for the purpose.<br />
____________________________________________________________________________________
1. Introduction<br />
The needs for measurement <strong>of</strong> thermal radiation from ambient-temperature <strong>and</strong> highertemperature<br />
objects are vast <strong>and</strong> wide ranging [1]. These needs arise from requirements <strong>of</strong><br />
surveillance <strong>and</strong> non-destructive testing to early <strong>and</strong> accurate detection <strong>of</strong> hot objects at far<br />
distances for defense <strong>and</strong> other applications. At present, these needs are met by the use <strong>of</strong><br />
cryogenically-cooled quantum detector materials such as InSb or HgCdTe or by the use <strong>of</strong><br />
thermal detectors such as thermopiles, pyroelectrics or bolometers [2]. Although the quantum<br />
detectors have sufficient sensitivities to be able to measure thermal radiation with low noiseequivalent<br />
temperature difference (NETD), the need for cryogens or cryo-coolers <strong>and</strong> the<br />
accompanying vacuum jacket for low-noise operations limit their versatility in many<br />
applications. Furthermore, the thermal cycling <strong>and</strong> eventual ice build-up inside the cryostat<br />
lead to poor long-term stability <strong>of</strong> the responsivity <strong>and</strong> require routine maintenance <strong>of</strong> the<br />
system. Instruments utilizing thermal detectors suffer from low signal-to-noise ratios<br />
resulting from the low-power responsivities <strong>of</strong> the thermal detectors which lead to high NETD.<br />
Also, the use <strong>of</strong> thermal detectors can result in drift <strong>of</strong> the measured signal from any change<br />
in the surrounding ambient temperatures. For collection optics, these traditional detectors<br />
also require the use <strong>of</strong> either reflective mirrors or refractive lenses which transmit in the midinfrared<br />
<strong>and</strong> long-infrared wavelength such as those constructed using Si, Ge or ZnSe.<br />
In the past, the use <strong>of</strong> short-wave infrared (SWIR) wavelength region for thermal imaging<br />
has been limited due to the poor signal-to-noise performances <strong>of</strong> the existing detectors. The<br />
most commonly utilized detector in this wavelength region is the photoconductive PbS which<br />
requires operation with dry ice at 193 K for optimum operation. However, photoconductive<br />
PbS was found to be limited by its high noise-equivalent power, poor long-term stability <strong>of</strong><br />
response <strong>and</strong> possible signal nonlinearity. Other SWIR detectors such as photoconductive<br />
HgCdTe (MCT), PbSe <strong>and</strong> InAs detectors have also been used but with limited success.<br />
Due to the rapid improvements in InGaAs material fabrication driven by the optical fiber<br />
communications, the InGaAs photodiodes are the preferred detectors in the 900 nm to<br />
1700 nm range. With modification <strong>of</strong> the fabrication process, InGaAs can be made to be<br />
sensitive to infrared radiation from 900 nm to 2500 nm, with the long-wavelength b<strong>and</strong>gap<br />
occurring at around 2500 nm. However, the extension <strong>of</strong> the responsivity to longer<br />
wavelengths results in the ex-InGaAs diodes having lower shunt resistances than the regular<br />
InGaAs photodiodes. The shunt resistances <strong>of</strong> the ex-InGaAs diodes can be increased by<br />
cooling the diode with 1-stage to 4-stage thermo-electric (TE) coolers. Similarly,<br />
photovoltaic (pv) MCT photodiodes can also be used. The MCT photodiodes can be<br />
fabricated for sensitivity from 2.0 μm to 2.5 μm with long-wavelength cut<strong>of</strong>fs near 2.5 μm,<br />
distinct from the usual 10 μm to 12 μm operation <strong>of</strong> these devices. The shunt resistances <strong>of</strong><br />
the SWIR MCT detectors can also be increased by TE cooling, <strong>and</strong> such detectors can be<br />
substituted for ex-InGaAs.<br />
In this work, the use <strong>of</strong> TE cooled, extended InGaAs <strong>and</strong> short-wave, pv MCT diodes for<br />
the measurement <strong>of</strong> thermal radiation from ambient-temperature objects is described. The<br />
work is motivated by the examination <strong>of</strong> the thermal emission <strong>and</strong> the radiance ratios between<br />
the object <strong>and</strong> the background radiation. The SWIR radiometers can be designed to operate in<br />
a clear, atmospheric window between 2.0 μm <strong>and</strong> 2.5 μm. In this wavelength region, in<br />
contrast to other IR b<strong>and</strong>s, <strong>of</strong>f-the shelf, glass optics can be utilized for the collection <strong>of</strong> the<br />
emitted radiation. Optical modeling using glass lenses indicates that diffraction-limited<br />
performance is achieved. As examples, we demonstrate, using a TE-cooled ex-InGaAs<br />
radiation thermometer <strong>and</strong> a radiometer for measuring collimated sources, that such<br />
radiometers can achieve significantly better irradiance <strong>and</strong> radiance sensitivity than<br />
radiometers utilizing cryogenically-cooled InSb.
2. Planck Radiance Analysis<br />
The choice <strong>of</strong> the optimum wavelengths for the detection <strong>of</strong> Planck radiation depends upon<br />
many factors. Although the obvious choice <strong>of</strong> the wavelength would be at the peak <strong>of</strong> the<br />
Planck radiance <strong>of</strong> the emitting body, other considerations can mitigate the signal advantages<br />
from measuring at the peak <strong>of</strong> the spectral distribution. Often, object <strong>of</strong> interest will be in the<br />
presence <strong>of</strong> ambient background radiation which is also detected by the sensors leading to a<br />
large contaminating, background signal. The background radiation could come from objects<br />
in the field-<strong>of</strong>-view <strong>of</strong> the radiometer or from the thermal emission from body <strong>of</strong> the<br />
radiometer. Much <strong>of</strong> the unwanted background signal can be eliminated by the use <strong>of</strong> lock-in<br />
detection <strong>and</strong> the placement <strong>of</strong> the modulator. However, outside <strong>of</strong> the laboratory<br />
environment, the optimum modulation, which is directly at the source, is not feasible.<br />
In many applications, the detection <strong>of</strong> thermal radiation from an object which is hotter<br />
than the ambient background is desired. In such cases, the advantages <strong>of</strong> using the shortest<br />
wavelength while having sufficient signals from the target area can be seen from Fig. 1. The<br />
Spectral Radiance [ W/ cm 2 /cm sr ]<br />
10 5<br />
10 4<br />
10 3<br />
10 2<br />
10 1<br />
10 0<br />
10 -1<br />
10 -2<br />
10 -3<br />
0 1000 2000 3000 4000 5000<br />
Wavelength [ nm ]<br />
22 o C<br />
300 o C<br />
500 o C<br />
1000 o C<br />
Figure 1. The spectral radiances from the use <strong>of</strong> the Planck radiance law for blackbodies at the respective<br />
temperatures. In the spectral region from 2.0 μm to 2.5 μm, a blackbody at 22 °C <strong>and</strong> a blackbody at 300 °C will<br />
differ by a factor > 19,000 while at a center wavelength <strong>of</strong> 4.0 μm, such ratio is ~ 370.<br />
Planck radiances for the temperatures <strong>of</strong> interest are plotted, <strong>and</strong> for comparisons, the<br />
radiance differences between the ambient background at 22 °C <strong>and</strong> the target at 300 °C at<br />
2.4 μm <strong>and</strong> at 4.0 μm can be compared. At 4.0 μm, the spectral radiance ratio from the roomtemperature<br />
22 °C background <strong>and</strong> a blackbody at 300 °C is<br />
o<br />
L4.<br />
0μm<br />
( 300 C)<br />
≅ 370 . (1)<br />
o<br />
L 22 C<br />
4.<br />
0μm<br />
( )<br />
However, at a center wavelength <strong>of</strong> 2.4 μm, the Planck radiance ratio is much larger at
L<br />
2.<br />
4μm<br />
L<br />
2.<br />
4μm<br />
o ( 300 C)<br />
o ( 22 C)<br />
4<br />
≅ 1.<br />
9x10<br />
. (2)<br />
The radiance from the 22 °C ambient at 2.4 μm is lower than at 4.0 μm by a factor <strong>of</strong> 260<br />
which will result in lower interfering radiances from the background at the shorter<br />
wavelengths. This simple analysis indicates that if sufficiently sensitive detectors with low<br />
noise <strong>and</strong> high responsivity can be developed, then such detectors will be less influenced by<br />
the background radiation while still being able to detect the radiation source. It is critical that<br />
the b<strong>and</strong>-gap <strong>of</strong> the detectors cut-<strong>of</strong>f is at or near 2.5 μm so that the sensor is less sensitive to<br />
the ambient background radiation. The Planck radiances also indicate that the dynamic range<br />
<strong>of</strong> the signals (the useful-signal <strong>and</strong> background-signal ratios) for a source at 300 °C <strong>and</strong> at<br />
1000 °C will be greater at 2.25 μm than at 4.0 μm, thus leading to greater contrast ratios<br />
between the objects.<br />
3. SWIR Detectivity or D*<br />
The relative performances <strong>of</strong> detectors can be compared independently from the detector<br />
element sizes using the criterion <strong>of</strong> D* or detectivity (sometimes called Jones) with units <strong>of</strong><br />
cm Hz 1/2 / W. The D* <strong>of</strong> the detector can be increased by decreasing the noise-equivalent<br />
power (NEP). A decrease in the NEP can be achieved by increasing the shunt resistance, RS,<br />
<strong>of</strong> the detector which will decrease the noise at the output <strong>of</strong> the photodiode trans-impedance<br />
amplifier. The RS can be increased by several techniques. Since the shunt resistance is<br />
typically due to the areal density <strong>of</strong> the electrical imperfections <strong>of</strong> the detector, it depends on<br />
the surface area <strong>of</strong> the detector. A detector with a smaller surface area will have higher shunt<br />
resistance resulting in a lower NEP <strong>and</strong> a higher D*.<br />
The shunt resistances <strong>of</strong> semiconductor photodiodes also depend on the temperature <strong>of</strong><br />
the diode. The shunt resistances <strong>of</strong> 3 mm <strong>and</strong> 1 mm diameter ex-InGaAs <strong>and</strong> short-wave<br />
MCT (2.8 μm b<strong>and</strong>gap) detectors were measured as a function <strong>of</strong> diode temperature. The<br />
temperatures were varied using the built-in 4-stage thermoelectric coolers with thermistor<br />
feedback controls. The shunt resistances shown in Fig. 2 were determined from the inverse
Shunt Resistance [ Ω ]<br />
10 8<br />
10 7<br />
10 6<br />
10 5<br />
10 4<br />
10 3<br />
1 mm swMCT<br />
3 mm exInGaAs<br />
1 mm exInGaAs<br />
-80 -60 -40 -20 0 20 40<br />
Temperature [ o C ]<br />
3 mm exInGaAs<br />
1 mm swMCT<br />
1mm exInGaAs<br />
1 mm swMCT w/cap<br />
1 mm exInGaAs w/cap<br />
Figure 2. The temperature dependence <strong>of</strong> shunt resistance for 1 mm <strong>and</strong> 3 mm diameter InGaAs, extended InGaAs<br />
<strong>and</strong> 1 mm diameter swMCT detectors. Shunt resistance increase <strong>of</strong> 1000 over the room temperature values are easily<br />
achieved using TE cooling. The notation “w/cap” refers to the addition <strong>of</strong> a TE-cooled 30° field-<strong>of</strong>-view limiting<br />
baffle incorporated onto the front <strong>of</strong> the diode in the detector housing.<br />
slope <strong>of</strong> the current-voltage (I-V) curves. All the detectors are found to have a semilogarithmic<br />
dependence on diode temperature. These results indicate that the shunt<br />
impedances for the ex-InGaAs detector <strong>and</strong> the sw-MCT can be increased by a factor > 1000,<br />
resulting in 3x10 6 Ω with the 3 mm diameter detector cooled to -85 °C (188 K). The 3 mm<br />
diameter diode has a lower shunt resistance than the 1 mm diameter diode which is inversely<br />
proportional to the area <strong>of</strong> the diode. This indicates that the defects which limit the shunt<br />
resistance are uniformly distributed across the diode area.<br />
The D* or the detectivity <strong>of</strong> various detectors at the peak wavelength <strong>of</strong> their spectral<br />
responsivities are shown in Fig. 3 along with the back-ground-limited performance (BLIP) at
[ cm Hz 1/2 /W ]<br />
Detectivity, D *<br />
λ C<br />
10 16<br />
10 15<br />
10 14<br />
10 13<br />
10 12<br />
10 11<br />
-85 o C<br />
RT<br />
10<br />
0 2 4 6 8 10<br />
10<br />
Wavelength [μ m]<br />
-85 o C InGaAs<br />
-85 o C swMCT<br />
-85 o C exInGaAs<br />
77 K InSb<br />
22 o C ex InGaAs<br />
22 o C Si<br />
295 K BLIP<br />
Figure 3. The background-limited power (BLIP) restricted to F/2 field-<strong>of</strong>-view for 295 K background with the<br />
detectivity <strong>of</strong> NIR, SWIR <strong>and</strong> MIR sensors plotted versus their b<strong>and</strong>gap wavelengths. The detectivities plotted are<br />
for electrical b<strong>and</strong>width <strong>of</strong> 0.16 Hz. The detectivities <strong>of</strong> the uncooled exInGaAs at room temperature (RT) does not<br />
meet the BLIP curve while the 4-staged TE cooled detectors lie near the BLIP curve.<br />
295 K. The BLIP limits the performances <strong>of</strong> detectors operating in typical laboratory<br />
environments since the fluctuations in the arrival rate <strong>of</strong> photons from the ambient<br />
background will limit the noise floor. One can observe that much higher detectivities, without<br />
being limited by the BLIP, are possible as the detection wavelengths are made shorter than the<br />
peak <strong>of</strong> the 295 K Planck radiances at 10 μm. With cooling <strong>of</strong> the ex-InGaAs diode, the<br />
measured D* is > 3 x 10 13 cm Hz 1/2 / W, which is almost a factor <strong>of</strong> 100 greater than that <strong>of</strong><br />
liquid-nitrogen cooled InSb detector at ~ 5 x 10 11 cm Hz 1/2 / W. These detectivities at long<br />
wavelengths would be unusable in ambient environments because <strong>of</strong> the limitations <strong>of</strong> the<br />
BLIP, but at the shorter wavelengths, the reduction in the BLIP allows even higher D*.<br />
4. Spectral Responsivity <strong>and</strong> Atmospheric Transmission<br />
The advantages <strong>of</strong> higher detectivities for these detectors cannot be utilized if the spectral<br />
responsivities <strong>of</strong> the detectors are in regions <strong>of</strong> atmospheric absorption b<strong>and</strong>s. The spectral<br />
irradiance responsivity <strong>of</strong> a 2-stage cooled ex-InGaAs photodiode is shown in Fig. 4. The
Spectral Irradiance Responsivity [ A / W / cm 2 ]<br />
0.08<br />
0.06<br />
0.04<br />
0.02<br />
0.00<br />
1000 1500 2000 2500<br />
Wavelength [ nm ]<br />
Figure 4. The <strong>NIST</strong>-measured spectral irradiance responsivity <strong>of</strong> an ex-InGaAs detector demonstrating the peak <strong>of</strong><br />
the responsivity lies in the 2.0 μm to 2.5 μm region.<br />
peak <strong>of</strong> the responsivity can be tuned by selecting the material composition such that the<br />
b<strong>and</strong>-gap energy <strong>of</strong> InGaAs or HgCdTe diodes can be made to occur at a range <strong>of</strong><br />
wavelengths from 1.7 μm to 2.6 μm. Since these are direct b<strong>and</strong>-gap materials, the quantum<br />
efficiency <strong>of</strong> the photon-to-electron conversion is also high.<br />
In Fig. 5, the atmospheric transmission as a function <strong>of</strong> wavelength is plotted showing<br />
Transmittance<br />
1.0<br />
0.8<br />
0.6<br />
0.4<br />
0.2<br />
0.0<br />
1.0 1.5 2.0 2.5 3.0<br />
Wavelength [ μm ]<br />
Figure 5. The transmittance at sea level for a 1 m path length <strong>of</strong> atmosphere showing the window between 2.0 μm to<br />
2.5 μm.<br />
that such spectrally selected radiometers can operate in an atmospherically clear transmission<br />
region. To avoid fluctuations due to atmospheric changes in the transmission or absorption,<br />
ex-InGaAs radiometers can be constructed with cut-on filters to further restrict the spectral<br />
region from 2.0 μm to 2.5 μm.
5. Detector Signals from Ambient Objects<br />
The results <strong>of</strong> initial feasibilities studies <strong>of</strong> using SWIR detectors for measurements <strong>of</strong><br />
ambient temperature objects are shown in Table 1. A 3 mm diameter ex-InGaAs detector was<br />
Table 1. The signals from various objects at the estimated temperatures filling the field-<strong>of</strong>-view with the 3 mm<br />
diameter, 4-stage TE cooled (-85 °C) ex-InGaAs photodiode with a preamplifier gain <strong>of</strong> 10 7 V/A. These signals<br />
clearly demonstrate that there is sufficient signal for thermal imaging. The differences in the spectral emissivity <strong>of</strong><br />
the room temperature objects account for the different signals.<br />
Material Signal [ V ] St. Dev. [ V ]<br />
LN2 dewar ( 77 K) 0.026 2.5 x 10 -5<br />
Al foil ( 295 K ) 0.0912 2.5 x 10 -6<br />
Anodized Al ( 295 K ) 0.115 2.5 x 10 -6<br />
Black polymer ( 295 K ) 0.137 2.5 x 10 -6<br />
Human h<strong>and</strong> ( 307 K ) 0.226 2.5 x 10 -6<br />
TE cooled to -85 °C <strong>and</strong> the photocurrents were converted to voltages using a current-tovoltage<br />
amplifier at a gain <strong>of</strong> 10 7 V/A. Various objects with differing temperatures <strong>and</strong><br />
emissivities were placed to fill the field-<strong>of</strong>-view <strong>of</strong> the detector. Although the detector was<br />
placed over the mouth <strong>of</strong> a liquid-nitrogen (LN2) dewar to reduce the ambient background<br />
signal, the field-<strong>of</strong>-view could not be completely filled with a 77 K environment. The signals<br />
from the various objects are listed in col. 2 <strong>of</strong> Table 1. The lower temperature background <strong>of</strong><br />
the LN2 dewar results in lower signals, <strong>and</strong> the low emissivity <strong>of</strong> the aluminum foil also leads<br />
to low signals. The difference in the signals with the changing temperature <strong>and</strong> the emissivity<br />
<strong>of</strong> the objects at room temperature <strong>and</strong> human body temperatures can be observed. These<br />
results clearly indicate that SWIR detectors have the sensitivity to measure objects at ambient<br />
temperatures.<br />
6. Use <strong>of</strong> Traditional Glass Refractive Optics<br />
One <strong>of</strong> the greatest advantages <strong>of</strong> operating in this atmospheric window is that unlike the<br />
traditional mid- or thermal-infrared regions where the choices <strong>of</strong> refractive lens materials are<br />
limited, many optical glasses transmit to 2.5 μm. The transmittances <strong>of</strong> 10 mm thick BK7<br />
<strong>and</strong> SF5 glasses [3], which are used in typical achromat lens combinations, are shown in Fig.<br />
6. These <strong>of</strong>f-the-
Transmittance<br />
1.0<br />
0.9<br />
0.8<br />
0.7<br />
0.6<br />
BK7 10 mm<br />
SF5 10 mm<br />
0.5<br />
1.4 1.6 1.8 2.0 2.2 2.4 2.6<br />
Wavelength [ μm ]<br />
Figure 6. The transmittances <strong>of</strong> 10 mm thick BK7 (crown) glass <strong>and</strong> SF5 (flint) glass elements which are commonly<br />
used to form achromat lenses. Other optical glasses have generally similar transmittances.<br />
shelf achromats are used to collect the SWIR radiation. Since these glasses also transmit in<br />
the visible radiation, the optical alignment can be performed using visible radiation <strong>and</strong> then<br />
refocused to optimize the thermal infrared signal. Such lenses could be easily optimized for<br />
diffraction-limited optical performance as shown later by optical modeling using commercial<br />
s<strong>of</strong>tware. In addition, if the detectors are designed so that the back substrate is thinned, then<br />
the spectral responsivities can be made to range from the visible to 2.5 μm. For such a<br />
detector, these optical glass lenses can be refocused to use a single lens system for visible to<br />
thermal imaging.<br />
7. Imaging Performance <strong>of</strong> Traditional Glass Optics in the SWIR<br />
Optical performances <strong>of</strong> lenses used in the visible wavelength region can be assessed for the<br />
SWIR by using an optical modeling s<strong>of</strong>tware. In Table 2, typical achromat specifications are<br />
Table 2. The specifications <strong>of</strong> the 200 mm focal length achromatic lens used for the optical modeling.<br />
Radius <strong>of</strong> Curvature<br />
[ mm ]<br />
Thickness [ mm ]<br />
Radius <strong>of</strong><br />
Entrance Aperture<br />
[mm ]<br />
Material<br />
121.342 8.0 25.4 BK7<br />
-91.445 4.0 25.4 SF5<br />
-271.562 -- 25.4 --<br />
shown with the surface curvatures <strong>and</strong> thicknesses along with the glass types. The achromat<br />
specifications are for an <strong>of</strong>f-the-shelf achromat which has been optimized for infinite<br />
conjugate in the visible wavelength region. Typically, if the optics has been optimized at a<br />
shorter wavelengths, the performance at longer wavelengths will be better than at the<br />
optimized wavelengths. The specifications in Table 2 for a 200 mm focal length lens are used<br />
to model the optical performance shown in Table 3 at 2.45 μm. Table 2 shows the root-mean-
Table 3. The optical performance <strong>of</strong> the achromatic lens at infinite conjugate at a wavelength <strong>of</strong> 2.45 μm. The<br />
performance is diffraction limited as indicated by a smaller geometric, root-mean-squared (RMS) radius than the<br />
diffraction limit radius.<br />
Beam Entrance<br />
Radius [ mm ]<br />
Geometric RMS<br />
Radius [ mm ]<br />
Diffraction Limit<br />
Radius [ mm ]<br />
Strehl Ratio<br />
24.0 0.002123 0.013145 0.9883<br />
squared radius as compared to the diffraction-limited radius indicating that the lens is<br />
diffraction limited with close to optimum Strehl ratio <strong>of</strong> 1.0 for an infinite conjugate operation<br />
at 2.45 μm. Although the optical performance will suffer if infinite conjugate optimized<br />
lenses are used in finite conjugate (1:1) imaging, custom lenses with computer-optimized<br />
curvatures <strong>and</strong> thicknesses can be fabricated if better performance is desired.<br />
8. SWIR detector performance in radiation thermometers<br />
To compare the performances <strong>of</strong> SWIR detectors against traditional cryogenically cooled<br />
detectors, the SWIR detectors were constructed into experimental radiation thermometers.<br />
Since optical glasses transmit at these wavelengths, regular achromats were used as objective<br />
lenses in the prototype shown in Fig. 7. A variable-temperature blackbody set to room<br />
Blackbody<br />
Aperture<br />
Objective<br />
Lens<br />
Chopper<br />
Wheel<br />
Field<br />
Stop<br />
Photodiode<br />
Lyot<br />
stop<br />
Figure 7. The SWIR detector was constructed into a radiation thermometer configuration to determine the noiseequivalent<br />
temperature difference as a function <strong>of</strong> the blackbody temperature. The distance between the objective<br />
lens <strong>and</strong> the blackbody aperture was 500 mm with a 50 mm diameter objective resulting in roughly a f/10 collection<br />
geometry. A 6 mm diameter target was focused at the blackbody opening.<br />
temperatures <strong>and</strong> higher was used as the source <strong>of</strong> radiation. A 6 mm diameter target was<br />
imaged by the radiation thermometer at a distance <strong>of</strong> 50 cm between the source aperture <strong>and</strong><br />
front <strong>of</strong> the objective lens. The radiation was imaged onto a field stop with a chopper wheel<br />
placed close to the field stop. The radiation was collimated <strong>and</strong> focused onto the 3 mm<br />
diameter detector with achromats. The ex-InGaAs detector was cooled to –85 °C with<br />
thermoelectric cooling. The Lyot stop [4] serves as the aperture stop behind the field stop.<br />
Due to the low scatter objective, the Lyot stop <strong>and</strong> the internal field-<strong>of</strong>-view limiter, this<br />
radiation thermometer design has out-<strong>of</strong>-field rejection which enables internal chopping. A<br />
novel chopper using a mirrored surface was used to have the TE-cooled diode view itself<br />
using the self-staring or “Narcissus” effect. The reference for the chopped radiation then<br />
becomes the radiation from the temperature-stabilized detector leading to long-term stability<br />
<strong>of</strong> the chopped signal.
The results <strong>of</strong> the measurements with the blackbody at 50 °C can be seen in Fig. 8. A<br />
Temperature [ o C ]<br />
50.02<br />
50.01<br />
50.00<br />
49.99<br />
49.98<br />
11:19 11:20 11:21 11:22 11:23 11:24<br />
Time [hh:mm]<br />
Figure 8. The stability <strong>of</strong> the chopped radiation thermometer measuring the radiance temperature <strong>of</strong> the 50 o C<br />
blackbody. The blackbody was constructed with a spherical geometry <strong>and</strong> a control loop was used to stabilize the<br />
blackbody temperature.<br />
noise-equivalent temperature difference (NETD) <strong>of</strong> < 3 mK can be observed from the<br />
st<strong>and</strong>ard deviation <strong>of</strong> the temperature measurements taken with an electrical b<strong>and</strong>width <strong>of</strong><br />
0.16 Hz. A longer time sequence <strong>of</strong> temperatures showed changes due to the fluctuations<br />
from the heater controller <strong>of</strong> the blackbody which are not shown in the short time sequence in<br />
Fig. 8.<br />
The NETD plotted as a function <strong>of</strong> the blackbody temperature is shown in Fig. 9. The<br />
NETD [ mK ]<br />
100<br />
80<br />
60<br />
40<br />
20<br />
0<br />
20 25 30 35 40 45 50<br />
Blackbody Temperature [ o C ]<br />
Figure 9. The noise-equivalent temperature difference (NETD), at an electrical b<strong>and</strong>width <strong>of</strong> 0.16 Hz, obtained from<br />
the st<strong>and</strong>ard deviation <strong>of</strong> the radiation thermometer measurements at the respective blackbody temperatures. The
increase in the NETD from the low signals as the blackbody temperature approaches the laboratory ambient<br />
temperatures is observed. The NETD at human body temperature <strong>of</strong> 36 °C is below 10 mK.<br />
NETD increases rapidly as the target temperature becomes comparable to the chopper-wheel<br />
temperature, but at the human body temperature <strong>of</strong> 36 o C, the NETD remains < 10 mK.<br />
These results demonstrate that the NETD is comparable to that <strong>of</strong> InSb detectors for<br />
blackbody temperatures > 25 °C without the need for cryogenic cooling.<br />
9. Noise-equivalent Irradiance<br />
To test the limits <strong>of</strong> detection for irradiance, a blackbody at 300 °C was placed at the entrance<br />
to the 1.24 m focal length collimator as shown in Fig. 10. An aperture wheel was placed in<br />
1.24 m fl Collimator<br />
Chopper 1<br />
Blackbody<br />
200 mm fl SWIR Radiometer<br />
Chopper 2<br />
Figure 10. The schematic <strong>of</strong> the SWIR radiometer used to measure the collimated output from an infrared collimator.<br />
The use <strong>of</strong> the two chopper positions allows comparison <strong>of</strong> “upstream” chopping at the source to “down-stream”<br />
chopping inside the radiometer.<br />
front <strong>of</strong> the blackbody, <strong>and</strong> the chopper wheel (Chopper 1) was placed between the blackbody<br />
<strong>and</strong> the aperture wheel. From the geometry <strong>of</strong> the collimator, the calculated irradiance at the<br />
40 mm diameter entrance pupil <strong>of</strong> the radiometer can be determined. Another alternatively<br />
used chopper wheel (Chopper 2) was placed inside the radiometer for “down-stream”<br />
chopping at the radiometer. The measurements <strong>of</strong> the noise-equivalent irradiance (NEI) with<br />
the setup in Fig. 11 are shown in Table 4.<br />
Table 4. The noise-equivalent irradiances found using the SWIR radiometers from the measurements <strong>of</strong> the<br />
collimator shown in Fig. 10 with the blackbody source with the respective source diameters at 300 °C.<br />
Diameter<br />
[ um ]<br />
Measured<br />
Signal [ V ]<br />
St<strong>and</strong>ard<br />
Deviation<br />
[ V ]<br />
St<strong>and</strong>ard<br />
Deviation/Signal<br />
Noise equivalent<br />
irradiance [ W / cm 2 ]<br />
250.0 9.54 x10 -3 1.50 x10 -6 1.57 x10 -4 1.00 x10 -14<br />
150.0 3.62 x10 -3 6.40 x10 -7 1.77 x10 -4 4.06 x10 -15<br />
50.0 3.78 x10 -4 7.30 x10 -7 1.93 x10 -3 4.94 x10 -15
10. Applications <strong>of</strong> SWIR Radiometers<br />
One <strong>of</strong> the advantages <strong>of</strong> using the SWIR radiometers is the transparency <strong>of</strong> glass in buildings,<br />
automobiles <strong>and</strong> other equipment at these wavelengths. If SWIR thermal imagers with low<br />
NETD could be developed at these wavelengths, then it would be possible to perform thermal<br />
imaging for human detection through the automotive glass <strong>and</strong> building windows.<br />
Firefighters <strong>and</strong> emergency personnel could determine the presence human beings without<br />
having to break the window <strong>and</strong> risk acceleration <strong>of</strong> smoldering fires. Such thermal imaging<br />
is not possible for the currently used long-wavelength infrared detectors. In addition, thermal<br />
imagers are used for diagnostics <strong>of</strong> electrical power switches where the operator must be<br />
protected from potentially lethal voltages with a protective cover. Often, these covers require<br />
special infrared transmitting glasses for thermal imaging in order to determine which switches<br />
are overheating <strong>and</strong> about to fail. Regular window glass covers could be used in these<br />
applications. There are also a large number <strong>of</strong> military applications, especially in target<br />
discrimination at long distances where the traditional InSb <strong>and</strong> MCT detectors are not<br />
sensitive enough for accurate sensing.<br />
11. Conclusions<br />
We demonstrate that SWIR detectors with a 2.5 μm wavelength cut-<strong>of</strong>f can be used as new<br />
generation <strong>of</strong> sensors for IR radiometers <strong>and</strong> radiation thermometers. Although the cut-on at<br />
2.0 μm can be accomplished with a filter, the cut-<strong>of</strong>f at around 2.5 μm must be intrinsic to the<br />
detector material from the fabrication process to avoid large background currents. These<br />
detectors can be used in a spectral wavelength region where the atmosphere has a clear<br />
window from 2.0 μm to 2.5 μm, leading to the use <strong>of</strong> refractive-glass optics without central<br />
obscurations. Furthermore, equivalent or better infrared detection capability than the<br />
traditionally used detectors can be achieved in a compact, low-maintenance design with the<br />
capabilities <strong>of</strong> measuring human body temperatures.
# Certain commercial equipment, instruments, or materials are identified in this paper to foster underst<strong>and</strong>ing. Such<br />
identification does not imply recommendation or endorsement by the <strong>National</strong> <strong>Institute</strong> <strong>of</strong> <strong>St<strong>and</strong>ards</strong> <strong>and</strong> Technology,<br />
nor does it imply that the material or equipment are necessarily the best available for the purpose.<br />
References<br />
1. A. Rogalski <strong>and</strong> K. Chrzanowski, Infrared devices <strong>and</strong> technique, Opto-Electronics Review 10(2): 111(2002).<br />
2. D.G. Crowe, P.R. Norton, T. Limperis <strong>and</strong> J. Mudar, “Detectors,” in Electro-Optical Components, W. D. Rogatto<br />
ed., The Infrared <strong>and</strong> Electro-Optical Systems H<strong>and</strong>book, Infrared Information Analysis Center, Michigan,<br />
1993.<br />
3. Schott glass designations.<br />
4. H.W. Yoon, D.W. Allen, <strong>and</strong> R.D. Saunders, “Methods to reduce the size-<strong>of</strong>-source effect in radiometers,”<br />
Metrologia 42, 89-96 (2005).
AC-Mode Short-Wavelength IR Radiation Thermometers for<br />
Measurement <strong>of</strong> Ambient Temperatures<br />
G. P. Eppeldauer <strong>and</strong> H. W. Yoon<br />
Optical Technology Division, <strong>National</strong> <strong>Institute</strong> <strong>of</strong> <strong>St<strong>and</strong>ards</strong> <strong>and</strong> Technology,<br />
Gaithersburg, Maryl<strong>and</strong> 20899, USA<br />
ABSTRACT<br />
Recent improvements in the fabrication <strong>of</strong> short-wave infrared (SW-IR) quantum<br />
detectors have opened a new era in radiation thermometry. Ambient <strong>and</strong> higher<br />
temperatures can be measured with low uncertainties using thermoelectrically (TE)<br />
cooled extended-InGaAs (E-IGA) <strong>and</strong> short-wave photovoltaic-HgCdTe (SW-MCT)<br />
detectors. Since these detectors have low cut-<strong>of</strong>f wavelengths (2.5 μm <strong>and</strong> 2.8 μm,<br />
respectively), they do not respond past cut-<strong>of</strong>f <strong>and</strong> are less sensitive to the background<br />
infrared radiation, resulting in orders <strong>of</strong> magnitude lower background noise than<br />
traditionally used broad-b<strong>and</strong> infrared detectors such as cryogenically cooled quantum<br />
detectors or thermal detectors. At the same time, the cut-<strong>of</strong>f is far enough in the infrared<br />
to obtain a large enough signal from the source <strong>of</strong> interest. Because <strong>of</strong> the low detector<br />
cut-<strong>of</strong>f wavelength, traditional glass-based optics can be used in the radiation<br />
thermometers. A chopper produced alternating-current (AC) signal was used to measure<br />
low temperatures by separating the AC signal from the background-radiation-produced<br />
direct-current (DC) signal <strong>and</strong> its fluctuations. Design considerations <strong>and</strong> characteristics<br />
<strong>of</strong> a newly developed SW-IR radiation thermometer are discussed. A noise-equivalent<br />
temperature difference (NETD) <strong>of</strong> < 3 mK for a 50 °C blackbody was measured. At the<br />
human body temperature <strong>of</strong> 36 °C, the obtained NETD <strong>of</strong> ~ 10 mK indicates that these<br />
detectors can be used in non-contact temperature measurements to replace thermopile- or<br />
pyroelectric-based radiation thermometers.<br />
KEY WORDS: ambient temperatures; infrared; input optics; NETD; NEP; noise; optical<br />
radiation; radiance; radiation thermometer; responsivity; non-contact body temperature<br />
1. INTRODUCTION<br />
Traditional infrared detectors, such as cryogenically cooled quantum detectors <strong>and</strong><br />
thermal detectors, operate in background-limited mode because <strong>of</strong> their long cut-<strong>of</strong>f<br />
wavelengths. In this mode, the background radiation is orders <strong>of</strong> magnitude larger than<br />
the target radiation. In addition, the high background-radiation-produced DC signal is not<br />
stable <strong>and</strong> has a large noise component. The signal to be measured is usually AC to<br />
separate it from the DC background signal. However, the large noise component <strong>of</strong> the<br />
DC background signal will dominate the output noise <strong>of</strong> the radiometer unless the<br />
background signal is significantly reduced.
Furthermore, ambient-temperature thermal detectors (e.g. thermopiles or<br />
pyroelectric detectors) have low responsivities <strong>and</strong>, thus, high noise-equivalent powers<br />
(NEP). They need large signals (sufficient thermal radiation within the detector system<br />
b<strong>and</strong>pass) to obtain reasonable signal-to-noise ratios at the output <strong>of</strong> the radiometers. In<br />
many applications, large thermal radiation to be measured is not available, <strong>and</strong> the signal<br />
(photocurrent) gain in the radiometers cannot be increased to improve the poor signal-tonoise<br />
ratios. Both <strong>of</strong> the above limitations are apparent in current designs <strong>of</strong> radiation<br />
thermometers for measuring human body temperatures. They are prone to drift from<br />
changes in the immediate thermal environment around the detector <strong>and</strong> also are not<br />
capable <strong>of</strong> transferring a temperature scale to within ± 0.2 °C from 32 °C to 45 °C [1].<br />
We describe the development <strong>of</strong> a short-wave infrared (SW-IR) radiation<br />
thermometer that can be used as a transfer st<strong>and</strong>ard to measure low-temperature<br />
radiometric sources with low uncertainty <strong>and</strong> high stability. The design issues <strong>and</strong> the<br />
characteristics <strong>of</strong> this thermometer are discussed here, <strong>and</strong> we show that cryogenic,<br />
quantum detector-based radiation thermometer performance can be achieved with<br />
thermo-electrically cooled SW-IR radiation thermometers.<br />
2. NETD AND NEP OF RADIATION THERMOMETERS<br />
The noise-equivalent temperature difference (NETD) <strong>and</strong> the NEP <strong>of</strong> a radiation<br />
thermometer are noise figures-<strong>of</strong>-merit that are closely related. The NETD shows the<br />
sensitivity (temperature resolution) <strong>of</strong> a thermometer while the NEP is used to optimize<br />
the detectivity <strong>of</strong> a radiation thermometer.<br />
The NETD is determined when the thermometer measures the radiation from a<br />
stable source. In this case, the st<strong>and</strong>ard deviation (STD) <strong>of</strong> the measured photocurrent<br />
values is divided by the mean <strong>of</strong> the values to obtain the NETD. The noise equivalent<br />
signal fluctuation Δ S S can come from both the emitted radiation <strong>and</strong> the noise in the<br />
output signal <strong>of</strong> the thermometer. Using the derivative <strong>of</strong> the Wien approximation,<br />
ΔS<br />
ΔL<br />
c2<br />
ΔT<br />
= =<br />
S L λ 2<br />
T<br />
where L is the source radiance, = 1.4387752 x 10 -2 c2<br />
m·K , T is the temperature <strong>of</strong> the<br />
source, <strong>and</strong> λ is the wavelength where the detector is responsive to the broad-b<strong>and</strong> source<br />
radiation (such as a blackbody), the NETD can be equated with the calculated ΔT .<br />
In contrast to the above suggested NETD measurements, the NEP is measured at<br />
zero (dark or blocked) signal, or close to zero signal. The NEP is the ratio <strong>of</strong> the output<br />
noise N to the responsivity R <strong>of</strong> the radiation thermometer, usually at an electrical<br />
b<strong>and</strong>width <strong>of</strong> 1 Hz,<br />
N(<br />
output )<br />
NEP = . (2)<br />
R<br />
The output noise can be obtained as the st<strong>and</strong>ard deviation (STD) <strong>of</strong> the thermometer<br />
photocurrent (output voltage per photocurrent-to-voltage gain). The unit <strong>of</strong> NEP is W·Hz -<br />
1/2<br />
. The detectivity D* <strong>of</strong> the thermometer (comprised <strong>of</strong> the radiation detector <strong>and</strong> the<br />
preamplifier) can be calculated from the NEP,<br />
(1)
A<br />
D * = , (3)<br />
NEP<br />
where A is the active area <strong>of</strong> the detector. The unit <strong>of</strong> detectivity is cm·Hz 1/2 ·W -1 .<br />
In traditional broad-b<strong>and</strong> detector applications, where the background-produced<br />
photocurrent is high, the photocurrent-to-voltage gain (a component <strong>of</strong> R) cannot be<br />
increased to high values without saturating the photocurrent-to-voltage converter, but the<br />
low R will result in a high NEP. The lower background signal <strong>of</strong> SW-IR detectors makes<br />
it possible to increase the photocurrent-to-voltage gain in the preamplifier <strong>of</strong> the<br />
radiometer.<br />
The NETD <strong>of</strong> ambient thermal detectors is higher than 0.1 K, which makes them<br />
difficult to use for low-uncertainty measurements in many applications, such as for ear<br />
thermometers [1]. The responsivity <strong>of</strong> such detectors, i.e. thermopiles <strong>and</strong> pyroelectric<br />
detectors, is low. For example, the power responsivity <strong>of</strong> a pyroelectric detector is 6<br />
orders <strong>of</strong> magnitude lower than that <strong>of</strong> InGaAs (including extended-InGaAs) detectors,<br />
resulting in 6 orders <strong>of</strong> magnitude higher NEP.<br />
Detectors with high responsivity for the SW-IR <strong>and</strong> low responsivity (high<br />
rejection) for the long-wave infrared (LW-IR) should be used to achieve low NEP <strong>and</strong><br />
NETD in radiation thermometers. In order to obtain maximum responsivity, the feedback<br />
resistance <strong>of</strong> the photocurrent-to-voltage converter should be equal to the shunt resistance<br />
<strong>of</strong> the detector. Also, the output noise, N, should be minimized.<br />
3. DECREASE OF THERMOMETER OUTPUT NOISE<br />
The output noise <strong>of</strong> a thermometer can be decreased in a few ways. The dominating noise<br />
components are the amplified 1/f noise <strong>of</strong> the current measuring preamplifier, the resistor<br />
(Johnson) noise (which is obtained from the parallel combination <strong>of</strong> the detector shunt<br />
resistance <strong>and</strong> the feedback resistance <strong>of</strong> the current meter), <strong>and</strong> the remaining<br />
background noise [2]. These three noise components must be minimized to achieve low<br />
values <strong>of</strong> NEP. This is in contrast to the dominantly background-noise-limited<br />
operational mode <strong>of</strong> traditional mid-IR <strong>and</strong> long-IR thermometers.<br />
The 1/f noise can be significantly decreased using AC signal techniques. In this<br />
case, the signal frequency is much higher than in DC mode measurements. The signal<br />
frequency should be selected near the elbow <strong>of</strong> the 1/f noise spectrum <strong>of</strong> the current-tovoltage<br />
converter (preamplifier). A high photodiode shunt resistance can keep the closedloop<br />
voltage gain <strong>of</strong> the photocurrent-to-voltage converter low [3], resulting in low noise<br />
at the output <strong>of</strong> the radiometer. The noise <strong>of</strong> the remaining background signal can be<br />
further decreased using a metal detector case with a built-in thermoelectric (TE) cooler<br />
<strong>and</strong> a cold field-<strong>of</strong>-view (FOV) limiter for the detector. The side <strong>of</strong> the metal can,<br />
viewed by the detector, should remain at room temperature to avoid radiating excess heat<br />
onto the detector. The achievable signal-to-noise ratio is determined by the performance<br />
<strong>of</strong> the first-stage amplifier (preamplifier), which includes the detector <strong>and</strong> the current-tovoltage<br />
converter. As the noise is electrical b<strong>and</strong>width dependent, it can be further<br />
reduced if the AC signal <strong>of</strong> the radiometer (thermometer) output is measured with a lockin<br />
amplifier that has a large time-constant low-pass filter.
4. PHOTOCURRENT MEASUREMENT<br />
In order to describe the effects <strong>of</strong> detector <strong>and</strong> feedback impedances <strong>and</strong> noise sources in<br />
a photodiode current meter, the equivalent circuit must be discussed. As shown in Fig. 1,<br />
a photodiode P can be substituted by an ideal current source (double circle) <strong>and</strong> parallel-<br />
connected shunt resistance RS <strong>and</strong> junction capacitance CJ. The photocurrent IP from<br />
photodiode P is converted into a voltage V at the output <strong>of</strong> the operational amplifier<br />
(OA). R is the feedback resistance <strong>and</strong> C is the feedback capacitance <strong>of</strong> the OA. IIN is the<br />
input current noise <strong>and</strong> VVN the input voltage noise <strong>of</strong> the OA. The resistor noise that<br />
originates from the parallel connection <strong>of</strong> R <strong>and</strong> RS is not illustrated here to keep the<br />
equivalent circuit simple. The resistor noise will be superimposed on V without any<br />
amplification.<br />
Fig. 1. Equivalent circuit <strong>of</strong> a photodiode current meter.<br />
The photodiode P is denoted by the dotted line.<br />
The signal gain (current-to-voltage conversion) is the following:<br />
V<br />
I<br />
P<br />
P<br />
R S<br />
C J<br />
I P<br />
⎛ 1 ⎞⎛<br />
1<br />
R⎜<br />
⎟⎜<br />
⎝ 1+<br />
jωRC<br />
⎠⎝<br />
1+<br />
G<br />
= −1<br />
⎞<br />
⎟<br />
⎠<br />
I IN<br />
V V<br />
N<br />
where RC is the time constant produced by the feedback components. It determines the<br />
upper frequency roll-<strong>of</strong>f <strong>of</strong> the signal. G is the loop gain <strong>and</strong> it must be large at the signal<br />
(i.e. the chopping) frequency to keep the uncertainty <strong>of</strong> the current-to-voltage gain low.<br />
The loop gain (the product <strong>of</strong> the OA open-loop gain A <strong>and</strong> the feedback attenuation β) is<br />
(4)<br />
G = Aβ (5)<br />
where β = RS/(RS+R) at low frequency, i.e. as with DC measurements. High loop gain can<br />
be obtained if β is close to unity (its maximum value). To achieve this condition, the<br />
shunt impedance, ZS ( ≡ RS 1 + jωRSC<br />
S ), must be high at the signal frequency. CS is the<br />
shunt capacitance <strong>of</strong> the photodiode.<br />
The closed-loop voltage gain that determines the amplification <strong>of</strong> the input noise,<br />
<strong>of</strong>fset, <strong>and</strong> drift for the output <strong>of</strong> the current-to-voltage converter is the reciprocal <strong>of</strong> β :<br />
R<br />
C<br />
O<br />
A<br />
V
A<br />
R<br />
+ R<br />
S<br />
V = (6)<br />
RS<br />
Again, AV can be kept small (close to unity) if the shunt resistance is high relative to the<br />
feedback resistance. As with the signal-gain above, both G <strong>and</strong> AV are frequency<br />
dependent [4].<br />
When the shunt resistance is high, the feedback resistor <strong>of</strong> the current-to-voltage<br />
amplifier (that determines the signal gain) can be high as well.<br />
The input impedance <strong>of</strong> the above photocurrent meter can be calculated as the<br />
parallel connection <strong>of</strong> the down-transformed feedback resistor <strong>and</strong> the up-transformed<br />
feedback capacitor <strong>of</strong> the OA:<br />
( Z )<br />
−1<br />
I<br />
⎛ R ⎞<br />
= ⎜ ⎟<br />
⎝ A ⎠<br />
−1<br />
⎛ 1 ⎞<br />
+ ⎜ ⎟<br />
⎝ jωAC<br />
⎠<br />
Linear signal-gain (response) can be achieved if the short-circuit photocurrent <strong>of</strong> the<br />
photodiode is measured. In this case, the photodiode shunt impedance must be much<br />
larger than the input impedance <strong>of</strong> the current meter:<br />
−1<br />
(7)<br />
ZI
accurate. It can be calibrated against a digital voltmeter (DVM) in DC mode if the input<br />
signal has a large signal-to-noise ratio. If the chopper is stopped, the DVM reading will<br />
be S2=2H. The real correction factor will be the ratio <strong>of</strong> the lock-in amplifier reading to<br />
the DVM reading.<br />
In many cases, the frequency-dependent responsivity <strong>of</strong> a detector-preamplifier<br />
st<strong>and</strong>ard is measured during its calibration <strong>and</strong> the DC responsivity is reported. When this<br />
detector-preamplifier st<strong>and</strong>ard is used in an application where the chopper <strong>and</strong> the lock-in<br />
amplifiers are different, the frequency-dependent responsivity is measured again with<br />
these different instruments <strong>and</strong> the DC responsivity is extended to the signal frequency <strong>of</strong><br />
this application using the measured curve. Using the theoretical conversion factor S1, the<br />
DC responsivity is 2/0.9003 = 2.22 times higher than the value measured by the lock-in<br />
amplifier.<br />
6. DESIGN OF SENSITIVE RADIATION THERMOMETERS<br />
The wavelength interval for a sensitive radiation thermometer should be properly selected<br />
to obtain high ratios <strong>of</strong> signal from the target to that <strong>of</strong> the background. Figure 2 shows<br />
different blackbody radiance curves for target temperatures ranging from -63 °C to<br />
850 °C. The graph shows that at long wavelengths the target-signal to background-signal<br />
(contrast) ratios are much smaller than in the atmospheric window between 2 μm <strong>and</strong><br />
2.5 μm where the SWIR detectors operate. The vertical lines show orders <strong>of</strong> magnitude<br />
increase in the contrast ratio when the thermometer measures at 2.25 μm instead <strong>of</strong> 4 μm.<br />
Spectral Radiance, W/ cm 2 / cm sr<br />
10 -7<br />
10 -6<br />
10 -5<br />
10 -4<br />
10 -3<br />
10 -2<br />
10 -1<br />
10 0<br />
10 1<br />
10 2<br />
10 3<br />
10 4<br />
0 1 2 3 4 5 6 7<br />
Wavelength, μm<br />
22 o C<br />
300 o C<br />
350 o C<br />
600 o C<br />
850 o C<br />
-63 o C<br />
Fig. 2. Planck radiance curves between -63 °C <strong>and</strong> 850 °C. The target-signal to<br />
background-signal ratios are shown with vertical lines at 2.25 μm <strong>and</strong> 4 μm.<br />
Figure 2 also shows that the target signal at 2.25 μm is about an order <strong>of</strong><br />
magnitude smaller than at 4 μm or longer. Therefore, detectors with high D* should be<br />
selected for the atmospheric window between 2 μm <strong>and</strong> 2.5 μm. Figure 3 shows the
spectral power responsivity <strong>of</strong> an extended-InGaAs (E-IGA) detector. It can be seen that<br />
the responsivity is high in the 2 μm to 2.5 μm wavelength range.<br />
1.2<br />
1<br />
0.8<br />
0.6<br />
0.4<br />
0.2<br />
0<br />
1000 1400 1800 2200 2600<br />
Wavelength, nm<br />
Fig. 3. Spectral power responsivity <strong>of</strong> an extended-InGaAs detector.<br />
Figure 4 shows the wavelength dependence <strong>of</strong> D* <strong>of</strong> several high radiometric<br />
quality detector-preamplifier units (radiometers), such as Si <strong>and</strong> InGaAs (near-IR)<br />
radiometers <strong>and</strong> different infrared radiometers, including SW-IR such as E-IGA <strong>and</strong> SW-<br />
HgCdTe (SW-MCT), <strong>and</strong> mid-wave infrared (mid-IR) InSb.<br />
, cm Hz 1/2 /W<br />
Detectivity D *<br />
λ<br />
C<br />
10 16<br />
10 15<br />
10 14<br />
10 13<br />
10 12<br />
10 11<br />
-85 o C<br />
RT<br />
10<br />
0 2 4 6 8 10<br />
10<br />
Wavelength , μm<br />
-85 o C InGaAs<br />
-85 o C swMCT<br />
-85 o C exInGaAs<br />
77 K InSb<br />
22 o C ex InGaAs<br />
22 o C Si<br />
295 K BLIP<br />
Fig. 4. D* <strong>of</strong> silicon, near-IR, SW-IR, <strong>and</strong> mid-IR radiometers with the backgroundlimited<br />
power curve at 295 K calculated with an f/2 detector FOV <strong>and</strong> an electrical<br />
b<strong>and</strong>width <strong>of</strong> 0.16 Hz.
The background-limited power (BLIP) curve, which gives the theoretical limit for<br />
the D* [5], was calculated with an f/2 detector field-<strong>of</strong>-view (FOV) for a 295 K<br />
background radiation. The graph shows that the D* <strong>of</strong> a room-temperature E-IGA<br />
radiometer was increased by almost three orders <strong>of</strong> magnitude when the detector was<br />
cooled down to –85 °C. As a result <strong>of</strong> equalizing the three dominant noise components,<br />
the obtained D* value <strong>of</strong> 3 x 10 13 cm·Hz 1/2 ·W -1 is very close to the background noise<br />
theoretical limit. The SW-MCT radiometer, with a 2.8 μm cut-<strong>of</strong>f, is also very close to<br />
the BLIP curve. The D* <strong>of</strong> an InSb radiometer (with optimized background rejection) is<br />
about two orders <strong>of</strong> magnitude lower. The Si <strong>and</strong> InGaAs radiometers have very high D*<br />
values but they are not suited for detection <strong>of</strong> objects at ambient temperatures since there<br />
is insufficient signal at these wavelengths (the BLIP is > 10 18 cm·Hz 1/2 ·W -1 ).<br />
Thermometers with high D* (high responsivity <strong>and</strong> low noise) can be developed<br />
if detectors with high shunt resistance are used. The shunt resistance <strong>of</strong> a 1 mm diameter<br />
SW-IR detector can be increased to about 10 MΩ from 10 kΩ (at room temperature)<br />
when it is cooled to about -70 °C or lower [6]. Instead <strong>of</strong> cryogenic cooling, which is<br />
traditionally used for InSb detectors, four-stage thermo-electric (TE) coolers can be used.<br />
7. SW-IR RADIATION THERMOMETER CONSTRUCTION<br />
Using the above design considerations, an experimental radiation thermometer was<br />
constructed to determine the NETD as a function <strong>of</strong> blackbody temperature. Since optical<br />
glasses transmit at these wavelengths, regular achromats were used as objective lenses in<br />
the prototype shown in Fig. 5. A variable-temperature blackbody set to room<br />
Blackbody<br />
Aperture<br />
Objective Lens<br />
Objective<br />
baffle<br />
Chopper<br />
Wheel<br />
Field<br />
Stop<br />
Fig. 5. SW-IR radiation thermometer construction.<br />
Collimating<br />
lens<br />
Lyot<br />
stop<br />
Photodiode<br />
temperatures <strong>and</strong> higher was used as the source <strong>of</strong> radiation. A 6 mm diameter target was<br />
imaged by the radiation thermometer at a distance <strong>of</strong> 50 cm between the source aperture<br />
<strong>and</strong> the front <strong>of</strong> the objective lens. The radiation was imaged onto a field stop with a<br />
chopper wheel placed close to the field stop. The radiation was collimated <strong>and</strong> focused<br />
onto a 1 mm diameter detector with achromats. The detector was underfilled by the<br />
image. The extended-InGaAs detector was cooled to –85 °C with TE cooling. The<br />
detector was attached to a short-circuit photocurrent meter built with a low-noise<br />
operational amplifier. The Lyot stop [7] serves as the aperture stop behind the field stop.
Due to the low-scatter objective <strong>and</strong> the Lyot stop, the thermometer has excellent out-<strong>of</strong>field<br />
rejection that enables internal chopping.<br />
8. NEP AND NETD MEASUREMENT RESULTS<br />
The output total noise voltage was measured versus signal-gain selections for a 3 mm<br />
(3 MΩ shunt resistance) extended-InGaAs photodiode current-meter. The temperature <strong>of</strong><br />
the detector was controlled to -85 °C using a 4-stage TE cooler. The noise equivalent<br />
current (NEC) is equal to the measured total noise voltage divided by the current-tovoltage<br />
gain (the value <strong>of</strong> the feedback resistor). The total noise voltage was measured by<br />
a lock-in amplifier attached to the output <strong>of</strong> the photocurrent meter. The chopping<br />
frequency was 7.5 Hz <strong>and</strong> the integrating time constant <strong>of</strong> the lock-in amplifier was 1 s.<br />
The signal source was a 314 °C blackbody located about 50 cm from the radiometer. The<br />
NEP was calculated as the ratio <strong>of</strong> the NEC to the detector (peak) power responsivity <strong>of</strong><br />
1.2 A/W (at 2 μm). The NEC <strong>and</strong> NEP results are shown on the two Y-axes <strong>of</strong> Fig. 6.<br />
100<br />
10<br />
10 6<br />
10 7<br />
10 8<br />
Feedback resistor, Ω<br />
Fig. 6. NEP (right-Y) <strong>and</strong> NEC (left-Y) <strong>of</strong> a 3 MΩ shunt resistance E-IGA photodiode<br />
current meter at a lock-in amplifier integrating time constant <strong>of</strong> 1 s.<br />
The measured data points are connected with straight lines for better illustration. The<br />
graph shows that a NEP=15 fW was obtained with the 1 s integration time constant. The<br />
NEP <strong>of</strong> this SWIR detector is more than six orders <strong>of</strong> magnitude lower than the 50-100<br />
nW·Hz -1/2 NEP <strong>of</strong> pyroelectric detectors. The 15 fW (obtained with 1 s time constant)<br />
NEP (<strong>and</strong> the related output signal-to-noise ratio) could not be improved at the 10 8 V·A -1<br />
<strong>and</strong> 10 9 V·A -1 signal-gains relative to the 10 7 V·A -1 selection where the shunt resistance is<br />
roughly equal to the feedback resistance. At gain selections <strong>of</strong> 10 7 V·A -1 <strong>and</strong> higher, the<br />
constant 3 MΩ shunt resistance dominates the resistor noise. The 10 8 V·A -1 <strong>and</strong> higher<br />
signal gains should be utilized only with higher than 3 MΩ shunt resistance detectors<br />
10 9<br />
70<br />
60<br />
50<br />
40<br />
30<br />
20<br />
10<br />
9<br />
8
ecause the loop gain decreases <strong>and</strong> there is no further signal-to-noise advantage. Higher<br />
shunt resistances <strong>of</strong> 10 MΩ - 15 MΩ were measured for 1 mm diameter E-IGA <strong>and</strong> SW-<br />
MCT detectors. In these cases, the NEP can be further decreased.<br />
At a blackbody temperature <strong>of</strong> 50 °C, a NETD <strong>of</strong> < 3 mK was obtained from the<br />
st<strong>and</strong>ard deviation <strong>of</strong> the temperature measurements taken with an electrical b<strong>and</strong>width<br />
<strong>of</strong> 0.16 Hz.<br />
The NETD plotted as a function <strong>of</strong> the blackbody temperature is shown in Fig. 7.<br />
The NETD increases rapidly as the target temperature becomes comparable to the<br />
chopper-wheel temperature, but at the human body temperature <strong>of</strong> 36 °C, the NETD is ~<br />
10 mK. These results demonstrate that the NETD is comparable to that <strong>of</strong> InSb detectors<br />
for blackbody temperatures > 25 °C without the need for cryogenic cooling.<br />
NETD, mK<br />
100<br />
80<br />
60<br />
40<br />
20<br />
0<br />
20 25 30 35 40 45 50<br />
Blackbody Temperature, o C<br />
Fig. 7. NETD <strong>of</strong> the experimental radiation thermometer versus target temperature.<br />
9. CONCLUSIONS<br />
Thermoelectrically-cooled SW-IR detectors attached to noise-optimized photocurrent<br />
meters can be incorporated into radiation thermometers utilizing traditional achromats to<br />
measure objects at human-body temperatures. The SW-IR thermometers operate in the<br />
2 μm to 2.5 μm atmospheric window where the target signal is lower than in the mid-IR.<br />
However, the target-signal to background-signal ratio is orders <strong>of</strong> magnitude higher than<br />
in the mid-IR or long-IR ranges. The NEP <strong>of</strong> the SW-IR thermometers is more than six<br />
orders <strong>of</strong> magnitude lower than that <strong>of</strong> pyroelectric thermometers. An optically- <strong>and</strong><br />
electronically-optimized SW-IR radiation thermometer was designed, built, <strong>and</strong> tested.<br />
Regular glass input optics are used <strong>and</strong> the incident radiation is chopped. The achieved<br />
NEP was 15 fW (with 1 s integrating time constant) <strong>and</strong> the NETD increased from 3 mK<br />
at 50 °C to 10 mK at 36 °C. While st<strong>and</strong>ards-quality radiation thermometers with high<br />
sensitivity are not presently available, the described SW-IR thermometer can measure<br />
ambient temperature sources, such as water-bath or tin-point blackbodies, with very low
uncertainties. With this suggested radiation thermometer st<strong>and</strong>ard, the temperature <strong>of</strong> the<br />
human body can be measured with a NETD <strong>of</strong> 10 mK, which is about an order <strong>of</strong><br />
magnitude improvement over existing ear-thermometers. These results indicate that<br />
transfer st<strong>and</strong>ard radiation thermometers for measurements <strong>of</strong> human-body temperatures<br />
can be constructed without utilizing cryogenic or thermal detectors.<br />
REFERENCES<br />
1. I. Pusnik, E.van der Ham, J. Drovsek, Physiol. Meas. 25, 699 (2004)<br />
2. G.P. Eppeldauer, A.L. Migdall, L.M. Hanssen, Metrologia 35, 485 (1998)<br />
3. G.P. Eppeldauer, Optical radiation measurement with selected detectors <strong>and</strong><br />
matched electronic circuits between 200 nm <strong>and</strong> 20 μm. <strong>NIST</strong> <strong>Technical</strong> <strong>Note</strong>,<br />
2001, 1438 (U.S. Government Printing Office).<br />
4. G.P. Eppeldauer, J. Res. <strong>NIST</strong>, 103, 153 (1998)<br />
5. A. Rogalski, K. Chrzanowski, Opto-Electronics Review 10, 111 (2002)<br />
6. H.W. Yoon, M.C. Dopkiss, G.P. Eppeldauer, Performance comparisons <strong>of</strong><br />
InGaAs, extended InGaAs <strong>and</strong> short-wave HgCdTe detectors between 1 <strong>and</strong> 2.5<br />
micrometers. SPIE Proceedings, 2006. 6297: p. 629703-1 to 629703-10.<br />
7. H.W. Yoon, D.W. Allen, R.D. Saunders, Metrologia 42, 89 (2005)
Downloaded By: [Ingenta Content Distribution T<strong>and</strong>F titles] At: 01:37 25 December 2008<br />
int. j. remote sensing, 2003, vol. 24, no. 2, 339–356<br />
System-level calibration <strong>of</strong> a transfer radiometer used to validate EOS<br />
radiance scales<br />
B. C. JOHNSON*, S. W. BROWN, G. P. EPPELDAUER <strong>and</strong><br />
K. R. LYKKE<br />
<strong>National</strong> <strong>Institute</strong> <strong>of</strong> <strong>St<strong>and</strong>ards</strong> <strong>and</strong> Technology, Optical Technology Division,<br />
Gaithersburg, MD 20899, USA<br />
Abstract. A number <strong>of</strong> transfer radiometers have been developed by the <strong>National</strong><br />
<strong>Institute</strong> <strong>of</strong> <strong>St<strong>and</strong>ards</strong> <strong>and</strong> Technology (<strong>NIST</strong>) with the support <strong>and</strong> funding <strong>of</strong><br />
the <strong>National</strong> Aeronautics <strong>and</strong> Space Administration’s (NASA’s) satellite sensor<br />
calibration programmes. The transfer radiometers travel to NASA satellite builder<br />
<strong>and</strong> calibration facilities <strong>and</strong> validate the radiance scale <strong>of</strong> calibration sources at<br />
those facilities. One <strong>of</strong> these instruments, the Earth Observing Systems (EOS)<br />
Visible Transfer Radiometer (VXR), was calibrated for spectral responsivity in<br />
different facilities at <strong>NIST</strong> using two types <strong>of</strong> integrating sphere sources (ISSs):<br />
an inc<strong>and</strong>escent lamp-illuminated ISS <strong>and</strong> a laser-illuminated ISS. The laserilluminated<br />
ISS results in reduced uncertainties <strong>and</strong> a greater dynamic range in<br />
radiance responsivity. We will discuss the calibration procedures using the two<br />
types <strong>of</strong> source, compare results <strong>of</strong> calibrations <strong>of</strong> two <strong>of</strong> the VXR filter channels<br />
in the two <strong>NIST</strong> facilities, <strong>and</strong> suggest additional irradiance <strong>and</strong> radiance responsivity<br />
calibrations that are now possible using the new laser-illuminated facility.<br />
1. Introduction<br />
The <strong>National</strong> <strong>Institute</strong> <strong>of</strong> <strong>St<strong>and</strong>ards</strong> <strong>and</strong> Technology (<strong>NIST</strong>) has undertaken a<br />
role to support the Earth Observing System (EOS) calibration programme <strong>of</strong> the<br />
<strong>National</strong> Aeronautics <strong>and</strong> Space Administration (NASA). The EOS programme is<br />
a major component <strong>of</strong> NASA’s Earth Sciences Enterprise, which is, in turn, a<br />
significant component <strong>of</strong> the US Global Change Research Program. The EOS<br />
programme utilizes space-based <strong>and</strong> ground-based measurement systems to provide<br />
the scientific basis for underst<strong>and</strong>ing global change. The unprecedented accuracies<br />
<strong>and</strong> long-term stability <strong>of</strong> the measurements required place new <strong>and</strong> stringent<br />
dem<strong>and</strong>s upon the metrology systems that underpin the effort. One <strong>of</strong> the requirements<br />
<strong>of</strong> the EOS calibration programme is to document the relationship between<br />
radiometric quantities as realized by <strong>NIST</strong> with those realized by EOS participants,<br />
who <strong>of</strong>ten use <strong>NIST</strong>-traceable radiometric st<strong>and</strong>ards (Butler <strong>and</strong> Barnes 1998).<br />
To accomplish this task, <strong>NIST</strong> has developed a number <strong>of</strong> portable artefacts for<br />
establishing the shortest possible measurement chains to the EOS community. These<br />
include transfer radiometers for the visible (Johnson et al. 1998), the short-wave<br />
*e-mail: cjohnson@nist. gov.<br />
Paper presented at the Conference on Characterization <strong>and</strong> Radiometric Calibration for<br />
Remote Sensing held at Utah State University, Logan, 9–11 November 1999.<br />
International Journal <strong>of</strong> Remote Sensing<br />
ISSN 0143-1161 print/ISSN 1366-5901 online © 2003 Taylor & Francis Ltd<br />
http://www.t<strong>and</strong>f.co.uk/journals<br />
DOI: 10.1080/01431160110113205
Downloaded By: [Ingenta Content Distribution T<strong>and</strong>F titles] At: 01:37 25 December 2008<br />
340<br />
B. C. Johnson et al.<br />
infrared (SWIR; Brown, et al. 1998), <strong>and</strong> the thermal infrared (Rice <strong>and</strong> Johnson<br />
1998, Rice et al. 2002) wavelength regions as well as a portable radiance source<br />
(Brown <strong>and</strong> Johnson 1999, 2002). The transfer artefacts travel to NASA instrument<br />
builder <strong>and</strong> calibration facilities to verify the radiance <strong>of</strong> sources used to calibrate<br />
the responsivity <strong>of</strong> air-<strong>and</strong> space-borne sensors. They therefore serve as a direct<br />
link from the instrument builder <strong>and</strong> NASA calibration facilities to the national<br />
radiometric scales maintained at <strong>NIST</strong>.<br />
This strategy has been successfully implemented at a number <strong>of</strong> facilities <strong>and</strong><br />
locations (Sakuma et al. 1996, Johnson et al. 1997, Butler et al. 1999). The comparisons<br />
in Japan in 1995 for the support <strong>of</strong> the Ocean Color <strong>and</strong> Temperature Scanner<br />
(OCTS) <strong>and</strong> the visible radiometer for the Advanced Spaceborne Thermal Emission<br />
<strong>and</strong> Reflection Radiometer (ASTER) are <strong>of</strong> particular interest because they related<br />
radiometric scales from two national metrological institutes. For these comparisons,<br />
the agreement between the results with the transfer radiometers <strong>and</strong> the values<br />
determined by the manufacturer (NEC Corporation) was within ±4% (Sakuma et al.<br />
1996, Johnson et al. 1997).<br />
A more involved approach was used with the Sea-viewing Wide Field-<strong>of</strong>-view<br />
Sensor (SeaWiFS) in 1997 (Johnson et al. 1999). In addition to the radiometric<br />
calibration performed by the instrument manufacturer, a pre-flight radiometric calibration<br />
was done at the spacecraft integrator’s facility using an integrating sphere<br />
source that was calibrated at <strong>NIST</strong> (Early <strong>and</strong> Johnson 1997). The radiance <strong>of</strong> this<br />
source at the time <strong>of</strong> the SeaWiFS pre-flight calibration was determined by using<br />
the SeaWiFS transfer radiometer (SXR) (Johnson et al. 1998) to relate the spectral<br />
radiance <strong>of</strong> the source from the <strong>NIST</strong> calibration (in April 1995) to the time <strong>of</strong> the<br />
SeaWiFS measurements (in spring 1997). Including sphere degradation effects, radiance<br />
non-uniformity <strong>and</strong> other sources <strong>of</strong> additional uncertainty, the SeaWiFS<br />
radiance responsivity was determined with st<strong>and</strong>ard uncertainties <strong>of</strong> 1.2–3.3%,<br />
depending on the instrument channel (Johnson et al. 1999).<br />
On-orbit solar <strong>and</strong> ocean colour measurements confirmed the SeaWiFS prelaunch<br />
calibration strategy. Solar-based transfer-to-orbit experiments agreed on-orbit<br />
with predicted ground-based values to within 2.5% (Barnes <strong>and</strong> McClain 1999).<br />
Similarly, vicarious calibrations <strong>of</strong> SeaWiFS using an ocean buoy near Hawaii under<br />
the auspices <strong>of</strong> the Marine Optical Buoy (MOBY) programme (Clark et al. 1997,<br />
Herring 1997) to measure the spectral radiance <strong>of</strong> the ocean has provided corrections<br />
<strong>of</strong> 3.2% or less to the laboratory-derived calibration coefficients (Barnes <strong>and</strong> McClain<br />
2000). The good agreement between the pre-launch calibration <strong>and</strong> on-orbit measurements<br />
is a consequence <strong>of</strong> the thorough calibration approach used by the SeaWiFS<br />
<strong>and</strong> the MOBY programmes, in particular the direct traceability to <strong>NIST</strong> established<br />
by the transfer radiometers for the satellite sensor calibration <strong>and</strong> during field<br />
calibrations <strong>of</strong> radiometers used at the MOBY site (Cromer <strong>and</strong> Johnson 1996).<br />
Owing to the increasing constraints in the uncertainties <strong>of</strong> on-orbit radiometric<br />
measurements by satellite sensors, it is desirable to calibrate the transfer radiometers<br />
with the lowest possible uncertainty. For example, the Moderate Resolution Imaging<br />
Spectroradiometer (MODIS) requires on-orbit radiometric uncertainties* <strong>of</strong> 5% or<br />
less in radiance <strong>and</strong> 2% or less in reflectance over the spectral range 412–2130 nm<br />
*The coverage probability is not stated explicity but corresponds to an estimated st<strong>and</strong>ard<br />
deviation.
Downloaded By: [Ingenta Content Distribution T<strong>and</strong>F titles] At: 01:37 25 December 2008<br />
Characterization <strong>and</strong> radiometric calibration 341<br />
(Guenther et al. 1996). For an on-orbit satellite sensor st<strong>and</strong>ard uncertainty in<br />
radiance responsivity <strong>of</strong> 5%, we would like to validate the calibration source radiance<br />
in the laboratory with st<strong>and</strong>ard uncertainties <strong>of</strong> 1–2%. Current uncertainties in the<br />
spectral responsivity <strong>of</strong> transfer radiometers in the visible <strong>and</strong> near-infrared (VNIR)<br />
approach those target levels (Butler et al. 2000), while they are between 2% <strong>and</strong> 4%<br />
in the SWIR (Yoon et al. 1998), so reduction in the uncertainties <strong>of</strong> the SWIR<br />
radiometers is important to achieve the laboratory calibration goals.<br />
To underst<strong>and</strong> better the origin <strong>of</strong> our calibration uncertainties, <strong>and</strong> in an attempt<br />
to reduce those uncertainties, we calibrated the EOS Visible Transfer Radiometer<br />
(VXR) using two approaches relying on very different types <strong>of</strong> integrating sphere<br />
sources (ISS): a typical inc<strong>and</strong>escent lamp-illuminated ISS <strong>and</strong> a laser-illuminated<br />
ISS. The lamp-illuminated source was calibrated for spectral radiance on the <strong>NIST</strong><br />
Facility for Automated Spectral Radiance Calibrations (FASCAL) (Walker et al.<br />
1987); the radiance scale in this facility is derived from a variable temperature black<br />
body that is traceable to a gold-point black body. This method was the only one<br />
available at <strong>NIST</strong> until recently.<br />
The new laser-illuminated ISS takes advantage <strong>of</strong> the recent technological<br />
advances in the development <strong>of</strong> laser sources. Sources are now available to cover<br />
the spectral range from the ultraviolet (below 0.2 mm) to the infrared (20 mm). We<br />
have taken advantage <strong>of</strong> these laser sources in a new facility termed the Spectral<br />
Irradiance <strong>and</strong> Radiance response Calibrations with a Uniform Source (SIRCUS)<br />
(Lykke et al. 1998, Brown et al. 2000, Eppeldauer et al. 2000). In this facility, the<br />
output from a variety <strong>of</strong> lasers is directed into an integrating sphere. The integrating<br />
sphere serves as a uniform, monochromatic, Lambertian source for both irradiance<br />
<strong>and</strong> radiance response calibrations. Calibrations in the SIRCUS facility are based<br />
on the direct substitution method using detectors whose responsivity is traceable to<br />
the <strong>NIST</strong> High Accuracy Cryogenic Radiometer (HACR) (Gentile et al. 1996a, b).<br />
A schematic diagram <strong>of</strong> the VXR is shown in figure 1. An objective lens forms<br />
an intermediate image at the field stop. Wedged mirrors reflect the field stop onto<br />
the six different filter channels. Each VXR channel consists <strong>of</strong> a narrow-b<strong>and</strong><br />
interference filter <strong>and</strong> a silicon photodiode; channel b<strong>and</strong>-moment wavelengths <strong>and</strong><br />
Figure 1. Schematic diagram <strong>of</strong> the VXR, with the critical components labelled. The side<br />
view <strong>of</strong> the optical system is shown using marginal <strong>and</strong> chief rays for a single channel.
Downloaded By: [Ingenta Content Distribution T<strong>and</strong>F titles] At: 01:37 25 December 2008<br />
342<br />
B. C. Johnson et al.<br />
full-width-square (FWS) b<strong>and</strong>widths are given in table 1. (The b<strong>and</strong>-moment wavelengths<br />
are a weighted average using the relative spectral responsivity <strong>of</strong> the channel<br />
for the weight.) The interference filters, photodiodes, <strong>and</strong> the precision aperture that<br />
functions as the field stop are all mounted on a temperature-controlled plate. During<br />
operation, they are maintained at 26° C. A relay lens images the field stop onto an<br />
eyepiece used to align the VXR to its target.<br />
We will describe the calibration strategies using two ISSs <strong>and</strong> compare calibrations<br />
<strong>of</strong> two VXR filter channels using the different approaches. We will then<br />
discuss future applications <strong>of</strong> the laser-illuminated ISS.<br />
2. Calibration using a lamp-illuminated ISS<br />
The measurement <strong>of</strong> a broadb<strong>and</strong> source for one channel <strong>of</strong> the VXR is described<br />
by a simplified measurement equation:<br />
S=AVG ∆ t(l)R (l)L (l)dl (1)<br />
f l<br />
where S is the output signal (V), the product AV is the throughput (m2 sr), G is the<br />
(fixed) gain <strong>of</strong> the transimpedance pre-amplifier (V A−1), t(l) is the spectral transmittance<br />
<strong>of</strong> the optical system (dimensionless), R (l) is the spectral flux (subscript f<br />
f<br />
for flux) responsivity <strong>of</strong> the silicon photodiode (A W−1), L (l) is the spectral radiance<br />
l<br />
<strong>of</strong> the ISS (W m−2 sr−1 nm−1), <strong>and</strong> l is the wavelength (nm). The variables AV, G,<br />
t(l), <strong>and</strong> R (l) depend on the VXR channel under consideration. The output S is<br />
f<br />
then the integrated response for the channel.<br />
Let the function f (l)=t(l)R (l) represent the spectral portion <strong>of</strong> the VXR<br />
f<br />
response. Also define the relative spectral responsivity r(l, l )= f (l)/ f (l ), where the<br />
j j<br />
reference wavelength l is arbitrary but usually near the value that results in the<br />
j<br />
maximum value <strong>of</strong> f (l). The equation (1) can be written as<br />
S=(AVGf(l ) ∆ r(l, l )dl)<br />
j j ∆ r(l, l j )L l (l)dl<br />
(2)<br />
∆ r(l, l )dl<br />
j<br />
The factor inside the parentheses on the right-h<strong>and</strong> side <strong>of</strong> equation (2) is the<br />
radiance responsivity (or calibration coefficient) for one channel in the VXR, <strong>and</strong> it<br />
is independent <strong>of</strong> the choice <strong>of</strong> the normalization wavelength l j . The ratio <strong>of</strong> the<br />
integrals is also independent <strong>of</strong> l j . Equation (2) <strong>and</strong> measurements <strong>of</strong> an ISS with<br />
known spectral radiance L l (l) are used to determine the calibration coefficient D b<br />
(V mW− cm2 sr nm). The subscript b st<strong>and</strong>s for broadb<strong>and</strong>.<br />
S<br />
D =<br />
b (∆ r(l)L (l)dl)/(∆ r(l)dl)−1<br />
l<br />
Table 1. Channel, b<strong>and</strong>-moment wavelength <strong>and</strong> full-width square b<strong>and</strong>pass <strong>of</strong> the VXR<br />
filter channels.<br />
Wavelength B<strong>and</strong>pass<br />
Channel (nm) (nm)<br />
1 411.77 10.76<br />
2 441.01 10.50<br />
3 548.40 10.21<br />
4 661.40 9.47<br />
5 775.47 11.11<br />
6 869.93 13.35<br />
(3)
Downloaded By: [Ingenta Content Distribution T<strong>and</strong>F titles] At: 01:37 25 December 2008<br />
Characterization <strong>and</strong> radiometric calibration 343<br />
Because the explicit dependence on the normalization wavelength is not necessary,<br />
r(l, l j ) is written as r(l). Equation (3) also applies when the VXR is used to assess<br />
the accuracy <strong>of</strong> sources calibrated independently by the EOS participants. The<br />
comparison is between the actual signals obtained with the VXR to those predicted<br />
using equation (3) <strong>and</strong> the independent determination <strong>of</strong> the spectral radiance.<br />
From equation (3), it is clear that three types <strong>of</strong> measurements are required to<br />
characterize <strong>and</strong> calibrate the VXR using the lamp-illuminated ISS: (1) determination<br />
<strong>of</strong> the spectral radiance L l (l) <strong>of</strong> the ISS; (2) determination <strong>of</strong> the relative spectral<br />
responsivity r(l) <strong>of</strong> the VXR channels; <strong>and</strong> (3) determination <strong>of</strong> the net VXR signal<br />
S corresponding to measurements <strong>of</strong> the ISS when it is operated to produce the<br />
same radiance as during its calibration. These three steps are illustrated in figure 2.<br />
In general, the ISS need only be calibrated at a single radiance level, but implementation<br />
<strong>of</strong> the basic scheme at multiple, independent levels provides a measure <strong>of</strong> the<br />
reproducibility <strong>of</strong> the procedure.<br />
2.1. ISS calibration on FASCAL<br />
The VXR has been calibrated using a number <strong>of</strong> lamp-illuminated ISSs, most<br />
recently the <strong>NIST</strong> Portable Radiance Source (NPR) source (Brown <strong>and</strong> Johnson<br />
1999, 2001). The VXR measured the source a total <strong>of</strong> 10 times at <strong>NIST</strong> from January<br />
1999 through September 1999. Monitor photodiodes mounted in the sphere were<br />
used to verify the stability <strong>of</strong> the ISS radiance over this time period (Brown <strong>and</strong><br />
Johnson 2002).<br />
Figure 2. Calibration <strong>and</strong> characterization <strong>of</strong> the VXR using the Vis/SCF, FASCAL <strong>and</strong> the<br />
NPR ISS. The propagation <strong>of</strong> the radiant flux is indicated by the direction <strong>of</strong> the lines<br />
with single arrows; lines with double arrows indicate linear translation for the purpose<br />
<strong>of</strong> source or detector substitution.
Downloaded By: [Ingenta Content Distribution T<strong>and</strong>F titles] At: 01:37 25 December 2008<br />
344<br />
B. C. Johnson et al.<br />
The NPR was calibrated for spectral radiance over the wavelength range<br />
300–900 nm on FASCAL in May 1999. The primary radiometric st<strong>and</strong>ard in<br />
FASCAL is a fixed-point black body at the freezing temperature <strong>of</strong> gold. The<br />
spectroradiometrically determined temperature (1337.3±0.1) K (k=1), is in agreement<br />
with the value defined on the International Temperature Scale <strong>of</strong> 1990 (Mielenz<br />
et al. 1990). The temperature <strong>of</strong> the gold-point black body is too low to produce<br />
any measurable flux below about 500 nm, so a higher temperature black body is<br />
used to calibrate the ISS. A number <strong>of</strong> steps are required to calibrate the higher<br />
temperature black body. First, a spectroradiometer, consisting <strong>of</strong> a prism-grating<br />
monochromator <strong>and</strong> a photomultiplier, is used to match the spectral radiance <strong>of</strong> the<br />
gold-point black body to that from a vacuum tungsten-strip lamp at 654.6 nm. Next,<br />
the tungsten-strip lamp is used to calibrate a higher temperature, commercial, vacuum<br />
tungsten-strip lamp so that its radiance corresponds to a black body at a temperature<br />
<strong>of</strong> about 1530 K. This lamp holds the scale, <strong>and</strong> is used to determine the temperature<br />
<strong>of</strong> a high emittance, variable temperature black body source, again at 654.6 nm.<br />
Once the temperature <strong>of</strong> the black body is known, its spectral radiance at any<br />
wavelength can be calculated using Planck’s equation.<br />
The spectroradiometer is used to transfer the radiance scale from the variable<br />
temperature black body to the ISS. The typical measurement interval for an ISS to<br />
be used with a VNIR instrument such as the VXR is 350–900 nm with a step size<br />
<strong>of</strong> 10 nm in the ultraviolet, 50 nm in the visible <strong>and</strong> 100 nm in the SWIR. The NPR<br />
spectral radiance <strong>and</strong> the FASCAL uncertainty <strong>of</strong> the spectral radiance calibration<br />
are shown in figure 3.<br />
2.2. Relative spectral responsivity measurements<br />
The relative spectral responsivity for the VXR was determined by adaptations <strong>of</strong><br />
the <strong>NIST</strong> Visible/Spectral Flux Comparator (Vis/SCF) (Larason et al. 1998) for<br />
Figure 3. The spectral radiance <strong>of</strong> the NPR ISS with four lamps in operation. The values<br />
<strong>and</strong> their relative st<strong>and</strong>ard uncertainties, which are identified in the legend, were<br />
determined using FASCAL.
Downloaded By: [Ingenta Content Distribution T<strong>and</strong>F titles] At: 01:37 25 December 2008<br />
Characterization <strong>and</strong> radiometric calibration 345<br />
operation in a relative mode. The Vis/SCF consists <strong>of</strong> a prism-grating monochromator<br />
illuminated by a lamp, a monitor detector, a shutter <strong>and</strong> a set <strong>of</strong> working<br />
st<strong>and</strong>ard detectors (silicon <strong>and</strong> germanium photodiodes). These detectors are calibrated<br />
using transfer st<strong>and</strong>ards (silicon photodiode trap detectors) that are calibrated<br />
against the HACR.<br />
The relative spectral responsivity <strong>of</strong> the VXR was determined using the same<br />
procedures as described for the SXR (Johnson et al. 1998). As with the SXR, the<br />
low flux levels meant that the instrumental b<strong>and</strong>width could not be smaller than<br />
about 1 nm, which is finite compared to the 10 nm b<strong>and</strong>width <strong>of</strong> the VXR channels.<br />
Because the output <strong>of</strong> the Vis/SCF did not fill the entrance pupil <strong>of</strong> the VXR, several<br />
steps were required. First, the VXR was aligned on the optical axis <strong>of</strong> the exit beam<br />
<strong>of</strong> the Vis/SCF <strong>and</strong> focused to image the intermediate image <strong>of</strong> the exit slit <strong>of</strong> the<br />
monochromator. Because the output <strong>of</strong> the monochromator is f/8 by f/16, this<br />
underfilled the VXR’s field <strong>of</strong> view. A translation stage could be positioned between<br />
the VXR <strong>and</strong> the monochromator such that the intermediate image <strong>of</strong> the exit slit<br />
coincided with the working st<strong>and</strong>ard detector. A b<strong>and</strong>width <strong>of</strong> 1 nm <strong>and</strong> a step size<br />
<strong>of</strong> 0.5 nm was used near the centre <strong>of</strong> each channel, <strong>and</strong> a b<strong>and</strong>width <strong>of</strong> 4 nm <strong>and</strong> a<br />
step size <strong>of</strong> 3–5 nm was used in the wings. The monitor detector was used to reduce<br />
the variability from source fluctuations.<br />
A second scan across the central portion <strong>of</strong> each channel was performed under<br />
conditions that filled the VXR field <strong>of</strong> view, but with poor measurement resolution<br />
due to the reduced flux. A diffuse reflectance st<strong>and</strong>ard was placed perpendicular to<br />
the optical axis at a distance that gave a spot size large enough to fill the VXR<br />
entrance window. The VXR was aligned to measure the radiance reflected from the<br />
diffuser. The field <strong>of</strong> view was then filled, resulting in a small wavelength shift<br />
compared to the on-axis measurements. The data acquired with the diffuser were<br />
used to correct the on-axis data for this small shift. The largest identifiable uncertainty<br />
components in the determination <strong>of</strong> the relative spectral responsivity result from the<br />
responsivity <strong>of</strong> the working st<strong>and</strong>ard <strong>and</strong> the effect <strong>of</strong> the 0.1 nm uncertainty in the<br />
Vis/SCF wavelength calibration. The magnitude <strong>of</strong> these effects depends on the<br />
wavelength (VXR channel). A likely, but difficult to quantify, additional component<br />
<strong>of</strong> uncertainty is that associated with the procedure itself, including the finite b<strong>and</strong>width<br />
<strong>of</strong> the source, corrections for the field <strong>of</strong> view effects, <strong>and</strong> matching the<br />
in- <strong>and</strong> out-<strong>of</strong>-b<strong>and</strong> scans.<br />
2.3. VXR calibration<br />
Given the FASCAL values for L l (l) <strong>of</strong> the ISS at one set <strong>of</strong> discrete wavelengths,<br />
<strong>and</strong> the function r(l) from the Vis/SCF data, the integrals in equation (1) were<br />
determined numerically using the alternative extended Simpson’s rule. The wavelength<br />
step corresponded to the r(l) data. A commercial cubic spline routine was<br />
used to determine the values <strong>of</strong> L l (l) at these wavelengths, with the input values<br />
just encompassing the r(l) dataset. For example, r(l) for channel 1 <strong>of</strong> the VXR was<br />
measured from 380–600 nm <strong>and</strong> the L l (l) values for one calibration <strong>of</strong> the ISS on<br />
FASCAL at 360, 380, 400, 450, 500, 550 <strong>and</strong> 600 nm were input to the cubic<br />
spline routine.<br />
The relative combined st<strong>and</strong>ard uncertainty <strong>of</strong> the individual determinations <strong>of</strong><br />
D b using the NPR <strong>and</strong> the relative responsivity measurements on the Vis/SCF are<br />
given in table 2 for VXR channels 1 <strong>and</strong> 5. The 0.1 nm uncertainty in the wavelength<br />
calibration <strong>of</strong> the monochromators for the r(l) <strong>and</strong> L l (l) measurements affects the
Downloaded By: [Ingenta Content Distribution T<strong>and</strong>F titles] At: 01:37 25 December 2008<br />
346<br />
B. C. Johnson et al.<br />
Table 2. Relative combined st<strong>and</strong>ard uncertainty <strong>of</strong> the individual determinations <strong>of</strong> D b using<br />
the NPR <strong>and</strong> relative responsivity measurements on the Vis/SCF.<br />
Channel 1 Channel 1 Channel 5 Channel 5<br />
type A type B type A type B<br />
Uncertainty origin (%) (%) (%) (%)<br />
EVects that are always present<br />
VXR alignment 0.10 0.10<br />
VXR linearity 0.10 0.10<br />
Vis/SCF, spectral flux scale* 0.11 0.09<br />
Vis/SCF, measurement uncertainty
Downloaded By: [Ingenta Content Distribution T<strong>and</strong>F titles] At: 01:37 25 December 2008<br />
Characterization <strong>and</strong> radiometric calibration 347<br />
an intensity stabilizer prior to entering the ISS. The intensity stabilizer reduces the<br />
relative st<strong>and</strong>ard deviation <strong>of</strong> the power in the laser beam to less than 0.05%, <strong>and</strong><br />
enables variable control over the power in the beam sent into the integrating sphere.<br />
We used a 20 cm diameter Spectralon@ (a product <strong>of</strong> Labsphere, Inc.*) integrating<br />
sphere with a 5.1 cm diameter exit port to calibrate the VXR. The source is <strong>of</strong><br />
sufficiently extended area that it overfills the VXR entrance pupil. Typical power<br />
levels <strong>of</strong> radiation introduced into the ISS range from a few milliwatts to a few<br />
hundred milliwatts, depending on the laser used, giving a source radiance varying<br />
from 2×10⁻⁵ Wmm−2 sr−1 to 1×10⁻⁷ Wmm−2 sr−1.<br />
3.1. Radiance responsivity calibrations on SIRCUS<br />
The measurement <strong>of</strong> an extremely narrow-b<strong>and</strong> source for one channel <strong>of</strong> the<br />
VXR is also given by equation (1). The laser-illuminated source is so narrow, with<br />
a b<strong>and</strong>width <strong>of</strong> about 2.5×10⁻⁵ nm, that the source spectral radiance is adequately<br />
described by a delta function <strong>and</strong> equation (1) becomes<br />
S(l)=AVGt(l)R f (l)L (l) (4)<br />
where L (l) is the radiance (W m−2 sr−1) <strong>of</strong> the laser-illuminated ISS at wavelength l.<br />
At each l, the radiance responsivity R(l) is determined:<br />
S(l)<br />
L(l) =AVGt(l)R (l)¬R(l) (5)<br />
f<br />
The responsivity for each VXR channel is found from integration over all wavelengths<br />
where the radiance responsivity is non-negligible:<br />
D d =∆R(l)dl (6)<br />
Here D d is the laser-illuminated calibration coefficient. For the EOS intercomparisons,<br />
an equation <strong>of</strong> the form <strong>of</strong> equation (3) is used, with D b replaced by D d <strong>and</strong><br />
r(l) replaced by R(l).<br />
From equation (5), it is clear that two types <strong>of</strong> measurements are required to<br />
characterize <strong>and</strong> calibrate the VXR using the laser-illuminated ISS: (1) determination<br />
<strong>of</strong> the radiance L (l) <strong>of</strong> the ISS; <strong>and</strong> (2) determination <strong>of</strong> the net VXR signal S<br />
corresponding to measurements <strong>of</strong> the laser-illuminated ISS at the same time L (l)<br />
is determined. In comparison to the lamp-illuminated determination <strong>of</strong> the VXR<br />
calibration coefficients, the SIRCUS method is more direct, with a shortened<br />
measurement chain to the HACR.<br />
The calibration strategy is shown in figure 4. Test sensors <strong>and</strong> a reference detector<br />
are located on a translation stage at a fixed (<strong>and</strong> measured) distance from the sphere<br />
exit port. The test sensors are calibrated against the reference detector using the<br />
substitution method. A monitor photodiode mounted in a small port on the side<br />
wall <strong>of</strong> the ISS corrects for small source intensity fluctuations during a calibration.<br />
A computer controls <strong>and</strong> monitors the laser power <strong>and</strong> wavelength over much <strong>of</strong><br />
the spectral range, controls the positions <strong>of</strong> the detectors <strong>and</strong> sources, <strong>and</strong> records<br />
test <strong>and</strong> reference detector signals.<br />
*Certain commercial equipment, instruments or materials are identified in this technical<br />
memor<strong>and</strong>um to foster underst<strong>and</strong>ing. Such identification does not imply recommendation<br />
or endorsement by <strong>NIST</strong>, nor does it imply that the materials or equipment used are necessarily<br />
the best available for the purpose.
Downloaded By: [Ingenta Content Distribution T<strong>and</strong>F titles] At: 01:37 25 December 2008<br />
348<br />
B. C. Johnson et al.<br />
Figure 4. Experimental system for the determination <strong>of</strong> the radiance responsivity <strong>of</strong> the VXR<br />
using SIRCUS. The propagation <strong>of</strong> the radiant flux is indicated by the direction <strong>of</strong><br />
the lines with single arrows; lines with double arrows indicate linear translation for<br />
the purpose <strong>of</strong> detector substitution. The vibrating mirror reduces the non-uniformities<br />
<strong>of</strong> the radiance in the exit port <strong>of</strong> the sphere that arise from speckle.<br />
We use a silicon trap detector equipped with a precision aperture as our reference<br />
detector for calibrations over the wavelength range 406–920 nm. An aperture <strong>of</strong><br />
known area is located at the sphere exit port for radiance calibrations using the trap<br />
detector as an irradiance st<strong>and</strong>ard. Before the trap detector measures the sphere<br />
radiance, its responsivity must be determined. The optical power responsivity <strong>of</strong> the<br />
trap detector is derived from measurements on HACR. HACR is an electrical<br />
substitution radiometer, relating optical power (flux) to the electrical watt. It serves<br />
as the primary US national st<strong>and</strong>ard for optical power measurements. The irradiance<br />
responsivity <strong>of</strong> the trap detector is the product <strong>of</strong> its power responsivity <strong>and</strong> the<br />
aperture area. The source radiance is calculated from the irradiance on the trap<br />
detector using the distance between the trap detector aperture <strong>and</strong> the source aperture<br />
<strong>and</strong> the area <strong>of</strong> the source aperture.<br />
During a calibration, a laser is tuned to the wavelength <strong>of</strong> interest. The trap<br />
detector is then placed in front <strong>of</strong> the sphere exit port, typically at a distance <strong>of</strong><br />
approximately 1 m, <strong>and</strong> measures the irradiance <strong>of</strong> the sphere. It is moved out <strong>of</strong><br />
the way, <strong>and</strong> replaced by the radiance detector under test. The test detector measures<br />
the radiance within the exit port <strong>and</strong> the radiance responsivity R(l) is calculated by<br />
dividing the test detector output signal by the sphere radiance (see equation (5)).
Downloaded By: [Ingenta Content Distribution T<strong>and</strong>F titles] At: 01:37 25 December 2008<br />
Characterization <strong>and</strong> radiometric calibration 349<br />
Any changes in the sphere radiance between the reference detector measurements<br />
<strong>and</strong> the test detector measurements are accounted for by referencing both signals to<br />
the output <strong>of</strong> the monitor photodiode. For a full spectral calibration, the wavelength<br />
is changed, <strong>and</strong> the calibration sequence repeated.<br />
3.2. Uncertainty budget for VXR radiance response calibration<br />
Each component in the calibration contributes to the overall uncertainty in<br />
radiance responsivity calibrations. Additional uncertainties arise from the repeatability<br />
<strong>and</strong> reproducibility <strong>of</strong> the measurements, <strong>and</strong> include thermal effects as well as<br />
any small detector ageing effects. Table 3 lists all known contributions to the uncertainty<br />
in radiance responsivity calibrations on SIRCUS. While the uncertainty in<br />
the transfer to test detector will vary slightly from detector to detector, the current<br />
combined st<strong>and</strong>ard uncertainty in radiance responsivity for a typical test detector<br />
is 0.25%.<br />
4. Calibration <strong>of</strong> the VXR<br />
In figure 5, the spectral responsivity determinations from the two techniques—<br />
using the Vis/SCF <strong>and</strong> SIRCUS—are shown for two channels <strong>of</strong> the VXR. The<br />
channel at 412 nm was selected because this value <strong>of</strong> D b is the most uncertain due<br />
to the wavelength-dependent components <strong>of</strong> uncertainty described previously<br />
(table 2). Also, experience with two other ISSs at <strong>NIST</strong> had revealed temporal drifts<br />
<strong>of</strong> the sphere radiance that resulted in larger than desired combined uncertainties.<br />
Hence SIRCUS could be expected to make the largest impact on the calibration <strong>of</strong><br />
the VXR at 412 nm. The channel at 775 nm was selected because the ISS-based<br />
uncertainties are lower <strong>and</strong> because application <strong>of</strong> VXR measurements for EOS<br />
programmes is <strong>of</strong>ten <strong>of</strong> interest for a broad wavelength interval.<br />
For comparison purposes, the data were normalized using the maximum values<br />
in each dataset (figure 5). The Vis/SCF data were acquired in November <strong>and</strong><br />
December 1996 <strong>and</strong> the SIRCUS measurements were performed in June 1999. At<br />
412 nm (shown in figure 5(a)), there is a wavelength shift <strong>of</strong> about 0.33 nm, with the<br />
Table 3. Relative combined st<strong>and</strong>ard uncertainty <strong>of</strong> radiance responsivity calibrations on<br />
SIRCUS.<br />
Type A Type B<br />
Uncertainty origin (%) (%)<br />
Source radiance<br />
Trap detector spectral power responsivity 0.15<br />
Trap detector aperture area* 0.01<br />
Source-to-trap detector distance (squared) 0.05<br />
Trap detector repeatability 0.04<br />
Source aperture area 0.05<br />
Amplifier gain 0.04<br />
T ransfer to test detector<br />
Source spatial radiance non-uniformity 0.1<br />
Test detector repeatability 0.05<br />
Test detector size-<strong>of</strong>-source effect 0.15<br />
Amplifier gain 0.04<br />
Relative combined st<strong>and</strong>ard uncertainty 0.25<br />
*Fowler et al. (1998).
Downloaded By: [Ingenta Content Distribution T<strong>and</strong>F titles] At: 01:37 25 December 2008<br />
350<br />
B. C. Johnson et al.<br />
Figure 5. Comparison <strong>of</strong> the spectral shapes <strong>of</strong> the relative responsivity determined on the<br />
Vis/SCF in 1996 <strong>and</strong> the normalized radiance responsivity determined using SIRCUS<br />
in 1999 for the (a) 412 nm <strong>and</strong> (b) 775 nm channel.<br />
SIRCUS results at the shorter wavelength. There are also small differences in the<br />
shape <strong>of</strong> the responsivity functions in the region 408–415 nm. The SIRCUS measurements<br />
were made only over the central portion <strong>of</strong> the response, but the normalized<br />
data can be compared from unity to about 10−4 <strong>of</strong> the maximum value. The effect<br />
<strong>of</strong> the missing out-<strong>of</strong>-b<strong>and</strong> response in the SIRCUS results can be estimated from<br />
the Vis/SCF data, where the integrated response from 450–600 nm is 0.05% <strong>of</strong> the<br />
total integrated response. We estimate the effect for measurements <strong>of</strong> a broadb<strong>and</strong><br />
source to be 0.1% or less.<br />
At 775 nm, there is a wavelength shift <strong>of</strong> about 0.35 nm, again with the SIRCUS<br />
results at the shorter wavelength. The Vis/SCF results are larger than those <strong>of</strong>
Downloaded By: [Ingenta Content Distribution T<strong>and</strong>F titles] At: 01:37 25 December 2008<br />
Characterization <strong>and</strong> radiometric calibration 351<br />
SIRCUS from 790–850 nm by about 50% on average, but the effect on the integrated<br />
response is only 0.05%. It is clear from the SIRCUS measurements beyond 850 nm<br />
that this laser-illuminated determination is able to achieve accurate values at 10−6<br />
<strong>of</strong> the peak. There was evidence in the Vis/SCF data for the SXR at 775 nm <strong>of</strong> a<br />
decrease in responsivity beyond 850 nm (Johnson et al. 1998), but with signal-tonoise<br />
ratios <strong>of</strong> less than unity, interpretation was difficult. Therefore SIRCUS is able<br />
to explore the lower limits <strong>of</strong> the instrument responsivity with much improved<br />
accuracy.<br />
The two methods <strong>of</strong> determining the calibration coefficient for the 412 nm <strong>and</strong><br />
the 775 nm channels <strong>of</strong> the VXR are compared in figure 6. The values <strong>of</strong> D for all<br />
b<br />
measurements <strong>of</strong> the NPR source from 13 January to 31 August 1999 are plotted<br />
for the two radiance levels <strong>of</strong> the NPR source that were determined on FASCAL.<br />
These levels correspond to all four lamps in operation, or only one lamp (designated<br />
lamp number 1) in operation. The FASCAL calibration for these settings was<br />
performed on 19–21 May 1999. As explained in §2, the b<strong>and</strong>-averaged radiance was<br />
determined using the 1996 Vis/SCF relative responsivity data, r(l).<br />
The calibration coefficients derived from the SIRCUS data are also shown<br />
in figure 6. At 412 nm, the average D b<br />
from the NPR measurements is<br />
0.041948 V cm2 sr nm mW−1, <strong>and</strong> the SIRCUS result is 0.041869 V cm2 sr nm mW−1,<br />
foradifference <strong>of</strong> 0.19%. At 775 nm, the average D b is 0.026303 V cm2 sr nm mW−1,<br />
the SIRCUS result is 0.026267 V cm2 sr nm mW−1, <strong>and</strong> the difference is 0.14%. This<br />
agreement is better than expected given the magnitude <strong>of</strong> the relative st<strong>and</strong>ard<br />
uncertainties in D b <strong>and</strong> may be fortuitous. Most uncertainty components in D b are<br />
systematic, <strong>and</strong> cannot be reduced by repeat measurements.<br />
The SIRCUS values for the absolute spectral radiance responsivity can be used<br />
in equation (3) to determine D b . This provides a more robust <strong>and</strong> reasonable<br />
comparison <strong>of</strong> the two methods because the VXR filters could have changed between<br />
the Vis/SCF measurements in 1996 <strong>and</strong> the SIRCUS measurements in 1999.<br />
Recalculation <strong>of</strong> D b at 412 nm gives 0.042161 V cm2 sr nm mW−1, which agrees with<br />
SIRCUS to within 0.7%. At 775 nm, D b changes by less than 0.1% because the<br />
spectral radiance <strong>of</strong> the NPR changes slowly with wavelength compared to its<br />
behaviour at 412 nm, so the calibration coefficient at 775 nm is less sensitive to the<br />
wavelength shift <strong>of</strong> R(l) with respect to r(l).<br />
5. Future applications using SIRCUS<br />
Higher radiance levels, lower wavelength uncertainty, negligible b<strong>and</strong>pass, <strong>and</strong><br />
no out-<strong>of</strong>-b<strong>and</strong> radiation all contribute to reducing the uncertainty in radiance <strong>and</strong><br />
irradiance responsivity calibrations on SIRCUS. Our current uncertainties in irradiance<br />
<strong>and</strong> radiance responsivity calibrations are 0.1% <strong>and</strong> 0.25%, respectively, over<br />
the spectral range 406 nm–920 nm. With minor improvements in the facility, we<br />
expect to be able to reduce our uncertainties for both irradiance <strong>and</strong> radiance<br />
responsivity calibrations to 0.05% or less (Anderson et al. 1992). SIRCUS could<br />
easily be adapted for optical flux linearity studies, <strong>and</strong> <strong>of</strong>fers an alternative to the<br />
<strong>NIST</strong> beamconjoiner. In addition, the uniformity <strong>of</strong> the exit aperture <strong>of</strong> the laserilluminated<br />
ISS has been exploited in the study <strong>of</strong> two-dimensional array detectors.<br />
Reduction <strong>of</strong> our uncertainties on SIRCUS will impact calibrations <strong>of</strong> the VXR<br />
while extension <strong>of</strong> the wavelength coverage using secondary working st<strong>and</strong>ards will<br />
enable calibration <strong>of</strong> other ultraviolet, visible <strong>and</strong> infrared transfer radiometers.<br />
SIRCUS may be used, for example, to calibrate the SWIR transfer radiometers
Downloaded By: [Ingenta Content Distribution T<strong>and</strong>F titles] At: 01:37 25 December 2008<br />
352<br />
Cal. Coeff. (V cm 2 sr nm µW _1 )<br />
Cal. Coeff. (V cm 2 sr nm µW _1 )<br />
B. C. Johnson et al.<br />
1 January 1 March 1 May 1 July 1 September<br />
1999 1999 1999 1999 1999<br />
Date<br />
1 January 1 March 1 May 1 July 1 September<br />
1999 1999 1999 1999 1999<br />
Date<br />
Figure 6. Comparison <strong>of</strong> the calibration coefficients determined using the NPR ISS <strong>and</strong><br />
SIRCUS for the (a) 412 nm <strong>and</strong> (b) 775 nm channel <strong>of</strong> the VXR. Two levels were used<br />
with the NPR <strong>and</strong> they are identified in the legend. The vertical lines illustrate<br />
representative relative st<strong>and</strong>ard uncertainties.<br />
developed by <strong>NIST</strong>, the University <strong>of</strong> Arizona <strong>and</strong> other institutions. The current<br />
variation in sphere radiance measurements in the SWIR is about 4%, which is<br />
comparable to the uncertainties in the calibration <strong>of</strong> the transfer radiometers. With<br />
SIRCUS, we expect to be able to calibrate radiometers out to 2.5 mm with relative<br />
st<strong>and</strong>ard uncertainties <strong>of</strong> 0.5% or less. Therefore, calibrating the SWIR transfer<br />
radiometers on SIRCUS should reduce the variance in radiance measurements<br />
with these instruments <strong>and</strong> provide a better estimate <strong>of</strong> the accuracy <strong>of</strong> the scale<br />
assignments made by the EOS participants.<br />
Further in the infrared, we anticipate calibrating the Thermal-infrared Transfer<br />
Radiometer (TXR) (Rice <strong>and</strong> Johnson 1998, Rice et al. 2002). The TXR is a vacuumcompatible,<br />
liquid nitrogen cooled filter radiometer with two 1 mm-wide filter
Downloaded By: [Ingenta Content Distribution T<strong>and</strong>F titles] At: 01:37 25 December 2008<br />
Characterization <strong>and</strong> radiometric calibration 353<br />
channels centred at 5 mm <strong>and</strong> 10 mm, respectively. The TXR is important to the<br />
remote sensing community in that it <strong>of</strong>fers a relatively simple <strong>and</strong> economical method<br />
<strong>of</strong> verifying the radiometric scales that are used for ground calibration <strong>of</strong> thermalinfrared<br />
channels <strong>of</strong> the many remote sensing instruments in use. As with the VXR,<br />
SIRCUS provides an accurate <strong>and</strong> direct method <strong>of</strong> calibrating the TXR spectrally<br />
against the <strong>NIST</strong> detector-based radiometric scale. The SIRCUS data will enable a<br />
comparison to the relative spectral responsivity determined using the ambient<br />
infrared spectral comparator (Migdall et al. 1994, Rice <strong>and</strong> Johnson 1998).<br />
Integration <strong>of</strong> the SIRCUS data over the TXR channel will provide a calibration<br />
coefficient that can be compared to the one derived using an ambient black body<br />
source (Rice <strong>and</strong> Johnson 1998, Rice et al. 2002). The SIRCUS facility will reduce<br />
the uncertainties associated with calibration <strong>of</strong> the TXR at <strong>NIST</strong> by enabling direct<br />
measurements <strong>of</strong> a number <strong>of</strong> effects that previously could only be estimated.<br />
In a separate application, SIRCUS is well suited to calibrate instruments used<br />
in a number <strong>of</strong> environmental monitoring <strong>and</strong> remote sensing applications. For<br />
example, a global network <strong>of</strong> sun photometers, the Aerosol Robotic Network<br />
(AERONET) has been established under the auspices <strong>of</strong> NASA’s EOS programme<br />
to provide globally distributed near-real-time observations <strong>of</strong> aerosol optical depths,<br />
aerosol size distributions <strong>and</strong> precipitable water in diverse aerosol regimes (Holben<br />
et al. 1998). The sun photometers are filter radiometers with a number <strong>of</strong> channels<br />
with b<strong>and</strong> centre wavelengths ranging from the visible to the near-infrared; the Cimel<br />
CE318-2 sun photometer has filters at 440, 670, 870, 936 <strong>and</strong> 1020 nm, for example.<br />
Reduction in uncertainties in the calibration <strong>of</strong> the sun photometers will aid the<br />
validity <strong>of</strong> data products that result from AERONET.<br />
Finally, SIRCUS is being used to improve the accuracy <strong>of</strong> <strong>NIST</strong>’s spectroradiometric,<br />
photometric <strong>and</strong> radiance temperature calibration services. The primary<br />
impact to the EOS community will be in the reduction <strong>of</strong> uncertainty in the spectral<br />
irradiance values assigned to 1000 W st<strong>and</strong>ard lamps. These st<strong>and</strong>ard lamps are<br />
currently calibrated from 250–2400 nm on FASCAL <strong>and</strong> used by the EOS community<br />
as irradiance st<strong>and</strong>ards for both irradiance <strong>and</strong> radiance calibrations (in combination<br />
with diffuse reflectance st<strong>and</strong>ards). To date, filter radiometers have been calibrated<br />
using the Vis/SCF <strong>and</strong> used to determine the radiance temperature <strong>of</strong> a hightemperature<br />
black body with an uncertainty <strong>of</strong> 0.5 K near 2900 K (Yoon <strong>and</strong> Gibson<br />
1999). The high-temperature black body will be used to directly determine the<br />
spectral irradiance <strong>of</strong> the st<strong>and</strong>ard irradiance lamps. The new method will result in<br />
a reduction <strong>of</strong> the uncertainty in the <strong>NIST</strong> irradiance scale by a factor <strong>of</strong> up to five,<br />
depending on wavelength. Because the principal source <strong>of</strong> uncertainty in the calibration<br />
<strong>of</strong> the filter radiometers is the spectral irradiance responsivity, the calibrations<br />
using SIRCUS results will reduce the uncertainties even further.<br />
6. Summary<br />
The VXR, a portable filter radiometer for radiance measurements with six narrowb<strong>and</strong><br />
channels, has been calibrated using two different methods, both involving<br />
measurements <strong>of</strong> integrating sphere sources. Measurements with the broadb<strong>and</strong>,<br />
lamp-illuminated ISS require ancillary measurements on the spectral responsivity,<br />
while the laser-illuminated calibration results in a direct determination <strong>of</strong> the spectral<br />
radiance responsivity. We present results for one lamp-illuminated ISS <strong>and</strong> one laserilluminated<br />
ISS for two channels <strong>of</strong> the VXR; the agreement is within the combined<br />
uncertainties. The laser-illuminated ISS method is more accurate.
Downloaded By: [Ingenta Content Distribution T<strong>and</strong>F titles] At: 01:37 25 December 2008<br />
354<br />
B. C. Johnson et al.<br />
The improved accuracy from SIRCUS is the result <strong>of</strong> many factors. First, systemlevel<br />
calibrations are more accurate than combinations <strong>of</strong> component level measurements,<br />
<strong>and</strong> the high flux levels <strong>and</strong> appropriate geometric properties <strong>of</strong> the source<br />
make the system-level determinations possible. Secondly, the advancements in tunable<br />
lasers allow for thorough studies in the spectral regions <strong>of</strong> interest. Thirdly, the<br />
availability <strong>of</strong> suitable transfer detectors ensures a short measurement chain to the<br />
fundamental measurements on HACR.<br />
The improvement in the calibration accuracy, especially for the spectral region<br />
below 500 nm <strong>and</strong> above 800 nm, will have a significant impact on the utility <strong>of</strong> the<br />
radiometric intercomparisons performed by NASA’s Goddard Space Flight Facility<br />
<strong>and</strong> <strong>NIST</strong> for EOS. First, SIRCUS will be used to characterize <strong>and</strong> calibrate the<br />
EOS/<strong>NIST</strong> transfer radiometers in the SWIR <strong>and</strong> thermal infrared; work with the<br />
VXR will also continue. Secondly, SIRCUS may be used with other important EOS<br />
radiometers. Thirdly, SIRCUS will be used to improve the accuracy <strong>of</strong> the <strong>NIST</strong><br />
spectroradiometric quantities, which will reduce the uncertainties in critical st<strong>and</strong>ards<br />
such as the 1000 W quartz-halogen irradiance lamps.<br />
Acknowledgments<br />
We would like to thank <strong>NIST</strong> colleagues M. V. Annageri, S. S. Bruce,<br />
C. E. Gibson, T. C. Larason <strong>and</strong> R. D. Saunders for assistance, <strong>and</strong> acknowledge<br />
support by NASA’s EOS Project Science Office under contract number S-41365-F<br />
<strong>and</strong> the US Air Force Metrology under contract numbers 97-421 <strong>and</strong> 98-439.<br />
References<br />
Anderson, V. E., Fox, N. P., <strong>and</strong> Nettleton, D. H., 1992, Highly stable, monochromatic<br />
<strong>and</strong> tunable optical radiation source <strong>and</strong> its application to high accuracy spectrophotometry.<br />
Applied Optics, 31, 536–545.<br />
Barnes, R. A., <strong>and</strong> McClain, C. R., 1999, The calibration <strong>of</strong> SeaWiFS after two years on<br />
orbit. Proceedings, International Society <strong>of</strong> Optical Engineering (SPIE), 3870, 214–227.<br />
Brown, S. W., <strong>and</strong> Johnson, B. C., 1999, A portable integrating sphere source for radiometric<br />
calibrations from the visible to the short-wave infrared. T he Earth Observer, 11(3),<br />
14–19.<br />
Brown, S. W., <strong>and</strong> Johnson, B. C., 2002, Development <strong>of</strong> a portable integrating sphere source<br />
for the Earth Observing System’s calibration validation programme. International<br />
Journal <strong>of</strong> Remote Sensing, 00, 00–00.<br />
Brown, S. W., Johnson, B. C., <strong>and</strong> Yoon, H. W., 1998, Description <strong>of</strong> a portable spectroradiometer<br />
to validate EOS radiance scales in the shortwave infrared. T he Earth Observer,<br />
10(3), 43–48.<br />
Brown, S. W., Eppeldauer, G. P., <strong>and</strong> Lykke, K. R., 2000, <strong>NIST</strong> facility for spectral irradiance<br />
<strong>and</strong> radiance responsivity calibrations with uniform sources. Metrologia, 37, 579–582.<br />
Butler, J. J., <strong>and</strong> Barnes, R. A., 1998, Calibration strategy for the Earth Observing System<br />
(EOS)-AM1 Platform. IEEE T ransactions on Geoscience <strong>and</strong> Remote Sensing, 36,<br />
1056–1061.<br />
Butler, J. J., Johnson, B. C., Brown, S. W., Yoon, H. W., Barnes, R. A., Markham, B.<br />
L., Biggar, S. F., Zalewski, E. F., Spyak, P. R., Cooper, J. W., <strong>and</strong> Sakuma, F.,<br />
1999, Radiometric measurement comparisons using transfer radiometers in support <strong>of</strong><br />
the calibration <strong>of</strong> NASA’s Earth Observing System (EOS) Sensors. Proceedings,<br />
International Society <strong>of</strong> Optical Engineering (SPIE), 3870, 180–192.<br />
Clark, D. K., Gordon, H. R., Voss, K. J., Ge, Y., Broenkow, W., <strong>and</strong> Trees, C., 1997,<br />
Validation <strong>of</strong> atmospheric correction over the oceans. Journal <strong>of</strong> Geophysical Research,<br />
102, 17 209–17 217.<br />
Cromer, C. L., <strong>and</strong> Johnson, B. C., 1996, Appendix B—report on the calibration <strong>of</strong> MOBY.<br />
In T he T hird SeaW iFS Intercalibration Round-Robin Experiment (SIRREX-3),
Downloaded By: [Ingenta Content Distribution T<strong>and</strong>F titles] At: 01:37 25 December 2008<br />
Characterization <strong>and</strong> radiometric calibration 355<br />
19-30 September 1994. NASA <strong>Technical</strong> Memor<strong>and</strong>um 104566, vol. 34 (NASA<br />
Goddard Space Flight Center: Greenbelt, MD), pp. 71–75.<br />
Early, E. A., <strong>and</strong> Johnson, B. C., 1997, Calibration <strong>and</strong> characterization <strong>of</strong> the GSFC sphere.<br />
In Case Studies for SeaW iFS Calibration <strong>and</strong> Validation, Part 4. NASA <strong>Technical</strong><br />
Memor<strong>and</strong>um 104566, vol. 41 (NASA Goddard Space Flight Center: Greenbelt,<br />
MD), pp. 3–17.<br />
Early, E. A., <strong>and</strong> Thompson, A., 1996, Irradiance <strong>of</strong> horizontal quartz-halogen st<strong>and</strong>ard<br />
lamps. Journal <strong>of</strong> Research <strong>of</strong> the <strong>National</strong> <strong>Institute</strong> <strong>of</strong> <strong>St<strong>and</strong>ards</strong> <strong>and</strong> T echnology,<br />
101, 141–153.<br />
Eppeldauer, G. P., Brown, S. W., Larason, T. C., Racz, M., <strong>and</strong> Lykke, K. R., 2000,<br />
Realization <strong>of</strong> a spectral radiance responsivity scale with a laser-illuminated source<br />
<strong>and</strong> Si radiance meters. Metrologia, 37, 531–534.<br />
Fowler, J. B., Durvasula, R. S., <strong>and</strong> Parr, A. C., 1998, High-accuracy aperture-area measurement<br />
facilities at the <strong>National</strong> <strong>Institute</strong> <strong>of</strong> <strong>St<strong>and</strong>ards</strong> <strong>and</strong> Technology. Metrologia,<br />
35, 497–500.<br />
Gentile, T. R., Houston, J. M., <strong>and</strong> Cromer, C. L., 1996a, Realization <strong>of</strong> a scale <strong>of</strong> absolute<br />
spectral response using the <strong>National</strong> <strong>Institute</strong> <strong>of</strong> <strong>St<strong>and</strong>ards</strong> <strong>and</strong> Technology highaccuracy<br />
cryogenic radiometer. Applied Optics, 35, 4392–4402.<br />
Gentile, T. R., Houston, J. M., Hardis, J. E., Cromer, C. L., <strong>and</strong> Parr, A. C., 1996b,<br />
<strong>National</strong> <strong>Institute</strong> <strong>of</strong> <strong>St<strong>and</strong>ards</strong> <strong>and</strong> Technology high accuracy cryogenic radiometer.<br />
Applied Optics, 35, 1056–1068.<br />
Guenther, B., Barnes, W., Knight, E., Barker, J., Harnden, J., Weber, R., Roberto, M.,<br />
Godden, G., Montgomery, H., <strong>and</strong> Abel, P., 1996, MODIS calibration: A brief review<br />
<strong>of</strong> the strategy for the at-launch calibration approach. Journal <strong>of</strong> Atmospheric <strong>and</strong><br />
Oceanic T echnology, 13, 274–285.<br />
Herring, D., 1997, Marine Optical Buoy (MOBY) evolves, while Marine Optical<br />
Characterization Experiment (MOCE) continues in support <strong>of</strong> SeaWiFS, MODIS,<br />
<strong>and</strong> OCTS. T he Earth Observer, 9(5), 15–20.<br />
Holben, B. N., Eck, T. F., Slutsker, ?.?.,Tanré, T. D., Bius, J. P., Setzer, A., Vermote, E.,<br />
Reagan, J. A., Kaufman, Y. J., Nakajima, T., Lavenu, F., Jankowiak, I., <strong>and</strong><br />
Smirnov, A., 1998, AERONET—A federated instrument network <strong>and</strong> data archive<br />
for aerosol characterization. Remote Sensing <strong>of</strong> Environment, 66, 1–16.<br />
Johnson, B. C., Sakuma, F., Butler, J. J., Biggar, S. F., Cooper, J. W., Hiramatsu, M.,<br />
<strong>and</strong> Suzuki, K., 1997, Radiometric measurement comparison using the Ocean Color<br />
Temperature Scanner (OCTS) visible <strong>and</strong> near infrared integrating sphere. Journal <strong>of</strong><br />
Research <strong>of</strong> the <strong>National</strong> <strong>Institute</strong> <strong>of</strong> <strong>St<strong>and</strong>ards</strong> <strong>and</strong> T echnology, 102, 627–646.<br />
Johnson, B. C., Fowler, J. B., <strong>and</strong> Cromer, C. L., 1998, The SeaWiFS transfer radiometer<br />
(SXR). NASA/TM-1998-206892, vol. 1, NASA Goddard Space Flight Center,<br />
Greenbelt, MD, USA.<br />
Johnson, B. C., Early, E. A., Eplee, R. E. Jr., Barnes, R. A., <strong>and</strong> Caffrey, R. T., 1999, The<br />
1997 prelaunch radiometric calibration <strong>of</strong> SeaWiFS. NASA/TM-1999-206892, vol. 4,<br />
NASA Goddard Space Flight Center, Greenbelt, MD, USA.<br />
Larason, T. C., Bruce, S. S., <strong>and</strong> Parr, A. C., 1998, Spectroradiometric detector measurements.<br />
Special Publication 250–41, <strong>National</strong> <strong>Institute</strong> <strong>of</strong> <strong>St<strong>and</strong>ards</strong> <strong>and</strong> Technology,<br />
Washington, DC, USA.<br />
Lykke, K. R., Shaw, P.-S., Hanssen, L. M., <strong>and</strong> Eppeldauer, G. P., 1998, Development <strong>of</strong><br />
a monochromatic, uniform source facility for calibration <strong>of</strong> radiance <strong>and</strong> irradiance<br />
detectors from 0.2 mm to18mm. Metrologia, 35, 479–484.<br />
Mielenz, K. D., Saunders, R. D. Jr., <strong>and</strong> Shumaker, J. B., 1990, Spectroradiometric<br />
determination <strong>of</strong> the freezing temperature <strong>of</strong> gold. Journal <strong>of</strong> Research <strong>of</strong> the <strong>National</strong><br />
<strong>Institute</strong> <strong>of</strong> <strong>St<strong>and</strong>ards</strong> <strong>and</strong> T echnology, 95, 49–67.<br />
Migdall, A. L., Eppeldauer, G. P., <strong>and</strong> Cromer, C. L., 1994, IR detector spectral responsivity<br />
calibration facility at <strong>NIST</strong>. Proceedings, International Society <strong>of</strong> Optical Engineering<br />
(SPIE), 2227, 46–53.<br />
Rice, J. P., <strong>and</strong> Johnson, B. C., 1998, The <strong>NIST</strong> EOS thermal-infrared transfer radiometer.<br />
Metrologia, 35, 505–509.<br />
Rice, J. P., Bender, S. C., Atkins, W. H., <strong>and</strong> Lovas, F. J., 2002, Deployment test <strong>of</strong> the<br />
<strong>NIST</strong> EOS Thermal-infrared Transfer Radiometer. International Journal <strong>of</strong> Remote<br />
Sensing, 00, 00–00.
Downloaded By: [Ingenta Content Distribution T<strong>and</strong>F titles] At: 01:37 25 December 2008<br />
356<br />
Characterization <strong>and</strong> radiometric calibration<br />
Sakuma, F., Johnson, B. C., Biggar, S. F., Butler, J. J., Cooper, J. W., Hiramatsu, M.,<br />
<strong>and</strong> Suzuki, K., 1996, EOS AM-1 preflight radiometric measurement comparison<br />
using the Advanced Spaceborne Thermal Emission <strong>and</strong> Reflection Radiometer<br />
(ASTER) visible/near-infrared integrating sphere. Proceedings, International Society <strong>of</strong><br />
Optical Engineering (SPIE), 2820, 184–196.<br />
Walker, J. H., <strong>and</strong> Thompson, A., 1994, Improved automated current control for st<strong>and</strong>ard<br />
lamps. Journal <strong>of</strong> Research <strong>of</strong> the <strong>National</strong> <strong>Institute</strong> <strong>of</strong> <strong>St<strong>and</strong>ards</strong> <strong>and</strong> T echnology,<br />
99, 255–261.<br />
Walker, J. H., Saunders, R. D., <strong>and</strong> Hattenburg, A. T., 1987, Spectral radiance calibrations.<br />
Special Publication SP 250-1, <strong>National</strong> Bureau <strong>of</strong> <strong>St<strong>and</strong>ards</strong>, Washington, DC, USA.<br />
Yoon, H. W., <strong>and</strong> Gibson, C. E., 1999, Determination <strong>of</strong> radiance temperatures using detectors<br />
calibrated for absolute spectral power response. In T EMPMEKO ’99, T he Seventh<br />
International Symposium on T emperature <strong>and</strong> T hermal Measurements, vol. 2 (Delft, The<br />
Netherl<strong>and</strong>s: IMEKO/NMi Van Swinden Laboratorium), pp. 737–742.<br />
Yoon, H. W., Johnson, B. C., Kelch, D., Biggar, S., <strong>and</strong> Spyak, P. R., 1998, A 400 nm to<br />
2500 nm absolute spectral radiance comparison using filter radiometers. Metrologia,<br />
35, 563–568.
Spectral Irradiance <strong>and</strong> Radiance responsivity Calibrations using<br />
Uniform Sources (SIRCUS) facility at <strong>NIST</strong><br />
Steven W. Brown, George P. Eppeldauer, Joseph P. Rice, Jun Zhang, Keith R. Lykke<br />
<strong>National</strong> <strong>Institute</strong> <strong>of</strong> <strong>St<strong>and</strong>ards</strong> <strong>and</strong> Technology<br />
Gaithersburg, MD 20899-8442<br />
ABSTRACT<br />
Detectors have historically been calibrated for spectral power responsivity at the <strong>National</strong> <strong>Institute</strong> <strong>of</strong> <strong>St<strong>and</strong>ards</strong> <strong>and</strong><br />
Technology (<strong>NIST</strong>) using a lamp-monochromator system to tune the wavelength <strong>of</strong> the excitation source. Silicon<br />
detectors can be calibrated in the visible spectral region with uncertainties at the 0.1 % level. However, uncertainties<br />
increase dramatically when measuring an instrument’s spectral irradiance or radiance responsivity. In addition, the<br />
uncertainties are even larger in the UV <strong>and</strong> IR ranges. We will discuss a new laser-based facility for Spectral<br />
Irradiance <strong>and</strong> Radiance responsivity Calibrations using Uniform Sources (SIRCUS) that was developed to calibrate<br />
instruments directly in irradiance or radiance mode with uncertainties approaching those available for spectral power<br />
responsivity calibrations. In this facility, high-power, tunable lasers are introduced into an integrating sphere using<br />
optical fibers, producing uniform, quasi-Lambertian, high radiant flux sources. Reference st<strong>and</strong>ard irradiance detectors,<br />
calibrated directly against national primary st<strong>and</strong>ards for spectral power responsivity, are used to determine the<br />
irradiance at a reference plane. Knowing the measurement geometry, the source radiance can be readily determined as<br />
well. The radiometric properties <strong>of</strong> the SIRCUS source coupled with state-<strong>of</strong>-the-art transfer st<strong>and</strong>ard radiometers<br />
whose responsivities are directly traceable to primary national radiometric scales, result in typical combined st<strong>and</strong>ard<br />
uncertainties in irradiance <strong>and</strong> radiance responsivity calibrations less than 0.1 % in the visible (larger in the UV <strong>and</strong> IR).<br />
Details <strong>of</strong> the facility are presented <strong>and</strong> examples <strong>of</strong> unique calibrations possible in the facility are given, including<br />
system-level responsivity calibrations in support <strong>of</strong> the <strong>National</strong> Aeronautics <strong>and</strong> Space Administration’s (NASA’s)<br />
remote sensing activities.<br />
Keywords: calibration, detectors, lasers, ocean color, remote sensing<br />
1. INTRODUCTION<br />
NASA's Earth Observing System (EOS) is an international, multi-instrument, multi-platform satellite remote sensing<br />
program designed to produce long time series data on global climate change. EOS constitutes the major component <strong>of</strong><br />
NASA's Mission to Planet Earth <strong>and</strong> data products from the EOS program will be used as a guide for the<br />
implementation <strong>of</strong> international environmental policies [1]. The utility <strong>of</strong> these remotely sensed data products in<br />
helping to establish <strong>and</strong> underst<strong>and</strong> driving mechanisms behind global environmental changes occurring on decadal<br />
time scales will depend on the accuracy <strong>of</strong> the calibration <strong>of</strong> the full ensemble <strong>of</strong> EOS instruments on the multiple<br />
platforms flown over the duration <strong>of</strong> the EOS mission. State-<strong>of</strong>-the-art sensor uncertainties are necessary to obtain the<br />
required uncertainty in relevant data products. Consequently, detailed sensor characterization <strong>and</strong> accurate radiometric<br />
calibration (both pre-launch <strong>and</strong> on-orbit) as well as long-term sensor degradation measurements are integral to the<br />
success <strong>of</strong> the EOS program. The EOS program <strong>of</strong>fice established a Calibration Validation (Cal/Val) program to<br />
validate radiometric uncertainties in instrument builder sources used to calibrate satellite sensors <strong>and</strong> to validate prelaunch<br />
<strong>and</strong> on-orbit sensor radiometric uncertainties [2].<br />
Primary national radiometric scales are maintained <strong>and</strong> disseminated by <strong>NIST</strong>. Artifacts, both sources <strong>and</strong> detectors,<br />
calibrated at <strong>NIST</strong> directly against primary <strong>and</strong> secondary st<strong>and</strong>ards will have the lowest possible uncertainties. To<br />
ensure traceability to primary national (<strong>and</strong> international) radiometric st<strong>and</strong>ards <strong>and</strong> to ensure radiometric measurements<br />
with the lowest achievable uncertainties, the EOS Cal/Val program <strong>of</strong>fice has enlisted <strong>NIST</strong>’s assistance in calibration<br />
validation activities to support EOS sensors. In this paper, we discuss a new laser-based calibration facility at <strong>NIST</strong> that<br />
helps support the EOS calibration validation program. Unprecedented accuracies in both radiance <strong>and</strong> irradiance<br />
responsivity calibrations are achievable in this facility for Spectral Irradiance <strong>and</strong> Radiance responsivity Calibrations<br />
Earth Observing Systems IX, edited by William L. Barnes, James J. Butler, Proc. <strong>of</strong> SPIE<br />
Vol. 5542 (SPIE, Bellingham, WA, 2004) · 0277-786X/04/$15 · doi: 10.1117/12.559577<br />
363
using Uniform Sources, dubbed SIRCUS. While the facility has been in operation for only a few years [3], it has<br />
supported a number <strong>of</strong> EOS programs. We first describe the facility <strong>and</strong> then go into detail on a few <strong>of</strong> the systems<br />
calibrated using SIRCUS that are related to EOS.<br />
2. SIRCUS FACILITY<br />
The SIRCUS facility has been described in detail recently [4], so we briefly discuss the facility here. SIRCUS is shown<br />
schematically in Figure 1. In the SIRCUS facility, high-power, tunable lasers are introduced into an integrating sphere<br />
producing uniform, quasi-Lambertian, high radiant flux sources. The laser is first directed through an intensity<br />
stabilizer that controls the relative optical power in the beam to within 0.01 % <strong>of</strong> the set point. A portion <strong>of</strong> the laser<br />
beam is sent into a wavemeter that measures the wavelength <strong>of</strong> the radiation to within 0.001 nm. A beamsplitter sends<br />
another portion <strong>of</strong> the laser beam into a Fabry-Perot interferometer to measure the b<strong>and</strong>width <strong>and</strong> mode stability <strong>of</strong> the<br />
laser. Finally, the laser radiation is introduced into an integrating sphere, <strong>of</strong>ten using an optical fiber [5]. Occasionally,<br />
a collimator coupled to the sphere is used as a calibration source. Speckle in the image from the source, originating<br />
from the coherent nature <strong>of</strong> the laser radiation, is effectively removed by either rastering the beam inside the sphere with<br />
a galvanometer-driven mirror or by placing a short length <strong>of</strong> optical fiber in an ultrasonic bath.<br />
Reference st<strong>and</strong>ard irradiance detectors, calibrated directly against national primary st<strong>and</strong>ards for spectral power<br />
responsivity [6] <strong>and</strong> equipped with a precision aperture measured on the <strong>NIST</strong> Aperture Area facility [7], are used to<br />
determine the irradiance at a reference plane. The source radiance can be readily determined from the measurement<br />
geometry as well. A monitor photodiode is located on the sphere to correct for any radiant flux changes in the sphere<br />
output between measurements with the reference instrument <strong>and</strong> the device under test. The sources are located inside a<br />
light-tight box. Two baffles are typically installed between the source <strong>and</strong> the detectors to minimize effects <strong>of</strong> stray<br />
radiation on the measurement. Instruments are calibrated<br />
364 Proc. <strong>of</strong> SPIE Vol. 5542<br />
Digital Voltmeter<br />
Computer<br />
St<strong>and</strong>ard<br />
detector<br />
Linear<br />
Encoder<br />
Monitor Detector<br />
Tunable Laser Stabilizer<br />
Wavemeter<br />
Exit port<br />
Device<br />
under test<br />
Integrating sphere<br />
Figure 1: Schematic <strong>of</strong> SIRCUS facility.<br />
Baffles<br />
Optical fiber<br />
Ultrasonic bath<br />
Lens
directly in irradiance or radiance mode with exp<strong>and</strong>ed uncertainties (k=2) <strong>of</strong> 0.15 %, approaching or exceeding those<br />
achievable for spectral power responsivity calibrations.<br />
There are two separate SIRCUS facilities; the UV/Vis/NIR SIRCUS <strong>and</strong> the IR SIRCUS. The UV/Vis/NIR SIRCUS<br />
covers the range from 200 nm to 1.6 um while the IR SIRCUS facility covers the spectral region from 780 nm to 5 um.<br />
There is some overlap between the two facilities for scale intercomparisons. The two facilities are very similar; the main<br />
distinction is in the laser source used to illuminate the integrating spheres <strong>and</strong> the reference transfer st<strong>and</strong>ards used to<br />
determine the irradiance at a reference plane.<br />
2.1 Sources<br />
A number <strong>of</strong> different lasers are used to cover the spectral range from about 210 nm to 5000 nm. Continuous tunability<br />
in the UV/visible/NIR is provided by dye lasers <strong>and</strong> Ti:Sapphire lasers that are pumped by either an Argon ion laser<br />
(25 W all lines visible, 7 W all lines UV) or a frequency-doubled Nd:Vanadate laser (10 W at 532 nm). A number <strong>of</strong><br />
discrete wavelengths are provided by the pump lasers themselves.<br />
Figure 2: Output powers versus wavelengths for SIRCUS sources.<br />
Continuous tunability in the NIR/IR is provided by optical parametric oscillators (OPO’s) pumped by solid state lasers<br />
(typically, Nd:YAG, Nd:Vanadate, frequency-doubled Nd:Vanadate). These systems are briefly discussed below <strong>and</strong><br />
illustrated in Figure 2 [8].<br />
Dye lasers at SIRCUS cover the spectral region from 415 nm to 700 nm (E in the figure); dyes used include Stilbene 3<br />
(415 nm-475 nm), Coumarin 480 (470 nm-520 nm), Coumarin 521 (505 nm-565 nm, [9]), Rhodamine 6G (550 nm-<br />
620 nm), <strong>and</strong> DCM (610 nm-700 nm). A separate laser is used for each dye so that the full tuning range can be rapidly<br />
covered <strong>and</strong> no dye change or optical reconfiguration is required. Ti:Sapphire lasers cover the spectral range from<br />
680 nm to 1050 nm (F in Figure 2) [10]. Frequency doubling <strong>of</strong> Ti:Sapphire lasers enables tuning from 350 nm to 500<br />
nm (D in figure). Two different types <strong>of</strong> frequency doubling are available: The first approach uses an external power<br />
Proc. <strong>of</strong> SPIE Vol. 5542 365
uild-up cavity that requires a frequency-stabilized, single-mode laser to pump it. The second is a <strong>NIST</strong>-built<br />
intracavity-doubled Ti:sapphire laser that requires no frequency stabilization. Over 300 mW <strong>of</strong> optical power is<br />
available from the dye lasers <strong>and</strong> the Ti:Sapphire laser (with optical powers <strong>of</strong> 1 W or greater over much <strong>of</strong> the spectral<br />
range). The power available from the cw, frequency-doubled radiation is typically in the range from 100 mW to 200<br />
mW. Computer-controlled actuators rotate the angle <strong>of</strong> the birefringent tuner in the dye <strong>and</strong> Ti:sapphire lasers for<br />
automated wavelength tuning.<br />
The IR systems developed at <strong>NIST</strong> include a cw periodically poled Lithium Niobate (PPLN) OPO pumped by a<br />
Nd:YAG laser, a mode-locked (220 MHz, 7 ps) PPLN OPO pumped by a Nd:Vanadate laser, <strong>and</strong> a mode-locked LBO<br />
OPO pumped by the 2 nd harmonic <strong>of</strong> the Nd:Vanadate laser. The first two systems tune from approximately1.4 �m to<br />
5 �m (H <strong>and</strong> J), while the LBO OPO tunes from approximately 700 nm to 2000 nm (not shown in the figure). The<br />
power level is in the 100 mW to 1 W range.<br />
Mode-locked systems have been shown in the past to work for radiometric situations [11]. A commercial mode-locked<br />
system that should allow continuous tunability from about 200 nm to 3 �m (part <strong>of</strong> the range is shown as G <strong>and</strong> F) was<br />
recently installed in the facility. One useful feature we hope to exploit is that the b<strong>and</strong>width <strong>of</strong> these mode-locked<br />
systems is considerable broader than the cw systems discussed above. This may help to alleviate some <strong>of</strong> the problems<br />
associated with interference fringes (see below). These mode-locked systems are easy to frequency triple (B in figure)<br />
<strong>and</strong> quadruple (A in figure).<br />
Different integrating spheres are used, depending on the radiometric calibration <strong>and</strong> the wavelength <strong>of</strong> calibration.<br />
Small diameter integrating spheres – typically diameters <strong>of</strong> 2 cm to 5 cm – equipped with precision apertures with<br />
diameters ranging from 3 mm to 8 mm are typically used for irradiance responsivity calibrations. Larger diameter<br />
spheres – 30 cm diameter – with 5 cm to 10 cm diameter exit ports are used for radiance measurements. The spheres<br />
are made <strong>of</strong> either sintered polytetrafluoroethylene-based coating (Spectralon TM ,Labsphere, Inc.) that has high diffuse<br />
reflectance from about 250 nm to 2.5 �m or infragold for calibrations from 1 �m to 20 �m. Typical irradiance levels at<br />
1 m using 2.54 cm diameter integrating sphere with a 5 mm diameter aperture range from approximately 1 �W/cm 2 to<br />
10 �W/cm 2 . The irradiance levels can be continuously decreased using the laser intensity stabilizer to check for<br />
linearity. The irradiance can be increased by moving closer to the sphere (falls <strong>of</strong>f as 1/r 2 ) or by collimating the output<br />
<strong>of</strong> the sphere using either an <strong>of</strong>f-axis parabolic mirror or a lens. Figure 2 shows typical irradiances for different<br />
wavelengths. Radiance levels between 1 mW/cm � /sr <strong>and</strong> 5 mW/cm � /sr are st<strong>and</strong>ard for a 30 cm diameter sphere with a<br />
7.5 cm diameter output port. <strong>Note</strong> that the exit apertures are normally calibrated at the <strong>NIST</strong> facility for aperture area<br />
measurement [7]. A monitor detector is mounted on the sphere wall to monitor <strong>and</strong> correct for fluctuations in the source<br />
radiant flux during a calibration.<br />
2.2 Detectors<br />
The uncertainty in the spectral irradiance responsivity <strong>of</strong> reference st<strong>and</strong>ard detectors is the largest component in the<br />
calibration uncertainty budget on SIRCUS. Ultimately, the quality <strong>and</strong> characteristics <strong>of</strong> the reference st<strong>and</strong>ard<br />
detectors determine the uncertainty achievable on SIRCUS. Silicon tunnel-trap detectors, configured to operate in both<br />
radiant power <strong>and</strong> irradiance measurement modes, are the highest-level transfer st<strong>and</strong>ards used in the UV/Vis/NIR<br />
SIRCUS facility. They cover the spectral range from 350 nm to 1050 nm. Nitrided Si reflection traps have been<br />
developed to cover the 200 nm to 400 nm spectral range. These detectors are calibrated against a cryogenic radiometer<br />
[12]. InGaAs detectors, calibrated against an electrical substitution Si bolometer (ESB) [13], cover the range from 1 �m<br />
to 2.5 �m while InSb detectors cover the 2 �m to 5 �m range. HgCdTe detectors are being developed to cover the<br />
spectral range from 3 �m to 20 �m.<br />
2.3 Calibration method<br />
The entire data collection sequence is automated. Initially, an electronic shutter that blocks the laser radiation before it<br />
enters the optical fiber is closed <strong>and</strong> a background signal is acquired for both the reference st<strong>and</strong>ard trap detector <strong>and</strong><br />
the sphere monitor. Then the shutter opens <strong>and</strong> the signals from the trap <strong>and</strong> the monitor on the sphere are recorded.<br />
366 Proc. <strong>of</strong> SPIE Vol. 5542
The signals are initially amplified using a current to voltage amplifier <strong>and</strong> then fed into a digital voltmeter set to average<br />
over some number <strong>of</strong> power line cycles (the signal is averaged for a few seconds at most). Typically 3 'shutter closed'<br />
signals <strong>and</strong> 9 'shutter open' signals are averaged. The mean reference-to-monitor ratio <strong>and</strong> the st<strong>and</strong>ard deviation <strong>of</strong> the<br />
ratio are recorded. After this, the stage moves to the Device Under Test (DUT) position, <strong>and</strong> the data acquisition<br />
sequence is repeated. This gives the DUT mean signal-to-monitor ratio <strong>and</strong> the st<strong>and</strong>ard deviation <strong>of</strong> the ratio. The<br />
st<strong>and</strong>ard deviations <strong>of</strong> the ratios are monitored; trap detector measurement st<strong>and</strong>ard deviations larger than 0.01 % are an<br />
indication <strong>of</strong> laser power instabilities.<br />
Under routine calibration conditions, the intensity-stabilized laser wavelength is read by the wavemeter <strong>and</strong> transferred<br />
to the computer during each measurement. Along with mean ratios, the mean <strong>and</strong> st<strong>and</strong>ard deviation <strong>of</strong> the wavelength<br />
are recorded. This enables ready identification <strong>of</strong> laser wavelength instabilities during a scan. Occasionally, for faster<br />
data acquisition, the wavelength is only recorded at the beginning <strong>of</strong> the acquisition sequence. Following the data<br />
acquisition sequence, the wavelength is changed <strong>and</strong> the sequence is repeated.<br />
3. EXAMPLES OF SYSTEM-LEVEL CALIBRATIONS<br />
In the following, we present a few examples <strong>of</strong> SIRCUS calibrations that relate to the EOS or space-based radiometers.<br />
One <strong>of</strong> the unique features <strong>of</strong> SIRCUS is that the calibration can be done at system level. The three examples we<br />
discuss are the Marine Optical BuoY (MOBY), the SCRIPPS-<strong>NIST</strong> Advanced Radiometer (<strong>NIST</strong>AR), <strong>and</strong> Sun<br />
Photometers.<br />
3.1 MOBY<br />
Ocean color satellites such as the Sea-Viewing Wide Field-<strong>of</strong>-View Sensor (SeaWiFS) <strong>and</strong> the Moderate Resolution<br />
Imaging Spectrometer (MODIS) require vicarious calibration for accurate <strong>and</strong> continuous measurements <strong>of</strong> the waterleaving<br />
radiance. The primary reference instrument for most ocean color satellites is the MOBY, a radiometric buoy<br />
stationed in the waters <strong>of</strong>f Lanai, Hawaii [14, 15].<br />
Detector array-based spectral imaging systems, such as spectrographs, enable the simultaneous acquisition <strong>of</strong> an entire<br />
spectrum over some finite spectral region <strong>of</strong> interest; they can acquire a spectral image in a matter <strong>of</strong> seconds. The<br />
ability to rapidly acquire a full spectrum has led to the use <strong>of</strong> array-based systems in a variety <strong>of</strong> ocean color<br />
applications where the source may not be stable over minutes. Spectrographs commonly consist <strong>of</strong> an entrance port, a<br />
dispersing element (such as a grating) to spatially resolve the spectral components <strong>of</strong> the incident radiation, <strong>and</strong> mirrors<br />
to image the entrance port (<strong>of</strong>ten a slit) onto a detector reference plane. Because <strong>of</strong> the dispersing element, the spatial<br />
image <strong>of</strong> the entrance port falls on different regions <strong>of</strong> the detector array, depending on its wavelength; broadb<strong>and</strong><br />
sources form an image across the entire array. The spectral coverage <strong>of</strong> a spectrograph is determined by the size <strong>of</strong> its<br />
detector array, the dispersion properties <strong>of</strong> its grating, <strong>and</strong> its optical layout.<br />
Two CCD-spectrographs, one for the blue spectral region (360 nm to 640 nm), referred to as the BSG, <strong>and</strong> another for<br />
the red (560 nm to 940 nm), the RSG, form the basis <strong>of</strong> the Marine Optical System (MOS), the sensor used in MOBY<br />
[14]. The same dual-spectrograph design is used for the MOS Pr<strong>of</strong>iler, a ship-board-deployable version <strong>of</strong> the MOBY<br />
sensor used in the development <strong>of</strong> bio-optical algorithms. The response <strong>of</strong> the two MOS spectrographs to<br />
monochromatic laser excitation is shown in Fig. 3. The spectra are similar for both spectrographs. There are four<br />
components to the image: a strong sharp peak corresponding to the image <strong>of</strong> the spectrograph entrance slit on the CCD;<br />
a broad, peaked structure around the slit image; a non-zero constant component; <strong>and</strong> an additional peak. The first three<br />
components are similar to specular, haze, <strong>and</strong> diffuse components <strong>of</strong> reflectance, respectively. They remain<br />
approximately invariant as the excitation wavelength is changed <strong>and</strong> the image moves across the CCD array. From<br />
physical examination <strong>of</strong> the spectrographs, the fourth component (the additional peak) arises from a spurious reflection<br />
<strong>of</strong>f a mirror coupled with higher-order diffraction from the grating. As the image moves across the array, the reflection<br />
peak changes size, shape <strong>and</strong> position with respect to the primary peak. The specular component corresponds to the<br />
Proc. <strong>of</strong> SPIE Vol. 5542 367
Figure 3: MOS response to monochromatic excitation at (a) 550 nm (for the blue spectrograph) <strong>and</strong> (b) 700 nm (for<br />
the red spectrograph).<br />
properly imaged radiation; the other components arise from light scattered in the spectrograph, principally from the<br />
grating. The ‘specular’ component in the spectrograph image is analogous to the ‘in-b<strong>and</strong>’ component <strong>of</strong> a filter<br />
radiometer’s responsivity, while the sum <strong>of</strong> the other three components is analogous to the ‘out-<strong>of</strong>-b<strong>and</strong>’<br />
component.This unwanted background radiation, while small, is fairly typical for single grating spectrographs <strong>and</strong> can<br />
give rise to unforeseen errors, <strong>of</strong>ten much larger than anticipated, when the spectral distribution <strong>of</strong> a source being<br />
measured differs significantly from that <strong>of</strong> the calibration source. Such a situation is routinely encountered in ocean<br />
color measurements, where instruments are calibrated against inc<strong>and</strong>escent sources having peak radiances in the near<br />
infrared <strong>and</strong> subsequently measure the optical properties <strong>of</strong> the ocean, where the up-welled radiance peaks in the blue to<br />
green spectral region. Consequently, to fully underst<strong>and</strong> the radiometric performance <strong>of</strong> a spectrograph used for ocean<br />
color measurements, it is important to characterize the stray light in the system.<br />
Knowing the relationship between the excitation wavelength <strong>and</strong> the position <strong>of</strong> the image on the array enables us to<br />
determine the fraction <strong>of</strong> incident light at some wavelength that is scattered onto a particular element. For example, for<br />
the wavelength �ex in Fig. 3(top), 0.01 % <strong>of</strong> the light imaged on element 190 (BSG) is scattered onto element 300.<br />
Assuming each element in the detector array has the same average spectral responsivity, the signal from element 300 to<br />
radiation at wavelength �ex is 0.01 % <strong>of</strong> the signal from element 190.<br />
A single data set, shown in Fig. 3, does not give us the spectral resolution required to determine a pixel’s in-b<strong>and</strong><br />
relative spectral response. For this information, it is necessary to tune the monochromatic excitation source in fine<br />
steps, a situation SIRCUS is well equipped to address. Figure 4 shows the relative spectral response <strong>of</strong> adjacent pixels<br />
<strong>of</strong> the MOS RSG detector array as the laser excitation wavelength on SIRCUS is tuned over the range from 587 nm to<br />
593 nm in 0.1 nm steps. At each excitation wavelength, the responsivity <strong>of</strong> each pixel is separately determined. By<br />
tuning the excitation wavelength over a broad spectral range, a single pixel’s absolute spectral responsivity (<strong>and</strong> slit<br />
scatter function [16]) can be determined.<br />
368 Proc. <strong>of</strong> SPIE Vol. 5542
Figure 4: Spectral responsivity <strong>of</strong> pixels 428 to 432 (from left to right).<br />
As discussed in detail by Brown et al. [17], MOBY’s system response has been corrected for stray light. MOBY is used<br />
for the vicarious calibration <strong>of</strong> a number <strong>of</strong> ocean color satellites <strong>and</strong> any changes in MOBY-derived water-leaving<br />
radiances are directly reflected in satellite sensor calibration coefficients for the relevant channels. Consider the impact<br />
on MODIS as a representative example <strong>of</strong> the impact <strong>of</strong> the stray light correction <strong>of</strong> MOBY. MODIS b<strong>and</strong>s 8 through<br />
12 (412 nm to 551 nm) are vicariously calibrated against MOBY [18]. The stray-light-correction factors for MOBY<br />
(the correction factors are simply the ratio <strong>of</strong> the stray-light-corrected to the uncorrected measurements) in terms <strong>of</strong><br />
LWN ��� at the MODIS b<strong>and</strong>-averaged wavelengths over 5 years <strong>of</strong> deployments are given in Fig. 5. Each left-to-right<br />
grouping in the figure is a separate buoy deployment. <strong>Note</strong> that two different MOS spectrograph systems are used:<br />
Figure 5: MOBY L WN stray light correction factors for MODIS b<strong>and</strong>s.<br />
Proc. <strong>of</strong> SPIE Vol. 5542 369
one for even numbered buoy deployments <strong>and</strong> another one for odd numbered buoy deployments. The correction factors<br />
range from + 8 % for B<strong>and</strong> 8 to –2.5 % for B<strong>and</strong>s 11 <strong>and</strong> 12. There are slight differences in the stray light corrections<br />
for the two different MOS systems. There was an increase in the magnitude <strong>of</strong> the stray light correction factor for B<strong>and</strong><br />
8 for 3 Buoy deployments around 1999. During these deployments, a different optical fiber was used. With the<br />
exception <strong>of</strong> these buoys, the correction factors have been stable over the entire deployment sequence, implying that the<br />
MOBY imaging <strong>and</strong> the MOS slit-scatter functions, along with the ocean color, have remained stable over this time<br />
frame. The observed radiometric stability <strong>of</strong> the MOBY systems [14, 17, 18] enables us to correct previous<br />
deployments for stray light with confidence.<br />
3.2 <strong>NIST</strong>AR<br />
Scripps-<strong>NIST</strong>AR is a space-qualified radiometer package composed <strong>of</strong> three electrical substitution cavity radiometers<br />
<strong>and</strong> one photodiode radiometer [19]. It was designed <strong>and</strong> built to orbit the Earth’s Lagrange-1 (L1) point as part <strong>of</strong><br />
NASA’s proposed Deep Space Climate Observatory (DISCOVR) mission <strong>and</strong> measure the energy emitted <strong>and</strong> reflected<br />
by the Earth with an accuracy <strong>of</strong> 0.1%. The Scripps-<strong>NIST</strong>AR package contains 1) a total (100 �m)<br />
channel (B<strong>and</strong> A) to measure total radiant power in the UV, visible, <strong>and</strong> infrared wavelengths; 2) a solar (0.2 to 4 �m)<br />
channel (B<strong>and</strong> B) to measure reflected solar radiance in the UV, visible <strong>and</strong> near infrared wavelengths; 3) a near<br />
infrared (0.7 to 4 m) channel (B<strong>and</strong> C) to measure reflected IR solar radiance; <strong>and</strong> 4) a photodiode (0.3 to 1 �m)<br />
channel to be used as an on-board calibration reference for the Scripps-<strong>NIST</strong>AR instrument.<br />
SIRCUS was used to make absolute irradiance responsivity measurements <strong>of</strong> the three cavity radiometers <strong>and</strong> the Si<br />
photodiode. During pre-flight calibration <strong>of</strong> <strong>NIST</strong>AR at the SIRCUS facility, the instrument was in a thermal-vacuum<br />
chamber to simulate the space environment. Through windows in the chamber, it viewed the output <strong>of</strong> a laserilluminated<br />
integrating sphere, simulating the geometry <strong>of</strong> the view <strong>of</strong> Earth from L1. Shown in Figure 6 is the<br />
normalized irradiance responsivity using 532 nm radiation emitted from a 2.54 cm diameter integrating sphere located<br />
approximately 2 m from the cavities. The sphere was illuminated by ~10 W <strong>of</strong> fiber optically coupled light from a<br />
frequency-doubled, diode-pumbed Nd: Vanadate laser.<br />
Shown in Figure 7 is the transmittance <strong>of</strong> three different B<strong>and</strong> C filters obtained with collimated light from a<br />
Ti:Sapphire laser. For these measurements, the monochromatic, uniform output from a 2.54 cm diameter integrating<br />
sphere was collimated with an <strong>of</strong>f-axis parabolic mirror. Also shown in the figure, for comparison, is the measurement<br />
<strong>of</strong> the transmittance <strong>of</strong> the filters with a monochromator. The SIRCUS results are a little different (probably because <strong>of</strong><br />
inter-reflections) from the “piece parts” approach <strong>and</strong> will help to put them on an absolute scale.<br />
SIRCUS has also helped to calibrate another instrument on the DSCOVR mission, the Earth Polychromatic Imaging<br />
Camera (EPIC) [20].<br />
3.3 Sun photometers<br />
Sun photometers <strong>and</strong> sky radiometers are used for atmospheric characterization. Sun photometers determine the<br />
atmospheric optical depth while radiance determined from sky radiometers constrains the aerosol models input into<br />
radiative transfer codes that calculate the atmospheric contribution to the at-sensor signal. There are several networks<br />
<strong>of</strong> sun photometers distributed globally to measure aerosol concentrations <strong>and</strong> distributions, e.g. the Aerosol Robotic<br />
Network (AERONET) [21]. The Sensor Intercomparison <strong>and</strong> Merger for Biological <strong>and</strong> Interdisciplinary Oceanic<br />
Studies (SIMBIOS) Project Office at NASA’s Goddard Space Flight Center (GSFC) uses in situ atmospheric data to<br />
validate MODIS <strong>and</strong> other ocean color satellite aerosol optical products, to evaluate aerosol models used for<br />
atmospheric correction, <strong>and</strong> to develop vicarious sensor calibration methodologies [22].<br />
370 Proc. <strong>of</strong> SPIE Vol. 5542
Irradiance Responsivity, R N<br />
1.010<br />
1.005<br />
1.000<br />
0.9950<br />
0.9900<br />
1 1 2 2 3 3<br />
Figure 6: Normalized irradiance responsivity <strong>of</strong> three receiver cavities calibrated on SIRCUS. For each cavity, the<br />
measurements were performed two times in order to assess repeatability within a two week period.<br />
Transmittance<br />
0.94<br />
0.92<br />
0.90<br />
0.88<br />
0.86<br />
Receiver Cavity Number<br />
F1System Level<br />
F5 System Level<br />
F8 System Level<br />
F1 Piece Parts<br />
F5 Piece Parts<br />
F8 Piece Parts<br />
700 750 800 850 900 950 1000<br />
Wavelength (nm)<br />
Figure 7: Absolute transmittance for 3 B<strong>and</strong> C filters measured using either monochromatic measurements forming a<br />
piece parts approach (lines) or using the system-level approach enabled by SIRCUS (symbols).<br />
Instruments are calibrated for irradiance responsivity against reference sun photometers using the cross-calibration<br />
technique at NASA’s GSFC [23]. Reference sun photometers that are part <strong>of</strong> the AERONET project are calibrated<br />
using the Langley-Bouger technique at the Mauna Loa Observatory on regular intervals. The cross-calibration technique<br />
consists <strong>of</strong> near simultaneous solar observations at GSFC with the uncalibrated instrument <strong>and</strong> a calibrated reference<br />
sun photometer. The method assumes that the ratio <strong>of</strong> the output voltages for the same channel (e.g., same spectral<br />
Proc. <strong>of</strong> SPIE Vol. 5542 371
esponsivity) for the reference <strong>and</strong> uncalibrated radiometers <strong>and</strong> a particular air mass is proportional to the ratio <strong>of</strong> the<br />
output voltage at zero air mass. If the spectral responsivities differ, a correction is made for spectral differences related<br />
to Rayleigh, ozone, <strong>and</strong> aerosol attenuation. The uncertainty in the calibration at GSFC is approximately 2 %.<br />
Instruments are calibrated for radiance responsivity at NASA’s GSFC using a <strong>NIST</strong>-traceable lamp -illuminated<br />
integrating sphere source known as the ‘Hardy’ source. A reference spectroradiometer equipped with an integrating<br />
sphere irradiance collector, the OL746/ISIC, is calibrated for irradiance responsivity against a <strong>NIST</strong> st<strong>and</strong>ard irradiance<br />
lamp. The irradiance calibration is then transferred to the Hardy sphere using the OL746/ISIC. Knowing the irradiance<br />
responsivity <strong>of</strong> the OL746/ISIC, the distance between the sphere exit port <strong>and</strong> the entrance aperture to the 746/ISIC, <strong>and</strong><br />
the sphere exit port area, it is straightforward to calculate the spectral radiance <strong>of</strong> the “Hardy” sphere. The uncertainty in<br />
the radiance responsivity calibration is estimated to be approximately 5 % (k = 2).<br />
As a first assessment <strong>of</strong> the uncertainties assigned to the radiance <strong>and</strong> irradiance responsivity calibrations <strong>of</strong> sun<br />
photometers, two multi-channel filter radiometers used in the SIMBIOS program were calibrated for irradiance <strong>and</strong><br />
radiance responsivity on SIRCUS <strong>and</strong> the results compared with st<strong>and</strong>ard calibrations [24]. The Satellite Validation for<br />
Marine Biology <strong>and</strong> Aerosol Determination (SimbadA) radiometers are eleven-channel filter radiometers with<br />
b<strong>and</strong>passes <strong>of</strong> approximately 10 nm <strong>and</strong> center wavelengths at 350 nm, 380 nm, 410 nm, 443 nm, 490 nm, 510 nm, 565<br />
nm, 620 nm, 670 nm, 750 nm <strong>and</strong> 870 nm, respectively. For comparison to the GSFC sun photometer cross-calibration<br />
results, the SIRCUS-derived irradiance responsivities s(�) were used to predict a top-<strong>of</strong>-the-atmosphere (TOA) signal<br />
Vo(SIRCUS):<br />
V o<br />
�SIRCUS� s���E���d�<br />
� �<br />
, (1)<br />
where s(�) is the spectral responsivity <strong>of</strong> one <strong>of</strong> the radiometer channels <strong>and</strong> E(�) is an exo -atmospheric solar<br />
irradiance spectrum. Souaidia et al. [24] used the exo -atmospheric solar irradiance spectra developed by others. To<br />
perform the integration, the s(�) <strong>and</strong> the E(�) were interpolated to a uniform wavelength interval <strong>of</strong> 0.25 nm <strong>and</strong><br />
integrated.<br />
The dominant source <strong>of</strong> uncertainty in the SIRCUS-based predicted TOA signal was the solar irradiance spectrum used.<br />
Changes <strong>of</strong> 1 % or so were observed, depending on the exo-atmospheric solar irradiance spectrum chosen. Given a<br />
cross-calibration uncertainty <strong>of</strong> ~ 2 %, we are able to validate the cross-calibration with a combined exp<strong>and</strong>ed<br />
uncertainty (k = 2) <strong>of</strong> ~ 4 %. Predicted results for the 750 nm channel <strong>and</strong> the 490 nm channel agreed with the crosscalibration<br />
to within 2 %; the agreement for the 440 nm channel was approximately 5 %. The agreement for the 490 nm<br />
<strong>and</strong> 750 nm channels is within the combined uncertainties, but the 440 nm results are not <strong>and</strong> warrant further<br />
investigation [24].<br />
In order to compare the two sets <strong>of</strong> radiance measurements, radiance responsivities, s(�), were interpolated to a uniform<br />
wavelength interval, as were the sphere spectral radiance values, L(�), for the lamp-illuminated integrating sphere<br />
source. The measured signal was then compared to the predicted signal using equation 1, but replacing E(�) with L(�)<br />
<strong>and</strong> using the instrument’s radiance responsivity instead <strong>of</strong> it’s irradiance responsivity. We obtained differences in the<br />
calibrations between 2 % <strong>and</strong> 4 %, depending on wavelength. The radiance responsivity results were consistent with<br />
results <strong>of</strong> an intercomparison performed at NASA’s Goddard Space Flight Center in 2001 [25, 26].<br />
4. SUMMARY<br />
SIRCUS is a laser-based facility recently developed at <strong>NIST</strong> to provide system-level characterization <strong>and</strong> calibration <strong>of</strong><br />
a vast assortment <strong>of</strong> radiometers, including EOS instruments, with state-<strong>of</strong>-the-art uncertainties. We continue to<br />
improve the radiometric calibration capabilities <strong>of</strong> SIRCUS by decreasing the uncertainties <strong>and</strong> increasing the spectral<br />
coverage. In many situations, such as with MOBY, it is impossible to bring the instrument to <strong>NIST</strong> for calibration.<br />
Recognizing the need <strong>and</strong> taking advantage <strong>of</strong> the miniaturization <strong>of</strong> lasers, a “traveling SIRCUS” has been developed<br />
to perform in-situ calibrations <strong>of</strong> EOS <strong>and</strong> related sensors. Currently, the spectral coverage available with this traveling<br />
372 Proc. <strong>of</strong> SPIE Vol. 5542
SIRCUS is from 360 nm to 1050 nm; the spectral coverage is being exp<strong>and</strong>ed to include the short-wave infrared out to<br />
2.5 �m.<br />
ACKNOWLEDGMENTS<br />
We wish to thank John Grangaard for his support <strong>of</strong> this facility <strong>and</strong> acknowledge the continued support <strong>of</strong> the Air<br />
Force component <strong>of</strong> the Calibration Coordination Group <strong>of</strong> the armed services. We also thank Steven Lorentz, Carol<br />
Johnson <strong>and</strong> Edward Early from <strong>NIST</strong> for significant contributions to this work.<br />
REFERENCES<br />
*Certain commercial equipment, instruments, or materials are identified in this paper to foster underst<strong>and</strong>ing. Such<br />
identification does not imply recommendation or endorsement by the <strong>National</strong> <strong>Institute</strong> <strong>of</strong> <strong>St<strong>and</strong>ards</strong> <strong>and</strong> Technology,<br />
nor dies it imply that the materials or equipment identified are the best available for the purpose.<br />
1. http://eospso.gsfc.nasa.gov/.<br />
2. Butler, J.J. <strong>and</strong> R.A. Barnes, Calibration strategy for the earth observing system (EOS)-AM1 platform. IEEE<br />
Transactions on Geoscience <strong>and</strong> Remote Sensing, 1998. 36(4): p. 1056-1061.<br />
3. Brown, S.W., G.P. Eppeldauer, <strong>and</strong> K.R. Lykke, <strong>NIST</strong> Facility for spectral irradiance <strong>and</strong> radiance<br />
responsivity calibrations with uniform sources. Metrologia, 2000. 37: p. 579-582.<br />
4. Brown, S.W., G. Eppeldauer, <strong>and</strong> K.R. Lykke, Facility for spectral irradiance <strong>and</strong> radiance responsivity<br />
calibrations using uniform sources (SIRCUS). Applied Optics, 2004. to be submitted.<br />
5. Anderson, V.E., N.P. Fox, <strong>and</strong> D.H. Nettleton, Highly stable, monochromatic <strong>and</strong> tunable optical radiation<br />
source <strong>and</strong> its application to high accuracy spectrophotometry. Applied Optics, 1992. 31(4): p. 536-545.<br />
6. Gentile, T.R., J.M. Houston, <strong>and</strong> C.L. Cromer, Realization <strong>of</strong> a scale <strong>of</strong> absolute spectral response using the<br />
<strong>NIST</strong> high-accuracy cryogenic radiometer. Applied Optics, 1996. 35(22): p. 4392-4403.<br />
7. Fowler, J. <strong>and</strong> M. Litorja, Geometric area measurements <strong>of</strong> circular apertures for radiometry at <strong>NIST</strong>.<br />
Metrologia, 2003. 40: p. S9-S12.<br />
8. sircus wavelengths powers.<br />
9. Jusinski, L.E. <strong>and</strong> C.A. Taatjes, Efficient <strong>and</strong> stable operation <strong>of</strong> an Ar+-pumped continuous-wave ring laser<br />
from 505-560nm using a coumarin dye. Review <strong>of</strong> Scientific Instruments, 2001. 72: p. 2837-2838.<br />
10. Moulton, P.F., Spectroscopic <strong>and</strong> laser characteristics <strong>of</strong> Ti:Al2O3. J. Opt. Soc. Am. B, 1986. 3: p. 125-133.<br />
11. Gentile, T.R. <strong>and</strong> C.L. Cromer, Mode-locked lasers for high-accuracy radiometry. Metrologia, 1996. 32: p.<br />
585-587.<br />
12. Gentile, T.R., et al., <strong>National</strong> <strong>Institute</strong> <strong>of</strong> <strong>St<strong>and</strong>ards</strong> <strong>and</strong> Technology high-accuracy cryogenic radiometer.<br />
Applied Optics, 1996. 35(7): p. 1056-1068.<br />
13. Rice, J.P., An electrically substituted bolometer as a transfer-st<strong>and</strong>ard detector. Metrologia, 2000. 37: p. 433-<br />
436.<br />
14. Clark, D.K., et al. An overview <strong>of</strong> the radiometric calibration <strong>of</strong> MOBY. in Earth Observing Systems VI. 2002:<br />
SPIE.<br />
15. Clark, D.K., et al., MOBY, a radiometric buoy for performance monitoring <strong>and</strong> vicarious calibration <strong>of</strong><br />
satellite ocean color sensors: measurement <strong>and</strong> data analysis protocols, in Ocean Optics Protocols for<br />
Satellite Ocean Color Sensor Validation, Revision 3, Volume 2, J.L. Mueller <strong>and</strong> G.S. Fargion, Editors. 2002,<br />
NASA Goddard Space Flight Center: Greenbelt, MD. p. 138-170.<br />
16. Kostkowski, H.J., Reliable Spectroradiometry. 1997.<br />
17. Brown, S.W., et al., Stray-light correction algorithm for spectrographs. Metrologia, 2003. 40: p. S81-S84.<br />
18. Barnes, R.A., et al. The calibration <strong>of</strong> SeaWiFS on orbit. in SPIE. 2000: SPIE.<br />
19. Rice, J.P., S.R. Lorentz, <strong>and</strong> T.M. Jung. The next generation <strong>of</strong> active cavity radiometers for space-based<br />
remote sensing, in 10th Conference on Atmospheric Radiation. 1999. Madison, WI: American Meteorological<br />
Society.<br />
20. Early, E.A., et al. Radiometric Calibration <strong>of</strong> the Scripps Earth Polychromatic Imaging Camera. in Earth<br />
Observing Systems VI; SPIE. 2001.<br />
Proc. <strong>of</strong> SPIE Vol. 5542 373
21. Holben, B.N. et al., Aeronet-a federated instrument network <strong>and</strong> data archive for aerosol characterization.<br />
Remote Sens. Environ., 1998. 66: p. 1-16.<br />
22. Fargion, G.S., R.A. Barnes, <strong>and</strong> C.R. McClain, In situ aerosol optical thickness collected by the SIMBIOS<br />
program (1997-2000): Protocols <strong>and</strong> data QC <strong>and</strong> analysis. 2001, NASA/TM-2001-209982: Greenbelt, MD.<br />
23. Pietras, C., et al., Calibration <strong>of</strong> sun photometers <strong>and</strong> sky radiance sensors, in In situ aerosol optical thickness<br />
collected by the SIMBIOS program (1997-2000): protocols, <strong>and</strong> data QC <strong>and</strong> analysis, R.B. G. S. Fargion, <strong>and</strong><br />
C. McClain, Editor. 2001, NASA's Goddard Space Flight Center: Greenbelt, MD.<br />
24. Souaidia, N., et al., Comparison <strong>of</strong> laser-based <strong>and</strong> conventional calibrations <strong>of</strong> sun photometers. SPIE<br />
proceedings, 2003.<br />
25. Butler, J.J., B.C. Johnson, <strong>and</strong> R.A. Barnes, Radiometric measurement comparisons at NASA's Goddard Space<br />
Flight Center: Part I. The GSFC sphere sources. The Earth Observer, 2002. 14(3): p. 3-8.<br />
26. Butler, J.J., B.C. Johnson, <strong>and</strong> R.A. Barnes, Radiometric measurement comparisons at NASA's Goddard Space<br />
Flight Center: Part II. Irradiance lamp comparisons <strong>and</strong> the <strong>NIST</strong> sphere source. The Earth Observer, 2002.<br />
14(4): p. 25-29.<br />
374 Proc. <strong>of</strong> SPIE Vol. 5542
ABSOLUTE RADIOMETRIC CALIBRATION OF DIGITAL IMAGING SYSTEMS<br />
Steven W. Brown, Thomas C. Larason, Catherine Habauzit, George P. Eppeldauer,<br />
Yoshihiro Ohno, <strong>and</strong> Keith R. Lykke<br />
<strong>National</strong> <strong>Institute</strong> <strong>of</strong> <strong>St<strong>and</strong>ards</strong> <strong>and</strong> Technology, Gaithersburg, MD 20899<br />
ABSTRACT<br />
We have developed a tunable laser-based facility for the absolute radiometric calibration <strong>of</strong> digital imaging systems such as<br />
CCD cameras, spectrographs, <strong>and</strong> microscopes. Several types <strong>of</strong> silicon-based digital imaging systems have been calibrated<br />
in this new facility, including a commercially available camera equipped with a removable photopic filter, a custom-designed<br />
digital microscope, <strong>and</strong> a CCD spectrograph. We present results <strong>of</strong> the CCD camera calibration in detail <strong>and</strong> discuss relevant<br />
aspects <strong>of</strong> the microscope <strong>and</strong> spectrograph calibrations. During the radiometric calibration, the pixel-to-pixel uniformity,<br />
linearity, <strong>and</strong> absolute spectral responsivity <strong>of</strong> each system were determined over the visible spectral range (400 nm to<br />
800 nm). Each <strong>of</strong> these aspects <strong>of</strong> the CCD camera calibration will be presented, along with a discussion <strong>of</strong> the measurement<br />
uncertainties.<br />
Keywords: calibration, CCD, digital camera, radiometry<br />
1. INTRODUCTION<br />
Improvements in the operation <strong>and</strong> performance <strong>of</strong> Digital Imaging Systems (DIS’s) have led to an explosion in the use <strong>of</strong><br />
these systems in a variety <strong>of</strong> scientific, medical, <strong>and</strong> industrial imaging applications. In many <strong>of</strong> these new applications, it is<br />
important that the spectral characteristics <strong>of</strong> the imaging system as well as its spatial (geometric) properties be well<br />
characterized <strong>and</strong> its photometric, radiometric, or colorimetric performance known. This has resulted in increased dem<strong>and</strong><br />
for characterization <strong>and</strong> calibration methodologies traceable to common st<strong>and</strong>ards.<br />
By knowing the spectral responsivity <strong>of</strong> a DIS, one can accurately predict its performance under differing operating<br />
conditions. Currently, these systems can be calibrated with relative combined st<strong>and</strong>ard uncertainties <strong>of</strong> approximately 5 % to<br />
10 %. In many cases, DIS’s are calibrated against broad-b<strong>and</strong> inc<strong>and</strong>escent sources — such as Illuminant A — <strong>and</strong><br />
subsequently measure sources with very different spectral power distributions. In this case, the measurement uncertainties<br />
are not well known in general, <strong>and</strong> can be much larger than expected.<br />
2. DESCRIPTION OF THE SIRCUS FACILITY<br />
We have developed a facility at the <strong>National</strong> <strong>Institute</strong> <strong>of</strong> <strong>St<strong>and</strong>ards</strong> <strong>and</strong> Technology (<strong>NIST</strong>) for Spectral Irradiance <strong>and</strong><br />
Radiance Responsivity Calibrations using Uniform Sources (SIRCUS) to calibrate DIS’s. In this facility — shown in<br />
Fig. 1 — lasers are directed into an integrating sphere to produce a monochromatic, Lambertian source for irradiance <strong>and</strong><br />
radiance responsivity calibrations. This integrating sphere source (ISS) has been used to calibrate the spectral radiance <strong>and</strong><br />
irradiance responsivity <strong>of</strong> a variety <strong>of</strong> detectors <strong>and</strong> imaging systems [1]. The two critical cornerstones <strong>of</strong> the facility are<br />
broadly tunable continuous-wave (cw) laser sources <strong>and</strong> reference st<strong>and</strong>ard detectors that are well-characterized <strong>and</strong><br />
calibrated with low uncertainties to determine the radiance <strong>of</strong> the ISS with low uncertainty.<br />
A variety <strong>of</strong> lasers are used to provide continuous coverage over the spectral range from 370 nm to 1000 nm. A Ti:sapphire<br />
laser provides tunable coverage from 690 nm to 1000 nm, frequency-doubling enables tunability from 370 nm to 450 nm.<br />
Discrete lasers were used for the spectral range from 450 nm to 550 nm <strong>and</strong> dye lasers are used to cover the spectral region<br />
from 550 nm to 700 nm. Currently, dye lasers are used to cover the spectral range from 415 nm to 700 nm.<br />
Reference st<strong>and</strong>ard detectors with spectral power responsivities directly traceable to the <strong>NIST</strong> primary st<strong>and</strong>ard equipped<br />
with precision apertures were used to determine the sphere radiance [2]. These trap detectors are calibrated for spectral<br />
power responsivity directly against a cryogenic radiometer over the spectral range from 405 nm to 920 nm [3]. From the<br />
power responsivity <strong>and</strong> the aperture area, the irradiance responsivity <strong>of</strong> the trap detector is determined. By measuring the<br />
distance between the sphere exit port <strong>and</strong> the trap detector entrance aperture <strong>and</strong> the area <strong>of</strong> the ISS exit port, the radiance <strong>of</strong><br />
Sensors <strong>and</strong> Camera Systems for Scientific, Industrial, <strong>and</strong> Digital Photography Applications II,<br />
Morley M. Blouke, John Canosa, Nitin Sampat, Editors, Proceedings <strong>of</strong> SPIE Vol. 4306 (2001)<br />
© 2001 SPIE · 0277-786X/01/$15.00<br />
13
14<br />
Voltmeter<br />
Computer<br />
Monitor detector<br />
baffle<br />
the ISS was determined with a relative combined<br />
st<strong>and</strong>ard uncertainty <strong>of</strong> 0.1 % [4, 5]. A silicon<br />
monitor detector mounted on the wall <strong>of</strong> the ISS was<br />
used to correct for small power fluctuations in the<br />
laser between measurements with the reference<br />
st<strong>and</strong>ard detector <strong>and</strong> the DIS.<br />
3. CALIBRATION RESULTS<br />
In general, the absolute spectral responsivity (ASR) <strong>of</strong><br />
an instrument, R(λ), relates the signal measured by a<br />
detector, S, to the spectral radiance <strong>of</strong> the source<br />
being measured, L(λ):<br />
S = ∫ R(λ)L(λ)dλ . (1)<br />
The integration is over the full spectral b<strong>and</strong>width <strong>of</strong><br />
the source. A DIS can be considered to be comprised<br />
<strong>of</strong> i by j independent detectors, with an individual<br />
measurement equation for each detector, or pixel, in<br />
the array. Each pixel in the array will also image a<br />
different area <strong>of</strong> the ISS, <strong>and</strong> in general:<br />
Si, j = ∫ Ri, j (λ)L i, j (λ)dλ , (2)<br />
with i defining the column position <strong>and</strong> j equal to the corresponding row in the array. Li,j(λ) refers to the radiance <strong>of</strong> the<br />
spatial region <strong>of</strong> the sphere exit port imaged onto pixel i, j. <strong>Note</strong> that for uniform sources, we can eliminate the spatial<br />
dependence on radiance: Li,j (λ)~L(λ).<br />
Because we are using narrow-b<strong>and</strong> laser sources (with a b<strong>and</strong>width <strong>of</strong> approximately 10 MHz, or 0.00001 nm), L(λ) can be<br />
approximated by a delta function, L(λ)=L(λο)δ(λ − λο), <strong>and</strong> Eq. 2 can be rewritten as,<br />
Si, j = Ri, j (λ o )L(λ o ) . (3)<br />
Knowing the source radiance L(λο) <strong>and</strong> measuring the CCD signal S(λo), we obtain a direct measurement <strong>of</strong> the desired<br />
quantity Ri,j(λo):<br />
Ri, j(λ o) = Si, j L(λ o) . (4)<br />
By tuning the wavelength <strong>of</strong> the calibration source, we directly obtain the absolute spectral responsivity <strong>of</strong> each element in<br />
the DIS.<br />
To complete the radiometric calibration <strong>of</strong> an instrument, other factors need to be considered as well, including the linearity<br />
<strong>of</strong> the response <strong>and</strong> the exposure time correction.<br />
3.1. Camera Calibration<br />
lens<br />
Integrating sphere<br />
Laser Intensity stabilizer<br />
Wavemeter<br />
Transfer St<strong>and</strong>ard<br />
Detector<br />
Device Under Test<br />
baffles<br />
aperture<br />
vibrating mirror<br />
Iris<br />
shutter<br />
mirror<br />
Fig. 1. Schematic diagram <strong>of</strong> the SIRCUS facility.<br />
We calibrated an 8-bit silicon-based CCD camera with 640 x 480 pixels equipped with a 35 mm focal length lens <strong>and</strong> a<br />
removable photopic filter. The instrument field-<strong>of</strong>-view under normal operating conditions is 13.5 o . It comes equipped with<br />
8 user-selectable shutter speeds, enabling measurements <strong>of</strong> luminance levels as low as 0.34 cd/m 2 . It has a short-term<br />
repeatability <strong>of</strong> 0.4 %, <strong>and</strong> is calibrated by the manufacturer against Illuminant A with a stated relative combined st<strong>and</strong>ard<br />
uncertainty (k=1) <strong>of</strong> 4 %. The camera pixel-to-pixel response uniformity, linearity, <strong>and</strong> absolute responsivity — both with<br />
<strong>and</strong> without the photopic V(λ) filter on the front <strong>of</strong> the camera — were determined.<br />
We used a 20 cm diameter Spectralon-coated integrating sphere with a 5.34 cm diameter exit port to calibrate the CCD<br />
camera. Typical power levels <strong>of</strong> radiation introduced into the ISS range from a few mW to a few hundred mW, depending on<br />
the laser used, giving a source radiance in the range from 1 x 10 -7 W/mm 2 /sr to 1 x 10 -4 W/mm 2 /sr. Prior to determining the<br />
responsivity <strong>of</strong> the CCD camera, the monitor detector was calibrated against the reference st<strong>and</strong>ard detector over the<br />
wavelength range <strong>of</strong> interest. The calibration related the monitor detector signal to the ISS radiance. The CCD camera was<br />
Proc. SPIE Vol. 4306
Fig. 2. ISS exit port radiance uniformity with 532 nm excitation.<br />
then aligned in front <strong>of</strong> the ISS <strong>and</strong> its radiance<br />
responsivity determined. During the camera<br />
calibration, the sphere radiance was determined at a<br />
particular wavelength by measuring the monitor<br />
detector signal.<br />
We measured the uniformity <strong>of</strong> the ISS at 488 nm,<br />
532 nm, <strong>and</strong> 633 nm using a temperature-stabilized Si<br />
radiometer with a narrow field <strong>of</strong> view mounted on a<br />
computer controlled two-axis (XY) translation stage.<br />
The stage was stepped in 2 mm increments over a 6 cm<br />
by 6 cm square area (an area larger than the area <strong>of</strong> the<br />
sphere exit port). The radiometer signal, normalized by<br />
the sphere monitor photodiode signal, was recorded at<br />
each position. Results are shown in Fig. 2 for the<br />
relative radiance over the ISS exit port at 532 nm;<br />
results for 633 nm <strong>and</strong> 488 nm were similar. As shown<br />
in the figure, the radiance from upper right quadrant <strong>of</strong><br />
the sphere is slightly larger than the radiance from the<br />
rest <strong>of</strong> the sphere. We therefore allow Li, j (λ) ≈ L λ<br />
(),<br />
with an added relative st<strong>and</strong>ard uncertainty <strong>of</strong> 0.25 %.<br />
We then positioned the camera in front <strong>of</strong> the ISS exit port. Using a target grid centered on the ISS exit port, we positioned<br />
the camera to image the central 4 cm by 3 cm region <strong>of</strong> the sphere exit port. Prior to determining the absolute responsivity <strong>of</strong><br />
the CCD, it is necessary to measure <strong>and</strong> correct for any non-linearity in the response <strong>of</strong> the camera. We therefore measured<br />
the response <strong>of</strong> the CCD array, averaged over the central 50 by 50 pixels, as the sphere radiance was changed. The<br />
measurements involved changing the intensity <strong>of</strong> the laser light entering the ISS (by adjusting the throughput <strong>of</strong> a laser power<br />
controller) <strong>and</strong> comparing the radiance <strong>of</strong> the sphere measured by the CCD with the known ISS radiance determined by the<br />
calibrated monitor photodiode. The 8-bit camera has a maximum digital number (DN) <strong>of</strong> 255, corresponding to a 90 % <strong>of</strong><br />
the CCD full-well capacity; data were taken with the<br />
same CCD exposure time (2 ms) over a radiance<br />
range giving count levels varying from approximately<br />
65<br />
1.5<br />
10 DN to 240 DN. The resultant data are plotted in<br />
Fig. 3 as the ratio <strong>of</strong> the CCD signal to the sphere<br />
radiance versus the CCD signal (DN). If the CCD<br />
60<br />
1.4<br />
response were linear, the ratio <strong>of</strong> the CCD signal to<br />
1.3<br />
the ISS radiance would remain constant as a function<br />
55<br />
<strong>of</strong> CCD count level. However, the ratio increased<br />
sharply as the CCD camera signal increased from<br />
1.2<br />
10 DN to 100 DN. Above 100 DN, the ratio<br />
continued to rise slightly, increasing from a value <strong>of</strong><br />
approximately 60 at 100 DN to a value <strong>of</strong><br />
50<br />
1.1<br />
approximately 63 at 230 DN. In determining the<br />
absolute radiance responsivity <strong>of</strong> the CCD, we<br />
normalized individual data sets to the high-count<br />
45<br />
1<br />
level, with the individual scaling factors determined<br />
by the results shown in Fig. 3.<br />
40<br />
0.9<br />
<strong>Note</strong> that we only calibrated the linearity <strong>of</strong> the CCD<br />
using a shutter setting corresponding to an exposure<br />
time <strong>of</strong> 2 ms. It is difficult to distinguish between a<br />
non-linearity in the CCD response, <strong>and</strong> a variability in<br />
the camera readout <strong>of</strong>fset value. For example, we<br />
performed a correction to the response <strong>of</strong> the CCD by<br />
Ratio [Signal/Monitor]<br />
0 50 100 150 200 250<br />
Signal [DN]<br />
Fig. 3. Non-linear response <strong>of</strong> the CCD camera <strong>and</strong> the resultant<br />
scaling factors used in the absolute responsivity calibration.<br />
Scaling Factor<br />
Proc. SPIE Vol. 4306 15
16<br />
changing the <strong>of</strong>fset level by 7 DN. Applying this simple correction to the data in Fig. 3, the response <strong>of</strong> the CCD camera was<br />
linear to within 1 % over the range from 25 DN to 230 DN.<br />
The CCD camera was then positioned in front <strong>of</strong> the ISS, <strong>and</strong> its spectral responsivity, in DN per second per unit radiance,<br />
was determined. During the calibration on SIRCUS, the laser was tuned to the wavelength <strong>of</strong> interest. The CCD camera<br />
measured the radiance from the ISS exit port <strong>and</strong> the radiance responsivity (DN/s/(W/cm 2 /sr)) was calculated by dividing the<br />
CCD output signal, corrected for the exposure time, by the sphere radiance. During the calibration, images were acquired<br />
with several different exposure times. The CCD responsivity was measured for different exposure times at several<br />
wavelengths during the calibration. The CCD responsivity agreed to within 1 % for the different exposure times.<br />
In Fig. 4, the pixel-to-pixel responsivity <strong>of</strong> the camera is shown for 580 nm excitation. Without the photopic filter in place,<br />
the total response variation over the central 90 % <strong>of</strong> the array was approximately 5 %, as shown in Fig. 4(a). With the<br />
photopic filter installed, the non-uniformity in the CCD responsivity increased to approximately 10 %, as shown in Fig. 4(b).<br />
All measurements were performed under the same conditions. The data were not corrected for the non-uniformity <strong>of</strong> the ISS<br />
radiance because it was negligible compared with the non-uniformity <strong>of</strong> the pixel-to-pixel responsivity <strong>of</strong> the CCD.<br />
To determine the ASR, we averaged the response <strong>of</strong> the central 50 by 50 pixels over the wavelength range from 400 nm to<br />
800 nm. At the time <strong>of</strong> the calibration, we did not have continuously tunable lasers for the spectral range from 450 nm to<br />
550 nm. To fill in this spectral region, we calculated the relative responsivity using the output from a lamp-monochromator<br />
source (4 nm b<strong>and</strong>width) [6], <strong>and</strong> determined the absolute responsivity by comparison with results obtained on SIRCUS. For<br />
this part <strong>of</strong> the calibration, relay optics were used to create a parallel 2.5 cm diameter beam. The radiation, under-filling the<br />
CCD field-<strong>of</strong>-view, was imaged onto a small region in the center <strong>of</strong> the CCD array. During the calibration, the radiant power<br />
in the beam was measured at each wavelength using reference detectors <strong>and</strong> an image subsequently acquired by the CCD. A<br />
35 by 35 pixel area on the CCD was selected to give an averaged response. The data were subsequently corrected for the<br />
nonlinear response <strong>of</strong> the CCD <strong>and</strong> normalized to the radiant power in the beam, giving a relative responsivity <strong>of</strong> the CCD.<br />
To determine the absolute responsivity <strong>of</strong> the camera, the data were normalized to the SIRCUS results near 580 nm. Results<br />
are shown in Fig. 5 for the camera (a) with <strong>and</strong> (b) without the photopic filter attached.<br />
Proc. SPIE Vol. 4306<br />
(a) (b)<br />
Fig. 4. Pixel-to-pixel uniformity (a) without <strong>and</strong> (b) with the photopic filter installed for 580 nm<br />
excitation. The total variation is 5 % in (a) <strong>and</strong> 10 % in (b).
Responsivity [DN/s/(W/mm 2 /sr)]<br />
1.4 10 9<br />
1.2 10 9<br />
1.0 10 9<br />
8.0 10 8<br />
6.0 10 8<br />
4.0 10 8<br />
2.0 10 8<br />
3.2. Uncertainty <strong>of</strong> camera radiance responsivity<br />
0.0<br />
-2.0 10 8<br />
300 400 500 600 700 800 900 1000<br />
Wavelength [nm]<br />
Each component in the calibration chain contributes to the overall uncertainty in the radiance responsivity calibration. We<br />
estimated the contributions <strong>of</strong> all known components to the combined st<strong>and</strong>ard uncertainty in the CCD radiance responsivity<br />
calibration on SIRCUS. These contributions are listed in Table 1. We estimate the relative combined st<strong>and</strong>ard uncertainty in<br />
the sphere radiance to be 0.1 %; the uncertainty in the non-linear correction to the responsivity to be 1 %; the uncertainty in<br />
the exposure time correction to be 0.5 %; <strong>and</strong> the reproducibility, including short-term repeatability, alignment <strong>and</strong> focus, to<br />
be approximately 2 %. After taking the root-sum-square <strong>of</strong> the individual components, the relative combined st<strong>and</strong>ard<br />
uncertainty in the CCD radiance responsivity calibration is 2.3 % (coverage factor k=1). For imaging applications, there will<br />
be an additional uncertainty <strong>of</strong> approximately 1 % from the non-uniformity <strong>of</strong> the CCD.<br />
Table 1. Relative combined st<strong>and</strong>ard uncertainty <strong>of</strong> the CCD radiance responsivity<br />
calibration on SIRCUS.<br />
Component Uncertainty [%]<br />
Sphere Radiance<br />
(Monitor detector calibration)<br />
0.1<br />
Sphere Radiance Non-uniformity 0.25<br />
CCD Non-linearity 1<br />
Exposure time correction 0.5<br />
Reproducibility 2<br />
Relative Combined Std. Uncertainty 2.3<br />
The radiant power distribution in the beam from the monochromator was highly non-uniform, leading to increased<br />
uncertainty in the calibration <strong>of</strong> the CCD, both because <strong>of</strong> the increased uncertainty in the reproducibility <strong>of</strong> the<br />
measurements, <strong>and</strong> also because <strong>of</strong> the increased uncertainty in the non-linearity correction <strong>of</strong> the averaged response. There<br />
was an additional uncertainty in the normalization <strong>of</strong> the response to the measurements on SIRCUS. Consequently,<br />
measurements using the lamp-monochromator had a relative combined st<strong>and</strong>ard uncertainty <strong>of</strong> approximately 4 %.<br />
For measurements <strong>of</strong> photometric quantities, a source spectral radiance distribution is weighted by the V(λ) function [7]. The<br />
photometric uncertainty is different than the above discussed radiometric responsivity measurement uncertainty <strong>and</strong> depends<br />
on how closely the response <strong>of</strong> the camera with the photopic filter approximates the V(λ) function. For poor matches, the<br />
photometric uncertainty can be large <strong>and</strong> will depend on the source spectral distribution. There will be an additional<br />
uncertainty for imaging applications from the larger non-uniformity in the pixel-to-pixel response.<br />
(a)<br />
(b)<br />
Fig. 5. CCD camera ASR (a) without <strong>and</strong> (b) with the<br />
photopic filter installed.<br />
Proc. SPIE Vol. 4306 17
18<br />
3.3 Microscope Calibration<br />
The microscope consists <strong>of</strong> an objective lens <strong>and</strong> a 1024 by 1024 pixel cooled CCD array. It is used to determine x-ray<br />
phosphor efficiencies from scintillator crystals [8]. Imaging a scintillation region on a crystal is extremely advantageous<br />
because the radiation from scintillators is Lambertian <strong>and</strong> viewing the source distribution enables the determination <strong>of</strong><br />
radiometric quantities with lower uncertainties. We measured the linearity, exposure time correction, pixel to pixel<br />
uniformity <strong>and</strong> the absolute spectral radiance responsivity <strong>of</strong> the microscope on SIRCUS. For these measurements, we used<br />
a 5 cm diameter ISS with a 2 mm aperture. The microscope, equipped with a 10X objective, was positioned in front <strong>of</strong> the<br />
ISS. Each pixel imaged the same region <strong>of</strong> the ISS exit port, resulting in minimal additional uncertainty in the calibration<br />
from any potential non-uniformity in the sphere exitance.<br />
The CCD array had a 12-bit A/D converter, with 4095 DN corresponding to 90 % <strong>of</strong> the CCD full-well capacity. We first<br />
determined the exposure time <strong>and</strong> the non-linearity corrections in the response <strong>of</strong> the microscope; results are shown in Figs. 6<br />
<strong>and</strong> 7, respectively. The exposure time correction was negligible for exposure times greater that 500 ms. For shorter<br />
exposure times, a correction — as large as 100 % for 10 ms exposure times — had to be applied. In many <strong>of</strong> these systems,<br />
there is a delay in opening <strong>and</strong> closing the shutter, leading to an exposure time that is slightly different than the nominal<br />
value. For this instrument, adding 10 ms to the nominal exposure time reduced the correction to the 5 % level for the shortest<br />
exposure times. The system response was linear for count rates larger than 100 DN. Offset variations <strong>and</strong> uncertainty in the<br />
determination <strong>of</strong> the background signal could contribute to the non-linear behavior at the smaller count rates. During the<br />
absolute radiometric calibration, the count rates were kept larger than 1000 DN <strong>and</strong> the exposure time was kept constant at<br />
100 ms. This is easy to accomplish using a laser-based ISS; we merely adjust the power into the ISS at a given wavelength to<br />
achieve these goals.<br />
Ratio [DN/Exp. Time]<br />
2.2<br />
2.0<br />
1.8<br />
1.6<br />
1.4<br />
1.2<br />
1.0<br />
0.80<br />
0.94<br />
0 1000 2000 3000 4000 5000 6000<br />
The microscope response was uniform to with 0.2 % over the central 90 % <strong>of</strong> the CCD array; the ASR, averaged over the<br />
central 25 by 25 pixels, is shown in Fig. 8. Because <strong>of</strong> the smaller non-linear correction, the better pixel to pixel uniformity<br />
<strong>and</strong> the 12 bit digitization, we estimate the relative combined st<strong>and</strong>ard uncertainty in the microscope ASR measurement to be<br />
approximately 1 %.<br />
3.4 Spectrograph Calibration<br />
1.04<br />
1.02<br />
1<br />
0.98<br />
0.96<br />
Exposure Time [ms]<br />
Fig. 6. Digital microscope exposure time correction.<br />
Ratio [DN+10/Exp. Time]<br />
0.0<br />
0.9<br />
0.0 0.2 0.4 0.6 0.8 1.0<br />
Spectrographs are typically calibrated for spectral radiance responsivity against broad-b<strong>and</strong> sources such as lamp-illuminated<br />
integrating sphere sources (ISSs) <strong>and</strong> plaques. Stray light, wavelength errors, <strong>and</strong> lack <strong>of</strong> knowledge <strong>of</strong> the single pixel<br />
relative responsivity all give rise to increased uncertainties in the calibration <strong>and</strong> subsequent operation <strong>of</strong> these instruments.<br />
Many <strong>of</strong> these sources <strong>of</strong> calibration error can be greatly reduced or eliminated using tunable, monochromatic laser sources in<br />
place <strong>of</strong> conventional broad-b<strong>and</strong> sources.<br />
Proc. SPIE Vol. 4306<br />
Camera Signal [DN]<br />
4.0 10 3<br />
3.5 10 3<br />
3.0 10 3<br />
2.5 10 3<br />
2.0 10 3<br />
1.5 10 3<br />
1.0 10 3<br />
5.0 10 2<br />
Sphere Radiance [a.u.]<br />
Fig. 7. Microscope response linearity.<br />
1.4<br />
1.3<br />
1.2<br />
1.1<br />
1<br />
Correction Factor
A dual-spectrograph radiometer was calibrated on SIRCUS for radiance responsivity over the spectral range from 400 nm to<br />
850 nm. Details <strong>of</strong> the calibration are described elsewhere [4, 5]. In this instrument, radiation enters the spectrograph<br />
through an entrance slit, is dispersed using a grating, <strong>and</strong> imaged onto the CCD array using a mirror, as shown in Fig. 9. For<br />
excitation using monochromatic radiation, the image<br />
formed is a line reflecting the image <strong>of</strong> the entrance slit<br />
on the CCD (Fig. 10). <strong>Note</strong> that the image is spread out<br />
M2<br />
Responsivity [DN/s/(W/cm2/sr)]<br />
1.0 10 9<br />
8.0 10 8<br />
6.0 10 8<br />
4.0 10 8<br />
2.0 10 8<br />
Grating<br />
0.0<br />
300 400 500 600 700 800<br />
CCD<br />
camera<br />
Wavelength [nm]<br />
Fig. 8. ASR <strong>of</strong> digital microscope.<br />
Entrance Slit<br />
over several pixels in the horizontal (dispersion)<br />
direction, is not centered vertically on the CCD array, <strong>and</strong><br />
shows a pronounced curvature (Fig. 11). By tuning the<br />
excitation wavelength, the image moves across the array<br />
<strong>and</strong> each pixel’s ASR can be determined. In this work,<br />
we measured the responsivity <strong>of</strong> the averaged central 100<br />
pixels in each column. Eq. 4 was modified to:<br />
Ri (λ o ) = Si L(λ M1<br />
o ) , (5)<br />
Fig. 9. Spectrograph optical layout.<br />
where i now refers to the particular column in the array.<br />
In Fig. 12, we show the absolute spectral responsivity,<br />
Ri(λ), for columns 243 – 247 over the wavelength range<br />
from 735 nm to 750 nm. We measured a 0.8 nm<br />
separation between the maximum responsivity <strong>of</strong> adjacent pixels <strong>and</strong> nominal single pixel b<strong>and</strong>width <strong>of</strong> 2 nm. The curvature<br />
in the spectrograph image, Fig. 11 gave rise to the pronounced shoulder observed at shorter wavelengths in the ASR. This<br />
shoulder in the single pixel ASR was attributed to the CCD not being located at the spectrograph image plane. We estimate<br />
the relative combined st<strong>and</strong>ard uncertainty in the calibration to be approximately 3 %. <strong>Note</strong> that the determination <strong>of</strong> each<br />
pixel’s ASR is difficult to obtain using any technique other than the tunable-laser-based ISS approach developed on SIRCUS.<br />
4. SUMMARY<br />
We have developed a flexible, detector-based calibration facility using tunable laser sources <strong>and</strong> high accuracy reference<br />
st<strong>and</strong>ard detectors for the irradiance <strong>and</strong> radiance responsivity calibration <strong>of</strong> digital imaging systems. We have calibrated a<br />
number <strong>of</strong> instruments on this facility, <strong>and</strong> presented results for a digital camera, a digital microscope <strong>and</strong> a digital<br />
spectrograph. This approach has several advantages over conventional calibration techniques using broad-b<strong>and</strong> sources,<br />
including uniform, monochromatic irradiance <strong>and</strong> radiance sources; lower wavelength uncertainty; no stray light contribution<br />
Proc. SPIE Vol. 4306 19
20<br />
Slit height [mm]<br />
14<br />
12<br />
10<br />
8<br />
6<br />
4<br />
2<br />
0<br />
550 600 650 700 750 800 850 900 950<br />
0 100 200 300 400 500<br />
column<br />
0<br />
Wavelength [nm]<br />
10000 20000 30000 40000<br />
[ADU s -1 ]<br />
Fig. 10. Spectrograph image <strong>of</strong> ISS with 745 nm excitation.<br />
Proc. SPIE Vol. 4306<br />
Responsivity<br />
[(ADU s -1 pixel -1 W -1 cm 2 sr]<br />
1.5 10 9<br />
1 10 9<br />
5 10 8<br />
50<br />
100<br />
150<br />
200<br />
250<br />
300<br />
350<br />
400<br />
450<br />
500<br />
0<br />
735 740 745 750<br />
Wavelength [nm]<br />
244 246 248 250<br />
column<br />
0 10000 20000 30000 40000<br />
Fig. 11. Exp<strong>and</strong>ed view <strong>of</strong> spectrograph<br />
image <strong>of</strong> ISS with 745 nm excitation.<br />
C243<br />
C244<br />
C245<br />
C246<br />
C247<br />
Fig. 12. Absolute spectral responsivity <strong>of</strong> columns 243 to 247.
to the signal; <strong>and</strong> the ability to determine each pixel’s responsivity. By using this approach, uncertainties in the radiometric<br />
calibration <strong>of</strong> DIS’s can be reduced by a factor <strong>of</strong> 2 or greater over conventional calibration techniques.<br />
5. ACKNOWLEDGMENTS<br />
We would like to thank Carol Johnson for useful discussions <strong>and</strong> acknowledge support for this work by the U. S. Air Force<br />
Metrology under contracts 97-421 <strong>and</strong> 98-439.<br />
6. REFERENCES<br />
1 S. W. Brown, G. P. Eppeldauer, <strong>and</strong> K. R. Lykke, “<strong>NIST</strong> facility for spectral irradiance <strong>and</strong> radiance responsivity<br />
calibrations with uniform sources,” Metrologia 37, 579-582 (2000).<br />
2 G. P. Eppeldauer <strong>and</strong> D.C. Lynch, "Opto-mechanical <strong>and</strong> electronic design <strong>of</strong> a tunnel-trap Si-radiometer," J. Res. Natl.<br />
Inst. St<strong>and</strong>. Technol. (in press).<br />
3 T. R. Gentile, J. M. Houston, J. E. Hardis, C. L. Cromer, <strong>and</strong> A. C. Parr, “<strong>National</strong> <strong>Institute</strong> <strong>of</strong> <strong>St<strong>and</strong>ards</strong> <strong>and</strong> Technology<br />
high accuracy cryogenic radiometer,” Appl. Opt, 35, 1056-1068 (1996).<br />
4 C. Habauzit, et al., “Radiometric characterization <strong>and</strong> absolute calibration <strong>of</strong> the Marine Optical System (MOS) bench<br />
unit,” J. Atmos. <strong>and</strong> Ocean. Technol., to be submitted.<br />
5 S. W. Brown, C. Habauzit, B. C. Johnson, <strong>and</strong> K. R. Lykke, “Tunable-laser-based calibration <strong>of</strong> a digital spectrograph,”<br />
Appl. Opt., to be submitted.<br />
6 T. C. Larason, S. S. Bruce, <strong>and</strong> A. C. Parr, Spectroradiometric Detector Measurements, Natl. Inst. St<strong>and</strong>. Technol. Spec.<br />
Publ. 250-41, U. S. Government Printing Office, Washington, DC, 1998.<br />
7 Yoshihiro Ohno, Photometric Calibrations, Natl. Inst. St<strong>and</strong>. Technol. Spec. Publ. 250-37, U. S. Government Printing<br />
Office, Washington, DC, 1997.<br />
8 Steven Grantham, <strong>NIST</strong>, personal communication.<br />
Proc. SPIE Vol. 4306 21
Uniform calibration <strong>of</strong> night vision goggles <strong>and</strong> test sets<br />
George P. Eppeldauer<br />
Optical Technology Division<br />
<strong>National</strong> <strong>Institute</strong> <strong>of</strong> <strong>St<strong>and</strong>ards</strong> <strong>and</strong> Technology<br />
Gaithersburg, Maryl<strong>and</strong> 20899-8441<br />
ABSTRACT<br />
There are orders <strong>of</strong> magnitude differences between the ~0.1 % (k=2) uncertainty <strong>of</strong> <strong>NIST</strong> reference detector calibrations<br />
<strong>and</strong> the uncertainty <strong>of</strong> night vision (NV) goggle measurements. <strong>NIST</strong> developed a night vision radiometer calibration<br />
facility <strong>and</strong> NV radiometer transfer st<strong>and</strong>ards. The transfer st<strong>and</strong>ards, that propagate the radiance responsivity scale to<br />
the military primary st<strong>and</strong>ards laboratories, are calibrated against a <strong>NIST</strong> reference radiometer. The reference<br />
radiometer has been calibrated on the <strong>NIST</strong> Spectral Comparator Facility (SCF) for spectral power <strong>and</strong> irradiance<br />
responsivities. Spectral considerations are discussed to lower the uncertainties <strong>of</strong> the radiance responsivity scale transfer<br />
to the test sets <strong>and</strong> then to the goggles. Since direct determination <strong>of</strong> the final uncertainties in goggle calibrations <strong>and</strong><br />
measurements is difficult, models have been made to estimate the most important uncertainty components based on<br />
individual spectral measurements <strong>of</strong> the source distributions <strong>and</strong> radiometer spectral responsivities. It is also shown, that<br />
because <strong>of</strong> source spectral mismatch problems, the goggle measurement uncertainty at applications can be much higher<br />
than at calibration. A suggestion is being made to mimic the no-moon (stars only) night sky radiation distribution using<br />
several LEDs in the test-sets to decrease the large spectral mismatch errors. A broad-b<strong>and</strong> correction factor has been<br />
developed to further decrease calibration uncertainty when the goggles to be used have different spectral responsivities<br />
than the st<strong>and</strong>ard. Geometrical considerations to optimize the radiance measurement angle <strong>and</strong> the out-<strong>of</strong>-target<br />
blocking are also discussed to decrease the uncertainty in the radiance responsivity transfer.<br />
Keywords: calibration, night vision goggle, radiance, radiometer, scale transfer, spectral responsivity, test-set<br />
1. INTRODUCTION<br />
The night vision (NV) goggles are the key sensors for human beings for night operations. The goggles have several<br />
technical parameters that can be used to characterize them. The most important parameters are spatial resolution, field<strong>of</strong>-view,<br />
image distortion, transfer-gain (output luminance / input radiance), <strong>and</strong> spectral responsivity. The spectral<br />
responsivity is one <strong>of</strong> the most critical parameter for flying safety. The MIL-STD-3009 [1], written in 2001, shows the<br />
assumed night vision imaging system (NVIS) spectral response characteristics that shall be used to define NVIS<br />
compatibility criteria with aircraft lighting. The st<strong>and</strong>ard extends the NVIS radiance requirements from the previous<br />
defining document [2]. Though a full framework would be necessary for NVIS radiance measurement requirements, the<br />
new (2001) document does not address calibration aspects <strong>of</strong> the new NVIS technology.<br />
Because <strong>of</strong> the lack <strong>of</strong> st<strong>and</strong>ardized goggle calibrations, individually applied maintenance actions are performed, such<br />
as pass/fail tests to determine whether the goggle will perform as expected when it is used (or as it has performed in the<br />
past). At present, there are no st<strong>and</strong>ard criteria that state the goggle gain must be higher than some specified value. The<br />
users are tasked to locally establish a value based on past performance <strong>of</strong> the goggles that will satisfy their needs. There<br />
are some initial recommendations for each goggle type, but it is still the responsibility <strong>of</strong> the users to establish their own<br />
test methods. Also, in the past two decades, different source distributions have been applied in different test-sets. The<br />
earlier used tungsten lamps were replaced with LEDs. Some manufacturers use an 815 nm (peak) light emitting diode<br />
(LED) irradiating source in the test-sets when determining the transfer gain <strong>of</strong> the goggles. The transfer gain is the<br />
luminance at the eye-piece <strong>of</strong> the goggle divided by the radiance viewed by the goggle. The luminance is a photometric<br />
quantity that can be measured easily. However, the radiance viewed by the goggle has a spectral distribution <strong>and</strong> it is<br />
measured by the goggle which has a spectral responsivity different from the human visual system (the CIE st<strong>and</strong>ard<br />
photometric observer). Accordingly, the radiance viewed by the goggle needs a (broad-b<strong>and</strong>) radiometric measurement<br />
Electro-Optical <strong>and</strong> Infrared Systems: Technology <strong>and</strong> Applications IV, edited by David A. Huckridge, Reinhard R. Ebert,<br />
Proc. <strong>of</strong> SPIE Vol. 6737, 67370M, (2007) · 0277-786X/07/$18 · doi: 10.1117/12.737814<br />
Proc. <strong>of</strong> SPIE Vol. 6737 67370M-1
where photometric units cannot be used. The spectral distribution <strong>of</strong> the viewed radiance (in the test-sets) has not been<br />
st<strong>and</strong>ardized. The manufacturers claim that the calibration <strong>of</strong> the goggles using either a tungsten (close to Planckian)<br />
distribution or a narrow-b<strong>and</strong> source distribution is satisfactory because the responsivity <strong>of</strong> the goggles is constant<br />
versus wavelength. They do not examine the errors when the broad-b<strong>and</strong> night sky radiation is measured (at application)<br />
as compared to the narrow-b<strong>and</strong> distribution <strong>of</strong> the LED (at calibration). According to the relative spectral responsivity<br />
characteristics <strong>of</strong> Classes A, B, <strong>and</strong> C in the MIL-STD-3009, the responsivity curves look flat (constant versus<br />
wavelength) because <strong>of</strong> the logarithmic responsivity scale used for illustration. However, as shown in Fig. 1, the<br />
spectral responsivity <strong>of</strong> different generation Gen-3 goggles can change significantly [3]. As an example, the Class-A<br />
st<strong>and</strong>ard <strong>and</strong> realized filter transmittance (cut-on) curves are also shown that will limit the goggle responsivities at the<br />
short wavelength side. A model is shown below to show the errors that the 815 nm LED source application <strong>and</strong> the<br />
constant goggle responsivity assumption can produce in night sky radiation measurements. The night sky irradiance<br />
distributions for full moon <strong>and</strong> no moon (only stars) [4] <strong>and</strong> the normalized spectral power distribution <strong>of</strong> a test set LED<br />
are shown in Fig. 2a on a logarithmic scale <strong>and</strong> in Fig. 2b on a linear scale (the full moon distribution is not shown here)<br />
to illustrate the difference in the wavelength coverage for the spectral range where the goggles are sensitive.<br />
320<br />
280<br />
240<br />
200<br />
160<br />
120<br />
80<br />
40<br />
0<br />
Gen-3 early 1990<br />
Gen-3 mid 1990<br />
Gen-3 present<br />
0<br />
400 500 600 700 800 900<br />
Wavelength [nm]<br />
Class-A transmittance<br />
Class-A 625 nm transm ITT<br />
Fig. 1. Spectral responsivity curves <strong>of</strong> different generation Gen-3 goggles <strong>and</strong> the<br />
transmittance curves <strong>of</strong> the st<strong>and</strong>ardized Class-A <strong>and</strong> realized ITT [5] minus-blue filter.<br />
A recently published work examined the impact <strong>of</strong> goggle spectral responsivity changes on NVIS compatibility to<br />
aircraft interior lighting [6]. The goggle responsivity changes are caused by the changes introduced in image tube<br />
parameters <strong>and</strong> objective lens coatings. In the referenced publication, the authors believed it is necessary to develop <strong>and</strong><br />
<strong>of</strong>fer a more complete framework for NVIS related radiometric calculations. They started to explore the cockpit lighting<br />
compatibility issues associated with differing night-vision goggle spectral responsivity distributions. In addition to the<br />
relative spectral responsivity curves <strong>of</strong> the Class A <strong>and</strong> B goggles st<strong>and</strong>ardized in the MIL-STD-3009, they calculated<br />
the Class C relative spectral responsivity curve, using the transmission <strong>of</strong> the (“leaky green”) objective lens (from MIL-<br />
STD-3009), <strong>and</strong> the spectral responsitivity <strong>of</strong> an ITT image intensifier (“hot”) tube responsive from 450 nm to 950 nm.<br />
In spectrally broad-b<strong>and</strong> measurements, such as goggle calibrations, the detector spectral responsivities are to be<br />
st<strong>and</strong>ardized to perform uniform integrated responsivity (INR) measurements. Similarly to the st<strong>and</strong>ardized V(λ)<br />
function in photometry, the Class A, B, <strong>and</strong> C spectral responsivity curves can be used as reference goggle spectral<br />
Proc. <strong>of</strong> SPIE Vol. 6737 67370M-2<br />
1<br />
0.8<br />
0.6<br />
0.4<br />
0.2
distributions. The goggle signals can be calculated as the product <strong>of</strong> the goggle spectral responsivity <strong>and</strong> the source<br />
spectral distribution seen by the goggle. If the realized (manufactured) detector spectral responsivity is different than the<br />
Night sky irradiance LW/cm<br />
10 -6<br />
10 -7<br />
10 -8<br />
10 -9<br />
No moon irradiance<br />
Full moon irradiance<br />
normalized LED distribution<br />
500 600 700 800 900<br />
Wavelength [nm]<br />
1<br />
0.1<br />
1 10 -8<br />
8 10 -9<br />
6 10 -9<br />
4 10 -9<br />
2 10 -9<br />
0<br />
500 600 700 800 900<br />
Wavelength [nm]<br />
Fig. 2a. Spectral distribution curves <strong>of</strong> night sky Fig. 2b. Spectral distribution curves <strong>of</strong> night sky (no<br />
irradiance <strong>and</strong> a test-set LED on logarithmic scales. moon) irradiance <strong>and</strong> a test-set LED on linear scales.<br />
st<strong>and</strong>ardized responsivity, large systematic measurement errors can be obtained if the source distribution to be measured<br />
is very different than the distribution <strong>of</strong> the source used at calibration.<br />
To avoid these large errors, in addition to the st<strong>and</strong>ardization <strong>of</strong> the detector spectral responsivity, the spectral power<br />
distribution <strong>of</strong> the source at calibration can be st<strong>and</strong>ardized (similarly to the CIE Illuminant A, D65, <strong>and</strong> other<br />
distribution functions) as well. In NV goggle calibrations, frequently an LED light source is used in the test-set. Since,<br />
the LED spectral power distribution is very different from the night sky distributions (during goggle applications), large<br />
goggle measurement errors can be obtained. The measurement uncertainties can be decreased if the source spectral<br />
distribution in the test-sets is st<strong>and</strong>ardized (at calibration) <strong>and</strong> the st<strong>and</strong>ardized spectral distribution is similar to the<br />
night sky radiation (at application). This st<strong>and</strong>ard source distribution function does not have to be equal to the different<br />
night sky radiation curves. It can be similar to those to obtain low calibration uncertainties. Similar considerations have<br />
been made in detector-based photometric <strong>and</strong> colorimetric calibrations [7]. This idea can be realized using several LEDs<br />
[8, 9] in a test-set instead <strong>of</strong> using one LED (that usually peaks around 815 nm). Also, a broad-b<strong>and</strong> correction factor<br />
(similar to the color correction factor in photometry [7]) that can be easily applied for goggle spectral responsivities that<br />
are different than the st<strong>and</strong>ard curve, can be developed to decrease goggle calibration uncertainty.<br />
Applying the above discussed INR measurement considerations, the goggle transfer-gain calibrations can be made in a<br />
uniform way with low uncertainties. The suggested goggle calibration system is based on the st<strong>and</strong>ardized goggle<br />
responsivity functions in the MIL-STD-3009 <strong>and</strong> it is traceable to the SI units through the <strong>NIST</strong> detector responsivity<br />
scales. The suggested uniform calibration system could significantly improve the goggle measurement uncertainties.<br />
2. THE <strong>NIST</strong> REFERENCE DETECTORS AND RESPONSIVITY SCALES<br />
Participation <strong>of</strong> <strong>NIST</strong> in the night vision goggle calibration program started in the late 1980s after <strong>NIST</strong> developed the<br />
high sensitivity silicon radiometers [10]. The noise equivalent photocurrent <strong>of</strong> these radiometers was 10 -16 A, similar to<br />
Proc. <strong>of</strong> SPIE Vol. 6737 67370M-3<br />
1<br />
0.8<br />
0.6<br />
0.4<br />
0.2
the photomultiplier tubes the Army used for goggle calibrations before acquiring the <strong>NIST</strong> radiometer st<strong>and</strong>ards. A few<br />
years later <strong>NIST</strong> developed a night vision detector (radiometer) calibration facility (NVRCF) funded by the Navy. The<br />
<strong>NIST</strong> responsivity scale is derived from electrical-substitution cryogenic radiometers. Silicon trap-detector transfer<br />
st<strong>and</strong>ards are calibrated against these primary st<strong>and</strong>ards in radiant power measurement mode. The trap detectors are<br />
equipped with precision apertures to convert the power responsivity into irradiance responsivity. The trap detectors have<br />
relative combined exp<strong>and</strong>ed uncertainties <strong>of</strong> less than 0.1 % (k=2) [11]. The trap detectors propagate the reference<br />
responsivity scale to two other <strong>NIST</strong> responsivity calibration facilities. The first one, the Spectral Irradiance <strong>and</strong><br />
Radiance Responsivity Calibration using Uniform Sources (SIRCUS) facility [11] is an extended version <strong>of</strong> the NVRCF<br />
<strong>and</strong> it can be used for general purpose detector irradiance <strong>and</strong> radiance responsivity calibrations. The other facility is the<br />
Spectral Comparator Facility (SCF) [12] which was used to calibrate the <strong>NIST</strong> night vision reference radiometer for<br />
both power <strong>and</strong> irradiance responsivity [13]. Several NV radiometer transfer st<strong>and</strong>ards were also developed at <strong>NIST</strong> for<br />
the Army, Navy, <strong>and</strong> the Air Force, to propagate the <strong>NIST</strong> radiance responsivity scale to the military primary st<strong>and</strong>ards<br />
laboratories. The radiance responsivity <strong>of</strong> these radiometers is typically determined at the NVRCF. The <strong>NIST</strong><br />
luminance scale is transferred separately to the three services [14].<br />
2.1 The <strong>NIST</strong> Reference Radiometer<br />
The <strong>NIST</strong> reference radiometer operates in irradiance measurement mode. The cross-section <strong>of</strong> the radiometer front is<br />
shown in Fig. 3. In front <strong>of</strong> the radiant power measuring silicon photodiode, there is a diffuser <strong>and</strong> a thin aperture<br />
attached to the front <strong>of</strong> the diffuser. The aperture determines the reference plane <strong>of</strong> irradiance measurements. The<br />
diffuser dominates the directional responsivity <strong>of</strong> the radiometer. The input geometry was optimized experimentally to<br />
obtain an angular responsivity close to the theoretical cosine function [13]. The field-<strong>of</strong>-view (FOV) limiter rejects<br />
optical radiation outside the radiometer FOV. The detector is temperature stabilized with a thermoelectric (TE) cooler at<br />
FO V limiter<br />
Aperture<br />
Diffrsé<br />
Thermoelectric<br />
cooler<br />
Silicon<br />
photodiode<br />
Fig. 3. The cross-section <strong>of</strong> the <strong>NIST</strong> night vision reference radiometer<br />
25 o C. The angular responsivity was measured using a small inc<strong>and</strong>escent lamp at a separation <strong>of</strong> about 3 m <strong>and</strong> the<br />
radiometer was rotated around the center <strong>of</strong> the aperture. The measurement results are shown on Fig. 4. The solid line is<br />
the cosine function <strong>and</strong> the open circles are the measured data points. The results show, that the irradiance meter has an<br />
angular responsivity very close to the cosine function in a FOV <strong>of</strong> 11.6 o (full angle).<br />
Proc. <strong>of</strong> SPIE Vol. 6737 67370M-4
elative irradiance response<br />
1.000<br />
0.999<br />
0.998<br />
0.997<br />
0.996<br />
0.995<br />
cosine<br />
meter<br />
0.994<br />
-5.8 -4.35 -2.9 -1.45 0 1.45 2.9 4.35 5.8<br />
angle [degree]<br />
Fig. 4. Relative angular responsivity <strong>of</strong> the irradiance measuring <strong>NIST</strong> radiometer st<strong>and</strong>ard<br />
2.2 The NV radiometer transfer st<strong>and</strong>ard<br />
The NV radiometer transfer st<strong>and</strong>ards, that propagate the <strong>NIST</strong> responsivity scale to the military primary st<strong>and</strong>ard<br />
laboratories, were developed at <strong>NIST</strong> to perform uniform spectral responsivity transfer <strong>and</strong> high sensitivity. The cross<br />
section <strong>of</strong> the radiometers are shown in Figs. 5 <strong>and</strong> 6. The first generation radiometer is shown in Fig. 5. Figure 6 shows<br />
the cross section <strong>of</strong> the second generation radiometer with a 90 o rotation relative to the view for the photodiode holding<br />
block in Fig. 5. In both radiometers, the silicon photodiode is mounted in a temperature stabilized copper holder. The<br />
copper holder has a threaded hole where the photodiode can be mounted at a given position relative to the input optics<br />
using retainer rings <strong>and</strong> washers. Three nylon screws pull the copper holder against a copper heat sink with a TE<br />
cooler/heater in between. The heat sink is attached to the Aluminum housing. The photocurrent meter is mounted in a<br />
separate housing (not shown in these figures) which is attached to the bottom <strong>of</strong> the front part <strong>of</strong> the measuring head<br />
using a four-pin connector. The leads <strong>of</strong> the TE cooler <strong>and</strong> a thermistor (not shown) are soldered to the side connector.<br />
The input optics attached to the front <strong>of</strong> the radiometer is different in the two figures. The widely used PVS-7 input<br />
optics is shown in Fig. 6 <strong>and</strong> a simplified input optics (with a radiance measurement angle <strong>of</strong> α) is shown in Fig. 5. The<br />
design considerations <strong>and</strong> the angular radiance responsivity measurements are discussed below in Section 3.2. The<br />
silicon photodiode has high power responsivity in the spectral response range <strong>of</strong> the NV goggles. The high photodiode<br />
shunt resistance produces low amplification for the amplifier noise in the photocurrent meter, resulting in high<br />
sensitivity for the NV radiometer.<br />
The picture <strong>of</strong> the first generation radiometer transfer st<strong>and</strong>ard with the PVS-7 input optics is shown in Fig. 7.<br />
2.3 The NV radiometer calibration facility (NVRCF)<br />
The NV radiometer transfer st<strong>and</strong>ards are calibrated for radiance responsivity at the NVRCF. The scheme <strong>and</strong> the<br />
picture <strong>of</strong> the inside arrangement <strong>of</strong> the NVRCF are shown in Figs. 8 <strong>and</strong> 9. The st<strong>and</strong>ard for the calibration is the <strong>NIST</strong><br />
reference radiometer. The uniform source for the calibration transfer is a 20 cm diameter integrating sphere illuminated<br />
by a light source. The light source can be either a diode laser (as shown in Fig. 8) or a light emitting diode (LED)<br />
attached to the entrance port <strong>of</strong> the sphere. For a diode laser, both the temperature <strong>and</strong> the current are controlled, for an<br />
LED, only the current is regulated. A silicon monitor detector compensates for intensity changes <strong>of</strong> the sources.<br />
Proc. <strong>of</strong> SPIE Vol. 6737 67370M-5
α<br />
aperture<br />
stop<br />
biconvex lens<br />
Si photodiode<br />
(field stop)<br />
focal plane<br />
Retainer Connector for<br />
temperature control<br />
I Silicon Copper holder<br />
photodiode<br />
/<br />
on top <strong>of</strong> TE<br />
cooler/heater<br />
Detector<br />
output<br />
connector<br />
—Nylon screws<br />
— Aluminum<br />
housing<br />
Fig. 5. Cross section <strong>of</strong> the front head <strong>of</strong> the NV Fig. 6. Cross section <strong>of</strong> the front head <strong>of</strong> the new<br />
radiometer transfer st<strong>and</strong>ard using a biconvex lens generation radiometer transfer st<strong>and</strong>ard with the<br />
input optics. PVS-7 input optics.<br />
Fig. 7. Picture <strong>of</strong> the NV radiometer transfer st<strong>and</strong>ard with the PVS-7 input optics <strong>and</strong> the attached amplifier unit.<br />
The radiance, L, <strong>of</strong> the integrating sphere source is determined from a measurement made with the <strong>NIST</strong> reference<br />
radiometer. The flux transfer calculation is based on the geometry <strong>of</strong> the flux transfer unit. The reference radiometer is<br />
calibrated for spectral radiant power responsivity ss(λ) [A/W] traceable to the <strong>NIST</strong> spectral responsivity scale [12].<br />
The radiant power responsivity for a given light source is calculated from ss(λ) <strong>and</strong> the spectral distribution <strong>of</strong> the<br />
source. The radiant power responsivity <strong>of</strong> the reference radiometer for the LED is:<br />
∫<br />
s s, LED =<br />
S(<br />
λ)<br />
ss<br />
( λ)<br />
dλ<br />
λ<br />
S(<br />
λ)<br />
dλ<br />
(1)<br />
∫<br />
λ<br />
heat<br />
sink<br />
TE cooler<br />
where S(λ) is the relative spectral power distribution <strong>of</strong> the LED.<br />
Proc. <strong>of</strong> SPIE Vol. 6737 67370M-6
Heat<br />
sink<br />
F,<br />
£J<br />
Transfer<br />
- - st<strong>and</strong>ard<br />
radiometer<br />
Fig. 8. Scheme <strong>of</strong> the NV transfer st<strong>and</strong>ard radiometer calibration at the NVRCF.<br />
Fig. 9. Picture <strong>of</strong> the <strong>NIST</strong> Night Vision Radiometer Calibration Facility.<br />
The cosine-corrected reference radiometer has a sufficiently large acceptance angle for the flux transfer. The irradiance<br />
responsivity <strong>of</strong> the reference radiometer is obtained from spatial responsivity integrals determined by a raster scanning<br />
procedure. The effective area <strong>of</strong> the radiometer aperture is given by the ratio <strong>of</strong> its total irradiance responsivity to the<br />
radiant power responsivity in the center <strong>of</strong> the aperture.<br />
The radiance L <strong>of</strong> the sphere exit port is determined from the radiant power P from the source incident on the detector,<br />
<strong>and</strong> the geometric extent G:<br />
Proc. <strong>of</strong> SPIE Vol. 6737 67370M-7
where<br />
G = 2<br />
P<br />
L = (2)<br />
G<br />
2<br />
π ⎡ 2 2 2<br />
⎢(<br />
) ⎧ 2 2 2 2<br />
+ rS<br />
+ rD<br />
− ⎨(<br />
d + rS<br />
+ rD<br />
)<br />
1/<br />
2<br />
2 2 ⎤<br />
d − 4r ⎫<br />
S rD<br />
⎬ ⎥<br />
(3)<br />
⎢⎣<br />
⎩<br />
⎭ ⎥⎦<br />
The rS is the radius <strong>of</strong> the source (sphere) exit port aperture (≈ 27 mm), rD is the radius determined from the effective<br />
area <strong>of</strong> the radiometer aperture (≈ 4 mm), <strong>and</strong> d is the distance between the source aperture <strong>and</strong> the radiometer aperture<br />
(≈ 22.6 cm). In our case, the units are W for P, W cm -2 sr -1 for L, <strong>and</strong> cm 2 sr for G.<br />
As the second step, the NV radiometer transfer st<strong>and</strong>ard, with the attached PVS-7 input optics, is calibrated for the exit<br />
port radiance. The transfer st<strong>and</strong>ard radiometer (as shown in Fig. 8) is placed <strong>and</strong> aimed at the center <strong>of</strong> the sphere exit<br />
port. The separation between the sphere aperture <strong>and</strong> the front <strong>of</strong> the PVS-7 optics is only 50 mm because <strong>of</strong> the poor<br />
out-<strong>of</strong>-target rejection <strong>of</strong> the PVS-7 equipped radiometer (see below in Fig. 13). At this separation, the sphere radiation<br />
overfills the radiance measurement angle <strong>of</strong> the transfer st<strong>and</strong>ard <strong>and</strong> the surrounding angular region where the device<br />
has undue sensitivity. The radiance responsivity <strong>of</strong> the transfer st<strong>and</strong>ard is determined as the ratio <strong>of</strong> its output current<br />
to the radiance <strong>of</strong> the sphere exit port calibrated against the reference radiometer.<br />
The improvement <strong>of</strong> the out-<strong>of</strong>-target rejection using a simplified (biconvex) input optics (discussed in Section 3.2)<br />
decreased the 2.4 % (k=2) uncertainty component <strong>of</strong> the distance dependent radiance responsivity <strong>of</strong> the PVS-7<br />
equipped radiometer to less than 1 % (k=2). The combined relative exp<strong>and</strong>ed uncertainty <strong>of</strong> the radiance responsivity<br />
calibrations using the PVS-7 input optics is 3.0 % (k=2).<br />
3. SCALE TRANSFER<br />
The military calibration laboratories further transfer the radiance responsivity from the NV radiometer transfer st<strong>and</strong>ard<br />
to their field NV radiometers. The field radiometers are similar to the construction <strong>of</strong> the above discussed NV<br />
radiometer transfer st<strong>and</strong>ard. The radiance responsivity transfer for the field radiometers is made using integrating<br />
sphere sources illuminated possibly with the same LED type used in the test sets. The field NV radiometers are used to<br />
calibrate the radiance <strong>of</strong> the test-sets. The goggles are calibrated against the test-set radiance. The spectral distribution<br />
<strong>of</strong> the test-set radiance is dominated by the LED spectral power distribution which is much narrower than both the night<br />
sky radiation <strong>and</strong> the goggle spectral responsivity range.<br />
In order to decrease calibration <strong>and</strong> measurement uncertainties it is necessary to analyze the spectral <strong>and</strong> geometrical<br />
issues during the radiance scale transfer from the <strong>NIST</strong> NVRCF to the military primary st<strong>and</strong>ard laboratories. The<br />
results <strong>and</strong> conclusions <strong>of</strong> the analysis below can be applied to the scale transfer from the military primary st<strong>and</strong>ard<br />
laboratories to the field test-sets. When the radiance scale transfer to the test-sets is performed according to the<br />
considerations discussed below smaller than 10 % (k=2) test-set radiance calibration uncertainties can be achieved.<br />
Otherwise, the uncertainties can be significantly higher. The additional uncertainties <strong>of</strong> the radiance scale propagation to<br />
goggle calibrations <strong>and</strong> goggle field measurements are also discussed below.<br />
3.1 Spectral considerations<br />
Spectral problems during the scale propagation from the <strong>NIST</strong> reference detector to test-sets, <strong>and</strong> then from the test-sets<br />
to the night vision goggles, can significantly increase the calibration uncertainties. However, when the spectral<br />
characteristics are different at the goggle calibration compared to the follow-on goggle applications, the goggle<br />
performance can be very different. To avoid these differences, the spectral issues during the radiance responsivity scale<br />
transfer <strong>and</strong> the following goggle calibrations <strong>and</strong> applications are to be analyzed.<br />
Proc. <strong>of</strong> SPIE Vol. 6737 67370M-8
3.1.1 Scale transfer from <strong>NIST</strong> to field test sets<br />
During the scale transfer, broad-b<strong>and</strong> detectors (radiometers) measure broad-b<strong>and</strong> sources. Photometric measurements,<br />
where the spectral responsivity <strong>of</strong> the photometer is st<strong>and</strong>ardized [7], are a good example to make uniform broad-b<strong>and</strong><br />
measurements. In the above discussed radiometric scale transfer, a similar st<strong>and</strong>ardization can be performed if the same<br />
silicon detector type is used in all night vision transfer st<strong>and</strong>ard radiometers.<br />
The responsivity transfer errors were modeled between LED measurements <strong>and</strong> laser calibrations using two different<br />
types <strong>of</strong> silicon photodiodes in the transfer st<strong>and</strong>ard radiometer. Two (available) LED source distributions were selected<br />
with similar peak wavelengths (692 nm <strong>and</strong> 697 nm) <strong>and</strong> different spectral coverage. Two lasers were used as the third<br />
type <strong>of</strong> source distribution <strong>and</strong> tuned to the two LED peak wavelengths. Figure 10 shows the Si photodiode spectral<br />
responsivities <strong>and</strong> the two LED spectral power distributions <strong>and</strong> one laser tuned to the peak <strong>of</strong> the 697 nm LED.<br />
Equation 1 can be used to calculate the INR <strong>of</strong> a detector for an LED source. For the laser lines, instead <strong>of</strong> the INR, the<br />
laser responsivity <strong>of</strong> the detector at the laser wavelength is used.<br />
Four INRs were calculated first (using Eq. 1) for two Hamamatsu (1227 <strong>and</strong> 1337) silicon photodiodes <strong>and</strong> the two<br />
LEDs. Then, each INR was compared to the laser responsivity by calculating the percent error between the INR <strong>and</strong> the<br />
laser (reference) responsivity. These examples are shown in Table 1 to illustrate the responsivity error propagations<br />
caused by using a different source (LED) at application (or scale derivation) than at calibration (laser). The results show<br />
that the errors are smaller with the 1337 detector than with the 1227. The responsivity <strong>of</strong> the 1337 detector is linear<br />
versus wavelength <strong>and</strong> it is similar to the unity quantum efficiency line. The 1227 detector has a lowered responsivity in<br />
the red <strong>and</strong> it is very different from a straight line. Also, the responsivity propagation errors are smaller when a narrow<br />
b<strong>and</strong> LED (like the 692 nm peak LED) is measured compared to the errors with the 697 nm (peak) LED which has a<br />
much wider spectral distribution. Utilizing the above considerations, the responsivity errors can be kept small in the<br />
responsivity scale propagation even if a laser is used at calibration <strong>and</strong> an LED is applied at scale derivations or field<br />
applications. This conclusion will not apply if more LEDs with different spectral distributions are used in the test-sets.<br />
1<br />
0.8<br />
0.6<br />
0.4<br />
0.2<br />
0<br />
0<br />
600 650 700 750 800 850 900<br />
Wavelength [nm]<br />
697 nm peak LED<br />
692 nm peak LED<br />
0.6<br />
0.5<br />
['] ApA!suodsej jopejep !S<br />
Fig. 10. Spectral responsivity <strong>of</strong> two different Si detectors, <strong>and</strong> spectral power distributions <strong>of</strong><br />
two LEDs with similar peak wavelengths. A laser line is also shown tuned to the 697 nm (peak) LED.<br />
1227<br />
1337<br />
Proc. <strong>of</strong> SPIE Vol. 6737 67370M-9<br />
0.4<br />
0.3<br />
0.2<br />
0.1
INR (697 nm LED & 1227)<br />
---------------------------------<br />
697 nm laser resp. <strong>of</strong> 1227<br />
4.6 %<br />
Table 1.<br />
Percent errors between LED integrated responsivity <strong>and</strong> laser responsivity measurements<br />
for two different LEDs <strong>and</strong> two different silicon photodiodes.<br />
INR (692 nm LED & 1227)<br />
---------------------------------<br />
692 nm laser resp. <strong>of</strong> 1227<br />
0.6 %<br />
3.1.2 Scale transfer from test-sets to goggles<br />
INR (697 nm LED & 1337)<br />
---------------------------------<br />
697 nm laser resp. <strong>of</strong> 1337<br />
2.8 %<br />
INR(692 nm LED & 1337)<br />
---------------------------------<br />
692 nm laser resp. <strong>of</strong> 1337<br />
It is not enough to determine the radiance responsivity scale propagation uncertainties from the <strong>NIST</strong> NVRCF to the<br />
test-sets. When the radiance scale is propagated from the test-sets to the goggles, the spectral b<strong>and</strong>width <strong>of</strong> the test-set<br />
source distribution <strong>and</strong> the deviation <strong>of</strong> that from the source distributions at the goggle applications will have a major<br />
influence to the uncertainties <strong>of</strong> goggle calibrations <strong>and</strong> applications. The transfer-gain is one <strong>of</strong> the most important<br />
goggle characteristics that should be determined. It is the ratio <strong>of</strong> the output luminance (at the eye piece) to the input<br />
radiance viewed by the goggle. The luminance is usually transferred from the <strong>NIST</strong> photometric scale [14]. The<br />
luminance at the output depends on the goggle signal which depends not only on the test-set radiance but also on the<br />
radiance spectral distribution. In order to obtain the same (or similar) goggle transfer gains at both calibration <strong>and</strong><br />
application(s), the test-set source distribution should be similar to the source distributions at night vision applications.<br />
Third generation (Gen-3) goggles are being used for military applications because <strong>of</strong> the high resolution <strong>and</strong> gain<br />
produced by improved image intensifier tubes <strong>and</strong> the Gallium Arsenide coated photocathode that enhanced the<br />
sensitivity (responsivity). These goggles can measure very low-level radiation from the visible to about 900 nm. Filters<br />
with a cut-on edge <strong>of</strong> about 600 nm <strong>and</strong> 630 nm are deposited on the input optics <strong>of</strong> Class-A <strong>and</strong> B goggles. The Class-<br />
C goggles have a cut-on edge <strong>of</strong> about 660 nm, that allows the use <strong>of</strong> red cockpit lights without causing large goggle<br />
signals or saturation, <strong>and</strong> also a decreased narrow-b<strong>and</strong> transmittance at about 550 nm (called leaky green) that allows<br />
the goggle user to see a green display (monitor) through the goggle.<br />
The radiance scale is transferred to the goggles from test-sets. A frequently used test-set light-source that irradiates the<br />
reticle-plane, is an LED that peaks around 815 nm. There are other test sets using a different LED type that peaks at<br />
about 690 nm. In both cases, the spectral power distribution <strong>of</strong> the LED covers only part <strong>of</strong> the wavelength range where<br />
the goggle is responsive. Also, in applications, where the goggles measure reflections under night sky irradiance, the<br />
spectral power distribution is much broader than that <strong>of</strong> a test-set LED. According to the present calibration<br />
considerations, if one LED distribution is used (as a reference distribution) for all Gen-3 goggle calibrations, then the<br />
calibration results (the transfer gain <strong>of</strong> the goggle) will be uniform. The assumption here is that the individual goggle<br />
responsivities will not change significantly within the wavelength interval <strong>of</strong> the LED (<strong>of</strong> the test-set). Another problem<br />
is that the spectral distribution <strong>of</strong> the source to be measured by the goggle at applications is ignored. As an example, the<br />
night sky radiation is very different from the spectral power distribution <strong>of</strong> an LED. The night sky radiation has a very<br />
broad distribution that will cover the overall responsivity range <strong>of</strong> the goggle resulting in a much larger signal than the<br />
goggle signal for a given LED distribution (for normalized distributions). The larger goggle signal at application does<br />
not mean that the produced systematic error is in the good direction (that the transfer gain <strong>of</strong> the goggle will be much<br />
higher in field applications than at calibration) because in a correct goggle calibration, the source distribution should be<br />
similar to the distribution at applications. The goggle transfer-gain at calibration should be very similar to that at<br />
applications. A modeling is described below to estimate the errors for an LED source at calibration <strong>and</strong> the broad-b<strong>and</strong><br />
night sky radiation at application.<br />
The model shows the errors what an 815 nm LED source application (during calibration in the test sets) <strong>and</strong> the<br />
“constant goggle responsivity versus wavelength” assumption can produce in night sky irradiated measurements<br />
(applications). In the calculations, the night sky irradiance distributions for full-moon <strong>and</strong> no-moon (only stars) are used<br />
as source distributions during goggle applications. The normalized spectral power distribution <strong>of</strong> an 815 nm (peak) LED<br />
Proc. <strong>of</strong> SPIE Vol. 6737 67370M-10<br />
1 %
with the two different night sky distributions (already shown in Figs. 2a <strong>and</strong> 2b) are used. In this model, the wavelength<br />
coverage for the calibration-source <strong>and</strong> application-source distributions is very different in the shown spectral range<br />
where the goggles are responsive. The different spectral resposivities <strong>of</strong> Gen-3 night vision goggles from the early 1990,<br />
the mid 1990, <strong>and</strong> present, have also been shown in Fig. 1. Figure 1 also shows that the Class-A (st<strong>and</strong>ard <strong>and</strong> realized)<br />
filter transmittance (cut-on) curves that limit the goggle responsivities at the short wavelength end. All three goggles in<br />
Fig. 1 used in the modeling are used as Class-A goggles. Their responsivities are calculated as the product <strong>of</strong> the cut-on<br />
filter transmittance (the ITT filter curve) <strong>and</strong> the real spectral responsivity <strong>of</strong> the three Gen-3 goggles as shown in<br />
Fig. 1. The goggle responsivities are normalized at their peaks. Also, the spectral distributions <strong>of</strong> the night sky radiation<br />
in Figs. 2a <strong>and</strong> 2b are normalized at their peaks to make the spectral products. First, the signal, which is the product <strong>of</strong><br />
the goggle spectral responsivity <strong>and</strong> the source spectral distribution, was calculated for the (same) “Gen-3 present”<br />
responsivity <strong>and</strong> the three source distributions (the 815 nm LED, the full-moon irradiance, <strong>and</strong> the no-moon (stars only)<br />
irradiance). Then, the three different signals were compared by making two signal ratios to the reference signal (using<br />
the LED). The ratios in Table 2 show how large the goggle signal errors can be between calibration <strong>and</strong> (two)<br />
applications (using the “Gen-3 present” goggle). Following that, the “Gen-3 mid 1990” <strong>and</strong> then the “Gen-3 early<br />
1990” goggle responsivities were substituted for the spectral products in the numerators (for both the full-moon <strong>and</strong> nomoon<br />
source distributions) <strong>and</strong> the denominator <strong>of</strong> the ratios was the spectral product <strong>of</strong> the “Gen-3 present” goggle <strong>and</strong><br />
the 815 nm LED (used at calibration in the model).<br />
Table 2.<br />
Calculated ratios (systematic measurement errors) <strong>of</strong> the “Gen-3 present” goggle signals (when measuring<br />
two different night sky radiation distributions) to its reference signal (when measuring the 815 nm LED).<br />
INR (Gen-3 present & full-moon)<br />
------------------------------------------<br />
INR (Gen-3 present & 815 nm LED)<br />
6.00<br />
INR (Gen-3 present & no-moon)<br />
------------------------------------------<br />
INR (Gen-3 present & 815 nm LED)<br />
The calculation results show that a factor <strong>of</strong> six (equal to 500 %) error can be obtained with the “Gen-3 present” goggle<br />
when it is calibrated using an 815 nm LED <strong>and</strong> then applied to measure full-moon night sky radiation. When it<br />
measures no-moon (stars only) radiation distribution, the error (ratio) decreases to 1.41 which means a 41 %<br />
measurement error. This error is much smaller because <strong>of</strong> the very different distribution <strong>of</strong> the two night sky radiation<br />
curves as shown in Fig. 2a. The linear Y scale <strong>of</strong> Fig. 2b better illustrates that the no-moon radiation is much lower at<br />
the short wavelength range <strong>of</strong> the goggle than the full-moon radiation.<br />
In the second part <strong>of</strong> this model, the spectral responsivities <strong>of</strong> the two other Gen-3 goggles were substituted for the<br />
“Gen-3 present” goggle to model the errors caused by different goggle spectral responsivities. The INRs were calculated<br />
for both full moon <strong>and</strong> no-moon source distributions <strong>and</strong> were referenced again to the INR <strong>of</strong> “Gen-3 present” <strong>and</strong> the<br />
815 nm LED (as in Table 2). The ratios, that show the measurement errors using these other two goggles instead <strong>of</strong> the<br />
“Gen-3 present” goggle (with the assumption that only the “Gen-3 present” goggle was calibrated using the 815 nm<br />
LED source), are shown in Tables 3 <strong>and</strong> 4.<br />
Table 3.<br />
Calculated ratios (systematic measurement errors) <strong>of</strong> the “Gen-3 mid 1990” goggle signals (when measuring two<br />
different night sky source distributions) to the reference signal (the “Gen-3 present” measures the 815 nm LED).<br />
INR (Gen-3 mid 1990 & full-moon)<br />
------------------------------------------<br />
INR (Gen-3 present & 815 nm LED)<br />
5.88<br />
Proc. <strong>of</strong> SPIE Vol. 6737 67370M-11<br />
1.41<br />
INR (Gen-3 mid 1990 & no-moon)<br />
------------------------------------------<br />
INR (Gen-3 present & 815 nm LED)<br />
1.26
Table 4.<br />
Calculated ratios (systematic measurement errors) <strong>of</strong> the “Gen-3 early 1990” goggle signals (when measuring two<br />
different night sky source distributions) to the reference signal (the “Gen-3 present” measures the 815 nm LED).<br />
INR (Gen-3 early 1990 & full-moon)<br />
------------------------------------------<br />
INR (Gen-3 present & 815 nm LED)<br />
6.54<br />
INR (Gen-3 early 1990 & no-moon)<br />
-----------------------------------------<br />
INR (Gen-3 present & 815 nm LED)<br />
The ratios, in Tables 3 <strong>and</strong> 4, show that substituting the “Gen-3 present” goggle (used for calibration) with two other<br />
Gen-3 goggles (<strong>of</strong> different spectral responsivities), the goggle measurement errors can change up to 20 % for no-moon<br />
<strong>and</strong> 54 % for full-moon distributions (related to the 6.00 <strong>and</strong> 1.41 ratios in Table 2 where the errors are caused by the<br />
different source distributions).<br />
All the errors calculated in Tables 2 to 4 are caused by spectral mismatch errors. In Table 2, the spectral mismatch <strong>of</strong><br />
the applied night sky source distributions is large relative to the spectral distribution <strong>of</strong> the 815 nm LED (used at<br />
calibration). In Tables 3 <strong>and</strong> 4, the spectral mismatch is between the “Gen-3 early 1990” <strong>and</strong> “Gen-3 mid 1990” goggles<br />
relative to the “Gen-3 present” goggle (that represents the st<strong>and</strong>ard goggle spectral responsivity in this model).<br />
The above measurement errors can be lowered if the spectral mismatch is less. For Table 2, the errors can be drastically<br />
decreased if several LEDs are used in the test sets instead <strong>of</strong> the 815 nm LED. Since the full-moon <strong>and</strong> no-moon night<br />
sky distributions are very different, <strong>and</strong> any distribution can happen between these two extreme distributions, the best<br />
results can be obtained if the LED distributions in the test sets (using several LEDs) will mimic (roughly) the no-moon<br />
distribution. The no-moon distribution is the best choice for reference source distribution because it has the lowest<br />
irradiance where large measurement uncertainties are not allowed (to perform safe goggle operations). The goggle<br />
measurement uncertainties can be higher at full moon (or between no-moon <strong>and</strong> full-moon) radiation where the signals<br />
are much higher <strong>and</strong> the measurement uncertainty is less <strong>of</strong> a problem.<br />
For Tables 3 <strong>and</strong> 4, the measurement errors can be decreased if goggles are used with spectral responsivities similar to<br />
the st<strong>and</strong>ards Class A, B, or C. In field applications, the individual measurements <strong>of</strong> goggle relative spectral<br />
responsivities cannot be expected. If possible, goggles should be used with known typical relative spectral responsivities<br />
that are similar to each other (e.g. from the same fabrication batch). In this case, a broad-b<strong>and</strong> correction factor can be<br />
used to further decrease the errors. This correction factor can be determined as shown below.<br />
The goggle (NVIS) radiance is:<br />
∫<br />
1.21<br />
R = Gs<br />
( λ)<br />
N(<br />
λ)<br />
dλ<br />
(4)<br />
λ<br />
where Gs (λ)<br />
is the normalized st<strong>and</strong>ard spectral radiance responsivity <strong>of</strong> the goggle, N(λ ) is the spectral radiance <strong>of</strong><br />
the source measured, <strong>and</strong> λ is the wavelength. The signal <strong>of</strong> the goggle is:<br />
∫<br />
S G(<br />
λ) N(<br />
λ)<br />
dλ<br />
(5)<br />
= λ<br />
where G(λ) is the (realized/fabricated) absolute spectral radiance responsivity <strong>of</strong> the goggle that measures<br />
the N(λ ) spectral radiance. The absolute radiance responsivity can be written as<br />
Proc. <strong>of</strong> SPIE Vol. 6737 67370M-12
G( ) = G(<br />
peak)<br />
⋅ G ( λ)<br />
(6)<br />
λ n<br />
where G( peak)<br />
is the absolute radiance responsivity <strong>of</strong> the goggle at the peak <strong>and</strong> Gn (λ)<br />
is the normalized relative<br />
responsivity <strong>of</strong> the realized/fabricated goggle. The goggle broadb<strong>and</strong> responsivity is the ratio <strong>of</strong> Eq. 5 to Eq. 4:<br />
S<br />
s =<br />
R<br />
∫<br />
∫<br />
G(<br />
peak)<br />
Gn<br />
( λ)<br />
N(<br />
λ)<br />
dλ<br />
λ<br />
=<br />
G ( λ)<br />
N(<br />
λ)<br />
dλ<br />
λ<br />
s<br />
The goggle calibration factor is the reciprocal <strong>of</strong> s <strong>and</strong> the broad-b<strong>and</strong> (spectral mismatch) correction factor is:<br />
G(<br />
peak)<br />
C = =<br />
s<br />
∫<br />
∫<br />
λ<br />
λ<br />
G ( λ)<br />
N(<br />
λ)<br />
dλ<br />
s<br />
G ( λ)<br />
N(<br />
λ)<br />
dλ<br />
n<br />
In practice, a broad-b<strong>and</strong> correction factor can be calculated from the typical normalized spectral responsivity curve <strong>of</strong><br />
the goggle relative to the normalized spectral responsivity curve <strong>of</strong> the st<strong>and</strong>ard (such as Class-A). The source can be<br />
the no-moon (stars only) night sky distribution. If the realized/fabricated goggle spectral responsivity is equal to the<br />
st<strong>and</strong>ardized spectral responsivity <strong>of</strong> a goggle type (from Class A, B, or C), the correction factor is unity. In case, the<br />
relative spectral responsivity <strong>of</strong> the goggle is known (e.g. measured), the correction factor will compensate for the<br />
spectral mismatch errors. The correction factor also can be used when goggles that belong to two different classes (such<br />
as Class A or B) are used to measure similar source distributions <strong>and</strong> uniform measurement results are needed.<br />
While the errors calculated above have not been measured directly, the individual characteristics <strong>and</strong> functions, such as<br />
source distributions <strong>and</strong> spectral responsivities used in the calculations, were measured. The described modeling was the<br />
best approach to estimate the main goggle calibration <strong>and</strong> measurement uncertainties.<br />
3.2 Geometrical considerations<br />
In order to lower uncertainty in both the radiance responsivity calibration <strong>of</strong> the transfer st<strong>and</strong>ard radiometers (described<br />
in Section 2.3) <strong>and</strong> in the following radiance responsivity scale propagations, the traditionally used PVS-7 input optics<br />
was tested. This input optics which is a multi-element objective lens, was originally used for goggles where spatial<br />
distortions (aberrations) could lower the image quality. The PVS-7 input optics is also used at the front <strong>of</strong> the transfer<br />
st<strong>and</strong>ard radiometer where a good out-<strong>of</strong>-target rejection (radiation attenuation outside <strong>of</strong> the radiance measurement<br />
angle) would be more important than high image quality. An analysis has been made to improve the out-<strong>of</strong>-target<br />
blocking <strong>of</strong> the PVS-7 equipped radiometer using a simplified input optics <strong>of</strong> improved angular responsivity. The PVS-<br />
7 input optics is still needed for the goggles.<br />
The radiance measurement angle depends on the front geometry <strong>of</strong> the radiometer. Figure 11 shows the radiance<br />
measurement scheme <strong>of</strong> the biconvex lens equipped radiometer. The solid angle Ωo <strong>of</strong> the S source as viewed<br />
(subtended) by the radiance measuring radiometer is usually not measured. Instead, the radiometer should have a well<br />
defined radiance measurement angle α. A radiance meter is usually a modified irradiance meter. At the output <strong>of</strong> the<br />
input optics, either the Si photodiode itself or an aperture can be used as a field stop (L). In the shown example, there is<br />
an aperture <strong>of</strong> diameter D1 at the front <strong>of</strong> the Si photodiode. The diameter <strong>of</strong> the objective lens is D2 <strong>and</strong> f is the focal<br />
length <strong>of</strong> the biconvex lens. There is an aperture stop A with a diameter <strong>of</strong> D3 in front <strong>of</strong> the lens to limit the viewing<br />
field. This way, the input optics has a constant f#, equal to f/D3. The objective (biconvex) lens can be moved along the<br />
optical axis, relative to L to form an image <strong>of</strong> the (D4 diameter) measured area <strong>of</strong> source S in the plane <strong>of</strong> L. S must be<br />
larger than D4 to overfill L. According to the scheme on Fig. 11, the radiance measurement half-angle is:<br />
Proc. <strong>of</strong> SPIE Vol. 6737 67370M-13<br />
(7)<br />
(8)
−1<br />
2 1<br />
α = tan ( D 2i)<br />
(9)<br />
where i is the image distance. If the object distance o between S <strong>and</strong> the center <strong>of</strong> the objective lens is much larger than<br />
i, then i = f = constant, otherwise i is different than f. In the radiometer shown in Fig. 5, no aperture was applied, <strong>and</strong> the<br />
photodiode was in the focal plane <strong>of</strong> the biconvex lens, that is the i = f condition has been achieved <strong>and</strong> α is constant.<br />
The angular responsivities <strong>of</strong> the same transfer st<strong>and</strong>ard radiometer head, when equipped with the two different input<br />
optics, are shown in Fig. 12 <strong>and</strong> 13. Using the biconvex lens, instead <strong>of</strong> the PVS-7 input optics, the out-<strong>of</strong>-target<br />
rejection could be improved by at least an order <strong>of</strong> magnitude at +/- 12 o <strong>and</strong> larger angles. The improvements are better<br />
illustrated on the logarithmic scale <strong>of</strong> Fig. 13. The linear scale on Fig. 12 shows that the field-<strong>of</strong>-view from the FWHM<br />
values is 15 o for the PVS-7 <strong>and</strong> about 10 o for the biconvex-lens input optics.<br />
Using the simplified input optics with the more efficient out-<strong>of</strong>-target blocking, the distance dependence <strong>of</strong> the radiance<br />
responsivity (between the exit port <strong>of</strong> the integrating sphere <strong>and</strong> the input optics <strong>of</strong> the transfer st<strong>and</strong>ard radiometer)<br />
could be decreased from a 3.2 % change to less than 1 % during the (radiance responsivity) scale transfer.<br />
D 4<br />
S<br />
Ω o<br />
o<br />
Fig. 11. Radiance measurement scheme <strong>of</strong> the transfer st<strong>and</strong>ard radiometer when using a biconvex objective lens.<br />
For the night vision goggles, D1 is equal to the diameter <strong>of</strong> the photocathode (since no aperture is used in front <strong>of</strong> the<br />
goggle) which is significantly larger than the diameter <strong>of</strong> a silicon photodiode used (also without any aperture) in the<br />
transfer st<strong>and</strong>ard radiometer. Since α depends on D1, different size target spots can be obtained for the goggles <strong>and</strong> the<br />
transfer st<strong>and</strong>ard radiometers if the same PVS-7 input optics is used. The uncertainty <strong>of</strong> the scale transfer (from the<br />
transfer radiometer to the goggles) can be smaller if the input optics <strong>of</strong> the transfer st<strong>and</strong>ard radiometer (such as the<br />
biconvex lens) is designed such that the target spots <strong>of</strong> both the radiometer <strong>and</strong> the goggles are <strong>of</strong> similar sizes. This<br />
requirement can be important if the test-set radiance is spatially non-uniform.<br />
Since both the goggles <strong>and</strong> the transfer st<strong>and</strong>ard radiometers have large radiance measurement angles, the radiance<br />
source applied in the radiance responsivity transfer should overfill the acceptance angle <strong>of</strong> both the radiometers <strong>and</strong> the<br />
goggles. Integrating sphere sources can be used as transfer sources, however, the st<strong>and</strong>ard remains the transfer st<strong>and</strong>ard<br />
radiometer. Application <strong>of</strong> collimators should be avoided. Also, careful mechanical <strong>and</strong> optical alignments are<br />
necessary in each step <strong>of</strong> the calibration transfer to keep the calibration uncertainties low.<br />
Proc. <strong>of</strong> SPIE Vol. 6737 67370M-14<br />
α<br />
F<br />
D 3<br />
A<br />
D 2<br />
f<br />
i<br />
F<br />
D 1<br />
L<br />
Si
1.2 10 0<br />
1 10 0<br />
8 10 -1<br />
6 10 -1<br />
4 10 -1<br />
2 10 -1<br />
Biconvex<br />
PVS-7<br />
0<br />
-20 -15 -10 -5 0 5 10 15 20<br />
Angle [degree]<br />
10 0<br />
10 -1<br />
10 -2<br />
10 -3<br />
Biconvex<br />
PVS-7<br />
-20 -15 -10 -5 0 5 10 15 20<br />
Angle [degree]<br />
Fig. 12. Normalized angular responsivity <strong>of</strong> the NV Fig. 13. Normalized angular responsivity <strong>of</strong> the NV<br />
radiometer in a linear scale when equipped either radiometer in a logarithmic scale when equipped either<br />
with the biconvex lens or the PVS-7 input optics. with the PVS-7 input optics or a biconvex lens.<br />
4. CONCLUSIONS<br />
The <strong>NIST</strong> NVRCF has been developed <strong>and</strong> used on a regular basis to transfer the <strong>NIST</strong> reference radiance responsivity<br />
scale to the military primary st<strong>and</strong>ard laboratories. Spectral considerations have been discussed to obtain low<br />
uncertainties in the responsivity scale transfer to the test-sets <strong>and</strong> then to the goggles. A model showed that lasers can be<br />
used at radiance responsivity calibrations <strong>and</strong> scale transfers if the right detector spectral responsivity <strong>and</strong> test-set source<br />
distribution are used. However, use <strong>of</strong> only one LED type in the test-sets produces a significant spectral mismatch<br />
between calibration <strong>and</strong> applications. At applications, the goggles measure reflections <strong>of</strong> night sky radiation which has a<br />
much broader spectral distribution than that <strong>of</strong> the test-set LED. As a result <strong>of</strong> this spectral mismatch, a goggle will have<br />
different transfer-gains at calibration <strong>and</strong> applications. The goggle views a narrow-b<strong>and</strong> LED distribution at calibration<br />
<strong>and</strong> measures a very different broad distribution at applications (night sky radiation). These errors have been modeled.<br />
The calculation results showed that 500 % error can be obtained with a Gen-3 goggle when it is calibrated using an<br />
815 nm LED <strong>and</strong> then applied to measure full-moon night sky radiation. When the same goggle measures no-moon<br />
(stars only) radiation distribution, the measurement error decreases to 41 %. In the second part <strong>of</strong> this model, the<br />
spectral responsivities <strong>of</strong> two Gen-3 goggles were substituted for a third Gen-3 goggle (the reference goggle in this<br />
model) to calculate the errors caused by the different goggle spectral responsivities. The calculations showed that the<br />
goggle measurement errors can change up to 20 % for no-moon <strong>and</strong> 54 % for full-moon night sky distributions when<br />
different goggles <strong>of</strong> the same type (uncalibrated in the model) are substituted for the reference goggle. The reason for<br />
these errors is the spectral mismatch between the two “test” goggles <strong>and</strong> the reference goggle.<br />
Suggestions are made to decrease the spectral mismatch between calibration <strong>and</strong> applications for both the source<br />
distributions <strong>and</strong> the goggle spectral responsivities. In order to decrease goggle measurement errors, it is suggested to<br />
use several LEDs with different distributions in the test sets instead <strong>of</strong> the 815 nm LED. Since the full-moon <strong>and</strong> nomoon<br />
night sky distributions are very different, <strong>and</strong> all application distributions are between these two extreme<br />
distributions, the best results can be obtained if the LED distributions in the test sets will mimic (roughly) the no-moon<br />
distribution. This distribution has the lowest irradiance where large measurement uncertainties cannot be allowed to<br />
Proc. <strong>of</strong> SPIE Vol. 6737 67370M-15
perform safe goggle operations. The goggle measurement uncertainties can be allowed to be higher at other night sky<br />
radiations where the signals are much higher <strong>and</strong> increased measurement uncertainty is less <strong>of</strong> a problem. A broad-b<strong>and</strong><br />
correction factor was introduced for goggle calibrations (to further decrease measurement uncertainties) for applications<br />
where the spectral responsivity <strong>of</strong> the applied (test) goggle is different than that <strong>of</strong> the st<strong>and</strong>ard.<br />
Geometrical considerations have also been discussed to decrease uncertainties in the radiance responsivity transfer. The<br />
design <strong>of</strong> a simplified radiance measuring input optics was discussed with improved out-<strong>of</strong>-target rejection. The results<br />
<strong>of</strong> angular responsivity measurements illustrate the optimum radiance measurement angles <strong>and</strong> the improved radiance<br />
measuring characteristics <strong>of</strong> the <strong>NIST</strong> developed transfer st<strong>and</strong>ard radiometers.<br />
5. ACKNOWLEDGEMENTS<br />
The author thanks the U.S. Navy for funding the development <strong>of</strong> the NV Radiometer Calibration Facility, C. R<strong>and</strong>y<br />
Lustenberger for making the drawing <strong>of</strong> the NV radiometer front-head, Irena Fryc for participating in the model spreadsheet<br />
calculations, <strong>and</strong> Joe Velasquez for his fruitful discussions on goggle <strong>and</strong> test-set calibrations.<br />
REFERENCES<br />
1. MIL-STD-3009, Department <strong>of</strong> Defense Interface st<strong>and</strong>ard for Lighting, Aircraft, Night Vision Imaging<br />
System (NVIS) Compatible, 2 February, 2001.<br />
2. MIL-L-85762A, Military specification for Lighting, Aircraft, Interior, Night Vision Imaging System (NVIS)<br />
Compatible, 26 August, 1988.<br />
3. Bender, E.J., Personal communication, U.S. Army Night Vision <strong>and</strong> Electronic Sensors Directorate, Imaging<br />
Technology Branch, Science <strong>and</strong> Technology Division, Fort Belvoir, VA 22060-5806, 2007.<br />
4. Littleton, R., Personal communication, Night Vision <strong>and</strong> Electronic Sensors Directorate, Fort Belvoir, VA<br />
22060-5806, 2007.<br />
5. Disclaimer, The mention <strong>of</strong> certain commercial products in this paper is for information purposes only <strong>and</strong><br />
does not constitute an endorsement <strong>of</strong> the product by the author or his institution.<br />
6. Task, H.L. <strong>and</strong> Marasco, P.L., The impact <strong>of</strong> changing night-vision goggle spectral response on night-vision<br />
imaging system lighting compatibility. SPIE proceedings, 2004. 5442.<br />
7. Eppeldauer, G.P., et al., Improved accuracy photometric <strong>and</strong> tristimulus-color scales based on spectral<br />
irradiance responsivity. Proc. <strong>of</strong> 25th Session <strong>of</strong> the CIE, 2003. 1: p. D2-30 to D2-33.<br />
8. U.S.patent 20050194516, , Programmable LED spectral light source. 2007.<br />
9. Brown, S.W., Santana, C., <strong>and</strong> Eppeldauer, G.P., Development <strong>of</strong> a Tunable LED-based Colorimetric Source.<br />
J. Res. <strong>NIST</strong>, 2002. 107(4): p. 363-371.<br />
10. Eppeldauer, G. <strong>and</strong> Hardis, J.E., Fourteen-decade photocurrent measurements with large-area silicon<br />
photodiodes at room temperature. Applied Optics, 1991. 30: p. 3091-3099.<br />
11. Brown, S.W., Eppeldauer, G.P., <strong>and</strong> Lykke, K.R., Facility for Spectral Irradiance <strong>and</strong> Radiance Responsivity<br />
Calibrations using Uniform Sources (SIRCUS), Applied Optics, 2006. 32: p. 8218-8237.<br />
12. Larason, T.C., Bruce, S.S., <strong>and</strong> Parr, A.C., Spectroradiometric detector measurements. <strong>NIST</strong> Special<br />
Publication, 1998. 250-41.<br />
13. Eppeldauer, G., Racz, M., <strong>and</strong> Larason, T., Optical Characterization <strong>of</strong> Diffuser-input St<strong>and</strong>ard Irradiance<br />
Meters. SPIE proceedings, 1998. 3573: p. 220-224.<br />
14. Ohno, Y., <strong>NIST</strong> measurement services: Photometric calibrations. <strong>NIST</strong> Spec. Publ., 1997. 250-37.<br />
Proc. <strong>of</strong> SPIE Vol. 6737 67370M-16
Traceability <strong>of</strong> photocurrent measurements to electrical st<strong>and</strong>ards<br />
George P. Eppeldauer<br />
Optical Technology Division<br />
<strong>National</strong> <strong>Institute</strong> <strong>of</strong> <strong>St<strong>and</strong>ards</strong> <strong>and</strong> Technology<br />
Gaithersburg, MD 20899<br />
Abstract<br />
In detector output-signal measurements, where the measurement uncertainty critically<br />
impacts the total uncertainty <strong>of</strong> a detector-based radiometric scale realization, traceability<br />
<strong>of</strong> the photocurrent measurement to SI traceable electrical st<strong>and</strong>ards is needed. A<br />
reference photocurrent-to-voltage conversion scale has been developed <strong>and</strong> described<br />
here. The new st<strong>and</strong>ard has internal reference resistors for all signal-gain selections to<br />
decrease noise pickup <strong>of</strong> traditionally used external reference resistors. The internal<br />
resistors were calibrated by the <strong>NIST</strong> Quantum Electrical Metrology Division against<br />
st<strong>and</strong>ard resistors. Using the substitution method, the reference photocurrent-to-voltage<br />
conversion scale was transferred from the converter st<strong>and</strong>ard to other converters up to a<br />
maximum signal-gain <strong>of</strong> 10 10 V/A with an exp<strong>and</strong>ed uncertainty <strong>of</strong> 0.013 % (k=2). The<br />
DC conversion scale was extended to AC mode signal-gain calibrations where the<br />
photocurrent measurement uncertainty is 0.05 % (k=2).<br />
1. Introduction<br />
The 0.01 % (k=2) uncertainty <strong>of</strong> optical power measurements with cryogenic radiometers<br />
<strong>and</strong> the 0.06 % (k=2) uncertainty <strong>of</strong> irradiance responsivity measurements at the <strong>NIST</strong><br />
Spectral Irradiance <strong>and</strong> Radiance Responsivity Calibration with Uniform Sources<br />
(SIRCIUS) facility [1] needed the development <strong>of</strong> a technique to measure photodiode<br />
output signals with an exp<strong>and</strong>ed uncertainty close to 0.01 % (k=2). Similar uncertainties<br />
are needed in those detector output signal measurements where the signal measurement<br />
uncertainty critically impacts the total uncertainty <strong>of</strong> a detector-based calibration. For<br />
photodiodes, that are the most accurate transfer <strong>and</strong> working st<strong>and</strong>ards, the output shortcircuit<br />
currents are to be measured to perform low signal-measurement uncertainty [2].<br />
St<strong>and</strong>ardized techniques are not available to calibrate photocurrent meters with the<br />
required 0.01 % (k=2) uncertainty especially at low (close to 1 pA) photocurrents.<br />
Traditionally, electrometers (picoammeters) or current-to-voltage converters are used to<br />
measure small photocurrents. Research papers report low current-measurement<br />
uncertainties. However, these publications usually discuss only electrical current<br />
measurements <strong>and</strong> the calibration <strong>of</strong> the current meters. Typically, they do not discuss<br />
photodiode related low-current measurements which is a special area <strong>of</strong> low-current<br />
measurements where the electrical characteristics <strong>of</strong> the photodiodes (such as the shunt<br />
resistance) can influence the measurement uncertainties.<br />
An intrinsically stable cryogenic current comparator (CCC) was reported recently for<br />
accurate measurement <strong>of</strong> small electrical currents [3]. Uncertainties <strong>of</strong> 0.002 % (k=1)
were reported for 300 pA <strong>and</strong> 0.005 % (k=1) for 100 pA current measurements. A low<br />
DC current source, also based on the charging capacitor method using a linear voltage<br />
ramp, was reported for the calibration <strong>of</strong> picoammeters [4]. At 10 pA, an uncertainty <strong>of</strong><br />
0.003 % (k=1) was reported. The uncertainty increased to 6 % (k=1) at 1 fA. A<br />
measurement setup to calibrate picoammeters between 100 pA <strong>and</strong> 100 nA has also been<br />
reported where the measurement uncertainty was 0.042 % (k=2) at 100 pA [5].<br />
In photodiode output-signal measurements, the signal measuring circuit operates in a<br />
linear mode if the photocurrent <strong>of</strong> the photodiode is measured. The current is converted<br />
into a voltage for data recording <strong>and</strong> evaluation. For low photocurrent measurements,<br />
high load-resistors are needed to obtain a high enough voltage that can be measured with<br />
regular digital voltmeters. Since high load-resistors (comparable to the shunt resistance <strong>of</strong><br />
the measured detector) can produce non-linearity in the signal conversion, operational<br />
amplifier based current meters (producing lower load-resistances) are used for low<br />
photocurrent measurements. The conversion is made with a large precision resistor in the<br />
feedback loop <strong>of</strong> the operational amplifier [2]. The low-uncertainty signal-conversion is<br />
needed up to a feedback resistance <strong>of</strong> 10 GΩ.<br />
A photocurrent-to-voltage converter calibration method was published [6] where the<br />
exp<strong>and</strong>ed uncertainties were 0.38 % (k=2) at 1 pA <strong>and</strong> 0.046 % (k=2) at 10 pA. A high<br />
constant-voltage was converted into small currents with high-resistance resistor st<strong>and</strong>ards<br />
<strong>and</strong> the test-converter measured the small currents. The calibration uncertainty was<br />
dominated by two dominant uncertainty components: the voltage-dependence <strong>and</strong> the<br />
stability <strong>of</strong> the 10 GΩ to 100 TΩ resistor st<strong>and</strong>ards <strong>and</strong> the 1/f noise from the converter.<br />
In our earlier work, precision resistors were used as reference resistors to calibrate an<br />
operational amplifier based current-to-voltage converter. In the first application, the<br />
reference resistors were serially connected to the converter input to transfer the converter<br />
from current mode into voltage measurement mode. In this case, the unknown feedback<br />
resistance <strong>of</strong> the operational amplifier is determined from the measured voltageamplification<br />
which depends on the serial reference-resistance <strong>and</strong> the feedback<br />
resistance. Here, both the input <strong>and</strong> the output voltages can be measured with low<br />
uncertainty. In the other application, the reference resistors are used to measure the<br />
current from a stable current source. With both methods, because <strong>of</strong> the use <strong>of</strong> external<br />
reference resistors, the converter output noise is large especially at high signal-gain<br />
selections. Usually, the signal dynamic range <strong>and</strong> the achievable uncertainty <strong>of</strong> the<br />
converter signal-gain calibrations are limited at high feedback resistances where the noise<br />
pickup can be significant <strong>and</strong> the noise-voltage amplification is high.<br />
In order to obtain improved signal conversion uncertainties, a reference current-tovoltage<br />
converter has been developed using internal (electrically shielded by the metal<br />
box <strong>of</strong> the converter) reference feedback resistors. With this design, the noise pickup can<br />
be decreased. Circuit design details (such as isolation resistance issues, printed circuit<br />
board design, shielding etc) are not discussed here. These questions have been discussed<br />
earlier [2]. This work focuses on a signal-conversion scale realization <strong>and</strong> its propagation<br />
to applications. The reference current-to-voltage converter can be used first for the
current-to-voltage conversion-scale realization <strong>and</strong> then, in a second step, it can<br />
propagate the signal-conversion scale to a test current-to-voltage converter. The signalconversion<br />
scale is an electrical scale where the current-to-voltage gains <strong>and</strong> the<br />
corresponding conversion uncertainties are determined. The reference signal conversion<br />
scale (implemented by the converter st<strong>and</strong>ard) can be transferred to different radiometric<br />
<strong>and</strong> photometric calibrations where it works like a sub-scale. The uncertainty <strong>of</strong> the subscale<br />
must be low enough to avoid dominating the combined uncertainty <strong>of</strong> the related<br />
radiometric or photometric scale realizations. Propagation <strong>of</strong> the reference sub-scale to<br />
field applications with low current-to-voltage conversion uncertainty is also an important<br />
requirement.<br />
2. The current-to-voltage converter st<strong>and</strong>ard<br />
A current-to-voltage converter st<strong>and</strong>ard with internal reference resistors has been<br />
developed to improve noise performance <strong>and</strong> uncertainty at high signal-gain calibrations<br />
<strong>of</strong> test converters.<br />
Commercially available precision resistors with excellent electrical <strong>and</strong> thermal<br />
characteristics have been acquired <strong>and</strong> then calibrated against <strong>NIST</strong> resistor st<strong>and</strong>ards.<br />
The manufacturer reported resistances <strong>of</strong> the purchased resistors (Caddock, TF Series)<br />
have 0.01 % tolerances to their nominal decade values between 10 4 Ω <strong>and</strong> 5 x 10 7 Ω [4].<br />
Two, 5 x 10 7 Ω resistors were connected serially to obtain a 10 8 Ω feedback<br />
resistance. The temperature coefficient <strong>of</strong> resistance for these resistors is 10 ppm/ 0 C or<br />
less. The characteristics <strong>of</strong> the highest feedback resistor, 10 9 Ω, used in the current-tovoltage<br />
converter st<strong>and</strong>ard (Ohmite, Mini-MOX) were worse than the lower feedback<br />
resistors. The tolerance for the decade nominal value was 0.5 % <strong>and</strong> the temperature<br />
coefficient <strong>of</strong> resistance was 100 ppm/ o C.<br />
The traditional circuit diagram used for the current-to-voltage converter st<strong>and</strong>ard is<br />
shown in Fig. 1. This converter has a BNC IN connector to measure the input current <strong>and</strong><br />
a BNC OUT to measure the output voltage. One resistor from a set <strong>of</strong> feedback resistors<br />
can be selected with a rotary switch to switch signal-gain (current sensitivity). The<br />
selected resistor with its parallel capacitance is switched into the feedback loop <strong>of</strong> the<br />
operational amplifier OA. An electrometer-grade OA is to be used because it has very<br />
low bias current, low <strong>of</strong>fset <strong>and</strong> drift, high open-loop gain <strong>and</strong> common-mode rejection.<br />
The feedback resistors (discussed above) are R1=10 4 Ω, R2=10 5 Ω, R3=10 6 Ω, R4=10 7<br />
Ω, <strong>and</strong> R5=10 8 Ω. Instead <strong>of</strong> using the manufacturer reported resistance tolerances, the<br />
resistors were calibrated against resistor st<strong>and</strong>ards at the <strong>NIST</strong> Quantum Electrical<br />
Metrology Division. The highest feedback resistor was R6=10 9 Ω. This resistor does not<br />
have parallel connected external capacitance to obtain a 3 dB roll-<strong>of</strong>f frequency <strong>of</strong> about<br />
100 Hz. The other parallel capacitors C1 to C5 were used for frequency compensations to<br />
optimize the fundamental gains <strong>and</strong> the minimum upper 3 dB roll-<strong>of</strong>f frequency was<br />
again 100 Hz [2]. The parallel feedback capacitors are C1=C2=6.8 nF, C3=1500 pF,<br />
C4=150 pF, <strong>and</strong> C5=15 pF. The converter housing was electrically shielded. The<br />
common <strong>of</strong> the circuit is combined with the shielding wire (connected to the ground-pin
<strong>of</strong> the 120 VAC power line connector) at the 0 V pin <strong>of</strong> the +/- 15 V power supply. The<br />
printed circuit board <strong>of</strong> the converter is illustrated with a dashed line on Fig. 1.<br />
In order to utilize the advantage <strong>of</strong> group policy, two sets <strong>of</strong> feedback resistors were<br />
calibrated for the 10 4 V/A to 10 8 V/A signal-gain selections. The obtained resistance<br />
corrections for the manufacturer reported nominal values <strong>and</strong> the exp<strong>and</strong>ed relative<br />
measurement uncertainties are shown in Table 1. The results show that the differences<br />
between the manufacturer reported nominal resistance values <strong>and</strong> the <strong>NIST</strong> Quantum<br />
Electrical Metrology Division measured resistances are always smaller than 0.012 % <strong>and</strong><br />
the highest relative exp<strong>and</strong>ed uncertainty <strong>of</strong> the <strong>NIST</strong> resistance calibrations was also<br />
0.012 % (k=2).<br />
After the resistance calibrations, all feedback resistors were inserted into the current-tovoltage<br />
converter st<strong>and</strong>ard. Since the 1 GΩ feedback resistor has worse electrical<br />
characteristics than the others <strong>and</strong> we wanted to keep the measurement uncertainty low, it<br />
was not calibrated against any external resistor st<strong>and</strong>ard. Instead, this signal-gain was<br />
calibrated against the neighboring signal-gain as it will be discussed below.<br />
3. DC signal-gain calibrations using the current-to-voltage converter st<strong>and</strong>ard<br />
Improved conversion uncertainty can be achieved with test current-to-voltage converters<br />
if they are calibrated against the above discussed current-to-voltage converter st<strong>and</strong>ard. In<br />
this case, the noise pickup problem can be eliminated <strong>and</strong> the low uncertainty signal-gain<br />
calibration can be extended to the 10 10 V/A gain <strong>of</strong> a test current-to-voltage converter.<br />
The 10 9 V/A signal-gain (using the 1 GΩ feedback resistor) was calibrated against the<br />
10 8 V/A gain by measuring the output voltage ratio with the two gains when applying the<br />
same (5 nA) constant current to the input <strong>of</strong> the converter st<strong>and</strong>ard.<br />
Table 1.<br />
Evaluation <strong>of</strong> the <strong>NIST</strong> Quantum Electrical Metrology Division calibrations<br />
for two sets <strong>of</strong> feedback resistors<br />
Feedback resistor Nominal Value Correction Relative exp<strong>and</strong>ed<br />
Serial Number<br />
[Ω]<br />
[μΩ/Ω] uncertainty [%]<br />
R1 10 4 42.8 0.0001<br />
R2 10 5 14.7 0.0001<br />
R3 10 6 12.0 0.0002<br />
R4 10 7 116.5 0.0014<br />
R5 10 8 88 0.0116<br />
R1’ 10 4 2.3 0.0001<br />
R2’ 10 5 -2.8 0.0001<br />
R3’ 10 6 76.2 0.0002<br />
R4’ 10 7 124.1 0.0014<br />
R5’ 10 8 173 0.0116
BNC IN<br />
+15V<br />
OA<br />
-15V<br />
A B<br />
0V H<br />
E D SHIELD<br />
CONNECTOR<br />
BNC OUT<br />
2<br />
3<br />
8<br />
C1<br />
C2<br />
C3<br />
C4<br />
C5<br />
4<br />
7<br />
R1<br />
R2<br />
R3<br />
R4<br />
R5<br />
R6<br />
5<br />
1 6<br />
P1<br />
ZERO<br />
Fig. 1. Circuit diagram <strong>of</strong> the current-to-voltage converter st<strong>and</strong>ard<br />
The current from the variable output current source is measured with the current-tovoltage<br />
converter st<strong>and</strong>ard. Figure 2 shows the simplified scheme <strong>of</strong> the substitution type<br />
current-to-voltage converter calibration.<br />
Current<br />
Source<br />
I<br />
A<br />
B<br />
R<br />
C<br />
V 1<br />
D<br />
9<br />
Digital<br />
Voltmeter<br />
Fig. 2. Current determination with the current-to-voltage converter st<strong>and</strong>ard.<br />
4
The current I from the electronic current source is introduced into the current-to-voltage<br />
converter st<strong>and</strong>ard. The output voltage V1 <strong>of</strong> the converter st<strong>and</strong>ard can be measured with<br />
a digital voltmeter. The value <strong>of</strong> the input current can be calculated after two output<br />
voltage measurements:<br />
V1<br />
( I)<br />
−V1<br />
( I = 0)<br />
I = (1)<br />
R<br />
where V1(I) is the converter output voltage for input current I, V1(I = 0) is the converter<br />
output voltage for I = 0, <strong>and</strong> R is the resistance <strong>of</strong> the feedback reference resistor in the<br />
converter. The voltage subtraction cancels the output <strong>of</strong>fset voltage <strong>of</strong> the converter<br />
st<strong>and</strong>ard.<br />
After the determination <strong>of</strong> I, test current-to-voltage converters can be substituted for the<br />
converter st<strong>and</strong>ard at points A, B, C, <strong>and</strong> D. Points B <strong>and</strong> D are the “common” <strong>of</strong> the<br />
circuits that also give the electrical shielding for the connecting (input <strong>and</strong> output) cables.<br />
The output voltage <strong>of</strong> a test current-to-voltage converter is V2. The signal-gain <strong>of</strong> the test<br />
current-to-voltage converter is:<br />
G S<br />
V2<br />
( I)<br />
−V2<br />
( I = 0)<br />
= (2)<br />
I<br />
where V2(I) is the test converter output voltage for input current I, V2(I = 0) is the test<br />
converter output voltage for I = 0, <strong>and</strong> I is the current as determined by Eq. 1. The output<br />
<strong>of</strong>fset voltage <strong>of</strong> the test converter is canceled out by the voltage subtraction in Eq. 2. In<br />
order to obtain high signal-to-noise ratios, GS = R is the best choice. However, when GS =<br />
10 10 V/A in the test converter, the maximum built-in feedback resistance <strong>of</strong> R = 10 9 V/A<br />
(corresponds to the highest feedback resistor <strong>of</strong> 1 GΩ) is used in the converter st<strong>and</strong>ard.<br />
In this case, the test current from the current source must be lowered to 0.5 nA where the<br />
output resistance <strong>of</strong> the current source (Keithley Model 263) is 1 GΩ. This sourceresistance<br />
increase is needed to keep the output noise (<strong>and</strong> the signal-gain uncertainty <strong>of</strong><br />
the test-converter) low.<br />
4. Loop-gain related DC signal-conversion uncertainty<br />
When a small load-resistor converts a large current into a voltage, the conversion is done<br />
according to Ohm’s law <strong>and</strong> the conversion uncertainty can be low. In case <strong>of</strong> small<br />
photocurrent measurements, when an operational amplifier is used with high feedback<br />
resistors, the conversion uncertainty can be high. This complication is the reason why<br />
national metrology institutes (NMIs) do not <strong>of</strong>fer calibration services for low current<br />
measurements.
The signal-gain <strong>of</strong> a photocurrent-to-voltage converter in DC (low-frequency<br />
measurement) mode is:<br />
In an ideal case,<br />
1<br />
G S = R . (3)<br />
−1<br />
1+<br />
G<br />
L<br />
V<br />
R = , (4)<br />
I<br />
where V is the output voltage <strong>and</strong> I is the input current <strong>of</strong> the current-to-voltage<br />
converter, R is the feedback resistance <strong>of</strong> the operational amplifier <strong>and</strong> GL is the loop gain<br />
<strong>of</strong> the analog control loop <strong>of</strong> the converter. A realized current-to-voltage conversion can<br />
be close to the ideal case if the conversion uncertainties are kept low. Otherwise, the<br />
loop-gain can produce a significant component in the uncertainty <strong>of</strong> the current-tovoltage<br />
conversion. The DC loop gain can be written as<br />
GL = A0β<br />
0 , (5)<br />
where β 0 is the DC feedback attenuation <strong>and</strong> A0<br />
is the DC open-loop gain <strong>of</strong> the<br />
operational amplifier used in the converter. When RS photodiode-shunt-resistance is<br />
connected to the input <strong>of</strong> the converter, the DC feedback attenuation will be<br />
RS<br />
β 0 = . (6)<br />
R + R<br />
S<br />
For a Si-tunnel-trap detector, if the photodiodes are selected for equal shunt resistance,<br />
the typical resultant shunt resistance is between 30 MΩ <strong>and</strong> 50 MΩ [2]. With RS=50 MΩ<br />
shunt resistance <strong>and</strong> R=1 GΩ maximum feedback resistance (R6 in Fig. 1), β =0.048<br />
that produces a loop gain <strong>of</strong> about GL=5 x 10 4 . This loop gain will result in a current-tovoltage<br />
conversion uncertainty <strong>of</strong> 0.002 %. The calculation also shows that the shunt<br />
resistance for a 0.01 % conversion-uncertainty cannot be smaller than 10 MΩ when using<br />
gain 10 9 V/A. The output resistance <strong>of</strong> the current source in Fig. 1 at 5 nA test-current<br />
was 100 MΩ resulting in a conversion uncertainty <strong>of</strong> 0.001 % using gain 10 9 V/A at<br />
calibration.<br />
5. Uncertainty <strong>of</strong> DC current measurement using the converter st<strong>and</strong>ard<br />
The uncertainty components <strong>of</strong> current measurement I using the current-to-voltage<br />
converter st<strong>and</strong>ard at gain 10 8 V/A are shown in Table 2. The test-current from the<br />
current source was 5 nA <strong>and</strong> the output resistance <strong>of</strong> the current source was 100 MΩ.<br />
The gain-ratio (step-down) method was used to calibrate the 10 9 V/A (highest) gain <strong>of</strong> the<br />
converter st<strong>and</strong>ard against the calibrated 10 8 V/A gain. The highest feedback resistor<br />
calibrated by the <strong>NIST</strong> Quantum Electrical Metrology Division was 10 8 Ω.
Table 2. Uncertainty <strong>of</strong> input current measurement at gain 10 8 V/A<br />
<strong>of</strong> the current-to-voltage converter st<strong>and</strong>ard<br />
Uncertainty components Type Relative uncertainty<br />
[%]<br />
Feedback resistance B 5.8 x 10 -3<br />
Short-term instability <strong>of</strong> input current I A 1 x 10 -3<br />
V1 voltage measurement B 2 x 10 -4<br />
Output noise <strong>and</strong> drift A 1 x 10 -4<br />
Loop gain A 2 x 10 -4<br />
Combined st<strong>and</strong>ard uncertainty (k=1) <strong>of</strong> I measurement 5.89 x 10 -3<br />
Exp<strong>and</strong>ed total uncertainty (k=2) <strong>of</strong> I measurement 0.012<br />
During the gain calibration transfer, two uncertainty components will change. Because <strong>of</strong><br />
the increased closed-loop voltage gain [2], the output noise <strong>and</strong> drift produced<br />
uncertainty component will increase to 1 x 10 -3 % (k=1). The increased feedback<br />
attenuation will increase the loop-gain produced uncertainty component to 1 x 10 -3 %<br />
(k=1). The combined st<strong>and</strong>ard uncertainty <strong>of</strong> the current measurement at 10 9 V/A will be<br />
6.06 x 10 -3 % (k=1), <strong>and</strong> the rounded exp<strong>and</strong>ed total uncertainty will remain 0.012 %<br />
(k=2). The results show that the uncertainty <strong>of</strong> the current measurements at both the<br />
10 8 V/A <strong>and</strong> 10 9 V/A gains is dominated by the uncertainty <strong>of</strong> the feedback resistance<br />
measurement (<strong>of</strong> the 10 8 Ω in Table 1).<br />
The final uncertainty determination <strong>of</strong> the current measurements with the current-tovoltage<br />
converter st<strong>and</strong>ard has been made experimentally, by measuring the neighboring<br />
gain ratios (using the step-down method). At each neighboring gain ratio <strong>of</strong> (n+1)/n,<br />
where n is the gain number (4 to 7 in this test), the input-current was kept at a constant<br />
value. The reference gain-resistance ratios in Table 1 were divided by the measured<br />
output-voltage ratios for all gains. The four gain ratios from 10 8 /10 7 to 10 5 /10 4 were<br />
determined five times (from five different current determinations) <strong>and</strong> all the four<br />
average ratios were smaller than 1.00010. The conclusion after these gain ratio (reference<br />
to measured) comparisons is that the current measurement uncertainty <strong>of</strong> the converter<br />
st<strong>and</strong>ard is 0.012 % (k=2) for gains 10 8 V/A <strong>and</strong> 10 9 V/A, <strong>and</strong> 0.01 % (k=2) for the lower<br />
gains.<br />
6. Uncertainty <strong>of</strong> a test converter DC signal-gain calibration<br />
In order to calibrate a test current-to-voltage converter with the 10 10 V/A highest gain, the<br />
test-current from the current source must be lowered to 0.5 nA <strong>and</strong> the 10 9 V/A gain <strong>of</strong><br />
the converter st<strong>and</strong>ard must be used to determine the current. At the 0.5 nA input current,<br />
the output resistance <strong>of</strong> the current source is 1 GΩ, one order <strong>of</strong> magnitude higher than at<br />
the 5 nA selection (used above). This source-resistance increase decreases the output<br />
noise <strong>and</strong> drift <strong>and</strong> also the loop-gain produced uncertainty components <strong>of</strong> the current<br />
determination but the exp<strong>and</strong>ed total uncertainty will remain 0.012 % (k=2). However,<br />
the 1 GΩ source resistance makes it possible to keep the output noise <strong>and</strong> drift <strong>and</strong> also
the loop-gain produced uncertainty components <strong>of</strong> the test-converter calibration low in<br />
spite <strong>of</strong> the 10 10 V/A (maximum) gain selection <strong>of</strong> the test converter. The uncertainty<br />
budget <strong>of</strong> the signal-gain determination <strong>of</strong> a test current-to-voltage converter using<br />
0.5 nA input-current at the 10 10 V/A signal-gain is shown in Table 3.<br />
Table 3. Uncertainty <strong>of</strong> the signal-gain determination <strong>of</strong> a test current-to-voltage<br />
converter at gain 10 10 V/A using 1 GΩ current-source-resistance<br />
Uncertainty components Type Relative uncertainty<br />
[%]<br />
I measurement B 0.006<br />
Short-term instability <strong>of</strong> input current I A 2 x 10 -3<br />
V2 voltage measurement B 2 x 10 -4<br />
Output noise <strong>and</strong> drift A 1 x 10 -3<br />
Loop gain A 1 x 10 -3<br />
Combined st<strong>and</strong>ard uncertainty (k=1) <strong>of</strong> GS measurement 6.48 x 10 -3<br />
Exp<strong>and</strong>ed total uncertainty (k=2) <strong>of</strong> GS measurement 0.013<br />
Using the above introduced DC signal-gain calibration method <strong>and</strong> procedure, even at the<br />
highest signal-gain selection <strong>of</strong> a test converter (GS = 10 10 V/A), an exp<strong>and</strong>ed total gainuncertainty<br />
<strong>of</strong> 0.013 % (k=2) can be achieved. During the calibration part <strong>of</strong> this method<br />
<strong>and</strong> procedure, photodiodes have not been used.<br />
If the above discussed calibration/measurement uncertainties are to be repeated in real<br />
photocurrent measurements (applications), where different photodiodes are connected to<br />
the input <strong>of</strong> a current-to-voltage converter (test or st<strong>and</strong>ard), the shunt resistance <strong>of</strong> the<br />
connected photodiode must be known. E.g., the shunt resistance must be 100 MΩ or<br />
higher when the 10 9 V/A signal-gain <strong>of</strong> the converter-st<strong>and</strong>ard is used (as discussed in<br />
Section 7). Similarly, the shunt resistance must be higher than 1 GΩ when the 10 10 V/A<br />
(maximum) signal-gain <strong>of</strong> a test converter is selected. Otherwise, the output noise <strong>and</strong><br />
drift uncertainty component in Tables 2 <strong>and</strong> 3 will increase resulting in an increase in the<br />
combined uncertainties as well.<br />
The shunt resistance <strong>of</strong> the applied photodiode will determine the smallest photocurrent<br />
that can be measured with the above reported uncertainties (obtained using the electronic<br />
current source). E.g., when the noise equivalent current (NEC) is 1 x 10 -15 A (k=2) [2],<br />
the minimum signal-current should be at least four orders <strong>of</strong> magnitude higher (10 pA) to<br />
obtain a maximum 0.01 % (k=2) uncertainty contribution (to the 0.012 % <strong>and</strong> 0.013 %<br />
exp<strong>and</strong>ed total uncertainties <strong>of</strong> Tables 2 <strong>and</strong> 3) from the output signal-to-noise ratio <strong>of</strong><br />
the converter. This would result in a 10 pA photocurrent measurement exp<strong>and</strong>ed total<br />
uncertainty <strong>of</strong> 0.016 %.<br />
Using AC mode current-to-voltage conversion (discussed below), the NEC can be<br />
decreased to 8 x 10 -17 A [2]. However, the inherent uncertainty <strong>of</strong> AC signal-gain<br />
calibrations is somewhat higher than that <strong>of</strong> the above discussed DC calibrations.
7. Extension <strong>of</strong> the DC current-to-voltage conversion to AC<br />
The signal-gain versus frequency characteristics <strong>of</strong> a current-to-voltage converter at<br />
different gain selections are different because the 3 dB upper roll-<strong>of</strong>f points are usually at<br />
different frequencies. In practice, fine tuning <strong>of</strong> the feedback capacitances to obtain the<br />
same 3 dB roll-<strong>of</strong>f frequencies is either a very difficult or an impossible task.<br />
In order to describe the signal-gain <strong>of</strong> a photocurrent-to-voltage converter in AC<br />
measurement mode, Eq. 3 (that describes the DC signal-gain only) must be extended with<br />
the frequency dependent components <strong>of</strong> the loop-gain <strong>and</strong> the current-to-voltage<br />
conversion [2]:<br />
1 1<br />
G S ( ω)<br />
= R<br />
(7)<br />
−<br />
1+<br />
jωRC<br />
1+<br />
[ ] 1<br />
G ( ω)<br />
L<br />
In order to achieve low photocurrent-to-voltage conversion uncertainty in AC mode, both<br />
the current-to-voltage conversion <strong>and</strong> the loop-gain are to be optimized at the signal<br />
(chopping) frequency.<br />
When the above described DC photocurrent-to-voltage conversion scale is extended to<br />
AC, even if the signal frequency is kept constant, additional AC mode measurements are<br />
needed. The above determined DC signal-gains are the reference values <strong>of</strong> a DC <strong>and</strong> AC<br />
mode current-to-voltage converter for signal frequencies close to 0 Hz. In order to<br />
propagate the DC signal-gain scale to higher signal frequencies, the signal-gain versus<br />
frequency curves are to be known for all signal-gain selections <strong>of</strong> the converter. When<br />
these curves are known, the above discussed current-to-voltage converter st<strong>and</strong>ard can be<br />
used in AC mode as well.<br />
As an example, Fig. 3 shows the measured signal-gain versus frequency curve <strong>of</strong> the<br />
current-to-voltage converter st<strong>and</strong>ard (discussed above) for one signal-gain selection. The<br />
photocurrent from a Si tunnel-trap detector-st<strong>and</strong>ard was converted into voltage by the<br />
converter st<strong>and</strong>ard, using signal-gain 10 5 V/A, <strong>and</strong> the voltage was measured by a lock-in<br />
amplifier. During the measurement, the detector-st<strong>and</strong>ard was illuminated by the chopped<br />
radiation <strong>of</strong> a tungsten halogen lamp. The frequency <strong>of</strong> the chopper was tuned from 4 Hz<br />
to 180 Hz <strong>and</strong> the lock-in amplifier was synchronized to the chopping (signal) frequency.<br />
Each data point is an average <strong>of</strong> 20 measurements. The data points are shown with an<br />
open circle on the left-Y logarithmic scale. This AC signal-gain curve is used as a relative<br />
curve <strong>and</strong> it will be converted into an absolute curve using a DC (0 Hz) absolute tie point<br />
(as discussed above). The st<strong>and</strong>ard deviation <strong>of</strong> the mean <strong>of</strong> the 20 measurements is<br />
shown with open squares on the linear right-Y axis <strong>of</strong> the graph. The frequency (X-axis)<br />
scale is also a logarithmic scale to obtain the popular Bode-plot for the signal-gain<br />
function. As shown in the graph, a one-time-constant RC roll-<strong>of</strong>f curve-fit was applied to<br />
the measured (response) data points:
0.35<br />
0.34<br />
0.33<br />
0.32<br />
0.31<br />
0.3<br />
0.29<br />
0.28<br />
0.27<br />
y = m1/sqrt((1+(M0/m2)^ 2))<br />
m1<br />
m2<br />
Chisq<br />
R<br />
Value<br />
0.34417<br />
236.42<br />
2.1499e-6<br />
0.99996<br />
Error<br />
4.1224e-5<br />
0.19455<br />
NA<br />
NA<br />
10 100<br />
Frequency [Hz]<br />
1.5 10 -4<br />
1 10 -4<br />
5 10 -5<br />
Fig. 3. Frequency dependent response <strong>of</strong> the converter st<strong>and</strong>ard at signal-gain 10 5 V/A.<br />
m<br />
1<br />
2<br />
0<br />
1 ⎟ y =<br />
⎛ M ⎞<br />
+ ⎜<br />
(8)<br />
⎜<br />
⎝ m<br />
where m1 is the DC response, M0 is the frequency, <strong>and</strong> the upper roll-<strong>of</strong>f frequency is<br />
1<br />
m2<br />
= = 236.4 Hz.<br />
2πRC<br />
The fit verifies that the upper roll-<strong>of</strong>f <strong>of</strong> a Si-photodiode current meter is exclusively<br />
determined by the time constant <strong>of</strong> the feedback RC components [2].<br />
The integrating time-constant at this 10 5 V/A signal-gain (see Section 4) is R2C2=6.8 x<br />
10 -4 s gives a 3 dB upper roll-<strong>of</strong>f frequency <strong>of</strong> 234.2 Hz. The 3 dB roll-<strong>of</strong>f frequency<br />
obtained from the curve fit is slightly higher because the actual C2 is different from the<br />
6.8 nF nominal value <strong>of</strong> the (externally connected) feedback capacitor. From the fit<br />
parameters <strong>and</strong> the st<strong>and</strong>ard deviation <strong>of</strong> the data points, an AC measurement uncertainty<br />
<strong>of</strong> 0.04 % (k=2) can be estimated.<br />
Similar signal-gain versus frequency measurements were made for the other signal-gain<br />
selections as well. The one-time-constant curve-fit worked well for all signal-gain<br />
selections. The results are summarized in Table 4.<br />
2<br />
⎠<br />
0<br />
(9)
Table 4.<br />
Results <strong>of</strong> the 3 dB upper roll-<strong>of</strong>f frequency measurements from one-time-constant<br />
curve fits at the different signal-gain selections <strong>of</strong> the converter st<strong>and</strong>ard.<br />
3 dB roll-<strong>of</strong>f<br />
nominal frequency<br />
3 dB roll-<strong>of</strong>f<br />
measured frequency<br />
St<strong>and</strong>ard deviation<br />
<strong>of</strong> the signal mean<br />
[%] (k=1)<br />
Signal gain<br />
[V/A]<br />
[Hz]<br />
[Hz]<br />
10 4 2341.7 3131.5 0.014<br />
10 5 234.2 236.4 0.015<br />
10 6 106.2 102.7 0.02<br />
10 7 106.2 105.3 0.025<br />
10 8 93.7 91.5 0.025<br />
At signal-gain 10 8 V/A, the nominal frequency was calculated with a 2 pF estimated stray<br />
capacitance parallel connected to the C5=15 pF feedback capacitor. The st<strong>and</strong>ard<br />
deviation <strong>of</strong> the measured data points are shown for all signal-gain selections in the last<br />
column. The above described 0.04 % (k=2) relative exp<strong>and</strong>ed uncertainty <strong>of</strong> the signalgain<br />
10 5 V/A also applies to the signal-gains <strong>of</strong> 10 4 V/A <strong>and</strong> 10 6 V/A. The uncertainty<br />
(shown by the st<strong>and</strong>ard deviations) is increased to 0.05 % (k=2) for the signal gains <strong>of</strong><br />
10 7 V/A <strong>and</strong> 10 8 V/A.<br />
The results indicate that the signal-gain versus frequency measurements may not be<br />
needed if the C feedback capacitors are measured (before mounting them into the circuit)<br />
<strong>and</strong> the parallel stray capacitances are known. In this case, the RC time constants <strong>and</strong><br />
then the relative roll-<strong>of</strong>f functions can be calculated. The uncertainty may increase at the<br />
higher gain selections where the value <strong>of</strong> the parallel stray capacitance is comparable to<br />
the value <strong>of</strong> the externally connected feedback capacitor. The parallel stray capacitance<br />
that can be performed with a regular printed-circuit-board (PCB) design is about 2 pF.<br />
This capacitance can be decreased by an order <strong>of</strong> magnitude if three layers are<br />
implemented on the PCB. In this case, the inverting-input <strong>and</strong> the output pin <strong>of</strong> the<br />
operational amplifier are to be soldered to two different layers (the top <strong>and</strong> bottom) that<br />
are separated with the shielded (third) copper layer to minimize the stray capacitance<br />
between the input <strong>and</strong> the output (where the feedback resistors are connected).<br />
Even if the relative roll-<strong>of</strong>f functions can be calculated, measurement <strong>of</strong> the frequency<br />
dependent signal-gains may be necessary to avoid gain peaking. Optimization <strong>of</strong> the<br />
signal- <strong>and</strong> the loop-gains needs partial frequency compensations for the different gain<br />
selections [2]. Frequency compensation can be applied to eliminate gain peaking.<br />
For an AC measuring test current-to-voltage converter, the reference values (tie points) <strong>of</strong><br />
the signal-gain versus frequency functions are the DC signal-gains. Usually, the signalgain<br />
at a given signal frequency is not transferred directly from the reference current-tovoltage<br />
converter to the test AC-mode converter. Only the DC signal-gains are<br />
transferred from the reference converter to the AC-mode test converter. In detector<br />
responsivity measurements, using the here discussed method, the DC responsivity <strong>of</strong> the
detector st<strong>and</strong>ard can be extended to the AC measuring current-to-voltage converter<br />
attached to the detector. Usually, <strong>NIST</strong> reports the DC responsivity <strong>of</strong> the issued<br />
detector-st<strong>and</strong>ard without the signal-gain <strong>of</strong> the current-to-voltage converter st<strong>and</strong>ard<br />
used to calibrate this detector. In this case, the signal-gain versus frequency curves <strong>of</strong> the<br />
AC measuring test converter (used with the <strong>NIST</strong> issued detector st<strong>and</strong>ard) should be<br />
known to extend the detector DC responsivity with the AC signal-gain <strong>of</strong> the attached<br />
test-converter at the signal (chopping) frequency. This method can produce similar AC<br />
signal-gain uncertainties for both the reference <strong>and</strong> the test current-to-voltage converter.<br />
Since the DC <strong>and</strong> AC signal-gain calibration uncertainties are r<strong>and</strong>om <strong>and</strong> uncorrelated,<br />
the root-mean-square-sum <strong>of</strong> the DC <strong>and</strong> AC signal-gain uncertainties will produce the<br />
combined uncertainty <strong>of</strong> an AC-operated test current-to-voltage converter.<br />
8. Conclusions<br />
In order to satisfy the less than 0.02 % (k=2) exp<strong>and</strong>ed total uncertainty requirement <strong>of</strong><br />
<strong>NIST</strong> reference radiometric calibrations, a new calibration method <strong>and</strong> procedure has<br />
been developed for calibrating the signal-gains <strong>of</strong> current-to-voltage converters that<br />
operate in a wide photocurrent range. A reference current-to-voltage converter has been<br />
developed where all the feedback resistors are inside <strong>of</strong> an electrically shielded housing<br />
to avoid noise pickup. The feedback resistors from 10 kΩ to 100 MΩ have been<br />
calibrated at the <strong>NIST</strong> Quantum Electrical Metrology Division against resistor st<strong>and</strong>ards.<br />
The 0.0116 % exp<strong>and</strong>ed uncertainty (k=2) <strong>of</strong> the 10 8 Ω feedback resistor <strong>of</strong> the converter<br />
st<strong>and</strong>ard made it possible to realize a photocurrent measurement scale with 0.012 % (k=2)<br />
uncertainty for the 10 8 V/A <strong>and</strong> 10 9 V/A gains, <strong>and</strong> 0.01 % (k=2) uncertainties for the<br />
lower gains. These are about a factor <strong>of</strong> three improved uncertainties over the<br />
uncertainties <strong>of</strong> our traditional (external reference-resistor based) calibrations at the<br />
10 9 V/A signal-gain. During the scale realization, the stable output current <strong>of</strong> a DC<br />
current source <strong>of</strong> high output-resistance was measured with the current-to-voltage<br />
converter st<strong>and</strong>ard. The output <strong>of</strong>fset voltage <strong>of</strong> the converter was compensated at both<br />
the scale realization <strong>and</strong> the following scale transfer. Secondary (<strong>and</strong> field) current-tovoltage<br />
converters up to 10 GΩ feedback resistors could be calibrated against the<br />
reference current-to-voltage converter using the (converter) substitution method. The<br />
uncertainty obtained at the 10 GΩ (maximum) feedback resistor <strong>of</strong> a test converter, was<br />
an order <strong>of</strong> magnitude lower than with the traditional method. Following the electronic<br />
signal-gain calibrations <strong>of</strong> the current-to-voltage converters, considerations have been<br />
made for the minimum shunt resistances <strong>of</strong> the photodiodes that can be connected to the<br />
input <strong>of</strong> the calibrated converters. As a result <strong>of</strong> high photodiode shunt-resistance<br />
selections, a 10 pA photocurrent can be measured with 0.016 % (k=2) uncertainty. By<br />
determining the gain versus frequency characteristics <strong>of</strong> the converter st<strong>and</strong>ard for all<br />
signal-gain selections, the method/procedure (based on the converter st<strong>and</strong>ard) was<br />
extended to AC mode calibrations where the signal-gain uncertainty was 0.05 % (k=2).<br />
It is planned to compare the current-to-voltage converter st<strong>and</strong>ard with reference lowcurrent<br />
sources at 10 pA <strong>and</strong> 100 pA.
References<br />
[1] S. W. Brown, G. P. Eppeldauer, <strong>and</strong> K. R. Lykke, Facility for Spectral Irradiance<br />
<strong>and</strong> Radiance Responsivity Calibrations using Uniform Sources, Applied Optics, Vol. 45,<br />
No. 32, p. 8218-8237, 2006.<br />
[2] G. P. Eppeldauer, <strong>NIST</strong> <strong>Technical</strong> <strong>Note</strong> 1438, Optical Radiation Measurement with<br />
Selected Detectors <strong>and</strong> Matched Electronic Circuits Between 200 nm <strong>and</strong> 20 µm, U.S.<br />
Government Printing Office, Washington, DC, 20402, 2001.<br />
[3] G. Rietveld, P. de la Court, <strong>and</strong> H. E. van den Brom, Intrinsically stable CCC for<br />
accurate measurement <strong>of</strong> small currents, Conference on Precision Electromagnetic<br />
Measurements (CPEM), Conference Digest, p. 156-157, 8-13 June 2008, Broomfield,<br />
Colorado.<br />
[4] W-S Kim, M-S Kim, K-T Kim, Y. chong, H-J Kim, M. Kim, <strong>and</strong> H. N. Tauscher, A<br />
high precision calibration setup for low-current meters in the range <strong>of</strong> 10 pA to 1 fA,<br />
Conference on Precision Electromagnetic Measurements (CPEM), Conference Digest, p.<br />
358-359, 8-13 June 2008, Broomfield, Colorado.<br />
[5] P. P. Capra, F. Galliana, <strong>and</strong> M. Astrua, A measurement setup to calibrate<br />
picoammeters in DC current in the range 100 pA – 100 nA, Conference on Precision<br />
Electromagnetic Measurements (CPEM), Conference Digest, p. 578-579, 8-13 June 2008,<br />
Broomfield, Colorado.<br />
[6] P. Sipila, R. Rajala, P. Karha, A. Manninen, <strong>and</strong> E. Ikonen, Calibration <strong>of</strong> currentto-voltage<br />
converters for radiometric applications at picoampere level, Proc. NEWRAD,<br />
p. 223-224, 17-19 October 2005, Ed. J. Grobner, Physikalisch-Meteoroligisches<br />
Observatorium Davos, Weltstrahlungszentrum, Switzerl<strong>and</strong>.<br />
[7] Certain commercial equipment, instruments, or materials are identified in this paper<br />
to foster underst<strong>and</strong>ing. Such identification does not imply recommendation or<br />
endorsement by the <strong>National</strong> <strong>Institute</strong> <strong>of</strong> <strong>St<strong>and</strong>ards</strong> <strong>and</strong> Technology, nor does it imply<br />
that the material or equipment are necessarily the best available for the purpose.