

world cancer report - iarc
world cancer report - iarc
world cancer report - iarc

Create successful ePaper yourself
Turn your PDF publications into a flip-book with our unique Google optimized e-Paper software.
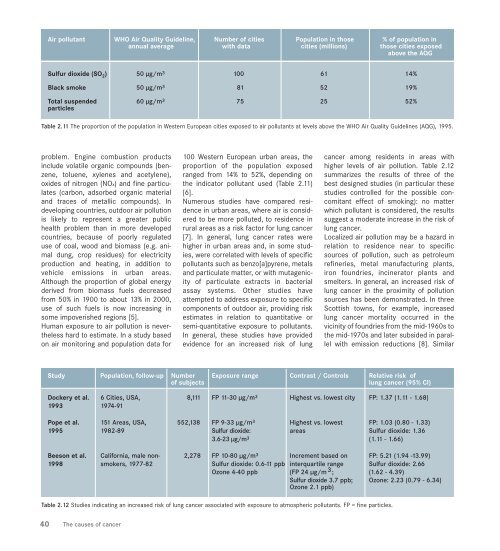
Air pollutant WHO Air Quality Guideline, Number of cities Population in those % of population in<br />
annual average with data cities (millions) those cities exposed<br />
above the AQG<br />
Sulfur dioxide (SO 2) 50 µg/m 3 100 61 14%<br />
Black smoke 50 µg/m 3 81 52 19%<br />
Total suspended 60 µg/m 3 75 25 52%<br />
particles<br />
Table 2.11 The proportion of the population in Western European cities exposed to air pollutants at levels above the WHO Air Quality Guidelines (AQG), 1995.<br />
problem. Engine combustion products<br />
include volatile organic compounds (benzene,<br />
toluene, xylenes and acetylene),<br />
oxides of nitrogen (NOx) and fine particulates<br />
(carbon, adsorbed organic material<br />
and traces of metallic compounds). In<br />
developing countries, outdoor air pollution<br />
is likely to represent a greater public<br />
health problem than in more developed<br />
countries, because of poorly regulated<br />
use of coal, wood and biomass (e.g. animal<br />
dung, crop residues) for electricity<br />
production and heating, in addition to<br />
vehicle emissions in urban areas.<br />
Although the proportion of global energy<br />
derived from biomass fuels decreased<br />
from 50% in 1900 to about 13% in 2000,<br />
use of such fuels is now increasing in<br />
some impoverished regions [5].<br />
Human exposure to air pollution is nevertheless<br />
hard to estimate. In a study based<br />
on air monitoring and population data for<br />
40 The causes of <strong>cancer</strong><br />
100 Western European urban areas, the<br />
proportion of the population exposed<br />
ranged from 14% to 52%, depending on<br />
the indicator pollutant used (Table 2.11)<br />
[6].<br />
Numerous studies have compared residence<br />
in urban areas, where air is considered<br />
to be more polluted, to residence in<br />
rural areas as a risk factor for lung <strong>cancer</strong><br />
[7]. In general, lung <strong>cancer</strong> rates were<br />
higher in urban areas and, in some studies,<br />
were correlated with levels of specific<br />
pollutants such as benzo[a]pyrene, metals<br />
and particulate matter, or with mutagenicity<br />
of particulate extracts in bacterial<br />
assay systems. Other studies have<br />
attempted to address exposure to specific<br />
components of outdoor air, providing risk<br />
estimates in relation to quantitative or<br />
semi-quantitative exposure to pollutants.<br />
In general, these studies have provided<br />
evidence for an increased risk of lung<br />
<strong>cancer</strong> among residents in areas with<br />
higher levels of air pollution. Table 2.12<br />
summarizes the results of three of the<br />
best designed studies (in particular these<br />
studies controlled for the possible concomitant<br />
effect of smoking): no matter<br />
which pollutant is considered, the results<br />
suggest a moderate increase in the risk of<br />
lung <strong>cancer</strong>.<br />
Localized air pollution may be a hazard in<br />
relation to residence near to specific<br />
sources of pollution, such as petroleum<br />
refineries, metal manufacturing plants,<br />
iron foundries, incinerator plants and<br />
smelters. In general, an increased risk of<br />
lung <strong>cancer</strong> in the proximity of pollution<br />
sources has been demonstrated. In three<br />
Scottish towns, for example, increased<br />
lung <strong>cancer</strong> mortality occurred in the<br />
vicinity of foundries from the mid-1960s to<br />
the mid-1970s and later subsided in parallel<br />
with emission reductions [8]. Similar<br />
Study Population, follow-up Number Exposure range Contrast / Controls Relative risk of<br />
of subjects lung <strong>cancer</strong> (95% CI)<br />
Dockery et al. 6 Cities, USA, 8,111 FP 11-30 µg/m 3 Highest vs. lowest city FP: 1.37 (1.11 - 1.68)<br />
1993 1974-91<br />
Pope et al. 151 Areas, USA, 552,138 FP 9-33 µg/m 3 Highest vs. lowest FP: 1.03 (0.80 - 1.33)<br />
1995 1982-89 Sulfur dioxide: areas Sulfur dioxide: 1.36<br />
3.6-23 µg/m 3 (1.11 - 1.66)<br />
Beeson et al. California, male non- 2,278 FP 10-80 µg/m 3 Increment based on FP: 5.21 (1.94 -13.99)<br />
1998 smokers, 1977-82 Sulfur dioxide: 0.6-11 ppb interquartile range Sulfur dioxide: 2.66<br />
Ozone 4-40 ppb (FP 24 µg/m 3 ; (1.62 - 4.39)<br />
Sulfur dioxide 3.7 ppb; Ozone: 2.23 (0.79 - 6.34)<br />
Ozone 2.1 ppb)<br />
Table 2.12 Studies indicating an increased risk of lung <strong>cancer</strong> associated with exposure to atmospheric pollutants. FP = fine particles.


