Batch coffee roasting - 11th International Congress on Engineering ...
Batch coffee roasting - 11th International Congress on Engineering ...
Batch coffee roasting - 11th International Congress on Engineering ...

Create successful ePaper yourself
Turn your PDF publications into a flip-book with our unique Google optimized e-Paper software.
<str<strong>on</strong>g>Batch</str<strong>on</strong>g> <str<strong>on</strong>g>coffee</str<strong>on</strong>g> <str<strong>on</strong>g>roasting</str<strong>on</strong>g>; <str<strong>on</strong>g>roasting</str<strong>on</strong>g> energy use; reducing that use<br />
Henry Schwartzberg<br />
Food Science Dept., Univ. of Massachusetts, Amherst, Mass. United States (schwartzberg@foodsci.umass.edu)<br />
ABSTRACT<br />
This paper deals with: a) batch <str<strong>on</strong>g>roasting</str<strong>on</strong>g> of <str<strong>on</strong>g>coffee</str<strong>on</strong>g> beans, b) energy use for such <str<strong>on</strong>g>roasting</str<strong>on</strong>g>, and c) means for<br />
reducing such use. Overall heat and material balances are used to analyze: roaster energy c<strong>on</strong>sumpti<strong>on</strong> for<br />
batch, gas-fired roasters with afterburners; and the feasibility of methods for reducing such c<strong>on</strong>sumpti<strong>on</strong>.<br />
Coffee Roasting; Afterburning; Flame Temperature; Volatile Organic Compounds; Stack gas heat recovery<br />
INTRODUCTION<br />
6.7 billi<strong>on</strong> kg of <str<strong>on</strong>g>coffee</str<strong>on</strong>g> beans are roasted worldwide annually, mostly in batch roasters. Near the end of<br />
roasts, <str<strong>on</strong>g>roasting</str<strong>on</strong>g> <str<strong>on</strong>g>coffee</str<strong>on</strong>g> emits volatile organic compounds (VOC) and CO, which in many industrialized<br />
countries have to be oxidized in afterburners. Roasting and afterburning uses roughly 11.2x10 12 kJ fuel<br />
energy/year and causes emissi<strong>on</strong> of roughly 7.0x10 8 kg CO2/year. This paper aims to help readers understand<br />
<str<strong>on</strong>g>coffee</str<strong>on</strong>g> <str<strong>on</strong>g>roasting</str<strong>on</strong>g> with afterburning and factors determining energy use for such <str<strong>on</strong>g>roasting</str<strong>on</strong>g>, and presents and<br />
evaluates ways to reduce such use.<br />
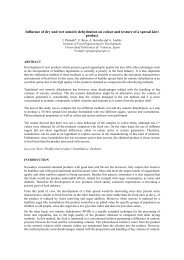
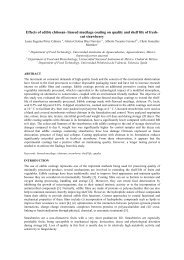
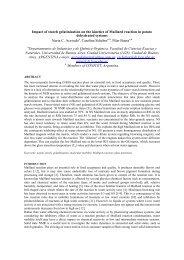
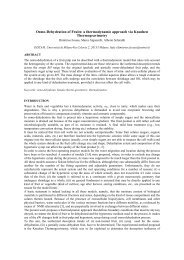
Figure 1 Comp<strong>on</strong>ents, flow layout and stream masses and temperatures for a gas-fired batch <str<strong>on</strong>g>coffee</str<strong>on</strong>g> roaster where roaster<br />
gas recirculates and which is equipped with an afterburner.
Fig. 1 depicts basic comp<strong>on</strong>ents and stream mass flows and temperatures for a gas-fired batch roaster with<br />
afterburner. Stream temperatures, e.g. TGI, the temperature of gas entering the <str<strong>on</strong>g>roasting</str<strong>on</strong>g> chamber, (chamber for<br />
short) are enclosed in parentheses in Fig.1, but not in the text of this paper. Most temperatures vary during<br />
<str<strong>on</strong>g>roasting</str<strong>on</strong>g>, e.g. bean temperature, TB, and TGO, the temperature of gas leaving the <str<strong>on</strong>g>roasting</str<strong>on</strong>g> chamber, increase<br />
progressively. Other stream temperatures may remain c<strong>on</strong>stant, e.g. TAB, the temperature at which<br />
afterburning occurs, preferably should be automatically kept c<strong>on</strong>stant. Mean-effective stream temperatures<br />
will sometimes be used later in enthalpy balances. The mass flows, shown in italics, are the total mass of a<br />
stream that enters or leaves a roaster comp<strong>on</strong>ent during a roast. Stream flow rates vary during roasts, but total<br />
stream masses will be used later for mass and enthalpy balances. The term “gas”, by itself, will be taken to<br />
mean air partly depleted in oxygen and c<strong>on</strong>taining CO2 and H2O produced by combusti<strong>on</strong> of fuel gas (e.g.<br />
natural gas) plus H2O, CO2, VOC and CO emitted by <str<strong>on</strong>g>roasting</str<strong>on</strong>g> <str<strong>on</strong>g>coffee</str<strong>on</strong>g>. Mass (G – FR) of gas is heated from<br />
TGO to TGI by mixing it in the furnace with mass FR of burner gas (whose temperature is TF). The blower<br />
draws the mixture into the chamber, where it c<strong>on</strong>tacts and transfers heat to the batch of <str<strong>on</strong>g>coffee</str<strong>on</strong>g> beans.<br />
Chamber Gas-Inlet Temperature:<br />
TGI usually ranges from 235ºC to 535ºC, but TGI as low as 220ºC [1] and as high as 650ºC [2] have been used.<br />
Prol<strong>on</strong>ged use of TGI > 535ºC tends to cause bean tips and edges to burn. The heat capacity of burner gas and<br />
roaster gas are roughly equal. Therefore, based <strong>on</strong> an enthalpy balance around the furnace:<br />
TGI = TGO + ′ F R<br />
G' (T (13<br />
F − TGO) F’R is the burner-gas mass-inflow rate in the furnace and G’ the mass flow rate of gas into the chamber. In<br />
some roasters, F’R undergoes <strong>on</strong>e of two step- decreases at late stages of <str<strong>on</strong>g>roasting</str<strong>on</strong>g>, but remains c<strong>on</strong>stant, albeit<br />
at a different level, before and after a step. If so, TGI progressively increases while F’R remains c<strong>on</strong>stant<br />
(because G’ decreases progressively as <str<strong>on</strong>g>roasting</str<strong>on</strong>g> proceeds), but decreases a step each time F’R decreases. In<br />
other more-modern roasters, F’R is automatically adjusted so as to keep TGI c<strong>on</strong>stant, or to c<strong>on</strong>trol how TGI<br />
varies during a roast. TF is determined by the combusti<strong>on</strong>-air/fuel-gas ratio used. Since that ratio is<br />
automatically kept c<strong>on</strong>stant, TF remains c<strong>on</strong>stant.<br />
Green Bean Load:<br />
The total weight of a batch of green <str<strong>on</strong>g>coffee</str<strong>on</strong>g> bean is R. Its initial temperature is TBO. Its dry weight is RD; and<br />
the weight of bean moisture is RDX0. About 75% of beans used in commerce are of Arabica varieties (e.g.<br />
Columbians, Santos, Costa Ricans, Kenyans, etc.) and about 25% are of Robusta varieties (e.g. beans from<br />
Viet-Nam, Uganda, Ivory Coast). Robustas are of lower quality, but are less costly. With minor excepti<strong>on</strong>s,<br />
beans are roughly hemi-ellipsoidal and have a groove <strong>on</strong> their flatter surface. Green bean lots are graded in<br />
size to prevent uneven <str<strong>on</strong>g>roasting</str<strong>on</strong>g>. Arabica beans in the large-size range are roughly 10.3 mm l<strong>on</strong>g, 7.3 mm<br />
wide and 4 mm high. In the smallest commercial-size range, Arabica bean dimensi<strong>on</strong>s are roughly three<br />
quarters as large. Length/width ratios for Robustas are smaller than for Arabicas. 120 kg green beans, a<br />
typical load for a medium-size batch roaster, c<strong>on</strong>tains roughly 700,000 large beans, or, if the smallest<br />
commercial size is used, roughly 1,570,00 beans. <str<strong>on</strong>g>Batch</str<strong>on</strong>g>es for very large roasters are four times as large.<br />
Roasting Induced Changes:<br />
Chamber elements or pneumatic transport c<strong>on</strong>tinually mix freshly heated beans with the rest of the batch,<br />
thereby improving bean-to-bean uniformity of heating. As bean temperature, TB, rises; moisture vaporizes<br />
within beans and diffuses out of them, but not fast enough to prevent steam pressure build up inside the cells<br />
in beans. The beans soften; and the internal steam pressure causes them to expand [3]. As the beans expand,<br />
they release parchment (chaff) previously covering beans or trapped in the groove in beans. RDS indicates the<br />
mass of chaff released. Moisture loss ultimately causes beans to harden [3], setting the expansi<strong>on</strong>.<br />
Thermally stimulated <str<strong>on</strong>g>roasting</str<strong>on</strong>g> reacti<strong>on</strong>s inside bean cells and in their walls produce over eight-hundred<br />
identified reacti<strong>on</strong> products and a wide variety of intermediate compounds. A small fracti<strong>on</strong> of the products<br />
have very desirable flavors and aromas prized by c<strong>on</strong>sumers in roasted <str<strong>on</strong>g>coffee</str<strong>on</strong>g>. Pigmented reacti<strong>on</strong> products<br />
cause bean color, originally light green or tan, to turn brown and progressively darken [4,5]. The reacti<strong>on</strong>s<br />
also cause beans to lose dry matter in the form of reacti<strong>on</strong>-generated water vapor, CO2, [3,5,6] CO [6,7] and<br />
volatile organic compounds (VOC) [6,8]. RDP indicates the total mass of dry matter mass lost, including<br />
chaff. Virtually all of the bean’s initial moisture c<strong>on</strong>tent probably evaporates by the time the beans reach their<br />
end-of-roast temperature, TBF. If so, the moisture in roasted beans c<strong>on</strong>sists of reacti<strong>on</strong>-formed water that has<br />
not yet evaporated plus absorbed quench water; and the mass of beans at the end of the roast, but prior to<br />
quenching, = RD(1 – P). Static pressures are kept negative in most <str<strong>on</strong>g>roasting</str<strong>on</strong>g> chambers to prevent escape of
gas, vapor and smoke. Therefore fresh air leaks into the chamber. A indicates the total mass of fresh air that<br />
leaks into the chamber during a roast.<br />
Gas Temperature Changes:<br />
Since the gas transfers heat to beans, it leaves the chamber at temperature TGO, which is substantially lower<br />
than inlet temperature, TGI. The leaving gas c<strong>on</strong>tains in-leaked air, entrained chaff, evaporated bean moisture<br />
and gas and vapor produced by dry matter breakdown. Thus, its total mass = G + A + RD(X0 + P), while the<br />
total entering mass = G. The leaving gas then passes through the blower and the cycl<strong>on</strong>e, which removes<br />
entrained chaff, i.e. mass RDS. Then the gas splits into two streams: a larger <strong>on</strong>e, which passes through the<br />
furnace and recycles to the chamber; and a smaller <strong>on</strong>e, which passes through the afterburner.<br />
VOC Oxidati<strong>on</strong> - Afterburners:<br />
In the afterburner, the gas is heated to TAB by admixing a sec<strong>on</strong>d stream of burner gas (mass FAB at<br />
temperature TF). If TAB is high enough and gas-residence time in the afterburner is adequately l<strong>on</strong>g, enough<br />
VOC will oxidize to yield stack gas c<strong>on</strong>taining less than 50 ppm VOC, i.e. a VOC level that satisfies German<br />
regulati<strong>on</strong>s. VOC are also partially destroyed when roaster gas passes through the roaster furnace. Therefore,<br />
even without afterburning, stack VOC levels can be as low as 300 ppm when all chamber-discharge gas<br />
passes through the furnace [9]. When all chamber-discharge gas does not pass through the furnace and<br />
afterburning is not used, VOC levels in stack gas typically are roughly 1,650 ppm [9] and increase markedly<br />
as TBF increases [6]. Catalytic afterburners for <str<strong>on</strong>g>coffee</str<strong>on</strong>g> roasters require TAB ≥ 400ºC and 0.05 s to 0.1 s of gas<br />
residence time. The catalyst has to be replaced every three or four years, and should be used with a pre-filter<br />
to prevent particulate matter from blinding it. A supplementary blower is often required to overcome pressure<br />
drop across the catalyst bed and pre-filter. Thermal afterburners are cheaper, but require TAB ≥ 760ºC and 0.4<br />
s of gas residence time when used for <str<strong>on</strong>g>coffee</str<strong>on</strong>g> roasters. VOC levels in feeds for thermal and catalytic<br />
afterburner should be less than 25% of their lower explosive limit (L.E.L.). L.E.L typically range from<br />
around 10,000 to 30,000 ppm. Peak VOC levels as high as 10,000 ppm [10], i.e. potentially explosive levels,<br />
have been reported (very likely for the end of a very dark roast). Regenerative thermal oxidizers (RTO) use<br />
regenerative heat exchange to heat afterburner feeds from TGO to appropriate TAB and then cool discharged<br />
gas almost to TGO. Thus they require little or no heat input after start-up [11]. RTO should <strong>on</strong>ly be used for<br />
feed VOC levels less than 10% of their L.E.L. RTO also require frequent switching of flow directi<strong>on</strong> through<br />
the regenerator bed or beds and, at present, rarely are used for <str<strong>on</strong>g>coffee</str<strong>on</strong>g> roasters.<br />
NOX and CO:<br />
Nitrogen oxides (NOX) are generated in roaster furnace burners and in the burners used for VOC oxidizers.<br />
The higher the burner temperature the greater the NOX level. Thus afterburning reduces VOC levels, but<br />
produces NOX. NOX emissi<strong>on</strong> levels for <str<strong>on</strong>g>coffee</str<strong>on</strong>g> roasters are higher for darker roasts [11], i.e. roasts where<br />
large amounts of VOC are produced. NOX levels can be reduced roughly 50% by use of low NOX burners,<br />
i.e. burners where combusti<strong>on</strong> products recycle into the combusti<strong>on</strong> z<strong>on</strong>e. Because little heat producti<strong>on</strong> is<br />
needed to operate RTO, less NOX would be emitted if they were used [11]. EU regulati<strong>on</strong>s limit NOX<br />
emissi<strong>on</strong> to 100 mg/N m 3 . New catalyst formulati<strong>on</strong>s can reduce NOX levels to 50 ppm (≈ 52 mg/N m 3 ).<br />
Many intermediates, including CO are produced as VOC oxidize. EU regulati<strong>on</strong>s limit CO emissi<strong>on</strong> levels to<br />
100 mg/N m 3 . CO is emitted by <str<strong>on</strong>g>roasting</str<strong>on</strong>g> beans; and even more CO can be produced by improperly adjusted<br />
burners, partial oxidati<strong>on</strong> of VOC in roaster furnaces or by incomplete oxidati<strong>on</strong> of VOC in afterburners, e.g.<br />
due to: loss of catalyst activity, insufficient residence time, channelling, or TAB being too low.<br />
Gas Input and Output:<br />
Gas mass holdup variati<strong>on</strong> in the roaster system is negligible. Therefore the total gas mass leaving the system<br />
via the stack equals the sum of the total mass of entering gas and the total mass of gas and vapor emitted by<br />
beans, i.e. = F + A + RD(X0 + P – S), where F = FR + FAB. Similar mass balances apply for gas stream<br />
masses at intermediate points al<strong>on</strong>g the gas-flow path.<br />
R Roasters:<br />
The flow layout in Fig. 1 is for an R roaster, i.e. a roaster where most gas leaving the chamber recycles to the<br />
chamber. R roasters usually are used for <str<strong>on</strong>g>roasting</str<strong>on</strong>g> large and medium sized batches, i.e. batches > 60 kg. In<br />
many older R roasters, chamber-discharge gas heats to TGI in the furnace before splitting into a recycle<br />
stream and afterburner feed, which is not heated further when TGI > TAB. Catalytic afterburners usually are<br />
used with R roasters [11]. Comp<strong>on</strong>ent sequences for some R roasters may differ from the sequence shown in<br />
Fig. 1 [12]; e.g. the cycl<strong>on</strong>e may come before the blower; or an added blower or blowers may be used to
overcome high local pressure drops. In Neohaus Neotec RFB roasters, high-speed gas flow causes spoutinginduced<br />
bean circulati<strong>on</strong> in the chamber [12]; a blower located just before the chamber provides the needed<br />
gas pressure; and static pressures are positive in the chamber, which is well sealed. Then A = 0. Air inleakage<br />
is further minimized by having furnace-discharge gas bypass the chamber during the loading and<br />
unloading of beans. A is positive for roughly 90% of roasters.<br />
SP Roasters:<br />
In single-pass (SP) roasters gas passes through the roaster <strong>on</strong>ly <strong>on</strong>ce. SP roasters usually are used for small<br />
batch roasts, where R < 60 kg and sometimes is as small as 2.5 kg. In many SP roasters, fresh air, drawn in<br />
by the blower, mixes with flames from a set of lance burners. Then the mixed gas flows through the <str<strong>on</strong>g>roasting</str<strong>on</strong>g><br />
chamber, blower, cycl<strong>on</strong>e and afterburner. Towards the end of a roast, first <strong>on</strong>e burner and then another is<br />
turned off, thereby reducing F’R and TGI in steps. Other SP roasters are equipped with a furnace with a single<br />
c<strong>on</strong>tinuously adjustable burner, where F’R can be smoothly changed. The furnace output gas flows directly<br />
through the <str<strong>on</strong>g>roasting</str<strong>on</strong>g> chamber, blower, cycl<strong>on</strong>e and afterburner. Thermal afterburners usually are used for<br />
small roasters [11].<br />
Ending Roasts – Bean Cooling:<br />
The outcome of <str<strong>on</strong>g>coffee</str<strong>on</strong>g> <str<strong>on</strong>g>roasting</str<strong>on</strong>g> reacti<strong>on</strong>s depends <strong>on</strong> initial reactant c<strong>on</strong>centrati<strong>on</strong>s, which, in turn, depends<br />
<strong>on</strong> bean variety and source; and <strong>on</strong> how TB varies with time, t, i.e. the “TB profile”. In industrial roasters, bean<br />
temperatures are measured with sturdy sheathed probes, which provide measured temperatures, i.e. TBM,<br />
instead of TB [13]. Often, roasts are ended when TBM reaches a set value that corresp<strong>on</strong>ds to TBF. Coffee flavor<br />
and aroma development will be inadequate if TBF is less than 190ºC. In most R roasters, a c<strong>on</strong>trolled volume<br />
of quench water is sprayed <strong>on</strong> the beans when the end-of-roast TBM is reached. Most of the water evaporates,<br />
thereby cooling the beans rapidly and stopping the roast. In most cases, the beans then discharge into the<br />
cooling tray. There, the beans form a 0.075- to 0.1-m. deep bed, which is stirred and through which room-<br />
temperature air is drawn, further cooling the beans. Often, beans at the air-outflow side of the cooler bed still<br />
remain quite hot when those at the inflow side already are cool. Str<strong>on</strong>gly agitated air-based coolers that<br />
provide good bean mixing and more uniform bean cooling are used with some R roasters. In some of these<br />
coolers, beans are quenched while being air cooled, thereby increasing the time available for <str<strong>on</strong>g>roasting</str<strong>on</strong>g>. Air<br />
cooing al<strong>on</strong>e, without quenching, usually is used for small roasters. Beans c<strong>on</strong>tinue to emit VOC during early<br />
stages of air-cooling. Thus, air that has been used to cool beans sometimes has to be subjected to<br />
afterburning, which can use large amounts of energy.<br />
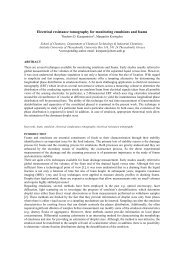
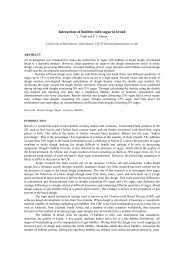
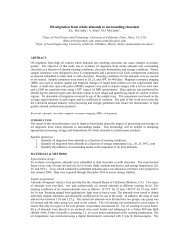
Figure 2 Actual and measured bean temperature profiles for a regular roast and degrees of roast darkness and total<br />
<str<strong>on</strong>g>roasting</str<strong>on</strong>g> loss for different T BF. Agtr<strong>on</strong> and C.I.E. L* reflectance-based roast colors for those T BF.
Thermometric Lag:<br />
Fig. 2 shows corresp<strong>on</strong>ding TB and two TBM profiles obtained with probes of different diameter during a<br />
“regular” roast where the possible roast time, tR, ranged from 480 to 720 s. Roast times for “regular” roasts<br />
can range up to 900 s, or even to 1,200 s for some roasters. Roasting beans closely surrounded the probes,<br />
thereby preventing hot gas flow from directly affecting TBM. When probes are heated by hot gas as well as by<br />
beans, TBM may always lie above TB [13]. TBM are initially much higher than TB because <str<strong>on</strong>g>roasting</str<strong>on</strong>g> chambers<br />
and probes are preheated before bean loading begins. Immediately after beans are added, TBM falls towards<br />
TB, which is rising. Then, for properly positi<strong>on</strong>ed probes, TBM falls below TB, but starts rising, and thereafter<br />
always stays below TB. Thermometric lag increases with probe size. Therefore, after TBM starts rising, it lies<br />
farther below TB for larger diameter probes than for the smaller <strong>on</strong>es [13]. (TB - TBM) tends to be proporti<strong>on</strong>al<br />
to dTB/dt [13] and, as just noted, is larger for large probes than small <strong>on</strong>es. Therefore it is difficult to correctly<br />
compare TBM profiles and TBF from <strong>on</strong>e roaster with those from another, particularly roasters of different<br />
design, or with different probe arrangements, and to correctly compare TBF for fast and slow industrial roasts.<br />
Researchers at ETH Zurich [3,5,14] obtained highly useful TB data for fluidized bed roasts by implanting<br />
very fine thermocouples in <str<strong>on</strong>g>coffee</str<strong>on</strong>g> beans. Researchers at the Univ. of Hamburg-Harburg [15] found large TB<br />
gradients within beans when dTB/dt was large. Schwartzberg [13] developed methods for calculating TB<br />
profiles and TBF from properly measured TBM profiles and also showed that for individual roasters c<strong>on</strong>trol of<br />
properly measured TBM profiles would also c<strong>on</strong>trol TB profiles. TBM profiles often are roughly adjusted at late<br />
stages of <str<strong>on</strong>g>roasting</str<strong>on</strong>g> by <strong>on</strong>e or two step reducti<strong>on</strong>s in F’R (and hence step decreases in TGI) or by step decreases<br />
in the chamber-inlet gas-flow rate, G’. Advanced c<strong>on</strong>trol systems, first developed by Eichner in the mid<br />
1990s, now c<strong>on</strong>tinuously regulate TGI and G’ for some roasters, and use TBM–based feedback c<strong>on</strong>trol to<br />
c<strong>on</strong>sistently provide TBM profiles that c<strong>on</strong>form to “learned” profiles that yielded desirable roasted <str<strong>on</strong>g>coffee</str<strong>on</strong>g>.<br />
Roast Color and Total Roasting Loss:<br />
Points A through I <strong>on</strong> curve TB in fig. 2 indicate a series of increasing TBF and corresp<strong>on</strong>ding increasing<br />
degrees of roast darkness. The darkness descriptors, Agtr<strong>on</strong> roast colors and total-<str<strong>on</strong>g>roasting</str<strong>on</strong>g>-loss values listed<br />
in the inset are data by M<strong>on</strong>dry [4]. The TBF for points A through I were obtained by roughly correcting<br />
M<strong>on</strong>dry’s TBM values for thermometric lag. A indicates a very light roast, E a medium roast, H a very dark<br />
roast and I over-<str<strong>on</strong>g>roasting</str<strong>on</strong>g>, i.e. nearly black beans. Agtr<strong>on</strong> coIors are instrumentally measured and based <strong>on</strong><br />
reflectance of narrow-spectrum near I-R light from ground roasted beans [4], and are used by specialty<br />
roasters to characterize degree of roast. Other near I-R based roast-color meters are used in industry [4].<br />
C.I.E. L* roast colors are based <strong>on</strong> reflectance of broad-spectrum visible light, and have been used in<br />
academic research <strong>on</strong> <str<strong>on</strong>g>roasting</str<strong>on</strong>g> [3,5,14]. The listed L* values are rough estimates based <strong>on</strong> measured L*<br />
values [5] for <str<strong>on</strong>g>coffee</str<strong>on</strong>g> bought from Swiss retailers. Hunter L roast colors are also based <strong>on</strong> reflectance of<br />
broad-spectrum visible light, are used by Folgers, the largest U.S. roaster of <str<strong>on</strong>g>coffee</str<strong>on</strong>g>, and are often listed in<br />
process descripti<strong>on</strong>s in patents obtained by that company. In the end-of-roast color range, L values are<br />
roughly 74% as great as L* values. Bean darkness increases, roast color decreases and <str<strong>on</strong>g>coffee</str<strong>on</strong>g> flavor character<br />
progressively changes as tR and TBF increase. Very darkly roasted beans also tend to be oilier or become oily<br />
after <str<strong>on</strong>g>roasting</str<strong>on</strong>g> [3], and do not store as well as lighter roasted beans.<br />
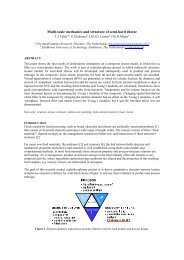
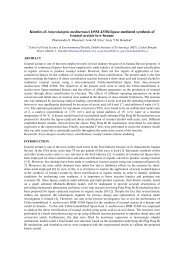
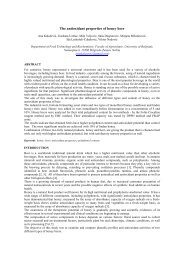
Figure 3 Cumulative mass loss of gas and vapor products emitted from beans due dry matter breakdown versus TB. The<br />
total cumulative mass of all such products is (P – S).
Dry-Matter-Based Emissi<strong>on</strong>s:<br />
Fig. 3 shows how: (P – S), the total cumulative mass of emitted gas and vapor products of dry matter<br />
breakdown, and the cumulative masses of emitted individual breakdown product comp<strong>on</strong>ents, i.e. reacti<strong>on</strong>formed<br />
H2O vapor, CO2, CO and VOC, increase as TB increases. Total <str<strong>on</strong>g>roasting</str<strong>on</strong>g> loss increases as X0 and chaff<br />
loss increases. Therefore, (P – S) values were estimated by subtracting an estimated initial as-is bean<br />
moisture c<strong>on</strong>tent of 0.1 and an estimated as-is chaff loss of 0.01 from M<strong>on</strong>dry’s as-is total-<str<strong>on</strong>g>roasting</str<strong>on</strong>g>-loss<br />
values for points A through I. Irregularities in the calculated (P – S) versus TB curve were smoothed in<br />
drawing the (P – S) curve in Fig. 3. Total <str<strong>on</strong>g>roasting</str<strong>on</strong>g> losses are up to 1.2% greater for Robusta beans and up to<br />
0.3% greater for Santos beans than for Columbian beans [6]. Data from Geiger [3] (used to help plot the CO2<br />
and reacti<strong>on</strong> H2O curves) showed that: a) the main dry matter breakdown products are water vapor (roughly<br />
70% initially), then CO2, with the CO2/H2O ratio increasing with degree of roast; b) reacti<strong>on</strong>-water emissi<strong>on</strong><br />
can start at TB ≈ 160ºC; c) CO2 emissi<strong>on</strong> starts around 190ºC; and d) both emissi<strong>on</strong> rates increase very rapidly<br />
thereafter as TB rises. The CO curve was qualitatively based <strong>on</strong>: data from Valdovinos-Tijerino [7], which<br />
showed CO emissi<strong>on</strong> starting when TB ≈ 220ºC, then rising quite rapidly to very high levels when TB =<br />
240ºC; and data from Jansen [6] indicating cumulative CO emissi<strong>on</strong> for Columbian beans = 0.001R for a<br />
medium roast. For Robustas, the corresp<strong>on</strong>ding CO loss is 0.0022R [6].<br />
VOC-Emissi<strong>on</strong> Curve:<br />
The VOC curve is qualitatively based <strong>on</strong> mass spectrometric data from Dorfner [8] showing VOC-emissi<strong>on</strong><br />
rates during a light-medium roast (i.e. like point D in Fig 2) in a 250 kg capacity roaster where c<strong>on</strong>vective<br />
heating of beans predominated, and <strong>on</strong> a VOC loss of 0.0034R for medium-roast Columbian beans from<br />
Jansen [6]. Robustas emit more VOC, e.g. 0.004R for a medium roast [6]. In the cited test by Dorfner, VOC<br />
emissi<strong>on</strong> was small during roughly the first 80% of the roast, and rose rapidly thereafter. The roast time, tR<br />
was 613 s; and the total as-is roast loss 16.3%, which roughly corresp<strong>on</strong>ds to (P – S) = 0.059 if X0 = 0.111<br />
and S = 0.011. However, VOC were emitted 200 to 300 s into a 900 s roast in a c<strong>on</strong>ductively heated 0.1 kg<br />
sample roaster [8]. VOC were also emitted early when Dutra et al. [16] c<strong>on</strong>ductively roasted beans. Very<br />
likely, bean hot spots occur when c<strong>on</strong>ductive heating is used. Emissi<strong>on</strong> also started around 200 s to 300 s in a<br />
1000 s roast in a 15 kg capacity SP roaster that was str<strong>on</strong>gly preheated (TBM initially = 236ºC) [8]. It appears<br />
that c<strong>on</strong>ductive heating, local hot spots in beans and a high degree of preheating favor early VOC emissi<strong>on</strong>.<br />
Dutra et al. [16] found that VOC were acidic and that their acidity tended to increase almost until the very<br />
end of their test roast. Jansen [6] noted that acetic acid is a major VOC c<strong>on</strong>stituent.<br />
Aroma and Flavor Development:<br />
Baggenstoss [14], Schenker [5], and Gianturco [17], each using different means, measured how in-bean<br />
c<strong>on</strong>centrati<strong>on</strong>s of different important aroma and flavor compounds varied during <str<strong>on</strong>g>roasting</str<strong>on</strong>g>. For most of these<br />
compounds, these variati<strong>on</strong>s followed <strong>on</strong>e of three patterns. In two of these patterns, c<strong>on</strong>centrati<strong>on</strong>s rose,<br />
peaked and then declined. In <strong>on</strong>e of these two patterns, the peaks occurred at light to medium roast colors,<br />
e.g. between points B and E for the Fig. 2 TB profile. In the other of these two, the peaks occurred at darker<br />
colors, e.g. between E and G. The declines in aroma c<strong>on</strong>centrati<strong>on</strong>s within beans probably are caused by a<br />
combinati<strong>on</strong> of: 1) loss of aroma as VOC, 2) formati<strong>on</strong> of complexes between aroma compounds and<br />
melanoidins (the dark-colored matter in roasted beans), and 3) reactive destructi<strong>on</strong> of aromas. C<strong>on</strong>centrati<strong>on</strong>s<br />
of compounds following the third pattern rose progressively without declining as bean color became very<br />
dark, e.g. bey<strong>on</strong>d point G. in Fig. 2. Compounds following the first two patterns impart important <str<strong>on</strong>g>coffee</str<strong>on</strong>g><br />
flavor and aroma attributes valued by those who prefer light or medium roasts. Am<strong>on</strong>g compounds that<br />
follow the third pattern, e.g. 2-furfurylthiol, pyridine, cyclopentan<strong>on</strong>e, guaiacol, phenol, and various pyrroles,<br />
[5,14] are some that impart the burnt, bitter and roasty notes favored by those that prefer dark roasted <str<strong>on</strong>g>coffee</str<strong>on</strong>g>.<br />
Roasted <str<strong>on</strong>g>coffee</str<strong>on</strong>g>’s character depends more <strong>on</strong> the TB profile used for <str<strong>on</strong>g>roasting</str<strong>on</strong>g> than <strong>on</strong> roast color. Schenker [5]<br />
and Baggenstoss [14] used different TB profiles (measured with fine thermocouples implanted in beans) to<br />
roast identical green <str<strong>on</strong>g>coffee</str<strong>on</strong>g>s to the same roast color. The aroma c<strong>on</strong>centrati<strong>on</strong> profiles for the roasted <str<strong>on</strong>g>coffee</str<strong>on</strong>g>s<br />
differed when the TB profile differed, even though their L* roast colors were the same. For fluidized bed<br />
roasts with the same roast color: TBF = 245ºC when tR =180 s, 230ºC when tR =300 s, and 212ºC when tR<br />
=720 s [3,5], i.e. faster roasts require higher TBF. For roasts with roughly equal tR, higher TBF (by roughly<br />
5ºC) provided the same roast color when TB initially rose slowly than when TB initially rose very rapidly [3].<br />
Heat transfer in <str<strong>on</strong>g>roasting</str<strong>on</strong>g> chambers:<br />
A prime symbol (′) added to stream symbols indicates stream mass flow rates or rates of change with time.<br />
Thus G′ indicates the gas mass flow rate entering the chamber, F′R, the rate of furnace-burner gas output, and
RDX′ and RDP′ the respective mass rates of moisture evaporati<strong>on</strong> and dry-matter loss from beans. In <str<strong>on</strong>g>roasting</str<strong>on</strong>g><br />
chambers, beans either fall across, or are thrown across, or entrain in flowing hot gas, and/or encounter hot<br />
gas flowing through interstices in beds of beans. The gas transfers heat to part of the beans. Mixing exposes<br />
other beans to hot gas c<strong>on</strong>tact, causes recently heated beans to transfer heat to beans that have been heated<br />
less recently or less str<strong>on</strong>gly and keeps bean-to-bean TB variati<strong>on</strong> small. Eq. 1 describes bean heating [18].<br />
R DC B<br />
dT B<br />
dt = EG'C G(T GI − T B ) + R DH EV X'+R DQ' REAC −MC M<br />
dT M<br />
dt − Q' LOSS (2<br />
CG is the gas heat capacity. X′ is the rate of change of bean dry-basis moisture c<strong>on</strong>tent. CB is the beans’ dry-<br />
basis heat capacity. At bean moisture c<strong>on</strong>tents, HEV, the latent heat of evaporati<strong>on</strong> of moisture from beans, ≈<br />
2760 kJ/kg because latent heats of evaporative desorpti<strong>on</strong> then are about 1.2 times water’s normal heat of<br />
vaporizati<strong>on</strong>. Q′LOSS, the rate of loss of heat from the chamber, is small for well-designed roasters, and will<br />
usually be neglected hereafter. E≡ ∆TG/(TGI – TB) is the heat-transfer efficiency, where ∆TG is the heattransfer-induced<br />
gas-temperature drop in the <str<strong>on</strong>g>roasting</str<strong>on</strong>g> chamber. TGO < (TGI - ∆TG) because of roaster-gas<br />
diluti<strong>on</strong> by cool leak air and emissi<strong>on</strong>s from beans. E is a functi<strong>on</strong> of (UABE/G’CG) and fC, the fracti<strong>on</strong> of gas<br />
that actually c<strong>on</strong>tacts and transfers heat to beans while passing through the chamber. U is the gas-bean heattransfer<br />
coefficient and ABE the bean surface heat-transfer area, i.e. the part of the bean-load’s surface area<br />
actively c<strong>on</strong>tacted by hot gas. If gas flow is plug-like in the chamber, but some gas flow bypasses the beans:<br />
If complete back-mixing of gas occurs:<br />
E = fC 1− exp − UA ⎡ ⎛ ⎞ ⎤<br />
BE<br />
⎢ ⎜ ⎟ ⎥<br />
⎣ ⎝ fC G ′ CG ⎠ ⎦<br />
(3<br />
E = (UABE )/( ′ G CG )<br />
1+ (UABE )/( G ′ CG ) (4<br />
When bean velocities relative to surrounding gas are determined mainly by the gas-flow rate, U increases as<br />
(fCG′) increases, but in a less than linear fashi<strong>on</strong>. When bean velocities relative to surrounding gas are<br />
determined mainly by mechanically-, centrifugally- or gravitati<strong>on</strong>ally-imparted bean moti<strong>on</strong>, U is not greatly<br />
affected by (fCG′). In either case, E decreases as G′ increases.<br />
Exothermic Heating:<br />
Q′REAC is the rate of heat generati<strong>on</strong> by <str<strong>on</strong>g>roasting</str<strong>on</strong>g> reacti<strong>on</strong>s. DSC measurements carried out at c<strong>on</strong>diti<strong>on</strong>s where<br />
bean moisture evaporati<strong>on</strong> was suppressed show <str<strong>on</strong>g>roasting</str<strong>on</strong>g> starts becoming exothermic at TB around 135ºC and<br />
is markedly exothermic when TB = 190ºC [19,20]. In these tests, water evaporati<strong>on</strong> was suppressed to<br />
eliminate cooling due to evaporati<strong>on</strong> of original bean moisture, but that created a reacti<strong>on</strong> envir<strong>on</strong>ment with<br />
an unnaturally high water c<strong>on</strong>centrati<strong>on</strong> [21], and also prevented evaporati<strong>on</strong> of the most abundant reacti<strong>on</strong><br />
product, water, and the cooling that normally would have been produced by such evaporati<strong>on</strong>. Exothermic<br />
heating was evident <strong>on</strong>ly at high TB in DSC measurements made when evaporati<strong>on</strong> was not suppressed<br />
[7,15]. TB profiles for both industrial and experimental <str<strong>on</strong>g>roasting</str<strong>on</strong>g> usually do not appear to be noticeably<br />
affected by exothermic heating [3,5]. Therefore Q′REAC appears to be negligibly small. However, <strong>on</strong>e should<br />
keep in mind that dangerous TB increases due to exothermic heating may occur when a process interrupti<strong>on</strong><br />
or operator misstep causes fully roasted or nearly fully roasted beans to lie in a pile without agitati<strong>on</strong>.<br />
Roasters should be operated and c<strong>on</strong>trolled so as to prevent build-up of stagnant piles of hot roasted beans.<br />
Means should be provided for automatically and safely quenching and unloading beans if a stagnant pile of<br />
beans forms near the end of <str<strong>on</strong>g>roasting</str<strong>on</strong>g> and TB is likely to increase dangerously.<br />
Heat Transfer to Chamber Parts:<br />
M, CM and TM respectively are the mass, heat capacity and temperature of roaster chamber parts heated by the<br />
hot gas or beans. Heat transfers from preheated roaster hardware to beans at the start of roasts, and some heat<br />
c<strong>on</strong>ductively or radiantly transfers to beans from chamber walls in roasters whose walls are externally heated.<br />
Near the end of roasts, beans may transfer heat to roaster hardware. The net effect of MCMdTM/dt <strong>on</strong> dTB/dt is<br />
small when c<strong>on</strong>vective transfer of heat from gas to beans is predominant, as it is in most large modern<br />
roasters. Hardware-to-bean heat transfer and MCM (dTM /dt) will be neglected hereafter.<br />
TB Profile Shape:
The main factors affecting dTB/dt are G′, E, (TGI - TB) and X′. dTB/dt progressively decreases as <str<strong>on</strong>g>roasting</str<strong>on</strong>g><br />
proceeds because (TGI - TB) progressively decreases as TB rises. dTB/dt decreases to a greater extent for roasts<br />
where TGI is small than for roasts where TGI is large. TGI was 455ºC for the roast whose TB profile was<br />
depicted in Fig. 2. There, the profile flattened toward the end of the roast. When lower TGI (e.g. 290ºC) are<br />
used, TB profiles for industrial roasts remain upwardly c<strong>on</strong>cave till the roast’s end. Evaporative cooling<br />
depresses dTB/dt markedly when (-X′) is large. Schenker [4] showed that the TB profile is significantly lower<br />
for large X0 than for small X0. Gas mass flow through the blower usually is proporti<strong>on</strong>al to gas density at TGO,<br />
i.e. inversely proporti<strong>on</strong>al to TGO in degrees Kelvin. TGO progressively rises as TB rises. Thus gas density and<br />
G′ tend to progressively decrease as <str<strong>on</strong>g>roasting</str<strong>on</strong>g> proceeds [22]; and the decrease in G′ c<strong>on</strong>tributes to the dTB/dt<br />
decrease. Roasting-induced increases in CB and RD reducti<strong>on</strong>s due to dry-matter loss also affect dTB/dt. F′R,<br />
F′AB and energy-use rates are greatest near the start of <str<strong>on</strong>g>roasting</str<strong>on</strong>g> when dTB/dt is largest, and are much smaller<br />
near the end of <str<strong>on</strong>g>roasting</str<strong>on</strong>g>, when VOC and CO output rates are largest, but both dTB/dt and -X’ are small.<br />
Roast Time:<br />
Integrati<strong>on</strong> of Eq. 1 with small terms eliminated yields the following approximati<strong>on</strong> for roast time, tR, in<br />
sec<strong>on</strong>ds when variables in kg, kJ and ºC units are used:<br />
t R ≈ R D C B<br />
EG 'C G<br />
ln T GI − T ⎡ ⎛ ⎞<br />
BO H EV X ⎤<br />
0<br />
⎢ ⎜ ⎟ +<br />
⎥ ≈<br />
⎣ ⎝ T GI − TBF ⎠ C B (T GI − T B ) ⎦<br />
0.51R D ln<br />
EG '<br />
T GI − T ⎛ ⎞<br />
BO<br />
⎜ ⎟ +<br />
⎝ T GI − TBF ⎠<br />
1250 X ⎡<br />
⎤<br />
0<br />
⎢<br />
⎥ (5<br />
⎣<br />
(T GI −160) ⎦<br />
High-Speed Roasting:<br />
The terms with bars over them are mean effective values. Increasing ⎺G′/R and/or ⎺TGI reduces tR. If ⎺G′/R<br />
and/or ⎺TGI are increased enough, tR will be < 300 s and the roast will be a “high-speed” roast. High-speed<br />
<str<strong>on</strong>g>roasting</str<strong>on</strong>g> is used to produce roasted <str<strong>on</strong>g>coffee</str<strong>on</strong>g>s with bulk densities up to 34% lower than regular roast <str<strong>on</strong>g>coffee</str<strong>on</strong>g> [23]<br />
and which c<strong>on</strong>tain more available soluble matter [1,24,25], more sucrose [25], more 3-caffeolquinic acid<br />
[25], more aroma [25], and more residual water [9,24]. The soluble-matter increase has been attributed to<br />
hydrolytic breakdown of polymeric cell wall carbohydrates [26], most likely arabinogalactans. Roasting<br />
times as small as 60 s [25] or even 47 s [26] have been used, and a tR of 35 s has been cited in <strong>on</strong>e patent<br />
[24]. Nowadays, use of tR < 180 s is uncomm<strong>on</strong>. High-speed <str<strong>on</strong>g>roasting</str<strong>on</strong>g> usually is obtained by increasing ⎺G′;<br />
but reducti<strong>on</strong>s in R have also been used; or have been combined with moderate increases in ⎺⎺G′ and higher<br />
TGI [2]. G′ can <strong>on</strong>ly be increased to levels that will not cause beans to be pneumatically c<strong>on</strong>veyed out of the<br />
<str<strong>on</strong>g>roasting</str<strong>on</strong>g> chamber. Therefore high speed <str<strong>on</strong>g>roasting</str<strong>on</strong>g> usually is carried out either in newer kinds of batch roasters,<br />
e.g. spouted-bed roasters (Neuhaus Neotec RFB roasters) [12], rotating-scoop roasters (Gothot Rapido-Nova<br />
roasters or Probat RT roasters) [12] or modified rotating-bowl roasters (i.e. Probat RZ-SY roasters) [12], that<br />
accommodate or need to use high ⎺G′, or in c<strong>on</strong>tinuous roasters where hot gas issuing from a large number of<br />
jets impinges <strong>on</strong> a moving bed of beans (Probat C<strong>on</strong>t-Roasters or Wolverine Jet Roasters) [12,24,27]. G′/R<br />
can be more than 33 times as great for high-speed <str<strong>on</strong>g>roasting</str<strong>on</strong>g> as for regular <str<strong>on</strong>g>roasting</str<strong>on</strong>g>.<br />
G = ⎺G′(tR), and therefore is inversely proporti<strong>on</strong>al to E. Since E decreases as G′ increases, G/R is much<br />
greater for high-speed roasts than for regular roasts. G/R for regular roasts ranges from 0.9 to 3.3, but for<br />
high-speed roasts G/R can be > 10. Therefore blower energy use per kg bean feed is very much greater for<br />
high-speed <str<strong>on</strong>g>roasting</str<strong>on</strong>g> than for regular <str<strong>on</strong>g>roasting</str<strong>on</strong>g>. Fluidized bed <str<strong>on</strong>g>roasting</str<strong>on</strong>g> was <strong>on</strong>ce used for high-speed <str<strong>on</strong>g>roasting</str<strong>on</strong>g>;<br />
but sometimes involved use of G/R as great as 60 [26]. This required very large use of energy to run blowers.<br />
MATERIALS & METHODS<br />
Mass Balance:<br />
Overall mass balances were based <strong>on</strong> the mass flows shown in Fig. 1. Masses: F, A and R = RD(1 + X0), enter<br />
the roaster. RDS leaves it as chaff, and [F + A + RD(X0 + P - S)] leaves it as stack gas. The mass of roasted<br />
beans remaining in the chamber at the end of a roast, but prior to quenching, is RD(1 - P).<br />
Enthalpy Balance:<br />
Overall enthalpy balances were used to compute QSR, the kJ energy used to roast a kg of green <str<strong>on</strong>g>coffee</str<strong>on</strong>g> feed in<br />
both R and SP roasters. Stream or stream comp<strong>on</strong>ent masses were divided by R and multiplied by the<br />
relevant heat capacity and stream temperature, with TA used as a reference temperature, to provide specific<br />
stream enthalpies: i.e. QB for roasted beans, QG for stack gas and QC for chaff, all <strong>on</strong> a kJ/kg green beans<br />
basis. The heat capacity used for gas and for dry-matter gas and vapor breakdown products was CG = 1.12<br />
kJ/(kg ºC). CB was based <strong>on</strong> DSC measurements [28] which, when analyzed, appeared to show the CB could
e broken down into two partial heat capacities: CBD = [1.099 + 0.007TB] kJ/(kg ºC) for bean dry matter, and<br />
CBM =5.0X kJ/(kg ºC) for bean moisture. CWV = 2.09 kJ/(kg ºC) was used as the heat capacity for bean<br />
moisture after evaporati<strong>on</strong>. Valdovinos-Tijereno [7] used modulated DSC to measure <str<strong>on</strong>g>coffee</str<strong>on</strong>g> CB versus TB.<br />
This procedure eliminated effects of evaporative cooling and exothermic heating and permitted measurement<br />
of CB up to 250ºC. Finely ground beans were used; and vapor and gas were allowed to escape. Her CB<br />
increased as TB increased, but slightly less rapidly than postulated above; and her CB started to level off at<br />
190ºC and then decreased slightly. Her lower CB rise rate appears to be due to progressive loss of bean<br />
moisture and the accompanying progressive reducti<strong>on</strong> in CBM, bean moisture’s c<strong>on</strong>tributi<strong>on</strong> to CB. The<br />
levelling off and slight decrease in her CB at high TB appear to be due to dry matter loss. When these effects<br />
are accounted for, her CB data largely c<strong>on</strong>firms the CB relati<strong>on</strong>ship proposed above.<br />
As noted before, HEV, bean moisture’s latent heat of vaporizati<strong>on</strong>, ≈ 2760 kJ/kg. Modelling of regular<br />
industrial roasts showed that roughly half of bean moisture c<strong>on</strong>tent is lost when TB ≈ 160ºC. Therefore in<br />
carrying out enthalpy balances, it was assumed the initial bean water c<strong>on</strong>tent RD(X0) evaporated at an average<br />
TB of 160ºC. Moisture evaporati<strong>on</strong> midpoints occur at higher TB for fast roasts. It was also assumed that: the<br />
initial bean temperature, TBO, = TA = 20ºC; exothermic heat generati<strong>on</strong> and net heat transfer to or from<br />
chamber hardware during a roast were negligible; chaff loss S = 0.011 (a typical value for Arabica beans);<br />
and chaff was heated to 200ºC by roaster gas before being captured in the cycl<strong>on</strong>e. VOC and CO oxidati<strong>on</strong><br />
during afterburning cause a gas-temperature rise, whose magnitude depends <strong>on</strong> the VOC and CO load. The<br />
enthalpy rise due to that gas temperature rise is exactly cancelled by a potential combusti<strong>on</strong>-energy<br />
c<strong>on</strong>tributi<strong>on</strong> assignable to the green <str<strong>on</strong>g>coffee</str<strong>on</strong>g> feed. Therefore both effects were neglected in the enthalpy<br />
balance.<br />
QSR = (FCG)(TF - TA)/[RD(1+ X0)]. QSR also = QB + QG + QC from the overall enthalpy balance for the roaster.<br />
QG c<strong>on</strong>tains an F dependent term. Therefore the enthalpy balance could be solved for F/[RD(1+ X0)], which,<br />
in turn, was used, as follows, to evaluate QSR.<br />
Q SR = (T F − T A )(Q B + Q C + Q PG + Q A + Q X )<br />
(T F − T AB )(1+ X 0)<br />
Q B = (1 − P)[1.099(T BF − T A ) + 0.0035{(T BF ) 2 − (T A ) 2 }] (6a<br />
is the specific enthalpy of roasted beans. The specific enthalpy of chaff discharged from the cycl<strong>on</strong>e is<br />
QC = S[1.099(200 − TA ) + 0.0035{(200) 2 − (TA ) 2 }]<br />
The specific-enthalpy rise for air that leaked into the roaster is<br />
(6b.<br />
QA = (A /RD )CG (TAB − TA ) (6c<br />
The specific-enthalpy rise for bean moisture c<strong>on</strong>verted to water vapor is<br />
QX = X 0 [CBM (160 − TA ) + HEV + CWV (TAB −160)] (6d<br />
I assumed that TPE the average temperature at which breakdown of dry matter to gas and vapor occurred was<br />
approximately (200ºC + TBF)/2. Thus the specific-enthalpy rise of dry matter c<strong>on</strong>verted to gas and vapor is<br />
QPE = (P − S)[1.099(TPE − TA ) + 0.0035{(TPE ) 2 − (TA ) 2 } + CG (TAB − TPE )] (6e<br />
I also assumed that (A/RD) was 0.136 for a 600 sec roast and was proporti<strong>on</strong>al to tR and that TAB was<br />
automatically kept c<strong>on</strong>stant during roasts. Values of (P – S) for different TBF were obtained from the (P – S)<br />
versus TB curve in Figure 3.<br />
Quenching, Preheating, Loading and Unloading:<br />
Gas heating and afterburning usually c<strong>on</strong>tinue during quenching, bean loading and unloading and roaster<br />
preheating. The added kJ energy use/kg bean feed during these periods is:<br />
Q ADD = (T F − T A )[C G(A Q + A D + A P )(T AB − T A ) + W EC WV (T AB −100) + Q M ]<br />
(T F − T AB )R D(1+ X 0)<br />
( 6<br />
(7
AQ, AD and AP respectively are the kg of air in-leakage during quenching, bean discharge from the chamber,<br />
and preheating and bean loading. WE/[RD(1 + X0)] is the kg quench water evaporated/kg green beans.<br />
QM/[RD(1 + X0)] is the (kJ heat)/(kg green beans) transferred to roaster hardware during preheating. AQ, AD<br />
and AP vary with the type of roaster used, its associated quench time (15 to 30 s), preheat and charge time (30<br />
to 90 s) and bean discharge time (5 to 40 s) and with bean-charge- and discharge-port size. It will be assumed<br />
that (AQ/R) ≈ 0.005, (AD/R) ≈ 0.041 and (AP/R) ≈ 0.027, values which appear reas<strong>on</strong>able for rotating-drum<br />
roasters, the most comm<strong>on</strong> type of <str<strong>on</strong>g>coffee</str<strong>on</strong>g> roaster. AQ, AD and AP are zero for roasters where beans are<br />
quenched while undergoing air cooling outside the roaster and where furnace gas bypasses the chamber<br />
during unloading and loading of beans. QM/R depends <strong>on</strong> chamber mass and <strong>on</strong> its temperature rise during<br />
preheating. It was assumed that QM/R ≈ 45 kJ/kg, which appears reas<strong>on</strong>able for a large rotating-drum roaster.<br />
Since surface to volume ratios for chambers tend to be proporti<strong>on</strong>al to R 2/3 , QM/R would be larger for most<br />
small roasters. WE/RD depends <strong>on</strong> TBF and <strong>on</strong> TBD, the desired bean temperature after quenching. WE/RD ≈<br />
CBD(TBF - TBD)/∆HQ, where ∆HQ ≈ 2602 kJ/kg, the enthalpy rise for water between 20ºC liquid and 100ºC<br />
steam. It was assumed that TBD = 120ºC. Quenching usually is not used for small SP roasters. Therefore<br />
WE/RD was set to zero when determining QADD for SP roasters. WE/RD also = 0 when beans are quenched<br />
outside the roaster while undergoing cooling by air.<br />
QADD was added to QSR to provide QTOT, the total thermal energy use in kJ/kg green bean feed. QSR and QTOT<br />
were determined for different TBF, burner flame temperatures, TF, afterburning temperatures, TAB, initial drybasis<br />
moisture c<strong>on</strong>tents, X0, and leak air/dry bean ratios, A/RD, and are presented in Table 1.<br />
Table 1 QSR and QTOT for various <str<strong>on</strong>g>roasting</str<strong>on</strong>g> and afterburning c<strong>on</strong>diti<strong>on</strong>s<br />
TBF P-S kg loss/ TF TAB XO A/RD (ºC) kg dry beans (ºC) (ºC) moisture d.b. kg air/kg dry beans<br />
QSR (kJ/kg) QTOT (kJ/kg)<br />
214 a 0.022 a 1260 400 * 0.111 0.109 1308 1491<br />
236 b 0.068 b 1260 400 * 0.111 0.136 1417 1621<br />
255 c 0.160 c 1260 400 * 0.111 0.162 1506 1729<br />
236 b 0.068 1530 d 400 * 0.111 0.136 1313 1502<br />
236 b 0.068 1260 400 * 0.111 0.068 1379 1584<br />
236 b 0.068 1260 480 e 0.111 0.136 1615 1878<br />
236 b 0.068 1260 760 f 0.111 0.136 2807 3426<br />
236 b 0.068 1260 400 * 0.075 0.136 1273 1477<br />
236 b 0.068 1260 400 * 0.133 0.136 1500 1705<br />
236 b 0.068 1260 760 f 0.111 0.733 g 3004 3266<br />
236 b 0.068 1260 400 * 0.111 0.733 g<br />
1747 1856<br />
a very light roast, b medium roast, c very dark roast, d highest TF without some CO2 and H2O decompositi<strong>on</strong>, *catalytic<br />
afterburner, e catalytic afterburner fed by roaster furnace, f thermal afterburner, g SP roaster<br />
Comparis<strong>on</strong>s Between Predicted and Reported QSR and QTOT:<br />
Operating and feed c<strong>on</strong>diti<strong>on</strong>s for a medium, 600 s roast in a R-type roaster were used as reference<br />
c<strong>on</strong>diti<strong>on</strong>s. The predicted QSR for that roast is 12% higher than QSR (1245 kJ/kg) measured by Dorfner [8] for<br />
a 613-s, light-medium roast in a modern 250-kg capacity roaster with a catalytic afterburner. Part of that<br />
difference is due to Dorfner’s roast being somewhat lighter; and part may be due to his TF possibly being<br />
higher and his A/RD and X0 possibly being smaller than the reference case. Part of the difference may also be<br />
due to small errors in parameters I used when calculating predicted QSR. The predicted standard-roast QTOT,<br />
i.e. 1621 kJ/kg, is similar to the 1675 kJ/kg values listed by Rothfus [9] for: 1) a R-type Probat rotating-drum<br />
roaster with catalytic afterburner; and 2) a R-type Probat rotating-bowl roaster with catalytic afterburner.<br />
Effects of Operating and Feed C<strong>on</strong>diti<strong>on</strong>s:<br />
Operating c<strong>on</strong>diti<strong>on</strong>s and QSR and QTOT for the reference roast are shaded in Table 1. Operating or feed<br />
c<strong>on</strong>diti<strong>on</strong>s that differ from reference c<strong>on</strong>diti<strong>on</strong>s are also shaded so as to better indicate c<strong>on</strong>trasts between<br />
c<strong>on</strong>diti<strong>on</strong>s. One can see that: 1) QTOT is roughly twice as great for thermal afterburning (TAB = 760ºC) as for<br />
catalytic afterburning (TAB = 400ºC); 2) is greater for dark roasts [TBF = 255ºC, (P-S) = 0.160 and A/RD =<br />
0.162] and less for light roasts [TBF = 214ºC, (P-S) = 0.022 and A/RD = 0.109]; 3) is greater for high bean<br />
moisture c<strong>on</strong>tents (X0 = 0.133) and less for low moisture c<strong>on</strong>tents (X0 = 0.075); 4) decreases when burner<br />
temperature increases (TF = 1530ºC instead of 1260ºC); 5) is reduced by reducing air in-leakage (A/RD =<br />
0.068 instead of 0.136); and 6) is larger when catalytic afterburner feed is heated in the roaster furnace rather<br />
than in the afterburner itself (TAB = 480ºC instead of 400ºC).
Effects of Using SP Roasting<br />
QTOT is greater for SP roasters (A/RD = 0.733 in Table 1) than for R roasters, particularly when thermal<br />
afterburning is used. An A/RD of 0.733 was used to account for greater air intake by SP roasters. However,<br />
A/RD, QSR and QTOT for SP roasters depend <strong>on</strong> E and TG. Both the predicted A/RD, QSR and QTOT would be<br />
greater if E or TGI were smaller than I assumed. The predicted QTOT for SP <str<strong>on</strong>g>roasting</str<strong>on</strong>g> with thermal afterburning,<br />
i.e. 3266 kJ/kg, is 20% less than 4060 kJ/kg listed by Rothfus [9] for a SP type Probat rotating-drum roaster<br />
with thermal afterburner and 19% more than 2680 kJ/kg listed for a SP type Gothot Rapido Nova roaster with<br />
thermal afterburner [9]. These differences probably are largely due to differenced between the actual A/RD<br />
for those roasters and the A/RD I assumed. E and TGI <strong>on</strong>ly slightly affect QTOT for R roasters.<br />
Other than using catalytic instead of thermal afterburning, QTOT savings from individual process changes are<br />
modest (less than 10%). Combining them provides greater, but slightly less than additive, savings, e.g. low<br />
X0, low A/RD and high TF, when combined, reduce QTOT 17.4%. Heat savings per kg of roasted <str<strong>on</strong>g>coffee</str<strong>on</strong>g> are<br />
greater than those per kg of green <str<strong>on</strong>g>coffee</str<strong>on</strong>g>, particularly when (P + X0) is reduced. For example, the previously<br />
cited combined green-<str<strong>on</strong>g>coffee</str<strong>on</strong>g>-based QTOT saving of 17.4% is a 20.3% savings when reck<strong>on</strong>ed per kg of<br />
roasted <str<strong>on</strong>g>coffee</str<strong>on</strong>g>. Thus reducing X0 and, where possible, reducing P by use of lighter roasts can provide<br />
attractive thermal-energy and product-yield savings. It has been claimed that pre-drying of beans: 1) reduces<br />
differences in roast color within beans, particularly when high-speed <str<strong>on</strong>g>roasting</str<strong>on</strong>g> is used [29,30]; 2) prevents the<br />
formati<strong>on</strong> of rubbery tastes that would normally be generated when <str<strong>on</strong>g>coffee</str<strong>on</strong>g> beans, particularly Robustas, are<br />
dark roasted [30]; and 3) reduces <str<strong>on</strong>g>roasting</str<strong>on</strong>g>-induced dry-matter loss (when combined with a modified TB<br />
profile) [31].<br />
Problems with Dark Roasting:<br />
TAB probably has to be increased to provide acceptably low stack gas VOC c<strong>on</strong>centrati<strong>on</strong>s when VOC<br />
generati<strong>on</strong> is large, i.e. when very dark <str<strong>on</strong>g>roasting</str<strong>on</strong>g> is used. Therefore energy requirements for dark <str<strong>on</strong>g>roasting</str<strong>on</strong>g><br />
probably are greater than indicated in Table 1. That added energy-use burden and other disadvantages of dark<br />
<str<strong>on</strong>g>roasting</str<strong>on</strong>g>, e.g. lower roasted-<str<strong>on</strong>g>coffee</str<strong>on</strong>g> yield, increased fouling, reduced catalyst life, provide incentives for<br />
dealing with problems caused by dark <str<strong>on</strong>g>roasting</str<strong>on</strong>g>. While lighter roasts may be difficult to use where dark roasts<br />
are str<strong>on</strong>gly preferred, it may be possible to blend light, medium and dark roast <str<strong>on</strong>g>coffee</str<strong>on</strong>g> so as to retain darkroast<br />
notes, while: a) better utilizing flavor and aroma c<strong>on</strong>tributi<strong>on</strong>s derived from each type of roast, b)<br />
increasing roasted <str<strong>on</strong>g>coffee</str<strong>on</strong>g> yield, c) improving roasted-bean storage stability, and d) saving energy. It has been<br />
claimed [32] that blending small amounts, e.g. 10%, of darkly roasted <str<strong>on</strong>g>coffee</str<strong>on</strong>g> made from pre-dried Robusta<br />
beans with 90% normally roasted <str<strong>on</strong>g>coffee</str<strong>on</strong>g> will provide <str<strong>on</strong>g>coffee</str<strong>on</strong>g> that, when brewed, will have a dark brew color,<br />
a high flavor strength/rubbery taste ratio and good balance of flavor to strength.<br />
G’, TGI, tR and E do not affect enthalpy balances for R roasters and thus do not directly affect QTOT for such<br />
roasters, but have slight indirect effects. Reducti<strong>on</strong>s in tR (achieved by increasing G’, TGI or E) reduce A/RD<br />
and thereby slightly reduce QTOT. More blower energy and higher TBF are needed when high-speed <str<strong>on</strong>g>roasting</str<strong>on</strong>g> is<br />
used. These cause overall-energy-use increases that exceed the QTOT savings derived from the marked<br />
decrease in tR and c<strong>on</strong>sequent decreases in A/RD and heat loss from the roaster to its surroundings.<br />
Energy Saving Methods:<br />
Nearly 75% of heat input to roasters can go out the stack. Part of that heat, e.g. the latent heat of stack-gas<br />
water vapor, cannot be readily recovered. Nevertheless, reducing stack-gas temperature (called TOUT<br />
hereafter) or stack-gas mass outflow can reduce QTOT significantly. Table 2 lists QSR and QTOT for standard<br />
<str<strong>on</strong>g>roasting</str<strong>on</strong>g> c<strong>on</strong>diti<strong>on</strong>s, i.e. line 2 in Table 1, and QSR and QTOT for the same c<strong>on</strong>diti<strong>on</strong>s when different methods<br />
for reducing TOUT are used.<br />
Table 2 Q SR and Q TOT at standard <str<strong>on</strong>g>roasting</str<strong>on</strong>g> c<strong>on</strong>diti<strong>on</strong>s both when energy saving methods are and are not employed<br />
TBF<br />
(ºC)<br />
P-S kg loss/<br />
kg dry beans<br />
TF<br />
(ºC)<br />
TOUT<br />
(ºC)<br />
XO<br />
moisture d.b.<br />
A/RD<br />
kg air/kg dry beans<br />
QSR (kJ/kg) QTOT (kJ/kg)<br />
236 0.068 1260 400 A 0.111 0.136 1417 1621<br />
236 0.068 1260 120 B 0.111 0.136 943 1005<br />
236 0.068 1260 200 C 0.111 0.162 1053 1148<br />
236 0.068 1260 300 D 0.111 0.136 1216 1360<br />
236 0.068 1260 280 E 0.111 0.136 1180 1314<br />
A Reference. B Heat transfer from stack gas to: afterburner feed, roaster gas and roaster furnace air and fuel. C Same setup<br />
as B, but heat transfer is less efficient. D Heat transfer from stack gas to afterburner feed <strong>on</strong>ly. E Afterburner largely<br />
bypassed when VOC levels acceptably low.
Use of Heat Exchange to Save Energy:<br />
Transferring heat from stack gas to cooler gas streams and/or green beans is <strong>on</strong>e way to reduce TOUT. Stack<br />
gas c<strong>on</strong>tains a great deal of water vapor. Therefore TOUT cannot be reduced much below 100ºC without water<br />
c<strong>on</strong>densing <strong>on</strong> heat-exchange surfaces and reducing heat-exchange capacity. Stepwise transfers of heat from<br />
stack gas to: a) afterburner feed; b) then chamber discharge gas; and c) burner air and fuel can reduce TOUT to<br />
120ºC (line 2 in Table 2), thereby reducing QTOT by 38%. Line 3 (where TOUT = 200ºC) shows QTOT for the<br />
same heat-exchange scheme, but with less efficient heat exchange because of use of smaller and less costly<br />
heat exchangers. Line 4 (where TOUT = 300ºC) shows what QTOT would be if stack gas <strong>on</strong>ly transferred heat<br />
to afterburner feed.<br />
Transferring heat to combusti<strong>on</strong> air and fuel gas for the roaster-furnace burner may significantly increase<br />
NOX producti<strong>on</strong> in that burner [32]. Therefore it may be preferable to replace step c) in the previously<br />
c<strong>on</strong>sidered three-step heat-transfer arrangement with a step in which partly cooled stack gas transfers heat to<br />
green beans in the bean-feed hopper for the roaster. Schmidt [11] described use of a mini rotating-scoop<br />
roaster to accomplish that process.<br />
Fouling:<br />
Heat-exchange-based QTOT reducti<strong>on</strong> will be feasible <strong>on</strong>ly if: c<strong>on</strong>densable VOC can be prevented from<br />
fouling the heat exchangers or regenerators used; those units are not too large or too costly; and heatexchange<br />
pinches are minimized. Fouling is a problem mainly for roasters where G’ is low, and is aggravated<br />
when dark roasts are used. Low G’ lead to: 1) less reducti<strong>on</strong> of VOC partial pressures by diluti<strong>on</strong>; 2) lower<br />
TGO because low G’ increase E; and 3) greater TGO reducti<strong>on</strong> due to diluti<strong>on</strong> of roaster gas by leak air and by<br />
heat losses. Thus TGO is likely to fall enough for some VOC to c<strong>on</strong>dense <strong>on</strong> duct walls or as smoke droplets<br />
(which later impact <strong>on</strong> and foul surfaces). If G’ is low and E is high enough, TGO may even be low enough to<br />
permit tarry VOC to c<strong>on</strong>dense <strong>on</strong> <str<strong>on</strong>g>roasting</str<strong>on</strong>g> beans, thereby adversely affecting their flavor. Temporarily<br />
admixing furnace-discharge gas with chamber-discharge gas, or heat exchange with stack gas itself could<br />
raise TGO and heat-exchanger-surface temperatures enough to prevent VOC c<strong>on</strong>densati<strong>on</strong> and c<strong>on</strong>sequent<br />
fouling. Thus passing stack gas or partly cooled stack gas through a shell surrounding ducts through which<br />
chamber-discharge gas flows could prevent those ducts from fouling. C<strong>on</strong>densed VOC initially are oily, but<br />
harden and solidify as time goes by. It is sometimes possible to burn off fouling by passing 400ºC gas<br />
through the empty roaster for 720 to 900 s [33]. The burn-off process is automatically repeated every 24 to 40<br />
hours for roasters that foul particularly rapidly. This procedure cannot be used for some roasters. Burn-off<br />
procedures might possibly be used to remove fouling from heat exchangers and to burn-off fouling and<br />
blinding material <strong>on</strong> afterburner catalysts.<br />
Fouling of heat exchangers could also be avoided by allowing stack gas to exchange heat <strong>on</strong>ly with VOCfree<br />
streams, e.g. furnace-burner air and fuel. The mass-flow rate of stack gas exceeds the mass-flow rate of<br />
furnace-burner air and fuel. This mass-flow rate imbalance creates a heat-exchange pinch that limits how<br />
much heat can be extracted from hot stack gas by such heat transfer. Heat transfer from stack gas to other<br />
VOC-free heat-absorbing loads in a <str<strong>on</strong>g>coffee</str<strong>on</strong>g> <str<strong>on</strong>g>roasting</str<strong>on</strong>g> plant has also been c<strong>on</strong>sidered [34].<br />
Compact Heat Exchange<br />
Roasters are designed to occupy a small area and to minimize duct length and c<strong>on</strong>sequent loss of heat from<br />
ducts. Therefore, heat-exchange systems used to recover energy used for <str<strong>on</strong>g>roasting</str<strong>on</strong>g> also have to be compact.<br />
Finken [35] described a compact heat exchanger and afterburner in which afterburner discharge gas was used<br />
to heat afterburner feed and roaster gas for SP roasters. The system might be adapted to recover heat in R<br />
roasters. Regenerators could also provide heat exchange compactly, but, if fouled, might be very difficult to<br />
clean. Regenerators also cannot be used when VOC levels are likely to exceed 10% of their L.E.L. Such<br />
VOC levels might easily occur when very dark roasts are produced. Heat-transfer fluids or heat pipes might<br />
be used to exchange heat compactly in the third and/or sec<strong>on</strong>d stages of the proposed three-stage heatexchange<br />
scheme, i.e. after stack gas has cooled enough to prevent thermal degradati<strong>on</strong> of such media.<br />
Afterburner Bypassing:<br />
VOC levels are acceptably low during the first 75% to 80% of regular roasts, i.e. when roughly 90% of heat<br />
use occurs. If most stack gas bypasses the afterburner during this period, QTOT could be significantly reduced.<br />
A small porti<strong>on</strong>, e.g. 10%, of stack gas would still be sent to the afterburner then to keep it at operating<br />
temperature. All stack gas would go through the afterburner after VOC levels start rising. The estimated<br />
average TOUT for this arrangement is 280ºC and could be even lower if E is high. The last line in Table 2<br />
(where TOUT = 280ºC) indicates QTOT could be reduced 19% by use of this arrangement. Alternatively,<br />
afterburner bypassing could be gradually reduced as VOC levels rise. FR is the main c<strong>on</strong>tributor to stack gas
outflow, and decreases markedly towards the end of <str<strong>on</strong>g>roasting</str<strong>on</strong>g>. Therefore stack-gas outflow rates will be low<br />
when the afterburner is fully <strong>on</strong>-line. C<strong>on</strong>sequently, smaller afterburners can be employed if afterburner<br />
bypassing is used; and total gas flow through the afterburner will be small. Reducing total flow through the<br />
afterburner, particularly reducing afterburner flow during times when beans release chaff (which occur<br />
relatively early in roasts) may reduce rates of catalyst blinding and deactivati<strong>on</strong> and extend catalyst life.<br />
Stack VOC levels were excessive when intermittent afterburning was used in the past with SP roasters [9],<br />
but should be substantially lower if intermittent afterburning is used with R roasters (where substantial infurnace<br />
destructi<strong>on</strong> of VOC occurs) and if excessive roaster preheating is avoided. Suitably low VOC levels<br />
can reliably be obtained by using <strong>on</strong>-line detecti<strong>on</strong> of VOC increases or critical TBM to initiate full<br />
afterburning. TBM profiles could also be adjusted so as to limit VOC and CO producti<strong>on</strong> time. For example,<br />
VOC emissi<strong>on</strong> could be reliably c<strong>on</strong>fined to the last 20% of a roast by slightly decreasing TBM during the first<br />
80% and then increasing dTBM /dt roughly 25% or 30% thereafter. This probably would also increase in-bean<br />
generati<strong>on</strong> of methanethiol, a valuable <str<strong>on</strong>g>coffee</str<strong>on</strong>g> aroma [36]. Similarly limiting VOC producti<strong>on</strong> to the last 10%<br />
of <str<strong>on</strong>g>roasting</str<strong>on</strong>g> would save even more energy. Afterburner bypassing would not be effective for TB (and TBM)<br />
profiles that are fairly level during mid and late stages <str<strong>on</strong>g>roasting</str<strong>on</strong>g> and probably would be difficult to utilize for<br />
high-speed <str<strong>on</strong>g>roasting</str<strong>on</strong>g>.<br />
Effects of TAB C<strong>on</strong>trol:<br />
The QSR and QTOT values in Table 1 are based <strong>on</strong> implicitly assuming that F’AB was automatically regulated<br />
so as to maintain TAB c<strong>on</strong>stant. If F’AB remained c<strong>on</strong>stant instead, TAB would progressively increase and would<br />
be much higher at the end of the roast than at the beginning. In such a case, QSR and QTOT would be larger<br />
than listed in Table 1; and TAB might become high enough at the end of roasts to damage the afterburner<br />
catalyst. C<strong>on</strong>ceivably, F’AB could possibly be set at a level that would provide low TAB at the beginning of<br />
roasts, i.e. when VOC emissi<strong>on</strong> is negligible, but which would also provide acceptably high TAB close to the<br />
end of roasts when VOC are emitted. This might possibly save energy, but it probably would be difficult to<br />
ensure reliable and predictable provisi<strong>on</strong> of adequately low VOC levels.<br />
Combining Savings:<br />
Stack-gas heat exchange and afterburner bypassing cannot be effectively combined without losing much of<br />
the energy saving provided by heat exchange. However, each of these methods can be effectively combined<br />
with other energy-saving steps, e.g. reducing X0 and A/RD and raising TF. The percent QTOT savings for the<br />
added steps would <strong>on</strong>ly apply to energy not already saved; but total QTOT savings can be as high as 49% if<br />
stack-gas heat exchange is combined with these added steps, and as high as 33% if afterburner bypassing is<br />
combined with these steps. In the first case, as much as 57% of the energy input per kg of roasted <str<strong>on</strong>g>coffee</str<strong>on</strong>g><br />
could be saved, and in the sec<strong>on</strong>d case, as much as 38%.<br />
Proper Purging:<br />
Markedly reducti<strong>on</strong>s in QTOT cause FR as well as FAB to decrease. FR reducti<strong>on</strong>s reduce stack gas outflow and<br />
c<strong>on</strong>sequent purging of combustible VOC and CO from the roaster. Thus, when G/R is small and/or very dark<br />
roasts are used, large QTOT reducti<strong>on</strong>s could cause VOC c<strong>on</strong>centrati<strong>on</strong>s near the end of roasts to become high<br />
enough within roasters to cause puffing (oscillatory n<strong>on</strong>-explosive igniti<strong>on</strong>s) or even an explosi<strong>on</strong>. VOC<br />
c<strong>on</strong>centrati<strong>on</strong>s in the afterburner feed would also probably exceed their allowable percentage L.E.L. limit, i.e.<br />
25%. These problems can be circumvented by: a) using roasters that utilize larger G/R; or, if this approach is<br />
not feasible, b) temporarily using sufficient extra burner air to thereby increase F’R and venting enough to<br />
prevent VOC and CO c<strong>on</strong>centrati<strong>on</strong>s from becoming excessive. This should be automatically d<strong>on</strong>e whenever<br />
m<strong>on</strong>itored VOC and/or CO c<strong>on</strong>centrati<strong>on</strong>s start to approach dangerous levels. Adding extra burner air will<br />
reduce TF, but good burner-c<strong>on</strong>trol systems will automatically adjust F’R further so as to keep TGI c<strong>on</strong>stant.<br />
The amount of purging required will in part depend <strong>on</strong> how much VOC is destroyed in the roaster furnace<br />
and <strong>on</strong> whether destructi<strong>on</strong> of VOC there results in producti<strong>on</strong> of significant amounts of CO.<br />
Bean Cooling – Recovering Heat from Roasted Beans:<br />
Part of the heat c<strong>on</strong>tent of roasted beans could be recovered by passing air leaving the bean cooler through<br />
green beans held in an added hopper upstream from the green-bean-feed hopper for the roaster. The added<br />
hopper’s bottom would have a perforated, sloping inner wall and solid outer wall with an air-flow channel in<br />
between, and would be loaded so that the upper surface of the beans it c<strong>on</strong>tains lies roughly parallel to the<br />
hopper’s bottom (whose slope would <strong>on</strong>ly slightly exceed the angle of repose for <str<strong>on</strong>g>coffee</str<strong>on</strong>g> beans). Air drawn<br />
from the cooling tray by a blower would be also drawn upward through the perforated sloped bottom and bed<br />
of beans in the added hopper, thereby preheating the green beans. Heat recovery by this scheme can be
maximized by: 1) limiting quenching to the minimum that will arrest <str<strong>on</strong>g>roasting</str<strong>on</strong>g>; and 2) increasing stratificati<strong>on</strong><br />
of heat transfer in cooling trays. At most, use of this approach would save roughly 134 kJ/kg green beans and<br />
raise TBO to 87ºC. Based <strong>on</strong> records of measured bean-cooler outlet-air temperature versus time [34], actual<br />
energy saving currently obtainable by use of this approach might be around 80 kJ/kg green beans.<br />
Reducti<strong>on</strong> of VOC Levels in Cooler Air:<br />
In some locales, air used to cool <str<strong>on</strong>g>roasting</str<strong>on</strong>g> beans also has to subjected to afterburning to oxidize VOC it<br />
c<strong>on</strong>tains. Afterburning should <strong>on</strong>ly be used <strong>on</strong>ly during the brief time at the start of cooling when VOC<br />
emissi<strong>on</strong> is significant (e.g. roughly 15 s out of a 210 to 240 s cooling period for a regular roast). If beans are<br />
cooled in a moderately stratified fashi<strong>on</strong>, limiting afterburning of discharged cooler air to the first 15 s of<br />
discharge would require roughly 50 kJ/kg green beans compared to the roughly 810 kJ/kg that would be used<br />
if all discharged cooler air were subjected to afterburning. If the beans were thoroughly mixed during<br />
cooling, limiting afterburning of discharged cooler air to the first 15 s of discharge would require roughly 175<br />
kJ/kg green beans compared to the roughly 2,740 kJ/kg that would be used if all discharged cooler air was<br />
subjected to afterburning. Thermal stratificati<strong>on</strong> during bean cooling causes different bean strata to cool at<br />
different rates, but saves energy when cooler air has to be subjected to afterburning. Use of quenching that<br />
adequately stops all <str<strong>on</strong>g>roasting</str<strong>on</strong>g> reacti<strong>on</strong>s should minimize adverse c<strong>on</strong>sequences of bean-cooling-time<br />
unevenness.<br />
Alternatively, cooler-discharge air could be sent through a bed of an adsorbent during the time that VOC are<br />
emitted. The adsorbed VOC could be periodically desorbed in c<strong>on</strong>centrated form later and sent to the<br />
afterburner. This would greatly reduce the mass of air that has to be heated to TAB. Use of the previously<br />
described green-bean-preheating scheme would reduce the temperature of discharged cooler air and facilitate<br />
VOC adsorpti<strong>on</strong>. The VOC c<strong>on</strong>tained in cooler air could also be absorbed in oil and the burned with that oil.<br />
CONCLUSIONS<br />
Wherever feasible, existing thermal afterburners should be replaced by catalytic afterburners. Catalytic<br />
afterburner feeds for R roasters should be heated in the afterburner itself rather than in the roaster furnace.<br />
Energy c<strong>on</strong>sumpti<strong>on</strong> for <str<strong>on</strong>g>coffee</str<strong>on</strong>g> roasters with afterburners can be reduced 30% to 40% by sequentially<br />
transferring heat from roaster stack gas to afterburner feed gas, chamber discharge gas, and then to burner air<br />
and fuel or to green beans. The feasibility of this approach depends <strong>on</strong> whether its use reduces or enhances<br />
fouling of heat exchangers and roaster hardware by c<strong>on</strong>densable VOC. Largely bypassing afterburners when<br />
VOC c<strong>on</strong>centrati<strong>on</strong>s are acceptably low can reduce energy use by about 20%. In each case, added energy<br />
could be saved by also increasing TF, reducing air in-leakage, use of lighter roasts and reducing the moisture<br />
c<strong>on</strong>tent of green beans, e.g. by storing them at c<strong>on</strong>diti<strong>on</strong>s that promote bean drying. When steps providing<br />
large energy-use reducti<strong>on</strong>s are utilized, care should be taken that VOC and CO are adequately purged from<br />
roasters at late stages of <str<strong>on</strong>g>roasting</str<strong>on</strong>g>. This can be d<strong>on</strong>e by temporarily increasing the air/fuel ratio used for the<br />
burner in the roaster furnace. If bean-cooler-discharge air has to be subjected to afterburning, such<br />
afterburning should be restricted to periods when that air c<strong>on</strong>tains appreciable amounts of VOC. Requiring<br />
more extensive afterburning of cooler air would have negative envir<strong>on</strong>mental effects.<br />
Acknowledgement: Joachim Eichner, President of Praxis <str<strong>on</strong>g>Internati<strong>on</strong>al</str<strong>on</strong>g> Inc., provided informati<strong>on</strong> about<br />
industrial <str<strong>on</strong>g>roasting</str<strong>on</strong>g> practice that proved useful in preparing this paper.<br />
REFERENCES<br />
[1] Mahlmann, J.P. & Schecter. S.M. 1985. C<strong>on</strong>trolled Coffee Roasting. U.S. Patent 4,501,761<br />
[2] Stefanucci. A. & Protomastro, M. 1982. Low Density Coffee Process. U.S. Patent 4,349,573<br />
[3] Geiger, R. 2004. Development of Coffee Bean Structure During Roasting – Investigati<strong>on</strong>s <strong>on</strong> Resistance and Driving<br />
Forces. Doctoral Dissertati<strong>on</strong> ETH No. 15430, Swiss Federal Institute of Technology Zurich, Switzerland<br />
[4] M<strong>on</strong>dry, V.A. 2004. Measuring Roast Color: Can the Various Popular Systems Be Cross-Referenced. Specialty<br />
Coffee Associati<strong>on</strong> of America 2004 Annual C<strong>on</strong>ference, Atlanta, Georgia, U.S.A. 23-26 April 2004<br />
[5] Schenker, S. 2000. Investigati<strong>on</strong>s <strong>on</strong> the Hot Air Roasting of Coffee. Doctoral Dissertati<strong>on</strong> ETH No. 13620, Swiss<br />
Federal Institute of Technology Zurich, Switzerland<br />
[6] Jansen, G.A. 2006. Coffee Roasting, Magic, Art, Science: Physical Changes and Chemical Reacti<strong>on</strong>s. SV Corporate<br />
Media GmbH, Munich, Germany<br />
[7] Valdovinos-Tijerino, B. 2005. Etude de la Torréfacti<strong>on</strong> du Café: Modelisati<strong>on</strong> et Développement des Outils Pour<br />
Maitriser la Qualité du Produit en Ligne. Thése de Doctorat, Université Pierre & Marie Curie, Paris, France<br />
[8] Dorfner, R. 2004. In-Line Techniken zur Echtzeit Analyse v<strong>on</strong> Fluchtigen Verbindungen in Kaffee Rostgasen.<br />
Doctoral Thesis, Technischen Universitat Munchen, Germany
[9] Rothfus, B. 1986. Coffee C<strong>on</strong>sumpti<strong>on</strong>. Gordian-Max Rieck GmbH, Hamburg, Germany, p. 112-180<br />
[10] An<strong>on</strong>ymous. 2006. Secti<strong>on</strong> 3.2.39.2 Roasting Air Emissi<strong>on</strong>s. Integrated Polluti<strong>on</strong> Preventi<strong>on</strong> and C<strong>on</strong>trol Reference<br />
Document <strong>on</strong> Best Available Techniques in the Food, Drink and Milk Industries. European Commissi<strong>on</strong>, p. 139<br />
[11] Schmidt, K. 2008. Mitigating the Envir<strong>on</strong>mental Impact of Coffee Roasting. Paper. 97 th Annual C<strong>on</strong>venti<strong>on</strong><br />
Nati<strong>on</strong>al Coffee Associati<strong>on</strong> of America, Adventura, Florida, U.S.A., 6-8 March 2008<br />
[12] Clarke, R.J. 1979. Roasting and Grinding. In: Clarke, R.J. & Macrae, R. (Eds.) Coffee. Volume 2. Technology.<br />
Elsevier Applied Science Press, Barking, Essex, England, p. 73-107<br />
[13] Schwartzberg, H. 2006. Improving Industrial Measurement of the Temperature of Roasting Coffee Beans, 21 st<br />
<str<strong>on</strong>g>Internati<strong>on</strong>al</str<strong>on</strong>g> C<strong>on</strong>ference <strong>on</strong> Coffee Science, M<strong>on</strong>tpellier, France, 11-15 September 2006<br />
[14] Baggenstoss, J. 2008. Coffee Roasting and Quenching Technology – Formati<strong>on</strong> and Stability of Aroma Compounds.<br />
Doctoral Dissertati<strong>on</strong> ETH No. 17696. Swiss Federal Institute of Technology Zurich, Switzerland<br />
[15] Eggers, R. & v<strong>on</strong> Blittersdorff, M. 2005. Temperature Field During the Roasting and Cooling of Coffee Beans.<br />
Proceeding of 20 th <str<strong>on</strong>g>Internati<strong>on</strong>al</str<strong>on</strong>g> C<strong>on</strong>ference <strong>on</strong> Coffee Science, Bangalore, India, 11-15 October 2004<br />
[16] Dutra, E.R. Oliveira, L.S. Franca, A.S. & Af<strong>on</strong>so, R.J.C.F. 2001. A Preliminary Study <strong>on</strong> the Feasibility of Using<br />
the Compositi<strong>on</strong> of Coffee Roasting Exhaust Gas for the Determinati<strong>on</strong> of the Degree of Roast, Journal of Food<br />
<strong>Engineering</strong>, 47(3), 241-246<br />
[17] Gianturco, M. 1967. Coffee Flavor. In: Schultz, H.W, Day, E.A. and Libbey, E.M (Eds.) The Chemistry and<br />
Physiology of Flavor. AVI Publishing Company, Westport, C<strong>on</strong>necticut, U.S.A. p. 431-449<br />
[18] Schwartzberg, H. 2002. Modelling Bean Heating During <str<strong>on</strong>g>Batch</str<strong>on</strong>g> Roasting of Coffee Beans. In: Welte-Chanes, J.,<br />
Barbosa-Canovas, G. & Aguilera, J. (Eds.) <strong>Engineering</strong> of Food for the 21 st Century. CRC Press, Boca Rat<strong>on</strong>, FL,<br />
U.S.A. p. 871-890<br />
[19] Raemy, A. 1981. Differential Thermal Analysis and Heat Flow Calorimetry of Coffee and Chicory Products.<br />
Thermochemical Acta, 43(2), 229-236<br />
[20] Raemy, A. & Lambelet, P. 1982. A Calorimetric Study of Self Heating in Coffee and Chicory. Journal of Food<br />
Technology, 17(4), 452-460<br />
[21] Schwartzberg, H. 2004. Modelling Exothermic Heat Generati<strong>on</strong> During the Roasting of Coffee. 21 st <str<strong>on</strong>g>Internati<strong>on</strong>al</str<strong>on</strong>g><br />
C<strong>on</strong>ference <strong>on</strong> Coffee Science, M<strong>on</strong>tpellier, France, 11-15 September 2006<br />
[22] Schwartzberg, H. 2004. Effect of the Characteristic Behavior of Roaster Blowers <strong>on</strong> Bean Heating in <str<strong>on</strong>g>Batch</str<strong>on</strong>g><br />
Roasters. 9 th <str<strong>on</strong>g>Internati<strong>on</strong>al</str<strong>on</strong>g> <str<strong>on</strong>g>C<strong>on</strong>gress</str<strong>on</strong>g> <strong>on</strong> <strong>Engineering</strong> and Food. M<strong>on</strong>tpellier, France, 7-11 March 2004<br />
[23] Small, L.E. & Horrell, R.S. 1993, High Yield Coffee Technology. Proceedings, 15th <str<strong>on</strong>g>Internati<strong>on</strong>al</str<strong>on</strong>g> C<strong>on</strong>ference <strong>on</strong><br />
Coffee Science, M<strong>on</strong>tpellier, France, 6-11 June 1993, p. 719-726<br />
[24] MacAllister, R.V. & Spotholz, C.H, 1964. Coffee Roasting. U.S. Patent 3,122,439<br />
[25] Price, S.E. Kussin, R.P. Fruhling, R.J. & Harris, M.B. 1991. Ultrafast Roasted Coffee. U.S. Patent 4,988,590<br />
[26] Brandlein, L.S. Schecter, S.P. & Mahlmann, J.P. 1988. Coffee Roasting Method, U.S. Patent 4,737,376<br />
[27] Hubbard, M.R. 1982. High Speed Process for Roasting Coffee. U.S. Patent 4,322,447<br />
[28] Singh, P. Singh, R, Bhamidipati, S. Singh. S & Bar<strong>on</strong>e, P. 1997. Thermophysical Properties of Fresh and Roasted<br />
Coffee Powders. Journal of Food Process <strong>Engineering</strong>, 20(1), 31-50<br />
[29] Kirkpatrick, S.J. Bertagna, R.W. & Gutwein, R.W. 1992. Process for Making Reduced Density Coffee. U.S. Patent<br />
5,160,757<br />
[30] Jensen, M.R. Kirkpatrick, S.J. & Leppla, J.K. 1994. High Yield Roasted Coffee with Balanced Flavor. U.S. Patent<br />
5,322,703<br />
[31] Adler, I.L. & Feldbrugge, A.H. 1971. Method of Roasting Coffee, U.S. Patent 3,589,912<br />
[32] D<strong>on</strong>ley, E & Lewandowski, D. 1996. Optimized Design and Oxidizing Parameters for Minimizing Emissi<strong>on</strong>s<br />
During VOC Thermal Oxidati<strong>on</strong>. Metal Finishing, 94(11), 52-58<br />
[33] Angstadt, J.W. 1970. Method and Apparatus for Automatic Cleaning of Coffee Roasters. U.S. Patent 3,733,172<br />
[34] De M<strong>on</strong>te, M. Padoano, E. & Pozzetto, D. 2003. Waste Heat Recovery in a Coffee Roasting Plant. Applied Thermal<br />
<strong>Engineering</strong>, 23(8), 1033-1044<br />
[35] Finken, H. Jansen, G. & Naves, E. 1998. Arrangement for Roasting Vegetable Bulk Material, Such as Coffee Beans.<br />
U.S. Patent 5,718,164<br />
[36] Wasserman, G.S. Rerngsamai, N. Hayes, D.F. Mofford, E.F. & Dabdoub, C. 2001. Roasted Coffee and Coffee<br />
Roasting Method, U.S. Patent 6,207,211