- Page 1 and 2:
Krasnodar GRES Project 86-33 7 Volu
- Page 3 and 4:
2.1.1 EIA Preparation. Review. and
- Page 5 and 6:
4.1 Air ...........................
- Page 7 and 8:
4.4.2 Land Owners .................
- Page 9 and 10:
....................... ....... 5.2
- Page 11 and 12:
9.3 Continuous Monitoring of Emissi
- Page 13 and 14:
e I. 1 Introduction 1.0 EXECUTIVE S
- Page 15 and 16:
operation of the Krasnodar GRES fac
- Page 17 and 18:
e plant staffing structure. Departm
- Page 19 and 20:
e Plant Sewage Discharge - Potentia
- Page 21 and 22:
The off-site air monitoring station
- Page 23 and 24:
In addition, the plant electric tra
- Page 25 and 26:
@ In addition, several public meeti
- Page 27 and 28:
@ Training facilities should be ins
- Page 29 and 30:
2.0 POLICY, LEGAL AND ADMINISTRATIV
- Page 31 and 32:
2.1.1 EIA Preparation, Review, and
- Page 33 and 34:
e Regulations by the Russian Federa
- Page 35 and 36:
* and 2.2.3 Occupational Health and
- Page 37 and 38: electromagnetic field intensities b
- Page 39 and 40: PH Contaminant or Parameter BOD Hea
- Page 41 and 42: TABLE 2.6 Electromagnetic Field Int
- Page 43 and 44: negligence or non-negligence; degre
- Page 45 and 46: e Odessa Declaration on the Black S
- Page 47 and 48: Environmental and workplace quality
- Page 49 and 50: consists of large gravel mixed with
- Page 51 and 52: 3.2.7 Water Source The source of op
- Page 53 and 54: standards in addition to any design
- Page 55 and 56: 3.3.4 Estimated Plant Emissions Air
- Page 57 and 58: Adding a new double-circuit 220 kV
- Page 59 and 60: The summer is hot and long (it begi
- Page 61 and 62: Notes: 1. Previous meteorological s
- Page 63 and 64: 4.1 .I .4 Annual and Seasonal Preci
- Page 65 and 66: Months I I I I I I IV V V I VII Vll
- Page 67 and 68: During rainfall and fog the western
- Page 69 and 70: Years 1979 1979 1980 1980 1980 1980
- Page 71 and 72: 4.1.3 Air Quality Impact by Nitroge
- Page 73 and 74: Appendices 8 and 9 are indicative o
- Page 75 and 76: River Laba Malaya Laba Point Doguzh
- Page 77 and 78: a steady low water level which can
- Page 79 and 80: i, Section F, ' 1 m BS m m2 1 41 4.
- Page 81 and 82: Section 1 2 3 4 Sum i, m BS Q I m3/
- Page 83 and 84: Table 4.21 Average Annual Water Dis
- Page 85 and 86: River Site La ba Kaladzhinskaya La
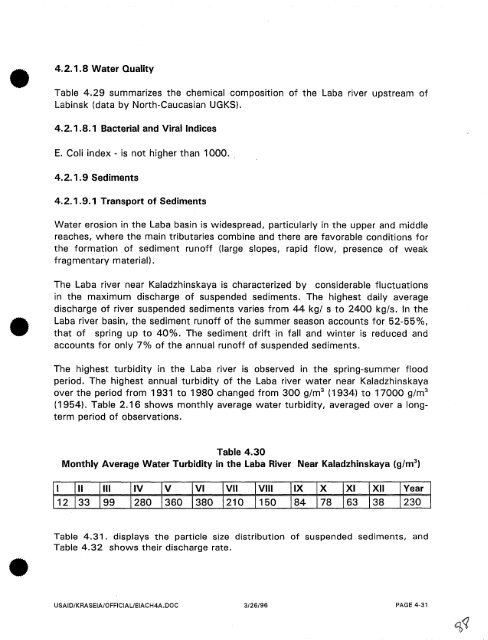
- Page 87: Dimensionality 8 % mln. m3 8 O h ml
- Page 92 and 93: Sampling Date 14.V 15.VI 2.8 20.V 2
- Page 94 and 95: Table 4.34 Recorded Disposals into
- Page 96 and 97: 4.2.2.2 Thickness and Occurrence of
- Page 98 and 99: 4.2.2.4 The Regions of Groundwater
- Page 100 and 101: 4.3. I. 1 Stratigraphy In the Cauca
- Page 102 and 103: * These An earthquake closest to th
- Page 104 and 105: a 4.3.1.4 Relief In a geomorphologi
- Page 106 and 107: 4.3.1.5 Mineralogy The deposits of
- Page 108 and 109: 4.3.1.8 Frozen-State Regime Climate
- Page 110 and 111: Humic-gley soil constitutes 17% and
- Page 112 and 113: a reaches In terms of humus horizon
- Page 114 and 115: @ In terms of the leaching extent,
- Page 116 and 117: Form of Use Arable land Perennial p
- Page 118 and 119: @ River Laba Malaya Laba 4.4.1 Land
- Page 120 and 121: Name Administration of Mostovskoy 1
- Page 122 and 123: N 1 2 3 4 5 6 7 8 9 10 11 12 13 14
- Page 124 and 125: a The average annual increase of pl
- Page 126 and 127: Data on record keeping of ungulate
- Page 128 and 129: divided into separate massifs by th
- Page 130 and 131: a 4.5.2.1.3 Animal Kingdom The Cauc
- Page 132 and 133: the Southern slope. European minks
- Page 134 and 135: 4.6.1.3 Labor and Occupation Market
- Page 136 and 137: Total Disease of circulation organs
- Page 138 and 139:
and waste with negative impacts on
- Page 140 and 141:
Existing Environment Conditions Lan
- Page 142 and 143:
5.1.2.5 River Crossing by Transmiss
- Page 144 and 145:
5.2 Operation Stage Figure 5.1 is r
- Page 146 and 147:
Maximum concentration of nitrogen o
- Page 148 and 149:
Distance From the Power Plant, km 1
- Page 150 and 151:
probability is 7.14 m3/sec and this
- Page 152 and 153:
Underflooding of the power plant te
- Page 154 and 155:
Water pollution at the water intake
- Page 156 and 157:
Biological pollution and chemical p
- Page 158 and 159:
Noise range in the engine room fall
- Page 160 and 161:
Reference points 002 through 004 ar
- Page 162 and 163:
use of individual noise reduction m
- Page 164 and 165:
' - European feather grass Anapa, L
- Page 166 and 167:
Populated Areas Mostovskoy Pereprav
- Page 168 and 169:
1 2 3 4 5 6 7 8 9 # Table 5.1 2 Est
- Page 170 and 171:
In accordance with the district Adm
- Page 172 and 173:
during oil transportation. The othe
- Page 174 and 175:
are then directed to an oillwater s
- Page 176 and 177:
Biological reclamation - bogging an
- Page 178 and 179:
- direct impact on vegetation, fore
- Page 180 and 181:
5.2.3.2 Transmission Lines 5.2.3.2.
- Page 182 and 183:
5.2.3.2.2 Impacts on Bird Migration
- Page 184 and 185:
Positive lmpacts Additional facilit
- Page 186 and 187:
6.0 WORKER HEALTH AND SAFETY Health
- Page 188 and 189:
In the course of practical training
- Page 190 and 191:
knowledge of power generator's safe
- Page 192 and 193:
@ Urgent instruction is carried out
- Page 194 and 195:
- preventive maintenance of the equ
- Page 196 and 197:
Governing Standard: "Regulations in
- Page 198 and 199:
The Plant Substation; Fenced-off ar
- Page 200 and 201:
CONTAMINANT RUSSIA CO NO2 SO2 Parti
- Page 202 and 203:
urn agricultural wastes for fuel, t
- Page 204 and 205:
production and the large land area
- Page 206 and 207:
Interconnection to the existing tra
- Page 208 and 209:
7.6 Alternative Water Supplies and
- Page 210 and 211:
4. "Report No. 256". Krasnodar Terr
- Page 212 and 213:
Target of Impact ENVIRONMENTAL Air
- Page 214 and 215:
Impacts Water supply shortages due
- Page 216 and 217:
Target of Impact Air Quality Surfac
- Page 218 and 219:
Noise levels shall be measured at a
- Page 220 and 221:
mobile sources (trucks, loaders, et
- Page 222 and 223:
located 0.5 km downstream of the wa
- Page 224 and 225:
@ 10.0 ENVIRONMENTAL MANAGEMENT AND
- Page 226 and 227:
@ a facility. Maintenance Training
- Page 228:
e conducted. In addition, staff wil
- Page 231 and 232:
Primary Planning Responsibility Rev
- Page 233 and 234:
11.0 INTERAGENCY COORDINATION AND P
- Page 235 and 236:
2. Burns and Roe indicated that Gen
- Page 237 and 238:
Discussion: 1. The Regional Environ
- Page 239 and 240:
V.V. Fedorovich, Editor and Publish
- Page 241 and 242:
* Molokanov: Question: Anikin: Molo
- Page 243 and 244:
Molokanov: We have our man in the a
- Page 245 and 246:
nuclear power industry to judge it?
- Page 247 and 248:
Lazov: There aint' any gas. The nuc
- Page 249 and 250:
1 1.2.6 Mostovskoy District Represe
- Page 251 and 252:
Having reviewed major project techn
- Page 253 and 254:
a 1 1.3.2 Attendees 1. B. G. Teresh
- Page 255 and 256:
1 1.3.3 Agenda of Public Hearing Pu
- Page 257 and 258:
Answer: Mr 0. Yeschenko. The plant
- Page 259 and 260:
@ 11.3.4 Newspaper Coverage of Publ
- Page 261 and 262:
Mazut will be used during the start
- Page 263 and 264:
June July August Wind rose (summer
- Page 265 and 266:
December January February Wind rose
- Page 267 and 268:
I Appendix 5 Wind rose at different
- Page 269 and 270:
Wind rose in foggy weather and in p
- Page 271 and 272:
1 0285004 'Kubansky Gypsum' stock c
- Page 273 and 274:
iVlostovsky mill-sorting plant indu
- Page 275 and 276:
6 3504831 kIostovskoe PTS 32 Sovets
- Page 277 and 278:
agent code 1 untreated 2 including
- Page 279 and 280:
a 1555 2704 5 5 acetic acid gasolin
- Page 281 and 282:
11 0335493 "Labinsky sugar refinery
- Page 283 and 284:
untreated benzol toluene acrolein f
- Page 285 and 286:
( agent I code agent description "C
- Page 287 and 288:
ethyl alcohol ethyl Cellosoive buty
- Page 289 and 290:
chloride 1722 tetramethylt 2.914000
- Page 291 and 292:
, 5 16 isoprene (2methylbutadien e-
- Page 293 and 294:
a 20 5142419 Labinskaya a/c 1492 18
- Page 295 and 296:
agent code agent description "Avtor
- Page 297 and 298:
* ' agent code 24 3892633 U B joint
- Page 299 and 300:
a - agent. code 26 0001160 Labinska
- Page 303 and 304:
APPENDIX 13 CALCULATED GAGES ON THE
- Page 305 and 306:
Appendix 15
- Page 307 and 308:
The Scheme of the Krasnodar GRES Si
- Page 309 and 310:
Mostovsky District Transport Networ
- Page 311 and 312:
I KRASNODAR GRES PROJECT IIMPACT OK
- Page 315 and 316:
BESTAVAILABLE COPY '"'P'I~~ c)l'[ll