Design of an Automatic Control Algorithm for Energy-Efficient ...
Design of an Automatic Control Algorithm for Energy-Efficient ...
Design of an Automatic Control Algorithm for Energy-Efficient ...

You also want an ePaper? Increase the reach of your titles
YUMPU automatically turns print PDFs into web optimized ePapers that Google loves.
8 System <strong>an</strong>d functionality integration 81<br />
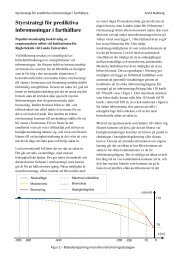
���� will be introduced (set to 0 in Figure 8.5).<br />
��������� �<br />
�<br />
�������������<br />
�������������<br />
�� ���<br />
¡ ���� <strong>for</strong> ����¡���������<br />
��������� ��������<br />
����<br />
����� ���������������<br />
����<br />
�� ���<br />
¡ ���� <strong>for</strong> ����¡���������<br />
¡ ����<br />
� else<br />
��� � �� ℃<br />
<strong>for</strong> �� ℃ � ��� � �� ℃ � ����� ���������� �����<br />
¡ ���� <strong>for</strong> �� ℃ � ��� � �� ℃ � ����� ����������� �����<br />
��� � �� ℃<br />
(8.16)<br />
This relationship c<strong>an</strong> be used to implement a simple air speed consideration. Values<br />
above ���� need to be set to ����. The limits may be adapted <strong>an</strong>d tested. A ���� <strong>of</strong><br />
��� � is chosen to avoid reaching the maximum <strong>of</strong> ����<br />
� �<br />
�<br />
8.1.4 Humidity com<strong>for</strong>t<br />
proposed in ISO 7730 [7].<br />
As seen in Section 2.2.3, <strong>an</strong> established mathematical <strong>for</strong>mulation <strong>of</strong> a com<strong>for</strong>table air<br />
humidity does not exist. There<strong>for</strong>e, using the chart by Leudsen <strong>an</strong>d Freymark <strong>an</strong>d the<br />
limits given in DIN 1946-3, a com<strong>for</strong>t figure <strong>for</strong> the humidity is created.<br />
As general limits <strong>for</strong> the relative humidity 30% as lower <strong>an</strong>d 70% as upper boundary<br />
have been chosen. A slope fitting the one <strong>of</strong> Leudsen <strong>an</strong>d Freymarks graph is chosen, while<br />
the upper limit is adapted to the DIN recommendations. As a result, <strong>an</strong> upper ����� <strong>an</strong>d<br />
a lower ���� com<strong>for</strong>t limit is obtained.<br />
����� �<br />
���� �<br />
�<br />
��<br />
��<br />
�<br />
��<br />
��<br />
��� <strong>for</strong> ���� � ��℃<br />
� ��� ¡ ���� ������� <strong>for</strong> ���� � ��℃<br />
� ���� ¡ ���� ������� <strong>for</strong> ���� � ��℃<br />
��� <strong>for</strong> ���� � ��℃<br />
(8.17)<br />
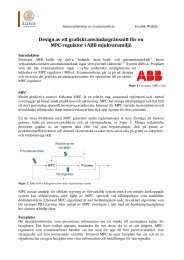
���� is the actual cabin temperature in degrees Celsius. The com<strong>for</strong>t area c<strong>an</strong> be seen in<br />
Figure 8.6. With these limits the humidity com<strong>for</strong>t (����) is defined. It expresses how far<br />
away from a com<strong>for</strong>table humidity the actual condition is. In order to respect personal