Market Survey on Copper - Indian Bureau of Mines
Market Survey on Copper - Indian Bureau of Mines Market Survey on Copper - Indian Bureau of Mines
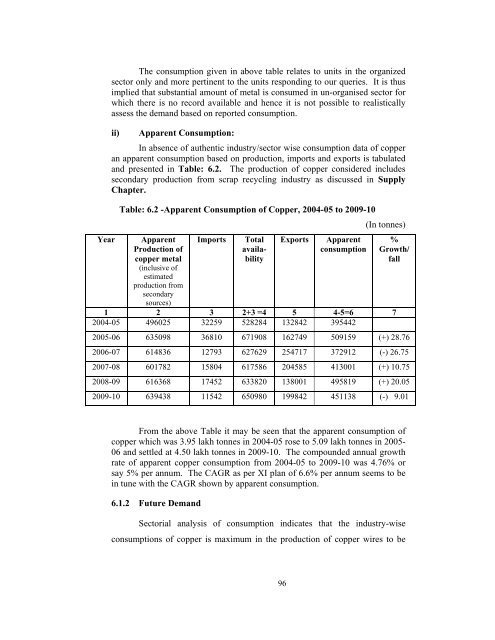
The consumption given in above table relates to units in the organized sector only and more pertinent to the units responding to our queries. It is thus implied that substantial amount of metal is consumed in un-organised sector for which there is no record available and hence it is not possible to realistically assess the demand based on reported consumption. ii) Apparent Consumption: In absence of authentic industry/sector wise consumption data of copper an apparent consumption based on production, imports and exports is tabulated and presented in Table: 6.2. The production of copper considered includes secondary production from scrap recycling industry as discussed in Supply Chapter. Table: 6.2 -Apparent Consumption of Copper, 2004-05 to 2009-10 (In tonnes) Year Apparent Imports Total Exports Apparent % Production of availa- consumption Growth/ copper metal (inclusive of estimated production from secondary sources) bility fall 1 2 3 2+3 =4 5 4-5=6 7 2004-05 496025 32259 528284 132842 395442 2005-06 635098 36810 671908 162749 509159 (+) 28.76 2006-07 614836 12793 627629 254717 372912 (-) 26.75 2007-08 601782 15804 617586 204585 413001 (+) 10.75 2008-09 616368 17452 633820 138001 495819 (+) 20.05 2009-10 639438 11542 650980 199842 451138 (-) 9.01 From the above Table it may be seen that the apparent consumption of copper which was 3.95 lakh tonnes in 2004-05 rose to 5.09 lakh tonnes in 2005- 06 and settled at 4.50 lakh tonnes in 2009-10. The compounded annual growth rate of apparent copper consumption from 2004-05 to 2009-10 was 4.76% or say 5% per annum. The CAGR as per XI plan of 6.6% per annum seems to be in tune with the CAGR shown by apparent consumption. 6.1.2 Future Demand Sectorial analysis of consumption indicates that the industry-wise consumptions of copper is maximum in the production of copper wires to be 96
used in electrical industry as household wiring, winding wires, automobile wiring as well as in many other ways. There is an overall increase in the production of various goods namely electric motors, fans, automobiles, wiring and winding wires, transmission cables, refrigeration and air-conditioning plants, air conditioner, washing and laundry machines etc. The details of compounded annual growth rates (CAGR) of various copper consuming machines/equipments is given in Annexure:6-I. Considering the apparent consumption as given in Table 6.2 from 2004-05 to 2008-09 a CAGR of 12.2% have been arrived and used for forecasting the apparent consumption till 2024-25 as given in Table 6.3. The apparent consumption during 2009-10 has not been considered as it shows a negative growth and not representing the factual position. 1) Demand Forecast of Copper on CAGR & GDP Electrical industry is by far the largest industry consuming copper to a tune of 50% of the total consumption in the country. Copper is used in making wires of different diameter to suit the requirements such as making cables, transmission and winding wires for household as well as industrial purposes. Production of copper has seen an unprecedented growth in recent years because of the smelting capacity came up in private sector on the basis of imported concentrates. In addition to this the recovery of copper from scrap is gaining importance and contributing about 20% of the total primary production. Therefore, on the basis of primary and secondary production of copper, an estimated production of 639 thousand tonnes has been arrived at in 2009-10. Although the country exports sizeable quantities of copper presently it also imports some quantities of copper. By adding the apparent production of copper and imports and deducting the exports, the demand of copper has been calculated at 496 thousand tonnes in 2008-09 and 451 thousand tonnes in 2009-10. Table-6.2. The demand of copper is increasing at a CAGR of 12.2%, calculated on the basis of data from 2004-05 to 2008-09. This has been utilized to forecast the demand beyond 2009-10 till 2024-25 and is given in Table-6.3. During 11 th Plan period, Planning Commission has calculated a GDP growth of 8.2% and for 12 th Plan period GDP growth has been estimated at 9-9.5%. Taking into consideration the GDP growth of 9% for 12 th plan (2012-17), the demand forecast till 2024-25 has been made, the same is given at Table-6.3. 97
- Page 61 and 62: ii) Malanjkhand Copper Project The
- Page 63 and 64: silver, selenium, tellurium, nickel
- Page 65 and 66: ladle crane to the Pierce Smith Con
- Page 67 and 68: Complex), Jharkhand (Indian Copper
- Page 69 and 70: Presently, the concentrator situate
- Page 71 and 72: Out of these 5 plants, no plant is
- Page 75 and 76: In addition to this there are some
- Page 77 and 78: International Copper Association Lt
- Page 79 and 80: Chapter 4. Foreign Market</
- Page 81 and 82: Thousands Tonnes Russia 5% Poland 4
- Page 83 and 84: Thousands Tonnes Thousands Tonnes F
- Page 85 and 86: Table: 4.1- Top 10 Copper Mines by
- Page 87 and 88: India’s trade with Australia is m
- Page 89 and 90: The exports of refined copper were
- Page 91 and 92: East Iran and Lar in Zahedan locali
- Page 93 and 94: eserves of the order of 4.23 millio
- Page 95 and 96: smelter production of copper is ste
- Page 97 and 98: copper which was only 105 thousand
- Page 99 and 100: As it will be seen from the Table-4
- Page 101 and 102: Table -4.8: Estimated Region wise W
- Page 103: Chapter 5. Prices Copper metal is t
- Page 106 and 107: Table: 5.3 - London Metal Exchange
- Page 108 and 109: 10000 Figure : 5.2 - Month Wise LME
- Page 110 and 111: y the State Government in the Minin
- Page 114 and 115: Table-6.3: Internal Apparent Demand
- Page 116 and 117: electrification will result in an i
- Page 118 and 119: consumption in General Engineering
- Page 120 and 121: The HCL has planned a number of gre
- Page 122 and 123: In earlier chapter it has already b
- Page 124 and 125: ased on imported concentrates. Indi
- Page 126 and 127: Annexure: 3 - I LIST OF THE UNITS R
- Page 128 and 129: Sl. No. NAME OF THE UNIT CAPACITY (
- Page 130 and 131: Annexure: 3 - II LIST OF THE UNITS
- Page 132 and 133: Sl. NAME OF THE UNIT CAPACITY WASTE
- Page 134 and 135: Sl. NAME OF THE UNIT CAPACITY WASTE
- Page 136 and 137: Sl. NAME OF THE UNIT CAPACITY WASTE
- Page 138 and 139: Sl. NAME OF THE UNIT CAPACITY No. (
- Page 140 and 141: Sl. NAME OF THE UNIT CAPACITY WASTE
- Page 142 and 143: Sl. NAME OF THE UNIT CAPACITY WASTE
- Page 144 and 145: Sl. No. XII TAMIL NADU NAME OF THE
- Page 146 and 147: Concld… Sl. NAME OF THE UNIT CAPA
- Page 148 and 149: Concld…. COBRA No.2 Copper Wire N
- Page 150 and 151: Annexure: 3 - IV (B) Exports of Cop
- Page 152 and 153: Annexure: 4 - II World Mine Product
- Page 154 and 155: Sl. No. Annexure: 4 - IV World Prod
- Page 156 and 157: 140
- Page 158 and 159: Sl. No. Annexure: 4 - VI World Impo
- Page 160 and 161: Sl. No. Annexure: 4 - VIII India’
The c<strong>on</strong>sumpti<strong>on</strong> given in above table relates to units in the organized<br />
sector <strong>on</strong>ly and more pertinent to the units resp<strong>on</strong>ding to our queries. It is thus<br />
implied that substantial amount <strong>of</strong> metal is c<strong>on</strong>sumed in un-organised sector for<br />
which there is no record available and hence it is not possible to realistically<br />
assess the demand based <strong>on</strong> reported c<strong>on</strong>sumpti<strong>on</strong>.<br />
ii) Apparent C<strong>on</strong>sumpti<strong>on</strong>:<br />
In absence <strong>of</strong> authentic industry/sector wise c<strong>on</strong>sumpti<strong>on</strong> data <strong>of</strong> copper<br />
an apparent c<strong>on</strong>sumpti<strong>on</strong> based <strong>on</strong> producti<strong>on</strong>, imports and exports is tabulated<br />
and presented in Table: 6.2. The producti<strong>on</strong> <strong>of</strong> copper c<strong>on</strong>sidered includes<br />
sec<strong>on</strong>dary producti<strong>on</strong> from scrap recycling industry as discussed in Supply<br />
Chapter.<br />
Table: 6.2 -Apparent C<strong>on</strong>sumpti<strong>on</strong> <strong>of</strong> <strong>Copper</strong>, 2004-05 to 2009-10<br />
(In t<strong>on</strong>nes)<br />
Year Apparent Imports Total Exports Apparent %<br />
Producti<strong>on</strong> <strong>of</strong><br />
availa-<br />
c<strong>on</strong>sumpti<strong>on</strong> Growth/<br />
copper metal<br />
(inclusive <strong>of</strong><br />
estimated<br />
producti<strong>on</strong> from<br />
sec<strong>on</strong>dary<br />
sources)<br />
bility<br />
fall<br />
1 2 3 2+3 =4 5 4-5=6 7<br />
2004-05 496025 32259 528284 132842 395442<br />
2005-06 635098 36810 671908 162749 509159 (+) 28.76<br />
2006-07 614836 12793 627629 254717 372912 (-) 26.75<br />
2007-08 601782 15804 617586 204585 413001 (+) 10.75<br />
2008-09 616368 17452 633820 138001 495819 (+) 20.05<br />
2009-10 639438 11542 650980 199842 451138 (-) 9.01<br />
From the above Table it may be seen that the apparent c<strong>on</strong>sumpti<strong>on</strong> <strong>of</strong><br />
copper which was 3.95 lakh t<strong>on</strong>nes in 2004-05 rose to 5.09 lakh t<strong>on</strong>nes in 2005-<br />
06 and settled at 4.50 lakh t<strong>on</strong>nes in 2009-10. The compounded annual growth<br />
rate <strong>of</strong> apparent copper c<strong>on</strong>sumpti<strong>on</strong> from 2004-05 to 2009-10 was 4.76% or<br />
say 5% per annum. The CAGR as per XI plan <strong>of</strong> 6.6% per annum seems to be<br />
in tune with the CAGR shown by apparent c<strong>on</strong>sumpti<strong>on</strong>.<br />
6.1.2 Future Demand<br />
Sectorial analysis <strong>of</strong> c<strong>on</strong>sumpti<strong>on</strong> indicates that the industry-wise<br />
c<strong>on</strong>sumpti<strong>on</strong>s <strong>of</strong> copper is maximum in the producti<strong>on</strong> <strong>of</strong> copper wires to be<br />
96


