Environmental Health Criteria 214
Environmental Health Criteria 214
Environmental Health Criteria 214

Create successful ePaper yourself
Turn your PDF publications into a flip-book with our unique Google optimized e-Paper software.
HUMAN EXPOSURE ASSESSMENT<br />
between two unequally weighted hypotheses; the first is the null<br />
hypothesis, H 0 , which is the safe hypothesis, and the second is H 1 ,<br />
the alternative or sceptical hypothesis, which requires sufficiently<br />
large evidence to believe in. The specifications of the test, based<br />
upon sceptical scientific belief or common usage, are the type I error<br />
and the type II error (defined in section 4.4.3). Introductory<br />
information on sample size determination is presented here; the reader<br />
is referred to Lemeshow et al. (1990) for details.<br />
To determine the minimum sample size required to observe the<br />
desired outcome, one needs to determine the smallest effect that is<br />
scientifically worth detecting (i.e., based on measurement limit or<br />
scientific principles), and use that to collect a sample with enough<br />
information to detect such a difference. The effect is the minimum<br />
significant difference in exposure between two groups. The smaller the<br />
effect, the more information is required to distinguish it. This<br />
effect is related to the type I error of a hypothesis test. There are<br />
two components, the type II error and the sample size, which are<br />
unspecified. When the type II error is specified, the resulting sample<br />
size can be determined. Once the sample size is determined, the power<br />
(1-type II error) of a study can be computed. The smaller the<br />
difference to be detected, the larger the sample size needed for fixed<br />
type I and type II error probabilities.<br />
The following describes the formula for a two-group comparison.<br />
To compare the means of two groups with equal sample size, let Delta<br />
represent a scientifically significant difference that we would like<br />
to detect, if it exists. Suppose that the first group can be modelled<br />
by Y 1 = µ 1 +epsilon 1 , where µ 1 is the mean and epsilon 1 ~<br />
N(0,rho 2 ) is the error term, and the second group can be modelled<br />
by Y 2 =µ 2 + epsilon 2 with the error term epsilon 2 ~ N(0,<br />
rho 2 ). The only difference between the two groups is the mean<br />
response. The groups will be considered statistically different only<br />
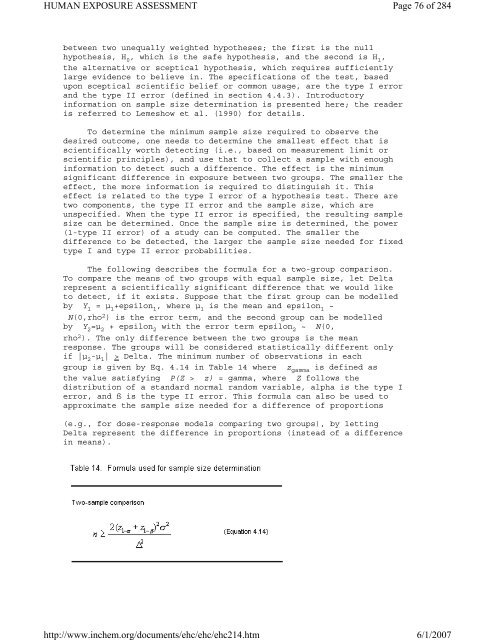
if |µ 2 -µ 1 | > Delta. The minimum number of observations in each<br />
group is given by Eq. 4.14 in Table 14 where z gamma is defined as<br />
the value satisfying P(Z > z) = gamma, where Z follows the<br />
distribution of a standard normal random variable, alpha is the type I<br />
error, and ß is the type II error. This formula can also be used to<br />
approximate the sample size needed for a difference of proportions<br />
(e.g., for dose-response models comparing two groups), by letting<br />
Delta represent the difference in proportions (instead of a difference<br />
in means).<br />
http://www.inchem.org/documents/ehc/ehc/ehc<strong>214</strong>.htm<br />
Page 76 of 284<br />
6/1/2007