Environmental Health Criteria 214
Environmental Health Criteria 214
Environmental Health Criteria 214

You also want an ePaper? Increase the reach of your titles
YUMPU automatically turns print PDFs into web optimized ePapers that Google loves.
HUMAN EXPOSURE ASSESSMENT<br />
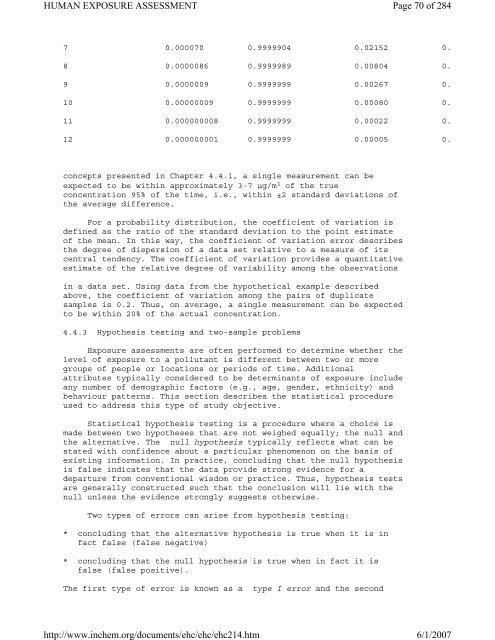
7 0.000070 0.9999904 0.02152 0.<br />
8 0.0000086 0.9999989 0.00804 0.<br />
9 0.0000009 0.9999999 0.00267 0.<br />
10 0.00000009 0.9999999 0.00080 0.<br />
11 0.000000008 0.9999999 0.00022 0.<br />
12 0.000000001 0.9999999 0.00005 0.<br />
concepts presented in Chapter 4.4.1, a single measurement can be<br />
expected to be within approximately 3-7 µg/m 3 of the true<br />
concentration 95% of the time, i.e., within ±2 standard deviations of<br />
the average difference.<br />
For a probability distribution, the coefficient of variation is<br />
defined as the ratio of the standard deviation to the point estimate<br />
of the mean. In this way, the coefficient of variation error describes<br />
the degree of dispersion of a data set relative to a measure of its<br />
central tendency. The coefficient of variation provides a quantitative<br />
estimate of the relative degree of variability among the observations<br />
in a data set. Using data from the hypothetical example described<br />
above, the coefficient of variation among the pairs of duplicate<br />
samples is 0.2. Thus, on average, a single measurement can be expected<br />
to be within 20% of the actual concentration.<br />
4.4.3 Hypothesis testing and two-sample problems<br />
Exposure assessments are often performed to determine whether the<br />
level of exposure to a pollutant is different between two or more<br />
groups of people or locations or periods of time. Additional<br />
attributes typically considered to be determinants of exposure include<br />
any number of demographic factors (e.g., age, gender, ethnicity) and<br />
behaviour patterns. This section describes the statistical procedure<br />
used to address this type of study objective.<br />
Statistical hypothesis testing is a procedure where a choice is<br />
made between two hypotheses that are not weighed equally; the null and<br />
the alternative. The null hypothesis typically reflects what can be<br />
stated with confidence about a particular phenomenon on the basis of<br />
existing information. In practice, concluding that the null hypothesis<br />
is false indicates that the data provide strong evidence for a<br />
departure from conventional wisdom or practice. Thus, hypothesis tests<br />
are generally constructed such that the conclusion will lie with the<br />
null unless the evidence strongly suggests otherwise.<br />
Two types of errors can arise from hypothesis testing:<br />
* concluding that the alternative hypothesis is true when it is in<br />
fact false (false negative)<br />
* concluding that the null hypothesis is true when in fact it is<br />
false (false positive).<br />
The first type of error is known as a type I error and the second<br />
http://www.inchem.org/documents/ehc/ehc/ehc<strong>214</strong>.htm<br />
Page 70 of 284<br />
6/1/2007