- Page 1 and 2:
HUMAN EXPOSURE ASSESSMENT UNITED NA
- Page 3 and 4:
HUMAN EXPOSURE ASSESSMENT PREAMBLE
- Page 5 and 6:
HUMAN EXPOSURE ASSESSMENT 6.6.2. Un
- Page 7 and 8:
HUMAN EXPOSURE ASSESSMENT 10.6.7. B
- Page 9 and 10:
HUMAN EXPOSURE ASSESSMENT (iv) to p
- Page 11 and 12:
HUMAN EXPOSURE ASSESSMENT Organizat
- Page 13 and 14:
HUMAN EXPOSURE ASSESSMENT WHO TASK
- Page 15 and 16:
HUMAN EXPOSURE ASSESSMENT Dr M. You
- Page 17 and 18:
HUMAN EXPOSURE ASSESSMENT Environme
- Page 19 and 20:
HUMAN EXPOSURE ASSESSMENT increase
- Page 21 and 22:
HUMAN EXPOSURE ASSESSMENT character
- Page 23 and 24:
HUMAN EXPOSURE ASSESSMENT include e
- Page 25 and 26:
HUMAN EXPOSURE ASSESSMENT http://ww
- Page 27 and 28:
HUMAN EXPOSURE ASSESSMENT the carri
- Page 29 and 30:
HUMAN EXPOSURE ASSESSMENT the ideal
- Page 31 and 32:
HUMAN EXPOSURE ASSESSMENT continuum
- Page 33 and 34:
HUMAN EXPOSURE ASSESSMENT as well a
- Page 35 and 36:
HUMAN EXPOSURE ASSESSMENT In regula
- Page 37 and 38:
HUMAN EXPOSURE ASSESSMENT Results o
- Page 39 and 40:
HUMAN EXPOSURE ASSESSMENT Risk miti
- Page 41 and 42:
HUMAN EXPOSURE ASSESSMENT trends of
- Page 43 and 44:
HUMAN EXPOSURE ASSESSMENT Knowledge
- Page 45 and 46:
HUMAN EXPOSURE ASSESSMENT small tow
- Page 47 and 48:
HUMAN EXPOSURE ASSESSMENT * selecti
- Page 49 and 50:
HUMAN EXPOSURE ASSESSMENT provide s
- Page 51 and 52:
HUMAN EXPOSURE ASSESSMENT the water
- Page 53 and 54:
HUMAN EXPOSURE ASSESSMENT Public po
- Page 55 and 56:
HUMAN EXPOSURE ASSESSMENT character
- Page 57 and 58:
HUMAN EXPOSURE ASSESSMENT PbB PbF P
- Page 59 and 60:
HUMAN EXPOSURE ASSESSMENT values in
- Page 61 and 62:
HUMAN EXPOSURE ASSESSMENT lead meas
- Page 63 and 64:
HUMAN EXPOSURE ASSESSMENT Continuou
- Page 65 and 66:
HUMAN EXPOSURE ASSESSMENT logarithm
- Page 67 and 68:
HUMAN EXPOSURE ASSESSMENT events in
- Page 69 and 70:
HUMAN EXPOSURE ASSESSMENT -1.751 0.
- Page 71 and 72:
HUMAN EXPOSURE ASSESSMENT one is a
- Page 73 and 74:
HUMAN EXPOSURE ASSESSMENT house dus
- Page 75 and 76:
HUMAN EXPOSURE ASSESSMENT PM 2.5 co
- Page 77 and 78:
HUMAN EXPOSURE ASSESSMENT 4.5 Non-p
- Page 79 and 80:
HUMAN EXPOSURE ASSESSMENT season, r
- Page 81 and 82:
HUMAN EXPOSURE ASSESSMENT Table 15.
- Page 83 and 84:
HUMAN EXPOSURE ASSESSMENT Activity
- Page 85 and 86:
HUMAN EXPOSURE ASSESSMENT Similarly
- Page 87 and 88:
HUMAN EXPOSURE ASSESSMENT local con
- Page 89 and 90:
HUMAN EXPOSURE ASSESSMENT Environme
- Page 91 and 92:
HUMAN EXPOSURE ASSESSMENT for tempo
- Page 93 and 94:
HUMAN EXPOSURE ASSESSMENT devices,
- Page 95 and 96:
HUMAN EXPOSURE ASSESSMENT Using a d
- Page 97 and 98:
HUMAN EXPOSURE ASSESSMENT (gases an
- Page 99 and 100:
HUMAN EXPOSURE ASSESSMENT Dermal ab
- Page 101 and 102:
HUMAN EXPOSURE ASSESSMENT Models de
- Page 103 and 104:
HUMAN EXPOSURE ASSESSMENT partition
- Page 105 and 106:
HUMAN EXPOSURE ASSESSMENT 6.6.1 Var
- Page 107 and 108:
HUMAN EXPOSURE ASSESSMENT Probabili
- Page 109 and 110:
HUMAN EXPOSURE ASSESSMENT The ADD i
- Page 111 and 112:
HUMAN EXPOSURE ASSESSMENT 7.1 Intro
- Page 113 and 114:
HUMAN EXPOSURE ASSESSMENT suitabili
- Page 115 and 116:
HUMAN EXPOSURE ASSESSMENT Carbon mo
- Page 117 and 118:
HUMAN EXPOSURE ASSESSMENT Samplin I
- Page 119 and 120:
HUMAN EXPOSURE ASSESSMENT Table 22.
- Page 121 and 122:
HUMAN EXPOSURE ASSESSMENT TSI Flowr
- Page 123 and 124:
HUMAN EXPOSURE ASSESSMENT 2 litre/m
- Page 125 and 126:
HUMAN EXPOSURE ASSESSMENT Table 24.
- Page 127 and 128:
HUMAN EXPOSURE ASSESSMENT or increa
- Page 129 and 130:
HUMAN EXPOSURE ASSESSMENT Fluosilic
- Page 131 and 132:
HUMAN EXPOSURE ASSESSMENT dependent
- Page 133 and 134:
HUMAN EXPOSURE ASSESSMENT basket su
- Page 135 and 136:
HUMAN EXPOSURE ASSESSMENT reasonabl
- Page 137 and 138:
HUMAN EXPOSURE ASSESSMENT There are
- Page 139 and 140:
HUMAN EXPOSURE ASSESSMENT predesign
- Page 141 and 142:
HUMAN EXPOSURE ASSESSMENT field wou
- Page 143 and 144: HUMAN EXPOSURE ASSESSMENT samples v
- Page 145 and 146: HUMAN EXPOSURE ASSESSMENT dust to,
- Page 147 and 148: HUMAN EXPOSURE ASSESSMENT Choosing
- Page 149 and 150: HUMAN EXPOSURE ASSESSMENT others sh
- Page 151 and 152: HUMAN EXPOSURE ASSESSMENT sampling
- Page 153 and 154: HUMAN EXPOSURE ASSESSMENT of house
- Page 155 and 156: HUMAN EXPOSURE ASSESSMENT Individua
- Page 157 and 158: HUMAN EXPOSURE ASSESSMENT subject o
- Page 159 and 160: HUMAN EXPOSURE ASSESSMENT same assa
- Page 161 and 162: HUMAN EXPOSURE ASSESSMENT high-volu
- Page 163 and 164: HUMAN EXPOSURE ASSESSMENT Immunoche
- Page 165 and 166: HUMAN EXPOSURE ASSESSMENT 9.5.1 Air
- Page 167 and 168: HUMAN EXPOSURE ASSESSMENT measureme
- Page 169 and 170: HUMAN EXPOSURE ASSESSMENT By their
- Page 171 and 172: HUMAN EXPOSURE ASSESSMENT possess a
- Page 173 and 174: HUMAN EXPOSURE ASSESSMENT factors (
- Page 175 and 176: HUMAN EXPOSURE ASSESSMENT Improved
- Page 177 and 178: HUMAN EXPOSURE ASSESSMENT limited.
- Page 179 and 180: HUMAN EXPOSURE ASSESSMENT Media Che
- Page 181 and 182: HUMAN EXPOSURE ASSESSMENT of venipu
- Page 183 and 184: HUMAN EXPOSURE ASSESSMENT Glands at
- Page 185 and 186: HUMAN EXPOSURE ASSESSMENT breast-fe
- Page 187 and 188: HUMAN EXPOSURE ASSESSMENT equipment
- Page 189 and 190: HUMAN EXPOSURE ASSESSMENT only nume
- Page 191 and 192: HUMAN EXPOSURE ASSESSMENT procedure
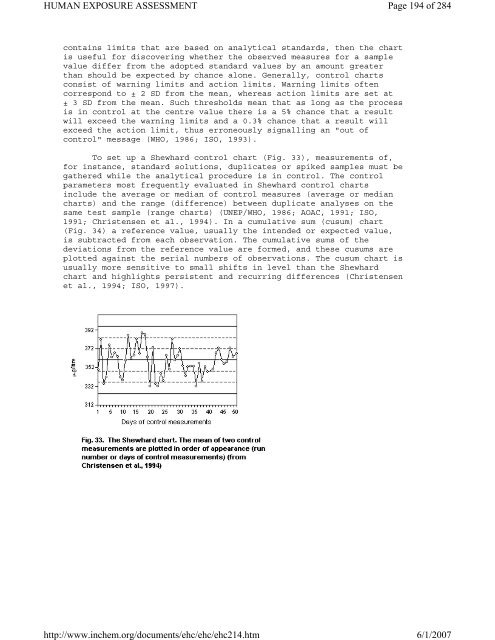
- Page 193: HUMAN EXPOSURE ASSESSMENT clearly p
- Page 197 and 198: HUMAN EXPOSURE ASSESSMENT of statis
- Page 199 and 200: HUMAN EXPOSURE ASSESSMENT as closel
- Page 201 and 202: HUMAN EXPOSURE ASSESSMENT operation
- Page 203 and 204: HUMAN EXPOSURE ASSESSMENT reports o
- Page 205 and 206: HUMAN EXPOSURE ASSESSMENT Indoor Ai
- Page 207 and 208: HUMAN EXPOSURE ASSESSMENT (calcium,
- Page 209 and 210: HUMAN EXPOSURE ASSESSMENT 1984; Akl
- Page 211 and 212: HUMAN EXPOSURE ASSESSMENT chemilumi
- Page 213 and 214: HUMAN EXPOSURE ASSESSMENT carried o
- Page 215 and 216: HUMAN EXPOSURE ASSESSMENT beverages
- Page 217 and 218: HUMAN EXPOSURE ASSESSMENT Total 11
- Page 219 and 220: HUMAN EXPOSURE ASSESSMENT of mean c
- Page 221 and 222: HUMAN EXPOSURE ASSESSMENT 30 µg/dl
- Page 223 and 224: HUMAN EXPOSURE ASSESSMENT The shell
- Page 225 and 226: HUMAN EXPOSURE ASSESSMENT 12.5 Expo
- Page 227 and 228: HUMAN EXPOSURE ASSESSMENT treatment
- Page 229 and 230: HUMAN EXPOSURE ASSESSMENT Aeration
- Page 231 and 232: HUMAN EXPOSURE ASSESSMENT downwind
- Page 233 and 234: HUMAN EXPOSURE ASSESSMENT Governmen
- Page 235 and 236: HUMAN EXPOSURE ASSESSMENT Bercini D
- Page 237 and 238: HUMAN EXPOSURE ASSESSMENT Callahan
- Page 239 and 240: HUMAN EXPOSURE ASSESSMENT Centers f
- Page 241 and 242: HUMAN EXPOSURE ASSESSMENT Report of
- Page 243 and 244: HUMAN EXPOSURE ASSESSMENT Goldstein
- Page 245 and 246:
HUMAN EXPOSURE ASSESSMENT (1996) [E
- Page 247 and 248:
HUMAN EXPOSURE ASSESSMENT Jimenez R
- Page 249 and 250:
HUMAN EXPOSURE ASSESSMENT Seemayer
- Page 251 and 252:
HUMAN EXPOSURE ASSESSMENT carbon mo
- Page 253 and 254:
HUMAN EXPOSURE ASSESSMENT order sta
- Page 255 and 256:
HUMAN EXPOSURE ASSESSMENT Lake, Nor
- Page 257 and 258:
HUMAN EXPOSURE ASSESSMENT effects o
- Page 259 and 260:
HUMAN EXPOSURE ASSESSMENT Saraf A,
- Page 261 and 262:
HUMAN EXPOSURE ASSESSMENT Silbergel
- Page 263 and 264:
HUMAN EXPOSURE ASSESSMENT retrospec
- Page 265 and 266:
HUMAN EXPOSURE ASSESSMENT UN ESCAP
- Page 267 and 268:
HUMAN EXPOSURE ASSESSMENT National
- Page 269 and 270:
HUMAN EXPOSURE ASSESSMENT Wallace L
- Page 271 and 272:
HUMAN EXPOSURE ASSESSMENT WHO (1995
- Page 273 and 274:
HUMAN EXPOSURE ASSESSMENT RÉSUMÉ
- Page 275 and 276:
HUMAN EXPOSURE ASSESSMENT le point
- Page 277 and 278:
HUMAN EXPOSURE ASSESSMENT chercher
- Page 279 and 280:
HUMAN EXPOSURE ASSESSMENT tóxica a
- Page 281 and 282:
HUMAN EXPOSURE ASSESSMENT 6. Modeli
- Page 283 and 284:
HUMAN EXPOSURE ASSESSMENT ambiental