Trends in GlobAl MArine Fisheries - Sea Around Us Project
Trends in GlobAl MArine Fisheries - Sea Around Us Project Trends in GlobAl MArine Fisheries - Sea Around Us Project
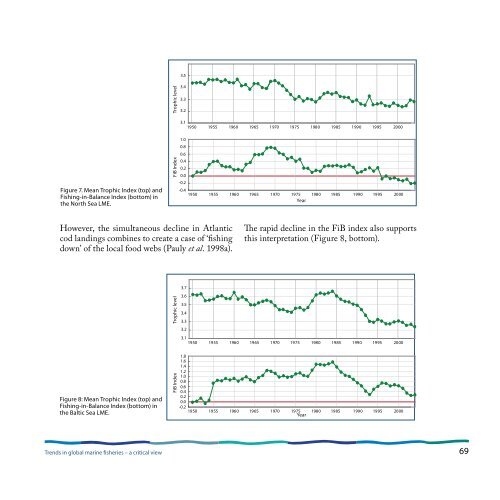
68 Considering the individual LMEs presented as examples, the Mean Trophic Index of the reported landings for the Newfoundland-Labrador Shelf LME remained high until the 1990s, when the cod stock began to collapse (Figure 6, top), a clear case of rapid ‘fishing down’ the food web in the LME (Pauly et al. 1998a). The FiB index Trophic level FiB Index 4.0 3.8 3.6 3.4 3.2 3.0 2.8 2.6 2.0 1.0 0.0 -1.0 -2.0 -3.0 -4.0 1950 1955 1960 1965 1970 1975 1980 1985 1990 1995 2000 1950 1955 1960 1965 1970 1975 Year 1980 1985 1990 1995 2000 The Mean Trophic Index of the reported landings for the North Sea LME has shown a steady decline since 1970 (Figure 7, top), an indication of a steady ‘fishing down’ of the food web in the LME (Pauly et al. 1998a). The FiB index has been on a similar decline over the past three decades (Figure 7, bottom). Both indices thus correspond shows a similar trend (Figure 6, bottom), indicating that the reported landings did not compensate for the decline in the MTI over that period. However, these landings do not account for the discarded bycatch from the shrimp fishery, which now accounts for half of the value of the landings (Sherman and Hempel 2008). Figure 6. Mean trophic level (i.e. Marine Trophic Index) (top) and Fishing-in-Balance Index (bottom) in the Newfoundland-Labrador Shelf LME. with the detailed analysis by Froese and Pauly (2003), which was based on catch data starting in 1903. The Mean Trophic Index of the reported land-ings for the Baltic Sea LME shows a distinct decline from the mid 1980s to 2004 (Figure 8, top), driven by the increased sprat landings. FISH, SUSTAINABILITY AND DEVELOPMENT
Figure 7. Mean Trophic Index (top) and Fishing-in-Balance Index (bottom) in the North Sea LME. Trends in global marine fisheries – a critical view Trophic level FiB Index Trophic level FiB Index 3.5 3.4 3.3 3.2 3.1 1.0 0.8 0.6 0.4 0.2 However, the simultaneous decline in Atlantic cod landings combines to create a case of ‘fishing down’ of the local food webs (Pauly et al. 1998a). Figure 8: Mean Trophic Index (top) and Fishing-in-Balance Index (bottom) in the Baltic Sea LME. 0.0 -0.2 1950 1955 1960 1965 1970 1975 1980 1985 1990 1995 2000 -0.4 1950 1955 1960 1965 1970 1975 Year 1980 1985 1990 1995 2000 3.7 3.6 3.5 3.4 3.3 3.2 3.1 The rapid decline in the FiB index also supports this interpretation (Figure 8, bottom). 1950 1955 1960 1965 1970 1975 1980 1985 1990 1995 2000 1.8 1.6 1.4 1.2 1.0 0.8 0.6 0.4 0.2 0.0 -0.2 1950 1955 1960 1965 1970 1975 1980 1985 1990 1995 2000 Year 69
- Page 1 and 2: Trends in GlobAl MArine Fisheries -
- Page 3 and 4: Then there is the extermination of
- Page 5 and 6: It is our contention that, given a
- Page 7 and 8: and their apparent irreversibility,
- Page 9 and 10: s-1 Area = Σ [Ci + (0.5 ∙ Y )]
- Page 11 and 12: The North Sea LME is relatively sha
- Page 13: ardized to have a value of zero in
- Page 17 and 18: Figure 9. Paired Stock-Catch-Status
- Page 19 and 20: conclusions Indices such as those p
- Page 21 and 22: References Alder, J. and Sumaila, U
- Page 23: Valtysson, H.Þ. and Pauly, D. 2003
Figure 7. Mean Trophic Index (top) and<br />
Fish<strong>in</strong>g-<strong>in</strong>-Balance Index (bottom) <strong>in</strong><br />
the North <strong>Sea</strong> LME.<br />
<strong>Trends</strong> <strong>in</strong> global mar<strong>in</strong>e fisheries – a critical view<br />
Trophic level<br />
FiB Index<br />
Trophic level<br />
FiB Index<br />
3.5<br />
3.4<br />
3.3<br />
3.2<br />
3.1<br />
1.0<br />
0.8<br />
0.6<br />
0.4<br />
0.2<br />
However, the simultaneous decl<strong>in</strong>e <strong>in</strong> Atlantic<br />
cod land<strong>in</strong>gs comb<strong>in</strong>es to create a case of ‘fish<strong>in</strong>g<br />
down’ of the local food webs (Pauly et al. 1998a).<br />
Figure 8: Mean Trophic Index (top) and<br />
Fish<strong>in</strong>g-<strong>in</strong>-Balance Index (bottom) <strong>in</strong><br />
the Baltic <strong>Sea</strong> LME.<br />
0.0<br />
-0.2<br />
1950 1955 1960 1965 1970 1975 1980 1985 1990 1995 2000<br />
-0.4<br />
1950 1955 1960 1965 1970 1975<br />
Year<br />
1980 1985 1990 1995 2000<br />
3.7<br />
3.6<br />
3.5<br />
3.4<br />
3.3<br />
3.2<br />
3.1<br />
The rapid decl<strong>in</strong>e <strong>in</strong> the FiB <strong>in</strong>dex also supports<br />
this <strong>in</strong>terpretation (Figure 8, bottom).<br />
1950 1955 1960 1965 1970 1975 1980 1985 1990 1995 2000<br />
1.8<br />
1.6<br />
1.4<br />
1.2<br />
1.0<br />
0.8<br />
0.6<br />
0.4<br />
0.2<br />
0.0<br />
-0.2<br />
1950 1955 1960 1965 1970 1975 1980 1985 1990 1995 2000<br />
Year<br />
69


