The Diffusion of Ideas over Contested Terrain - Personal World Wide ...
The Diffusion of Ideas over Contested Terrain - Personal World Wide ...
The Diffusion of Ideas over Contested Terrain - Personal World Wide ...

You also want an ePaper? Increase the reach of your titles
YUMPU automatically turns print PDFs into web optimized ePapers that Google loves.
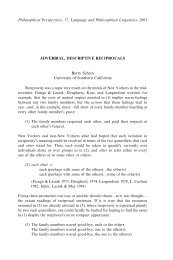
Table 5<br />
#2144-ASQ V49 N4-December 2005—file: 49401-fiss<br />
Negative Binomial Regressions Models Predicting Number <strong>of</strong> Implemented G<strong>over</strong>nance Practices (N = 248)*<br />
Independent variable Model 1 Model 2 Model 3 Model 4 Model 5 Model 6 Model 7 Model 8 Model 9<br />
German bank ownership level .288 • .383 •• .465 ••<br />
—(espousing) (.126) (.144) (.157)<br />
German bank ownership level .049 .214 .209<br />
—(non-espousing) (.148) (.171) (.169)<br />
German firm ownership (espousing) .081 .270 .352 •<br />
(.140) (.201) (.193)<br />
German firm ownership –.235 –.077 –.133<br />
(non-espousing) (.132) (.172) (.179)<br />
German g<strong>over</strong>nment ownership level –.580 –.668 –.664<br />
—(pro-business) (.423) (.417) (.387)<br />
German g<strong>over</strong>nment ownership level –.957 –.827 –.599<br />
—(pro-labor) (.847) (.764) (.723)<br />
Family ownership level .147 .182 .155<br />
—(3rd or later generation) (.110) (.130) (.136)<br />
Family ownership level .197 .268 .281<br />
—(1st and 2nd generation) (.200) (.229) (.201)<br />
CEO economics or law degree .463 •• .560 • 1.013 ••<br />
(.199) (.283) (.365)<br />
CEO age .030 .030 .030<br />
(.020) (.020) (.018)<br />
CEO economics or law degree –.002 –.010 •<br />
—× CEO age (.006) (.006)<br />
Debt/external market capitalization –.308 –.296 –.389 –.080 –.284 –.017 –.416 –.404 –.115<br />
(.327) (.341) (.358) (.243) (.310) (.208) (.284) (.293) (.223)<br />
Foreign sales/total sales .009 • .007 .008 .007 .007 .002 .012 • .012 • .004<br />
(.005) (.005) (.004) (.005) (.005) (.005) (.005) (.005) (.005)<br />
Percentage <strong>of</strong> shares dispersed –.003 –.001 –.006 –.004 –.001 .001 –.004 –.005 –.001<br />
(.006) (.006) (.006) (.005) (.006) (.007) (.006) (.006) (.007)<br />
Ties to prior adopters (one-step) .331 .234 .381 .416 .466 .411 .169 .173 .233<br />
(.219) (.229) (.219) (.230) (.242) (.238) (.247) (.250) (.289)<br />
Ties to prior adopters (two-step) .210 .218 .248 .224 .240 .266 .155 .154 .208<br />
(.207) (.207) (.211) (.208) (.205) (.212) (.190) (.188) (.188)<br />
Network centrality .007 .009 .007 .003 .005 .003 .015 .015 .011<br />
(.010) (.010) (.010) (.010) (.010) (.010) (.011) (.012) (.012)<br />
Other institutional investor .141 .177 .117 .017 .213 .170 .133 .127 .151<br />
—ownership (.185) (.206) (.180) (.169) (.160) (.213) (.160) (.164) (.214)<br />
Union strength .014 .017 .014 .016 .016 .020 .009 .009 .014<br />
(.015) (.013) (.014) (.015) (.015) (.013) (.015) (.016) (.013)<br />
Log <strong>of</strong> market capitalization .199 .200 .181 .166 .172 .146 .162 .167 .106<br />
(.134) (.134) (.138) (.129) (.143) (.138) (.127) (.123) (.125)<br />
Log <strong>of</strong> sales .157 .191 .177 .229 .171 .304 • .160 .163 .361 •<br />
(.152) (.159) (.151) (.144) (.149) (.149) (.140) (.144) (.149)<br />
Return on assets .022 .024 .021 .026 .014 .021 .034 .033 .031<br />
(.028) (.027) (.028) (.029) (.031) (.030) (.027) (.026) (.027)<br />
Total return –.002 –.001 –.001 –.002 –.002 –.001 –.001 –.001 –.000<br />
(.002) (.002) (.002) (.002) (.002) (.002) (.002) (.002) (.001)<br />
Diversification .013 .001 .008 .012 .014 –.001 .006 .004 –.025<br />
(.056) (.057) (.057) (.049) (.054) (.047) (.048) (.050) (.044)<br />
Constant –6.906 ••• –7.432 –6.568 –7.137 –7.008 –8.326 –8.337 –8.377 –9.877<br />
(1.367) (1.316) •• (1.390) •• (1.368) •• (1.356) •• (1.451) •• (2.081) •• (2.058) •• (2.091) ••<br />
Chi-square 319.22 406.55 355.51 267.85 331.38 561.00 360.80 364.31 1013.99<br />
D.f. 27 29 29 29 29 35 29 30 38<br />
• p ≤ .05; •• p ≤ .01; ••• p ≤ .001. Significance tests are one-tailed for directional hypotheses and two-tailed for control<br />
variables.<br />
* Robust standard errors are in parentheses. All models also control for industry and year (dummy variables).<br />
tation. In fact, we do observe a negative, significant coefficient<br />
for first- and second-generation family ownership in the<br />
fully specified model <strong>of</strong> table 4, indicating that the presence<br />
<strong>of</strong> such family owners tends to significantly limit the extent<br />
<strong>of</strong> practice implementation, a finding that is consistent with<br />
our predicted negative stance <strong>of</strong> such owners toward a<br />
shareholder value orientation.<br />
526/ASQ, December 2004