- Page 1 and 2:
HT 390 .C66 C66 1986 v.2 Thomas EBi
- Page 3 and 4:
Copyright® 1987 The Coastal Societ
- Page 5 and 6:
"PROPERTY OF NOAA COASTAL K_CE3 CEN
- Page 7 and 8:
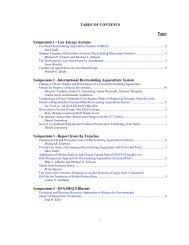
PLENARY SESSIONS TABLE OF CONTENTS
- Page 9 and 10: CHARACTERIZING A SYSTEM Choir. Char
- Page 11 and 12: TRACKING TOXICS Chair Susan Harvey
- Page 13 and 14: The Use ofthe NationalWater DataExc
- Page 15 and 16: The Site Selection Process foraChes
- Page 17 and 18: MANAGING LIVING RESOURCES Resource
- Page 19 and 20: Estuarine and CoastalManagement - T
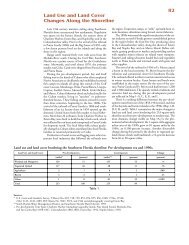
- Page 21 and 22: 398 the particular Interests, envir
- Page 23 and 24: 400 data, a developer may discover
- Page 25 and 26: Estuarine and Coastal Management
- Page 27 and 28: fortune to work with several coasta
- Page 29 and 30: growth economics, local feelings ab
- Page 31 and 32: 410 unprotected coastal barriers wi
- Page 33 and 34: 412 caveats. The greatest concerns
- Page 35 and 36: Estuarine and Coastal Management -
- Page 37 and 38: Model of Resort Evolution R. Initia
- Page 39 and 40: Pensacola Beach Like Fort Myers Bea
- Page 41 and 42: had again contributed to serious en
- Page 43 and 44: Estuarine andCoastal Management -To
- Page 45 and 46: High altitude and oblique aerial ph
- Page 47 and 48: Estuarineand Coastal Management•
- Page 50 and 51: 432 system, the LEO system is start
- Page 52 and 53: 434 b. Hind observations (Figure 5)
- Page 54 and 55: 436 LEO PERCENT OCCURRENCE OF WAVE
- Page 56 and 57: 438 Estuarine and Coastal Managemen
- Page 58 and 59: 440 appropriate variables and param
- Page 62 and 63: Estuarineand Coastal Management Too
- Page 64 and 65: (figures 1 and 2). On a first order
- Page 66 and 67: variables. This resulted in a set o
- Page 69 and 70: Estuarine andCoastal Management •
- Page 71 and 72: help canaands and dictionaries are
- Page 73 and 74: Access to System All requests for a
- Page 75 and 76: 460 Why Is NOAA Unarmed In ftnMfal
- Page 77 and 78: 462 To test this procedure, a simpl
- Page 79 and 80: 464 Cowardln, L.M.. V. Carter, F.C.
- Page 81 and 82: 466 between the participating indiv
- Page 83 and 84: 468 Data Search Assistance Through
- Page 85 and 86: 470 Additional Information For addi
- Page 87 and 88: 472 Estuarine andCoastal Management
- Page 89 and 90: 474 FIGURE 2 OPDIN RESOURCES NMPIS
- Page 91 and 92: 476 means ot access, determination
- Page 93 and 94: 478 NMPPO. 1985b. Inventory of Non-
- Page 95 and 96: 480 Estuarine andCoastal Management
- Page 97 and 98: EDUCATING DECISIONMAKERS William Ei
- Page 99 and 100: prediction of the effects of changi
- Page 101 and 102: Management Oommittee did slightly r
- Page 103 and 104: The causes of the degradation of wa
- Page 105 and 106: quality. For a commission to adopt
- Page 107 and 108: 494 Estuarine and Coastal Managemen
- Page 109 and 110: 496 authorities prior to any land d
- Page 111 and 112:
498 boon based largely on ono piece
- Page 113 and 114:
500 Interstate Agreement on Chesape
- Page 115 and 116:
Estuarine and Coastal Management -T
- Page 117 and 118:
In general, though, these relations
- Page 119 and 120:
meetings. Their recommendations ver
- Page 121 and 122:
etveen any other academic departmen
- Page 123 and 124:
Many of these same demands vere mad
- Page 125 and 126:
Estuarineand Coastal Management- To
- Page 127 and 128:
The private sector The motivation f
- Page 129 and 130:
It's more and more obvious: those w
- Page 131 and 132:
The Center's role is limited to ide
- Page 133 and 134:
Estuarine and Coastal Management -
- Page 135 and 136:
County. The resulting roport, "Cons
- Page 137 and 138:
and shellflshing; to provide open s
- Page 139 and 140:
The COD is innovative as a performa
- Page 141 and 142:
Estuarine andCoastal Management - T
- Page 143 and 144:
provide adequate information for a
- Page 145 and 146:
Aquaculture project The most recent
- Page 147 and 148:
Estuarine andCoastal Management - T
- Page 149 and 150:
CHESAPEAKEBAY VirginiaTippie,Chair
- Page 151 and 152:
542 program with an investment of 2
- Page 153 and 154:
544 Estuarine andCoastal Management
- Page 155 and 156:
Estuarine andCoastalManagement - To
- Page 157 and 158:
methodology being proposed - develo
- Page 159 and 160:
major sections of the 1972 Clean Wa
- Page 161 and 162:
Prioritizing makes best use of the
- Page 163 and 164:
Degradation of the Bay has taken a
- Page 165 and 166:
558 federal agencies, additional tr
- Page 167 and 168:
560 ing system 1t would be helpful
- Page 169 and 170:
Estuarine and Coastal Management -
- Page 171 and 172:
obtained, or shoreline changes-were
- Page 173 and 174:
SAV was sighted as well as water co
- Page 175 and 176:
canadensis and Zannlchelia palustri
- Page 177 and 178:
greatest percent increases occurrin
- Page 179 and 180:
Orth, R.J., K.L. Heck, Jr. and J. v
- Page 181 and 182:
Estuarineand Coastal Management- To
- Page 183 and 184:
Bromley (1978) considered (1) propo
- Page 185 and 186:
2. Rnyulntorv nrogram-i A number of
- Page 187 and 188:
private nuisance is an interference
- Page 189 and 190:
property rule. If Congress passed s
- Page 191 and 192:
nonpoint source water pollution con
- Page 193 and 194:
Estuarineand CoastalManagement - To
- Page 195 and 196:
cannot be granted unless there is u
- Page 197 and 198:
ecomes subject to cancellation. An
- Page 199 and 200:
REFERENCES Morrison, M.D. and M.K.
- Page 201 and 202:
598 other agencies are Involved in
- Page 203 and 204:
600 requirements for dumping of ves
- Page 205 and 206:
602 oatorlal in the future. The oil
- Page 207 and 208:
Estuarineand Coastal Management- To
- Page 209 and 210:
Application of the doctrine of Impl
- Page 211:
oundaries of the dry sand area and
- Page 214 and 215:
Estuarineand Coastal Management- To
- Page 216 and 217:
compilation of existing data. Areas
- Page 218 and 219:
To rank areas based on observed con
- Page 220 and 221:
In spatial coverage of previous stu
- Page 222 and 223:
Estuarineand Coastal Management- To
- Page 224 and 225:
satellites to the reserve system, a
- Page 226 and 227:
types of geomorphological features
- Page 228 and 229:
Manao-gmgnr conaldpratH onn — The
- Page 230 and 231:
productivity. The National Estuarin
- Page 232 and 233:
Estuarine and Coastal Management To
- Page 234 and 235:
equired to validate the sensitivity
- Page 236 and 237:
goal, an uncertainty analysis was c
- Page 238 and 239:
Precision of the sediment quality v
- Page 240 and 241:
Estuarine andCoastal Management -To
- Page 242 and 243:
Independent variable that is assume
- Page 244 and 245:
Possible outcomes of the experiment
- Page 246 and 247:
PREPARING FOR EMERGENCIES James McQ
- Page 248 and 249:
648 The evacuation of more than 500
- Page 250 and 251:
650 terminal; $220,000 for an oil s
- Page 252 and 253:
652 U.S. Highway 98 damage estimate
- Page 254 and 255:
654 Spangenbcrg, T. 1986. Personal
- Page 256 and 257:
LOUISIANA'S BATTLEWITH THE SEA; ITS
- Page 258 and 259:
Estuarineand Coastal Management- To
- Page 260 and 261:
Qco ISLES DERltt^ km & Figure 2. Hi
- Page 262 and 263:
Objectives The first objective of t
- Page 264 and 265:
STATION NUMBER STATION NAME TABLE 1
- Page 266 and 267:
The St. Petersburg tide gauge stati
- Page 268 and 269:
STATION NUMBER STATION NAME TABLE 2
- Page 270 and 271:
elative sea level rise is 0.33 cm/y
- Page 272 and 273:
References Byrne, P., Borengasser,
- Page 274 and 275:
Estuarineand Coastal Management- To
- Page 276 and 277:
these times that the increase in vu
- Page 278 and 279:
econstruction projects. Conclusion
- Page 280 and 281:
RESOLVING CONFLICTS/ASSESSING RISKS
- Page 282 and 283:
686 lightering is estimated at $69
- Page 284 and 285:
BEACH EVOLUTION AFTER CAUSEWAY CONS
- Page 286 and 287:
690 and overriding the facility. Ic
- Page 288 and 289:
Estuarine andCoastal Management - T
- Page 290 and 291:
Inextricably wound up with religion
- Page 292 and 293:
ethics is that advocated by Leopold
- Page 294 and 295:
laboratory animals, lower animals a
- Page 296 and 297:
Estuarine andCoastal Management-Too
- Page 298 and 299:
Estuarine and Coastal Management To
- Page 300 and 301:
708 these projects. Our criteria fo
- Page 302 and 303:
710 S. alternlflora established on
- Page 304 and 305:
712 Additional compensation by ropl
- Page 306 and 307:
714 to the question of placement (l
- Page 308 and 309:
716 criteria adequate to achieve th
- Page 310 and 311:
718 Nixon, S. W. 1980. Between coas
- Page 312 and 313:
720 of them because of this distanc
- Page 314:
722 Light penetration Is probably o
- Page 317 and 318:
Estuarine and CoastalManagement-Too
- Page 319 and 320:
management emphasis Is now affectin
- Page 321 and 322:
Estuarine andCoastal Management - T
- Page 323 and 324:
734 assemblages; Juvenile fish and
- Page 325 and 326:
-J 736 The heavy material falls out
- Page 327 and 328:
738 Future Harsh Creation. We are n
- Page 329 and 330:
740 Estuarine and Coastal Managemen
- Page 331 and 332:
Estuarine andCoastal Management -To
- Page 333 and 334:
This site also satisfied several ot
- Page 335 and 336:
successful implementation of such a
- Page 337 and 338:
750 I.C.R.R Fig. I
- Page 339 and 340:
752 More lumber companieslaunched o
- Page 341 and 342:
754 the track. When ties nasoed rep
- Page 343 and 344:
756 Schlleder spared no expense, no
- Page 345 and 346:
758 Stover, j. F. 1955. The Railroa
- Page 347 and 348:
Estuarine and Coastal Management -
- Page 349 and 350:
Estuarineand Coastal Management•
- Page 351 and 352:
contain detailed Information about
- Page 353 and 354:
production Is uncertain. Thus, the
- Page 355 and 356:
Estuarine and Coastal Management To
- Page 357 and 358:
MANAGING LIVING RESOURCES
- Page 359 and 360:
776 seagrasses and associated biota
- Page 361 and 362:
778 FLORIDA BIG BEND SEAGRASS HABIT
- Page 363 and 364:
780 Barle, S. A. 1972. Benthic alga
- Page 365 and 366:
Estuarine andCoastal Management-Too
- Page 367 and 368:
The Florida alligator nuisance prog
- Page 369 and 370:
In Louisiana, a computer simulation
- Page 371 and 372:
Florida Game and Fresh Water Fish C
- Page 373 and 374:
Estuarine and CoastalManagement - T
- Page 375 and 376:
794 Mississippi Born * Island Petit
- Page 377 and 378:
796" important means of preserving
- Page 379:
f 798 man-modified environments. Th