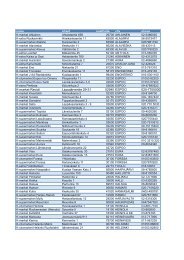
Kesko's Annual Report 2009
Kesko's Annual Report 2009
Kesko's Annual Report 2009

Create successful ePaper yourself
Turn your PDF publications into a flip-book with our unique Google optimized e-Paper software.
Consolidated statement of cash flows, IFRS<br />
Kesko financial statements <strong>2009</strong><br />
€ million Note <strong>2009</strong> 2008<br />
Cash flows from operating activities<br />
Profit before tax<br />
Adjustments:<br />
216.6 330.8<br />
Depreciation according to plan 116.9 118.1<br />
Financial income and expenses 16.0 -1.1<br />
Other adjustments 37 -74.0 -130.1<br />
Change in working capital<br />
58.9 -13.2<br />
Current non-interest-bearing receivables, increase (-) / decrease (+) 39.4 -10.3<br />
Inventories increase (-) / decrease (+) 206.6 2.3<br />
Current non-interest-bearing liabilities, increase (+) / decrease (-) -83.9 -78.4<br />
162.2 -86.4<br />
Interest paid and other financial expenses -37.5 -32.6<br />
Interest received 23.0 31.6<br />
Dividends received 0.1 0.1<br />
Income tax paid -44.5 -99.0<br />
Net cash generated from operating activities 378.8 131.4<br />
Cash flows from investing activities<br />
Acquisition of subsidiary, net of cash acquired -16.4 -35.0<br />
Acquisition of associate -0.2 0.0<br />
Purchases of tangible and intangible assets -205.2 -284.7<br />
Purchases of available-for-sale financial assets -0.8 -0.3<br />
Disposal of subsidiary, net of cash disposed of 4, 38 52.3 121.3<br />
Disposal of associate 0.1 1.5<br />
Proceeds from sale of available-for-sale financial assets 39 1.2 0.2<br />
Proceeds from sale of tangible and intangible assets 198.3 158.4<br />
Increase in non-current loan receivables 0.0 -7.3<br />
Decrease in non-current loan receivables 1.6 0.0<br />
Net cash used in investing activities 31.0 -45.8<br />
Cash flows from financing activities<br />
Increase (+) / decrease (-) in interest-bearing liabilities -33.1 -47.1<br />
Repayments of finance lease liabilities 0.2 -5.6<br />
Increase (+) / decrease (-) in current interest-bearing receivables -13.7 216.5<br />
Dividends paid -98.4 -172.5<br />
Proceeds from issuance of shares 4.6 0.4<br />
Increase (-) / decrease (+) in short-term money market investments -97.6 -17.3<br />
Other items 3.6 11.3<br />
Net cash used in financing activities -234.4 -14.3<br />
Change in cash and cash equivalents and current available-for-sale<br />
financial assets<br />
Cash and cash equivalents and current available-for-sale financial<br />
175.4 71.4<br />
assets at 1 Jan. 40 319.3 245.3<br />
Currency translation difference adjustment and value adjustment -3.2 -0.7<br />
Cash and cash equivalents related to available-for-sale assets<br />
Cash and cash equivalents and current available-for-sale financial<br />
0.0 -1.8<br />
assets at 31 Dec. 40 491.4 319.3<br />
87