Kesko's Annual Report 2009
Kesko's Annual Report 2009
Kesko's Annual Report 2009

Create successful ePaper yourself
Turn your PDF publications into a flip-book with our unique Google optimized e-Paper software.
Net sales by segment,<br />
continuing operations<br />
(€ million) 1–12/<strong>2009</strong> 1–12/2008 Change, %<br />
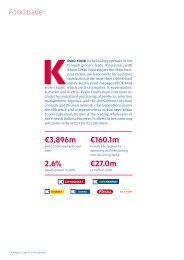
Food trade, Finland 3,790 3,696 2.6<br />
Food trade, other countries* 7 11 -33.1<br />
Food trade total<br />
Home and speciality goods trade,<br />
3,798 3,707 2.4<br />
Finland<br />
Home and speciality goods trade,<br />
1,530 1,560 -1.9<br />
other countries*<br />
Home and speciality goods<br />
28 46 -39.6<br />
trade total<br />
Building and home improvement<br />
1,558 1,606 -3.0<br />
trade, Finland<br />
Building and home improvement<br />
1,041 1,319 -21.1<br />
trade, other countries*<br />
Building and home improvement<br />
1,271 1,659 -23.4<br />
trade total 2,312 2,978 -22.4<br />
Car and machinery trade, Finland<br />
Car and machinery trade,<br />
773 1,137 -32.0<br />
other countries* 175 343 -49.1<br />
Car and machinery trade total<br />
Common operations and<br />
947 1,480 -36.0<br />
eliminations -168 -178 -5.7<br />
Finland total 6,966 7,533 -7.5<br />
Other countries total* 1,481 2,059 -28.1<br />
Group total 8,447 9,591 -11.9<br />
* exports and net sales in countries other than Finland.<br />
Kesko financial statements <strong>2009</strong><br />
81<br />
Operating profit by<br />
segment, continuing<br />
operations (€ million) 1–12/<strong>2009</strong> 1–12/2008 Change<br />
Food trade1 170.6 185.5 -14.9<br />
Home and speciality goods trade2 Building and home improvement<br />
66.5 63.6 3.0<br />
trade3 19.6 19.4 0.2<br />
Car and machinery trade<br />
Common operations and<br />
-5.1 30.5 -35.6<br />
eliminations -19.3 -13.3 -6.0<br />
Total 232.3 285.6 -53.3<br />
Segments’ operating profits excl.<br />
non-ecurring items,<br />
continuing operations<br />
(€ million) 1–12/<strong>2009</strong> 1–12/2008 Change<br />
Food trade 133.1 122.5 10.5<br />
Home and speciality goods trade<br />
Building and home improvement<br />
29.5 31.2 -1.7<br />
trade 11.9 56.4 -44.4<br />
Car and machinery trade<br />
Common operations and<br />
0.3 30.4 -30.1<br />
eliminations -19.4 -23.6 4.1<br />
Total 155.4 217.0 -61.6<br />
1) Includes €46.4 million in non-recurring gains on real estate disposals.<br />
The operating profit of the comparative year included €68.5 million in<br />
non-recurring gains on real estate disposals and lease arrangements.<br />
2) Includes €37.0 million (€32.4 million) in non-recurring gains on real<br />
estate disposals and impairments.<br />
3) Includes a €7.7 million non-recurring gain on real estate disposal. The<br />
comparative period included a €47.0 million non-recurring impairment<br />
charge on Byggmakker Norge's intangible assets, and a €5.4 million<br />
non-recurring gain on real estate disposal.