Kesko's Annual Report 2009
Kesko's Annual Report 2009
Kesko's Annual Report 2009

Create successful ePaper yourself
Turn your PDF publications into a flip-book with our unique Google optimized e-Paper software.
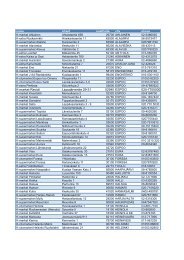
Real estate operations<br />
indicators for <strong>2009</strong><br />
Kesko’s year <strong>2009</strong><br />
Owned properties<br />
Capital*, € million <strong>2009</strong> 2008<br />
Finland 656 776<br />
Other Nordic countries 70 57<br />
Baltic countries 32 41<br />
Russia 112 77<br />
Total 870 951<br />
Area, m 2 <strong>2009</strong> 2008<br />
Finland 629,000 756,000<br />
Other Nordic countries 80,000 62,000<br />
Baltic countries 103,000 103,000<br />
Russia 46,000 34,000<br />
Total 858,000 955,000<br />
Leased properties<br />
Lease liabilities, € million <strong>2009</strong> 2008<br />
Finland 2,036 1,767<br />
Other Nordic countries 118 110<br />
Baltic countries 171 183<br />
Russia 32 45<br />
Total 2,357 2,105<br />
Area, m 2 <strong>2009</strong> 2008<br />
Finland 2,358,000 2,191,000<br />
Other Nordic countries 202,000 205,000<br />
Baltic countries 429,000 431,000<br />
Russia 25,000 25,000<br />
Total 3,014,000 2,852,000<br />
*Carrying amounts<br />
Breakdown of owned properties <strong>2009</strong><br />
Strategic properties 77%<br />
Standard properties 17%<br />
Realisation properties 0%<br />
Development properties 6%<br />
Breakdown of owned properties 2008<br />
Strategic properties 79%<br />
Standard properties 15%<br />
Realisation properties 0%<br />
Development properties 6%<br />
41