Kesko's Annual Report 2009
Kesko's Annual Report 2009
Kesko's Annual Report 2009

Create successful ePaper yourself
Turn your PDF publications into a flip-book with our unique Google optimized e-Paper software.
152 Kesko financial statements <strong>2009</strong><br />
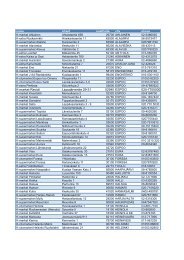
10 largest shareholders by number of votes at 31.12.<strong>2009</strong><br />
Number of shares % of shares Number of votes % of votes<br />
1 Kesko Pension Fund 4,438,885 4.51 35,388,850 9.22<br />
2 K-Retailers' Association 3,400,724 3.46 33,639,590 8.76<br />
3 Vähittäiskaupan Takaus Oy 2,991,771 3.04 26,648,568 6.94<br />
4 Valluga-sijoitus Oy 1,340,439 1.36 13,404,390 3.49<br />
5 Foundation for Vocational Training in the Retail Trade 936,085 0.95 7,989,898 2.08<br />
6 Ilmarinen Mutual Pension Insurance Company 1,938,980 1.97 3,916,838 1.02<br />
7 Ruokacity Myyrmäki Oy 389,541 0.40 3,895,410 1.01<br />
8 K-Food Retailers' Club 351,822 0.36 3,518,220 0.92<br />
9 Heimo Välinen Oy 313,707 0.32 2,961,570 0.77<br />
10 Svenska litteratursällskapet i Finland r.f. 350,000 0.36 2,150,000 0.56<br />
10 largest, total 16,451,954 16.73 133,513,334 34.77<br />
Distribution of share ownership at 31.12.<strong>2009</strong><br />
All shares<br />
Number of shares<br />
Number of<br />
shareholders % of shareholders Shares total % of shares<br />
1–100 11,057 28.43 649,923 0.66<br />
101–500 14,363 36.93 3,994,056 4.06<br />
501–1 000 5,689 14.63 4,466,636 4.54<br />
1 001–5 000 5,992 15.41 13,313,691 13.54<br />
5 001–10 000 955 2.46 6,812,170 6.93<br />
10 001–50 000 688 1.77 14,227,131 14.47<br />
50 001–100 000 80 0.21 5,661,411 5.76<br />
100 001–500 000 49 0.13 9,906,666 10.08<br />
500 001– 15 0.04 39,289,845 39.96<br />
Total 38,888 100.00 98,321,529 100.00<br />
A shares<br />
Number of shares<br />
Number of<br />
shareholders<br />
% of holders of A<br />
shares A shares total % of A shares<br />
1–100 1,707 26.41 86,919 0.27<br />
101–500 1,378 21.32 365,747 1.15<br />
501–1 000 977 15.11 841,461 2.65<br />
1 001–5 000 1,610 24.91 3,973,792 12.52<br />
5 001–10 000 405 6.27 2,856,168 9.00<br />
10 001–50 000 334 5.17 7,030,846 22.15<br />
50 001–100 000 35 0.54 2,471,378 7.79<br />
100 001–500 000 13 0.20 2,559,208 8.06<br />
500 001– 5 0.08 11,551,488 36.40<br />
Total 6,464 100.00 31,737,007 100.00<br />
B shares<br />
Number of shares<br />
Number of<br />
shareholders<br />
% of holders of B<br />
shares B shares total % of B shares<br />
1–100 10,270 29.49 612,459 0.92<br />
101–500 13,819 39.68 3,846,514 5.78<br />
501–1 000 5,000 14.36 3,864,363 5.80<br />
1 001–5 000 4,719 13.55 10,123,854 15.20<br />
5 001–10 000 554 1.59 4,032,498 6.06<br />
10 001–50 000 379 1.09 7,589,624 11.40<br />
50 001–100 000 38 0.11 2,683,974 4.03<br />
100 001–500 000 32 0.09 6,925,951 10.40<br />
500 001– 11 0.03 26,905,285 40.41<br />
Total 34,822 100.00 66,584,522 100.00<br />
* General government includes municipalities, the provincial administration of Åland, employment pension institutions and social security funds.<br />
** Non-profit institutions include foundations awarding scholarships, organisations safeguarding certain interests, charitable associations.