Kesko's Annual Report 2009
Kesko's Annual Report 2009
Kesko's Annual Report 2009

You also want an ePaper? Increase the reach of your titles
YUMPU automatically turns print PDFs into web optimized ePapers that Google loves.
Kesko’s year
Kesko’s year <strong>2009</strong><br />
2 Kesko in brief<br />
3 Vision and values<br />
4 Review by the President and CEO<br />
6 Year <strong>2009</strong> in brief<br />
8 Strategic objectives<br />
12 K-Plussa<br />
14 Food trade<br />
20 Home and speciality goods trade<br />
26 Building and home improvement<br />
trade<br />
34 Car and machinery trade<br />
40 Real estate operations<br />
42 Human resources<br />
47 K-retailer career<br />
48 Corporate responsibility<br />
54 Kesko’s Corporate Governance<br />
66 Board of Directors<br />
68 Corporate Management Board<br />
Financial statements<br />
70 Contents<br />
71 <strong>Report</strong> by the Board of Directors<br />
78 Group performance indicators<br />
86 Consolidated financial statements<br />
(IFRS)<br />
89 Notes to the consolidated financial<br />
statements (IFRS)<br />
137 Parent’s financial statements (FAS)<br />
146 Shares and shareholders<br />
154 Information for shareholders<br />
155 Information about Kesko for<br />
investors<br />
156 Contact information<br />
158 Glossary<br />
Contents<br />
Kesko’s year <strong>2009</strong><br />
1
2 Kesko’s year <strong>2009</strong><br />
Kesko<br />
in brief<br />
Kesko is the leading provider of trading<br />
sector services and a highly valued listed<br />
company. Through its stores, Kesko offers<br />
quality to the daily lives of consumers.<br />
Kesko has about 2,000 stores engaged<br />
in chain operations in the Nordic and<br />
Baltic countries, Russia, and Belarus.<br />
Our core competence areas<br />
• Development and management of<br />
store concepts and brands<br />
• Development, ownership and<br />
management of the store site<br />
network<br />
• International retail expertise<br />
• Combining retailer<br />
entrepreneurship and chain<br />
operations efficiently<br />
• Leveraging centralised resources<br />
and economies of scale<br />
Divions<br />
Kesko Food | Page 14<br />
Kesko Food is a strong operator in the<br />
Finnish grocery trade. K-retailers, whose<br />
operations are based on the K-retailer<br />
business model, are responsible for customer<br />
satisfaction at the more than 1,000<br />
K-food stores.<br />
Kesko Food manages K-citymarket’s<br />
food trade and the K-supermarket,<br />
K-market and K-extra chains. Kesko<br />
Food’s main functions include the centralised<br />
purchasing of products, selection<br />
management, logistics, and the development<br />
of chain concepts and the store site<br />
network. Chain operations ensure the<br />
efficiency and competitiveness of business.<br />
Kesko Food’s subsidiary Kespro Ltd is<br />
the leading wholesaler in the Finnish<br />
HoReCa business. It offers the best sourcing<br />
solutions in the sector for its customers.<br />
Home and speciality goods trade |<br />
Page 20<br />
Kesko’s home and speciality goods trade<br />
operates in the clothing, home, leisure,<br />
home technology, entertainment and furniture<br />
product lines. The home and speciality<br />
goods trade comprises Anttila Oy,<br />
K-citymarket Oy, Intersport Finland Ltd,<br />
Indoor Group Ltd, Musta Pörssi Ltd and<br />
Kenkäkesko Ltd. The total number of<br />
home and specility goods stores is 450.<br />
Building and home improvement<br />
trade | Page 26<br />
Rautakesko operates in the building and<br />
home improvement supplies trade in<br />
Finland, Sweden, Norway, the Baltic<br />
countries, Russia, and Belarus and the<br />
agricultural supplies trade in Finland.<br />
Rautakesko manages and develops its<br />
K-rauta, Rautia, K-maatalous, Byggmakker,<br />
Senukai and OMA retail chains<br />
and B2B sales in its operating area.<br />
Rautakesko is responsible for the chains’<br />
concepts, marketing, sourcing and logistics<br />
services, store network, and retailer<br />
resources. There are 330 building and<br />
home improvement stores in eight<br />
countries and 90 agricultural stores<br />
in Finland.<br />
Car and machinery trade | Page 34<br />
VV-Auto and Konekesko make up the car<br />
and machinery trade division.<br />
VV-Auto imports and markets Volkswagen,<br />
Audi and Seat passenger cars, and<br />
Volkswagen commercial vehicles in<br />
Finland, and it also imports and markets<br />
Seat passenger cars in Estonia and Latvia.<br />
VV-Auto is also engaged in car retailing<br />
and provides after-sales services at its<br />
own outlets in the Greater Helsinki area<br />
and Turku.<br />
Konekesko is a service company specialising<br />
in the import and sales of construction,<br />
environmental and agricultural<br />
machinery, trucks and buses, and recreational<br />
machinery. Konekesko operates in<br />
Finland, the Baltic countries and Russia.<br />
Konekesko arranges the manufacture of<br />
and sells Yamarin boats in Finland and<br />
exports them to several European countries<br />
and Russia.
Vision<br />
Kesko’s year <strong>2009</strong><br />
Kesko is the leading provider of trading sector services and a highly valued listed company.<br />
Values<br />
The values guide our operations:<br />
We exceed our<br />
customers’<br />
expectations<br />
We recognise our<br />
customers’ needs and<br />
expectations. We strive<br />
to offer them positive<br />
experiences through<br />
the continual reform of<br />
our operations and<br />
emphasis on<br />
entrepreneurial activity.<br />
We are the best<br />
operator in the<br />
trading sector<br />
We offer our customers<br />
the best products and<br />
services in the market<br />
to ensure our<br />
competitiveness and<br />
success.<br />
We create a good<br />
working<br />
community<br />
We operate in an open,<br />
interactive working<br />
community where<br />
people are respected<br />
and every individual<br />
can contribute to the<br />
full and use his or her<br />
initiative.<br />
We bear our<br />
corporate<br />
responsibility<br />
Our operations are<br />
responsible and we<br />
follow ethically<br />
acceptable principles in<br />
all actions within our<br />
working community<br />
and in relations with<br />
our partners.<br />
3
4 Kesko’s year <strong>2009</strong><br />
Review by<br />
the President<br />
and CEO<br />
A year for adjustment<br />
In all of Kesko’s business divisions and<br />
operating countries, the recession had a<br />
major impact on the operating environment<br />
of the trading sector and on the<br />
willingness of customers to consume.<br />
In <strong>2009</strong>, we cut costs and adapted our<br />
business according to the prevailing market<br />
situation. We also had to decrease the<br />
number of employees, particularly in the<br />
building and home improvement and in<br />
the car and machinery trade.<br />
Positive performance in all<br />
divisions<br />
The grocery sales of K-food stores<br />
increased by 5.6% and clearly exceeded<br />
market growth. The popularity of Pirkka<br />
products continued. The full reduction in<br />
the value added tax on retail sales of<br />
food, which took effect in autumn <strong>2009</strong>,<br />
was implemented in the prices of K-food<br />
stores. Kesko Food’s return on capital was<br />
the best of all times.<br />
In the home and speciality goods<br />
trade, sales development during the latter<br />
part of the year clearly improved from the<br />
previous year. The sales and profitability<br />
of K-citymarket and Intersport improved<br />
throughout the year. Anttila, too, had<br />
brisk Christmas sales that exceeded<br />
expectations.<br />
The halt in construction caused by the<br />
recession made <strong>2009</strong> a difficult year for<br />
the building and home improvement<br />
trade in all the operating countries and<br />
particularly in business-to-business<br />
trade. The building and home improvement<br />
segment managed to reduce costs<br />
and stocks and keep trade receivables<br />
under control. This contributed to a clear<br />
profit despite the recession.<br />
In the car and machinery trade, sales<br />
and profits decreased as demand<br />
declined. The market share of Audi,<br />
Volkswagen and Seat, the brands<br />
imported by VV-Auto, increased during<br />
the year and the number of new orders<br />
grew clearly towards the end of the year.<br />
Aiming at profitable growth<br />
Kesko’s solvency, cash flow and liquidity<br />
are at an excellent level. A strong balance<br />
sheet and good financial standing provide<br />
Kesko with opportunities for making<br />
investments during recession, too.<br />
When making investment decisions,<br />
we take the market situation and customer<br />
demand of the particular country<br />
into consideration. We will continue to<br />
actively develop the store network.<br />
We will continue to investigate opportunities<br />
for expanding the food trade<br />
into international markets, particularly<br />
in Russia.<br />
K-Plussa provides customers with<br />
diversified benefits<br />
The K-Plussa customer loyalty programme<br />
provides total services for every K-retailer,<br />
store and chain of the K-Group to better<br />
cater for their customers and increase<br />
customer satisfaction.<br />
More than 3.6 million Finns now have<br />
a K-Plussa customer loyalty card. The<br />
K-Plussa customer loyalty programme<br />
achieved the landmark of two million<br />
households in <strong>2009</strong> after more than<br />
100,000 new households had joined. The<br />
K-Plussa network comprises over 3,500<br />
outlets throughout Finland.
By concentrating their purchases,<br />
K-Plussa customers get diversified benefits.<br />
We utilise customer information<br />
obtained with the card when planning<br />
store-specific selections, targeting our<br />
marketing, and planning the store network.<br />
We want to be the most<br />
attractive workplace in the<br />
trading sector<br />
Kesko and its chains’ K-retailer entrepreneurs<br />
employ some 45,000 professionals<br />
and experts in trade. The wellbeing, competence<br />
and improvements in labour productivity<br />
of our employees are important<br />
to us. We will continue long-term projects<br />
in different companies for promoting<br />
wellbeing at work. We will improve labour<br />
productivity primarily by enhancing the<br />
efficiency of operating practices.<br />
The Master Sales Assistant Training,<br />
organised by our own training centre, the<br />
K-instituutti, is one of the largest annual<br />
vocational training events for adults in<br />
Finland. The Master Sales Assistant Training<br />
was attended by more than 17,000<br />
students in <strong>2009</strong>.<br />
We continue our sustainability<br />
work and are committed to<br />
energy savings<br />
Kesko has established a top ranking in<br />
comparisons measuring the sustainability<br />
of international listed companies.<br />
Kesko is included in the Dow Jones<br />
sustainability indexes, DJSI World and DJSI<br />
STOXX, and also in the FTSE4Good indexes,<br />
for example. We also continue on the ‘The<br />
Global 100 Most Sustainable Corporations’<br />
list published by the World Economic<br />
Forum.<br />
We are proud for the appreciation<br />
shown by international independent sustainability<br />
experts and different assessment<br />
institutes towards our work.<br />
This work will continue: we have<br />
drawn up a comprehensive responsibility<br />
programme for 2008–2012. The programme<br />
sets concrete targets, for<br />
instance, for combating climate change,<br />
wastage reduction, transportation,<br />
responsible purchasing and employee<br />
wellbeing.<br />
As part of the implementation of the<br />
responsibility programme we have signed<br />
the trading sector energy efficiency agreement<br />
and committed to saving more than<br />
65 GWh by the end of 2016.<br />
Thanks to employees,<br />
shareholders, K-retailers and<br />
all business partners<br />
I wish to extend my warmest thanks to all<br />
Kesko employees for their diligence and<br />
for a job well done. I would also like to<br />
thank all shareholders, K-retailers and<br />
their staff, and all our business partners<br />
for good cooperation during <strong>2009</strong>.<br />
Matti Halmesmäki<br />
President and CEO<br />
Kesko’s year <strong>2009</strong><br />
A 12-year-old genetically Finnish red<br />
oak was planted in Katajanokka Park,<br />
next to Kesko’s main office building, at<br />
the Fiskars Orange Thumb charity event<br />
in October <strong>2009</strong>. Kesko’s President and<br />
CEO Matti Halmesmäki, Helsinki Mayor<br />
Jussi Pajunen, and Fiskars Group President<br />
and CEO Kari Kauniskangas, the<br />
host of the event, all did their part with<br />
spades.<br />
5
6 Kesko’s year <strong>2009</strong><br />
Year <strong>2009</strong><br />
in brief<br />
• The Kesko Group’s net sales from<br />
continuing operations totalled<br />
€8,447 million (€9,591 million)<br />
• Operating profit excluding nonrecurring<br />
items was €155.4 million<br />
(€217.0 million)<br />
• Profit before tax was €216.6<br />
million (€288.5 million)<br />
• The Kesko Group’s earnings per<br />
share were €1.27 (€2.24)<br />
• Earnings per share excluding nonrecurring<br />
items were €0.71 (€1.44)<br />
• The Board of Directors proposes to<br />
the <strong>Annual</strong> General Meeting that<br />
€0.90 per share be distributed as<br />
dividends for <strong>2009</strong><br />
Net sales and profit<br />
The deterioration in the general economic<br />
situation in <strong>2009</strong> affected sales particularly<br />
in Kesko’s car and machinery trade<br />
and in the building and home improvement<br />
trade. Sales growth remained stable<br />
in the food trade.<br />
Net sales decreased by 11.9% from the<br />
previous year. In Finland, net sales<br />
dropped by 7.5% and in other countries<br />
by 28.1%.<br />
The K-Group’s sales (incl. VAT) to retail<br />
and B2B customers were €12,614 million,<br />
representing a decrease of 9.1% from the<br />
previous year.<br />
Net sales in the food segment<br />
increased by 2.4% and the grocery sales<br />
of K-food stores increased by 5.6% (VAT<br />
0%) from the previous year. The sales<br />
growth of Pirkka products was particularly<br />
good. The K-citymarket’s sales also performed<br />
well and showed an increase of<br />
14.3% in food sales.<br />
Net sales in the home and speciality<br />
goods segment decreased by 3.0%. Sales<br />
of home electronics and interior decoration<br />
items suffered from the weaker economic<br />
situation and growing unemployment.<br />
Towards the end of the year, however,<br />
sales started to pick up. Sales of<br />
clothing and sports items increased in<br />
particular and Christmas sales were very<br />
successful.<br />
In the building and home improvement<br />
segment, net sales dropped by<br />
22.4%. In Finland, the decline in net<br />
sales can be mainly attributed to the drop<br />
in B2B sales. In other countries, the<br />
decrease in net sales resulted from lower<br />
demand and the weakening of the Swedish<br />
krona, the Norwegian krone, and the<br />
Russian rouble. The construction market<br />
declined substantially in the Nordic and<br />
Baltic countries, and in Russia.<br />
In the car and machinery trade, the<br />
market remained difficult and net sales<br />
decreased by 36.0%. The demand for cars<br />
dropped, but Audi, Volkswagen and Seat<br />
succeeded in increasing their market<br />
share to 18.5% (17.1%). The number of<br />
orders grew towards the end of the year.<br />
Konekesko’s net sales dropped due to the<br />
weakened machinery market and the discontinuation<br />
of the Baltic grain and agricultural<br />
supplies trade.<br />
Operating profit well short of<br />
the previous year<br />
Operating profit excluding non-recurring<br />
items amounted to €155.4 million<br />
(€217.0 million). Non-recurring items<br />
totalled €77 million and they include a<br />
€93 million gain on the sale of properties.<br />
Non-recurring expenses include a €14.4<br />
million impairment charge on properties.<br />
The decrease in the operating profit<br />
excluding non-recurring items compared<br />
with the previous year can be attributed<br />
to weakened demand in the building and<br />
home improvement trade in particular<br />
and in the car and machinery trade.<br />
Kesko is transferring statutory<br />
employee pension insurance to<br />
Ilmarinen<br />
Kesko has decided to transfer management<br />
of the statutory pension provision<br />
and the insurance portfolio to Ilmarinen<br />
Mutual Pension Insurance Company in<br />
two phases, starting 1 June 2010. The<br />
Kesko Pension Fund’s statutory employee<br />
pension insurance (department B) covers<br />
about 8,700 people, and the first phase<br />
of the transfer will concern some 3,600<br />
people. The transfer is estimated to have<br />
a positive effect on Kesko’s cash flow. The<br />
transfer is subject to the approval of the<br />
Financial Supervisory Authority and the<br />
Finnish Competition Authority. The second<br />
phase will be implemented at the beginning<br />
of 2012 at the earliest.<br />
Number of shareholders<br />
increased<br />
The number of shareholders totalled<br />
38,888 at the end of <strong>2009</strong>, an increase<br />
of 808 from the beginning of the year.<br />
Foreign shareholders owned 30% of<br />
the B shares at the end of <strong>2009</strong>.
Performance indicators for <strong>2009</strong><br />
Kesko’s year <strong>2009</strong><br />
Key figures <strong>2009</strong> 2008 Changes<br />
Net sales* € million 8,447 9,591 -11.9%<br />
Operating profit* € million 232 286 -18.7%<br />
Operating profit excl. non-recurring items* € million 155 217 -28.4%<br />
Profit before tax* € million 217 289 -24.9%<br />
Return on capital employed % 11.0 15.2 -4.2 pp<br />
Return on equity % 6.6 12.1 -5.5 pp<br />
Cash flow from operating activities € million 379 131 (..)<br />
Investments* € million 198 338 -41.5%<br />
Equity ratio % 54.1 52.4 1.8 pp<br />
Gearing % -12.5 2.3 -14.8 pp<br />
Dividend per share € 0.90** 1.00 -10.0%<br />
Earnings per share, diluted € 1.27 2.24 -43.1%<br />
Equity per share, adjusted € 20.39 20.09 1.5%<br />
Personnel, average* 19,184 21,327 -10.0%<br />
*continuing operations **proposal to the AGM (..) change over 100%<br />
Net sales by division* Operating profit excl. non-recurring items by division*<br />
Group’s net sales*<br />
€ million<br />
Finland<br />
Other countries<br />
Food trade<br />
Home and speciality goods trade<br />
Building and<br />
home improvement trade<br />
Car and machinery trade<br />
Group’s operating profit*<br />
excl. non-recurring items, € million<br />
Food trade<br />
Home and speciality goods trade<br />
Building and<br />
home improvement trade<br />
Car and machinery trade<br />
Earnings/share and dividend/share,<br />
€<br />
10,000<br />
350<br />
4.0<br />
9,000<br />
8,000<br />
7,000<br />
300<br />
250<br />
3.5<br />
3.0<br />
6,000<br />
200<br />
2.5<br />
5,000<br />
2.0<br />
4,000<br />
150<br />
1.5<br />
3,000<br />
2,000<br />
1,000<br />
100<br />
50<br />
1.0<br />
0.5<br />
**<br />
0<br />
0<br />
0<br />
2005 2006 2007 2008 <strong>2009</strong> 2005 2006 2007 2008 <strong>2009</strong> 2005 2006 2007 2008 <strong>2009</strong><br />
*continuing operations **proposal to the AGM<br />
Earnings/share, basic<br />
Non-recurring items Dividend<br />
7
Kesko is a highly valued listed trading sector company. It manages retail store chains<br />
that are valued by customers and efficiently produces services for retail store chains’<br />
purchasing, logistics, network development and data management. Kesko’s operations<br />
include food, home and speciality goods, building and home improvement,<br />
and car and machinery trade. Its division parent companies and chains act in close<br />
cooperation with retailer entrepreneurs and other partners. Kesko operates in the<br />
Nordic and Baltic countries, Russia, and Belarus.<br />
Strategic objectives<br />
Healthy, profitable<br />
growth<br />
• Our targeted sales growth<br />
exceeds that of the market<br />
• We increase the shareholder<br />
value by improving profit<br />
• We implement the strategy of<br />
selective internationalisation<br />
• We expand our store network<br />
Customer-driven business models<br />
Suppliers<br />
and service<br />
providers<br />
Sales and services for<br />
consumer customers<br />
• Our customer satisfaction<br />
exceeds that of competitors<br />
• Retailers’ knowledge of local<br />
customers’ needs is our<br />
competitive asset<br />
• We use loyal customer<br />
information efficiently in our<br />
customer programmes<br />
• We develop e-commerce and<br />
services<br />
• Store concepts and<br />
business models<br />
• Sourcing, logistics and<br />
marketing services<br />
• Store chain<br />
management<br />
• Store sites<br />
• Retailer resources<br />
• Support processes<br />
Retailer entrepreneurs’<br />
retailing<br />
Kesko’s own retailing<br />
B2B sales<br />
Strategic<br />
objectives<br />
Responsible and costefficient<br />
business models<br />
• Our operating practices are<br />
responsible<br />
• We efficiently combine retailer<br />
entrepreneurship and chain<br />
operations<br />
• We leverage our economies of<br />
scale and competence to the<br />
benefit of customers<br />
• We guide our business<br />
through efficient data<br />
management<br />
Consumer<br />
customers
10 Kesko’s year <strong>2009</strong><br />
Objectives<br />
include<br />
customer<br />
satisfaction<br />
exceeding that<br />
of competitors<br />
Breakdown of Kesko’s net sales<br />
by business model, %<br />
Retailer entrepreneurs’<br />
retailing 51%<br />
Kesko’s own retailing 27%<br />
B2B sales 22%<br />
Financial objectives and their realisation<br />
The objectives announced<br />
on 5 Feb. <strong>2009</strong><br />
Net sales growth Growth rate exceeding that<br />
of the market<br />
Healthy, profitable growth<br />
Objectives include customer<br />
satisfaction exceeding that of<br />
competitors and increasing<br />
shareholder value<br />
Kesko’s key strategic objectives in all store<br />
chains include achieving a level of customer<br />
satisfaction and sales growth that<br />
exceeds the level achieved by competitors.<br />
Shareholder value is increased by<br />
long-term profitable growth. Objectives<br />
also include maintaining good solvency<br />
and liquidity in all market conditions. The<br />
target return on equity is 12%, while the<br />
target return on capital employed is 14%.<br />
Kesko implements a strategy of<br />
selective internationalisation<br />
The objective is to invest in healthy, profitable<br />
growth, while taking the market<br />
situation and customer demand into<br />
consideration.<br />
Investments in the food trade are<br />
directed at expanding and refurbishing<br />
the store network in Finland. In addition,<br />
expanding business to the Russian market<br />
is studied.<br />
In the building and home improvement<br />
trade, the international store network<br />
will be expanded in the next few<br />
years mainly in Russia, with the focus on<br />
the retailing markets of the St. Petersburg<br />
and Moscow regions. In addition to<br />
investments in new store sites, business<br />
growth may also be achieved through<br />
acquisitions. The Russian market in particular<br />
is considered to offer significant<br />
long-term growth potential in the home<br />
building and decoration trade. Synergy<br />
benefits are achieved through joint cat-<br />
egory management and sourcing, which<br />
are supported by investments in the joint<br />
enterprise resource planning system and<br />
centrally directed logistics network.<br />
Sales and services to consumer<br />
customers<br />
Customer satisfaction exceeding<br />
that of competitors<br />
The strategic emphasis lies on sales to<br />
consumer customers. The objective is to<br />
achieve a level of customer satisfaction<br />
and sales growth that exceeds the level<br />
achieved by competitors. Success in the<br />
consumer customer trade requires clear<br />
customer and brand promises and the<br />
fulfilment of these promises during every<br />
store visit.<br />
Customer promises are fulfilled<br />
through high-quality and competitivelypriced<br />
products, a comprehensive store<br />
network and good service.<br />
Kesko has dozens of successful chain<br />
and product brands that are managed<br />
and developed according to customer<br />
needs. The objective of brand development<br />
work is to increase the value of<br />
brands and to improve the efficiency of<br />
marketing.<br />
The creation of customer-driven selections<br />
and targeted marketing are supported<br />
by the K-Plussa customer loyalty<br />
system, whose reward and payment card<br />
features have undergone reforms in recent<br />
years. The K-Plussa customer loyalty programme<br />
operates on three levels: benefits<br />
granted to customers are either storespecific,<br />
chain-specific or provided across<br />
the entire K-Plussa network. The objective<br />
of the system is to offer significant prod-<br />
Target level Realised in <strong>2009</strong> Realised in 2008<br />
Realised*: Food trade, sports trade,<br />
building and home improvement<br />
trade (Finland), car and machinery<br />
trade<br />
Return on equity 12% 6.6%, excl. non-recurring items<br />
3.8%<br />
Return on capital employed 14% 11.0%, excl. non-recurring items<br />
7.3%<br />
Realised: VV-Auto, Intersport Finland,<br />
Kenkäkesko<br />
12%, excl. non-recurring items 8.1%<br />
14%, excl. non-recurring items<br />
10.0%<br />
Interest-bearing net debt/EBITDA < 3 -0.7 0.1<br />
Equity ratio 40–50% 54% 52%<br />
Economic value added<br />
*Kesko’s own estimate<br />
Growing positive EVA as<br />
internal indicator<br />
Not realised Not realised
uct and service benefits to customers,<br />
encouraging them to centralise their purchases<br />
in the K-Group. The use of customer<br />
information has been enhanced in<br />
key business areas. Chains and stores utilise<br />
customer information in their selection<br />
planning, pricing, marketing and<br />
store network planning, for example.<br />
Customer-driven business models<br />
The business models applied in Kesko’s<br />
sales to consumer customers are retailing<br />
through retailer entrepreneurs and<br />
Kesko’s own retailing. Kesko is also<br />
engaged in B2B sales.<br />
1) Retailer entrepreneurs’ retailing<br />
The principal business model in the Finnish<br />
market is the chain business model, in<br />
which independent K-retailers run retail<br />
stores in chains managed by Kesko. In<br />
Finland, all food and building and home<br />
improvement stores in the K-Group are<br />
run by retailer entrepreneurs. Through its<br />
chain operations, Kesko provides a firstclass<br />
setting for its retailer entrepreneurs<br />
to provide the best possible service to<br />
their customers. The K-retailer entrepreneur<br />
is responsible for his or her store’s<br />
customer satisfaction, personnel and business<br />
profitability. Good service and<br />
knowledge of customer needs provide the<br />
K-Group with a competitive edge.<br />
At the end of <strong>2009</strong>, Kesko had 1,302<br />
K-retailer entrepreneurs as partners and,<br />
in addition, about 250 other retailer<br />
partners in the Asko, Sotka, Byggmakker<br />
and Senukai chains. Kesko’s sales to<br />
retailer partners accounted for 51% of net<br />
sales in <strong>2009</strong>.<br />
2) Kesko’s own retailing<br />
Kesko acts as a retailer in business operations<br />
where the competitive advantage<br />
derives from the centrally managed chain<br />
concept and large units. Kesko’s own<br />
retail stores in Finland include the Anttila<br />
and Kodin Ykkönen department stores. In<br />
addition, Kesko is also responsible for<br />
retailing home and speciality goods in the<br />
K-citymarket chain. Kesko’s own retailing<br />
is also the model mainly used in expanding<br />
business operations outside Finland.<br />
In <strong>2009</strong>, Kesko’s own retailing accounted<br />
for 27% of net sales.<br />
3) B2B sales<br />
Kesko is engaged in B2B sales in those<br />
business operations in which B2B sales<br />
support consumer customer sales. Typical<br />
business customers include construction<br />
companies, agricultural entrepreneurs,<br />
the manufacturing industry, institutional<br />
kitchens and the public sector. In <strong>2009</strong>,<br />
Kesko’s B2B sales accounted for 22% of<br />
net sales.<br />
Electronic customer<br />
communications and e-commerce<br />
The importance of electronic customer<br />
communications in trading has increased<br />
continuously. Kesko is developing online<br />
customer communications and the chains’<br />
online trading sites. The objective is to<br />
improve customer satisfaction and to<br />
increase sales. Kesko has gained a strong<br />
position in online sales of home and<br />
speciality goods through the NetAnttila,<br />
Kodin1.com, Konebox.fi and Budget Sport<br />
online stores.<br />
Responsible and cost-efficient<br />
business models<br />
Sustainable development and<br />
responsible operating practices<br />
The principles of sustainable development<br />
and responsible operating practices are a<br />
central part of Kesko’s and its chains’<br />
daily activities. Consumer customers<br />
require the trading sector to take responsibility<br />
for products’ safety and health<br />
effects, and for the environmental and<br />
social impact of business operations. The<br />
results of responsible operations are<br />
reported annually in Kesko’s Corporate<br />
Responsibility <strong>Report</strong>.<br />
Efficient combination of retailer<br />
entrepreneurship and chain<br />
operations and benefitting from<br />
economies of scale<br />
The strategic objective is to efficiently<br />
combine K-retailer entrepreneurship and<br />
chain operations. K-retailers are responsible<br />
for customer service, local selections<br />
and fulfilling the customer promise in<br />
their stores.<br />
Kesko’s efficient chain operations and<br />
joint processes provide support to retailers.<br />
Chain operations offer the retailer a<br />
joint business concept which includes,<br />
among other things, chain control related<br />
to chain selection, pricing and marketing,<br />
and business management support. Joint<br />
Kesko’s year <strong>2009</strong><br />
11<br />
chain operations carried out by retailers<br />
and Kesko are further enhanced by developing<br />
increasingly better tools and business<br />
models for the stores. The most<br />
important of these are regional and storespecific<br />
selections and pricing guidance as<br />
well as tools for customer relationship<br />
and store personnel management.<br />
Kesko participates in international<br />
purchasing cooperation in various product<br />
lines, which increases purchasing volumes<br />
and efficiency. The most important partnership<br />
organisations in which Kesko participates<br />
include AMS Sourcing B.V. in the<br />
grocery trade, tooMax-x in the building<br />
and home improvement trade, Intersport<br />
International Corporation in the sports<br />
trade, and Electronic Partner International<br />
in the home technology trade.<br />
Work and productivity<br />
programme<br />
Cost-efficient operations build price competitiveness<br />
and customer satisfaction in<br />
the retailing sector. Cost-efficiency is also<br />
a basic requirement for increasing Kesko’s<br />
profitability and shareholder value.<br />
One of the key objectives of the work<br />
and productivity programme launched is<br />
to increase employees’ work productivity<br />
in Kesko and the chain stores. The most<br />
important tools for improving productivity<br />
include increasing personnel competence<br />
and the efficiency of operating practices.<br />
Promoting the wellbeing of employees<br />
has also become an increasingly important<br />
factor. Retail stores also focus on<br />
enhancing the productivity of store space<br />
and inventories.<br />
Electronic and automated<br />
processes<br />
A project to automate processes and routines<br />
with the goal of improving costefficiency<br />
is underway in Kesko. Key areas<br />
in process automation include logistics<br />
automation projects, the forecast systems<br />
and automated orders that improve the<br />
availability of products in stores, the<br />
adoption of electronic purchase and sales<br />
invoices, and the automation of financial<br />
management routines in the shared services<br />
centre of the Kesko Group.<br />
More detailed information on each division’s<br />
strategic emphases and projects is<br />
provided in the division-specific presentations<br />
starting on page 14.
12 Kesko’s year <strong>2009</strong><br />
K-Plussa is<br />
the biggest<br />
customer<br />
loyalty<br />
programme<br />
in Finland<br />
The widest and most diverse customer<br />
loyalty programme in Finland provides<br />
K-Plussa customers with benefits from<br />
more than 3,500 outlets and over 40<br />
cooperation partners. Local K-retailers<br />
and the K-Group chains offer special<br />
benefits and services targeted to their<br />
K-Plussa customers. K-Plussa customers<br />
also get special benefits that are always<br />
at least 10% of the normal price. The<br />
benefit received in the form of K-Plussa<br />
points is up to 5%. In <strong>2009</strong>, the<br />
K-Plussa customer loyalty programme<br />
gained 190,596 new customers and<br />
reached the landmark of two million<br />
households.<br />
By concentrating their purchases, K-Plussa<br />
customers get benefits and services that<br />
are based on their needs and shopping<br />
behaviour. The K-Plussa customer loyalty<br />
system operates on three levels: benefits<br />
granted to customers are either storespecific,<br />
chain-specific or provided across<br />
the entire K-Plussa network. Targeted<br />
marketing communications and special<br />
offers as well as electronic channels<br />
gained more importance in <strong>2009</strong> at all<br />
three levels of the K-Plussa customer<br />
loyalty programme.<br />
Retailer cater for customers<br />
Research has shown that special benefits<br />
and services provided by stores for<br />
K-Plussa customers increase customer<br />
satisfaction and store visits.<br />
Customer information obtained via the<br />
K-Plussa card is used in planning storespecific<br />
selections and services and in targeting<br />
the store’s marketing messages.<br />
Targeted marketing both in electronic and<br />
traditional media is more cost-efficient<br />
and often attracts more attention. For<br />
example, results obtained from special<br />
benefits and events targeted to customers<br />
have been extremely good.<br />
K-Group chains’ operations are<br />
based on customer information<br />
At the chain level, customer information<br />
obtained via K-Plussa is leveraged in network<br />
planning and concept development,<br />
for example. Chain-level customer information<br />
is also useful when building the<br />
chains’ selections and services to meet<br />
the needs of customers as well as possi-<br />
ble. Many chains have built loyalty<br />
schemes for their important customer<br />
groups, such as Kodin Ykkönen’s<br />
Ykkösasiakas programme.<br />
Benefits for all K-Plussa<br />
customers<br />
K-Plussa offers significant benefits available<br />
for all customers: each month hundreds<br />
of topical K-Plussa offers, which<br />
always reward customers with a discount<br />
of at least 10%, provided at the checkout.<br />
By centralising their purchases in the<br />
K-Plussa network, customers receive a<br />
reward of up to 5% in the form of<br />
K-Plussa points.<br />
A joint benefit launched for all<br />
K-Plussa customers shopping at K-food<br />
stores in <strong>2009</strong> is the new electronic Nutritioncode<br />
service, which enables customers<br />
to monitor, free of charge, how<br />
healthy their purchases are. The electronic<br />
service registers the purchases made by<br />
the household in K-food stores and<br />
provides the users with information<br />
and hints on the nutrition values of<br />
the groceries purchased.<br />
The importance of targeted electronic<br />
communications continues to grow. Customers<br />
who have agreed to electronic<br />
marketing receive a K-Plussa e-newsletter<br />
once a month. K-Group chains and stores<br />
also approach their customers with personal<br />
e-mail offers. Customers can<br />
deposit their K-Plussa points into their<br />
account with any bank.<br />
As a customer benefit, K-Plussa customers<br />
receive Pirkka, the most widely<br />
read magazine in Finland. Readership of
the Pirkka magazine continued to increase<br />
in <strong>2009</strong> (source: the National Readership<br />
Survey).<br />
Andiamo Club’s electronic customer<br />
loyalty card was launched in <strong>2009</strong>.<br />
Andiamo Club members can download<br />
their electronic membership cards to their<br />
mobile phones. The card works like a normal<br />
plastic loyalty card and the customer’s<br />
personal K-Plussa data may also be<br />
combined with it. Customers can opt to<br />
receive new benefits and special offers<br />
direct to their mobile phones.<br />
New partners to<br />
the K-Plussa network<br />
The K-Plussa network became increasingly<br />
diversified during <strong>2009</strong>. In April, more<br />
than 100 Instrumentarium outlets<br />
throughout Finland joined the K-Plussa<br />
network. In addition to the K-stores and<br />
the K-Group chains, the K-Plussa network<br />
includes over 40 leading operators in their<br />
sectors. K-Plussa customers’ total benefits<br />
have improved considerably during the<br />
year and the number of cooperation partners<br />
will continue to grow.<br />
<strong>2009</strong> brought more K-Plussa card benefits<br />
for leisure activities for the whole<br />
family. Visits to all Finnish HopLop indoor<br />
adventure parks now accrue K-Plussa<br />
points. HopLop is the biggest chain of<br />
year-round children’s adventure parks in<br />
the Nordic countries.<br />
Cooperation started between K-Plussa<br />
and Flamingo Spa. The Spa, located in the<br />
Greater Helsinki Area, comprises a large<br />
water park for the whole family and a spa<br />
& wellness world for adults. Since the<br />
beginning of <strong>2009</strong>, customers have also<br />
been able to accrue K-Plussa points from<br />
food and beverages served by Center Inn<br />
restaurants in Helsinki.<br />
More than 100,000 new<br />
K-Plussa households<br />
In <strong>2009</strong>, the K-Plussa customer loyalty<br />
programme reached the landmark figure<br />
of two million households. More than 3.6<br />
million Finns already have a K-Plussa<br />
card. There are nearly 850,000 K-Plussa<br />
co-branding cards with OP-Pohjola and<br />
Nordea. In <strong>2009</strong>, the K-Plussa customer<br />
loyalty programme gained 190,596 new<br />
customers.<br />
To enable us to develop rewarding and<br />
customer programmes, we need a sufficient<br />
amount of information about customer<br />
relationships and the competence<br />
to analyse and leverage this information.<br />
K-Plus Oy collects and analyses this information<br />
in the K-Group.<br />
Customers’ privacy protection is<br />
ensured when customer information is<br />
collected and made use of. K-Plus Oy<br />
processes customers’ purchasing data on<br />
the sum total or product group level.<br />
Anonymous receipt line level purchasing<br />
data may also be used. Customer information<br />
and programmes play a key role in<br />
business planning.<br />
Kesko’s year <strong>2009</strong><br />
13<br />
Wellbeing in the K-Plussa<br />
network<br />
The K-Plussa network became increasingly<br />
diversified in April <strong>2009</strong>, when<br />
consumer customers started to receive<br />
K-Plussa points from over one<br />
hundred Instrumentarium outlets<br />
throughout Finland. Thanks to this<br />
cooperation, K-Plussa benefits were<br />
extended to include wellbeing<br />
products and expertise.
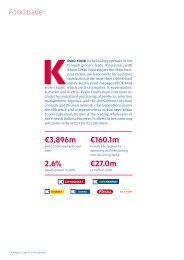
Kesko Food is a strong operator in the Finnish grocery trade. K-retailers are responsible<br />
for customer satisfaction at the more than 1,000 K-food stores. Kesko Food<br />
manages K-citymarket’s food trade and the K-supermarket, K-market and K-extra<br />
chains. Kesko Food’s main functions include the centralised purchasing of products,<br />
selection management, logistics, and the development of chain concepts and the<br />
store site network. Chain operations ensure the efficiency and competitiveness of<br />
business. Kesko Food’s subsidiary Kespro Ltd is the leading wholesaler in the Finnish<br />
HoReCa business. It offers the best sourcing solutions in the sector for its customers.<br />
Kesko’s brands in the food trade<br />
Food segment’s net sales<br />
€3,798 million<br />
Food segment’s operating profit<br />
excluding non-recurring items<br />
€133.1 million<br />
Food<br />
trade
16 Kesko’s year <strong>2009</strong><br />
K-food stores<br />
focus on food<br />
and service<br />
Customer information as part<br />
of high-quality operations<br />
Customer information and understanding<br />
provide the basis for Kesko<br />
Food’s business development. Leveraging<br />
of customer information<br />
relies on information produced<br />
by K-Plus Oy that is collected<br />
locally both at the customer<br />
and product group levels.<br />
Store- and chain-specific<br />
programmes as<br />
well as those available<br />
across the entire network are<br />
developed on the basis of the information<br />
to ensure that selections are<br />
as suitable and the service experience<br />
as good as possible for the customers.<br />
Customer information serves as a<br />
basis for the development of selections,<br />
concepts, network planning<br />
and marketing, for example.<br />
A K-food store is a quality store, which<br />
provides customers with the best food<br />
ideas and meal solutions at favourable<br />
prices. K-food stores operate efficiently<br />
and offer the widest and most exciting<br />
selections, and have the best fresh produce<br />
departments. Every K-food store<br />
stocks a wide range of Pirkka products,<br />
which are valued by customers, of high<br />
quality and sold at permanently low<br />
prices. The K-Plussa customer loyalty programme<br />
rewards customers for centralising<br />
their purchases and the K-Plussa card<br />
also provides versatile benefits. Customer<br />
programmes help cater for loyal K-Plussa<br />
customers on an individual basis. The<br />
main purpose of the customer programmes<br />
is to locally offer the exact<br />
selections and services needed by particular<br />
customers.<br />
Market<br />
The Finnish grocery market totalled some<br />
€14.7 billion in <strong>2009</strong>, representing a<br />
growth of 3–4% from 2008 (own estimate).<br />
The increase was biggest in the<br />
hypermarkets in the largest size category<br />
(over 2,500 m 2 ).<br />
In addition to K-food stores, primary<br />
operators in the market include Prisma,<br />
S-market and Alepa/Sale (S Group), Valintatalo,<br />
Siwa and Euromarket (Suomen<br />
Lähikauppa Oy), and Lidl. The estimated<br />
market share of the K-food stores is 34%<br />
(own estimate).<br />
In <strong>2009</strong>, the HoReCa market’s (hotels,<br />
restaurants and catering) purchases in<br />
Finland totalled about €2.4 billion (own<br />
estimate). Kesko Food’s subsidiary Kespro<br />
Ltd is the leading wholesaler in the Finnish<br />
HoReCa business. Kespro’s main competitors<br />
are Meiranova Oy, Metro Chain<br />
and Heinon Tukku Oy. Kespro strengthened<br />
its position in <strong>2009</strong> and achieved its<br />
best-ever customer satisfaction rate.<br />
The aim is a satisfied customer<br />
K-food stores are visited by nearly<br />
900,000 customers every day. Successful<br />
customer encounters every time are a<br />
prerequisite of overall success and are<br />
ensured with:<br />
• The widest and most exciting<br />
selections, and an extensive selection<br />
of new arrivals.<br />
• The best fruit and vegetable, meat and<br />
fish, and bread departments.<br />
• High-quality and safe, permanently<br />
low-priced Pirkka products. The range<br />
now comprises more than 1,800 items.<br />
• The best food expertise, including a<br />
diversified supply of recipes and<br />
cooking advice.<br />
• The K-Plussa customer loyalty<br />
programme, which rewards<br />
centralisation of purchases. The<br />
K-Plussa card entitles holders to<br />
benefit from diverse special offers.<br />
• The help of customer loyalty<br />
programmes, which offer K-Plussa<br />
customers exactly the selections and<br />
services they need locally.<br />
• Responsible operations, including<br />
active development of the Pirkka<br />
Fairtrade product range.<br />
Favourable prices are a prerequisite for<br />
growth and customer satisfaction. The<br />
basis for favourable prices is built with<br />
the help of the selection that is available<br />
throughout the chain, permanently<br />
low-priced Pirkka products, the chain’s<br />
campaigns and store-specific activities.<br />
Permanently low prices are reinforced<br />
by efficient practices all the way from<br />
customer to supplier, chain operations<br />
and long-term cooperation models with<br />
selected partners.<br />
Considerable benefits are obtained<br />
both in Finland and internationally by<br />
combining purchasing volumes. Kesko<br />
Food is a member of the international<br />
sourcing alliance, Associated Marketing<br />
Services (AMS), that has rapidly expanded.<br />
Other major members of AMS include<br />
Ahold, Dansk SG, ICA, Migros and<br />
Système U.<br />
K-retailers are responsible for<br />
customer satisfaction<br />
Local K-retailers are responsible for the<br />
customer service, competence of personnel,<br />
quality, and profitability of business.<br />
Making use of customer data, the retailer<br />
builds a selection and service that meets<br />
customer needs, offering, for example,<br />
food from local producers to complement<br />
joint selections of the chain.<br />
In order to ensure high quality, K-food<br />
stores have their own quality system. Its
objective is to ensure continuous development<br />
of the operations of the store and<br />
the whole chain to best serve the customers.<br />
The system includes measuring customer<br />
satisfaction and the store’s condition,<br />
and assessing price control and<br />
management. The best retailing competence<br />
is maintained with the help of<br />
constant training in cooperation with<br />
the K-instituutti, the K-Group’s training<br />
centre.<br />
Efficient cooperation between Kesko<br />
Food and the K-food retailer is based on<br />
the chain operations defined in the chain<br />
agreement. Chain operations ensure customer-orientation,<br />
operational efficiency,<br />
competitiveness and the attainment of<br />
competitive advantages.<br />
High-quality Pirkka products<br />
are K-food stores’ strength<br />
Pirkka products combine quality and low<br />
prices. The total number of Pirkka products<br />
reached 1,826 by the end of the year.<br />
According to consumer studies, customers<br />
feel that Pirkka products are an easy and<br />
safe choice because of their high quality<br />
and low price.<br />
The Pirkka range also includes Pirkka<br />
Organic and Pirkka Fairtrade products.<br />
There are now more than 40 Pirkka<br />
Organic and nearly 30 Pirkka Fairtrade<br />
products.<br />
The quality of Pirkka products is<br />
assured by Kesko Food’s own Pirkka Product<br />
Research Unit, which carefully analyses<br />
all new Pirkka products. The research<br />
unit’s laboratory has the ISO 17025<br />
accreditation, an international recognition<br />
of competence. It is the only ISO 17025<br />
accredited laboratory in Finland responsible<br />
for the quality assurance of ownbrand<br />
products in the trading sector.<br />
All Kesko Food’s own recipes have<br />
been developed and tested by the Pirkka<br />
test kitchen, which is part of the Pirkka<br />
Product Research. Diverse recipes are published<br />
in the Pirkka magazine, which is<br />
mailed to K-Group loyalty customers, in<br />
the online cookery book on Pirkka.fi, in<br />
the K-RuokaPirkka leaflet that is published<br />
monthly and available at all K-food<br />
stores, on the TV programme “What are<br />
we having today?”, and on Pirkka product<br />
packaging.<br />
Quality guaranteed by the letter<br />
K and the chain concepts<br />
Strong chain concepts guarantee the high<br />
quality of K-food stores. Kesko Food’s<br />
chain operations provide K-retailers with<br />
a strong basis for purchasing, building<br />
selections, marketing and price competition.<br />
K-citymarkets offer their customers<br />
the most diversified selections of groceries<br />
and home and speciality goods. Their<br />
special strengths include fresh bread, fruit<br />
and vegetables, a diversified supply of<br />
foods, and exiting departments with<br />
their displays. K-citymarkets provide their<br />
customers with a low-priced shopping<br />
basket and the best offers – every day.<br />
There are 69 K-citymarkets in Finland<br />
in 51 towns. Five new K-citymarkets were<br />
opened in <strong>2009</strong>.<br />
The K-supermarkets’ strength is<br />
excellent service. In addition to the<br />
retailer and other staff, customers are also<br />
served by over 160 employees with a specialist<br />
food manager qualification. These<br />
meat and fish experts provide customers<br />
with cooking tips and advice. K-supermarkets<br />
are better than the average food<br />
stores and offer wide selections of food<br />
items at competitive prices.<br />
The chain consists of 170 stores. In<br />
<strong>2009</strong>, four new K-supermarkets were<br />
opened.<br />
K-markets are reliable, service-oriented<br />
and local neighbourhood stores<br />
located near to customers. In addition to<br />
good basic selections, K-markets offer<br />
customers fresh bread straight from the<br />
store’s oven, fresh, high-quality fruit and<br />
vegetables, and the best local services.<br />
The chain comprises 487 stores. 15<br />
new K-markets were opened in <strong>2009</strong>.<br />
K-extras are neighbourhood stores<br />
which focus on personal service and<br />
provide customers with daily essentials.<br />
Additionally, as the name implies, many<br />
K-extras located in the countryside offer<br />
extra services, such as the sale of agricultural<br />
and builders’ supplies, fuel distribution,<br />
lottery and postal services.<br />
The chain comprises 189 stores.<br />
Kesko’s year <strong>2009</strong><br />
17<br />
Everyone has a favourite in<br />
the diversified Pirkka range<br />
The “My favourite” campaign encouraged<br />
Finns to vote for their Pirkka<br />
favourites in August <strong>2009</strong>. The campaign<br />
site was visited more than<br />
500,000 times and over 190,000<br />
votes were cast. The fun campaign<br />
focused on the diversity of the Pirkka<br />
range in everyday food solutions.<br />
The range now comprises over 1,800<br />
products. The number one favourite<br />
among Finns was the Pirkka AB rye<br />
nut yoghurt.
18 Kesko’s year <strong>2009</strong><br />
High-quality Pirkka products<br />
are tested and safe<br />
All new Pirkka products are carefully<br />
analysed by Kesko Food’s own Pirkka<br />
Product Research. The unit was<br />
awarded the ISO 17025 accreditation,<br />
an important international recognition<br />
for competence, in March <strong>2009</strong> as<br />
the only laboratory in Finland responsible<br />
for quality assurance for the<br />
trading sector’s own brands. The<br />
Pirkka Product Research includes the<br />
Pirkka test kitchen, which creates and<br />
tests recipes for everyday and special<br />
purposes alike.<br />
Development of the store<br />
network continues<br />
At the end of <strong>2009</strong>, there were 1,030<br />
K-food stores, catering for various consumer<br />
needs ranging from daily local<br />
services to the wide range of clothing and<br />
other home and speciality goods stocked<br />
by hypermarkets. The K-food store network<br />
is the most comprehensive in<br />
Finland. 51% of Finns live less than a<br />
kilometre away from a K-food store. The<br />
K-Group’s neighbourhood store network<br />
is the most comprehensive in Finland. The<br />
total number of K-markets and K-extras is<br />
676.<br />
Kesko Food develops the K-food store<br />
network by investing in stores of all sizes.<br />
The constant development of the network<br />
is required to meet the needs of ageing<br />
stores, expanding selections, new services<br />
and migration.<br />
Year <strong>2009</strong><br />
The food segment’s net sales totalled<br />
€3,798 million in <strong>2009</strong>, an increase of<br />
2.4%. The operating profit excluding<br />
non-recurring items amounted to €133.1<br />
million, which is €10.5 million up on the<br />
previous year.<br />
The value added tax on retail sales of<br />
food was reduced at the beginning of<br />
October. Kesko Food and K-food retailers<br />
undertook to implement the reduction in<br />
full on food prices. The price monitoring<br />
survey published by the National Consumer<br />
Research Centre in November verified<br />
that at K-food stores food prices<br />
decreased even more than the VAT cut.<br />
Due to the reduction, K-food stores<br />
changed more than 6 million prices.<br />
A family who spent about €5,000 on<br />
food per year before the VAT decrease will<br />
now save €215 a year.<br />
The Act to extend retail store opening<br />
hours came into force at the beginning of<br />
December. The amendment meant that<br />
another 400 K-food stores would be able<br />
to benefit from extended Sunday opening<br />
hours. The total number of K-food stores<br />
is 1,030. For customers, this means much<br />
better accessibility to retail services. The<br />
fact that the stores no longer have to stay<br />
closed one day a week also improves efficiency<br />
and reduces waste, because total<br />
demand is easier to predict.<br />
During the year, five new K-citymarkets,<br />
four K-supermarkets, and 15<br />
K-markets were opened. A total of 25<br />
new food stores were opened, one of<br />
which replaced an existing store. Several<br />
K-food stores were also extended and<br />
renovated in <strong>2009</strong>.<br />
Objectives and strategic<br />
emphases<br />
Kesko Food’s key objective is to increase<br />
market share. The implementation of<br />
Kesko Food’s strategy aims at growth<br />
faster than the market, increased customer<br />
satisfaction and competitiveness.<br />
Kesko Food’s opportunities for internationalisation<br />
are also being actively investigated,<br />
particularly in Russia.<br />
Kesko Food’s key strategic focuses<br />
include increasing the efficiency of operations<br />
and enhancing electronic customer<br />
communications. Automated processes<br />
play a central role in increasing the efficiency<br />
of operations. In addition to more<br />
targeted information on the products and<br />
services available at K-food stores, electronic<br />
customer communications also provide<br />
customers with new methods of<br />
handling their customer relationship<br />
matters online. Opportunities for food<br />
retailing online are also being explored.<br />
The premise is that the retailing sector<br />
and electronic transactions should support<br />
customer needs and make shopping<br />
easier.
Competitors<br />
Finland, market share 34%<br />
(own estimate)<br />
Competitors: Prisma, S-market and Alepa/<br />
Sale (S Group), Valintatalo, Siwa and Euromarket<br />
(Suomen Lähikauppa Oy) and Lidl<br />
HoReCa, Finland, Kespro<br />
Competitors: Meiranova Oy, Metro Chain,<br />
Heinon Tukku Oy<br />
K-Group’s food trade, retail and B2B sales<br />
Number<br />
Kesko’s year <strong>2009</strong><br />
Sales (incl. VAT)<br />
€ million<br />
19<br />
<strong>2009</strong> 2008 <strong>2009</strong> 2008<br />
K-citymarket, groceries 69 64 1,412 1,249<br />
K-supermarket 170 163 1,633 1,580<br />
K-market (incl. service station stores) 487 490 1,502 1,494<br />
Others 304 338 344 362<br />
K-food stores, retail sales 4,891 4,685<br />
Kespro 811 837<br />
Food trade, total 1,030 1,055 5,703 5,521<br />
Food segment’s key figures, continuing operations <strong>2009</strong> 2008<br />
Net sales € million 3,798 3,707<br />
Operating profit € million 170.6 185.5<br />
Operating profit excl. non-recurring items € million 133.1 122.5<br />
Operating profit as % of net sales<br />
excl. non-recurring items % 3.5 3.3<br />
Investments € million 69.4 139.7<br />
Return on capital employed*<br />
excl. non-recurring items % 20.9 19.3<br />
Personnel average 3,035 3,440<br />
* cumulative average<br />
Food segment’s net sales, continuing operations € million change, %<br />
K-citymarket 854 12.1<br />
K-supermarket 1,001 3.7<br />
K-market and K-extra 1,067 -2.5<br />
Kespro 677 -2.6<br />
Others 199 4.1<br />
Net sales, total 3,798 2.4<br />
Food segment’s capital employed at 31 December,<br />
€ million <strong>2009</strong> 2008<br />
Non-current assets 632 704<br />
Inventories 90 91<br />
Short-term receivables 371 380<br />
./. Non-interest-bearing debt -489 -510<br />
./. Provisions -8 -8<br />
Capital employed** 596 657<br />
** capital employed at the end of month
Kesko’s home and speciality goods trade operates in the clothing, home, leisure,<br />
home technology, entertainment and furniture product lines. The home and<br />
speciality goods trade comprises Anttila Oy, K-citymarket Oy, Intersport Finland Ltd,<br />
Indoor Group Ltd, Musta Pörssi Ltd and Kenkäkesko Ltd. The total number of home<br />
and specility goods stores is 450, of which 199 are owned by Kesko.<br />
Kesko’s brands in the home and speciality goods trade<br />
Home and speciality goods<br />
segment’s net sales<br />
€1,558 million<br />
Home and speciality goods<br />
segment’s operating profit<br />
excluding non-recurring items<br />
€29.5 million<br />
Home and<br />
speciality goods<br />
trade
22 Kesko’s year <strong>2009</strong><br />
Diversified<br />
selections and<br />
well-known<br />
brands<br />
Market and the operating<br />
environment<br />
Kesko’s home and speciality goods trade<br />
comprises well-known store concepts<br />
with a strong position in the hypermarket,<br />
department store, speciality store and<br />
online sales. The Finnish total market of<br />
home and speciality goods is estimated to<br />
be approximately €10 billion.<br />
The economic recession has highlighted<br />
the importance of price. Customers<br />
are looking for opportunities to save and<br />
campaigns have become more and more<br />
important. In <strong>2009</strong>, there were differences<br />
in the market development of various<br />
product lines in the home and speciality<br />
goods trade. Consumer demand for<br />
sports goods increased, while demand for<br />
home electronics and interior decoration<br />
items in particular declined.<br />
The estimated market of home interior<br />
decoration and furniture is €1,800 million,<br />
representing a decrease of 5–10%<br />
from the previous year.<br />
The market for home electronics and<br />
entertainment is estimated to total some<br />
€2,000 million, representing a change of<br />
about -13%.<br />
The estimated sports trade market<br />
totals €900 million and increased by<br />
some 5% from the previous year.<br />
The value of the shoe trade market<br />
declined by some 3–4% from the previous<br />
year.<br />
Year <strong>2009</strong><br />
Since the beginning of <strong>2009</strong>, Anttila Oy,<br />
K-citymarket Oy, Intersport Finland Ltd,<br />
Indoor Group Ltd, Musta Pörssi Ltd and<br />
Kenkäkesko Ltd have been reported in the<br />
home and speciality goods segment. During<br />
the year, Anttila, K-citymarket’s home<br />
and speciality goods and other Group’s<br />
home and speciality goods companies<br />
intensified their cooperation. The objective<br />
of the cooperation is to improve competitiveness<br />
by defining the companies’<br />
joint strategy, developing retailing expertise<br />
on a centralised basis and ensuring<br />
that customers find the concepts interesting.<br />
Synergy benefits are sought, above<br />
all, in purchasing, in the development of<br />
the store network and through uniform,<br />
efficient business processes.<br />
Kesko’s net sales of home and speciality<br />
goods totalled €1,558 million in <strong>2009</strong>,<br />
a decrease of 3.0%, which can be attributed<br />
to the deteriorated financial situation<br />
and the increase in unemployment.<br />
The combined retail sales of home and<br />
speciality goods stores were €2,050<br />
million, a decrease of 3.1%.<br />
The operating profit of the home and<br />
speciality goods trade excluding nonrecurring<br />
items was €29.5 million, representing<br />
a decrease of €1.7 million from<br />
the previous year.<br />
Objectives and strategic<br />
emphases<br />
Changes in the financial situation and<br />
consumption habits are strongly reflected<br />
in the home and speciality goods trade.<br />
Internationalisation and formation of<br />
chains will strengthen competition, and<br />
successful chains are based on efficient<br />
business models. Seasons and collections<br />
change faster than ever, while product<br />
series become smaller and their life cycles<br />
shorter.<br />
The cooperation of the Kesko Group’s<br />
home and speciality goods companies<br />
started in <strong>2009</strong> will be further intensified.<br />
The K-Group’s home and speciality<br />
goods trade aims to be a market leader in<br />
selected product lines. This will be<br />
achieved by enhancing store concepts and<br />
selections, by increasing the cost-efficiency<br />
of operations chains and the staff’s<br />
sales and service competence.<br />
Hypermarket trade<br />
– K-citymarket<br />
K-citymarket is a diversified and favourably-priced<br />
hypermarket chain, which<br />
offers its customers wide selections of<br />
groceries and home and speciality goods.<br />
K-citymarket Oy is responsible for the<br />
home and speciality goods business in<br />
these stores, while K-retailer entrepreneurs<br />
are responsible for the food<br />
business. There are 69 K-citymarkets<br />
in Finland.<br />
K-citymarkets offer their customers<br />
up-to-date, frequently changing selections<br />
of everyday goods, quickly and at<br />
low prices. Key success factors include<br />
chain management and marketing combined<br />
with efficient, centralised purchasing<br />
and logistics. K-citymarket Oy’s operations<br />
are based on long-term strategy and<br />
systematic leveraging of customer information<br />
in operations management.<br />
The K-citymarket chain has approximately<br />
60 million customer visits per year<br />
and a staff of some 5,700 employees in<br />
customer service.
Year <strong>2009</strong><br />
In <strong>2009</strong>, the net sales of K-citymarket’s<br />
home and speciality goods totalled €595<br />
million, which represented an increase of<br />
5.1%. K-citymarket Oy’s retail sales<br />
amounted to €699 million.<br />
In <strong>2009</strong>, five new K-citymarket hypermarkets<br />
were opened: in Ylöjärvi, in<br />
the Skanssi shopping centre, Turku, in<br />
Kirkkonummi, in Linnainmaa, Tampere,<br />
and in Koivukylä, Vantaa.<br />
Department store trade<br />
– Anttila<br />
Anttila retails entertainment, fashion and<br />
home goods. The multi-channel Anttila<br />
has 29 Anttila department stores and two<br />
smaller speciality stores in Finland. The<br />
nine Kodin Ykkönen department stores for<br />
interior decoration and home goods are<br />
complemented with the Kodin1.com<br />
online store. NetAnttila is engaged in distance<br />
sales in Finland, Estonia and Latvia.<br />
Anttila department stores provide<br />
diversified selections of leisure items,<br />
clothing and home goods combined with<br />
a low price level and friendly service. The<br />
TopTen departments are the largest<br />
retailer of music, movies and multimedia<br />
in Finland, and a major seller of information<br />
technology and electronics.<br />
Kodin Ykkönen provides a superior<br />
selection and services for home decorators.<br />
For several years, NetAnttila has been<br />
the best-known and most popular online<br />
department store in Finland. It offers a<br />
pioneering position, ease and reliability of<br />
shopping as well as low prices and wide<br />
selections.<br />
Year <strong>2009</strong><br />
Anttila’s net sales were €513 million in<br />
<strong>2009</strong>, a decrease of 8.0%. Retail sales of<br />
Anttila department stores totalled €368<br />
million in <strong>2009</strong>, a decrease of 6.1%.<br />
Retail sales of Kodin Ykkönen department<br />
stores for interior decoration and home<br />
goods totalled €161.2 million, down by<br />
10.7%. Sales of NetAnttila amounted to<br />
€97.3 million, a decrease of 14.3%,<br />
which can be attributed particularly to the<br />
drop in the Latvian market.<br />
In <strong>2009</strong>, a new Anttila department<br />
store was opened in the Skanssi shopping<br />
centre, Turku and a new Kodin Ykkönen<br />
department store in Lielahti, Tampere.<br />
Sports trade – Intersport<br />
Finland<br />
Intersport Finland’s retail store chains are<br />
Intersport, Budget Sport and Kesport.<br />
Intersport Finland is responsible for the<br />
marketing, sourcing and logistics services,<br />
store network and retailer resources of the<br />
chains. There are 57 Intersport stores, five<br />
Budget Sport stores and 37 Kesport stores<br />
in Finland, of which 91 are owned by<br />
retailer entrepreneurs and eight by Intersport<br />
Finland.<br />
Intersport is part of the international<br />
sports chain. The Intersport chain is the<br />
market leader in Finnish sports retailing.<br />
Intersport’s strengths include the chain’s<br />
high reliability and recognition among<br />
customers, wide and diversified selections,<br />
and its expert and service-minded<br />
staff.<br />
Budget Sport is a sports store format,<br />
which is based on low prices and the<br />
cost-effective business concept. It offers<br />
Kesko’s year <strong>2009</strong><br />
the sector’s largest selections in outdoor<br />
activity-related product groups.<br />
The Kesport stores are located in<br />
smaller rural centres and are the leading<br />
sports stores in their areas.<br />
Kesko is a partner of Intersport International<br />
Corporation.<br />
23<br />
Year <strong>2009</strong><br />
The net sales of Intersport Finland were<br />
€165 million in <strong>2009</strong>, representing an<br />
increase of 4.3%. The combined retail<br />
sales of Intersport, Budget Sport and<br />
Kesport stores were €305.8 million,<br />
up by 5.7%.<br />
In <strong>2009</strong>, new Intersport stores were<br />
opened in Ylöjärvi and in the Skanssi<br />
shopping centre, Turku. A new Budget<br />
Sport outlet was opened in Oulu, and the<br />
Budget Sport online store was launched to<br />
complement the network.<br />
Furniture trade – Indoor<br />
Indoor is a furniture and interior decoration<br />
retailer, which runs Asko and Sotka<br />
chains in Finland and the Baltic countries.<br />
There are a total of 83 stores in Finland,<br />
two in Latvia and seven in Estonia. In<br />
Finland, 56 of the stores are owned by<br />
Indoor, while 26 operate as a franchise.<br />
Asko provides quality- and brandconscious<br />
home decorators with an upto-date<br />
and competitive product range<br />
combined with the best service in the<br />
sector, ease of purchasing and delivery<br />
accuracy.<br />
Sotka offers consumers who value low<br />
prices with a competitive range combined<br />
with high delivery accuracy and quick and<br />
easy shopping.
24 Kesko’s year <strong>2009</strong><br />
International recognition for<br />
Kenkäkesko and Andiamo<br />
Kenkäkesko and Andiamo received<br />
international recognition and attention<br />
for The K.E.N.K.Ä 09 shoe design<br />
contest targeted for the young. They<br />
ranked fourth in the Retail/Direct<br />
Sales/Consumer category of the ECHO<br />
Awards, the direct marketing competition<br />
organised by DMA, and received<br />
the ECHO LEADER AWARD <strong>2009</strong>.<br />
Year <strong>2009</strong><br />
Indoor’s net sales totalled €155 million in<br />
<strong>2009</strong>, down 12.4%. The combined retail<br />
sales of the Asko and Sotka chains in<br />
Finland were €190 million, a decrease<br />
of 5.9%.<br />
In Finland, new Asko stores were<br />
opened in Lielahti, Tampere and in<br />
Savonlinna. The Sotka stores in Mäntsälä<br />
and Valkeakoski were closed. In Riga,<br />
Latvia, the Asko and Sotka stores located<br />
in the Alfa shopping centre were closed.<br />
Both of the chains implemented comprehensive<br />
training programmes developing<br />
sales and customer service skills of the<br />
whole staff. The chains’ cost-efficiency<br />
was enhanced and the efficiency of logistics<br />
was improved by concentrating all<br />
warehousing and terminal operations to<br />
an external operator.<br />
Home technology trade<br />
– Musta Pörssi<br />
The Musta Pörssi and Konebox chains provide<br />
home technology products and services.<br />
The Musta Pörssi chain of speciality<br />
stores offers its customers home technology<br />
products that make housework easier,<br />
enhance communications and provide<br />
entertainment. In addition, Musta Pörssi<br />
offers a comprehensive range of productrelated<br />
services and customers can choose<br />
to have the home technology installed so<br />
that it’s ready to use. The Musta Pörssi<br />
chain celebrated its 30th anniversary in<br />
<strong>2009</strong>.<br />
The chain consists of 53 stores specialising<br />
in home technology, of which 50 are<br />
owned by retailer entrepreneurs and<br />
three by Musta Pörssi Ltd.<br />
On the home technology market, the<br />
Konebox.fi online store competes with<br />
quality products, their good availability<br />
and low prices, and round-the-clock<br />
opening. The prices are based on efficient<br />
logistics and warehousing combined with<br />
the online store’s self-service.<br />
Year <strong>2009</strong><br />
The net sales of Musta Pörssi Ltd were<br />
€107 million, representing a decrease of<br />
12.5%. The combined retail sales of the<br />
Musta Pörssi and Konebox stores were<br />
€154 million and, a decrease of 15%<br />
from the previous year.<br />
Besides the decline in consumer<br />
demand, the decreasing sales can be<br />
attributed to the decrease in the average<br />
prices of consumer electronics and transferring<br />
company-owned stores under<br />
retailer ownership. In <strong>2009</strong>, new Musta<br />
Pörssi stores were opened in Lielahti,<br />
Tampere and in the Levi Centre, Kittilä.<br />
In addition, a new Konebox store was<br />
opened in Porttipuisto, Vantaa.<br />
Shoe trade – Kenkäkesko<br />
Kenkäkesko’s retail store chains are<br />
K-kenkä and Andiamo.<br />
K-kenkä is a shoe store for the whole<br />
family, offering its customers a wide<br />
selection of branded footwear and expert<br />
service.<br />
Andiamo’s main target group is trendy<br />
and fashion-conscious shoppers, for<br />
whom the store offers a fashionable<br />
selection of shoes that is constantly being<br />
updated.<br />
The K-Group’s speciality shoe outlets<br />
also include the Kenkäexpertti stores<br />
which operate in smaller towns.<br />
There are 55 chain stores in all: 35<br />
K-kenkä, 16 Andiamo and four combined<br />
Andiamo/K-kenkä stores. There are also<br />
34 Kenkäexpertti stores, which operate<br />
outside the chains.<br />
Year <strong>2009</strong><br />
The net sales of Kenkäkesko were €24<br />
million in <strong>2009</strong>, a decrease of 7.9%. The<br />
sales of the Andiamo and K-kenkä stores<br />
declined by 3.0%, and the combined<br />
sales of all of the K-Group’s speciality<br />
shoe stores amounted to €58.3 million.<br />
In <strong>2009</strong>, two new K-kenkä stores were<br />
opened, one in the Elo shopping centre,<br />
Ylöjärvi and one in the Skanssi shopping<br />
centre, Turku.
Market shares and competitors<br />
Hypermarket and department store<br />
trade<br />
K-citymarket, Anttila, Kodin Ykkönen and<br />
NetAnttila<br />
Market share cannot be reliably calculated<br />
Competitors: department stores, hypermarkets,<br />
speciality store chains and<br />
online stores<br />
Sports trade<br />
Intersport, Budget Sport and Kesport<br />
Market share 34% (own estimate)<br />
Competitors: Sportia, Top Sport, Stadium,<br />
department stores and hypermarkets, and<br />
other speciality sports stores<br />
Furniture trade<br />
Asko and Sotka<br />
Market share in Finland about 17%<br />
(own estimate)<br />
Competitors: furniture and interior decoration<br />
stores<br />
Home technology trade<br />
Musta Pörssi and Konebox<br />
Market share 9% (own estimate)<br />
Competitors: stores specialised in home<br />
technology, hypermarkets and online<br />
stores<br />
Shoe trade<br />
K-kenkä, Andiamo, Kenkäexpertti<br />
Market share 10.5% (Association of Textile<br />
and Footwear Importers and Wholesalers<br />
and own estimate)<br />
Competitors: other speciality stores,<br />
department stores, hypermarkets, sports<br />
stores and online stores<br />
Kesko’s year <strong>2009</strong><br />
K-Group’s home and speciality goods trade, retail and B2B sales<br />
Sales (incl. VAT),<br />
Number<br />
€ million<br />
25<br />
<strong>2009</strong> 2008 <strong>2009</strong> 2008<br />
Anttila department stores 31 30 370 393<br />
Kodin Ykkönen department stores for<br />
interior decoration and home goods*<br />
Distance sales<br />
10 9 161 181<br />
(mail order and NetAnttila)<br />
K-citymarket, home and speciality<br />
1 1 86 93<br />
goods 69 64 699 666<br />
Asko 33 32 91 94<br />
Sotka 50 52 99 109<br />
Intersport 57 57 243 233<br />
Budget Sport* 6 5 32 26<br />
Kesport 37 38 31 31<br />
Musta Pörssi 53 54 145 180<br />
Konebox* 3 2 10 3<br />
Shoe stores<br />
Home and speciality goods stores,<br />
89 94 58 62<br />
Finland 439 438 2,026 2,070<br />
Anttila, Baltic countries 2 2 11 17<br />
Indoor, Baltic countries<br />
Home and speciality goods stores,<br />
9 13 13 26<br />
Baltic countries 11 15 24 43<br />
Home and speciality goods trade, total<br />
* incl. online sales<br />
450 453 2,050 2,113<br />
Home and speciality goods segment’s key figures,<br />
continuing operations <strong>2009</strong> 2008<br />
Net sales € million 1,558 1,606<br />
Operating profit € million 66.5 63.6<br />
Operating profit excl. non-recurring items<br />
Operating profit as % of net sales<br />
€ million 29.5 31.2<br />
excl. non-recurring items % 1.9 1.9<br />
Investments<br />
Return on capital employed*<br />
€ million 29.6 60.5<br />
excl. non-recurring items % 5.8 6.2<br />
Personnel average<br />
* cumulative average<br />
5,666 5,801<br />
Home and speciality goods segment’s net sales,<br />
continuing operations € million change, %<br />
K-citymarket, home and speciality goods 595 5.1<br />
Anttila 513 -8.0<br />
Intersport 165 4.3<br />
Indoor 155 -12.4<br />
Musta Pörssi 107 -12.5<br />
Kenkäkesko 24 -7.9<br />
Total 1,558 -3.0<br />
Home and speciality goods segment’s capital employed<br />
at 31 December, € million <strong>2009</strong> 2008<br />
Non-current assets 304 345<br />
Inventories 223 257<br />
Short-term receivables 174 156<br />
./. Non-interest-bearing debt -260 -246<br />
./. Provisions -8 -7<br />
Capital employed**<br />
** capital employed at the end of month<br />
434 504
Rautakesko operates in the building and home improvement supplies trade<br />
in Finland, Sweden, Norway, the Baltic countries, Russia, and Belarus and the agricultural<br />
supplies trade in Finland. Rautakesko manages and develops its K-rauta,<br />
Rautia, K-maatalous, Byggmakker, Senukai and OMA retail chains and B2B sales in<br />
its operating area. Rautakesko is responsible for the chains’ concepts, marketing,<br />
sourcing and logistics services, store network, and retailer resources. There are<br />
330 building and home improvement stores in eight countries and 90 agricultural<br />
stores in Finland.<br />
Kesko’s brands in the building and home improvement trade<br />
Building and home<br />
improvement segment’s<br />
net sales<br />
€2,312 million<br />
Building and home<br />
improvement segment’s<br />
operating profit excluding nonrecurring<br />
items<br />
€11.9 million<br />
Building and home<br />
improvement trade
28 Kesko’s year <strong>2009</strong><br />
Products and<br />
services for<br />
building, interior<br />
decoration and<br />
agriculture<br />
The building and home<br />
improvement market<br />
Rautakesko aims to be the leading service<br />
provider in the building and home<br />
improvement trade. Rautakesko’s building<br />
and home improvement store chains<br />
K-rauta, Rautia, Byggmakker, Senukai and<br />
OMA serve both consumer and professional<br />
customers. Consumer customers<br />
mainly comprise home, leisure home and<br />
yard builders, renovators and interior<br />
decorators. Important professional customers<br />
include construction companies,<br />
the manufacturing industry and public<br />
institutions.<br />
In terms of its chains’ retail sales,<br />
Rautakesko is one of the five largest<br />
companies in the European building and<br />
home improvement market. The principal<br />
European competitors operating in<br />
Rautakesko’s market area are Castorama<br />
(Kingfisher Group), Leroy Merlin (Groupe<br />
Adeo), DT Group, Bauhaus, Hornbach and<br />
OBI. Rautakesko is a partner in tooMax-x,<br />
a purchasing alliance. Rautakesko’s partnership<br />
in tooMax-x made it the third<br />
largest European sourcing channel for<br />
home building and interior decoration<br />
items.<br />
The total retail market of this sector in<br />
Rautakesko’s operating area amounts to<br />
some €28 billion. It is estimated that the<br />
overall market change in the <strong>2009</strong> building<br />
and home improvement trade in the<br />
Baltic countries was -30%, in Norway<br />
-10%, in Sweden -5%, in Finland -15%,<br />
and in Russia -25%. The main reason for<br />
the decrease in demand has been the<br />
strong decline in the construction market,<br />
resulting from the recession.<br />
Retail sales of Rautakesko’s chains<br />
totalled €3,778 million (incl. VAT) in<br />
<strong>2009</strong>, a decrease of 18.0% from the<br />
previous year.<br />
In Finland, the retail market in the<br />
building and home improvement sector<br />
totals some €3.4 billion and declined by<br />
14.8% in <strong>2009</strong> (Finnish Hardware Association,<br />
DIY). The K-Group’s market share<br />
in this sector was some 38% (Finnish<br />
Hardware Association, DIY, own estimate).<br />
In Finland, Rautakesko operates the<br />
K-rauta and Rautia retail chains and Rautakesko<br />
B2B Sales which serves construction<br />
companies, the manufacturing<br />
industry and other professional customers.<br />
Rautakesko also provides services at<br />
33 customer contract stores operating<br />
outside the chains.<br />
The K-rauta chain consists of 42 stores,<br />
with some 70% of sales going to consumers.<br />
The Rautia chain consists of 107<br />
stores, 50 of which also operate as<br />
K-maatalous stores, engaged in the agricultural<br />
trade. The emphasis in the sales<br />
structure of Rautia is more on basic building<br />
products. All Finnish chain stores are<br />
run by retailer entrepreneurs.<br />
The combined sales of the K-rauta and<br />
Rautia chains, Rautakesko B2B Sales and<br />
K-customer contract stores in Finland<br />
were €1,417 million (incl. VAT), a decrease<br />
of 15.5%. The principal competitors in<br />
Finland are Starkki, Terra, S-rauta and<br />
Agrimarket, and Bauhaus.
In Sweden, the building and home<br />
improvement market totals some €3.8<br />
billion (SCB). In <strong>2009</strong>, the market declined<br />
by about 5% (SCB).<br />
At the end of <strong>2009</strong>, Rautakesko had 19<br />
K-rauta stores of its own and one retailerowned<br />
store in Sweden. Retail sales of<br />
K-rauta stores in Sweden totalled €235<br />
million (incl. VAT), a growth of 0.7%.<br />
Rautakesko’s market share is about 6%<br />
(own estimate).<br />
Private customers account for around<br />
85% of K-rauta clientele. Principal competitors<br />
are Bauhaus, Byggmax, DT Group,<br />
and local speciality stores.<br />
In Norway, the building and home<br />
improvement market totals some €4.7<br />
billion (TBF), down by about 10% in <strong>2009</strong><br />
(TBF).<br />
Byggmakker Norge AS, which is owned<br />
by Rautakesko, manages the Byggmakker<br />
chain of 113 building and home<br />
improvement stores, 15 of which are<br />
owned by Byggmakker. Other stores in the<br />
chain are owned by retailer entrepreneurs<br />
who have chain contracts with Byggmakker.<br />
Retail sales of the chain’s stores<br />
totalled €963 million (incl. VAT) in <strong>2009</strong>, a<br />
decrease of 13.8% from the previous year.<br />
Rautakesko’s market share in Norway is<br />
about 17% (TBF). More than half of all<br />
sales are to professional customers. Rautakesko’s<br />
competitors are Monter/Optimera<br />
(Saint Gobain), Maxbo and Coop.<br />
In Estonia, the building and home<br />
improvement market totals some €0.4<br />
billion (own estimate) and in <strong>2009</strong> the<br />
market decreased by 20% (own estimate).<br />
Rautakesko has nine building and home<br />
improvement stores in Estonia. Their retail<br />
sales totalled €76 million (incl. VAT) in<br />
<strong>2009</strong>, a decrease of 21.4%. Professional<br />
customers account for some 59% of all<br />
customers. Rautakesko’s market share in<br />
Estonia is about 20% (own estimate).<br />
Rautakesko’s competitors are Ehitus ABC<br />
(Saint Gobain), Bauhof and Espak.<br />
In Latvia, the building and home<br />
improvement market totals approximately<br />
€0.4 billion (CSB), a decrease of 30–40%<br />
in <strong>2009</strong> (CSB). Rautakesko has nine<br />
K-rauta stores of its own in Latvia. Retail<br />
sales of K-rauta stores totalled €61 million<br />
(incl. VAT) in <strong>2009</strong>, a decrease of<br />
30.3%. It is estimated that Rautakesko’s<br />
market share in Latvia is 16% (own estimate).<br />
Rautakesko’s competitors are Depo<br />
DIY and Kursi.<br />
In Lithuania, the building and home<br />
improvement market totals some €0.4<br />
billion (own estimate) and it decreased<br />
by 40–50% in <strong>2009</strong> (own estimate). In<br />
Lithuania, Rautakesko has the majority<br />
shareholding in UAB Senuku prekybos<br />
centras, which is the market leader in the<br />
Lithuanian building and home improvement<br />
sector with a share of about 25%.<br />
The Senukai chain, which sells to both<br />
consumers and business customers, comprises<br />
16 stores of its own, a logistics centre<br />
and 60 partner stores. Senukai’s retail<br />
sales totalled €311 million (incl. VAT) in<br />
<strong>2009</strong>, a decrease of 41.6%. Its competitors<br />
include local building supplies outlets<br />
and speciality stores.<br />
Kesko’s year <strong>2009</strong><br />
29<br />
Own brands<br />
continue to grow<br />
The strong development of Rautakesko’s<br />
own international brands<br />
continued. Cello, Prof, Fiorin and FXA<br />
offer a reliable and affordable solution<br />
for the building and renovation<br />
needs of both consumer and professional<br />
customers. Major launches in<br />
<strong>2009</strong> included Cello exterior paints<br />
and Cello storage systems.<br />
In 2010 own brands will focus on<br />
improving the efficiency of selections<br />
and increasing international coverage.<br />
The web service of the Cello<br />
brand will be enhanced to make<br />
a channel which serves customers<br />
better.
30 Kesko’s year <strong>2009</strong><br />
Through its cooperation with tooMax-x,<br />
Rautakesko also participates in the<br />
charity work carried out by Eurogroup.<br />
In <strong>2009</strong>, a school for over one thousand<br />
pupils, built as a cooperation<br />
project, was opened in Southern<br />
China. The Eurogroup organisation<br />
also provides training and consultation<br />
to various operators and carries<br />
out audits on factories in the Far East.<br />
Rautakesko adopted a policy on<br />
ensuring origin and traceability of<br />
timber and wood products in October<br />
<strong>2009</strong>. Rautakesko accepts the FSC and<br />
PEFC certification systems and is committed<br />
to the principles of responsible<br />
sourcing. Rautakesko’s aim is to<br />
always ensure origin and traceability<br />
of the timber and wood products purchased<br />
and sold by the company.<br />
In Russia, the building and home<br />
improvement market totals some €14 billion<br />
(own estimate), a decrease of about<br />
25% in <strong>2009</strong> (Ros Business Consulting<br />
and own estimate). There are 10 K-rauta<br />
stores in Russia and their retail sales<br />
totalled €200 million (incl. VAT) in <strong>2009</strong>,<br />
a decrease of 16%. Rautakesko’s market<br />
share in Russia is about 2.0% (own estimate).<br />
Rautakesko’s competitors are Leroy<br />
Merlin, OBI, Castorama, Maxidom and<br />
Metrica.<br />
In Belarus, the building and home<br />
improvement market totals some €1.0<br />
billion (own estimate). OMA, the company<br />
acquired by Senukai in Belarus in July<br />
2007, has four stores. Their retail sales<br />
amounted to €62 million (incl. VAT) in<br />
<strong>2009</strong>, representing a decrease of 26.6%.<br />
The market share of OMA is about 5% of<br />
the total market (own estimate).<br />
Agricultural trade market<br />
Kesko Agro Ltd’s business operations were<br />
reorganised at the beginning of <strong>2009</strong>. The<br />
K-maatalous chain and the agricultural<br />
trade (agricultural implements, inputs<br />
and supplies, and the seed and grain<br />
trade) were transferred to Rautakesko,<br />
while the tractor and combine harvester<br />
business and Kesko Agro subsidiaries in<br />
the Baltic countries were transferred to<br />
the car and machinery trade.<br />
In Finland, 90 K-maatalous agricultural<br />
stores form the K-maatalous chain.<br />
52 of the stores in the chain are combined<br />
Rautia K-maatalous or K-rauta<br />
K-maatalous stores. Major customer<br />
groups are agricultural entrepreneurs and<br />
contractors. K-maatalous provides agricultural<br />
entrepreneurs with solutions that<br />
help them efficiently produce the safe<br />
and pure foodstuffs that are valued by<br />
consumers.<br />
In <strong>2009</strong>, the net sales in the agricultural<br />
trade, which was transferred to Rautakesko,<br />
dropped by 32.6% in Finland.<br />
The reasons for this decline were the economic<br />
recession and a decrease in prices.<br />
Strong chain concepts<br />
Rautakesko’s operations are based on<br />
strong chain concepts, efficient sourcing,<br />
and the best practices, which are dupli-<br />
cated internationally. Rautakesko operates<br />
in the background of the chains, combining<br />
their category management, purchasing,<br />
logistics, information system control<br />
and network improvements. The synergy<br />
benefits and economies of scale achieved<br />
enable the company to offer products and<br />
services to customers at competitive<br />
prices.<br />
K-rauta is Rautakesko’s international<br />
concept. K-rauta operates in Finland,<br />
Sweden, Estonia, Latvia and Russia. The<br />
K-rauta concept focuses on wide selections,<br />
total solutions that make customers’<br />
lives easier and a good price-quality<br />
ratio. The concept combines the service,<br />
selections and business models for consumers,<br />
builders and professional customers.<br />
Overall, the K-rauta chain’s competitive<br />
advantages include stores and<br />
attached builders’ yards that are larger<br />
than those of its competitors.<br />
Rautia is the largest building and<br />
home improvement store chain in Finland.<br />
Its selections are targeted at builders,<br />
renovators and building professionals<br />
in particular. Key competitive advantages<br />
include comprehensive customer service,<br />
knowledge of the local market and the<br />
cooperation network. Many Rautia stores<br />
also complement their range with agricultural<br />
items.<br />
The K-maatalous chain’s strengths in<br />
Finland include the K-maatalous retailers,<br />
who know the local customers and circumstances,<br />
and the wide product range<br />
combined with the comprehensive services<br />
and network. Active contacts and<br />
sales and the utilisation of data and<br />
information technology provide the basis<br />
for close cooperation between agricultural<br />
entrepreneurs and K-maatalous.<br />
Byggmakker is the largest building<br />
and home improvement store chain in<br />
Norway. The chain’s business model is<br />
retailer entrepreneurship. Special<br />
strengths include sales of building supplies<br />
and knowledge of professional<br />
customers. The Norwegian concept has<br />
undergone a reform with the introduction<br />
of large Byggmakker outlets of a new type<br />
providing full service.<br />
The Senukai chain is the market leader<br />
in Lithuania. The chain incorporates the
Mega Store concept, which offers customers<br />
just about every product related to<br />
building and living at its stores of over<br />
20,000 m 2 .<br />
Rautakesko B2B Sales operates in<br />
Finland. Its customers include nationwide<br />
construction companies, the manufacturing<br />
industry and other professional customers.<br />
Rautakesko B2B Sales’ strengths<br />
include close cooperation with the network<br />
of Finnish K-rauta and Rautia stores<br />
through which a significant part of the<br />
deliveries are made.<br />
Year <strong>2009</strong><br />
Rautakesko’s net sales totalled €2,312<br />
million, representing a decrease of<br />
22.4%. Net sales in Finland amounted to<br />
€1,041 million, down by 21.1%. The<br />
building and home improvement trade<br />
contributed €744 million, and the agricultural<br />
supplies trade €297 million to the<br />
net sales in Finland. The net sales of subsidiaries<br />
in other countries totalled<br />
€1,271 million; the decrease was 23.4%.<br />
Foreign subsidiaries accounted for 55.0%<br />
of Rautakesko’s net sales.<br />
Rautakesko’s operating profit excluding<br />
non-recurring items was €11.9 million,<br />
down by €44.4 million. Rautakesko’s<br />
investments totalled €84.7 million, with<br />
investments outside Finland accounting<br />
for 82.8%.<br />
In <strong>2009</strong>, two new K-rauta stores were<br />
opened in Sweden and one in Russia,<br />
Estonia and Latvia. In addition, the store<br />
site network was strengthened by other<br />
new and replacement stores. During the<br />
year, one K-rauta was closed down in<br />
Sweden and seven Byggmakker stores,<br />
five of which run by retailers, were closed<br />
down in Norway.<br />
In <strong>2009</strong>, Rautakesko continued to seek<br />
synergy and efficiency benefits in order to<br />
develop its international operations. Rautakesko<br />
made a cooperation agreement<br />
with tooMax-x Handels GmbH. The purchasing<br />
cooperation ensures an increasingly<br />
comprehensive and competitivelypriced<br />
selection of products for customers.<br />
Major focal areas of the year included<br />
centralised category management and<br />
supply chain management. The product<br />
lines are responsible for the centralised<br />
formation of joint selections in all countries.<br />
The construction of the international<br />
logistics network continued. A service<br />
agreement for central warehousing operations<br />
in Norway and Sweden was signed<br />
with Itella, Rautakesko’s logistics partner.<br />
The structure of the K-rauta concept’s<br />
displays was revised. Customer visits and<br />
shopping are made easier by presenting<br />
different styles and price options clearly<br />
and together. The K-rauta chain is piloting<br />
the new design and service area business<br />
model at K-rauta Vantaanportti.<br />
The service structure of the Rautia concept<br />
was clarified by increasing product<br />
and usage information to help customers.<br />
The competence of Rautakesko staff<br />
was enhanced in <strong>2009</strong> with the help of a<br />
retail management training programme.<br />
The aim is to create a coherent strategic<br />
retail way of thinking and to ensure that<br />
best practices are shared.<br />
Master Training for retail store staff<br />
in the SMS project (Store Management<br />
System) was started in Estonia, Latvia,<br />
Norway and Sweden.<br />
Objectives and strategic focuses<br />
Rautakesko’s aims include exceeding the<br />
market growth in 2010.<br />
The recession will continue to be<br />
clearly felt in the building and home<br />
improvement trade. Demand in the<br />
building repair and interior decoration<br />
business is expected to remain at a good<br />
level, and sales of yard and gardening<br />
items will clearly increase. Demand for<br />
various services, such as design, transportation<br />
and installation is anticipated to<br />
further increase as customers are pressed<br />
for time and want tailored solutions.<br />
Customer purchasing behaviour and<br />
consumption habits are becoming more<br />
and more varied. The importance of<br />
energy efficiency, environmental values<br />
and responsibility in consumers’ decision-making<br />
will increase. Besides traditional<br />
shopping in physical stores, the use<br />
of the internet as a channel providing<br />
information and shopping sites will be<br />
emphasised. New international service<br />
providers will enter the market and new<br />
business models will arise.<br />
Kesko’s year <strong>2009</strong><br />
31<br />
Safe and clean foodstuffs<br />
efficiently<br />
The K-maatalous Experimental Farm<br />
in Hauho does pioneering research<br />
and development work for agriculture<br />
by testing plant varieties, fertilisation<br />
and protection. The cultivation programme<br />
of K-maatalous includes<br />
guidelines on the choice of seed, on<br />
fertilisation, on plant protection and<br />
liming.
32 Kesko’s year <strong>2009</strong><br />
Responsibility is part of the selected strategy<br />
Rautakesko’s chains aim to promote<br />
energy-efficient and healthy living. In the<br />
future, energy-efficiency, environmental<br />
values and responsibility will have a<br />
higher impact on both private and public<br />
decision-making.<br />
The K-environmental store system was<br />
incorporated into the business concept in<br />
all Finnish chain stores. The focus of<br />
K-environmental stores, among other<br />
things, is on environmentally-friendly<br />
product selections and product labelling,<br />
on recycling and preventing the generation<br />
of waste at the stores, on store<br />
energy-use management and cleaning<br />
practices.<br />
The new K-rauta store concept focuses<br />
on interior decoration and gardening.<br />
Product groups and categories are presented<br />
in a centralised display area close<br />
to desks providing service and design<br />
assistance. More comprehensive product<br />
information and signage facilitate selfservice.<br />
In the Rautia chain, special emphases<br />
will include the ‘home yard’ concept and<br />
sales of houses.<br />
In the agricultural trade, the aim is to<br />
develop the K-maatalous concept and<br />
improve market position to meet customer<br />
expectations. Objectives include the<br />
most active sales and the best total selection<br />
of products and services in the agricultural<br />
trade, including the K-maatalous<br />
cultivation programme.<br />
The store network will be strengthened.<br />
In 2010, one new K-rauta will be<br />
opened in Finland, two new stores in<br />
The Rautia chain’s heat renovation<br />
truck presented economical heating systems<br />
and energy-efficient solutions for<br />
renovation and building, while also<br />
encouraging customers to reduce their<br />
household-related burden on the environment.<br />
The K-rauta stores’ nationwide campaign<br />
on energy-saving bulbs helped<br />
customers choose more energy-efficient<br />
and responsible lighting solutions.<br />
Rautakesko participates in a project<br />
financed by Sitra, the Finnish Innovation<br />
Fund, and lead by Demos Helsinki, which<br />
supports people in their everyday energy<br />
choices.<br />
Russia and one in Belarus. A new K-rauta<br />
will also be opened in Sweden.<br />
The Best Practise Retail Solution,<br />
Rautakesko’s most important project that<br />
aims to achieve uniform business models,<br />
will continue. The project will harmonise<br />
the business models and retail information<br />
systems in the countries where<br />
Rautakesko operates.<br />
Enhancement of electronic customer<br />
information will continue in 2010. The<br />
aim is to launch the chains’ new websites,<br />
first in Finland and later in other<br />
countries.<br />
International cooperation concerning<br />
product lines will intensify. Rautakesko’s<br />
international logistics network with Itella<br />
Logistics will expand.<br />
The target is that by the end of 2010<br />
all purchases from the Far East will be<br />
made via tooMax-x sourcing cooperation.
Market shares and competitors<br />
Building and home improvement trade<br />
Finland, market share 38%<br />
(Finnish Hardware Association, DIY, own<br />
estimate)<br />
Competitors: Starkki, Terra, S-rauta,<br />
Agrimarket, Bauhaus<br />
Sweden, market share 6%<br />
(HUI, own estimate)<br />
Competitors: Bauhaus, Byggmax, DT Group<br />
and local speciality stores<br />
Norway, market share 17% (TBF)<br />
Competitors: Monter/Optimera<br />
(Saint Gobain), Maxbo and Coop<br />
Estonia, market share 20%<br />
(own estimate)<br />
Competitors: Ehitus ABC (Saint Gobain),<br />
Bauhof and Espak<br />
Latvia, market share 16% (own estimate)<br />
Competitors: Depo DIY, Tapeks/Aile and<br />
Kursi<br />
Lithuania, market share 25%<br />
(own estimate)<br />
Competitors: local building supplies and<br />
speciality stores<br />
Russia, market share 2.0%<br />
(ROS Business Consulting, own estimate)<br />
Competitors: Leroy Merlin, OBI, Castorama,<br />
Maxidom, Metrica<br />
Belarus, market share 5% (own estimate)<br />
Agricultural trade<br />
Finland, K-maatalous chain<br />
Main competitor: Agrimarket chain<br />
Kesko’s year <strong>2009</strong><br />
K-Group’s building and home improvement trade, retail and B2B sales<br />
Sales (incl. VAT)<br />
Number<br />
€ million<br />
33<br />
<strong>2009</strong> 2008 <strong>2009</strong> 2008<br />
K-rauta* 42 42 617 669<br />
Rautia* 107 102 541 556<br />
Rautakesko B2B Sales 197 279<br />
K-maatalous* 90 91 448 629<br />
K-customer contract stores 33 34 68 72<br />
Finland, total 272 269 1,865 2,206<br />
K-rauta, Sweden 20 19 235 233<br />
Byggmakker, Norway 113 118 963 1,118<br />
Building and home improvement<br />
stores, other Nordic countries total 133 137 1,198 1,351<br />
K-rautakesko, Estonia 9 8 76 96<br />
K-rauta, Latvia 9 8 61 87<br />
Senukai, Lithuania<br />
Building and home improvement<br />
16 16 311 532<br />
stores, Baltic countries total 34 32 447 715<br />
K-rauta, Russia 10 9 200 240<br />
OMA, Belarus<br />
Building and home improvement<br />
4 3 62 84<br />
stores, other countries total 14 12 262 324<br />
Building and home improvement<br />
trade, outside Finland total<br />
Building and home improvement<br />
181 181 1,907 2,391<br />
trade, total 453 450 3,778 4,597<br />
* In <strong>2009</strong>, 2 K-rauta stores and 50 Rautia stores also operated as K-maatalous stores<br />
* In 2008, 2 K-rauta stores and 47 Rautia stores also operated as K-maatalous stores<br />
Building and home improvement segment’s<br />
key figures, continuing operations <strong>2009</strong> 2008<br />
Net sales € million 2,312 2,978<br />
Operating profit € million 19.6 19.4<br />
Operating profit excl. non-recurring items € million 11.9 56.4<br />
Operating profit as % of net sales excl. non-recurring items % 0.5 1.9<br />
Investments € million 84.7 122.7<br />
Return on capital employed* excl. non-recurring items % 1.8 9.0<br />
Personnel average<br />
* cumulative average<br />
8,789 10,400<br />
Building and home improvement segment’s net sales,<br />
continuing operations € million change, %<br />
Building and home improvement trade, Finland 1,041 -21.1<br />
K-rauta AB, Sweden 187 0.6<br />
Byggmakker, Norway 477 -16.4<br />
Rautakesko, Estonia 63 -22.1<br />
Rautakesko, Latvia 48 -32.9<br />
Senukai (excl. OMA) 260 -42.1<br />
OMA 53 -25.5<br />
Stroymaster Group, Russia 169 -16.8<br />
Total<br />
(..) change over 100%<br />
Building and home improvement segment’s<br />
2,312 -22.4<br />
capital employed at 31 December, € million <strong>2009</strong> 2008<br />
Non-current assets 494 459<br />
Inventories 196 273<br />
Short-term receivables 222 220<br />
./. Non-interest-bearing debt -284 -299<br />
./. Provisions -4 -5<br />
Capital employed**<br />
** capital employed at the end of month<br />
624 649
VV-Auto and Konekesko make up the car and machinery trade division.<br />
VV-Auto imports and markets Volkswagen, Audi and Seat passenger cars, and<br />
Volkswagen commercial vehicles in Finland, and it also imports and markets Seat<br />
passenger cars in Estonia and Latvia. VV-Auto is also engaged in car retailing and<br />
provides after-sales services at its own outlets in the Greater Helsinki area and Turku.<br />
Konekesko is a service company specialising in the import and sales of construction,<br />
environmental and agricultural machinery, trucks and buses, and recreational<br />
machinery. Konekesko operates in Finland, the Baltic countries and Russia.<br />
Konekesko arranges the manufacture of and sells Yamarin boats in Finland and<br />
exports them to several European countries and Russia.<br />
Kesko’s most important brands in the car and machinery trade<br />
Car and machinery segment’s<br />
net sales<br />
€947 million<br />
Car and machinery segment’s<br />
operating profit excluding nonrecurring<br />
items<br />
€0.3 million<br />
Car and<br />
machinery trade
36 Kesko’s year <strong>2009</strong><br />
Leading<br />
brands and<br />
comprehensive<br />
services<br />
VV-Auto’s market<br />
In <strong>2009</strong>, 90,574 passenger cars, 8,677<br />
vans and 3,173 trucks were registered in<br />
Finland. The passenger car market<br />
decreased by 35.2% from the previous<br />
year. Registrations of new vans fell short<br />
of the previous year by 44.1% and those<br />
of trucks by 39.1%.<br />
The market position of the brands<br />
imported by VV-Auto strengthened.<br />
Volkswagen increased its market share<br />
and was in second place in the registration<br />
statistics of both passenger cars and<br />
vans. Audi maintained its position as the<br />
number one premium brand. Seat’s market<br />
share decreased slightly over the previous<br />
year. The car taxation that is based<br />
on carbon dioxide emissions increased<br />
the share of passenger cars with lower<br />
emissions and the popularity of TSI, TFSI<br />
and TDI motors which place less of a burden<br />
on the environment.<br />
The Volkswagen range continued to<br />
expand. Launches included the revised<br />
Golf Plus, the new Polo and Golf Variant.<br />
The range of EcoFuel natural gas vehicles<br />
was complemented with the Passat Variant,<br />
Touran and Caddy Maxi. The revised<br />
Transporter range was introduced in late<br />
<strong>2009</strong>. The Audi range was complemented<br />
with the new Audi A5 Sportback and<br />
Cabriolet. Seat arrivals of the year were<br />
the Seat Exeo and Exeo ST and the revised<br />
Altea, Altea XL, Leon and Ibiza SC.<br />
In <strong>2009</strong>, the market share of Volkswagen<br />
passenger cars in Finland was 12.6%<br />
and the Volkswagen Golf was the bestselling<br />
passenger car in the country. The<br />
market share of Volkswagen vans was<br />
20.9%. Audi had a market share of 4.7%<br />
and Seat’s share was 1.0%. Seat’s market<br />
share in Estonia was 1.0% and in Latvia<br />
0.5%.<br />
Konekesko’s market in Finland,<br />
the Baltic countries and Russia<br />
Konekesko’s sales of recreational machinery<br />
are based on close and long-term<br />
cooperation with Yamaha Motor Co. Quality-minded<br />
customers are served by the<br />
comprehensive Yamaha dealer network.<br />
The Finnish market for recreational<br />
machinery totalled some €300 million in<br />
<strong>2009</strong>.<br />
In addition to farmers, Konekesko’s<br />
most important customer groups in heavy<br />
machinery include construction, materials<br />
handling, transportation and service sector<br />
companies, and towns and municipalities.<br />
Construction and environmental<br />
machinery is marketed in Finland, the<br />
Baltic countries and St. Petersburg<br />
through Konekesko’s own dealer network.<br />
The construction market declined considerably<br />
in <strong>2009</strong>, amounting to about €200<br />
million in Finland, about €50 million in<br />
the Baltic countries and about €50 million<br />
in St. Petersburg, Russia.<br />
Konekesko sells tractors, combines and<br />
their spare parts to farmers in Finland<br />
and the Baltic countries. In the latter,<br />
Konekesko also sells agricultural implements.<br />
The best-known product brands<br />
represented by Konekesko include Massey<br />
Ferguson tractors and Claas combines. The
market for agricultural machinery in<br />
Finland is some €400 million and in the<br />
Baltic countries some €200 million.<br />
In Finland, Konekesko sells MAN trucks,<br />
and MAN and Neoplan buses through its<br />
own dealer network. The market for trucks<br />
(weight class of over 6 tons) is approximately<br />
€300 million. 146 MAN trucks and<br />
14 buses were registered in <strong>2009</strong>.<br />
Strengths<br />
At the beginning of <strong>2009</strong>, VV-Auto and<br />
Konekesko were combined and reorganised<br />
to form the car and machinery trade<br />
division. The new division structure aims<br />
at synergy benefits and the development<br />
of sales and maintenance services.<br />
VV-Auto and Konekesko represent the<br />
leading brands in their market area and<br />
are responsible for the marketing and<br />
sales of these brands. They also offer<br />
diversified after-sales services to their<br />
customers either through their own or a<br />
contract service network.<br />
Strengths also include the wide product<br />
selection, high-quality products and<br />
services, a comprehensive network in<br />
several countries, efficient operating<br />
methods, skilled and service-oriented<br />
staff, and its own chain of retail outlets<br />
in the car trade.<br />
Year <strong>2009</strong><br />
In <strong>2009</strong>, the net sales of the segment<br />
were €947 million, a decrease of 36.0%.<br />
The operating loss excluding non-recurring<br />
items was €0.3 million, €30.1 million<br />
less than in the previous year.<br />
VV-Auto’s net sales were €598 million,<br />
a decrease of 32.3% from the previous<br />
year. The net sales performance was<br />
affected by a decline in the car market,<br />
coupled with the car tax reform effective<br />
since April, as a result of which the car tax<br />
levied on cars after 1 April <strong>2009</strong> is<br />
excluded from the net sales. Taking the<br />
impact of the tax change into account,<br />
comparable net sales fell by 24.3%.<br />
In terms of vehicle numbers, VV-Auto’s<br />
own outlets in the Greater Helsinki area<br />
and Turku accounted for about one third<br />
of all new Volkswagen, Audi and Seat<br />
retail sales.<br />
VV-Auto’s retail sales network consists<br />
of 40 dealer shops selling Volkswagens<br />
and 59 service workshops, and 41 dealer<br />
shops and 58 service workshops for<br />
Volkswagen commercial vehicles. The corresponding<br />
figures for Audis are 17 and<br />
39. Seats are sold by 23 dealers and<br />
maintained and repaired by 40 workshops<br />
in Finland and three in the Baltic<br />
countries.<br />
A centralised customer relationship<br />
management system was adopted at all<br />
VV-Auto’s own outlets. The construction of<br />
VV-Auto’s new office building started in<br />
Veromies, Vantaa. The building will also<br />
include a new Audi outlet with a service<br />
workshop, maintenance and warehousing<br />
premises. The Volkswagen outlet and<br />
workshop located on the adjacent site will<br />
also be renovated and expanded during<br />
the process.<br />
Konekesko’s net sales were €350 million,<br />
down by 41.3% from the previous<br />
Kesko’s year <strong>2009</strong><br />
37<br />
BlueMotion<br />
The Volkswagen cars with the best fuel<br />
economy in their size category can be<br />
identified by their BlueMotion badge.<br />
The Polo BlueMotion is the most economical<br />
five-seater in the world:<br />
combined consumption 3.3 l per<br />
100 km and CO 2 emissions 87 g per km.
38 Kesko’s year <strong>2009</strong><br />
Yamaha in Finland<br />
In <strong>2009</strong>, Yamaha also became<br />
the market leader in motorcycles in<br />
Finland. Yamaha has been the leader<br />
in the Finnish outboard motor market<br />
since 1977.<br />
year. This can be attributed to the decline<br />
in the machinery market and a decrease<br />
in the Baltic grain and agricultural inputs<br />
trade.<br />
As the general economic situation<br />
deteriorated, the average sales of recreational<br />
machinery in Finland declined by<br />
about 30%. Sales of boats also dropped<br />
considerably from the previous year in the<br />
most important export markets (Norway,<br />
Sweden). Konekesko started importing<br />
and selling Linder boats in December<br />
<strong>2009</strong>.<br />
The Finnish and the Baltic market for<br />
construction and environmental machinery<br />
declined to less than half of the previous<br />
year, but Konekesko’s market position<br />
strengthened. Konekesko returned to the<br />
warehousing technology business with<br />
Still forklifts and BITO storage systems and<br />
started the imports and sales of Dynapac<br />
compaction and paving machines in the<br />
Baltic countries.<br />
The market for agricultural machinery<br />
dropped by about 30% in Finland and by<br />
some 50% in the Baltic countries.<br />
Konekesko’s market share of combines<br />
increased to 26.3%, but in the tractor<br />
trade the market share dropped to<br />
14.0%.<br />
In Finland, sales of MAN trucks<br />
declined more than the market, and the<br />
market share was 5.7%.<br />
Objectives and strategic<br />
emphases<br />
The segment’s objectives for 2010 include<br />
increasing the market share of the brands<br />
it represents, further developing the<br />
dealer network and improving profitability.<br />
The focuses will be expanding the<br />
selection of products and services and<br />
improving electronic customer communications.<br />
The car trade will continue to<br />
focus on the development of its own<br />
chain of retail outlets and expanding the<br />
adoption of the centralised customer<br />
management system. In line with its<br />
strategy, Konekesko will also concentrate<br />
on the machinery trade and dispose of its<br />
grain and agricultural imputs trade in the<br />
Baltic countries.
Market shares<br />
VV-Auto<br />
Finland:<br />
Volkswagen passenger cars 12.6%<br />
Audi passenger cars 4.7%<br />
Seat passenger cars 1.0%<br />
Volkswagen vans 20.9%<br />
(Transport Safety Agency TraFi, Vehicular<br />
and Driver Data Register)<br />
Estonia:<br />
Seat passenger cars 1.0%<br />
Latvia:<br />
Seat passenger cars 0.5%<br />
(Estonian and Latvian car dealers<br />
associations)<br />
Konekesko<br />
Finland: market share 6–41%, depending<br />
on product group (own estimate)<br />
Estonia: market share 20%<br />
(own estimate)<br />
Lithuania: market share 20%<br />
(own estimate)<br />
Latvia: market share 30% (own estimate)<br />
K-Group’s car and machinery trade, retail and B2B sales<br />
Number<br />
Kesko’s year <strong>2009</strong><br />
Sales (incl. VAT)<br />
€ million<br />
39<br />
<strong>2009</strong> 2008 <strong>2009</strong> 2008<br />
VV-Auto, retail outlets 6 6 374 489<br />
VV-Auto, imports 1 1 372 605<br />
Konekesko, Finland 2 1 230 351<br />
Finland, total 9 8 977 1,445<br />
Konekesko, Estonia 38 69<br />
Konekesko Latvia 102 152<br />
Konekesko, Lithuania 35 55<br />
Konekesko, Baltic countries 175 276<br />
Car and machinery trade, total 9 8 1,152 1,721<br />
Car and machinery segment’s key figures, continuing<br />
operations <strong>2009</strong> 2008<br />
Net sales € million 947 1,480<br />
Operating profit € million -5.1 30.5<br />
Operating profit excl. non-recurring items<br />
Operating profit as % of net sales<br />
€ million 0.3 30.4<br />
excl. non-recurring items % 0.0 2.1<br />
Investments<br />
Return on capital employed*<br />
€ million 13.4 15.6<br />
excl. non-recurring items % 0.1 10.8<br />
Personnel average<br />
* cumulative average<br />
1,291 1,451<br />
Car and machinery segment’s net sales, continuing<br />
operations € million change, %<br />
VV-Auto Group 598 -32.3<br />
Konekesko, Finland 185 -31.9<br />
Konekesko, Baltic countries 165 -49.3<br />
Total 947 -36.0<br />
Car and machinery segment’s capital employed<br />
at 31 December, € million <strong>2009</strong> 2008<br />
Non-current assets 96 99<br />
Inventories 157 255<br />
Short-term receivables 67 89<br />
./. Non-interest-bearing debt -83 -127<br />
./. Provisions -15 -15<br />
Capital employed**<br />
** capital employed at the end of month<br />
222 302
40 Kesko’s year <strong>2009</strong><br />
Real estate<br />
operations<br />
A store site network is a strategic competitive<br />
factor for Kesko. It provides<br />
opportunities for developing business<br />
operations and increasing sales and<br />
customer satisfaction.<br />
The Kesko’s division parent companies are<br />
responsible for their own store sites<br />
throughout their life cycles. The companies<br />
plan their own retail networks and,<br />
on the basis of their network and business<br />
plans, make the investments in<br />
accordance with the Group’s real estate<br />
strategy. The division parent companies<br />
develop their own store sites, manage<br />
their construction, and are responsible<br />
for maintaining, managing, leasing and<br />
selling them.<br />
Real estate property<br />
management<br />
For the management of Kesko’s real estate<br />
assets and liabilities, the retail stores and<br />
other real estate properties are classified<br />
as follows:<br />
• Strategic properties are large retail<br />
stores which involve important<br />
business interests related to the<br />
continuity of management, the<br />
flexibility of change and the financial<br />
value of the premises. In order to<br />
protect such interests, Kesko usually<br />
prefers to own these properties.<br />
• Standard properties are premises<br />
owned by the Kesko Group. They can<br />
be sold and leased back for use in the<br />
Group’s business operations.<br />
• Realisation properties are those for<br />
which Kesko has no further use.<br />
• Development properties are those<br />
needing further development for their<br />
intended use.<br />
Investments<br />
Kesko’s real estate investments aim to<br />
enable the creation of trading services<br />
valued by customers by anticipating<br />
changes in customer behaviour and the<br />
operating environment and by maintaining<br />
the technical condition of properties.<br />
Kesko invests only in properties<br />
needed in its own business operations. As<br />
a result of Kesko’s internationalisation,<br />
investments outside Finland have become<br />
increasingly important.<br />
Life-cycle affordable and ecoefficient<br />
real estate operations<br />
Kesko’s construction activity is based on<br />
life-cycle affordability and eco-efficiency.<br />
This means optimising the costs and environmental<br />
burden across the entire life<br />
cycle of a store site.<br />
The aim is to build business premises<br />
with the lowest life-cycle costs in the<br />
trading sector.<br />
Further development of the eco-efficiency<br />
of existing properties has focused<br />
on monitoring energy consumption and<br />
improving energy use. The aim is to<br />
reduce both consumption and costs.<br />
Property maintenance<br />
Property maintenance relies on systematisation<br />
and proactivity. Repair work is<br />
scheduled to coincide with the rebuilding<br />
necessitated by business operations.<br />
The management and maintenance of<br />
properties owned or leased by Kesko has<br />
been outsourced to ISS Palvelut Oy, Ovenia<br />
Oy and YIT Kiinteistötekniikka Oy, which<br />
carry out the work in accordance with<br />
Kesko’s requirements. Kestra Kiinteistöpalvelut<br />
Oy, owned by Kesko, is<br />
responsible for purchasing electricity for<br />
the K-Group.<br />
Kesko’s energy team monitors<br />
energy consumption of<br />
properties<br />
The emissions generated in the production<br />
of electrical and heat energy for<br />
properties account for a significant share<br />
of the K-Group’s environmental impact.<br />
Therefore the K-Group’s environmental<br />
policy obliges Kesko’s real estate operations,<br />
in cooperation with its business<br />
partners, to develop solutions related to<br />
the building, repairs, concept changes,<br />
maintenance and use of real estate properties<br />
that reduce the consumption of<br />
materials and energy during the life cycle<br />
of these properties.<br />
The electricity, heat and water consumption<br />
of Kesko’s properties has been<br />
monitored closely since 1995. The managers<br />
responsible for property care and<br />
maintenance report about deviations in<br />
consumption to the energy team of the<br />
real estate operations. Reasons for deviations<br />
are investigated and corrective<br />
actions are taken immediately. Close<br />
energy monitoring helps keep the technical<br />
systems of properties in order and<br />
maintain the value of properties.
Real estate operations<br />
indicators for <strong>2009</strong><br />
Kesko’s year <strong>2009</strong><br />
Owned properties<br />
Capital*, € million <strong>2009</strong> 2008<br />
Finland 656 776<br />
Other Nordic countries 70 57<br />
Baltic countries 32 41<br />
Russia 112 77<br />
Total 870 951<br />
Area, m 2 <strong>2009</strong> 2008<br />
Finland 629,000 756,000<br />
Other Nordic countries 80,000 62,000<br />
Baltic countries 103,000 103,000<br />
Russia 46,000 34,000<br />
Total 858,000 955,000<br />
Leased properties<br />
Lease liabilities, € million <strong>2009</strong> 2008<br />
Finland 2,036 1,767<br />
Other Nordic countries 118 110<br />
Baltic countries 171 183<br />
Russia 32 45<br />
Total 2,357 2,105<br />
Area, m 2 <strong>2009</strong> 2008<br />
Finland 2,358,000 2,191,000<br />
Other Nordic countries 202,000 205,000<br />
Baltic countries 429,000 431,000<br />
Russia 25,000 25,000<br />
Total 3,014,000 2,852,000<br />
*Carrying amounts<br />
Breakdown of owned properties <strong>2009</strong><br />
Strategic properties 77%<br />
Standard properties 17%<br />
Realisation properties 0%<br />
Development properties 6%<br />
Breakdown of owned properties 2008<br />
Strategic properties 79%<br />
Standard properties 15%<br />
Realisation properties 0%<br />
Development properties 6%<br />
41
Kesko and the K-stores offer motivating and rewarding jobs with products and services<br />
valued by customers. Kesko is a good and responsible working community<br />
where employees are treated equally and fairly.<br />
At the end of <strong>2009</strong>, the total number of Kesko personnel was 22,220 in eight<br />
different countries. Kesko’s most international division is Rautakesko, with 95.6% of<br />
its 8,789 employees working outside Finland. In all, Kesko and its chains’ retailer<br />
entrepreneurs employ some 45,000 people. Kesko’s strengths include providing an<br />
opportunity for versatile internal job rotation and career development. During <strong>2009</strong>,<br />
some 2,000 people moved to new jobs within the Kesko Group.<br />
Kesko personnel, average Personnel in Finland<br />
19,184 employees 10,284 employees<br />
Personnel in other countries<br />
8,900 employees<br />
Total personnel of Kesko and<br />
retailer entrepreneurs<br />
some 45,000 employees<br />
Human<br />
resources
44 Kesko’s year <strong>2009</strong><br />
Kesko is<br />
a good place<br />
to work<br />
Aiming to be the most<br />
attractive workplace in the<br />
trading sector<br />
Commercial students are interested in<br />
Kesko and its chains as a workplace. In<br />
the Universum survey, those with an initial<br />
vocational education ranked Kesko<br />
6th, just like in the previous year. In the<br />
<strong>2009</strong> Universum Young Professionals survey,<br />
Kesko was rated on top among one<br />
hundred companies, offering the widest<br />
variety of assignments. Kesko’s overall<br />
ranking in the survey was 18.<br />
Kesko carries out close cooperation<br />
with students and teachers in different<br />
sectors. For example, the job-orientation<br />
of Finnish teachers of commercial and<br />
technical subjects is promoted in trainings<br />
arranged by Kesko. Trainings will be<br />
revised in 2010.<br />
The most competent and<br />
motivated people in the trading<br />
sector<br />
Key competitive assets for Kesko’s and its<br />
stores’ operations and for improvement in<br />
work productivity include systematic<br />
development of staff competence.<br />
Kesko’s subsidiary K-instituutti acts as<br />
a centralised planning, implementation<br />
and purchasing organisation of the<br />
K-Group’s training services. Its key duties<br />
include ensuring competence development<br />
in the K-Group with the best pricequality<br />
relation. The competence development<br />
solutions which support business<br />
activities are planned in cooperation with<br />
business units and implemented in cooperation<br />
with the selected and audited<br />
network of training partners. The role of<br />
K-instituutti also includes the fast and<br />
efficient duplicating and sharing of the<br />
best practices within the K-Group.<br />
In <strong>2009</strong>, the Master Sales Assistant<br />
training had more than 17,000 participants<br />
in 12 different product lines. The<br />
aim is, above all, continuous enhancement<br />
of sales people’s service attitude,<br />
sales skills and product knowledge in<br />
cooperation with suppliers. More than<br />
100 business colleges and polytechnics<br />
also implemented the training, in which<br />
some 5,000 students participated.<br />
Some 99% (the target is 100%) of the<br />
checkout personnel and their supervisors<br />
selling age-restricted products in K-food<br />
stores completed the proficiency test in<br />
<strong>2009</strong>. The test includes questions about<br />
the sale of age-restricted products.<br />
Management and leadership<br />
At Kesko, management is conducted in<br />
a responsible manner and in compliance<br />
with the corporate values. Leadership and<br />
the working community that are motivating<br />
and encouraging are prerequisites for<br />
excellent performance and wellbeing at<br />
work.<br />
The annual personnel survey plays<br />
a key role in measuring the operations of<br />
the working community, the quality of<br />
management and the internal employer<br />
profile. A similar survey is conducted<br />
throughout Kesko and its chain stores. In<br />
<strong>2009</strong>, replies were received from 72.3%<br />
of the employees of the companies<br />
included in the survey. Active leverage of<br />
survey results in managerial work and the
efficient implementation of concrete<br />
development activities are of essential<br />
importance.<br />
The personnel survey also looks into<br />
employees’ experience of equality in<br />
terms of age, origin and gender. Equality<br />
was considered to be good in every area<br />
surveyed.<br />
One of the key tools in efficient performance<br />
management and the motivating<br />
leadership of immediate superiors is<br />
the performance and development review<br />
whose implementation is included in the<br />
personnel survey. 72% of the employees<br />
have had a performance and development<br />
review during the past year, and<br />
rated their satisfaction with the review as<br />
4.0 (on a scale of 1–5). Furthermore, the<br />
performance assessment of the entire<br />
Group’s key personnel was further<br />
expanded in the companies.<br />
Leadership skills and career progress<br />
are supported by Kesko’s own three-step<br />
superior and management training. Since<br />
2004, Kesko has implemented a longterm<br />
development programme for members<br />
of the management and potential<br />
management. There are some 200 participants<br />
in the programme, whose purpose<br />
is to ensure a sufficient supply of managerial<br />
resources both in terms of quality<br />
and quantity. In <strong>2009</strong>, key employees<br />
participated in the training supporting the<br />
implementation of the work and productivity<br />
programme.<br />
Common training is complemented by<br />
the chain’s own training programmes. The<br />
building and home improvement sector’s<br />
Master programme in international retail<br />
management started in <strong>2009</strong> with the<br />
purpose of standardising the implementation<br />
of the sector’s concepts in all the<br />
countries where the Group operates. In<br />
Anttila and Kodin Ykkönen department<br />
stores, 190 managers participated in<br />
store-specific HR training. The aim was to<br />
increase general competence in personnel<br />
and employment issues, while specifying<br />
and improving the efficiency of implementing<br />
HR processes at everyday level.<br />
Towards the best labour<br />
productivity in the trading<br />
sector<br />
The key objective of the ongoing work and<br />
productivity programme is to improve the<br />
employees’ work productivity, for example<br />
by focusing on the competence and wellbeing<br />
of people and on better leadership.<br />
The programme focuses on the development<br />
of sales and customer service skills,<br />
projects that promote wellbeing at work,<br />
efficient management of working hours<br />
and adapting the number of personnel to<br />
the current market situation. The programme<br />
also involves measures related to<br />
increasing electronic communications. The<br />
work and productivity programme applies<br />
to all of Kesko and its chain stores.<br />
As a result of the decline in consumer<br />
demand, measures aimed at adjusting<br />
the number and cost of staff were continued.<br />
During the year, the Group’s staff<br />
cost decreased by 7.4%.<br />
Labour productivity has also improved<br />
thanks to the adoption of different working<br />
hour models and the systematic management<br />
of working hours. For example,<br />
Kesko’s year <strong>2009</strong><br />
45<br />
The Volkswagen Retail Sales Excellence<br />
(RSE) is a sales management training<br />
programme for sales managers in<br />
Finland. The aim of the programme is<br />
to improve sales profitability with the<br />
help of tools supporting the training<br />
of sales people and the sales process.<br />
The RSE programme started in<br />
VV-Auto’s own Volkswagen outlets in<br />
<strong>2009</strong> and will be expanded to cover<br />
all Volkswagen dealers in Finland.
46 Kesko’s year <strong>2009</strong><br />
The widest variety of job<br />
assignments at Kesko<br />
In the <strong>2009</strong> Universum Young Professionals<br />
survey, Kesko was rated top<br />
among one hundred companies,<br />
offering the widest variety of assignments.<br />
Respondents comprised<br />
approximately 6,000 young business,<br />
engineering and IT professionals.<br />
Michaela von Wendt, Universum’s<br />
Country Manager for Finland says that<br />
Kesko has succeeded in communicating<br />
the variety of career alternatives<br />
and opportunities it offers to young<br />
professionals and students.<br />
K-food stores carried out an extensive<br />
project, the aim of which was improving<br />
the planning of working hours, increasing<br />
the use of planning programmes and the<br />
electronic transfer of related information<br />
to the payroll accounting unit.<br />
Long-term projects focusing on wellbeing<br />
at work will continue in companies.<br />
The introduction of the intervention<br />
model has further expanded during the<br />
year. The aim is to increase labour productivity<br />
by reducing sickness absences<br />
and raising the retirement age. A uniform<br />
sickness absence monitoring and reporting<br />
model was introduced at the beginning<br />
of <strong>2009</strong>. All companies prepared a<br />
concrete action plan with the aim of<br />
reducing sickness absences.<br />
In Finland, Kesko’s Occupational Health<br />
Service Unit focuses on operations that<br />
maintain work capacity and promote the<br />
wellbeing of the working community.<br />
Currently 35–45% of the total costs of<br />
occupational health are allocated to these<br />
activities. In other countries, occupational<br />
health services have been arranged<br />
according to the local practice and legislation.<br />
Support for personnel’s recreational<br />
activities is provided through joint<br />
staff clubs and in the form of companyspecific<br />
contribution.<br />
Most of Kesko’s employees belong to a<br />
bonus incentive system. The management’s<br />
incentive systems are described on<br />
pages 59–60.<br />
Kesko’s internal communications<br />
became more efficient with the introduction<br />
of the new intranet in all operating<br />
countries in <strong>2009</strong>.<br />
Information about HR affairs will also<br />
be available in the Corporate Responsibility<br />
<strong>Report</strong> for <strong>2009</strong>.
Competitive<br />
advantage<br />
from chain<br />
operations and<br />
K-retailer<br />
enterprise<br />
The K-Group’s principal business model<br />
in Finland is the chain business model,<br />
in which independent K-retailers run<br />
retail stores in the chains managed by<br />
Kesko. At the end of <strong>2009</strong>, Kesko had<br />
1,302 K-retailer entrepreneurs as partners,<br />
as well as about 250 other retailer<br />
partners.<br />
Path to K-retailer career<br />
Need<br />
• About 50–100<br />
novice retailers<br />
every year<br />
Cooperation between K-retailers and<br />
Kesko – chain operations – is based on<br />
equality, openness and willingness to<br />
develop joint operations. The objective of<br />
chain operations is improving competitiveness<br />
and customer satisfaction combined<br />
with achieving higher, uniform<br />
quality and lowering costs.<br />
The obligations and rights of K-retailers<br />
and Kesko have been specified in the<br />
chain agreement.<br />
Competitive edge is gained by combining<br />
systematic chain operations and the<br />
K-retailer operations based on entrepreneurship.<br />
Kesko is responsible for the<br />
constant development of the business<br />
model and the store concepts, for chain<br />
operations management and for sourcing<br />
and purchasing of the products included<br />
in the chain selections. The K-retailer<br />
entrepreneur is responsible for his or her<br />
store’s customer satisfaction, personnel<br />
and profitability of business.<br />
To ensure success, it is important that a<br />
new retailer’s professional and other skills<br />
are at as high level as possible at the start<br />
of his/her career. About 200 stores are<br />
affected by retailer changes annually in<br />
the K-Group. The annual need for new<br />
entrepreneurs, ready to start their<br />
K-retailer careers, is approximately 100.<br />
The K-Group systematically trains new<br />
retailers to ensure a sufficient supply of<br />
people with the appropriate professional<br />
skills. New candidates interested in a<br />
Marketing Screening<br />
• K-stores and Kesko<br />
• Manufacturing industry<br />
• Competitors<br />
• Entrepreneurs of<br />
various sectors<br />
• Educational institutes<br />
• Others<br />
K-retailer trainee programme<br />
• Required theoretical training at K-instituutti (food<br />
retailer training) or in online learning environment<br />
• On-the-job retailer work training under mentor<br />
retailer<br />
• Regional training (theme days)<br />
Further<br />
qualification in<br />
entrepreneurship<br />
Assessment<br />
• Attitude<br />
• Values<br />
• Experience /<br />
development needs<br />
• Suitability assessment<br />
Kesko’s year <strong>2009</strong><br />
47<br />
K-retailer career are sought through different<br />
channels. There are about 500<br />
contacts annually. The requirement for<br />
new retailers is estimated for 1–3 years<br />
ahead.<br />
The K-retailer trainee programme<br />
offers three alternative paths: a comprehensive<br />
programme, an intensive programme<br />
and the retailer entrepreneur<br />
path in polytechnics. Approximately 50%<br />
of those starting the programme have a<br />
fair amount of retailing experience, but in<br />
recent years the number of students<br />
transferring from other fields or having<br />
just finished their general education has<br />
grown. Before selection to the K-retailer<br />
trainee programme, the applicants are<br />
evaluated with regard to their development<br />
potential, values, work experience<br />
and education. After selection, would-be<br />
K-retailers start the K-retailer trainee programme,<br />
which consists of three parts:<br />
practical training in a retail store under<br />
the guidance of a mentor, theoretical<br />
training at the K-instituutti training centre<br />
or in the online learning environment,<br />
and regional K-trainee seminars.<br />
Approximately 100 K-retailer trainees<br />
complete the programme every year. After<br />
completion, the trainees are ready to start<br />
as independent K-retailer entrepreneurs.<br />
The K-Group gives its retailers strong<br />
background support and opportunities for<br />
further training and progress in their<br />
careers.<br />
K-retailer reserve<br />
• (personality,<br />
knowledge, skills)<br />
Selection<br />
• Key areas of selfdevelopment<br />
• Planning of a personal<br />
training programme<br />
• Apprenticeship contract<br />
assessment<br />
K-retailer career
Principles and indicators of responsibility support the<br />
management<br />
Corporate responsibility in Kesko is included in the Group’s normal management,<br />
complementing the management system with policies and principles guiding<br />
responsibility, with operating guidelines and indicators complying with the Global<br />
<strong>Report</strong>ing Initiative (GRI) recommendation. Corporate responsibility work includes<br />
good corporate governance, cooperation with stakeholders, risk management,<br />
economic, social and environmental responsibility, and all activities on behalf<br />
of product safety and consumer protection.<br />
The corporate responsibility policies and principles approved by Kesko’s Board of<br />
Directors or the Corporate Management Board and related international commitments<br />
have been published at www.kesko.fi/responsibility.<br />
Kesko’s responsibility programme in 2008–2012<br />
Our responsibility programme sets concrete targets for:<br />
• combating climate change<br />
• reducing wastage<br />
• transportation<br />
• responsible purchasing<br />
•<br />
employee wellbeing.<br />
Responsibility
50 Kesko’s year <strong>2009</strong><br />
Responsibility<br />
The Pirkka Organic<br />
range keeps growing<br />
The Pirkka Organic range<br />
now comprises about 40<br />
products, some of which<br />
are sold during a certain<br />
season only. The<br />
most popular Pirkka<br />
Organic products<br />
are tomatoes,<br />
carrots and eggs.<br />
New products are<br />
constantly and actively<br />
sought for the Pirkka Organic range.<br />
The most recent arrivals include Pirkka<br />
Fairtrade Organic cocoa powder and<br />
Pirkka Fairtrade Organic chocolates.<br />
These products combine Fairtrade certification<br />
and organic production.<br />
Responsibility is<br />
day-to-day work<br />
The plans and actions relating to corporate<br />
responsibility are included in the different<br />
phases of Kesko’s management<br />
system like other activities. The general<br />
principles of corporate responsibility provide<br />
management guidelines, while more<br />
detailed operating practices and goals<br />
have been defined in the policies and<br />
principles relating to different areas of<br />
operations. The guide ‘Our Responsible<br />
Working Principles’ and a supporting<br />
online training programme have been<br />
prepared for training the whole personnel<br />
– including K-store people.<br />
The corporate responsibility team that<br />
operates within the Corporate Communications<br />
and Responsibility Unit develops<br />
and coordinates responsibility actions<br />
implemented in the line organisation,<br />
and reports on the results. The team’s<br />
work is supported by a Corporate Responsibility<br />
Advisory Board, which has been<br />
appointed by the Corporate Management<br />
Board. The Advisory Board consists of<br />
members representing the management<br />
of Kesko’s various division parent companies.<br />
Its duties include determining the<br />
responsibility strategy and the operating<br />
policies and models needed for its implementation,<br />
and monitoring the results.<br />
In <strong>2009</strong>, the Corporate Responsibility<br />
Advisory Board focused on preparing a<br />
responsibility communications plan, with<br />
the aim of starting planned communications,<br />
including the revising of the<br />
responsibility section of kesko.fi pages in<br />
2010.<br />
The Environmental Steering Group is<br />
responsible for developing and coordinating<br />
environmental issues in different divisions<br />
and countries. Its focuses included<br />
the actions needed to meet the collection<br />
requirements of the EU’s Battery Directive<br />
and the progress of the implementation<br />
of REACH, the EU regulation on chemicals.<br />
A steering group consisting of representatives<br />
from the purchasing management<br />
of division parent companies coordinates<br />
responsible purchasing. In <strong>2009</strong>,<br />
the group addressed, for example, risk<br />
classification and monitoring of suppliers,<br />
and the introduction of the database of<br />
suppliers in high-risk countries.<br />
Kesko among the best in the<br />
world in sustainability indexes<br />
For the seventh time, Kesko was included<br />
in the Dow Jones sustainability indexes,<br />
DJSI World and DJSI STOXX. In the <strong>2009</strong><br />
assessment, Kesko ranked the best in the<br />
sector in innovations management, risk<br />
management, supplier controls, environmental<br />
reporting, eco-efficiency of operations,<br />
and anti-corruption and anti-<br />
bribery measures taken.<br />
Based on the assessment made by the<br />
EIRIS research institute, Kesko was<br />
included in the FTSE4Good Global and<br />
FTSE4Good Europe indexes focusing on<br />
responsible investment in March <strong>2009</strong>.<br />
The assessment by EIRIS consists of the<br />
following areas: environmental sustainability,<br />
fostering human rights, countering<br />
bribery, supply chain labour standards<br />
and curbing climate change. The FTSE is a<br />
company owned jointly by the Financial<br />
Times and the London Stock Exchange.<br />
Kesko’s listings in the ASPI Eurozone®,<br />
Ethibel Pioneer & Excellence and Kempen/<br />
SNS Smaller Europe SRI indexes were also<br />
repeated in <strong>2009</strong>.<br />
Every January since 2005, World Economic<br />
Forum has published the ‘The Global<br />
100 Most Sustainable Corporations in<br />
the World’ list. Kesko has been included<br />
every year – on the 2010 list Kesko’s<br />
ranking was 33rd.<br />
As in <strong>2009</strong>, Kesko qualified in the<br />
2010 Sustainability Yearbook, published<br />
by the SAM Group which draws up the DJSI<br />
index, for the Silver Class in the Food &<br />
Drug Retailers sector. No companies qualified<br />
in the Gold Class in this sector. Kesko<br />
was also recognised as the “Sector<br />
Mover”, a qualification given to the company<br />
that has achieved the greatest proportional<br />
increase in its sustainability<br />
performance.<br />
Kesko’s rankings in different indexes<br />
are on display at www.kesko.fi/<br />
responsibility.<br />
Economic responsibility<br />
Economic responsibility is reflected in<br />
good management of finances, efficient<br />
use of resources, and the stable and longterm<br />
generation of economic benefit to<br />
different stakeholders. Good financial<br />
performance is sought with responsible<br />
methods – supported by good corporate<br />
governance, open communications and
effective stakeholder interaction while<br />
taking environmental and social responsibility<br />
into account. In the Corporate<br />
Responsibility <strong>Report</strong>, Kesko specifies the<br />
economic benefit generated by it from the<br />
perspective of different stakeholders,<br />
market areas and communities.<br />
Major part to the manufacturing<br />
industry<br />
Most of the economic benefit generated<br />
by Kesko – nearly 83% of Kesko’s net<br />
sales -goes to suppliers of goods from<br />
which total purchases were €7.0 billion in<br />
<strong>2009</strong>. Finnish suppliers accounted for<br />
70% of all. In <strong>2009</strong>, Kesko had approximately<br />
29,500 active suppliers of goods<br />
and services (Kesko’s annual purchases<br />
exceeding €1,000), of which 16,300<br />
operated in Finland. Kesko’s investments<br />
in Finland totalled €128 million and in<br />
other countries €70 million.<br />
Comprehensive store network for<br />
customers<br />
Together with the K-retailers, Kesko is<br />
responsible for a nationwide store network<br />
in Finland. Its services are complemented<br />
by a mail order business and<br />
e-commerce.<br />
At the end of <strong>2009</strong>, there were 1,030<br />
K-food stores i.e. 25 fewer than the year<br />
before. The store network covered 311 of<br />
Finland’s 348 cities and municipalities.<br />
51% of Finnish households lived within<br />
one kilometre of the nearest K-food store.<br />
97 new K-retailers started during the<br />
year.<br />
The total number of other K-Group<br />
stores in Finland was 720. Store numbers<br />
are specified in the tables of each division<br />
on pages 14–39.<br />
There were 133 building and home<br />
improvement stores in other Nordic countries.<br />
There were 34 building and home<br />
improvement stores and nine furniture<br />
stores in the Baltic countries. There were<br />
10 building and home improvement<br />
stores in Russia and four in Belarus.<br />
Sales to the K-retailers accounted for<br />
51% of Kesko’s total sales. Kesko’s own<br />
retail stores accounted for 27% of the<br />
company’s total sales.<br />
Support for the public good<br />
In <strong>2009</strong>, Kesko and its subsidiaries gave<br />
financial support amounting to approxi-<br />
mately €1.5 million to some 150 organisations<br />
and institutions operating for the<br />
public good.<br />
Support is primarily directed to areas<br />
associated with wellbeing of families with<br />
children. In <strong>2009</strong>, funds were above all<br />
directed to support the work for the mental<br />
health of the young. Kesko’s cooperation<br />
with the Young Finland Association to<br />
promote physical exercise of children and<br />
the young and a healthy way of life has<br />
continued for over a decade. Scholarships<br />
were granted to talented young athletes,<br />
art students and polytechnic students for<br />
the 22nd time. Through the UNICEF, Kesko<br />
also donated funds to the education of<br />
children in Vietnam.<br />
The Happy Christmas Spirit collection<br />
organised jointly for the 13th time by the<br />
Mannerheim League for Child Welfare, the<br />
Finnish Red Cross, the Finnish Broadcasting<br />
Company’s YLE Radio Suomi and<br />
Morning TV, and Kesko for the benefit of<br />
low-income Finnish families with children<br />
raised €950,000, which was a new<br />
record. K-food stores’ and Chiquita’s ‘Give<br />
Children a Life’ campaign raised €160,000<br />
for purchasing intensive care equipment<br />
for premature babies in the university<br />
hospitals in Helsinki, Turku, Tampere,<br />
Kuopio and Oulu. Procter&Gamble’s and<br />
K-food stores’ Pampers campaign raised<br />
funds for UNICEF to provide vaccine for<br />
the protection of newborn babies against<br />
tetanus. K-retailers complemented the<br />
campaign by donating funds for nearly<br />
600,000 further inoculations.<br />
Environmental responsibility<br />
The Kesko Group’s certified ISO 14001<br />
environmental management system covers<br />
all major environmental impacts of<br />
operations. During the year, the certification<br />
of Keslog’s transportation and warehouse<br />
operations was revised and Anttila<br />
Oy included their new department store<br />
in Rovaniemi and the Anttila Store in<br />
Nummela in the system. Business partners<br />
providing property construction,<br />
maintenance and waste management<br />
services for Kesko have similar systems.<br />
VV-Autotalot Oy and Turun VV-Auto Oy<br />
comply with the action plan of the Finnish<br />
Central Organisation for Motor Trades<br />
and Repairs and the quality requirements<br />
of the Volkswagen Group.<br />
Kesko’s year <strong>2009</strong><br />
51<br />
In its reporting, Kesko follows the recommendation<br />
for reporting on sustainable<br />
development drawn up by<br />
the Global <strong>Report</strong>ing Initiative (GRI)<br />
and is an Organisational Stakeholder<br />
of the GRI. Kesko’s Board of Directors<br />
discusses the Corporate Responsibility<br />
<strong>Report</strong> annually after it has been<br />
published. Since 2002, reporting has<br />
been assured by an independent<br />
party. The report for <strong>2009</strong> will be<br />
published in May 2010 and PricewaterhouseCoopers<br />
Oy will be responsible<br />
for its assurance.<br />
Kesko is committed to the Global<br />
Compact challenge launched by the<br />
UN Secretary General. In June <strong>2009</strong>,<br />
the Global Compact Office thanked<br />
Kesko for excellent responsibility<br />
reporting and presented Kesko’s<br />
report on its web pages, classified as<br />
Notable.
52 Kesko’s year <strong>2009</strong><br />
Carrotmob challenged<br />
K-markets to save energy<br />
The Carrotmob consumer movement<br />
arranged events at K-market<br />
Kotikontu in Helsinki and at K-market<br />
Tullintori in Tampere in October <strong>2009</strong>.<br />
Carrotmob offers ordinary consumers<br />
a concrete way to combat climate<br />
change. The target of the events was<br />
to challenge food stores to save<br />
energy. “Every euro generated from<br />
extra sales will be invested in improving<br />
the energy efficiency of the store,”<br />
the retailers promise.<br />
K-food stores have long focused on<br />
energy efficiency. All new island freezers<br />
purchased for K-food stores have<br />
been fitted with lids since the beginning<br />
of 2008.<br />
K-stores’ environmental management<br />
is based on the requirements of the<br />
K-environmental store diploma. Bureau<br />
Veritas Quality International (BVQI) audits<br />
the fulfilment of these requirements. At<br />
the end of the year, 457 K-food stores<br />
had the diploma. All K-citymarkets and<br />
K-supermarkets fulfil the requirements in<br />
accordance with their chain concept, as<br />
do 138 K-rauta and Rautia stores, and 29<br />
K-maatalous agricultural stores.<br />
Energy and emissions<br />
The combined electricity consumption of<br />
Kesko and the K-stores operating in Kesko’s<br />
premises in Finland was 766 GWh.<br />
Electricity consumption increased by 2.0%<br />
while the total area of real estate<br />
increased by 2.6%. The consumption of<br />
heat energy totalled 329 GWh (288 GWh<br />
in 2008). In all real estate, the specific<br />
consumption of electric energy decreased<br />
by 0.6%, whereas the specific consumption<br />
of heat energy increased by 11.1%<br />
due to the cold weather.<br />
Kesko used centralised purchasing to<br />
buy 75% of the electricity used. All electricity<br />
bought was carbon-free, produced<br />
with nuclear power and renewable energy<br />
sources. The carbon dioxide emissions of<br />
electricity used by the whole K-Group<br />
have decreased by 93% since 2001.<br />
A total of 12.0 million kilometres was<br />
driven in distance and trunk transportation,<br />
17.0 million kilometres were driven<br />
in distribution transportation, and 9.9<br />
million kilometres were driven in outsourced<br />
transportation. Transportation<br />
caused approximately 46,025 tons of carbon<br />
dioxide emissions in Finland, or<br />
about 0.0252 kilos per each kilo transported.<br />
Proportional CO 2 emissions<br />
increased by 3.7% from the previous year.<br />
Emissions of electricity and heat energy<br />
purchased in Finland and the energy and<br />
emissions statistics of foreign subsidiaries<br />
will be presented in the Corporate<br />
Responsibility <strong>Report</strong>.<br />
Waste management and recycling<br />
Waste recovery rate dropped slightly from<br />
the previous year. In Kesko Food’s warehouse<br />
operations, the total amount of<br />
waste was 6,539 tons and the waste<br />
recovery rate was 86%. 74 million cans<br />
and 28 million recyclable plastic bottles<br />
were collected in return logistics. The total<br />
waste amount of the Anttila distribution<br />
centres was 651 tons (740 tons) and the<br />
recovery rate was 97% (96%). Recovery<br />
rates of department stores varied between<br />
68% and 100% depending on regional<br />
recycling possibilities.<br />
In the autumn, Intersport organised a<br />
recycling campaign with the Finnish Red<br />
Cross and Halti. The stores received more<br />
than 2,200 old outdoor coats and jackets<br />
brought by customers. In all, 64 bales of<br />
inspected coats and jackets were transported<br />
to Kyrgyzstan, Mongolia and<br />
Tadzhikistan, which suffer from the cold<br />
and poverty.<br />
Social responsibility<br />
Kesko’s social responsibility can be<br />
divided into direct social responsibility for<br />
its own personnel, and indirect social<br />
responsibility for personnel helping to<br />
produce the merchandise sold by Kesko.<br />
The core areas of social responsibility<br />
for own personnel are a good working<br />
community, equality, competence development,<br />
and health and safety. An<br />
annual personnel survey with the same<br />
content that is conducted throughout<br />
Kesko and its chain stores provides information<br />
about the strengths and development<br />
needs of working communities.<br />
The work and productivity programme<br />
that had started in 2008 continued in<br />
<strong>2009</strong>. The programme has promoted the<br />
adoption of different working hour systems,<br />
the systematic management of<br />
working hours and specified the monitoring<br />
absences due to illness. Other core<br />
areas have included competence, wellbeing<br />
and leadership development as well<br />
as occupational health care services,<br />
which in Finland focus on operations that<br />
maintain work capacity and promote the<br />
wellbeing of work community.<br />
For more information about HR issues,<br />
see pages 44–46 and the Corporate<br />
Responsibility <strong>Report</strong>.<br />
Responsible purchasing<br />
Kesko’s own two-member monitoring<br />
team that was established in Shanghai in<br />
October 2008 made 161 factory visits to<br />
the premises of 50 suppliers in China in<br />
<strong>2009</strong>. The suppliers and the factories they<br />
use first fill in Kesko’s self-assessment<br />
form, which complies with the practices of<br />
the BSCI audit. The monitoring officers
compare the responsibility practices of<br />
factories on site with Kesko’s requirements,<br />
decide on any required corrective<br />
actions and give support to factories<br />
implementing these corrective actions.<br />
Compliance with chemical regulations<br />
defined by Kesko is also verified during<br />
these visits.<br />
The goal of monitoring is always an<br />
independent audit, carried out according<br />
to either the BSCI audit model or the<br />
SA8000 standard. The objective of Kesko,<br />
such as all BSCI members, is to do business<br />
in the so-called high-risk countries<br />
only with suppliers who have passed the<br />
audit. At the end of <strong>2009</strong>, audits had<br />
been carried out in 107 of the factories of<br />
Kesko’s high-risk suppliers, compared<br />
with 32 the year before. More than 40<br />
Kesko’s suppliers participated in the<br />
training events arranged by the BSCI in<br />
China, Vietnam, Bangladesh and Turkey.<br />
Suppliers’ audit information is collected<br />
in the database developed by<br />
Kesko for this purpose. In addition to BSCI<br />
audited suppliers, Kesko had 30 suppliers<br />
with SA8000 certification and 112 suppliers<br />
of Fairtrade products. In all, Kesko has<br />
participated in ensuring decent working<br />
conditions and terms for workers of some<br />
250 companies in developing countries.<br />
Responsibility in<br />
the product trade<br />
Kesko’s division parent companies have<br />
several sustainable sourcing policies concerning<br />
the origins and production conditions<br />
which affect the creation of selections<br />
and promote the sales of the products<br />
in question.<br />
The selection and marketing policies<br />
concerning organic and Fairtrade products<br />
and products with environmental labelling<br />
are included in the K-food stores’<br />
chain concepts. Kesko’s statement on fish<br />
and shellfish purchases relies on the<br />
guidelines of the WWF for products from<br />
nearby areas and on the guidelines of the<br />
Marine Conservation Society for products<br />
from further away.<br />
In the development of Pirkka products,<br />
the focus is on promoting a healthy way<br />
of life, like in other marketing. The K-citymarket<br />
chain has launched to the market<br />
clothing collections that are based on the<br />
Global Organic Textile Standard or made of<br />
recycled plastic material.<br />
Rautakesko offers a wide selection of<br />
products with environmental, energy or<br />
emission category labelling. The proportion<br />
of certified timber out of total timber<br />
sales exceeded 90%. Garden furniture<br />
sold by all K-Group stores is either FSCcertified<br />
or made of sustainably cultivated<br />
tropical wood species.<br />
Product safety<br />
Kesko Food’s Pirkka Product Research is<br />
responsible for ensuring the quality of<br />
purchases, keeping abreast of food legislation,<br />
maintaining and providing support<br />
for the self-control plans required by law<br />
and for developing own brand products<br />
together with the purchasing and marketing<br />
units.<br />
Quality control is carried out by auditing<br />
the operations of product manufacturers<br />
and analysing product composition<br />
and quality. In 2008, the Pirkka Product<br />
Research Unit’s laboratory became the<br />
first laboratory representing the Finnish<br />
trading sector with the ISO 17025 accreditation.<br />
In <strong>2009</strong>, the Product Research audited<br />
41 suppliers, of which nine were Finnish.<br />
Most of them were manufacturers of Kesko’s<br />
own brand products. A total of 5,702<br />
food novelties and product development<br />
samples were analysed, while the total<br />
number of batch control and other selfcontrol<br />
samples was 1,393.<br />
The Product Research Unit also plays a<br />
key role in exceptional situations, when a<br />
product launched on the market deviates<br />
from quality or safety requirements. During<br />
the year, there were 61 product recalls<br />
(66 in the previous year), most of which<br />
related to defective quality or taste, or to<br />
a defect in manufacturing or packaging.<br />
21 of the recall cases were Kesko’s own<br />
brands; in other cases the Product<br />
Research Unit assisted manufacturing<br />
industry. Three of the recall cases were<br />
public recalls, involving potential health<br />
hazards.<br />
During the year, the recipe service of<br />
the K-test kitchen, which changed its<br />
name to the Pirkka test kitchen to celebrate<br />
its 50th anniversary, produced 620<br />
recipes for both the K-Group units and<br />
directly for consumers. Kesko Food’s Consumer<br />
Service answers consumer inquiries<br />
and receives feedback. In <strong>2009</strong>, there<br />
were 20,999 such contacts.<br />
Kesko’s year <strong>2009</strong><br />
53<br />
New signs at K-food stores<br />
illuminated with LEDs<br />
LED lighting technology is replacing<br />
neon and fluorescent tubes in signage<br />
at K-food stores. The benefits of LED<br />
lighting include the following:<br />
• Energy consumption is 60–80%<br />
lower<br />
• Reduced need for maintenance<br />
work for illuminated advertising<br />
and, as a consequence, less travel<br />
• Life-spans of LED lights are over<br />
10 years<br />
• Over time, LED lights dim<br />
considerably less than neon and<br />
fluorescent tubes<br />
• Advertising with LED lighting<br />
contains no hazardous waste.<br />
A monitoring team controls<br />
the responsibility of Chinese<br />
suppliers<br />
Kesko’s monitoring team in Shanghai,<br />
China guides, trains and monitors<br />
Chinese suppliers of Kesko’s division<br />
parent companies. Monitoring officers<br />
Angel Yang and Buick Bie help suppliers<br />
correct any deficiencies found.<br />
Monitoring also helps suppliers<br />
develop their operations and apply for<br />
a BSCI audit or SA8000 certification.<br />
Monitoring in China started in<br />
October 2008. The monitoring team<br />
made 161 factory visits to the<br />
premises of 50 suppliers in <strong>2009</strong>.
54 Kesko’s year <strong>2009</strong><br />
Kesko’s Corporate Governance<br />
Kesko Group’s Corporate Governance structure<br />
Elects<br />
Auditor<br />
Issues an audit<br />
report<br />
Elects<br />
Supervises<br />
Controls<br />
The rules and the Corporate Governance Code<br />
observed by Kesko<br />
Kesko Corporation (Kesko or the company) is a Finnish public limited<br />
company in which the duties and responsibilities of the<br />
executive bodies are defined according to the Finnish law. The<br />
international Kesko Group comprises the parent company, Kesko,<br />
and its subsidiaries. The company is domiciled in Helsinki.<br />
The highest decision-making power in Kesko is exercised by<br />
the company’s shareholders at a General Meeting. The company’s<br />
shareholders elect the company’s Board of Directors and auditor<br />
at a General Meeting. The Kesko Group is managed by the Board<br />
of Directors and a Managing Director, who is the President and<br />
CEO. The company uses a single-tier governance model.<br />
Kesko’s decision-making and administration comply with the<br />
Finnish Limited Liability Companies Act, other regulations concerning<br />
publicly traded companies, Kesko Corporation’s Articles of<br />
Association, and the rules and guidelines of NASDAQ OMX Helsinki<br />
Ltd. In addition, the company complies with the Finnish Corpo-<br />
Kesko Corporation<br />
General Meeting, shareholders<br />
<strong>Report</strong>s<br />
Internal Audit Corporate Management Board<br />
Food trade<br />
Kesko Food Ltd and its<br />
subsidiaries<br />
Home and speciality<br />
goods trade<br />
Anttila Oy<br />
and its subsidiaries<br />
K-citymarket Oy<br />
Indoor Group Ltd and its<br />
subsidiaries<br />
Intersport Finland Ltd<br />
Musta Pörssi Ltd<br />
Kenkäkesko Ltd<br />
Elects<br />
Board of Directors<br />
Audit Committee<br />
Remuneration Committee<br />
President and CEO<br />
Building and home<br />
improvement trade<br />
Rautakesko Ltd and<br />
its subsidiaries<br />
Car and machinery trade<br />
VV-Auto Group Oy<br />
and its subsidiaries<br />
Konekesko Ltd and<br />
its subsidiaries<br />
rate Governance Code for listed companies (“Corporate Governance<br />
Code”). The Corporate Governance Code is available in full at<br />
www.cgfinland.fi. As provided by the Comply or Explain principle<br />
of the Corporate Governance Code, the company departs from the<br />
Corporate Governance Code’s recommendation concerning the<br />
terms of office of Board members as specified hereafter.<br />
Departure from Corporate Governance Code<br />
recommendation<br />
The terms of the members of Kesko’s Board of Directors depart<br />
from the term of one year given in Recommendation 10 of the<br />
Corporate Governance Code. The term of the company’s Board is<br />
defined in the company’s Articles of Association. The General<br />
Meeting makes decisions on amendments to the Articles of Association.<br />
According to the company’s Articles of Association, the<br />
term of office of each Board member is three (3) years with the<br />
term starting at the close of the General Meeting electing the
member and expiring at the close of the third (3rd) <strong>Annual</strong><br />
General Meeting after the election.<br />
A shareholder which, together with controlled companies,<br />
holds over 10% of all voting rights attached to Kesko’s shares,<br />
has informed the company’s Board of Directors that it considers<br />
the term of three (3) years good for the company’s long-term<br />
development and sees no need to shorten the term of office set<br />
in the Articles of Association.<br />
Corporate Governance Statement<br />
A separate Kesko’s Corporate Governance Statement referred to in<br />
the Corporate Governance Code and inspected by the Audit Committee<br />
of Kesko’s Board of Directors at its meeting on 4 February<br />
2010 is available at www.kesko.fi.<br />
General meetings<br />
The <strong>Annual</strong> General Meeting, which is held on a date before the<br />
end of every June as designated by the company’s Board of<br />
Directors, handles the business specified for the <strong>Annual</strong> General<br />
Meeting in the company’s Articles of Association and any other<br />
proposals that may be made to the Meeting. Kesko’s <strong>Annual</strong><br />
General Meeting has usually been held in March or April. If<br />
needed, the company may also hold an Extraordinary General<br />
Meeting.<br />
All General Meetings are convened by the company’s Board of<br />
Directors. An Extraordinary General Meeting must also be convened<br />
if shareholders with at least 10% of the shares so demand<br />
in writing in order to deal with a given matter. As a rule, General<br />
Meetings handle the matters placed on the agenda by the company’s<br />
Board of Directors.<br />
Individual shareholders have the right, prescribed in the<br />
Limited Liability Companies Act, to place those matters that fall<br />
within the competence of a General Meeting, on the General<br />
Meeting agenda, provided they make a written request to the<br />
Board of Directors in time for the matter to be included in the<br />
notice of the meeting. Shareholders must send such requests,<br />
together with a written account of the reasons behind the<br />
requests or the proposed resolutions to the Kesko Group’s Legal<br />
Affairs, Kesko Corporation, FI-00016 KESKO or by e-mail to<br />
cg@kesko.fi.<br />
Major matters to be decided by a General Meeting<br />
The major matters to be decided by a General Meeting include:<br />
• decisions on the number of Board members<br />
• the election of Board members<br />
• decisions on the remuneration and financial benefits of the<br />
members of the Board of Directors and Board Committees<br />
• the election of the auditor and decisions on the auditor’s fee<br />
• the adoption of the financial statements<br />
• decisions on discharging the Board and the Managing Director<br />
from liability<br />
• amendments to the Articles of Association<br />
• decisions on increases in the share capital<br />
• decisions on the distribution of the company’s earnings, such<br />
as profit distribution.<br />
Kesko’s year <strong>2009</strong><br />
55<br />
Convening a General Meeting<br />
Shareholders are invited to a General Meeting by a notice published<br />
in at least two nationwide newspapers, specifying e.g.<br />
• the time and place of the meeting<br />
• the proposed agenda of the General Meeting<br />
• the proposals for the number and appointment of Board<br />
members and biographical information on the candidates<br />
• the proposal prepared by the Audit Committee for the<br />
appointment of the auditor<br />
• other proposals to the General Meeting<br />
• matters placed on the General Meeting agenda for which no<br />
resolutions are proposed<br />
• a description of the procedures that shareholders must comply<br />
with in order to participate in and cast votes at the General<br />
Meeting<br />
• the ‘record date’ that defines the right to participate in and<br />
cast votes at the General Meeting<br />
• the place where the General Meeting documents and<br />
proposed resolutions are available<br />
• the address of the company website<br />
• the total number of shares and voting rights by share class on<br />
the date of the notice.<br />
The notice is delivered no earlier than two (2) months and no<br />
later than twenty-one (21) days before the record date of the<br />
General Meeting. The notice and the proposals of the company’s<br />
Board to the General Meeting are published in a stock exchange<br />
release. Proposals for the number, and proposed nominations<br />
and fees of Board members made by shareholders who hold at<br />
least 10% of the votes carried by the company shares are also<br />
published in a stock exchange release.<br />
The notice of the General Meeting and the following information<br />
is made available to shareholders on the company website<br />
at least 21 days before the General Meeting:<br />
• the documents to be submitted to the General Meeting<br />
• the resolutions proposed by the Board or another competent<br />
body.<br />
Right to participate in a General Meeting<br />
Shareholders have the right to participate in a General Meeting if<br />
they are registered as shareholders in the company’s register of<br />
shareholders kept by the Finnish Central Securities Depository Ltd<br />
at the record date separately given by the company. Those wishing<br />
to attend a General Meeting must notify their intention in<br />
advance by the date announced in the notice of the General<br />
Meeting, which date must not be earlier than ten (10) days<br />
before the meeting. Shareholders may attend the meeting themselves<br />
or through an authorised representative. The representative<br />
shall produce a proxy document or otherwise provide reliable<br />
evidence of the right to represent the shareholder. Each<br />
shareholder or representative may have one assistant at the<br />
meeting.
56 Kesko’s year <strong>2009</strong><br />
Minutes of the meeting<br />
The minutes of a General Meeting, together with voting results<br />
and appendixes relating to decisions made, can be read by<br />
shareholders on the company’s website within two (2) weeks of<br />
the meeting. Appendixes to decisions made by a General Meeting<br />
are available on the company website only insofar they describe<br />
the actual content of the decision. General Meeting decisions are<br />
also published in a stock exchange release immediately after the<br />
meeting.<br />
Presence of governing bodies at a General Meeting<br />
Kesko’s aim is that all members of the company’s Board of Directors<br />
and the auditor are present at <strong>Annual</strong> General Meetings.<br />
Extraordinary General Meeting are attended by the Chair of the<br />
company’s Board of Directors, a sufficient number of Board<br />
members and the President and CEO. First-time candidates for<br />
the Board of Directors are present at the General Meeting that<br />
elects them, unless there is a weighty reason for their absence.<br />
Share series<br />
The company has two share series, A and B shares, which differ<br />
only with respect to the votes to which they give entitlement.<br />
Each A share entitles its holder to ten (10) votes and each B share<br />
to one (1) vote at a General Meeting. When votes are taken, the<br />
proposal supported by more than half of the votes will normally<br />
be the decision of the General Meeting, as prescribed by the Limited<br />
Liability Companies Act. However, the Act specifies several<br />
matters, such as amendments to the Articles of Association and<br />
decisions on directed share issues, where a legally binding decision<br />
requires a higher qualified majority in relation to the<br />
number of shares and the votes to which they give entitlement.<br />
Kesko’s Articles of Association do not include any redemption<br />
clauses or voting restrictions. No shareholder agreements on the<br />
use of voting rights in the company or agreements on restricting<br />
the transfer of company shares are known to the company.<br />
Board of Directors and Board Committees<br />
Term, composition and<br />
independence of the Board of Directors<br />
According to the Articles of Association, the term of office of each<br />
Board member is three (3) years with the term starting at the<br />
close of the General Meeting electing the member and expiring<br />
at the close of the third (3rd) <strong>Annual</strong> General Meeting after the<br />
election.<br />
According to the Articles of Association, Kesko’s Board of<br />
Directors consists of a minimum of five (5) and a maximum of<br />
eight (8) members. The General Meeting elects all members of<br />
the Board of Directors. The Board elects the Chair and the Deputy<br />
Chair from among its members. The Board of Directors elected by<br />
Kesko’s <strong>Annual</strong> General Meeting of 30 March <strong>2009</strong> consists of<br />
seven (7) members: Heikki Takamäki (Chair), Seppo Paatelainen<br />
(Deputy Chair), Maarit Näkyvä, Ilpo Kokkila, Esa Kiiskinen, Mikko<br />
Kosonen and Rauno Törrönen. According to the Articles of Association,<br />
the term of each Board member will expire at the close<br />
of the 2012 <strong>Annual</strong> General Meeting.<br />
All of Kesko’s Board members are non-executive directors. The<br />
Board of Directors evaluates the independence of its members on<br />
a regular basis. Each Board member is obliged to provide the<br />
Board with sufficient information that will allow the Board to<br />
evaluate his/her independence. The majority of Kesko’s Board<br />
members are independent of the company and all Board members<br />
are independent of the company’s significant shareholders.<br />
Board members Heikki Takamäki, Esa Kiiskinen and Rauno Törrönen<br />
each have a corporation over which they exercise control<br />
and which has a chain agreement with a Kesko Group company.<br />
Principal duties<br />
The function of Kesko’s Board of Directors is to duly arrange the<br />
company’s management, operations and accounting, and to<br />
supervise the company’s financial management. The Board of<br />
Directors has confirmed the written rules of procedure that specify<br />
the Board of Directors’ duties, business to be handled, meeting<br />
practice and the decision-making process. The Board of<br />
Directors handles and decides on all matters that are financially,<br />
commercially or fundamentally significant for the Group’s operations.<br />
The principal duties of the Board of Directors include:<br />
• making decisions on Group strategy and confirming strategies<br />
for the divisions<br />
• confirming the Group’s rolling plan, which includes the<br />
investment plan<br />
• approving the Group’s financing and investment policy<br />
• confirming the Group’s risk management policy and handling<br />
the Group’s major risks and uncertainties<br />
• confirming the Group’s insurance policy<br />
• handling and adopting consolidated financial statements,<br />
interim reports and related stock exchange releases and the<br />
report by the Board of Directors<br />
• making decisions on strategically or financially important<br />
individual capital expenditure, acquisitions, disposals or other<br />
arrangements, and contingent liabilities<br />
• making decisions on management authorisation rules<br />
• making decisions on key Group structure and organisation<br />
• appointing and dismissing the company’s President and CEO<br />
approving his/her managing director’s service contract and<br />
making decisions on his/her salary and other financial<br />
benefits<br />
• approving the appointments, salaries and financial benefits<br />
of the Corporate Management Board members responsible for<br />
business divisions<br />
• making decisions on Kesko’s remuneration systems including<br />
possible granting of stock options within the terms and<br />
conditions decided by the General Meeting<br />
• establishing a dividend policy and being responsible for the<br />
development of shareholder value<br />
• confirming the company’s values<br />
•<br />
handling the Corporate Responsibility <strong>Report</strong>.
Decision-making, activities and meetings<br />
The purpose of Kesko’s Board of Directors is to promote the interests<br />
of Kesko and all its shareholders. In the company, the Board<br />
members do not represent the interests of the parties who proposed<br />
their election. Board members are disqualified from participating<br />
in the handling of any matter between him/her and<br />
the company. When a vote is taken, the Board of Directors’ decision<br />
will be the opinion of the majority. If the vote results in a<br />
tie, the decision will be the opinion supported by the Chair. If<br />
the votes cast at an election end in a tie, the results will be<br />
decided by drawing lots.<br />
The Board met 10 times in <strong>2009</strong>, and the average attendance<br />
at meetings was 98.6%. New Board members were systematically<br />
introduced to Kesko’s activities during the year.<br />
At its meetings, the Board of Directors has focused particularly<br />
on strategies of the Kesko Group and its divisions. At the meetings,<br />
the Board receives regular reviews from the President and<br />
CEO, handles financial reports and actively monitors the financial<br />
situation of the Kesko Group. It also approves major capital<br />
expenditure, such as store site investments. On the basis of the<br />
Kesko’s year <strong>2009</strong><br />
Members of Kesko Corporation’s Board of Directors and its Committees and their attendance at meetings in <strong>2009</strong><br />
Attendance<br />
Committee membership Board<br />
Audit<br />
Committee<br />
Remuneration<br />
Committee<br />
Heikki Takamäki (Chair) Remuneration Committee (Chair) 10/10 - 3/3<br />
Esa Kiiskinen** 8/8 - -<br />
Ilpo Kokkila Remuneration Committee** 10/10 - 3/3<br />
Mikko Kosonen** Audit Committee 8/8 4/4 -<br />
Maarit Näkyvä Audit Committee (Chair) 10/10 5/5 -<br />
Seppo Paatelainen (Dep. Chair since<br />
30.3.<strong>2009</strong>) Audit Committee, Remuneration Committee** 9/10 4/5 3/3<br />
Rauno Törrönen** 8/8 - -<br />
Keijo Suila (Dep. Chair until 30.3.<strong>2009</strong>)* Audit Committee, Remuneration Committee 2/2 1/1 -<br />
Pentti Kalliala* Remuneration Committee 2/2 - -<br />
Jukka Säilä* - 2/2 - -<br />
Independence of the Board members in <strong>2009</strong><br />
Independent of the company<br />
Independent of significant<br />
shareholders<br />
Heikki Takamäki (Chair) No*** Yes<br />
Esa Kiiskinen** No*** Yes<br />
Ilpo Kokkila Yes Yes<br />
Mikko Kosonen** Yes Yes<br />
Maarit Näkyvä Yes Yes<br />
Seppo Paatelainen (Dep. Chair since 30.3.<strong>2009</strong>) Yes Yes<br />
Rauno Törrönen** No*** Yes<br />
Keijo Suila (Dep. Chair until 30.3.<strong>2009</strong>)* Yes Yes<br />
Pentti Kalliala* No*** Yes<br />
Jukka Säilä* No*** Yes<br />
* until 30 March <strong>2009</strong><br />
** since 30 March <strong>2009</strong><br />
*** The companies in which Kalliala, Kiiskinen, Säilä, Takamäki and Törrönen exercise control each have a chain agreement with a Kesko Group company.<br />
57<br />
Audit Committee’s recommendation, the Board handles and<br />
approves the interim reports and the financial statements before<br />
they are published. The Board also discusses reports on committee<br />
meetings, made by the Chairs of the Audit Committee and the<br />
Remuneration Committee. The auditor presents his findings to<br />
the Board once a year.<br />
The Board of Directors regularly assesses its operations and<br />
working practices and carries out a related self-assessment once<br />
a year. Most recently the Board made a self-assessment of its<br />
operations and working practices in December <strong>2009</strong>. This was<br />
based on a questionnaire, followed by a discussion on the results<br />
and further actions. On the basis of the assessment, the Board of<br />
Directors decided to continue to focus on strategies.<br />
Committees of the Board of Directors<br />
The Board of Directors has an Audit Committee and a Remuneration<br />
Committee, both of which consist of three (3) Board members.<br />
At the close of the <strong>Annual</strong> General Meeting, the Board of<br />
Directors elects the Chairs and the members of the Committees<br />
from among its members for one year at a time. All members of
58 Kesko’s year <strong>2009</strong><br />
the Audit Committee are independent of the company and its<br />
significant shareholders. All members of the Remuneration Committee<br />
are independent of the company’s significant shareholders<br />
and the majority of them are also independent of the company.<br />
The Committees regularly assess their operations and working<br />
practices and carry out a related self-assessment once a year.<br />
The Board of Directors has confirmed written rules of procedure<br />
for the Committees that lay down their key duties and operating<br />
policies.<br />
The Committees have no independent decision-making<br />
power, but the Board makes decisions based on the preparations<br />
made by the Committees. The Chair of the Committee reports on<br />
the work of the Committee at the Board of Directors meeting following<br />
the Committee meeting. Minutes of all Committee meetings<br />
are submitted to Board members for information.<br />
Kesko’s Board of Directors has not established any other committees<br />
in addition to the Audit and Remuneration Committees.<br />
Audit Committee and its activities<br />
The Audit Committee comprises Maarit Näkyvä (Chair), Seppo<br />
Paatelainen and Mikko Kosonen.<br />
According to the rules of procedure, the duties of the Audit<br />
Committee include:<br />
• monitoring the financial position and financing of the Kesko<br />
Group<br />
• monitoring the company’s financial statements reporting<br />
process<br />
• supervising the company’s financial reporting process<br />
• evaluating the efficiency of the company’s internal control,<br />
internal audit and risk management systems<br />
• handling the Corporate Governance Statement submitted by<br />
the company, including a description of the main features of<br />
the internal control and risk management systems related to<br />
the financial reporting process<br />
• handling the plans and reports of the Corporate Internal Audit<br />
• monitoring the statutory audit of the financial statements and<br />
consolidated financial statements<br />
• evaluating the independence of the company’s audit firm<br />
• evaluating the related services provided to Kesko by the<br />
company’s audit firm and the audit companies belonging to<br />
the same chain<br />
• preparing the draft resolution concerning the election of the<br />
company’s auditor<br />
• maintaining contact with the company’s auditor.<br />
The Audit Committee met five (5) times in <strong>2009</strong>, and the average<br />
attendance at meetings was 93.3%. At Committee meetings, the<br />
CFO, the Corporate Controller, the Chief Audit Executive and the<br />
General Counsel of the Group give regularly reports on their areas<br />
of responsibility to the Committee. The Committee also receives<br />
information on the Kesko Group’s financing, risk management<br />
and insurances. The auditor is present at meetings and presents<br />
his audit plan and report to the Audit Committee.<br />
During the year, the Committee handled reports on the financial<br />
position of the Group, including the financial statements<br />
release and interim reports before they were published and recommended<br />
that the Board of Directors discuss the interim reports<br />
and the financial statements release. It discussed the Group’s<br />
external and internal audit and risk management reports, and<br />
made a proposal to the <strong>Annual</strong> General Meeting on the auditor<br />
to be elected for Kesko.<br />
Remuneration Committee and its activities<br />
The Remuneration Committee comprises Heikki Takamäki (Chair),<br />
Seppo Paatelainen and Ilpo Kokkila.<br />
According to the rules of procedure, the duties of the Remuneration<br />
Committee include:<br />
• preparing the salary and other financial benefits of the<br />
company’s President and CEO for the company’s Board of<br />
Directors<br />
• preparing the salaries and other financial benefits of the<br />
Corporate Management Board members responsible for the<br />
business divisions<br />
• preparing the appointment matters of the President and CEO<br />
and the Corporate Management Board members responsible<br />
for the business divisions and the assessment of their<br />
successors<br />
• preparing and developing the company’s remuneration<br />
systems, including the preparation of matters related to the<br />
possible granting of stock options for the company’s Board of<br />
Directors on terms and conditions decided by a General<br />
Meeting.<br />
The Remuneration Committee met three (3) times in <strong>2009</strong>, and<br />
the average attendance at meetings was 100%. The committee<br />
prepared a proposal for the Board of Directors on granting stock<br />
options as part of the Group executives’ and other key persons’<br />
long-term incentive system, and approved the principles of the<br />
Group’s performance bonus system. It also monitored progress<br />
on the Group’s work and productivity programme.<br />
Further information on Kesko’s Board members is available on<br />
pages 66–67 and at www.kesko.fi.<br />
President and CEO<br />
Kesko’s President and CEO is Matti Halmesmäki, M.Sc. (Econ.),<br />
LL.M. He has been Kesko’s President and CEO since 1 March 2005.<br />
The President and CEO is responsible for managing the company’s<br />
activities within the guidelines and limits set by the Board<br />
of Directors, and informing the Board of Directors about the<br />
development of the company’s business and financial position.<br />
He is also responsible for arranging the company’s day-to-day<br />
administration and for ensuring the reliable arrangement of<br />
the company’s financial administration. The President and CEO<br />
also chairs the Corporate Management Board and the Boards<br />
of the Group’s major subsidiaries, such as Kesko Food Ltd and<br />
Rautakesko Ltd.<br />
The President and CEO is elected by the Board of Directors,<br />
which also decides on the terms of the President and CEO’s<br />
service contract.
A written managing director’s service contract has been made<br />
between the company and the President and CEO.<br />
Further information on Kesko’s President and CEO is presented<br />
on page 68 and at www.kesko.fi.<br />
Corporate Management Board<br />
The Kesko Group has a Corporate Management Board, the Chair of<br />
which is Kesko’s President and CEO.<br />
The Corporate Management Board has no authority based on<br />
legislation or the Articles of Association. The Corporate Management<br />
Board is responsible for dealing with Group-wide development<br />
projects and Group-level policies and practices. In addition,<br />
the Corporate Management Board deals with the Group’s<br />
and the division parent companies’ business plans, profit performance<br />
and matters handled by Kesko’s Board of Directors, in<br />
whose preparation it also participates. The Corporate Management<br />
Board meets 8–10 times a year.<br />
Further information on Kesko’s Corporate Management Board<br />
is presented on pages 68–69 and at www.kesko.fi.<br />
Kesko’s year <strong>2009</strong><br />
<strong>Annual</strong> and monthly fees paid to the members of the Board of Directors in <strong>2009</strong> for Board and Committee work<br />
<strong>Annual</strong> fees<br />
Members of the Corporate Management Board and<br />
their responsibility areas in <strong>2009</strong><br />
Corporate Management Board<br />
member since<br />
Matti Halmesmäki, Chair 1.1.2001<br />
Board of Directors’ annual and meeting fees in 2006–<strong>2009</strong>, decided by the <strong>Annual</strong> General Meeting<br />
<strong>Annual</strong> fee Fee per year, €<br />
Meeting fees<br />
Board Audit Committe<br />
<strong>2009</strong> 2006–2008<br />
Chair of the Board 80,000 60,000*<br />
Deputy Chair of the Board 50,000 42,000*<br />
Board member 37,000 30,000*<br />
Meeting fees Fee per meeting, €<br />
<strong>2009</strong> 2006–2008<br />
Fee for Board meeting 500 500<br />
Fee for Committee meeting 500 500<br />
Fee to Chair for Committee meeting<br />
if he/she is not also Chair or Deputy Chair of the Board 1,000 1,000<br />
* Monthly fees decided in 2006–2008 have been converted into annual fees.<br />
Remuneration<br />
Committee<br />
Responsibility<br />
area<br />
Kesko’s<br />
President and CEO<br />
Terho Kalliokoski<br />
President of Kesko Food Ltd 17.3.2005 Food trade<br />
Jari Lind<br />
President of Rautakesko Ltd 1.3.2005<br />
Matti Leminen<br />
President of Anttila Oy 1.1. 2007<br />
Pekka Lahti<br />
President of VV-Auto Group Oy 1.3.2005<br />
Building and home<br />
improvement trade<br />
Home and<br />
speciality goods<br />
trade<br />
Car and<br />
machinery trade<br />
Arja Talma, Kesko’s Senior Vice<br />
President, CFO<br />
Riitta Laitasalo<br />
Kesko’s Senior Vice President,<br />
17.3.2005 Finance<br />
Human Resources 1.1.2001 Human Resources<br />
Paavo Moilanen<br />
Kesko’s Senior Vice President,<br />
Corporate Communications and<br />
Responsibility 13.10.2005<br />
Corporate<br />
Communications<br />
and Responsibility<br />
Heikki Takamäki (Chair) 75,000 5,000 - 1,500 81,500<br />
Esa Kiiskinen** 27,750 4,000 - - 31,750<br />
Ilpo Kokkila 35,250 5,000 - 1,500 41,750<br />
Mikko Kosonen** 27,750 4,000 2,000 - 33,750<br />
Maarit Näkyvä 35,250 5,000 5,000 - 45,250<br />
Seppo Paatelainen (Dep. Chair since<br />
30.3.<strong>2009</strong>) 45,000 4,500 2,000 1,500 53,000<br />
Rauno Törrönen** 27,750 4,000 - - 31,750<br />
Keijo Suila (Dep. Chair until 30.3.<strong>2009</strong>)* 10,500 1,000 500 - 12,000<br />
Pentti Kalliala* 7,500 1,000 - - 8,500<br />
Jukka Säilä* 7,500 1,000 - - 8,500<br />
Total<br />
* until 30 March <strong>2009</strong> ** since 30 March <strong>2009</strong><br />
299,250 34,500 9,500 4,500 347,750<br />
Total,<br />
€<br />
59
60 Kesko’s year <strong>2009</strong><br />
Remuneration<br />
Remuneration and other financial benefits of<br />
the Board of Directors and its Committees<br />
The <strong>Annual</strong> General Meeting makes decisions on the annual<br />
remuneration and other financial benefits of the members of the<br />
Board of Directors and its Committees. All fees of the members of<br />
the Board and its Committees are paid in cash. Board members<br />
have no share or share-linked remuneration systems.<br />
Remuneration of the President and<br />
CEO and other executives<br />
The remuneration system of the President and CEO and other<br />
executives of Kesko consists of a fixed monthly salary, a performance<br />
bonus based on criteria set annually, an executive’s pension<br />
benefits, and a stock option system. The company has no share<br />
remuneration system.<br />
Kesko’s Board of Directors makes decisions on the individual<br />
salaries and other financial benefits of the President and CEO and<br />
the Corporate Management Board members responsible for the<br />
business divisions, on the principles of the performance bonus<br />
system, and on the bonuses to be paid. As for the other executives,<br />
Kesko’s Board of Directors makes decisions on performance<br />
bonus principles. The President and CEO makes decisions on the<br />
salaries and bonuses of Corporate Management Board members<br />
other than those mentioned above and on the details of other<br />
executives’ performance bonus systems, following the one-overone<br />
principle. Depending on the profit impact of each management<br />
position, the maximum bonuses of Kesko’s President and<br />
CEO and other company executives can vary up to an amount<br />
corresponding to an executive’s salary for 3–8 months. The performance<br />
bonus criteria consist of the Group’s profit before<br />
extraordinary items and tax, the executive’s area-specific EP ratio<br />
and operating profit, net sales performance, customer and personnel<br />
indicators, and an overall assessment. The results used as<br />
the basis for the performance bonuses are exclusive of nonrecurring<br />
items, and the weights given to the bonus criteria vary<br />
depending on the task. Bonuses are paid at the end of March,<br />
after the annual financial statements have been completed. The<br />
management’s performance bonus system covers about 100<br />
executives of the Kesko Group.<br />
In addition, Kesko has a valid year 2003 stock option scheme<br />
for Kesko Group executives, which expires on 30 April 2010, and<br />
a valid year 2007 stock option scheme for Group executives and<br />
other key persons. The 2007 option scheme includes an obligation<br />
placed by Kesko’s Board of Directors on option recipients to<br />
use 25% of their option income to buy company shares for permanent<br />
ownership. Kesko’s Board of Directors makes decisions<br />
on the distribution of stock options on the basis of proposals<br />
Salaries, bonuses and fringe benefits of the President and CEO and the Corporate Management Board in 2008–<strong>2009</strong><br />
Fixed salary Bonuses Fringe benefits Total<br />
<strong>2009</strong> 2008 <strong>2009</strong>** 2008*** <strong>2009</strong> 2008 <strong>2009</strong> 2008<br />
Matti Halmesmäki 569,300 541,100 152,250 280,000 23,014 17,460 744,564 838,560<br />
Corporate Management<br />
Board* 1,415,291 1,359,636 93,650 346,910 112,441 101,085 1,621,382 1,807,631<br />
Total 1,984,591 1,900,736 245,900 626,910 135,455 118,545 2,365,946 2,646,191<br />
* excluding President and CEO Matti Halmesmäki ** based on 2008 performance ***based on 2007 performance<br />
Stock options granted to the members of the Corporate Management Board in 2007–<strong>2009</strong>, and the members’<br />
retirement age and benefits, notice period and severance pay<br />
Retirement<br />
benefits*, pen-<br />
Granted stock options<br />
sion as % of<br />
pensionable Notice period,<br />
<strong>2009</strong> (2007C) 2008 (2007B) 2007 (2007A) Retirement age<br />
salary months Severance pay<br />
Matti Halmesmäki, Chair 50,000 50,000 50,000 60 66 6 12 months’ salary<br />
Terho Kalliokoski 30,000 25,000 25,000 62 66 6 6 months’ salary<br />
Jari Lind 25,000 25,000 25,000 62 66 6 6 months’ salary<br />
Matti Leminen 20,000 20,000 20,000 60 66 6 12 months’ salary<br />
Pekka Lahti 20,000 20,000 20,000 62 66 6 6 months’ salary<br />
Based on the Based on the<br />
Employees’ Employees’<br />
Arja Talma 25,000 25,000 25,000 Pensions Act Pensions Act 6 6 months’ salary<br />
Riitta Laitasalo 15,000 15,000 15,000 60 66 6 12 months’ salary<br />
Paavo Moilanen 15,000 15,000 15,000 60 66 6 12 months’ salary<br />
Total 200,000 195,000 195,000<br />
* Supplementary pension benefits are granted by department A of the Kesko Pension Fund in accordance with its rules.
made by the Remuneration Committee and within the terms and<br />
conditions of the stock option scheme decided by the company’s<br />
General Meeting.<br />
Further information on the terms and conditions of Kesko’s<br />
stock option schemes is available on pages 147–148 and at<br />
www.kesko.fi.<br />
Outline of internal control and risk management<br />
systems related to the Group’s financial reporting<br />
Kesko’s management system<br />
Kesko’s financial reporting and planning are based on the Kesko<br />
Group’s management system (Fig. 1). The Group units’ financial<br />
results are reported and analysed inside the Group on a monthly<br />
basis, and disclosed in interim reports published quarterly.<br />
Financial plans are prepared for quarterly periods, in addition to<br />
which significant changes are taken into account in the monthly<br />
performance forecasts. The Group’s and its units’ strategies and<br />
related long-term financial plans are updated annually.<br />
Roles and responsibilities<br />
The Kesko Group’s financial reporting and its control is divided<br />
between three organisational levels. The subsidiaries analyse and<br />
report their figures to the respective divisions, which then report<br />
the division-specific figures to Corporate Accounting. Analyses<br />
and controls for ensuring the correctness of reporting are used at<br />
each level.<br />
Interim<br />
report<br />
Rolling<br />
planning and<br />
risk<br />
assessment<br />
Fig 1.<br />
The Kesko Group’s management system<br />
Monthly reporting<br />
STRATEGIC IMPLEMENTATION<br />
Interim<br />
report<br />
Vision<br />
Values<br />
Strategic<br />
emphases<br />
Operating<br />
principles<br />
Rolling<br />
planning<br />
and risk<br />
assessment<br />
JANUARY FEBRUARY MARCH APRIL MAY JUNE JULY AUGUS SEPTEMBER OCTOBER NOVEMBER DECEMBER<br />
STRATEGIC PROCESS<br />
Monthly reporting<br />
Rolling<br />
planning and<br />
risk<br />
assessment<br />
Financial<br />
statements<br />
release<br />
<strong>Annual</strong> <strong>Report</strong><br />
Rolling<br />
planning and<br />
risk assessment<br />
Corporate<br />
Responsibility<br />
<strong>Report</strong><br />
Interim report<br />
Kesko’s year <strong>2009</strong><br />
The correctness of reporting is ensured by using different<br />
automated and manual controls at every reporting level. In<br />
addition, the income statement and balance sheet are analysed<br />
by controllers at subsidiary, division and Group level every<br />
month. The implementation of analyses and controls is supervised<br />
on a monthly basis at company, division and Group level.<br />
61<br />
Planning and performance reporting<br />
The Group’s financial performance and the achievement of<br />
financial objectives are monitored via Group-wide financial<br />
reporting. Monthly performance reporting includes Group-, division-<br />
and subsidiary-specific results, progress compared to the<br />
previous year, comparisons with financial plans, and forecasts for<br />
the next 12 months. The Group’s short-term financial planning<br />
is based on plans drawn up by the quarter, extending for 15<br />
months. The financial indicator for growth is sales performance,<br />
while that for profitability is the accumulation of economic value<br />
added, monitored via monthly internal reporting. When calculating<br />
economic value added, the requirements concerning return<br />
on capital are determined annually on market terms, and the<br />
performance requirements take account of risk-related division-<br />
and country-specific differences. Information about the Group’s<br />
financial situation is given by interim reports and the financial<br />
statements release. The Group’s sales figures are published in a<br />
stock exchange release each month.
62 Kesko’s year <strong>2009</strong><br />
Financial planning takes place in the subsidiaries, divisions<br />
and the Group where rolling plans, each for a 15-month period,<br />
are made. The plans are updated quarterly, and any significant<br />
changes are taken into account in the monthly performance<br />
forecasts. Any deviations between the plan and the actual result<br />
are analysed by the company, division and Corporate Accounting,<br />
and the reasons are reported to the division and Corporate<br />
Accounting every month.<br />
The performance reports provided monthly for the Group’s top<br />
management comprise the subsidiaries’, divisions’ and the consolidated<br />
income statements and balance sheets. Each subsidiary<br />
is primarily responsible for the financial reporting and the correctness<br />
of its figures. The financial management and the controlling<br />
function of each division analyse the respective division’s<br />
figures, while Corporate Accounting analyses the whole Group’s<br />
figures. The income statement and the balance sheet are analysed<br />
monthly at the company, division and Group level, based<br />
on the documented division of duties and specified reports. This<br />
enables a real-time knowledge of the financial situation, as well<br />
as real-time response to possible defects. The performance<br />
reports provided for the top management also include Grouplevel<br />
monitoring of sales on a weekly, monthly and quarterly<br />
basis.<br />
Public performance reporting comprises interim reports, the<br />
annual financial statements and monthly sales reports. The same<br />
principles and control methods are applied to the public performance<br />
reporting as to the monthly performance reporting. The<br />
Audit Committee reviews the interim report and the financial<br />
statements and gives a recommendation to the Board of Directors.<br />
The Board of Directors approves the interim report and the<br />
financial statements before they are published.<br />
Accounting policies and<br />
financial management IT systems<br />
The Kesko Group has adopted the International Financial <strong>Report</strong>ing<br />
Standards (IFRSs) endorsed by the European Union. The<br />
accounting policies adopted by the Group are included in the<br />
accounting manual, updated as the standards are amended. The<br />
manual contains guidelines for stand-alone companies, the parent<br />
company, and instructions for the preparation of consolidated<br />
financial statements.<br />
The Kesko Group’s financial management information is generated<br />
by division-specific enterprise resource planning systems,<br />
via a centralised and controlled common interface, into the<br />
Group’s centralised consolidation system, to produce the Group’s<br />
main financial reports. The key systems used in the production of<br />
financial information are certified and secured by back-up systems,<br />
and they are controlled and checked regularly to ensure<br />
reliability and continuity.<br />
Risk management and internal audit<br />
Risk management is an integral part of Kesko’s<br />
management<br />
Kesko’s risk management is proactive and an integral part of<br />
management and day-to-day activities. The objective of Kesko’s<br />
risk management is to ensure the implementation of Group<br />
strategies, the delivery of customer promises, the maintenance of<br />
shareholder value, and the continuity of business. Efficient risk<br />
management is a competitive advantage for Kesko.<br />
The risk management policy approved by the Board of Directors<br />
guides risk management in the Kesko Group. The policy<br />
defines the objectives, principles, responsibilities and key practices<br />
of risk management. Kesko divides risks into strategic,<br />
financial, operational and damage/loss risks.<br />
In the Kesko Group, a risk is defined as any kind of uncertainty<br />
that may lead to:<br />
• a failure to exploit business opportunities,<br />
• events or reasons which prevent or hinder the attainment of<br />
objectives or have other unwanted consequences.<br />
The Kesko Group applies a business-oriented and comprehensive<br />
approach to risk assessment and management. This means that<br />
key risks are systematically identified, assessed, managed, monitored<br />
and reported as part of business activities at the Group,<br />
division, company and unit levels in all the countries where<br />
Kesko operates. Risk identification and assessment play a key role<br />
in Kesko’s strategies and rolling planning.<br />
Kesko has a uniform risk assessment and reporting system.<br />
Risks are identified and prioritised by assessing the impact and<br />
probability of their materialisation, and the level of management.<br />
An owner is named for all risks and the most significant<br />
risks are analysed in detail to find out causes and effects. The<br />
risks classified as critical are regularly dealt with by the Corporate<br />
Management Board, which also monitors the actions taken. The<br />
development of the risk situation is also assessed on the basis of<br />
the progress made through these actions and the changes in<br />
external factors, for example. In risk assessments the time span<br />
is one year, except for strategic risks where the span is 3–5 years.<br />
The outcome is a clearer picture of the scope, mutual relations<br />
and expected trends of the risks.<br />
The management of financial risks is based on the Group’s<br />
treasury policy, confirmed by Kesko’s Board of Directors. The<br />
Group Treasury is centrally responsible for funding, liquidity<br />
management, debt investor relations and the management<br />
of financial risks.<br />
Providing insurance cover is part of Kesko’s risk management,<br />
and the insurance policy confirmed by Kesko’s Board of Directors<br />
defines the principles of providing insurance. The aim is to<br />
ensure that the Group’s employees, property, business and liabilities<br />
have proper and economical insurance cover, while taking<br />
account of legislative requirements, and the Group’s current risks<br />
and risk-bearing capacity. The Group’s risk management functions<br />
are responsible for providing Group-level insurance
programmes, for their competitive tendering and for brokerage<br />
services as part of the Group’s damage/loss risk management.<br />
The Kesko Group’s principles of risk management<br />
Objectives relating to risks and opportunities are set for the divisions<br />
and the business operations.<br />
• We take conscious and carefully evaluated risks within the<br />
limits set in strategy selections e.g. in expanding business<br />
operations, in enhancing market position and power, and in<br />
creating new business. Risk-taking is based on the defined<br />
risk-bearing capacity.<br />
• We avoid or reduce financial, operational and damage/loss<br />
risks.<br />
• We ensure a safe shopping environment for customers and<br />
product safety.<br />
• We create a safe working environment for employees.<br />
• We minimise opportunities for unhealthy phenomena, crime<br />
or malpractice through operating principles, controls and<br />
supervision.<br />
• The continuity of operations is ensured by safeguarding critical<br />
functions and essential resources.<br />
• Crisis management and continuity plans are prepared in case<br />
any risks are realised.<br />
• The costs and resources involved in risk management are in<br />
proportion to the obtainable benefits.<br />
• Information on risks and risk management is provided to<br />
stakeholders.<br />
Responsibilities and roles in risk management<br />
The business division and Group management are responsible for<br />
risk management in practice. Each division has appointed one<br />
Board member, usually the finance director, to be responsible for<br />
coordinating risk management and security and providing guidelines<br />
in each respective division and reporting on risk management<br />
activities. In addition, the food, building and home<br />
improvement, and home and speciality goods divisions each<br />
have a risk manager who is responsible for the development and<br />
control of risk management and security in the division in cooperation<br />
with the business management and supporting functions.<br />
The Group’s risk management function controls and coordinates<br />
the development of joint risk management and security<br />
procedures, introduces best practices to the Group and reports on<br />
risk management to the Group management.<br />
Kesko has a Group-level Risk Management Steering Group,<br />
which is chaired by the President and CEO, and consists of the<br />
representatives of the management of the various divisions and<br />
Group units. The Steering Group discusses risk management and<br />
safety procedures and key policy definitions, and assesses and<br />
monitors the Group’s risks and safety situation, and the implementation<br />
of risk management responses.<br />
Kesko’s Board of Directors discusses the major risks and the<br />
responses required to control them, and assesses the efficiency<br />
of risk management. Significant risks and uncertainties, as well<br />
Kesko’s year <strong>2009</strong><br />
as changes in and responses to them, are reported to Kesko’s<br />
Board of Directors’ Audit Committee when the interim reports are<br />
handled. The Board of Directors also submits reports to the market<br />
on significant risks and uncertainties in connection with the<br />
financial statements as part of the <strong>Report</strong> by the Board of Directors.<br />
The Corporate Internal Audit annually assesses the efficiency<br />
of the Group’s risk management and reports on it to Kesko’s<br />
Board of Directors’ Audit Committee.<br />
63<br />
Risk management in <strong>2009</strong><br />
As a result of the global financial crisis, risk management has<br />
become increasingly important. Risk management has been harmonised<br />
in the Kesko Group and divisional management now<br />
plays an increasingly important role in risk management. The risk<br />
assessment and management system has been made more<br />
explicit, and the process is now more efficiently applied in all<br />
countries where Kesko operates.<br />
The divisions have made their risk assessments and updated<br />
them according to the schedule of the strategy process and rolling<br />
planning. The management of the division parent companies<br />
and the Group have discussed the companies’ risks and how to<br />
manage them. In their own areas of responsibility, the Group<br />
units have also analysed the risks threatening Group objectives<br />
and how to manage them.<br />
On the basis of these risk analyses, the Group’s risk management<br />
function has prepared summaries of significant risks and<br />
their management on a quarterly basis. The resulting risk report<br />
has been handled by the Audit Committee of Kesko’s Board of<br />
Directors. Major risks and uncertainties have been reported in<br />
connection with the interim reports.<br />
Continuity has been ensured by updating the existing continuity<br />
and contingency plans, arranging crisis exercises and<br />
appointing substitutes for people in critical duties. Preparations<br />
for the swine flu pandemic started in the spring. The risk management<br />
function has also arranged competitive tendering of<br />
insurances, improved loss prevention and the safety of shopping<br />
centres. As a result of the ‘glass splint problem’ that spread from<br />
Sweden, Kesko revised its instructions relating to groceries.<br />
Focal areas of risk management in 2010<br />
Kesko’s risk management function will continue its work to<br />
reduce wastage, prevent malpractice, maintain and test continuity<br />
plans, and provide cost-efficient insurance services. Management’s<br />
crisis exercises will be arranged on a more regular basis.<br />
The risk reporting model will be developed, for example, by<br />
improving the use of electronic portals.<br />
The risk management function works in close cooperation<br />
with other Group units, particularly with the finance, treasury<br />
and IT functions. Cooperation will be improved with the Corporate<br />
Internal Audit and responsibility functions in order to ensure<br />
that ethical working principles are implemented and the<br />
management of environmental risks improves.
64 Kesko’s year <strong>2009</strong><br />
Significant risks and uncertainties related to Kesko’s business<br />
operations and risk management responses are described in the<br />
<strong>Report</strong> by the Board of Directors on pages 71–77, in notes Nos.<br />
44–45 to the consolidated financial statements on pages 133–<br />
135 and at www.kesko.fi.<br />
Internal audit<br />
Kesko’s Corporate Internal Audit is responsible for the Group’s<br />
independent assessment and assurance function, required from<br />
a listed company, which systematically defines and verifies the<br />
efficiency of risk management and control, as well as of management<br />
and administration. The management and organisation<br />
are supported to ensure that Kesko’s goals and objectives are<br />
achieved, and to develop the control system. The Audit Committee<br />
of Kesko’s Board of Directors has confirmed the Charter of<br />
Kesko’s Corporate Internal Audit.<br />
The Corporate Internal Audit works under the Group’s President<br />
and CEO and the Audit Committee, and it reports on its<br />
audit findings and recommendations to the Audit Committee,<br />
the President and CEO, the management of the audited activity<br />
or business, and the external auditors. The function covers all of<br />
Kesko’s divisions, companies and activities. The Corporate Internal<br />
Audit is divided into the foreign audit, the Group audit and<br />
the IT audit and has a staff of 11. Auditing is based on risk analyses<br />
and the control discussions carried on with Group and divisional<br />
management. An internal audit plan, subject to approval<br />
by the President and CEO and the Audit Committee, is prepared<br />
annually. The Corporate Internal Audit can also carry out special<br />
audits during the year. If required, the unit acquires external<br />
services for occasional needs or assessment assignments that<br />
require special competence.<br />
The Corporate Internal Audit cooperates with the Group’s risk<br />
management function and participates in the work of the Risk<br />
Management Steering Group. The Corporate Internal Audit<br />
assesses the effectiveness of Kesko’s risk management system<br />
annually.<br />
According to its Charter, the Corporate Internal Audit must<br />
have sufficient resources available and the knowledge, skills and<br />
other competencies needed for performing its duties. The auditors’<br />
competencies are developed by systematic professional<br />
Auditors’ fees:<br />
€ thousand<br />
Kesko<br />
Corporation<br />
PwC<br />
education and examinations. Kesko’s Corporate Internal Audit<br />
currently has six employees with the international qualification<br />
of Certified Internal Auditor, granted by the Institute of Internal<br />
Auditors (IIA). The extent and expertise of auditing is ensured<br />
and coordinated by regular contacts and exchange of information<br />
with the Group’s other internal assurance operations and external<br />
auditors.<br />
The focal areas in the internal audit have included foreign<br />
operations and corporate IT. In foreign operations audits, the<br />
emphasis has been on basic controls and the management of<br />
goods stocks and trade receivables, while in the corporate IT<br />
audit special attention has been paid to new systems projects, IT<br />
continuity and security. Compliance with Kesko’s accounting policies<br />
and reporting guidelines has been verified and assessed in<br />
audits in Finland and other countries.<br />
Auditing<br />
According to the Articles of Association, Kesko has one (1) auditor,<br />
which shall be an audit firm authorised by the Central Chamber<br />
of Commerce. The Board of Directors’ Audit Committee prepares<br />
the Board’s proposal concerning the company’s auditor for presentation<br />
at a General Meeting. The term of an auditor is the<br />
company’s financial period and an auditor’s duties terminate at<br />
the close of the <strong>Annual</strong> General Meeting following the election.<br />
A company belonging to the same chain as the audit firm<br />
represented by the auditor elected by Kesko’s General Meeting<br />
acts primarily as the auditor of the Group subsidiaries outside<br />
Finland.<br />
The <strong>2009</strong> <strong>Annual</strong> General Meeting re-elected PricewaterhouseCoopers<br />
Oy, Authorised Public Accountants, as the company’s<br />
auditor, with APA Johan Kronberg as the auditor with principal<br />
responsibility. PricewaterhouseCoopers Oy acts primarily as<br />
the auditor of all subsidiaries, coordinates auditing and prepares<br />
a compilation report about its findings to the Audit Committee<br />
for all the auditors of Group companies. Auditors annually audit<br />
both individual legal companies and the consolidated financial<br />
statements.<br />
The auditor presents the audit report required by law to Kesko’s<br />
shareholders in connection with the company’s financial<br />
statements. The auditor regularly participates in the meetings of<br />
<strong>2009</strong> 2008<br />
Other Group<br />
companies<br />
Other audit<br />
companies Total PwC<br />
Kesko<br />
Corporation<br />
Other Group<br />
companies<br />
Other audit<br />
companies Total<br />
Auditing 129 717 63 909 84 785 155 1,024<br />
Tax counselling 16 48 50 114 122 49 46 216<br />
IFRS counselling 6 - 2 8 24 - 4 28<br />
Other services 82 74 101 257 109 570 259 938<br />
Total 233 839 216 1,288 339 1,404 464 2,206
the Audit Committee, and reports on his findings to it. The Audit<br />
Committee regularly assesses the independence of the audit firm<br />
and the auxiliary services provided by it.<br />
Insider administration<br />
Kesko’s insider regulations<br />
Kesko complies with the insider guidelines of NASDAQ OMX Helsinki<br />
Ltd., effective as of 9 October <strong>2009</strong>. Kesko’s Board of Directors<br />
has confirmed Kesko’s insider regulations for permanent and<br />
project-specific insiders. The contents of the regulations correspond<br />
with the insider rules of NASDAQ OMX Helsinki Ltd. Kesko’s<br />
insider regulations have been distributed to all insiders.<br />
Kesko’s permanent insiders and insider registers<br />
In accordance with the Securities Markets Act, Kesko’s permanent<br />
public insiders include Kesko’s Board members, the President<br />
and CEO (managing director), and the audit firm’s auditor with<br />
principal responsibility for Kesko. Kesko Corporation’s Board of<br />
Directors has also stipulated that, in addition to the President<br />
and CEO, other members of the Corporate Management Board are<br />
regarded as the company’s permanent public insiders. All permanent<br />
public insiders and the statutory information about<br />
them, their related persons and the corporations that are controlled<br />
by related persons or in which they exercise influence,<br />
have been entered in Kesko’s register of public insiders.<br />
Other permanent insiders of Kesko include persons working in<br />
positions determined by the Board of Directors who, in their<br />
duties, receive insider information on a regular basis and who<br />
are thus entered in the company’s own, non-public insider<br />
register. Kesko’s company-specific insider register is divided<br />
into individual registers that consist of permanent insiders and<br />
of possible insider projects and persons participating in their<br />
preparation.<br />
Monitoring<br />
The Group’s Legal Affairs Unit monitors the compliance with<br />
insider regulations and maintains the company’s insider registers<br />
in cooperation with Euroclear Finland Ltd. At regular intervals,<br />
the Legal Affairs Unit sends an extract of the information in the<br />
insider register to permanent public insiders for checking and<br />
monitors the compliance with permanent insiders’ trading<br />
Kesko’s year <strong>2009</strong><br />
65<br />
restrictions. Kesko’s permanent insiders may not acquire or<br />
transfer securities issued by the company, including securities or<br />
derivative financial instruments entitling to them, during 21 days<br />
prior to the publication of interim reports and during 28 days<br />
prior to the publication of annual financial statements. These<br />
publication dates are announced annually beforehand in a stock<br />
exchange release. Furthermore, people involved in possible<br />
insider projects may not trade in Kesko’s securities or derivative<br />
financial instruments during such a project.<br />
Further information on the holdings of Kesko’s permanent<br />
public insiders is available on pages 66–69 and at www.kesko.fi.<br />
Other matters<br />
Stock exchange communications and<br />
stock exchange releases<br />
The Group’s Senior Vice President, CFO is responsible for the<br />
financial content of stock exchange releases as well as for investor<br />
information. The Corporate Communications and Responsibility<br />
Unit produces Group-level communications material and is<br />
responsible for providing stock exchange releases and financial<br />
information. The Vice President, General Counsel is responsible<br />
for ensuring that the rules related to stock exchange releases are<br />
observed at Kesko.<br />
In its investor communications, Kesko follows the principle of<br />
impartiality and publishes all investor information on its website<br />
in Finnish and English. Kesko observes a two (2) week period of<br />
silence before publishing information on its results.
66 Kesko’s year <strong>2009</strong><br />
Board of Directors on 31 December <strong>2009</strong><br />
Heikki Takamäki<br />
b. 1947<br />
Domicile: Tampere, Finland.<br />
Chair of the Board and the Remuneration<br />
Committee.<br />
Principal occupation: Retailer,<br />
K-rauta Rauta-Otra Nekala.<br />
Main employment history: K-rauta<br />
retailer since 1979. Kesport-Intersport<br />
retailer 1995–1999.<br />
Board member since: 1 January<br />
2001.<br />
Main simultaneous positions of<br />
trust: -<br />
Fees in <strong>2009</strong>: €81,500.<br />
Kesko shares and stock options<br />
held on 1 January <strong>2009</strong>: 104,470 A<br />
shares and 68,120 B shares held by<br />
him or his company. No stock<br />
options.<br />
On 31 December <strong>2009</strong>: 104,470 A<br />
shares and 68,120 B shares held by<br />
him or his company. No stock<br />
options.<br />
Seppo Paatelainen<br />
b. 1944, M.Sc. (Agr. & For.)<br />
Domicile: Seinäjoki, Finland.<br />
Deputy Chair of the Board, and<br />
member of the Audit Committee and<br />
the Remuneration Committee.<br />
Principal occupation: -<br />
Main employment history: Itikka<br />
Co-operative: Director 1970–1973,<br />
Luja-Yhtiöt: Director, Itikka Lihabotnia<br />
Oy and Itikka Co-operative: CEO<br />
1988–1991, Atria Group plc: CEO<br />
1991–2006.<br />
Board member since: 27 March<br />
2006.<br />
Main simultaneous positions of<br />
trust: Alma Media Corporation: Deputy<br />
Chair of the Board of Directors,<br />
Ilkka-Yhtymä Oyj: Chair of the Board<br />
of Directors, Finavia Corporation: Chair<br />
of the Board of Directors, Seinäjoki<br />
Region Business Service Center: Chair<br />
of the Board of Directors<br />
Fees in <strong>2009</strong>: €53,000.<br />
Kesko shares and stock options<br />
held on 1 January <strong>2009</strong>: No shares.<br />
No stock options.<br />
On 31 December <strong>2009</strong>: No shares.<br />
No stock options.<br />
Esa Kiiskinen<br />
b. 1963, Business College Graduate<br />
Domicile: Helsinki, Finland.<br />
Principal occupation: Retailer,<br />
K-supermarket Kontumarket,<br />
Helsinki.<br />
Main employment history: K-food<br />
retailer since 1990.<br />
Board member since: 30<br />
March <strong>2009</strong>.<br />
Main simultaneous positions of<br />
trust: K-Retailers’ Association: Chair<br />
of the Board of Directors, the Foundation<br />
for Vocational Training in the<br />
Retail Trade: Chair of the Board of<br />
Directors, Vähittäiskaupan Tilipalvelu<br />
VTP Oy: member of the Board of<br />
Directors, the Federation of Finnish<br />
Commerce: member of the Board of<br />
Directors, Saija ja Esa Kiiskinen Oy:<br />
Chair of the Board of Directors.<br />
Fees in <strong>2009</strong>: €31,750.<br />
Kesko shares and stock options<br />
held on 30 March <strong>2009</strong>: 102,350 A<br />
shares and 0 B shares held by him or<br />
his company. No stock options.<br />
On 31 December <strong>2009</strong>: 102,350 A<br />
shares and 0 B shares held by him or<br />
his company. No stock options.<br />
Ilpo Kokkila<br />
b. 1947, M.Sc. (Techn.)<br />
Domicile: Helsinki, Finland.<br />
Member of the Remuneration<br />
Committee.<br />
Principal occupation: SRV Group Plc:<br />
Chair of the Board of Directors.<br />
Main employment history: A-Betoni<br />
Oy: Constructor 1972–1974, Perusyhtymä<br />
Oy: Director 1974–1987, SRV<br />
Group Plc: Chair of the Board of Directors<br />
1987-, Pontos Ltd: Chair of the<br />
Board of Directors 2002-<br />
Board member since: 27 March<br />
2006.<br />
Main simultaneous positions of<br />
trust: JTO School of Management:<br />
Chair of the Board of Directors, Finnish-Russian<br />
Chamber of Commerce<br />
(FRCC): Deputy Chair of the Board of<br />
Directors.<br />
Fees in <strong>2009</strong>: €41,750.<br />
Kesko shares and stock options<br />
held on 1 January <strong>2009</strong>: 16,100 B<br />
shares held by him. No stock options.<br />
On 31 December <strong>2009</strong>: 16,100 B<br />
shares held by him. No stock options
Mikko Kosonen<br />
b. 1957, D.Sc. (Econ.)<br />
Domicile: Espoo, Finland<br />
Member of the Audit Committee.<br />
Principal occupation: Executive Vice<br />
President of Finnish Innovation Fund<br />
Sitra.<br />
Main employment history: Nokia<br />
plc: Senior Vice President for Strategic<br />
Planning and Information Management<br />
1996–2005 and Senior Advisor<br />
2005–2007. Finnish Innovation Fund<br />
Sitra: Executive Vice President 2007–<br />
2008 and President 2008-.<br />
Board member since: 30 March<br />
<strong>2009</strong>.<br />
Main simultaneous positions of<br />
trust: Itella Corporation: Deputy<br />
Chair of the Board of Directors, Fifth<br />
Element Ltd: member of the Board<br />
of Directors, Kauppatieteellinen<br />
yhdistys: member of the Board of<br />
Directors.<br />
Fees in <strong>2009</strong>: €33,750.<br />
Kesko shares and stock options<br />
held on 30 March <strong>2009</strong>: No shares.<br />
No stock options.<br />
On 31 December <strong>2009</strong>: No shares.<br />
No stock options.<br />
Maarit Näkyvä<br />
b. 1953, M.Sc. (Econ.)<br />
Domicile: Kirkkonummi, Finland.<br />
Chair of the Audit Committee.<br />
Principal occupation: -<br />
Main employment history: Unitas<br />
Bank Ltd.: Director 1990–1995,<br />
Merita Bank Ltd.: Director 1995–<br />
1996, Merita Fund Management Ltd:<br />
President 1996–1997, Leonia Bank<br />
plc: member of the Board of Directors<br />
1998–2000. Sampo plc’s Executive<br />
Vice President 2001–2006. Sampo<br />
Bank plc’s Deputy CEO 2005–2008.<br />
Board member since: 1 January<br />
2001.<br />
Main simultaneous positions of<br />
trust: -<br />
Fees in <strong>2009</strong>: €45,250.<br />
Kesko shares and stock options<br />
held on 1 January <strong>2009</strong>: No shares.<br />
No stock options.<br />
On 31 December <strong>2009</strong>: No shares.<br />
No stock options.<br />
Rauno Törrönen<br />
b. 1958, Hospitality Management<br />
Training<br />
Domicile: Joensuu, Finland.<br />
Principal occupation: Retailer,<br />
K-citymarket Kauppakatu, Joensuu.<br />
Main employment history: Pohjois-<br />
Karjalan Osuuskauppa: member of<br />
the management team 1986–1998.<br />
K-food retailer since 1998.<br />
Board member since: 30 March<br />
<strong>2009</strong>.<br />
Main simultaneous positions of<br />
trust: Joensuun kauppaopetuksen<br />
tukisäätiö: member of the Board of<br />
Directors, Alepro Oy: member of the<br />
Board of Directors.<br />
Fees in <strong>2009</strong>: €31,750.<br />
Kesko shares and stock options<br />
held on 30 March <strong>2009</strong>: 15,900 A<br />
shares and 9,600 B shares held by<br />
him or his company. No stock<br />
options.<br />
On 31 December <strong>2009</strong>: 15,900 A<br />
shares and 9,600 B shares held by<br />
him or his company. No stock<br />
options.<br />
Up-to-date information about the main positions of trust of the Board members is available at www.kesko.fi.<br />
According to the company’s Articles of Association, the term of each Board member will expire at the close of the 2012 <strong>Annual</strong> General Meeting.<br />
Kesko’s year <strong>2009</strong><br />
67
68 Kesko’s year <strong>2009</strong><br />
Corporate Management Board on 31 December <strong>2009</strong><br />
Matti Halmesmäki<br />
b. 1952, M.Sc. (Econ.), LL.M.<br />
Kesko Corporation’s President and<br />
CEO, Chair of the Corporate<br />
Management Board.<br />
Domicile: Helsinki, Finland.<br />
Other major duties: Confederation of<br />
Finnish Industries EK: Deputy Chair of<br />
the Board of Directors, the Finnish<br />
Fair Corporation: member of the<br />
Board of Directors, the Federation of<br />
Finnish Commerce: member of the<br />
Board of Directors, Varma Mutual<br />
Pension Insurance Company: Supervisory<br />
Board member, Luottokunta:<br />
Chair of the Supervisory Board, Foundation<br />
for Economic Education: member<br />
of the Board of Directors, Finnish<br />
Business and Policy Forum EVA: member,<br />
Helsinki Region Chamber of Commerce:<br />
Delegation member, Helsinki<br />
School of Economics: Advisory Board<br />
member, the Association for Promoting<br />
Voluntary National Defence of Finland:<br />
Delegation member, the Association<br />
for the Finnish Cultural Foundation:<br />
member, the Central Chamber<br />
of Commerce in Finland: Board member,<br />
ICC Finland – the Finnish Section<br />
of International Chamber of Commerce:<br />
Executive Board member,<br />
Savonlinna Opera Festival Patrons’<br />
Association, member of the Board of<br />
Trustees.<br />
Employment history: employed by<br />
Kesko Ltd since 1980: Director of the<br />
Accounting and Office Administration<br />
Department 1985–1989, Executive<br />
Vice President, Finance and Accounting<br />
1989–1993, Executive Vice President,<br />
Agricultural and Builders’ Supplies<br />
Division 1993–1995, Executive<br />
Vice President, Speciality Goods Division<br />
1995–1996, Managing Director<br />
of Tuko Oy 1996–1997, Executive Vice<br />
President, Speciality Goods Trade<br />
1997–2000. Member of Kesko Corporation’s<br />
Board of Directors 1989–<br />
2000. President of Rautakesko Ltd<br />
and Kesko Agro Ltd 2001–2005.<br />
Kesko Corporation’s Managing Director<br />
and the Kesko Group’s President and<br />
CEO since 1 March 2005.<br />
Kesko shares and stock options<br />
held on 1 January <strong>2009</strong>: 2,000 A<br />
shares, 7,000 B shares, 50,000 2007A<br />
stock options and 50,000 2007B<br />
stock options.<br />
On 31 December <strong>2009</strong>: 2,000 A<br />
shares, 7,000 B shares, 50,000 2007A<br />
stock options, 50,000 2007B stock<br />
options and 50,000 2007C stock<br />
options.<br />
Retirement age and benefits:<br />
60 years. Full pension is 66% of the<br />
pensionable salary.<br />
Notice period and severance pay:<br />
6 months. A severance pay paid in<br />
addition to the salaries for the period<br />
of notice corresponds to 12 months’<br />
salary.<br />
Corporate Management Board<br />
member since: 1 January 2001.<br />
Terho Kalliokoski<br />
b. 1961, M.Sc. (Econ.)<br />
President of Kesko Food Ltd.<br />
Domicile: Kirkkonummi, Finland<br />
Other major duties: the Finnish<br />
Food Marketing Association: member<br />
of the Board of Directors, the Association<br />
of Finnish Advertisers: member of<br />
the Board of Directors, the Association<br />
for Finnish Work: member of the<br />
Board, Helsinki Region Chamber of<br />
Commerce: member of the Board of<br />
Directors, the Finnish 4H Federation:<br />
member of the Supervisory Board.<br />
Employment history: employed by<br />
Kesko Ltd since 1985: Project Planner,<br />
Store Site Office (Helsinki) 1985–<br />
1987, Investment Manager, Real<br />
Estate Department (Helsinki) 1988–<br />
1990, Financial Manager, Northern<br />
Finland (Oulu) 1990–1995, Retail<br />
Services Manager, Grocery Retail Services<br />
(Oulu) 1995–1996, Sales Director,<br />
Supermarket Chain Unit (Oulu) 1996–<br />
1997, District Director, Northern<br />
Finland (Oulu) 1998–2002, Senior<br />
Vice President, Kesko Real Estate<br />
(Helsinki), 2002–2005. President of<br />
Kesko Food Ltd since 1 May 2005.<br />
Kesko shares and stock options<br />
held on 1 January <strong>2009</strong>: 3,250 B<br />
shares, 25,000 2007A stock options<br />
and 25,000 2007B stock options.<br />
On 31 December <strong>2009</strong>: 3,250 B<br />
shares, 25,000 2007A stock options,<br />
25,000 2007B stock options and<br />
30,000 2007C stock options.<br />
Retirement age and benefits:<br />
62 years. Full pension is 66% of the<br />
pensionable salary.<br />
Notice period and severance pay:<br />
6 months. A severance pay paid in<br />
addition to the salaries for the period<br />
of notice corresponds to 6 months’<br />
salary.<br />
Corporate Management Board<br />
member since: 17 March 2005.<br />
Jari Lind<br />
b. 1958, Engineer<br />
President of Rautakesko Ltd.<br />
Domicile: Vantaa, Finland.<br />
Other major duties: -<br />
Employment history: employed by<br />
Kesko Ltd since 1990: Rautakesko,<br />
Purchase Logistics Director 2000–<br />
2001, Vice President for the K-rauta<br />
chain and B-to-B Service 2002–<br />
2004. President of Rautakesko<br />
Ltd since 1 March 2005.<br />
Kesko shares and stock options<br />
held on 1 January <strong>2009</strong>: 25,000<br />
2007A stock options and 25,000<br />
2007B stock options.<br />
On 31 December <strong>2009</strong>: 25,000<br />
2007A stock options, 25,000 2007B<br />
stock options and 25,000 2007C stock<br />
options.<br />
Retirement age and benefits:<br />
62 years. Full pension is 66% of<br />
pensionable salary.<br />
Notice period and severance pay:<br />
6 months. A severance pay paid in<br />
addition to the salaries for the period<br />
of notice corresponds to 6 months’<br />
salary.<br />
Corporate Management Board<br />
member since: 1 March 2005.<br />
Matti Leminen<br />
b. 1951, B.Sc. (Econ.)<br />
President of Anttila Oy.<br />
Domicile: Espoo, Finland.<br />
Other major duties: Textile and<br />
Fashion Industries TMA: member of<br />
the Board of Directors.<br />
Employment history: employed by<br />
Kesko Ltd since 1982: Director of the<br />
Vaatehuone chain 1990–1991, Director<br />
of the Leisure Goods Department<br />
1992–1995, Director of Kesko Sports<br />
1995–1998, Executive Vice President<br />
of Keswell Ltd 2005–2006. President<br />
of Anttila Oy since 10 June 1998.<br />
Kesko shares and stock options<br />
held on 1 January <strong>2009</strong>: 20,000<br />
2007A stock options, 20,000 2007B<br />
stock options, 7,000 2003E stock<br />
options and 12,000 2003F stock<br />
options.<br />
On 31 December <strong>2009</strong>: 20,000<br />
2007A stock options, 20,000 2007B<br />
stock options, 20,000 2007C stock<br />
options and 3,000 2003F stock<br />
options.<br />
Retirement age and benefits:<br />
60 years. Full pension is 66% of<br />
pensionable salary.
Notice period and severance pay:<br />
6 months. A severance pay paid in<br />
addition to the salaries for the period<br />
of notice corresponds to 12 months’<br />
salary.<br />
Corporate Management Board<br />
member since: 1 January 2007.<br />
Pekka Lahti<br />
b. 1955, M.Sc. (Agr.)<br />
President of VV-Auto Group Oy.<br />
Domicile: Vantaa, Finland.<br />
Other major duties: the Association<br />
of Automobile Importers in Finland:<br />
Deputy Chair of the Board of Directors,<br />
Finnish Car Recycling Ltd: member of<br />
the Board of Directors.<br />
Employment history: employed by<br />
Kesko Ltd since 1981: Vice President,<br />
Kesko Machinery 2000, Managing<br />
Director of Konekesko Ltd since 2001<br />
and President of Kesko Agro Ltd<br />
2005–2008. Chair of the Board of<br />
Konekesko Ltd since 1 November<br />
2005. President of VV-Auto Group Oy<br />
since 1 February 2006.<br />
Kesko shares and stock options<br />
held on 1 January <strong>2009</strong>: 20,000<br />
2007A stock options, 20,000 2007B<br />
stock options and 23,500 2003F stock<br />
options.<br />
On 31 December <strong>2009</strong>: 20,000<br />
2007A stock options, 20,000 2007B<br />
stock options, 20,000 2007C stock<br />
options and 17,200 2003F stock<br />
options.<br />
Retirement age and benefits:<br />
62 years. Full pension is 66% of<br />
pensionable salary.<br />
Notice period and severance pay:<br />
6 months. A severance pay paid in<br />
addition to the salaries for the period<br />
of notice corresponds to 6 months’<br />
salary.<br />
Corporate Management Board<br />
member since: 1 March 2005.<br />
Riitta Laitasalo<br />
b. 1955, M.Sc. (Econ.)<br />
Senior Vice President, Human<br />
Resources.<br />
Domicile: Espoo, Finland.<br />
Other major duties: Edita Plc: member<br />
of the Board of Directors, JTO<br />
School of Management: member of<br />
the Board of Directors, the Finnish<br />
Institute for International Trade Fintra:<br />
member of the Board of Directors.<br />
Employment history: employed by<br />
Kesko Ltd since 1979: Personnel<br />
Director 1995–1997, Vice President,<br />
Accounting and Finance Division<br />
1997–1998, Vice President, Finance<br />
and Administration Division 1998–<br />
1999, Senior Vice President, Administration<br />
2000–2005. Senior Vice<br />
President, Human Resources since<br />
30 March 2005.<br />
Kesko shares and stock options<br />
held on 1 January <strong>2009</strong>: 5,000 B<br />
shares, 15,000 2007A stock options,<br />
15,000 2007B stock options and<br />
21,000 2003F stock options.<br />
On 31 December <strong>2009</strong>: 10,000 B<br />
shares, 15,000 2007A stock options,<br />
15,000 2007B stock options, 15,000<br />
2007C stock options and 16,000<br />
2003F stock options.<br />
Retirement age and benefits:<br />
60 years. Full pension is 66% of the<br />
pensionable salary.<br />
Notice period and severance pay:<br />
6 months. A severance pay paid in<br />
addition to the salaries for the period<br />
of notice corresponds to 12 months’<br />
salary.<br />
Corporate Management Board<br />
member since: 1 January 2001.<br />
Arja Talma<br />
b. 1962, M.Sc. (Econ.), eMBA<br />
Senior Vice President, CFO.<br />
Domicile: Helsinki, Finland.<br />
Other major duties: Sponda Plc:<br />
member of the Board of Directors and<br />
Chair of the Audit Committee, VR-<br />
Group Ltd: member of the Board of<br />
Directors and Chair of the Audit Committee,<br />
Luottokunta: member of the<br />
Board of Directors.<br />
Employment history: KPMG Wideri<br />
Oy Ab: APA 1992–2001, partner<br />
2000–2001. Oy Radiolinja Ab: Executive<br />
Vice President, Finance and<br />
Administration 2001–2003.<br />
Employed by Kesko Corporation since<br />
2004: Vice President, Corporate Controller<br />
2004–2005. Senior Vice President,<br />
CFO since 17 March 2005.<br />
Kesko shares and stock options<br />
held on 1 January <strong>2009</strong>: 1,000 B<br />
shares, 25,000 2007A stock options<br />
and 25,000 2007B stock options.<br />
On 31 December <strong>2009</strong>: 2,000 B<br />
shares, 25,000 2007A stock options,<br />
25,000 2007B stock options and<br />
25,000 2007C stock options.<br />
Retirement age and benefits:<br />
General retirement age and pensionable<br />
salary based on the Employees’<br />
Pensions Act (TyEL).<br />
Notice period and severance pay:<br />
6 months. A severance pay paid in<br />
addition to the salaries for the period<br />
of notice corresponds to 6 months’<br />
salary.<br />
Corporate Management Board<br />
member since: 17 March 2005.<br />
Kesko’s year <strong>2009</strong><br />
69<br />
Paavo Moilanen<br />
b. 1951, Business College Graduate.<br />
Senior Vice President, Corporate<br />
Communications and Responsibility.<br />
Domicile: Espoo, Finland.<br />
Other major duties: Kaleva Mutual<br />
Insurance Company: Supervisory<br />
Board member, the Association<br />
for Finnish Work: member of the<br />
Communications and Research<br />
Committee, the Federation of Finnish<br />
Commerce: Chair of the Communications<br />
Committee<br />
Employment history: employed by<br />
Kesko Ltd since 1974: Kajaani District<br />
Director 1986–1989; Jyväskylä District<br />
Director 1989–1991; Seinäjoki District<br />
Director 1991–1995; Director of the<br />
Neighbourhood Store Chain Unit<br />
1995–1996; Director of the Speciality<br />
Goods Division 1996–1997, Vice<br />
President, Builders’ and Agricultural<br />
Supplies Division 1998–2000,<br />
Managing Director of the K-Retailers’<br />
Association 2000–2005. Kesko<br />
Group’s Senior Vice President,<br />
Corporate Communications and<br />
Responsibility since 13 October 2005.<br />
Kesko shares and stock options<br />
held on 1 January <strong>2009</strong>: 500 A<br />
shares, 1,312 B shares, 15,000 2007A<br />
stock options and 15,000 2007B<br />
stock options.<br />
On 31 December <strong>2009</strong>: 500 A<br />
shares, 1,500 B shares, 15,000 2007A<br />
stock options, 15,000 2007B stock<br />
options and 15,000 2007C stock<br />
options.<br />
Retirement age and benefits:<br />
Retirement age 60 years. Full pension<br />
is 66% of the pensionable salary.<br />
Notice period and severance pay:<br />
6 months. A severance pay paid in<br />
addition to the salaries for the period<br />
of notice corresponds to 12 months’<br />
salary.<br />
Corporate Management Board<br />
member since: 13 October 2005.
70 Kesko financial statements <strong>2009</strong><br />
<strong>Report</strong> by the Board of Directors and<br />
Financial Statements<br />
<strong>Report</strong> by the Board of Directors<br />
71 <strong>Report</strong> by the Board of Directors<br />
77 Proposal for profit distribution<br />
78 Group performance indicators<br />
Financial statements<br />
85 Consolidated financial statements (IFRS)<br />
85 Consolidated income statement<br />
86 Consolidated statement of financial position<br />
87 Consolidated statement of cash flows<br />
88 Consolidated statement of changes in equity<br />
89 Notes to the consolidated financial statements<br />
89 Note 1, Accounting policies for the consolidated<br />
financial statements<br />
96 Note 2, Segment information<br />
100 Note 3, Acquisitions<br />
100 Note 4, Discontinued operations and disposals of<br />
assets<br />
101 Note 5, Other operating income<br />
101 Note 6, Other operating expenses<br />
102 Note 7, Non-recurring items<br />
102 Note 8, Staff cost, number of employees and<br />
management's salaries<br />
102 Note 9, Financial income and expenses<br />
103 Note 10, Income tax expense<br />
103 Note 11, Components of other comprehensive<br />
income<br />
103 Note 12, Earnings per share<br />
104 Note 13, Intangible assets<br />
106 Note 14, Property, plant and equipment<br />
107 Note 15, Interests in associates<br />
108 Note 16, Non-current available-for-sale financial<br />
assets<br />
108 Note 17, Non-current receivables<br />
109 Note 18, Finance lease receivables<br />
109 Note 19, Deferred income tax<br />
111 Note 20, Pension assets<br />
112 Note 21, Inventories<br />
112 Note 22, Trade receivables and other current<br />
receivables<br />
113 Note 23, Financial assets at fair value through<br />
profit or loss<br />
113 Note 24, Available-for-sale financial assets<br />
113 Note 25, Cash and cash equivalents<br />
113 Note 26, Non-current assets classified as held for<br />
sale and related liabilities<br />
114 Note 27, Notes to shareholders' equity<br />
115 Note 28, Carrying amounts of financial assets and<br />
liabilities by measurement group<br />
117 Note 29, Finance lease liabilities<br />
117 Note 30, Provisions<br />
118 Note 31, Trade payables and other current noninterest-bearing<br />
liabilities<br />
118 Note 32, Jointly controlled assets<br />
118 Note 33, Contingent liabilities<br />
118 Note 34, Operating leases<br />
119 Note 35, Share-based payment<br />
122 Note 36, Non-cash flow related investments<br />
122 Note 37, Adjustments to cash flows from operating<br />
activities<br />
122 Note 38, Subsidiary disposals<br />
122 Note 39, Proceeds from available-for-sale<br />
financial assets<br />
122 Note 40, Cash and cash equivalents within the<br />
statement of cash flows<br />
123 Note 41, Financial risk management<br />
129 Note 42, Risk management<br />
132 Note 43, Related-party transactions<br />
133 Note 44, Other notes<br />
134 Note 45, Subsidiaries and associates at<br />
31.12.<strong>2009</strong><br />
136 Parent's financial statements (FAS)<br />
136 Parent's income statement<br />
137 Parent's balance sheet<br />
138 Parent's cash flow statement<br />
139 Notes to the parent's financial statements<br />
145 Signatures<br />
145 Auditor's <strong>Report</strong>
<strong>Report</strong> by the Board of Directors<br />
January-December <strong>2009</strong><br />
Continuing operations<br />
Net sales and profit<br />
The Group’s net sales in January-December <strong>2009</strong> were €8,447<br />
million, which is 11.9% down on the corresponding period of<br />
the previous year (€9,591 million). The net sales decreased by<br />
7.5% in Finland and by 28.1% abroad. Exports and foreign<br />
operations accounted for 17.5% (21.5%) of net sales. The deterioration<br />
of the general economic situation especially affected<br />
the sales performance of the Group's car and machinery trade<br />
and building and home improvement trade. The sales performance<br />
of the food trade remained steady during the reporting<br />
period.<br />
In January-December, the K-Group’s (i.e. Kesko’s and the<br />
chain stores’) retail and B2B sales, including VAT, were €12,614<br />
million, a decrease of 9.1% compared with the previous year.<br />
The K-Group chains' sales entitling to K-Plussa loyalty award<br />
credits were €6,181 million, up 3.8% compared with the previous<br />
year. In <strong>2009</strong>, the K-Plussa customer loyalty programme<br />
gained 101,608 new households. At the end of the year, there<br />
were 2,033,884 K-Plussa households.<br />
The Group’s profit before tax for January-December was<br />
€216.6 million (€288.5 million). The operating profit was €232.3<br />
million (€285.6 million). Non-recurring items excluded, the<br />
operating profit was €155.4 million (€217.0 million), representing<br />
1.8% (2.3%) of net sales. The non-recurring income includes<br />
a €91.4 million amount of gains on the disposals of real estate to<br />
Varma Mutual Pension Insurance Company and the Kesko Pension<br />
Fund. The non-recurring expenses include a €14.4 million<br />
amount of real estate impairment charges. The non-recurring<br />
gains on disposals and impairment charges for the comparable<br />
period totalled €68.7 million.<br />
The smaller year-on-year operating profit excluding nonrecurring<br />
items was due to a decreased demand especially in the<br />
building and home improvement trade and the car and machinery<br />
trade. Due to cost adjustments, the Group's fixed costs<br />
decreased by some €69 million compared with the previous year,<br />
regardless of new store site openings.<br />
The Group's earnings per share from continuing operations<br />
were €1.27 (€1.81). The Group's equity per share was €20.39<br />
(€20.09).<br />
Investments<br />
In January-December, the Group's investments totalled €198.0<br />
million (€338.4 million), which is 2.3% (3.5%) of net sales.<br />
Investments in store sites were €161.2 million (€279.0 million)<br />
and other investments €36.7 million (€59.5 million). Investments<br />
in foreign operations represented 35.5% (29.0%) of total<br />
investments.<br />
Finance<br />
In January-December, the cash flow from operating activities<br />
increased by €247.4 million on the comparative year to €378.8<br />
million (€131.4 million). The increase is especially attributable to<br />
capital released from inventories. The net cash from investing<br />
activities was €31.0 million positive (€-45.8 million). The cash<br />
flow from investing activities included a €252.0 million (€281.4<br />
million) amount of proceeds from the sale of fixed assets.<br />
Kesko financial statements <strong>2009</strong><br />
71<br />
Throughout the reporting period, the Group's liquidity and<br />
solvency remained at an excellent level. At the end of the period,<br />
liquid assets totalled €715 million (€443 million). Interest-bearing<br />
liabilities were €456 million (€491 million) and interestbearing<br />
net liabilities €-259 million (€47 million) at the end of<br />
the reporting period. Equity ratio was 54.1% (52.4%) at the end<br />
of the period.<br />
In January-December, the Group's net financial expenses<br />
were €16.0 million (net financial income €1.0 million). Net<br />
financial expenses were increased by €17.9 million for hedging<br />
the Baltic and Russian currency exposures resulting from<br />
increased interest rate differences between currencies. Interest<br />
income on liquid assets decreased following a decline in the<br />
market interest rate level.<br />
Taxes<br />
In January-December, the Group's tax expense was €82.4 million<br />
(€89.4 million). The effective tax rate was 38.0% (30.9%),<br />
affected by loss-making foreign operations.<br />
Personnel<br />
In January-December, the average number of employees in the<br />
Kesko Group was 19,184 (21,327) converted into full-time<br />
employees. In Finland, the average decrease was 530 employees,<br />
while outside Finland, it was 1,613.<br />
At the end of December <strong>2009</strong>, the total number of employees<br />
was 22,200 (24,668), of whom 12,959 (13,651) worked in<br />
Finland and 9,241 (11,017) outside Finland. Compared with<br />
the end of 2008, there was a decrease of 692 employees in<br />
Finland and 1,776 outside Finland.<br />
As a result of the decline in consumer demand, measures<br />
aimed at adjusting the number and cost of staff were continued.<br />
During the reporting period, the Group's staff cost decreased by<br />
€43.0 million, or 7.4%, compared with the previous year.<br />
Seasonal nature of operations<br />
The Group’s operating activities are affected by seasonal fluctuations.<br />
The net sales and operating profits of the reportable<br />
segments are not earned evenly throughout the year. Instead<br />
they vary by quarter depending on the characteristics of each<br />
segment.<br />
Segment performances in January-December<br />
Food trade<br />
The food trade comprises the food business based on the<br />
K-retailer business model and Kespro Ltd’s grocery wholesaling in<br />
Finland.<br />
In the food trade, the net sales in January-December were<br />
€3,798 million (€3,707 million), up 2.4%. During the same<br />
period, the grocery sales of K-food stores increased by 5.6%,<br />
adjusted for the change in VAT (4.7% incl. VAT). K-food stores'<br />
total retail sales in January-December were €4,891 million<br />
(€4,685 million), representing a 5.3% year-on-year growth,<br />
adjusted for the change in VAT (4.4% incl. VAT). Good sales performance<br />
was achieved especially by Pirkka products and K-citymarket,<br />
the retail food sales of which grew by 14.3%, adjusted<br />
for the change in VAT. The growth rate of the total grocery trade<br />
market in Finland in January-December is estimated at some<br />
3–4% up on the previous year. In January-December, prices
72 Kesko financial statements <strong>2009</strong><br />
increased at an average monthly rate of 3.3%, compared with<br />
the previous year (Statistics Finland).<br />
In January-December, the operating profit excluding nonrecurring<br />
items of the food trade was €133.1 million (€122.5<br />
million), which is about €10.5 million up on the previous year.<br />
The operating profit excluding non-recurring items in relation to<br />
net sales was 3.5% (3.3%), or 0.2 percentage points higher than<br />
in the previous year. The operating profit was €170.6 million<br />
(€185.5 million). The non-recurring gains on property sales were<br />
€46.4 million in January-December. The comparative year’s<br />
operating profit was increased by €68.5 million of non-recurring<br />
gains on property sale and lease arrangements.<br />
In January-December, investments in the food trade were<br />
€69.4 million (€139.7 million), of which investments in store<br />
sites were €56.2 million (€116.0 million).<br />
In <strong>2009</strong>, five new K-citymarkets, four K-supermarkets and 15<br />
K-markets were opened. In addition, renovations and extensions<br />
were carried out.<br />
Home and speciality goods trade<br />
The home and speciality goods trade comprises Anttila, K-citymarket’s<br />
home and speciality goods trade, Intersport Finland,<br />
Indoor Group, Musta Pörssi and Kenkäkesko.<br />
In the home and speciality goods trade, the net sales in January-December<br />
were €1,558 million (€1,606 million), down<br />
3.0%. Owing to the deteriorated economic situation and a rise of<br />
the unemployment rate, consumer demand in the home and<br />
speciality goods trade declined especially for home electronics<br />
and interior decoration products.<br />
The operating profit of the home and speciality goods trade<br />
excluding non-recurring items in January-December was €29.5<br />
million (1.9% of net sales), a €1.7 million year-on-year decrease<br />
due to the fall in sales. In January-December, the operating<br />
profit was €66.5 million (€63.6 million). Non-recurring gains on<br />
property sales and impairment charges were €37.0 million in<br />
January-December and €32.4 million in the comparative period.<br />
Investments in the home and speciality goods trade in<br />
January-December were €29.6 million (€60.5 million).<br />
In January-December, Anttila's net sales were €513 million<br />
(€558 million), down 8.0%. The sales of the Anttila department<br />
stores were €303 million, down 5.7%. The sales of the Kodin<br />
Ykkönen department stores for home goods and interior decoration<br />
were €132 million, down 10.7%. NetAnttila's sales were<br />
€80 million, a decrease of 12.5%, mainly due to the weakened<br />
economic conditions in Estonia and Latvia.<br />
The net sales of K-citymarket’s home and speciality goods<br />
trade in January-December were €595 million (€566 million),<br />
up 5.1%. The net sales performance was affected by the store<br />
site network expansion and especially the good year-end sales<br />
performance.<br />
Intersport Finland’s net sales in January-December were €165<br />
million (€158 million), up 4.3%, which is especially attributable<br />
to the increased sales of winter sports equipment. Indoor’s net<br />
sales in January-December were €155 million (€177 million),<br />
down 12.4%. The performance was affected by the discontinuation<br />
of Indoor’s business activities in Sweden during the first<br />
quarter of 2008, and the weakened economic conditions in<br />
Estonia and Latvia. Musta Pörssi Ltd’s net sales in January-<br />
December were €107 million (€123 million), down 12.5%.<br />
Kenkäkesko Ltd’s net sales in January-December were €24 million<br />
(€26 million), down 7.9%.<br />
Building and home improvement trade<br />
The building and home improvement trade comprises Rautakesko<br />
and the agricultural supplies trade in Finland.<br />
In the building and home improvement trade, the net sales in<br />
January-December were €2,312 million (€2,978 million), down<br />
22.4%.<br />
In January-December, the net sales in Finland were €1,041<br />
million, a decrease of 21.1%. The building and home improvement<br />
trade contributed €744 million, and the agricultural supplies<br />
trade €297 million to the net sales in Finland. The net sales<br />
of the building and home improvement trade in Finland were<br />
down 15.4%, especially due to a fall in the sales to professional<br />
customers. The net sales of the agricultural supplies trade<br />
decreased by 32.6%. The net sales from foreign operations in the<br />
building and home improvement trade were €1,271 million<br />
(€1,659 million), a decrease of 23.4%. In addition to a decline<br />
in demand, the sales performance of foreign operations was<br />
affected by the weakening of the Swedish krona, the Norwegian<br />
krone and the Russian ruble. The net sales from foreign operations<br />
dropped by 17.2% in terms of the local currencies. Foreign<br />
operations contributed 55.0% to the net sales of the building<br />
and home improvement trade.<br />
In Sweden, the net sales of K-rauta AB increased by 0.6% to<br />
€187 million in January-December. In terms of the local currency,<br />
K-rauta AB’s net sales grew by 11.1%. In Norway, Byggmakker's<br />
net sales decreased by 16.4% to €477 million. In terms<br />
of the local currency, Byggmakker’s net sales dropped by 11.2%.<br />
In Estonia, Rautakesko's net sales were down 22.1% to €63 million.<br />
In Latvia, Rautakesko's net sales decreased by 32.9% to €48<br />
million. In Lithuania, Senukai's net sales fell by 42.1% to €260<br />
million. In Russia, the net sales of the building and home<br />
improvement trade decreased by 16.8% to €169 million. In<br />
terms of the local currency, the net sales increased by 0.8%. The<br />
net sales of the Belarusian OMA were down by 25.5% to €53<br />
million. In terms of the local currency, OMA’s net sales decreased<br />
by 7.8%.<br />
In January-December, the operating profit excluding nonrecurring<br />
items of the building and home improvement trade<br />
was €11.9 million (0.5% of net sales), which was €44.4 million,<br />
or 1.4 percentage points, lower than in the previous year. The<br />
profit performance was affected by a substantial contraction in<br />
the Nordic, Baltic and Russian construction markets. In Finland,<br />
the building and home improvement trade market declined in<br />
January-December by some 15%, in Sweden by some 5%, in<br />
Norway by some 10%, and in the Baltic countries by some<br />
30–40% (Rautakesko's estimate). The staff cost was down €42.1<br />
million, or 21.9%, on the comparative period. The operating<br />
profit of the building and home improvement trade was €19.6<br />
million (€19.4 million) in January-December. The operating<br />
profit includes a €7.7 million non-recurring gain on a property<br />
sale. The comparative period's operating profit includes a nonrecurring<br />
€47.0 million impairment charge on Byggmakker<br />
Norge's intangible assets, and a €5.4 million non-recurring gain<br />
on a property sale.<br />
In January-December, investments in the building and home<br />
improvement trade were €84.7 million (€122.7 million), of<br />
which 82.8% (79.1%) abroad.
In January-December, two new K-rauta stores were opened in<br />
Sweden and one in Russia, Estonia and Latvia. In addition, the<br />
store site network was strengthened by other new and replacement<br />
stores.<br />
The retail sales of the K-rauta and Rautia chains in January-<br />
December decreased by 5.5% to €1,158 million, including VAT,<br />
in Finland. The sales of Rautakesko B2B Service decreased by<br />
29.5%. The retail sales of the K-maatalous chain were €448<br />
million, including VAT, down 28.8%.<br />
Car and machinery trade<br />
The car and machinery trade comprises VV-Auto and Konekesko.<br />
Konekesko includes, in addition to the machinery trade, the<br />
tractor and combine harvester trade in Finland and the agricultural<br />
and machinery trade companies in the Baltic countries.<br />
In January-December, the net sales of the car and machinery<br />
trade were €947 million (€1,480 million), down 36.0%.<br />
VV-Auto’s net sales in January-December were €598 million<br />
(€884 million), a decrease of 32.3%. The net sales performance<br />
was affected by a decline in demand in the car trade, coupled<br />
with the car tax change effective at the beginning of April, causing<br />
the car tax levied on cars after 1 April <strong>2009</strong> to be excluded<br />
from the net sales. Adjusted for the tax change, the net sales fell<br />
by 24.3%. In January-December, the combined market share of<br />
passenger cars and vans imported by VV-Auto rose to 18.5%<br />
(17.1%).<br />
Konekesko's net sales in January-December were €350 million<br />
(€597 million), down 41.3% on the previous year, as a result of<br />
the weakened machinery market and the discontinuation of the<br />
Baltic grain and agricultural supplies trade. The net sales in Finland<br />
were €185 million, a decrease of 31.9%. The net sales from<br />
Konekesko’s foreign operations were €165 million, down 49.3%.<br />
In line with its strategy, Konekesko concentrates on the machinery<br />
trade also in the Baltic countries and disposes of its grain and<br />
agricultural inputs trade.<br />
In January-December, the operating profit excluding nonrecurring<br />
items of the car and machinery trade was €0.3 million<br />
(0.0% of net sales), which was €30.1 million lower than in the<br />
previous year. The profit performance was especially affected by<br />
the decline of Konekesko's profitability as a result of the decline<br />
in the machinery market and the discontinuation of the Baltic<br />
grain and agricultural supplies trade.<br />
Investments in the car and machinery trade were €13.4<br />
million (€15.6 million) in January-December.<br />
Discontinued operations<br />
In the comparative year 2008, the Group's profit from discontinued<br />
operations was €41.5 million. Discontinued operations<br />
included Kauko-Telko Ltd and the €31 million gain on its disposal,<br />
and TähtiOptikko Group Oy, with the about €8.5 million<br />
gain on its disposal.<br />
October-December <strong>2009</strong><br />
Continuing operations<br />
Net sales and profit<br />
The Group’s net sales in October-December <strong>2009</strong> were €2,153<br />
million, which is 7.7% down on the corresponding period of the<br />
previous year (€2,333 million). Net sales decreased by 4.4% in<br />
Finland and by 21.4% abroad. Exports and foreign operations<br />
Kesko financial statements <strong>2009</strong><br />
73<br />
accounted for 16.6% (19.5%) of net sales. The net sales performance<br />
of the food trade was steady. The net sales of the home<br />
and speciality goods trade took an upward turn during the<br />
reporting period. As a result of the weak market situation, the<br />
sales in the building and home improvement trade and in the<br />
car and machinery trade decreased compared with the comparative<br />
year.<br />
In October-December, the K-Group’s (i.e. Kesko’s and the<br />
chain stores’) retail and B2B sales, including VAT, were €3,226<br />
million, a decrease of 5.4% on the corresponding period of the<br />
previous year.<br />
The Group’s profit before tax for October-December was<br />
€116.3 million (€7.7 million). The operating profit was €118.1<br />
million (€6.9 million). The operating profit excluding non-recurring<br />
items was €68.0 million (€27.3 million), representing 3.2%<br />
of net sales (1.2%). The non-recurring items include a €63.5<br />
million gain on the sale of properties to Varma Mutual Pension<br />
Insurance Company. The non-recurring expenses include a €14.4<br />
million amount of impairments on real estate.<br />
The higher year-on-year operating profit excluding nonrecurring<br />
items was due to increased operational efficiency, cost<br />
savings and the fact that the profitability of the comparative year<br />
was negatively affected by impairments on trade receivables and<br />
inventories. Successful Christmas trading also contributed to the<br />
higher operating profit.<br />
The Group's earnings per share from continuing operations<br />
were €0.73 (€-0.05). The Group's equity per share was €20.39<br />
(€20.09).<br />
Investments<br />
The Group’s investments in October-December totalled €41.5<br />
million (€105.2 million), which is 1.9% (4.5%) of net sales.<br />
Investments in store sites were €30.0 million (€84.1 million),<br />
and other investments €11.5 million (€21.1 million). Investments<br />
in foreign operations represented 40.1% (37.8%) of total<br />
investments.<br />
Finance<br />
In October-December, the cash flow from operating activities was<br />
€123.1 million (€15.1 million), improved by adjustments in costs<br />
and inventories. The net cash flow from investing activities was<br />
€96.4 million (€-95.7 million). The cash flow from investing<br />
activities included a €157.8 million (€3.7 million) amount of<br />
proceeds received from the disposal of fixed assets. This amount<br />
was increased by a property sale at a debt-free price of €156<br />
million completed in December.<br />
In October-December, the Group’s net financial expenses were<br />
€1.8 million (net financial income €0.8 million). They were<br />
increased by the costs of currency exposure hedging and the<br />
income from liquid assets reduced by lowered Euribor rates.<br />
Taxes<br />
In October-December, the Group’s tax expense was €41.8 million<br />
(€5.5 million). The effective tax rate was 35.9% (71.2%),<br />
affected by foreign companies' loss-making performances.<br />
Personnel<br />
In October-December, the average number of personnel in the<br />
Kesko Group was 18,126 (20,920) converted into full-time
74 Kesko financial statements <strong>2009</strong><br />
employees. In Finland, the average decrease was 626 employees,<br />
while outside Finland, it was 2,168 employees.<br />
Segment performances in October-December<br />
Food trade<br />
In the food trade, the net sales in October-December were €970<br />
million (€982 million), down 1.2%. During the same period, the<br />
grocery sales of K-food stores increased by 3.6%, adjusted for the<br />
change in VAT (0.7% incl. VAT). Good sales performance was<br />
achieved especially by the K-citymarket chain and the Pirkka<br />
products. There were 1,030 K-food stores at the end of December.<br />
In October-December, the operating profit excluding nonrecurring<br />
items of the food trade was €33.7 million (€31.6 million),<br />
which is €2.1 million up on the previous year. The operating<br />
profit excluding non-recurring items in relation to net sales<br />
was 3.5% (3.2%), or 0.3 percentage points higher than in the<br />
previous year. The operating profit of the food trade was €58.7<br />
million (€27.4 million). The non-recurring gains on property<br />
sales were €33.1 million.<br />
In October-December, investments in the food trade were<br />
€9.9 million (€31.8 million), of which investments in store sites<br />
were €6.4 million (€21.9 million).<br />
Kesko Food continued to develop the K-food store network.<br />
In October, a K-citymarket was opened in Kirkkonummi and a<br />
K-supermarket in Eurajoki and Porvoo. In November, a K-citymarket<br />
was opened in Linnainmaa, Tampere, and in Koivukylä,<br />
Vantaa. In addition, several new K-markets were opened.<br />
The most significant store sites being built are the K-supermarkets<br />
in Kotka, in Koivuhaka, Vantaa, in Kangasala, Rovaniemi,<br />
Kouvola and in Paloheinä, Helsinki. K-citymarket Keljo in<br />
Jyväskylä is being extended.<br />
Home and speciality goods trade<br />
In the home and speciality goods trade, the net sales in October-<br />
December were €500 million (€490 million), up 2.0%. The<br />
growth is attributable to the good sales performance of clothing<br />
and sports goods, coupled with successful Christmas trading.<br />
The operating profit of the home and speciality goods trade<br />
excluding non-recurring items in October-December was €39.7<br />
million (7.9% of net sales), a €12.0 million year-on-year<br />
increase due to increased operational efficiency, cost savings and<br />
successful Christmas trading (€27.7 million, or 5.7%, of net<br />
sales). In October-December, the operating profit was €66.5 million<br />
(€10.6 million). Non-recurring gains on property sales and<br />
impairment charges were €26.8 million (€-17.1 million).<br />
Investments in the home and speciality goods trade in<br />
October-December were €6.8 million (€20.6 million).<br />
In October-December, Anttila's net sales were €179 million<br />
(€183 million), down 2.0%. The sales of the Anttila department<br />
stores were €110 million, down 2.5%. The sales of the Kodin<br />
Ykkönen department stores for home goods and interior decoration<br />
were €46 million, up 0.9%. NetAnttila's sales were €24 million,<br />
a decrease of 4.7%. The decline was sharp in Estonia and<br />
Latvia. In October, a new Kodin Ykkönen store was opened in<br />
Lielahti, Tampere. Kodin Ykkönen in Kaisaniemi, Helsinki will be<br />
closed down in early 2010, due to the termination of the lease.<br />
The Anttila department store in Jyväskylä will relocate to a new<br />
site in spring 2010.<br />
The net sales of K-citymarket’s home and speciality goods<br />
trade in October-December were €198 million (€187 million), up<br />
5.5%. The net sales performance was affected by store site<br />
network expansions and an increased number of customers.<br />
In October, a K-citymarket was opened in Kirkkonummi and an<br />
extended K-citymarket in Mikkeli. In November, K-citymarkets<br />
were opened in Koivukylä, Vantaa, and in Linnainmaa, Tampere.<br />
Intersport Finland’s net sales in October-December were €46<br />
million (€40 million), up 14.8% owing to the good sales performance<br />
of winter sports equipment. Indoor’s net sales in October-December<br />
were €39 million (€42 million), down 7.0%.<br />
Indoor's net sales in Finland matched the level of the comparative<br />
period. Musta Pörssi Ltd’s net sales in October-December<br />
were €35 million (€35 million), up 0.7%. Kenkäkesko Ltd’s<br />
net sales in October-December were €4 million (€4 million),<br />
down 7.5%.<br />
Building and home improvement trade<br />
In the building and home improvement trade, the net sales in<br />
October-December were €525 million (€617 million), down<br />
14.9%.<br />
In October-December, the net sales in Finland were €223 million,<br />
a decrease of 14.9%. The building and home improvement<br />
trade contributed €159 million and the agricultural supplies<br />
trade €63 million to the net sales in Finland. The net sales of the<br />
building and home improvement trade in Finland were down<br />
3.6%, and the net sales of the agricultural supplies trade<br />
decreased by 34.7%.<br />
The net sales from foreign operations in the building and<br />
home improvement trade were €302 million (€356 million), a<br />
decrease of 15.0%. In addition to a decline in demand, the sales<br />
performance of foreign operations was affected by the weakening<br />
of the Russian ruble. The net sales from foreign operations<br />
dropped by 14.9% in terms of the local currencies. Foreign operations<br />
contributed 57.6% to the net sales of the building and<br />
home improvement trade.<br />
In Sweden, the net sales of K-rauta AB increased by 16.3% to<br />
€43 million in October-December. In terms of the local currency,<br />
K-rauta AB’s net sales grew by 14.7%. In Norway, Byggmakker's<br />
net sales increased by 11.9% to €120 million. In terms of the<br />
local currency, Byggmakker’s net sales grew by 1.5%. In Estonia,<br />
Rautakesko's net sales were down 22.4% to €14 million. In<br />
Latvia, Rautakesko's net sales decreased by 31.6% to €10 million.<br />
In Lithuania, Senukai's net sales fell by 45,2% to €57 million.<br />
In Russia, the net sales of the building and home improvement<br />
trade decreased by 22.7% to €42 million. In terms of the<br />
local currency, the net sales decreased by 6.5%. The net sales of<br />
the Belarusian OMA were down by 32.4% to €13 million. In<br />
terms of the local currency, OMA’s net sales decreased by 2.9%.<br />
In October-December, the operating loss excluding non-recurring<br />
items of the building and home improvement trade was<br />
€2.1 million, or -0.4% of net sales, compared to €7.5 million<br />
(-1.2% of net sales) in the previous year. Regardless of net sales<br />
decrease, profitability improved as a result of cost adjustments,<br />
and the impairments on inventories and trade receivables negatively<br />
affecting the profit of the comparative year. The operating<br />
profit of the building and home improvement trade was €1.6<br />
million (€-6.5 million) in October-December.<br />
In October-December, investments in the building and home<br />
improvement trade were €19.4 million (€44.9 million), of which<br />
85.6% (87.5%) abroad.
The retail sales of the K-rauta and Rautia chains in October-<br />
December increased by 0.2% to €266 million, including VAT, in<br />
Finland. The sales of Rautakesko B2B Service decreased by<br />
14.1%. The retail sales of the K-maatalous chain were €96 million,<br />
including VAT, down 37.3%.<br />
In October-December, a new Rautia store was opened in<br />
Kiiminki, and a replacement K-rauta store in Vaasa.<br />
Rautakesko is building a new K-rauta store in Jyväskylä, Finland,<br />
another in Stockholm, Sweden, and two new K-rauta stores<br />
in Russia, one in Tula and the other in Kaluga. OMA is building a<br />
new store in Minsk, Belarus.<br />
Car and machinery trade<br />
In October-December, the net sales of the car and machinery<br />
trade were €205 million (€295 million), down 30.5%.<br />
VV-Auto’s net sales in October-December were €125 million<br />
(€161 million), a decrease of 22.2%. The net sales performance<br />
was affected by a decline in demand in the car trade, coupled<br />
with the car tax change effective at the beginning of April, causing<br />
the car tax levied on cars after 1 April <strong>2009</strong> to be excluded<br />
from the net sales. The comparable net sales, adjusted for the tax<br />
change, decreased by 7.4% in October-December. However, the<br />
number of new customer orders in October-December was clearly<br />
up on the previous year. The combined market share of passenger<br />
cars and vans imported by VV-Auto rose to 18.8% (18.4%) in<br />
October-December.<br />
Konekesko's net sales in October-December were €80 million<br />
(€134 million), down 40.5% on the corresponding period of the<br />
previous year, as a result of the weakened machinery market and<br />
the discontinuation of the Baltic grain and agricultural supplies<br />
trade. The net sales in Finland were €36 million, a decrease of<br />
29.5%. The net sales from Konekesko’s foreign operations were<br />
€44 million, down 47.2%.<br />
In October-December, the operating profit excluding nonrecurring<br />
items of the car and machinery trade was €2.7 million<br />
(1.3% of net sales), which was €19.8 million, or 7.1 percentage<br />
points, higher than in the corresponding period of the previous<br />
year. The profit performance was affected by substantial cost<br />
adjustments and the impairments on the inventories and trade<br />
receivables of the machinery and agricultural trade negatively<br />
affecting the profitability of the comparative year.<br />
Changes in the Group composition<br />
Effective 1 January <strong>2009</strong>, the Kesko Group’s segments are the<br />
food trade, the home and speciality goods trade, the building<br />
and home improvement trade, and the car and machinery trade<br />
(stock exchange release on 12 December 2008).<br />
Resolutions of the <strong>Annual</strong> General Meeting <strong>2009</strong><br />
and decisions of the Board’s organisational<br />
meeting<br />
Kesko Corporation’s <strong>Annual</strong> General Meeting held on 30 March<br />
<strong>2009</strong> adopted the financial statements for 2008 and discharged<br />
the Board of Directors’ members and the Managing Director from<br />
liability. The <strong>Annual</strong> General Meeting also resolved to distribute a<br />
dividend of €1.00 per share, or a total amount of €97,851,050,<br />
as proposed by the Board. The dividend pay date was 9 April<br />
<strong>2009</strong>. The <strong>Annual</strong> General Meeting elected PricewaterhouseCoopers<br />
Oy as the company’s auditor, with APA Johan Kronberg as the<br />
auditor with principal responsibility, and approved the Board’s<br />
Kesko financial statements <strong>2009</strong><br />
75<br />
proposal to amend the article of the Articles of Association<br />
providing for the convocation period so that the notice of the<br />
General Meeting shall be given at the latest 21 days before the<br />
General Meeting, and the Board’s proposal to authorise the<br />
Board to decide on the issuance of a maximum of 20,000,000<br />
new B shares. The share issue authorisation is valid until 30<br />
March 2012.<br />
The <strong>Annual</strong> General Meeting resolved to leave the number of<br />
members of the Board of Directors unchanged at seven, and<br />
elected Heikki Takamäki, Seppo Paatelainen, Maarit Näkyvä, Ilpo<br />
Kokkila, Esa Kiiskinen (new member), Mikko Kosonen (new member)<br />
and Rauno Törrönen (new member) as members of the company’s<br />
Board of Directors for a three-year term defined in the<br />
Articles of Association, which will expire at the close of the 2012<br />
<strong>Annual</strong> General Meeting.<br />
The resolutions of the <strong>Annual</strong> General Meeting were<br />
announced in more detail in a stock exchange release on 30<br />
March <strong>2009</strong>.<br />
The organisational meeting of Kesko Corporation’s Board of<br />
Directors, held after the <strong>Annual</strong> General Meeting on 30 March<br />
<strong>2009</strong>, elected Heikki Takamäki as its Chair and Seppo Paatelainen<br />
as its Deputy Chair. Maarit Näkyvä (Ch.), Seppo Paatelainen and<br />
Mikko Kosonen were appointed to the Board of Directors’ Audit<br />
Committee. Heikki Takamäki (Ch.), Seppo Paatelainen and Ilpo<br />
Kokkila were appointed to the Board of Directors’ Remuneration<br />
Committee. The terms of the Committees expire at the close of<br />
the next <strong>Annual</strong> General Meeting. The decisions of the Board’s<br />
organisational meeting were announced in a stock exchange<br />
release on 30 March <strong>2009</strong>.<br />
Shares, securities market and Board<br />
authorisations<br />
At the end of December <strong>2009</strong>, Kesko Corporation's share capital<br />
totalled €196,643,058. Of all shares 31,737,007, or 32.3%,<br />
were A shares and 66,584,522, or 67.7%, were B shares. The<br />
aggregate number of shares was 98,321,529. Each A share entitles<br />
to ten (10) votes and each B share to one (1) vote. During the<br />
reporting period, the share capital was increased four times corresponding<br />
to share subscriptions with the stock options of the<br />
year 2003 option scheme. The increases were made on 11 February<br />
<strong>2009</strong> (€52,392), 5 May <strong>2009</strong> (€51,250), 5 June <strong>2009</strong><br />
(€673,146) and 17 December <strong>2009</strong> (€216,562), and announced<br />
in stock exchange notifications on the same days. The subscribed<br />
shares were included on the main list of the Helsinki stock<br />
exchange for public trading with the old B shares on 12 February<br />
<strong>2009</strong>, 6 May <strong>2009</strong>, 8 June <strong>2009</strong> and 18 December <strong>2009</strong>.<br />
The price of a Kesko A share quoted on NASDAQ OMX Helsinki<br />
(the Helsinki stock exchange) was €22.00 at the end of 2008,<br />
and €23.60 at the end of <strong>2009</strong>, representing an increase of<br />
7.3%. The price of a B share was €17.80 at the end of 2008, and<br />
€23.08 at the end of <strong>2009</strong>, representing an increase of 29.7%.<br />
In January-December, the highest A share quotation was €25.00<br />
and the lowest was €18.73. For B shares, they were €24.00 and<br />
€14.99 respectively. In January-December, the OMX Helsinki All<br />
Share index of the Helsinki stock exchange rose by 19.5%, the<br />
weighted OMX Helsinki CAP index by 36.2%, while the Consumer<br />
Staples Index was up 30.8% during the same period.<br />
At the end of <strong>2009</strong>, the market capitalisation of A shares was<br />
€749 million, while that of B shares was €1,537 million. Their<br />
combined market capitalisation was €2,286 million, an increase
76 Kesko financial statements <strong>2009</strong><br />
of €411 million compared with the end of 2008. In <strong>2009</strong>,<br />
993,444 A shares were traded on the Helsinki stock exchange at<br />
a total value of €22 million, while 78.2 million B shares were<br />
traded at a total value of €1,501 million.<br />
The 2003E stock options of the year 2003 option scheme were<br />
available for trading until the end of April <strong>2009</strong>, and a total of<br />
some 116,000 options were traded at a total value of €981,000.<br />
A total of some 153,000 2003F stock options were traded during<br />
the reporting period at a total value of €1,122,000.<br />
The Board of Directors was authorised by the <strong>Annual</strong> General<br />
Meeting of 30 March <strong>2009</strong> to issue a maximum of 20,000,000<br />
new B shares against payment or other consideration. The<br />
authorisation also includes a rights issue. The authorisation has<br />
not been used. In addition to the 2003 stock option scheme, the<br />
company operates the 2007 scheme of stock options 2007A,<br />
2007B and 2007C. Their exercise period has not started. Further<br />
information on the Board’s authorisations is available at<br />
www.kesko.fi.<br />
At the end of the reporting period, the number of shareholders<br />
was 38,888. In <strong>2009</strong>, it increased by 808 shareholders.<br />
At the end of <strong>2009</strong>, foreign ownership of all shares was 20%,<br />
and foreign ownership of B shares was 30%.<br />
Flagging notifications<br />
Kesko Corporation did not receive flagging notifications during<br />
the reporting period.<br />
Main events during the reporting period<br />
Kesko Corporation’s Board of Directors approved the Group’s<br />
revised financial objectives. The objective for return on investment<br />
has been replaced by the objective for return on capital<br />
employed. The new objective for return on equity has been set at<br />
12% (previously 14%) and the objective for return on capital<br />
employed has been set at 14%. The objective range of the equity<br />
ratio has been broadened to 40–50% (previously 40–45%). The<br />
Board of Directors also revised <strong>Kesko's</strong> dividend policy, published<br />
on 6 April 2005. In accordance with the new dividend policy,<br />
Kesko Corporation distributes at least 50% of its earnings per<br />
share excluding non-recurring items as dividends, taking however<br />
the company's financial position and operating strategy into<br />
account (stock exchange release on 5 February <strong>2009</strong>).<br />
On 31 March <strong>2009</strong>, Kesko sold four store properties to the<br />
Kesko Pension Fund. The debt-free selling price was about €50<br />
million. The Kesko Group’s gain on the sale was €19.7 million,<br />
which was treated as a non-recurring item in the operating profit<br />
for the first quarter (stock exchange release on 31 March <strong>2009</strong>).<br />
The <strong>Annual</strong> General Meeting was held on 30 March <strong>2009</strong><br />
(stock exchange releases on 30 March <strong>2009</strong>).<br />
The Supreme Administrative Court decided not to grant leave<br />
to appeal against the Helsinki Administrative Court’s prior decision<br />
not to accept the €22.5 million write-down made by Rautakesko<br />
Ltd on the shares of its Swedish subsidiary, K-rauta AB, in<br />
its taxation for the year 2001. The Supreme Administrative Court<br />
also decided not to grant leave to appeal against the Helsinki<br />
Administrative Court’s prior decision to dismiss Kesko Corporation's<br />
appeal concerning the deductibility of expenses added to<br />
its taxable income for the years 1997–1999 (stock exchange<br />
release on 11 June <strong>2009</strong>).<br />
Kesko sold 13 retail store properties in different parts of Finland<br />
to Varma Mutual Pension Insurance Company. The debt-free<br />
selling price of the properties was €156 million. The Kesko<br />
Group's gain on the sale was €63 million, which was treated as a<br />
non-recurring item in <strong>Kesko's</strong> fourth quarter operating profit<br />
(stock exchange release on 22 December <strong>2009</strong>).<br />
Kesko decided to transfer the management of the statutory<br />
pension provision and the insurance portfolio to Ilmarinen<br />
Mutual Pension Insurance Company in two phases, starting from<br />
1 June 2010. The Kesko Pension Fund's statutory employee pension<br />
insurance (department B) covers about 8,700 people. The<br />
first phase of the transfer will concern some 3,600 people. The<br />
transfer is estimated to have a positive effect on <strong>Kesko's</strong> cash<br />
flow. The transfer is subject to the approval of the Financial<br />
Supervisory Authority and the Finnish Competition Authority. The<br />
second phase will be implemented at the beginning of 2012 at<br />
the earliest.<br />
An agreement has also been made to sell store sites and<br />
shares owned by the Kesko Pension Fund and Kesko, in a total<br />
value of some €440 million, partly to Ilmarinen and partly to a<br />
joint venture owned by Kesko, the Kesko Pension Fund and<br />
Ilmarinen, in connection with the transfer of pension liabilities.<br />
The completion of the arrangements will have a positive nonrecurring<br />
income statement impact for Kesko and the Kesko Pension<br />
Fund. The implementation of the arrangements under the<br />
letter of intent is subject to the approval of the bodies of the<br />
contracting parties (stock exchange release on 30 December<br />
<strong>2009</strong>).<br />
Information contained in the notes to the<br />
financial statements<br />
Information on the Group's personnel is disclosed in note 8.<br />
Information on options, shares under options and voting rights is<br />
disclosed in note 35.<br />
Related party transactions are disclosed in note 43. The Kesko<br />
Group is not engaged in significant research and development<br />
activities.<br />
In May 2010, Kesko will publish a separate corporate responsibility<br />
report which analyses the Group's performance in economic,<br />
social and environmental responsibility. An assurance<br />
statement will be provided by an independent external party.<br />
Risk management<br />
The Kesko Group has established a risk management process,<br />
based on the risk management policy confirmed by the Board.<br />
The divisions have made risk assessments and updated them in<br />
accordance with the strategy process and the rolling planning<br />
framework. The divisions' risks and their management responses<br />
have been discussed by the division parent companies' and the<br />
Group's management. In their respective responsibility areas, the<br />
Group units have assessed the risks threatening the Group's<br />
objectives and the management of such risks.<br />
On the basis of the divisions' and Group units' risk analyses,<br />
the Corporate Risk Management Unit has prepared summaries of<br />
major risks and their management on a quarterly basis. The<br />
resulting risk report has been handled by Kesko Corporation's<br />
Board of Directors' Audit Committee. The main risks and uncertainties<br />
have been reported in the interim financial reports. The<br />
following is a description of the risks and uncertainties assessed<br />
to be significant.
Significant risks and uncertainties<br />
The general economic development continues to involve significant<br />
uncertainties. Developments in the employment situation,<br />
tax increases resulting from the debt burden of the public sector,<br />
and consumers' confidence in the future have an essential<br />
impact on consumers' purchasing power, consumer demand and<br />
businesses' investment readiness. The biggest uncertainty relates<br />
to the building and home improvement trade, and the car and<br />
machinery trade, as well as the consumer demand trends in<br />
<strong>Kesko's</strong> operating countries, especially in Latvia, Lithuania,<br />
Estonia and Russia.<br />
Kesko aims to achieve growth also through international<br />
expansion in selected business areas. Failures in these projects<br />
may put growth and profitability at risk. On the other hand,<br />
business and stores site acquisitions may be easier to complete<br />
and with better terms. Expansion and operations in Russia<br />
involve both opportunities and risks. The unpredictability of officials<br />
and sudden changes in the interpretation and application<br />
of laws may complicate operating activities or delay expansion in<br />
Russia.<br />
Changes in consumer behaviour, technological developments<br />
and an increasing supply of electronic services are significantly<br />
changing the operating systems of trade. <strong>Kesko's</strong> challenge is to<br />
combine the possibilities of online trading, electronic customer<br />
communication and the retailer business model into an efficient<br />
system.<br />
The automation of financial administration routines may be<br />
delayed by suppliers' and retailers' technical facilities and abilities<br />
to adopt new operating systems. Kesko is carrying out several<br />
significant information system projects. There is a risk that the<br />
expected benefits are delayed or that the project costs are<br />
exceeded.<br />
The trading sector is characterised by increasingly complicated<br />
and long supply chains and a dependency on information systems,<br />
telecommunications and external service providers. Disturbances<br />
in the supply chain can cause major losses in sales and<br />
profit.<br />
Failure in the protection of personal information and card<br />
payments could cause losses, claims for damages and the<br />
degrading of reputation.<br />
Shrinkage causes significant financial losses for the retail<br />
trade. Shrinkage results, for example, from spoiled or damaged<br />
goods, theft or other malpractice, and unsuccessful purchasing.<br />
Recession entails a growing risk of financial malpractice.<br />
In business divisions that are strongly dependent on individual<br />
principals and suppliers, such as the car and machinery<br />
trade, ownership arrangements, changes in a principal's or supplier's<br />
strategy concerning the product selection, pricing and distribution<br />
channel solutions can mean a reduction in competitiveness<br />
or sales or loss of business.<br />
Considerable amounts of capital or lease liabilities are tied up<br />
in store properties for years. As a result of the recession or<br />
changes in local competitive situations, the operations in a store<br />
site can run risk of becoming unprofitable and the operation<br />
ends while non-current liabilities remain.<br />
A failure in product control or in the quality assurance of the<br />
supply chain may result in financial losses, the loss of customer<br />
confidence or, in the worst case, a health hazard.<br />
Compliance with legislation, agreements and <strong>Kesko's</strong> responsibility<br />
guidelines or ethical principles is an important basic<br />
Kesko financial statements <strong>2009</strong><br />
value. Non-compliance may result in fines, compensation for<br />
damages and other financial losses, and a loss of confidence or<br />
reputation.<br />
Further information about the risks, uncertainties and management<br />
responses relating to <strong>Kesko's</strong> operating activities, and<br />
about <strong>Kesko's</strong> risk management system and principles is available<br />
in note 42 to the financial statements and on the company's<br />
website at www.kesko.fi.<br />
Other risks and uncertainties relating to profit performance<br />
are described in the Group’s future outlook.<br />
77<br />
Future outlook<br />
Estimates of the future outlook for the Kesko Group's net sales<br />
and operating profit excluding non-recurring items are given for<br />
the 12 months following the reporting period (1/2010–12/2010)<br />
in comparison with the 12 months preceding the reporting<br />
period (1/<strong>2009</strong>–12/<strong>2009</strong>). The performance of the Group's operating<br />
activities is affected by the economic outlook in its different<br />
market areas and especially by the growth rate of private consumption.<br />
Substantial uncertainties are related to the economic<br />
outlook and developments in the real economy in the near<br />
future. In Finland, the unemployment rate is expected to rise<br />
further, which is why private consumer demand is not expected<br />
to return to growth during the next twelve months.<br />
The steady development of the grocery trade is expected to<br />
continue, although grocery prices are expected to turn down. The<br />
market situation is expected to remain difficult in the building<br />
sector and in the car and machinery trade.<br />
Making any statement about the Group's future outlook continues<br />
to be impacted by the economic outlook and the increasing<br />
unemployment. In 2010, the Kesko Group's net sales and<br />
operating profit excluding non-recurring items from continuing<br />
operations are expected to match the level of <strong>2009</strong>. The Group's<br />
liquidity and solvency are expected to remain excellent.<br />
Proposal for profit distribution<br />
The parent's distributable profits are €1,051,861,023.07, of<br />
which the profit for the period is €138,776,973.11.<br />
The Board of Directors proposes to the <strong>Annual</strong> General Meeting to<br />
be held on 29 March 2010 that the distributable profits be used<br />
as follows:<br />
€0.90 per share, or a total of €88,547,166.90, be distributed as<br />
dividends.<br />
€1,300,000.00 are reserved for charitable donations at the<br />
discretion of the Board of Directors.<br />
€962,013,856.17 are carried forward in equity.<br />
<strong>Annual</strong> General Meeting<br />
The Board of Directors decided to convene the <strong>Annual</strong> General<br />
Meeting at the Helsinki Fair Centre on 29 March 2010 at 13.00.<br />
Kesko Corporation will publish a notice of the <strong>Annual</strong> General<br />
Meeting at a later date.<br />
<strong>Annual</strong> <strong>Report</strong> <strong>2009</strong> and<br />
Corporate Governance Statement<br />
Kesko will publish the <strong>2009</strong> <strong>Annual</strong> <strong>Report</strong>, which contains the<br />
report by <strong>Kesko's</strong> Board of Directors and the financial statements<br />
for <strong>2009</strong>, and a separate Corporate Governance Statement on<br />
week 9 on its website at www.kesko.fi.
78 Kesko financial statements <strong>2009</strong><br />
Group<br />
performance<br />
indicators<br />
Key indicators<br />
Operating profit<br />
excl. non-recurring items*, € million<br />
350<br />
300<br />
250<br />
200<br />
150<br />
100<br />
50<br />
0<br />
Return on equity, %<br />
25<br />
20<br />
15<br />
10<br />
5<br />
0<br />
Earnings per share and dividend<br />
per share, €<br />
4.0<br />
3.5<br />
3.0<br />
2.5<br />
2.0<br />
1.5<br />
1.0<br />
0.5<br />
0<br />
2005 2006 2007 2008 <strong>2009</strong><br />
2005 2006 2007 2008 <strong>2009</strong><br />
2005 2006 2007 2008 <strong>2009</strong><br />
Earnings/share,basic<br />
Non-recurring items Dividend<br />
**<br />
Net sales*, € million<br />
10,000<br />
9,000<br />
8,000<br />
7,000<br />
6,000<br />
5,000<br />
4,000<br />
3,000<br />
2,000<br />
1,000<br />
0<br />
Investments*, € million<br />
400<br />
350<br />
300<br />
250<br />
200<br />
150<br />
100<br />
50<br />
0<br />
Finland Other countries<br />
Profit before tax*, € million<br />
400<br />
350<br />
300<br />
250<br />
200<br />
150<br />
100<br />
50<br />
0<br />
Payout ratio, %<br />
100<br />
80<br />
60<br />
40<br />
20<br />
0<br />
2005 2006 2007 2008 <strong>2009</strong><br />
2005 2006 2007 2008 <strong>2009</strong><br />
2005 2006 2007 2008 <strong>2009</strong><br />
2005 2006 2007 2008 <strong>2009</strong><br />
* continuing operations ** proposal to the AGM<br />
**<br />
Operating profit*, € million<br />
400<br />
350<br />
300<br />
250<br />
200<br />
150<br />
100<br />
50<br />
0<br />
Return on capital employed, %<br />
25<br />
20<br />
15<br />
10<br />
5<br />
0<br />
Equity ratio, %<br />
60<br />
50<br />
40<br />
30<br />
20<br />
10<br />
0<br />
Equity per share, €, 31.12., adjusted<br />
25<br />
20<br />
15<br />
10<br />
5<br />
0<br />
2005 2006 2007 2008 <strong>2009</strong><br />
2005 2006 2007 2008 <strong>2009</strong><br />
2005 2006 2007 2008 <strong>2009</strong><br />
2005 2006<br />
2007 2008 <strong>2009</strong>
Group performance indicators<br />
Kesko financial statements <strong>2009</strong><br />
Continuing operations 2006 2007 2008 <strong>2009</strong><br />
Income statement<br />
Net sales € million 8,493 9,287 9,591 8,447<br />
Change in net sales % 11.1 9.4 3.4 -11.9<br />
Staff cost € million 515 547 578 535<br />
Staff cost as percentage of net sales % 6.1 5.9 6.0 6.3<br />
Depreciation and impairment charges € million 129 116 178 131<br />
Operating profit € million 355 322 286 232<br />
Operating profit as percentage of net sales % 4.2 3.5 3.0 2.8<br />
Operating profit excl. non-recurring items € million 273 315 217 155<br />
Operating profit excl. non-recurring items as percentage of net sales % 3.2 3.4 2.3 1.8<br />
Financial income and expenses € million -5 36 1 -16<br />
Income from associates € million 1 0 2 0<br />
Profit before tax € million 351 358 289 217<br />
Profit before tax % 4.1 3.9 3.0 2.6<br />
Income tax € million 105 87 89 82<br />
Profit for the year from continuing operations € million 235 248 178 125<br />
Profit for the year from discontinued operations € million 133 37 42 -<br />
Investments € million 246 228 338 198<br />
Investments as percentage of net sales % 2.9 2.5 3.5 2.3<br />
Personnel, average number for the year 18,937 20,520 21,327 19,184<br />
Personnel at 31 Dec. 23,052 25,208 24,668 22,200<br />
Earnings/share, diluted € 2.39 2.52 1.81 1.27<br />
Earnings/share, basic € 2.41 2.54 1.82 1.28<br />
79
80 Kesko financial statements <strong>2009</strong><br />
Whole Group 2006 2007 2008 <strong>2009</strong><br />
Profit for the year (incl. minority interest) € million 379 307 241 134<br />
Profit for the year as percentage of net sales % 4.2 3.2 2.5 1.6<br />
Attributable to owners of the parent € million 369 285 220 125<br />
Attributable to minority interest € million 10 22 21 9<br />
Cash flow from operating activities € million 328 248 131 379<br />
Cash flow from investing activities € million 203 -85 -46 31<br />
Profitability<br />
Return on equity % 23.1 16.4 12.1 6.6<br />
Return on equity excl. non-recurring items % 11.4 12.7 8.1 3.8<br />
Return on capital employed % 22.0 16.3 15.2 11.0<br />
Return on capital employed excl. non-recurring items % 12.3 14.7 10.3 7.3<br />
Interest-bearing net debt/EBITDA 0.3 0.6 0.1 -0.7<br />
Finance and financial position<br />
Gearing % 11.9 14.0 2.3 -12.5<br />
Equity ratio % 47.0 48.5 52.4 54.1<br />
Other indicators<br />
Investments € million 282 228 340 198<br />
Investments as percentage of net sales % 3.1 2.5 3.5 2.3<br />
Personnel, average number for the year 23,756 20,520 21,327 19,184<br />
Personnel at 31 Dec. 23,755 25,890 24,668 22,200<br />
Share performance indicators<br />
Whole Group<br />
Earnings/share, diluted € 3.76 2.90 2.24 1.27<br />
Earnings/share, basic € 3.80 2.92 2.25 1.28<br />
Earnings/share, excl. non-recurring items, basic € 1.83 2.21 1.44 0.71<br />
Equity/share, adjusted € 17.94 19.53 20.09 20.39<br />
Dividend/share € 1.50 1.60 1.00 0.90*<br />
Payout ratio % 39.5 54.8 44.5 70.5*<br />
Payout ratio excl. non-recurring items % 82.0 72.4 69.4 126.8*<br />
Cash flow from operating activities/share, adjusted € 3.35 2.52 1.37 3.86<br />
Price/earnings ratio, (P/E), A share, adjusted 10.22 13.07 9.84 18.54<br />
Price/earnings ratio, (P/E), B share, adjusted 10.64 13.02 7.96 18.13<br />
Effective dividend yield, A share % 3.9 4.2 4.6 3.8*<br />
Effective dividend yield, B share<br />
Share price at 31 Dec.<br />
% 3.8 4.2 5.6 3.9*<br />
A share € 38.43 37.85 22.00 23.60<br />
B share<br />
Average share price<br />
€ 40.02 37.72 17.80 23.08<br />
A share € 30.10 43.85 28.30 21.92<br />
B share € 31.34 43.36 23.51 19.18<br />
Market capitalisation, A share € million 1,220 1,201 698 749<br />
Market capitalisation, B share<br />
Turnover<br />
€ million 2,632 2,491 1,176 1,537<br />
A share million pcs 2 4 1 1<br />
B share million pcs 77 122 121 78<br />
Turnover rate %<br />
A share % 6.4 11.5 4.5 3.1<br />
B share % 117.1 185.3 183.3 117.4<br />
Adjusted number of shares at 31 Dec. thousand 98,027 98,395 98,256 98,382<br />
Yield of A share for the last five periods<br />
Yield of B share<br />
% 29.3 26.6 10.9 9.2<br />
For the last five periods % 42.8 36.1 12.9 10.3<br />
For the last ten periods % 22.7 18.7 11.7 14.9<br />
* proposal to the <strong>Annual</strong> General Meeting
Net sales by segment,<br />
continuing operations<br />
(€ million) 1–12/<strong>2009</strong> 1–12/2008 Change, %<br />
Food trade, Finland 3,790 3,696 2.6<br />
Food trade, other countries* 7 11 -33.1<br />
Food trade total<br />
Home and speciality goods trade,<br />
3,798 3,707 2.4<br />
Finland<br />
Home and speciality goods trade,<br />
1,530 1,560 -1.9<br />
other countries*<br />
Home and speciality goods<br />
28 46 -39.6<br />
trade total<br />
Building and home improvement<br />
1,558 1,606 -3.0<br />
trade, Finland<br />
Building and home improvement<br />
1,041 1,319 -21.1<br />
trade, other countries*<br />
Building and home improvement<br />
1,271 1,659 -23.4<br />
trade total 2,312 2,978 -22.4<br />
Car and machinery trade, Finland<br />
Car and machinery trade,<br />
773 1,137 -32.0<br />
other countries* 175 343 -49.1<br />
Car and machinery trade total<br />
Common operations and<br />
947 1,480 -36.0<br />
eliminations -168 -178 -5.7<br />
Finland total 6,966 7,533 -7.5<br />
Other countries total* 1,481 2,059 -28.1<br />
Group total 8,447 9,591 -11.9<br />
* exports and net sales in countries other than Finland.<br />
Kesko financial statements <strong>2009</strong><br />
81<br />
Operating profit by<br />
segment, continuing<br />
operations (€ million) 1–12/<strong>2009</strong> 1–12/2008 Change<br />
Food trade1 170.6 185.5 -14.9<br />
Home and speciality goods trade2 Building and home improvement<br />
66.5 63.6 3.0<br />
trade3 19.6 19.4 0.2<br />
Car and machinery trade<br />
Common operations and<br />
-5.1 30.5 -35.6<br />
eliminations -19.3 -13.3 -6.0<br />
Total 232.3 285.6 -53.3<br />
Segments’ operating profits excl.<br />
non-ecurring items,<br />
continuing operations<br />
(€ million) 1–12/<strong>2009</strong> 1–12/2008 Change<br />
Food trade 133.1 122.5 10.5<br />
Home and speciality goods trade<br />
Building and home improvement<br />
29.5 31.2 -1.7<br />
trade 11.9 56.4 -44.4<br />
Car and machinery trade<br />
Common operations and<br />
0.3 30.4 -30.1<br />
eliminations -19.4 -23.6 4.1<br />
Total 155.4 217.0 -61.6<br />
1) Includes €46.4 million in non-recurring gains on real estate disposals.<br />
The operating profit of the comparative year included €68.5 million in<br />
non-recurring gains on real estate disposals and lease arrangements.<br />
2) Includes €37.0 million (€32.4 million) in non-recurring gains on real<br />
estate disposals and impairments.<br />
3) Includes a €7.7 million non-recurring gain on real estate disposal. The<br />
comparative period included a €47.0 million non-recurring impairment<br />
charge on Byggmakker Norge's intangible assets, and a €5.4 million<br />
non-recurring gain on real estate disposal.
82 Kesko financial statements <strong>2009</strong><br />
Group performance indicators by quarter<br />
1–3/<br />
2008<br />
4–6/<br />
2008<br />
7–9/<br />
2008<br />
10–12/<br />
2008<br />
Net sales, € million 2,277 2,547 2,435 2,333 2,018 2,143 2,133 2,153<br />
Change in net sales, % 6.8 6.1 3.0 -2.4 -11.4 -15.9 -12.4 -7.7<br />
Operating profit, € million 150.1 84.8 43.8 6.9 23.2 42.7 48.3 118.1<br />
Operating margin, % 6.6 3.3 1.8 0.3 1.1 2.0 2.3 5.5<br />
Operating profit excl. non-recurring items, € million 36.6 81.1 72.0 27.3 3.4 36.4 47.5 68.0<br />
Operating margin excl. non-recurring items, % 1.6 3.2 3.0 1.2 0.2 1.7 2.2 3.2<br />
Financial income/expenses, € million -1.4 -0.2 1.8 0.8 -5.1 -4.4 -4.7 -1.8<br />
Profit before tax, € million 148.6 84.3 48.0 7.7 18.2 38.2 43.8 116.3<br />
Profit before tax, % 6.5 3.3 2.0 0.3 0.9 1.8 2.1 5.4<br />
Return on capital employed, % 30.1 22.2 8.2 1.4 4.2 8.0 9.4 22.9<br />
Return on capital employed excl. non-recurring items, % 7.3 15.6 13.6 4.9 0.6 6.8 9.2 13.2<br />
Return on equity, % 25.1 19.1 4.2 0.6 2.4 4.6 5.2 14.7<br />
Return on equity excl. non-recurring items, % 5.6 12.3 10.4 4.3 -0.6 3.7 5.0 7.7<br />
Equity ratio, % 46.3 49.0 50.2 52.4 49.8 51.0 52.3 54.1<br />
Investments, € million* 60.3 83.0 89.9 105.2 51.5 55.8 49.2 41.5<br />
Earnings per share, diluted, €* 1.11 0.58 0.17 -0.05 0.12 0.19 0.24 0.73<br />
Equity per share, € 19.13 20.17 20.29 20.09 19.16 19.36 19.60 20.39<br />
* Continuing operations<br />
Net sales by segment, continuing operations<br />
€ million<br />
1–3/<br />
2008<br />
4–6/<br />
2008<br />
7–9/<br />
2008<br />
10–12/<br />
2008<br />
Food trade 853 939 933 982 888 974 966 970<br />
Home and speciality goods trade 364 355 396 490 346 331 381 500<br />
Building and home improvement trade 695 870 795 617 529 643 614 525<br />
Car and machinery trade 402 426 357 295 296 233 213 205<br />
Common operations and eliminations -37 -44 -46 -51 -41 -39 -41 -47<br />
Group total 2,277 2,547 2,435 2,333 2,018 2,143 2,133 2,153<br />
1–3/<br />
<strong>2009</strong><br />
1–3/<br />
<strong>2009</strong><br />
4–6/<br />
<strong>2009</strong><br />
4–6/<br />
<strong>2009</strong><br />
7–9/<br />
<strong>2009</strong><br />
7–9/<br />
<strong>2009</strong><br />
10–12/<br />
<strong>2009</strong><br />
10–12/<br />
<strong>2009</strong><br />
Segments’ operating profits, continuing operations<br />
1–3/ 4–6/ 7–9/ 10–12/ 1–3/ 4–6/ 7–9/ 10–12/<br />
€ million<br />
2008 2008 2008 2008 <strong>2009</strong> <strong>2009</strong> <strong>2009</strong> <strong>2009</strong><br />
Food trade 81.3 31.5 45.3 27.4 42.3 33.8 35.8 58.7<br />
Home and speciality goods trade 40.1 3.7 9.2 10.6 -3.3 -3.6 7.0 66.5<br />
Building and home improvement trade 7.3 34.6 -16.1 -6.5 -5.2 14.8 8.5 1.6<br />
Car and machinery trade 15.8 21.3 10.4 -17.0 -6.0 1.9 1.7 -2.7<br />
Common operations and eliminations 5.6 -6.3 -4.9 -7.6 -4.6 -4.3 -4.5 -5.9<br />
Group total 150.1 84.8 43.8 6.9 23.2 42.7 48.3 118.1<br />
Segments’ operating profits excl. non-recurring items, continuing operations<br />
1–3/ 4–6/ 7–9/ 10–12/ 1–3/ 4–6/ 7–9/ 10–12/<br />
€ million<br />
2008 2008 2008 2008 <strong>2009</strong> <strong>2009</strong> <strong>2009</strong> <strong>2009</strong><br />
Food trade 25.0 31.5 34.4 31.6 33.8 30.1 35.5 33.7<br />
Home and speciality goods trade -6.8 3.5 6.8 27.7 -10.7 -6.0 6.5 39.7<br />
Building and home improvement trade 7.3 31.0 25.5 -7.5 -9.1 14.8 8.4 -2.1<br />
Car and machinery trade 15.8 21.3 10.4 -17.1 -6.0 1.9 1.7 2.7<br />
Common operations and eliminations -4.8 -6.2 -5.1 -7.5 -4.6 -4.4 -4.5 -6.0<br />
Group total 36.6 81.1 72.0 27.3 3.4 36.4 47.5 68.0
Calculation of performance indicators<br />
Profitability<br />
Return on equity, % =<br />
Return on equity<br />
excl. non-recurring items, % =<br />
Return on capital employed, % =<br />
Return on capital employed<br />
excluding non-recurring items, %<br />
=<br />
(Profit / loss before tax – income tax)<br />
Shareholders' equity<br />
Kesko financial statements <strong>2009</strong><br />
83<br />
x 100<br />
(Profit/loss adjusted for non-recurring items before tax – income tax adjusted for<br />
the tax effect of non-recurring items) x 100<br />
Shareholders' equity<br />
Operating profit<br />
(Non-current assets + inventories + receivables + other current assets – non-interest-bearing<br />
liabilities) for a 12 month average<br />
Operating profit excluding non-recurring items<br />
(Non-current assets + inventories + receivables + other current assets – non-interest-bearing<br />
liabilities) for a 12 month average<br />
EBITDA = Operating profit + depreciation + impairments<br />
Funding and financial position<br />
Equity ratio, % =<br />
Gearing, % =<br />
Interest-bearing net debt/EBITDA =<br />
Share performance indicators<br />
Earnings/share, diluted<br />
Earnings/share, basic =<br />
Earnings/share<br />
excl. non-recurring items, basic<br />
Equity/share =<br />
Payout ratio, % =<br />
Price/earnings ratio, (P/E) =<br />
Effective dividend yield, % =<br />
Shareholders' equity<br />
(Balance sheet total – prepayments received)<br />
Interest-bearing net debt<br />
Shareholders' equity<br />
Interest-bearing net debt<br />
EBITDA<br />
= Profit/loss – minority interest<br />
Average number of shares adjusted for the dilutive effect of options<br />
=<br />
Profit/loss – minority interest<br />
Average number of shares<br />
Profit/loss adjusted for non-recurring items – minority interest<br />
Average number of shares<br />
Equity attributable to equity holders of the parent<br />
Basic number of shares at balance sheet date<br />
(Dividend/share)<br />
Earnings/share<br />
Share price at balance sheet date<br />
(Earnings/share)<br />
(Dividend/share)<br />
Share price at balance sheet date<br />
Market capitalisation = Share price at balance sheet date × number of shares<br />
Cash flow from operating activities/share =<br />
Cash flow from operating activities<br />
Average number of shares<br />
Yields of A share and B share = Change in share price + annual dividend yield<br />
x 100<br />
x 100<br />
x 100<br />
x 100<br />
x 100<br />
x 100
84 Kesko financial statements <strong>2009</strong><br />
Analysis of shareholding<br />
Ownership structure at 31.12.<strong>2009</strong><br />
All shares Number of shares, pcs % of all shares<br />
Non-financial corporations and housing corporations 25,624,351 26.06<br />
Financial and insurance corporations 6,101,976 6.21<br />
General Government 11,342,495 11.54<br />
Households 28,889,275 29.38<br />
Non-profit institutions serving households 6,238,327 6.34<br />
Rest of the world 772,696 0.79<br />
Nominee registered 19,352,409 19.68<br />
Total 98,321,529 100.00<br />
10 largest shareholders by number of shares at 31.12.<strong>2009</strong><br />
Number of shares, pcs % of shares Number of votes % of votes<br />
1. Kesko Pension Fund 4,438,885 4.51 35,388,850 9.22<br />
2. The K-Retailers’ Association 3,400,724 3.46 33,639,590 8.76<br />
3. Vähittäiskaupan Takaus Oy 2,991,771 3.04 26,648,568 6.94<br />
4. Ilmarinen Mutual Pension Insurance Company 1,938,980 1.97 3,916,838 1.02<br />
5. Valluga-sijoitus Oy 1,340,439 1.36 13,404,390 3.49<br />
6. Varma Mutual Pension Insurance Company 1,210,986 1.23 1,210,986 0.32<br />
7. Tapiola Mutual Pension Insurance Company 1,019,858 1.04 1,019,858 0.27<br />
8. Oy The English Tearoom Ab 1,008,400 1.03 1,008,400 0.26<br />
9. Foundation for Vocational Training in the Retail Trade 936,085 0.95 7,989,898 2.08<br />
10. The State Pension Fund 850,000 0.86 850,000 0.22<br />
10 largest shareholders by number of votes at 31.12.<strong>2009</strong><br />
Number of shares, pcs % of shares Number of votes % of votes<br />
1. Kesko Pension Fund 4,438,885 4.51 35,388,850 9.22<br />
2. The K-Retailers’ Association 3,400,724 3.46 33,639,590 8.76<br />
3. Vähittäiskaupan Takaus Oy 2,991,771 3.04 26,648,568 6.94<br />
4. Valluga-sijoitus Oy 1,340,439 1.36 13,404,390 3.49<br />
5. Foundation for Vocational Training in the Retail Trade 936,085 0.95 7,989,898 2.08<br />
6. Ilmarinen Mutual Pension Insurance Company 1,938,980 1.97 3,916,838 1.02<br />
7. Ruokacity Myyrmäki Oy 389,541 0.40 3,895,410 1.01<br />
8. The K-Food Retailers’ Club 351,822 0.36 3,518,220 0.92<br />
9. Heimo Välinen Oy 313,707 0.32 2,961,570 0.77<br />
10. Svenska litteratursällskapet i Finland r.f. 350,000 0.36 2,150,000 0.56<br />
Management's shareholdings<br />
At the end of December <strong>2009</strong>, the members of Kesko Corporation's Board of Directors, the President and CEO and the corporations<br />
under their control held 224,720 Kesko Corporation A shares and 100,820 Kesko Corporation B shares, i.e. a total of 325,540 shares<br />
which represent 0.33% of the company's share capital and 0.61% of voting rights.<br />
At 31 December <strong>2009</strong>, the President and CEO held 2,000 Kesko Corporation A shares and 7,000 Kesko Corporation B shares, which<br />
represent 0.01% of the company's share capital and 0.01% of its voting rights. In addition, the President and CEO holds 150,000<br />
share options, which comprise 50,000 2007C options granted in <strong>2009</strong>. If shares were subscribed for with the President and CEO's<br />
options, the options would represent 0.15% of all shares and 0.04% of all voting rights.
Consolidated Financial Statements<br />
Consolidated income statement, IFRS<br />
Kesko financial statements <strong>2009</strong><br />
€ million Note 1.1.–31.12.<strong>2009</strong> % 1.1.–31.12.2008 %<br />
Continuing operations<br />
Net sales 2 8,446.8 100.0 9,591.5 100.0<br />
Cost of sales -7,297.6 -86.4 -8,292.7 -86.5<br />
Gross profit 1,149.2 13.6 1,298.7 13.5<br />
Other operating income 5, 7 710.4 8.4 730.3 7.6<br />
Staff cost 8, 35 -535.2 -6.3 -578.2 -6.0<br />
Depreciation and impairment 13, 14 -131.2 -1.6 -178.1 -1.9<br />
Other operating expenses 6, 7 -960.8 -11.4 -987.1 -10.3<br />
Operating profit 232.3 2.8 285.6 3.0<br />
Interest income and expenses 9 0.7 0.0 4.7 0.0<br />
Exchange differences and other financial income and expenses 9 -16.7 -0.2 -3.8 0.0<br />
Total financial income and expenses 9 -16.0 -0.2 1.0 0.0<br />
Income from associates 0.2 0.0 1.9 0.0<br />
Profit before tax 216.6 2.6 288.5 3.0<br />
Income tax 10 -82.4 -0.9 -89.4 -0.9<br />
Profit for the year from continuing operations 134.2 1.6 199.1 2.1<br />
Profit for the year from discontinued operations 4 - - 41.5 0.4<br />
Profit for the year 134.2 1.6 240.6 2.5<br />
Profit for the year attributable to<br />
Owners of the parent 125.2 219.7<br />
Minority interest 9.0 20.9<br />
Earnings per share for profit attributable<br />
to owners of the parent<br />
Continuing operations<br />
Basic, € 12 1.28 1.82<br />
Diluted, €<br />
Discontinued operations<br />
12 1.27 1.81<br />
Basic, € 12 - 0.43<br />
Diluted, €<br />
Kesko total<br />
12 - 0.43<br />
Basic, € 12 1.28 2.25<br />
Diluted, € 12 1.27 2.24<br />
Consolidated statement of comprehensive income<br />
Profit for the year 134.2 240.6<br />
Other comprehensive income:<br />
Currency translation differences related to a foreign operation 11 -2.5 -6.3<br />
Cash flow hedge revaluation 11 -3.9 -12.8<br />
Revaluation of available-for-sale financial assets 11 -1.9 2.2<br />
Other comprehensive income 11 -0.3 -0.3<br />
Tax related to components of other comprehensive income 11 1.5 2.8<br />
Total other comprehensive income for the year, net of tax -7.1 -14.5<br />
Comprehensive income for the year 127.1 226.1<br />
Comprehensive income for the year attributable to<br />
Owners of the parent 123.0 204.8<br />
Minority interest 4.1 21.3<br />
85
86 Kesko financial statements <strong>2009</strong><br />
Consolidated statement of financial position, IFRS<br />
€ million Note 31.12.<strong>2009</strong> % 31.12.2008 %<br />
ASSETS<br />
Non-current assets<br />
Intangible assets 13 184.8 169.6<br />
Tangible assets 14 1,110.6 1,209.5<br />
Investments in associates 15, 45 33.0 31.2<br />
Available-for-sale financial assets 16 3.0 3.0<br />
Non-current receivables 17, 18 67.5 69.2<br />
Deferred tax assets 19 3.2 6.5<br />
Pension assets 20 315.2 300.3<br />
Total non-current assets 1,717.4 44.7 1,789.3 46.0<br />
Current assets<br />
Inventories 21 665.5 871.0<br />
Interest-bearing receivables 22 32.1 14.9<br />
Trade receivables 22, 41 593.6 633.1<br />
Other non-interest-bearing receivables 22 117.6 137.4<br />
Financial assets at fair value through profit or loss 23 213.1 94.4<br />
Available-for-sale financial assets 24 427.7 291.0<br />
Cash and cash equivalents 25 73.9 57.8<br />
Total current assets 2,123.5 55.3 2,099.6 53.9<br />
Non-current assets held for sale 4, 26 0.9 0.0 3.0 0.1<br />
Total assets 3,841.8 100.0 3,891.9 100.0<br />
EQUITY AND LIABILITIES<br />
Equity attributable to owners of the parent<br />
Share capital 27 196.6 195.6<br />
Share issue 27 - 0.1<br />
Share premium 27 194.2 190.6<br />
Other reserves 27 242.8 242.9<br />
Currency translation differences 27 -7.1 -9.5<br />
Revaluation surplus 27 -2.7 1.6<br />
Retained earnings 1,381.0 1,344.4<br />
2,004.9 52.2 1,965.7 50.5<br />
Minority interest 64.5 1.7 60.7 1.6<br />
Total equity 2,069.4 53.9 2,026.4 52.1<br />
Non-current liabilities<br />
Interest-bearing non-current liabilities 28, 29, 41 262.0 196.9<br />
Non-interest-bearing non-current liabilities 5.7 11.8<br />
Deferred tax liabilities 19 127.7 132.0<br />
Retirement benefit obligations 20 1.8 1.8<br />
Provisions 30 14.5 20.1<br />
Total non-current liabilities 411.6 10.7 362.7 9.3<br />
Current liabilities<br />
Interest-bearing current liabilities 194.2 293.6<br />
Trade payables 31 703.5 755.6<br />
Other non-interest-bearing liabilities 31 179.9 181.6<br />
Tax liabilities 31 37.0 2.9<br />
Accrued liabilities 31 217.1 245.5<br />
Provisions 30 29.2 23.5<br />
Total current liabilities 1,360.9 35.4 1,502.9 38.6<br />
Total liabilities 1,772.5 46.1 1,865.5 47.9<br />
Total equity and liabilities 3,841.8 100.0 3,891.9 100.0
Consolidated statement of cash flows, IFRS<br />
Kesko financial statements <strong>2009</strong><br />
€ million Note <strong>2009</strong> 2008<br />
Cash flows from operating activities<br />
Profit before tax<br />
Adjustments:<br />
216.6 330.8<br />
Depreciation according to plan 116.9 118.1<br />
Financial income and expenses 16.0 -1.1<br />
Other adjustments 37 -74.0 -130.1<br />
Change in working capital<br />
58.9 -13.2<br />
Current non-interest-bearing receivables, increase (-) / decrease (+) 39.4 -10.3<br />
Inventories increase (-) / decrease (+) 206.6 2.3<br />
Current non-interest-bearing liabilities, increase (+) / decrease (-) -83.9 -78.4<br />
162.2 -86.4<br />
Interest paid and other financial expenses -37.5 -32.6<br />
Interest received 23.0 31.6<br />
Dividends received 0.1 0.1<br />
Income tax paid -44.5 -99.0<br />
Net cash generated from operating activities 378.8 131.4<br />
Cash flows from investing activities<br />
Acquisition of subsidiary, net of cash acquired -16.4 -35.0<br />
Acquisition of associate -0.2 0.0<br />
Purchases of tangible and intangible assets -205.2 -284.7<br />
Purchases of available-for-sale financial assets -0.8 -0.3<br />
Disposal of subsidiary, net of cash disposed of 4, 38 52.3 121.3<br />
Disposal of associate 0.1 1.5<br />
Proceeds from sale of available-for-sale financial assets 39 1.2 0.2<br />
Proceeds from sale of tangible and intangible assets 198.3 158.4<br />
Increase in non-current loan receivables 0.0 -7.3<br />
Decrease in non-current loan receivables 1.6 0.0<br />
Net cash used in investing activities 31.0 -45.8<br />
Cash flows from financing activities<br />
Increase (+) / decrease (-) in interest-bearing liabilities -33.1 -47.1<br />
Repayments of finance lease liabilities 0.2 -5.6<br />
Increase (+) / decrease (-) in current interest-bearing receivables -13.7 216.5<br />
Dividends paid -98.4 -172.5<br />
Proceeds from issuance of shares 4.6 0.4<br />
Increase (-) / decrease (+) in short-term money market investments -97.6 -17.3<br />
Other items 3.6 11.3<br />
Net cash used in financing activities -234.4 -14.3<br />
Change in cash and cash equivalents and current available-for-sale<br />
financial assets<br />
Cash and cash equivalents and current available-for-sale financial<br />
175.4 71.4<br />
assets at 1 Jan. 40 319.3 245.3<br />
Currency translation difference adjustment and value adjustment -3.2 -0.7<br />
Cash and cash equivalents related to available-for-sale assets<br />
Cash and cash equivalents and current available-for-sale financial<br />
0.0 -1.8<br />
assets at 31 Dec. 40 491.4 319.3<br />
87
88 Kesko financial statements <strong>2009</strong><br />
Consolidated statement of changes in equity, IFRS<br />
€ million<br />
Share<br />
capital<br />
Share<br />
issuance<br />
Attributable to owners of the parent<br />
Share<br />
premium<br />
Other<br />
reserves<br />
Currency<br />
translation Revaluation<br />
differences surplus<br />
Retained<br />
earnings Total<br />
Minority<br />
interest<br />
Balance at 1 Jan. <strong>2009</strong> 195.6 0.1 190.6 242.9 -9.5 1.6 1,344.4 1,965.7 60.7 2,026.4<br />
Shares resulting from the exercise<br />
of options 1.0 -0.1 3.7 4.6 4.6<br />
Cost of share option schemes 8.1 8.1 8.1<br />
Subsidiary disposals 0.0 0.0<br />
Dividend distribution -97.9 -97.9 -0.5 -98.4<br />
Other changes -0.2 1.5 1.3 0.2 1.6<br />
Total comprehensive income for<br />
the period 2.4 -4.3 124.9 123.0 4.1 127.1<br />
Balance at 31 Dec. <strong>2009</strong> 196.6 0.0 194.2 242.8 -7.1 -2.7 1,381.1 2,004.9 64.4 2,069.4<br />
Balance at 1 Jan. 2008 195.5 0.0 190.4 247.1 -2.7 9.5 1,269.2 1,909.1 55.3 1,964.4<br />
Shares resulting from the exercise<br />
of options 0.1 0.1 0.2 0.4 0.4<br />
Cost of share option schemes 5.6 5.6 5.6<br />
Subsidiary disposals -4.2 4.2 0.0 0.1 0.1<br />
Dividend distribution -156.4 -156.4 -16.1 -172.5<br />
Other changes<br />
Total comprehensive income for<br />
2.3 2.3 2.3<br />
the period -6.8 -7.9 219.6 204.8 21.3 226.1<br />
Balance at 31 Dec. 2008 195.6 0.1 190.6 242.9 -9.5 1.6 1,344.4 1,965.7 60.7 2,026.4<br />
Further information about share capital and reserves is given in note 27.<br />
Total<br />
equity
NOTE 1<br />
Accounting policies for the consolidated financial<br />
statements<br />
Basic information about the company<br />
Kesko is the leading provider of trading sector services and a<br />
highly valued listed company. Kesko has about 2,000 stores<br />
engaged in chain operations in the Nordic and Baltic countries,<br />
Russia and Belarus.<br />
<strong>Kesko's</strong> operations are divided into four reportable segments.<br />
The Group’s business divisions, namely the food trade, the home<br />
and speciality goods trade, the building and home improvement<br />
trade, and the car and machinery trade, have been identified as<br />
the Kesko Group's reportable segments.<br />
The Group's parent company, Kesko Corporation, is a Finnish<br />
public limited company constituted in accordance with the laws<br />
of Finland. The company's business ID is 0109862–8, it is domiciled<br />
in Helsinki, and its registered address is Satamakatu 3,<br />
FI-00016 Kesko. Copies of Kesko Corporation's financial statements<br />
and the consolidated financial statements are available<br />
from Kesko Corporation, Satamakatu 3, FI-00016 Kesko, and from<br />
the Internet, at www.kesko.fi.<br />
<strong>Kesko's</strong> Board of Directors has approved these financial statements<br />
for disclosure on 4 February 2010.<br />
General information<br />
<strong>Kesko's</strong> consolidated financial statements have been prepared in<br />
accordance with International Financial <strong>Report</strong>ing Standards<br />
(IFRS) approved for adoption by the European Union, and they<br />
comply with the IAS and IFRS standards, and respective IFRIC and<br />
SIC Interpretations valid at 31 December <strong>2009</strong>. The International<br />
<strong>Report</strong>ing Standards refer to standards and their interpretations<br />
approved for adoption within the EU in accordance with the<br />
procedure enacted in EC regulation 1606/2002, included in the<br />
Finnish Accounting Standards and regulations based on them.<br />
Accounting standards not yet effective have not been adopted<br />
voluntarily for the consolidated financial statements. The notes<br />
to the consolidated financial statements also include compliance<br />
with the Finnish accounting and corporate legislation.<br />
All amounts in the consolidated financial statements are in<br />
millions of euros and are based on original cost, with the exception<br />
of items identified separately, which have been measured at<br />
fair value in compliance with the standards.<br />
With effect from 1 January <strong>2009</strong>, the Group has adopted the<br />
following new and revised standards:<br />
• IFRS 8, 'Operating Segments': The adoption of IFRS 8 has not<br />
changed the Group's reportable segments, because the<br />
Group's segment information was also previously based on<br />
internal management reporting, with the measurement<br />
principles of assets and liabilities complying with IFRS<br />
regulations. The Group’s business divisions, identified as the<br />
Kesko Group's reportable segments effective 1 January <strong>2009</strong>,<br />
are the food trade, the home and speciality goods trade, the<br />
building and home improvement trade, and the car and<br />
machinery trade. The change in reportable segments was due<br />
to changes in the Group composition. The segment<br />
Kesko financial statements <strong>2009</strong><br />
Notes to the consolidated financial statements<br />
•<br />
•<br />
•<br />
89<br />
information for the 2008 financial year has been restated<br />
accordingly.<br />
IAS 1 'Presentation of Financial Statements': In consequence<br />
of the adoption of the revised IAS 1 standard, the financial<br />
statements present a statement of comprehensive income<br />
specifying non-owner changes in equity. The statement of<br />
changes in equity has also been modified to comply with the<br />
requirements of the amended standard.<br />
IAS 23 'Borrowing Costs, capitalisation of borrowing costs<br />
attributable to a qualifying asset': The amended standard<br />
removes the option of immediately expensing borrowing costs<br />
attributable to the acquisition, construction or production of a<br />
qualifying asset as part of the cost of that asset. These<br />
borrowing costs are eligible for capitalisation as part of the<br />
cost of the asset. The Group previously expensed borrowing<br />
costs in the accounting period in which they incurred. Interest<br />
costs have not been capitalised as part of the cost of the asset<br />
during the accounting period.<br />
IFRIC 13 'Customer Loyalty Programmes': At the beginning of<br />
<strong>2009</strong>, the Kesko Group adopted a new IFRIC interpretation,<br />
IFRIC 13 'Customer Loyalty Programmes'. According to the<br />
interpretation, the loyalty award credits relating to the<br />
K-Plussa customer loyalty programme are recognised at fair<br />
values in sales adjustment items, as part of the sales<br />
transactions. Loyal award credits have been accounted for in<br />
the net sales of those Group retail companies which grant<br />
K-Plussa loyal award credits. The comparative figures for 2008<br />
have also been restated to comply with the new<br />
interpretation. The adoption of the interpretation does not<br />
impact the Group’s operating profit, because loyalty award<br />
credits arising from the K-Plussa customer loyalty programme<br />
have been recorded at fair value in the income statement as<br />
incurred even before the adoption of the interpretation.<br />
In addition, the Group has adopted the following revised or<br />
amended IFRS standards and IFRIC interpretations endorsed by<br />
the EU as from 1 January <strong>2009</strong>:<br />
• IAS 32 'Financial Instruments: presentation', and IAS<br />
1'Presentation of Financial Statements' - Puttable financial<br />
instruments and obligations arising on liquidation<br />
(amendment)<br />
• IFRS 1 'First-time adoption of IFRS', and IAS 27 'Consolidated<br />
and Separate Financial Statements' - Cost of an investment in<br />
a Subsidiary, Jointly controlled Entity or Associate<br />
(amendment)<br />
• IFRS 2 'Share-based Payments' - Vesting conditions and<br />
cancellations (amendment)<br />
• <strong>Annual</strong> amendments to the IFRSs (<strong>Annual</strong> Improvements<br />
2007)<br />
• IFRIC 16 'Hedges of a Net Investment in a Foreign Operation'<br />
The following standards became effective on 1 January <strong>2009</strong>, but<br />
have not yet been endorsed by the EU:<br />
• IFRS 7 'Financial Instruments: Disclosures' (amendment)<br />
• IFRIC 9 'Reassessment of Embedded Derivatives' (amendment)<br />
and IAS 39 'Financial Instruments: Recognition and<br />
Measurement' (amendment)<br />
•<br />
IFRIC 15 'Agreements for the Construction of Real Estate'
90 Kesko financial statements <strong>2009</strong><br />
The above amendments to standards and interpretations have<br />
not had a material impact on the reported income statement,<br />
statement of financial position or notes.<br />
Use of estimates<br />
The preparation of consolidated financial statements in conformity<br />
with IFRS requires the use of certain estimates and assumptions<br />
about the future that affect the reported amounts of assets<br />
and liabilities, contingent liabilities, and income and expense.<br />
The actual results may differ from these estimates and assumptions.<br />
Furthermore, the application of accounting policies is<br />
based on the management's judgements, for example, in the<br />
classification of assets and in determining whether risks and<br />
rewards incident to ownership of financial assets and leased<br />
assets have substantially transferred to the other party. The most<br />
significant estimates relate to the following.<br />
Allocation of cost of acquisition<br />
Assets and liabilities acquired in business combinations are<br />
measured at their fair values at the date of acquisition. The fair<br />
values on which cost allocation is based are determined by reference<br />
to market values to the extent they are available. If market<br />
values are not available, the measurement is based on the estimated<br />
earnings-generating capacity of the asset and its future<br />
use in <strong>Kesko's</strong> operating activities. The measurement of intangible<br />
assets, in particular, is based on the present values of future<br />
cash flows and requires management estimates regarding future<br />
cash flows and the use of assets.<br />
Impairment test<br />
The amounts recoverable from cash generating units' operating<br />
activities are determined based on value-in-use calculations. In<br />
the calculations, forecast cash flows are based on financial plans<br />
approved by the management, covering a period of 3 years (note<br />
13).<br />
Employee benefits<br />
The Group operates both defined contribution pension plans and<br />
defined benefit pension plans. The calculation of items relating<br />
to employee benefits requires the consideration of several factors.<br />
Pension calculations under defined benefit plans in compliance<br />
with IAS 19 include the following factors that rely on management<br />
estimates (note 20):<br />
• expected return on plan assets<br />
• discount rate used in calculating pension expenses and<br />
obligations for the period<br />
• future salary level trend<br />
• employee service life<br />
Changes in these assumptions can significantly impact the<br />
amounts of pension liability and future pension expenses. In<br />
addition, a significant part of the pension plan assets is invested<br />
in real estate and shares, whose value adjustments also impact<br />
the amounts of liabilities and pension expenses.<br />
Measurement of inventories<br />
The Group regularly reviews inventories for obsolescence and<br />
turnover, and for below-cost market values, and recognises<br />
obsolescence as necessary. Such reviews require assessments of<br />
future demand for products. Possible changes in these estimates<br />
may cause changes in inventory measurement in future periods.<br />
Trade receivables<br />
The Group companies apply a uniform practice to measuring<br />
mature receivables. Possible changes in customers' solvency may<br />
cause changes in the measurement of trade receivables in future<br />
periods.<br />
Consolidation principles<br />
Subsidiaries<br />
The consolidated financial statements combine the financial<br />
statements of Kesko Corporation and subsidiaries controlled by<br />
the Group. Control exists when the Group owns more than 50%<br />
of the voting rights of a subsidiary or otherwise exerts control.<br />
Control refers to the power to govern the financial and operating<br />
policies of an enterprise so as to obtain benefits from its activities.<br />
Acquired subsidiaries are consolidated from the date on<br />
which the Group gains control until the date on which control<br />
ceases. When assessing whether an enterprise controls another<br />
enterprise, the potential voting rights that are currently exercisable<br />
have been taken into account. The subsidiaries are listed in<br />
note 45.<br />
Internal shareholdings are eliminated by using the acquisition<br />
cost method. The cost of acquisition is determined on the basis<br />
of the fair value of the acquired assets as on the date of acquisition,<br />
the issued equity instruments and liabilities resulting from<br />
or assumed on the date of the exchange transaction, plus the<br />
direct expenses relating to the acquisition. The identifiable<br />
assets, liabilities and contingent liabilities of the acquiree are<br />
measured at the fair value on the date of acquisition, gross of<br />
minority interest.<br />
Intra-group transactions, receivables and payables, unrealised<br />
gains and internal distribution of profits are eliminated when<br />
preparing the consolidated financial statements. Unrealised<br />
losses are not eliminated, if the loss is due to the impairment of<br />
an asset. Minority interests in the net income are disclosed in the<br />
income statement and the amount of equity attributable to<br />
minority interest is disclosed separately in the Group's equity.<br />
Associates<br />
Unrealised gains between the Group and associates are eliminated<br />
in proportion to the Group's ownership interest. Dividends<br />
received from associates are deducted from the Group's result<br />
and the cost of the shares. An investment in an associate<br />
includes the goodwill generated by the acquisition. Goodwill is<br />
not amortised. The associates are listed in note 45.<br />
Joint ventures<br />
Joint ventures are enterprises in which the Group and another<br />
party exercise joint control by virtue of contractual arrangements.<br />
The Group's interests in joint ventures are consolidated proportionally<br />
on a line-by-line basis. The consolidated financial statements<br />
disclose the Group's share of a joint venture's assets,<br />
liabilities, income and expenses. At the end of the accounting<br />
period, the Group has no joint ventures.<br />
Mutual real estate companies<br />
In compliance with IAS 31, mutual real estate companies are<br />
consolidated as assets under joint control on a line-by-line basis<br />
in proportion to ownership.
Foreign currency items<br />
The consolidated financial statements are presented in euros,<br />
which is both the functional currency of the Group’s parent company<br />
and the reporting currency. On initial recognition, the figures<br />
relating to the result and financial position of Group entities<br />
located outside the euro zone are recorded in the functional currency<br />
of their operating environment. The operating currency of<br />
the real estate companies in St. Petersburg and Moscow in Russia<br />
has been determined to be the euro, which is why no significant<br />
exchange differences are realised from their balance sheets for<br />
the Group.<br />
Foreign currency transactions are recorded in euros by applying<br />
the exchange rate at the date of the transaction. Foreign currency<br />
receivables and liabilities are translated into euros using<br />
the closing rate. Gains and losses from foreign currency transactions,<br />
and from receivables and liabilities are recognised in the<br />
income statement, with the exception of those loan exchange<br />
rate movements designated to provide a hedge against foreign<br />
net investments and regarded as effective. These exchange differences<br />
are recognised in equity, in compliance with the rules<br />
of hedge accounting, and their changes are presented in other<br />
comprehensive income. Foreign exchange gains and losses from<br />
operating activities are included in the respective items above<br />
operating profit. Gains and losses from forward foreign exchange<br />
contracts and options used to hedge financial transactions, and<br />
from foreign currency loans are included in financial income and<br />
expenses.<br />
The income statements of Group entities operating outside the<br />
euro zone have been translated into euros at the average rate of<br />
the reporting period, and the balance sheets at the closing rate.<br />
The translation difference resulting from the use of different<br />
rates, and the translation differences arising from the elimination<br />
of the acquisition cost of subsidiaries outside the euro zone,<br />
and the hedging result of net investments made in them, are<br />
recognised in equity, and the changes are presented in other<br />
comprehensive income. In connection with the disposal of a<br />
subsidiary, currency translation differences are disclosed in the<br />
income statement as part of the gains or losses on the disposal.<br />
As of 1 January 2004, the goodwill arising from the acquisition<br />
of foreign units and the fair value adjustments of assets and<br />
liabilities made upon their acquisition have been treated as<br />
assets and liabilities of these foreign units and translated into<br />
euros at the closing rate. The goodwill and fair value adjustments<br />
of acquisitions made prior to 1 January 2004 have been recorded<br />
in euros.<br />
Financial assets<br />
The Group classifies financial assets in the following categories:<br />
• financial assets at fair value through profit or loss<br />
• available-for-sale financial assets<br />
• loans and receivables.<br />
The category is determined at initial recognition on the basis of<br />
why they were originally acquired.<br />
Purchases and sales of financial assets are recognised using<br />
the ‘regular way’ method. Financial assets are classified as noncurrent<br />
assets if they have a maturity date greater than twelve<br />
months after the balance sheet date. If financial assets are going<br />
to be held for less than 12 months, they are classified as current<br />
assets. Financial assets at fair value through profit or loss are<br />
classified as current assets.<br />
Kesko financial statements <strong>2009</strong><br />
91<br />
Financial assets are derecognised when the contractual rights<br />
to the cash flow of the financial asset expire or have been transferred<br />
to another party, and when the risks and rewards of ownership<br />
have been transferred.<br />
At each reporting date, the Group assesses whether there is<br />
any indication that a financial asset may be impaired. If any such<br />
indication exists, the recoverable amount of the asset is estimated.<br />
The recoverable amount is the fair value based on the<br />
market price or the present value of cash flows. The fair value of<br />
investment instruments is determined on the basis of a maturity-based<br />
interest rate quotation. An impairment loss is recognised<br />
if the carrying amount of a financial asset exceeds its<br />
recoverable amount. The impairment losses are recognised<br />
within the financial items of the income statement.<br />
Financial assets at fair value through profit or loss<br />
Financial assets at fair value through profit or loss include instruments<br />
initially classified as financial assets at fair value through<br />
profit or loss (the Fair Value Option). These instruments are<br />
accounted for based on fair value and they include investments<br />
in bond funds, as defined by the Group's treasury policy, as well<br />
as investments in other interest-bearing papers with over<br />
3-month maturities. The interest income and fair value changes<br />
of these financial assets, as well as any commissions returned by<br />
funds are presented on a net basis in the income statement in<br />
the interest income of the category in question.<br />
In addition, financial assets at fair value through profit or loss<br />
include all derivatives that do not qualify for hedge accounting<br />
in compliance with IAS 39. Derivatives are carried at fair value<br />
using prices quoted in active markets. The results of derivatives<br />
hedging purchases and sales are recognised in other operating<br />
income or expenses. The results of derivatives used to hedge<br />
financial items are recognised in financial items, unless the<br />
derivative has been designated as a hedging instrument.<br />
Available-for-sale financial assets<br />
Available-for-sale financial assets are non-derivative assets designated<br />
as available for sale at the date of initial recognition.<br />
Available-for-sale financial assets are measured at fair value at<br />
the balance sheet date and their fair value changes are recognised<br />
in equity, and the fair value change is presented in other<br />
comprehensive income. The fair value of publicly quoted financial<br />
assets is determined based on their market value. Financial<br />
assets not quoted publicly are measured at cost if their fair values<br />
cannot be measured reliably.<br />
The dividends from equity investments included in availablefor-sale<br />
financial assets are recognised in financial items in the<br />
income statement. The interest income from available-for-sale<br />
financial assets is recognised in the financial items of the relevant<br />
class. When an available-for-sale financial asset is sold,<br />
the accumulated fair value changes recognised in equity are<br />
included in the income statement as 'Other financial income/<br />
expenses'.<br />
Loans and receivables<br />
Loans and receivables are non-derivative assets with fixed or<br />
measurable payments, and they are not quoted in active markets.<br />
Loans and receivables also include trade receivables and<br />
other receivables. They are recognised at amortised cost using the<br />
effective interest method.
92 Kesko financial statements <strong>2009</strong><br />
Cash and cash equivalents<br />
Cash and cash equivalents include cash on hand and balances<br />
with banks. The cash and cash equivalents in the consolidated<br />
balance sheet also include amounts relating to the retail operations<br />
of division parent companies, used as cash floats in stores,<br />
or amounts being transferred to the respective companies.<br />
Financial liabilities<br />
Financial liabilities have initially been recognised at their cost,<br />
net of transaction costs. In the financial statements, financial<br />
liabilities are measured at amortised cost using the effective<br />
interest rate method. The arrangement fees related to lines of<br />
credit are amortised over the validity period of the credit. Financial<br />
liabilities having a maturity period of over 12 months after<br />
the balance sheet date are classified as non-current liabilities.<br />
Those having a maturity period of less than 12 months after the<br />
balance sheet date are classified as current liabilities.<br />
Derivative financial instruments and<br />
hedge accounting<br />
When acquired, derivative financial instruments are carried at<br />
fair value and subsequently they are measured at fair value. The<br />
recognition of value adjustments of derivatives depends on<br />
whether the derivative instrument qualifies for hedge accounting,<br />
and if so, on the hedged item. When entered into, derivative<br />
contracts are treated either as fair value hedges of receivables or<br />
liabilities, or in the case of interest rate risk and electricity price<br />
risk, as cash flow hedges, as hedges of net investments in a<br />
stand-alone foreign entity, or as derivative contracts that do not<br />
meet the hedge accounting criteria. If the hedge accounting criteria<br />
are not met, the results of instruments hedging a commercial<br />
currency risk are recognised in profit or loss in other operating<br />
income or expenses. The portion of derivatives hedging<br />
financial transactions to be recognised in the income statement<br />
is included in financial items.<br />
When a hedging arrangement is entered into, the relationship<br />
between the item being hedged and the hedging instrument, as<br />
well as the objectives of the Group's risk management are documented.<br />
The effectiveness of the hedging relationship is tested<br />
regularly and the effective portion is recognised, against the<br />
change in the fair value of the hedged item, in translation differences<br />
in equity, or in the revaluation surplus. The ineffective<br />
portion is recognised in financial items or other operating<br />
income and expenses, depending on its nature. The effective<br />
portion of the value adjustments of instruments hedging cash<br />
flow, such as a long-term credit facility, is recognised in the<br />
equity hedging reserve. The value adjustment of currency derivative<br />
instruments relating to the credit facility is recognised in the<br />
loan account, and the value adjustment of interest rate derivative<br />
instruments in other non-interest-bearing receivables or<br />
debt.<br />
Hedge accounting is discontinued when the hedging instrument<br />
expires or is sold, the contract is terminated or exercised.<br />
Any cumulative gain or loss existing in equity remains in equity<br />
until the forecast transaction has occurred.<br />
Measurement principles<br />
The fair value of forward rate agreements is determined by reference<br />
to the market prices of the balance sheet date. The fair<br />
value of interest rate swaps is calculated on the basis of the<br />
present value of future cash flows, using the market prices at the<br />
balance sheet date. The fair value of forward exchanges is determined<br />
by measuring the forward contracts at the forward rate of<br />
the balance sheet date. Currency options are measured by using<br />
the counterparty's price quotation, but the Group verifies the<br />
price with the help of the Black-Scholes method. Electricity and<br />
grain derivatives are measured at fair value using the market<br />
quotations of the balance sheet date.<br />
Hedging a net investment in a stand-alone foreign entity<br />
The Group applies hedge accounting in accordance with IAS 39 to<br />
hedge foreign currency net investments in foreign entities. Forward<br />
exchanges or foreign currency loans are used as hedging<br />
instruments. Spot price changes in forward exchanges are recognised<br />
as translation differences under equity, and are disclosed<br />
in components of comprehensive income. The interest rate differentials<br />
of forward exchange agreements are recognised as<br />
income under financial items. The exchange differences of foreign<br />
currency loans are stated as translation differences under<br />
equity. When a foreign entity is disposed of or wound up, the<br />
accumulated gains or losses from hedging instruments are recognised<br />
in profit or loss.<br />
Embedded derivatives<br />
The Group has prepared method descriptions for identifying<br />
embedded derivatives and applies fair value measurement to<br />
them. In the Kesko Group, embedded derivatives are included in<br />
firm commercial contracts denominated in a currency which is<br />
not the functional currency of either party and not commonly<br />
used in the economic environment in which the transaction<br />
takes place. The fair value of embedded derivatives is determined<br />
using the market prices of the measurement date and the value<br />
change is recognised in the income statement.<br />
Intangible assets<br />
Goodwill and trademarks<br />
Goodwill represents the excess of the cost of an acquisition over<br />
the fair value of the Group's share of the net assets and liabilities<br />
of an enterprise at the date of the acquisition. The goodwill of<br />
companies acquired prior to 1 January 2004 corresponds to their<br />
carrying amounts reported in accordance with the previous<br />
accounting practices, and the carrying amount is used as the<br />
deemed cost. The goodwill of business combinations entered<br />
into prior to 1 January 2004 corresponds to their carrying<br />
amounts reported in accordance with the previous accounting<br />
practices used as the deemed cost, in compliance with IFRS.<br />
Goodwill is not amortised but tested annually for impairment<br />
and whenever there is an indication of impairment. For testing<br />
purposes goodwill is allocated to the cash generating units.<br />
Goodwill is measured at original cost and the share acquired<br />
prior to 1 January 2004 at deemed cost net of impairment. Any<br />
negative goodwill is immediately recognised as income in<br />
accordance with IFRS 3.<br />
Intangible assets with indefinite useful lives are not amortised.<br />
They are tested for impairment annually and whenever<br />
there is an indication of impairment. These intangible assets<br />
include trademarks capitalised upon acquisition.
Other intangible assets<br />
The cost of intangible assets with definite useful lives are stated<br />
in the balance sheet and recognised as expenses during their<br />
useful lives. Such intangible assets include software licences and<br />
customer relationships to which acquisition cost has been allocated<br />
upon acquisition, and leasehold interests that are amortised<br />
during their probable terms. The estimated useful lives are:<br />
Computer software and licences 3–5 years<br />
Customer and supplier relationships 10 years<br />
Research and development expenses<br />
The Group has not had such development expenditures which,<br />
under certain conditions, should be recognised as assets and<br />
written off during their useful lives in accordance with IAS 38.<br />
Therefore the costs of research and development activities have<br />
been expensed as incurred.<br />
Computer software<br />
The labour costs and other direct expenditure of the Group<br />
employees working on new software development projects are<br />
capitalised as part of the software cost. In the balance sheet,<br />
computer software is included in intangible assets and its cost is<br />
written off during the useful life of the software. Software maintenance<br />
expenditure is recognised as an expense as incurred.<br />
Property, plant and equipment<br />
Property, plant and equipment mainly comprise land, buildings,<br />
machinery and equipment. Property, plant and equipment are<br />
carried at original cost net of planned depreciation and any<br />
impairment. The property, plant and equipment of acquired<br />
subsidiaries are measured at fair value at the date of acquisition.<br />
The machinery and equipment of buildings are treated as<br />
separate assets and any significant expenditure related to their<br />
replacement is capitalised. Subsequent expenditure relating to<br />
an item of property, plant and equipment is only added to the<br />
carrying amount of the asset when it is probable that future economic<br />
benefits relating to the asset will flow to the Group and<br />
that the cost of the asset can be reliably measured. The repair,<br />
service and maintenance expenditures of other items of property,<br />
plant and equipment aer recognised as an expense as incurred.<br />
Property, plant and equipment are written off on a straightline<br />
basis during their estimated useful lives.<br />
The most common estimated useful lives are:<br />
Buildings 10–33 years<br />
Components of buildings 8–10 years<br />
Machinery and equipment 3–8 years<br />
Cars and transport equipment 5 years<br />
The residual values, useful lives and depreciation methods<br />
applied to property, plant and equipment are reviewed at least<br />
at the end of each accounting period. If the estimates of useful<br />
life and the expected pattern of economic benefits are different<br />
from previous estimates, the change in the estimate is accounted<br />
for in accordance with IAS 8.<br />
The depreciation of property, plant and equipment ceases<br />
when the asset is classified as held for sale in accordance with<br />
IFRS 5. Lands are not depreciated.<br />
Kesko financial statements <strong>2009</strong><br />
Gains and losses from sales and disposals of property, plant<br />
and equipment are recognised in the income statement and<br />
presented as other operating income and expenses.<br />
93<br />
Investment properties<br />
Investment properties are properties held by the enterprise<br />
mainly to earn rentals or for capital appreciation. The Group does<br />
not hold real estate classified as investment properties.<br />
Impairment of non-financial assets<br />
At each reporting date, the Group assesses whether there is any<br />
indication that an asset may be impaired. If any such indication<br />
exists, the recoverable amount of the asset is estimated. The<br />
recoverable amount of goodwill and intangible assets with<br />
indefinite useful lives is assessed every year whether or not there<br />
is an indication of impairment. In addition, an impairment test<br />
is performed whenever there is an indication of impairment.<br />
The recoverable amount is the higher rate of an asset's fair<br />
value less the costs of disposal, and its value in use. Often it is<br />
not possible to assess the recoverable amount for an individual<br />
asset. Then, as in the case of goodwill, the recoverable amount is<br />
determined for the cash generating unit to which the goodwill or<br />
asset belongs.<br />
An impairment loss is recognised if the carrying amount of an<br />
asset exceeds its recoverable amount. The impairment loss is disclosed<br />
in the income statement. An impairment loss recognised<br />
for an asset in prior years is reversed if there has been an<br />
increase in the reassessed recoverable amount. However, the<br />
reversal of an impairment loss of an asset should not exceed the<br />
carrying amount of the asset without an impairment loss recognition.<br />
For goodwill, a recognised impairment loss is not reversed<br />
under any circumstances.<br />
Leases<br />
In accordance with IAS 17, leases that substantially transfer all<br />
the risks and rewards incident to ownership to the Group are<br />
classified as finance leases. An asset leased under a finance lease<br />
is recognised in the balance sheet at the lower rate of its fair<br />
value at the inception date and the present value of minimum<br />
lease payments. The rental obligations of finance leases are<br />
recorded in interest-bearing liabilities in the balance sheet.<br />
Lease payments are allocated between the interest expense and<br />
the liability. Finance lease assets are amortised over the shorter<br />
period of the useful life and the lease term.<br />
Leases in which assets are leased out by the Group, and substantially<br />
all the risks and rewards incident to ownership are<br />
transferred to the lessee, are also classified as finance leases.<br />
Assets leased under such contracts are recognised as receivables<br />
in the balance sheet and are stated at present value. The financial<br />
income from finance leases is determined so as to achieve a<br />
constant periodic rate of return on the remaining net investment<br />
for the lease term.<br />
Leases in which risks and rewards incident to ownership are<br />
not transferred to the lessee are classified as operating leases.<br />
Lease payments related to them are recognised in the income<br />
statement on a straight-line basis over the lease term.<br />
In sale and leaseback transactions the sale price and the<br />
future lease payments are usually interdependent. If a sale and<br />
leaseback transaction results in a finance lease, any excess of<br />
sales proceeds over the carrying amount is not immediately
94 Kesko financial statements <strong>2009</strong><br />
recognised as income. Instead it is deferred and amortised over<br />
the lease term. If a sale and leaseback transaction results in an<br />
operating lease and the transaction is established at fair value,<br />
any profit or loss is recognised immediately.<br />
If the sale price is below fair value, any profit or loss is recognised<br />
immediately unless the loss is compensated by future lease<br />
payments at below market price, in which case the loss is<br />
deferred and amortised over the period for which the asset is<br />
expected to be used. If the sale price is above fair value, the<br />
excess over fair value is deferred and amortised over the period<br />
for which the asset is expected to be used. If the fair value at the<br />
time of a sale and leaseback transaction is less than the carrying<br />
amount of the asset, a loss equal to the amount of the difference<br />
between the carrying amount and fair value is recognised immediately.<br />
Inventories<br />
Inventories are measured at the lower rate of cost and net realisable<br />
value. Net realisable value is the estimated selling price in<br />
the ordinary course of business less the estimated costs to sell.<br />
The cost is primarily assigned by using the weighted average cost<br />
formula. The cost of certain classifications of inventory is<br />
assigned by using the FIFO formula. The cost of an acquired asset<br />
comprises all costs of purchase including freight. The cost of selfconstructed<br />
goods comprise all costs of conversion including<br />
direct costs and allocations of variable and fixed production<br />
overheads.<br />
Trade receivables<br />
Trade receivables are recognised at the original invoice amount.<br />
Impairment is recognised when there is objective evidence of<br />
impairment loss. The Group has established a uniform basis for<br />
the determination of impairment of trade receivables based on<br />
the time receivables have been outstanding. In addition, impairment<br />
is recognised if there is other evidence of a debtor's insolvency,<br />
bankruptcy or liquidation. Losses on loans and advances<br />
are recognised as an expense in the income statement as part of<br />
'Other operating expenses'.<br />
Non-current assets held for sale and<br />
discontinued operations<br />
Assets (or a disposal group) and assets and liabilities relating to<br />
discontinued operations are classified as held for sale, if their<br />
carrying amount will be recovered principally through the disposal<br />
of the assets rather than through continuing use. For this<br />
to be the case, the sale must be highly probable, the asset (or<br />
disposal group) must be available for immediate sale in its<br />
present condition subject only to terms that are usual and customary,<br />
the management must be committed to selling and the<br />
sale should be expected to qualify for recognition as a completed<br />
sale within one year from the date of classification.<br />
Non-current assets held for sale (or assets included in the disposal<br />
group) and assets and liabilities linked to a discontinuing<br />
operation are measured at the lower rate of the carrying amount<br />
and fair value net of costs to sell. After an asset has been classified<br />
as held for sale, or if it is included in the disposal group, it is<br />
not depreciated. If the classification criterion is not met, the<br />
classification is reversed and the asset is measured at the lower<br />
rate of the carrying amount prior to the classification less depreciation<br />
and impairment, and recoverable amount. A non-current<br />
asset held for sale and assets included in the disposal group<br />
classified as held for sale are disclosed separately in the balance<br />
sheet. Liabilities included in the disposal group of assets held for<br />
sale are also disclosed separately in the balance sheet. The profit<br />
from discontinued operations is disclosed as a separate line item<br />
in the income statement.<br />
The comparative information in the income statement are<br />
adjusted for operations classified as discontinued during the latest<br />
financial period being reported. Consequently, the profit from<br />
discontinued operations is presented as a separate line item also<br />
for the comparatives.<br />
Provisions<br />
A provision is recognised when the Group has a present legal or<br />
constructive obligation as a result of a past event, and it is probable<br />
that an outflow of resources embodying economic benefits<br />
will be required to settle the obligation, and that a reliable estimate<br />
can be made of the amount of the obligation. Provision<br />
amounts are reviewed at each balance sheet date and adjusted<br />
to reflect the current best estimate. Changes in provisions are<br />
recorded in the income statement in the same item in which the<br />
provision was originally recognised. The most significant part of<br />
the Group's provisions relates to warranties given to products<br />
sold by the Group, and to onerous leases.<br />
A warranty provision is recognised when a product fulfilling<br />
the terms is sold. The provision amount is based on historical<br />
experience about the level of warranty expenses. Leases become<br />
onerous if the leased premises become vacant, or if they are subleased<br />
at a rate lower than the original. A provision is recognised<br />
for an estimated loss from vacant lease premises over the<br />
remaining lease term, and for losses from subleased premises.<br />
Employee benefits<br />
Pension plans<br />
The Group has both defined contribution plans and defined<br />
benefit plans. The contributions payable under defined contribution<br />
plans are recognised as expenses in the income statement of<br />
the period to which the payments relate. In defined contribution<br />
plans, the Group does not have a legal or constructive obligation<br />
to make additional payments, in case the payment recipient is<br />
unable to pay the retirement benefits.<br />
In defined benefit plans, after the Group has paid the amount<br />
for the period, an excess or deficit may result. The pension obligation<br />
represents the present value of future cash flows from<br />
payable benefits. The present value of pension obligations has<br />
been calculated using the Project Unit Credit Method. Pension<br />
costs are expensed during employees' service lives based on<br />
actuarial calculations. The discount rate assumed in calculating<br />
the present value of the pension obligations is the market yield<br />
of high-quality bonds issued by companies. Their maturity substantially<br />
corresponds to the maturity of the calculated pension<br />
liability. The assets corresponding to the pension obligation of<br />
the retirement benefit plan are carried at fair values at the balance<br />
sheet date. Actuarial gains and losses are recognised in the<br />
income statement for the average remaining service lives of the<br />
employees participating in the plan to the extent that they
exceed 10 percent of the higher rate of the present value of the<br />
defined benefit plans and the fair value of assets belonging to<br />
the plan.<br />
Relating to the arrangements taken care of by the Kesko Pension<br />
Fund, the funded portion and the disability portion under<br />
the Finnish Employees' Pension Act are treated as defined benefit<br />
plans. In addition, the Group operates a pension plan in Norway<br />
which is treated as a defined benefit plan. The plan is not significant<br />
for the Group. Other pension plans are treated as defined<br />
contribution plans.<br />
Share-based payment<br />
The share options granted as part of the Group management's<br />
and other key personnels' incentive and commitment programme<br />
are measured at fair value at the grant date and<br />
expensed on a straight-line basis over the option's vesting<br />
period. The counter-item is recognised in retained earnings.<br />
The expenditure determined at the grant date is based on the<br />
Group's estimate of the number of options expected to vest at<br />
the end of the vesting period. The Group updates the estimate<br />
of the final number of options at each balance sheet date. Any<br />
movements in estimates are recorded in the income statement.<br />
The fair value of the options has been calculated using the Black-<br />
Scholes option pricing model.<br />
When share options are exercised, the proceeds received from<br />
share subscriptions, adjusted for possible transaction costs, are<br />
recognised in shareholders' equity. Proceeds from share subscriptions<br />
based on options granted prior to the entry into force<br />
of the new Limited Liability Companies Act (1 Sept. 2006), have<br />
been recorded in shareholders' equity and share premium, in<br />
accordance with the plan rules. The proceeds from share subscriptions<br />
based on option plans implemented after the new<br />
Limited Liability Companies Act entered into force are recorded in<br />
shareholders' equity and the reserve of invested non-restricted<br />
equity, in accordance with the plan rules.<br />
Revenue recognition policies<br />
Net sales comprise the sale of products, services and energy. The<br />
sale of services and energy account for an insignificant portion of<br />
net sales. For net sales, sales revenue is adjusted by indirect<br />
taxes, sales adjustment items and the exchange differences of<br />
foreign currency sales. Sales adjustment items take into account<br />
customer loyalty programmes recognised in revenue in accordance<br />
with IFRIC 13 Customer Loyalty Programmes. According to<br />
the interpretation, the loyalty award credits relating to the<br />
K-Plussa customer loyalty programme are recognised in sales<br />
adjustment items at fair values as part of sales transactions. Loyalty<br />
award credits affect the net sales of those retail companies<br />
which grant K-Plussa customer loyalty credits.<br />
The Group sells products to retailers and other retail dealers,<br />
and engages in own retailing. Revenue from the sale of goods is<br />
recognised when the significant risks, benefits and control relating<br />
to the ownership of the goods have transferred to the buyer,<br />
and it is probable that the economic benefits associated with the<br />
transaction will flow to the Group. Normally revenue from the<br />
sale of goods can be recognised at the time of delivery of the<br />
goods. Sales to retailers and other retail dealers are based on<br />
Kesko financial statements <strong>2009</strong><br />
95<br />
central invoicing. Retail sales are mainly on cash and credit card<br />
basis.<br />
The Group does not have long-term projects with revenue<br />
recognised using the percentage of completion method.<br />
Revenue from the rendering of services is recognised after the<br />
service has been rendered and when a flow of economic benefits<br />
associated with the service is probable. Interest is recognised as<br />
revenue on a time proportion basis using the effective interest<br />
method. Dividends are recognised as revenue when the right to<br />
receive payment is established.<br />
Other operating income and expenses<br />
Other operating income includes income other than that associated<br />
with the sale of goods or services, such as rent income,<br />
store site and chain fees and various other service fees and commissions.<br />
Profits and losses from the sale and disposal of property,<br />
plant and equipment are disclosed in other operating<br />
income and expenses. Other operating income and expenses also<br />
include realised and unrealised profits and losses from derivatives<br />
used to hedge currency risks of trade.<br />
Borrowing costs<br />
The amendment of IAS 23 'Borrowing Costs' (effective from 1 January<br />
<strong>2009</strong>) removed the option of expensing borrowing costs<br />
attributable to the acquisition, construction or production of a<br />
qualifying asset as part of the cost of that asset. These borrowing<br />
costs are eligible for capitalisation as part of the cost of the asset.<br />
The Group previously expensed borrowing costs in the accounting<br />
period in which they incurred. During the reporting period,<br />
interest costs have not been capitalised as part of the cost of<br />
the asset. The amendment of the standard has not been applied<br />
retrospectively.<br />
Directly attributable transaction costs clearly associated with<br />
a certain borrowing are included in the original amortised cost of<br />
the borrowing and amortised to interest expense by using the<br />
effective interest method.<br />
Income taxes<br />
The taxes disclosed in the consolidated income statement recognise<br />
the Group companies' taxes on current net profits on an<br />
accrual basis, prior period tax adjustments and changes in<br />
deferred taxes. The Group companies' taxes are calculated from<br />
the taxable profit of each company determined by local jurisdiction.<br />
Deferred tax assets and liabilities are recognised for all temporary<br />
differences between the tax bases and carrying amounts<br />
of assets and liabilities. Deferred tax has not been calculated on<br />
goodwill insofar as goodwill is not tax deductible. Deferred tax<br />
on subsidiaries' undistributed earnings is not recognised unless<br />
a distribution of earnings is probable, causing tax consequences.<br />
Deferred tax is calculated using tax rates enacted by the<br />
balance sheet date, and if the rates change, at the new rate<br />
expected to apply. A deferred tax asset is recognised to the extent<br />
that it is probable that it can be utilised against future taxable<br />
income. The Group's deferred tax assets and liabilities are offset<br />
when they relate to income taxes levied by the same taxation<br />
authority.
96 Kesko financial statements <strong>2009</strong><br />
The most significant temporary differences arise from defined<br />
benefit plans, property, plant and equipment (depreciation difference,<br />
finance lease) and measurement at fair value of asset<br />
items in connection with business acquisitions.<br />
Dividend distribution<br />
The dividend proposed by the Board to the <strong>Annual</strong> General Meeting<br />
has not been deducted from equity. Instead dividends are<br />
recognised on the basis of the decision of the <strong>Annual</strong> General<br />
Meeting.<br />
New IFRS standards and ifric interpretations<br />
In addition to the standards and interpretations presented in the<br />
2008 financial statements, the Group will adopt the following<br />
standards, interpretations and amendments to the existing<br />
standards and interpretations issued in <strong>2009</strong> for application in<br />
its 2010 financial statements. The standards, interpretations and<br />
amendments to the existing standards and interpretations published<br />
in <strong>2009</strong> other than those listed here, are not assumed to<br />
have an impact on the consolidated financial statements.<br />
IFRS 2 (Amendment) Share-based Payment – Group Cash-settled<br />
Share-based Payment Transactions. The amendment clarifies<br />
that an entity that receives goods or services from its supplier<br />
must apply IFRS 2 even though the entity has no obligation to<br />
make the required share-based cash payments. The Group's<br />
management assesses that the amendment will not have a<br />
material impact on the consolidated financial statements. The<br />
amendment has not yet been endorsed by the European Union.<br />
IFRIC 9 and IAS 39 (Amendments) - Reassessment of Embedded<br />
Derivatives on Reclassification. The amendments clarify that<br />
on reclassification of a financial asset out of the ‘at fair value<br />
through profit or loss’ category all embedded derivatives have to<br />
be assessed and, if necessary, separately accounted for in financial<br />
statements. The Group's management assesses that the<br />
amendment will not have a material impact on the consolidated<br />
financial statements. The amendment has not yet been endorsed<br />
by the European Union.<br />
In <strong>2009</strong>, IASB issued several improvements to existing standards<br />
as part of its annual improvement project. The following is a<br />
summary of the amendments which the Group will adopt in<br />
2010, and which the Group's management assesses will possibly<br />
have an impact on the consolidated financial statements. These<br />
amendments have been endorsed by the European Union.<br />
IFRS 2 (Amendment) - Scope of IFRS 2 – Share-based Payment.<br />
The amendment confirms that in addition to business<br />
combinations as defined by IFRS 3 (revised) ‘Business combinations’,<br />
contributions of a business on formation of a joint venture<br />
and common control transactions are excluded from the scope of<br />
IFRS 2, ‘Share-based payment’. The Group's management<br />
assesses that the amendment may have an impact in business<br />
acquisitions.<br />
IFRS 5 (Amendment) Non-current Assets Held for Sale and Discontinued<br />
Operations. The amendment clarifies that IFRS 5 specifies<br />
the disclosures required in respect of non-current assets (or<br />
disposal groups) classified as held for sale or discontinued operations.<br />
It also clarifies that the general requirements of IAS 1 still<br />
apply, particularly paragraph 15 (to achieve a fair presentation)<br />
and paragraph 125 (sources of estimation uncertainty) of IAS 1.<br />
The Group's management assesses that the amendment may<br />
have an impact on the information disclosed in the financial<br />
statements in situations where an asset has been classified as<br />
available for sale or as a discontinued operation.<br />
IAS 38 (Amendment) Intangible Assets. The amendment clarifies<br />
the measuring of fair value of an intangible asset acquired in<br />
a business combination that a group of intangible assets may be<br />
recognised as a single asset provided the individual assets have<br />
similar useful lives. The Group's management assesses that the<br />
amendment may have an impact in business acquisitions.<br />
IAS 38 (Amendment) Intangible Assets. The amendment clarifies<br />
the description of valuation techniques commonly used by<br />
entities when measuring the fair value of intangible assets<br />
acquired in a business combination that are not traded in active<br />
markets. The Group's management assesses that the amendment<br />
may have an impact in business acquisitions.<br />
The following is a summary of the standards, interpretations<br />
and amendments to the existing standards published by the<br />
IASB, which will be adopted by the Group in 2011, or at a later<br />
effective date, and which, according to the Group's estimate,<br />
may have an impact on the consolidated financial statements.<br />
IFRS 9 Financial Assets – Classification and Measurement. The<br />
standard represents the first milestone in the IASB’s planned<br />
replacement of IAS 39. It addresses classification and measurement<br />
of financial assets. The next steps involve reconsideration<br />
and re-exposure of the classification and measurement requirements<br />
for financial liabilities, impairment testing methods for<br />
financial assets, and development of enhanced guidance on<br />
hedge accounting. The Group's management assesses that the<br />
new standard will have an impact on the presentation of financial<br />
instruments in the financial statements. The standard has<br />
not yet been endorsed by the European Union.<br />
NOTE 2<br />
Segment information<br />
The Group's reportable segments are composed of the Group's<br />
business divisions, namely the food trade, the home and speciality<br />
goods trade, the building and home improvement trade,<br />
and the car and machinery trade. During the 2008 financial<br />
period, the reportable segments were Kesko Food, Rautakesko,<br />
VV-Auto, Anttila, Kesko Agro and Other operating activities. The<br />
segment information of the 2008 financial period has been<br />
restated to correspond to the new segment classification. The<br />
adoption of IFRS 8 has not changed the Group’s reportable<br />
segments, because the Group’s prior segment information was<br />
already based on the management’s internal reporting, with the<br />
measurement principles of assets and liabilities complying with<br />
the IFRS regulations. The reportable segment classification was<br />
changed as a result of the change in the Group's organisational<br />
structure.<br />
Segment information is reported in a manner consistent with<br />
the internal reporting provided to the chief operating decisionmaker.<br />
The chief operating decision-maker, responsible for allo-
cating resources, has been identified as the Corporate Management<br />
Board. The net sales of the reportable operating segments<br />
are derived from the food trade, the home and speciality goods<br />
trade, the building and home improvement trade, and the car<br />
and machinery trade. Sales between segments are charged at<br />
prevailing market rates.<br />
The Corporate Management Board assesses the performance of<br />
the segments based on operating profit, operating profit<br />
adjusted for non-recurring items, and return on capital<br />
employed. Incidental transactions outside ordinary course of<br />
business are treated as non-recurring items and allocated to<br />
segments. The Group identifies gains and losses on disposals of<br />
real estate, shares and operations, impairments and costs of discontinuing<br />
significant operations as non-recurring items. Gains<br />
on disposal are presented within 'other income' in the income<br />
statement, and losses on disposal within 'other operating costs'.<br />
In other respects, the Management Board's performance monitoring<br />
is in full compliance with IFRS reporting. Financial<br />
expenses are not allocated to segments, as the activity is driven<br />
by the central treasury department, which manages the Group's<br />
cash and cash equivalents. Forward foreign exchange contracts<br />
entered into inside the Group are, however, reported as part of<br />
other operating income and expenses to the extent that they<br />
hedge the segments' operational foreign currency risk. Segment<br />
information only comprises continuing operations.<br />
The assets and liabilities included in a segment's capital<br />
employed consist of items used by the segment in its operating<br />
activities, or items justifiably allocated to segments. The assets<br />
included in capital employed comprise property, plant and<br />
equipment and intangible fixed assets, interests in associates,<br />
pension assets, inventories, trade receivables and other noninterest-bearing<br />
receivables, external interest-bearing receivables<br />
and available-for-sale assets. The liabilities included in<br />
capital employed consist of trade payables, other non-interestbearing<br />
liabilities and provisions. The Group's real estate assets<br />
and the revenue and costs derived from them have been allocated<br />
to the segments.<br />
Capital employed does not include deferred tax assets and<br />
liabilities, financial assets at fair value through profit or loss,<br />
available-for-sale financial assets, or interest-bearing liabilities.<br />
The food trade comprises the food business based on Kesko<br />
Food's K-retailer business model and Kespro's grocery wholesaling.<br />
Kesko Food is active in the grocery trade in Finland. The<br />
operations of the more than 1,000 K-food stores are based on<br />
the K-retailer business model. These stores form Kesko Food's<br />
K-citymarket, K-supermarket, K-market and K-extra chains.<br />
Kesko Food manages the operations of the chains made up by<br />
the stores. Chain operations ensure higher competitiveness.<br />
Through chain operations, Kesko Food ensures a strong operational<br />
base for K-retailers in terms of sourcing and purchasing,<br />
formation of selections, marketing and price competition. Kesko<br />
Food’s subsidiary Kespro Ltd engages in wholesaling in the<br />
Finnish HoReCa business.<br />
The home and speciality goods trade comprises Anttila,<br />
K-citymarket's home and speciality goods trade, and the other<br />
home and speciality goods companies, namely Indoor, Intersport<br />
Finland, Musta Pörssi and Kenkäkesko. Anttila retails home and<br />
Kesko financial statements <strong>2009</strong><br />
97<br />
speciality goods. Anttila serves its customers at Anttila department<br />
stores, Kodin Ykkönen department stores for home goods<br />
and interior decoration, and through NetAnttila focusing on distance<br />
sales. K-citymarket's home and speciality goods trade is<br />
responsible for the home and speciality goods and the household<br />
goods trade of the K-citymarket chain's department stores.<br />
Intersport Finland is active in the sports equipment trade in Finland<br />
and its retail store chains in Finland are Intersport, Budget<br />
Sport and Kesport. Indoor is a furniture and interior decoration<br />
retailer operating in Finland and the Baltic countries. Its store<br />
chains are Asko and Sotka. Must Pörssi offers home technology<br />
products and services through the Musta Pörssi store chain and<br />
the Konebox.fi online store. Kenkäkesko is active in the shoe<br />
trade and its retail store chains are K-kenkä and Andiamo.<br />
The building and home improvement trade comprises Rautakesko's<br />
building and home improvement trade and agricultural<br />
trade in Finland, Sweden, Norway, the Baltic countries, Russia<br />
and Belarus. Rautakesko's operations are based on strong chain<br />
concepts, efficient sourcing, and best practices duplicated internationally.<br />
Rautakesko is responsible for the chains' concepts,<br />
marketing, and sourcing and logistics services, store site network<br />
and retailer resources in Finland. Rautakesko is a retail operator<br />
in Sweden, the Baltic countries, Russia, Belarus and Norway. The<br />
retail store chains are K-rauta, Rautia, K-Maatalous, Byggmakker<br />
(Norway), Senukai (Lithuania) and OMA (Belarus). Rautakesko's<br />
building and home improvement stores serve both consumer<br />
and professional customers.<br />
The car and machinery trade comprises the business operations<br />
of VV-Auto and Konekesko. VV-Auto imports and markets<br />
Volkswagen, Audi and Seat passenger cars and Volkswagen commercial<br />
vehicles in Finland. VV-Auto is also engaged in car retailing<br />
and provides after-sales services at its own retail outlets.<br />
Konekesko is a service company specialising in the import and<br />
sales of construction, environmental and agricultural machinery,<br />
trucks and buses, and recreational machinery. Konekesko operates<br />
in Finland, the Baltic countries and Russia.<br />
Common operations comprise Group support functions.
98 Kesko financial statements <strong>2009</strong><br />
Segment information <strong>2009</strong><br />
Income statement<br />
€ million Food trade<br />
Building and<br />
Home and home<br />
speciality improvement<br />
goods trade trade<br />
Car and<br />
machinery<br />
trade<br />
Common<br />
operations Eliminations Total<br />
Segment net sales 3,797.6 1,558.0 2,311.8 947.5 133.7 8,748.6<br />
of which inter-segment sales -161.5 -26.1 -1.6 -0.5 -112.2 -301.8<br />
Net sales from external customers 3,636.1 1,532.0 2,310.2 947.0 21.5 8,446.8<br />
Other segment income 546.3 118.7 104.2 6.8 15.6 791.5<br />
of which inter-segment income -71.2 -5.4 -2.7 -0.4 -1.4 -81.1<br />
Other operating income from external customers 475.1 113.2 101.4 6.3 14.3 0.0 710.4<br />
Depreciation and amortisation -42.8 -27.0 -36.6 -8.1 -2.7 0.3 -116.9<br />
Impairments -8.0 -1.1 -0.6 -4.6 -14.4<br />
Operating profit 170.6 66.5 19.6 -5.1 -19.3 0.0 232.3<br />
Non-recurring items 37.5 37.0 7.7 -5.4 0.7 -0.5 77.0<br />
Operating profit excl. non-recurring items 133.1 29.5 11.9 0.3 -20.0 0.5 155.4<br />
Financial income and expenses -16.0<br />
Share of profit/loss from associates 0.2<br />
Profit before tax and discontinued operations 216.6<br />
Assets and liabilities<br />
Tangible and intangible assets 480.8 252.0 450.4 67.5 19.7 25.1 1,295.4<br />
Interests in associates and other investments 1.1 0.2 0.2 0.0 35.2 -0.6 36.0<br />
Pension assets 150.5 52.1 43.3 28.5 40.8 315.2<br />
Inventories 90.4 223.0 195.8 157.2 -0.8 665.5<br />
Trade receivables 255.9 149.5 154.8 51.3 11.8 -29.7 593.7<br />
Other non-interest-bearing receivables 35.4 24.2 54.0 13.0 9.2 -15.5 120.3<br />
Interest-bearing receivables from external<br />
customers 79.7 0.6 13.3 2.9 3.4 -3.0 96.9<br />
Assets held for sale 0.9 0.9<br />
Assets included in capital employed 1,093.8 701.5 911.8 320.3 121.1 -24.5 3,123.9<br />
Unallocated items<br />
Deferred tax assets 3.2<br />
Financial assets at fair value through profit or loss 213.1<br />
Available-for-sale financial assets 427.7<br />
Cash and cash equivalents 73.9<br />
Total assets 1,093.8 701.5 911.8 320.3 121.1 -24.5 3,841.8<br />
Trade payables 348.7 138.3 198.9 31.4 3.1 -21.7 698.7<br />
Other non-interest-bearing liabilities 140.6 121.3 85.4 51.9 70.4 -23.3 446.2<br />
Provisions 8.4 8.2 3.8 14.7 8.7 43.7<br />
Liabilities included in capital employed 497.7 267.8 288.1 97.9 82.2 -45.0 1,188.6<br />
Unallocated items<br />
Interest-bearing liabilities 456.2<br />
Deferred tax liabilities 127.7<br />
Total liabilities 497.7 267.8 288.1 97.9 82.2 -45.0 1,772.5<br />
Total capital employed at 31 Dec. 596.1 433.8 623.7 222.4 38.8 20.5 1,935.3<br />
Average capital employed<br />
Return on capital employed<br />
635.7 509.6 644.9 244.2 58.3 21.8 2,114.5<br />
excl. non-recurring items, % 20.9 5.8 1.8 0.1 0.0 0.0 7.3<br />
Investments 69.4 29.6 84.7 13.4 2.5 -1.7 198.0<br />
Number of employees at 31 Dec. 3,288 8,073 9,219 1,196 424 22,200<br />
Average number of employees 3,035 5,666 8,789 1,291 403 19,184
Segment information 2008<br />
Income statement<br />
€ million Food trade<br />
Building and<br />
Home and home<br />
speciality improvement<br />
goods trade trade<br />
Car and<br />
machinery<br />
trade<br />
Kesko financial statements <strong>2009</strong><br />
99<br />
Common<br />
operations Eliminations Total<br />
Segment net sales 3,706.9 1,605.6 2,977.5 1,479.7 115.8 9,885.5<br />
of which inter-segment sales -176.8 -24.5 -2.3 -1.0 -89.3 -294.0<br />
Net sales from external customers 3,530.1 1,581.0 2,975.2 1,478.7 26.5 9,591.5<br />
Other segment income 522.8 131.9 115.5 6.5 28.3 805.0<br />
of which inter-segment income -66.3 -5.2 -1.5 -1.2 -0.7 -74.7<br />
Other operating income from external customers 456.5 126.8 114.1 5.4 27.6 730.3<br />
Depreciation and amortisation -44.7 -25.3 -35.2 -8.5 -3.5 0.3 -117.0<br />
Impairments -15.5 -45.6 -61.1<br />
Operating profit 185.5 63.6 19.4 30.5 -13.5 0.2 285.6<br />
Non-recurring items 62.9 32.4 -37.0 0.1 10.3 68.7<br />
Operating profit excl. non-recurring items 122.5 31.2 56.4 30.4 -23.8 0.2 217.0<br />
Finance income and costs 1.0<br />
Share of profit/loss from associates 1.9<br />
Profit before tax and discontinued operations 288.5<br />
Assets and liabilities<br />
Tangible and intangible assets 543.2 299.5 417.1 71.1 23.4 24.9 1,379.2<br />
Interests in associates 0.9 0.2 0.1 0.7 33.0 -0.6 34.2<br />
Pension assets 159.8 45.0 42.3 27.6 25.5 300.3<br />
Inventories 90.5 256.5 273.5 255.3 0.0 -4.8 871.0<br />
Trade receivables 279.4 131.3 167.1 72.9 10.0 -27.5 633.1<br />
Other non-interest-bearing receivables 34.1 23.9 50.7 13.6 41.8 -15.8 148.3<br />
Interest-bearing receivables from external<br />
customers 66.6 0.5 0.6 2.6 4.9 -1.9 73.2<br />
Assets held for sale 1.9 1.0 3.0<br />
Assets included in capital employed 1,174.6 756.9 953.3 443.8 139.5 -25.8 3,442.2<br />
Unallocated items<br />
Deferred tax assets 6.5<br />
Financial assets at fair value through profit or loss 94.4<br />
Available-for-sale financial assets 291.0<br />
Cash and cash equivalents 57.8<br />
Total assets 1,174.6 756.9 953.3 443.8 139.5 -25.8 3,891.9<br />
Trade payables 349.0 138.9 205.5 78.9 4.6 -26.3 750.6<br />
Other non-interest-bearing liabilities 160.9 107.2 93.5 47.6 56.2 -16.6 448.9<br />
Provisions 8.2 7.1 4.7 15.3 8.3 43.6<br />
Liabilities included in capital employed 518.1 253.2 303.8 141.9 69.1 -43.0 1,243.1<br />
Unallocated items<br />
Interest-bearing liabilities 490.6<br />
Deferred tax liabilities 132.0<br />
Total liabilities 518.1 253.2 303.8 141.9 69.1 -43.0 1,865.6<br />
Total capital employed at 31 Dec. 656.5 503.7 649.5 301.9 70.4 17.1 2,199.2<br />
Average capital employed<br />
Return on capital employed<br />
635.1 507.3 629.3 280.7 66.8 16.1 2,135.3<br />
excl. non-recurring items,% 19.3 6.2 9.0 10.8 0 0 10.2<br />
Investments 139.7 60.5 122.7 15.6 4.2 -4.3 338.4<br />
Number of employees at 31 Dec. 3,830 8,229 10,972 1,402 235 24,668<br />
Average number of employees 3,440 5,801 10,400 1,451 236 21,327
100 Kesko financial statements <strong>2009</strong><br />
Group-wide information<br />
The Group is active in the Nordic countries, the Baltic countries,<br />
Russia and Belarus. The food trade and the home and speciality<br />
goods trade mainly take place in Finland, the car and machinery<br />
trade in Finland and the Baltic countries, and the building and<br />
home improvement trade in Finland, Norway, Sweden, the Baltic<br />
<strong>2009</strong><br />
Other Nordic<br />
Baltic<br />
Other<br />
€ million Finland countries countries countries Eliminations Total<br />
Net sales 7,022.9 664.0 556.0 222.7 -18.8 8,446.8<br />
Assets 2 489.7 248.7 197.7 144.2 43.7 3,123.9<br />
Investments 127.1 18.6 5.8 47.2 -0.6 198.0<br />
Number of employees at 31 Dec. 13,299 1,521 4,798 2,582 22,200<br />
2008<br />
Other Nordic<br />
Baltic<br />
Other<br />
€ million Finland countries countries countries Eliminations Total<br />
Net sales 7,634.2 758.7 945.7 278.2 -25.3 9,591.5<br />
Assets 2 737.3 232.4 317.6 116.0 39.0 3,442.2<br />
Investments 241.5 31.1 11.5 55.5 -1.2 338.4<br />
Number of employees at 31 Dec. 14,192 1,648 6,316 2,512 24,668<br />
The net sales nearly completely consist of goods sales. The<br />
sales of services are immaterial.<br />
NOTE 3<br />
Acquisitions<br />
Acquisitions in <strong>2009</strong><br />
In <strong>2009</strong>, the Kesko Group's acquisitions mainly comprised real<br />
estate companies. The acquisition cost totalled €10.5 million and<br />
the cash outflow, additional purchase prices included, totalled<br />
€16.4 million.<br />
Acquisitions in 2008<br />
In 2008, the Kesko Group's acquisitions mainly comprised real<br />
estate companies. The cost of acquisitions totalled €30.0 million<br />
and the cash outflow, additional purchase prices included,<br />
totalled €35.0 million.<br />
NOTE 4<br />
Discontinued operations and disposals of assets<br />
Discontinued operations<br />
In <strong>2009</strong>, no discontinued operation occurred in the Kesko Group.<br />
Disposals of assets<br />
In March <strong>2009</strong>, the Kesko Group sold four retail store properties<br />
to the Kesko Pension Fund. The debt-free selling price was about<br />
€50 million. The Kesko Group’s €19.7 million gain has been<br />
reported as a non-recurring item in the operating profit.<br />
countries, Russia and Belarus. The item 'Other countries' includes<br />
Russia and Belarus.<br />
The net sales, assets, investments and personnel are disclosed<br />
based on their location.<br />
The revenues of transactions with any single customer do not<br />
amount to 10% or more of the Kesko Group's revenues.<br />
In addition, the Kesko Group sold 13 of its retail store properties<br />
in different parts of Finland to Varma Mutual Pension Insurance<br />
Company in December <strong>2009</strong>. The debt-free selling price was<br />
€156 million. The Group's €63.5 million gain has been reported<br />
as a non-recurring item in the operating profit.<br />
Discontinued operations in 2008<br />
In March 2008, Kesko Corporation sold the share capital of Tähti<br />
Optikko Group Oy. The debt-free selling price was about €15<br />
million, which contributed a non-recurring gain of about €8.5<br />
million.<br />
In April 2008, Kesko Corporation sold the share capital of<br />
Kauko-Telko Ltd engaged in technical trade. The debt-free price<br />
was about €77 million, which contributed a non-recurring gain<br />
of about €31 million.
Net assets of discontinued operations at date of disposal<br />
€ million 2008<br />
Cash 21.0<br />
Intangible assets 22.8<br />
Tangible assets 10.0<br />
Inventories 26.6<br />
Receivables 31.3<br />
Non-interest-bearing liabilities -35.9<br />
Interest-bearing liabilities -13.4<br />
Deferred tax liabilities (net) -3.1<br />
Notes to the income statement<br />
NOTE 5<br />
Other operating income<br />
€ million <strong>2009</strong> 2008<br />
Service fees 488.1 460.0<br />
Rent income 39.3 37.3<br />
Gains on disposal of tangible and<br />
intangible assets 94.4 140.0<br />
Gains from derivatives *) 2.6 4.9<br />
Other 86.0 88.0<br />
Total 710.4 730.3<br />
Service fees mainly comprise chain and store site fees paid by<br />
chain companies for the chain concepts.<br />
59.2<br />
Group eliminations 1.9<br />
Gains/losses on disposal 39.4<br />
Total consideration 100.6<br />
Received in cash 100.6<br />
Received in shares<br />
Cash and cash equivalents in disposed<br />
entity -21.0<br />
Cash inflow on disposal 79.6<br />
Income statement for discontinued operations<br />
€ million 2008<br />
Net sales 83.1<br />
Expenses -80.3<br />
Profit before tax 2.8<br />
Income tax -0.8<br />
Profit after tax 2.0<br />
Profit before tax on disposal of operations 39.5<br />
Net profit on the disposal of operations 41.5<br />
NOTE 6<br />
Other operating expenses<br />
Kesko financial statements <strong>2009</strong><br />
101<br />
Cash flow statement for discontinued operations<br />
€ million 2008<br />
Operating cash flows 1.7<br />
Investing cash flows -3.0<br />
Financing cash flows -6.7<br />
Total cash flows from discontinued<br />
operations -8.0<br />
The cash flows do not include the cash flows from the disposal of<br />
operating activities.<br />
Disposals of assets<br />
In January 2008, Kesko Corporation sold K-Rahoitus Oy, one of its<br />
wholly-owned subsidiaries. In the 2007 financial statements,<br />
K-Rahoitus Oy's assets were reported in available-for-sale assets<br />
and in liabilities relating to available-for-sale assets. The transaction<br />
contributed a non-recurring gain of about €10.3 million.<br />
In 2008, Kesko waived the purchase option included in the<br />
lease agreements made with Nordisk Renting Oy in 2001 and<br />
2002, for which RBS Nordisk Renting paid Kesko a €74.2 million<br />
compensation.The previous agreements had been financial lease<br />
agreements and their cancellation generated a non-recurring<br />
income item of €26.5 million.<br />
In addition, Kesko sold properties to Aberdeen Property Fund<br />
Finland 1 Ky at a price of 44 million, which generated a €16.3<br />
million non-recurring gain.<br />
€ million <strong>2009</strong> 2008<br />
Rent expenses -383.1 -349.9<br />
Marketing costs -239.3 -254.0<br />
Property and store site occupancy costs -112.0 -125.3<br />
Data communication costs -65.1 -65.5<br />
Other trading expenses -157.7 -186.1<br />
Losses on disposal of tangible assets -1.4 -1.3<br />
Losses on derivatives *) -2.2 -4.9<br />
Total -960.8 -987.1<br />
*) Includes revaluations of embedded derivatives.<br />
Audit fees<br />
€ million <strong>2009</strong> 2008<br />
Authorised Public Accountants<br />
PricewaterhouseCoopers<br />
Audit fees 0.8 0.9<br />
Tax consultation 0.1 0.2<br />
Other services 0.2 0.7<br />
Total 1.1 1.7<br />
Other auditing firms 0.2 0.4
102 Kesko financial statements <strong>2009</strong><br />
NOTE 7<br />
Non-recurring items<br />
€ million <strong>2009</strong> 2008<br />
Gains on disposal of real estate and shares 93.7 139.0<br />
Losses on disposal of real estate and<br />
shares -1.1 -1.0<br />
Impairment losses -14.4 -61.1<br />
Others -1.3 -8.2<br />
Total 77.0 68.7<br />
Incidental transactions outside ordinary course of business are<br />
treated as non-recurring items and allocated to segments. The<br />
Group identifies gains and losses on disposal of real estate,<br />
shares and operations, impairments and costs of discontinuing<br />
significant operations as non-recurring items. Gains on disposal<br />
are presented within 'other income' in the income statement,<br />
and losses on disposal within 'other operating expenses'.<br />
In addition to the above, the comparative discontinued operations<br />
include non-recurring gains on disposal in the amount of<br />
€39.5 milllion.<br />
Impairment losses<br />
During the financial period, a total amount of €14.4 million of<br />
impairments in real estate were recognised as expenses.<br />
The income statement of the comparative period includes a<br />
total amount of €61.1 million in impairment losses. An impairment<br />
charge of €45.6 million was made on the consolidated<br />
goodwill and trademark of Rautakesko's subsidiary, Byggmakker<br />
Norge. In addition, the comparative non-recurring expenses<br />
include an impairment charge of €15.5 million on Anttila's logistics<br />
centre in Vantaa.<br />
NOTE 8<br />
Staff cost, number of employees and<br />
management's salaries<br />
€ million <strong>2009</strong> 2008<br />
Salaries and fees -448.4 -496.6<br />
Social security costs -39.0 -47.3<br />
Pension costs -39.6 -28.8<br />
Defined benefit plans 8.2 20.5<br />
Defined contribution plans -47.8 -49.3<br />
Share-based payments -8.1 -5.5<br />
Total -535.2 -578.2<br />
The employee benefits of the Group's management and other<br />
related party transactions are disclosed in note 43 and option<br />
plans in note 35.<br />
Salaries and fees of the Group companies' managing<br />
directors and boards of directors<br />
€ million <strong>2009</strong> 2008<br />
Salaries of managing directors<br />
(incl. fringe benefits) 4.9 5.8<br />
Fees of Board members 0.3 0.3<br />
Total 5.2 6.1<br />
Average number of Group employees<br />
<strong>2009</strong> 2008<br />
Food trade 3,035 3,440<br />
Home and speciality goods trade 5,666 5,801<br />
Building and home improvement trade 8,789 10,400<br />
Car and machinery trade 1,291 1,451<br />
Others 403 236<br />
Total 19,184 21,327<br />
NOTE 9<br />
Financial income and expenses<br />
€ million <strong>2009</strong> 2008<br />
Interest income and expenditure<br />
Interest income on loans and receivables<br />
Interest income on financial assets carried<br />
10.1 15.1<br />
at fair value through profit or loss<br />
Interest income on available-for-sale<br />
9.1 6.3<br />
financial assets<br />
Interest expense on financial liabilities<br />
1.9 13.8<br />
carried at amortised cost -20.3 -30.5<br />
Total interest income and expenditure 0.7 4.7<br />
Exchange differences and other financial income and expenses<br />
Exchange differences and fair value<br />
changes on derivatives, foreign currency<br />
denominated loans and bank accounts<br />
not qualified for hedge accounting<br />
Dividend yield on available-for-sale<br />
-19.0 -2.4<br />
financial assets<br />
Gains on disposal of available-for-sale<br />
0.1 0.1<br />
financial assets<br />
Losses on disposal of available-for-sale<br />
3.2 0.0<br />
financial assets -0.2<br />
Other financial expenses<br />
Total exchange differences and other<br />
-0.8 -1.5<br />
financial income and expenses -16.7 -3.8<br />
Total financial income and expenses -16.0 1.0<br />
The interest expenditure includes €4.9 million (€5.8 million) in<br />
interest on finance leases recognised as expenses for the period.<br />
The interest income includes €3.1 million (€2.5 milion) in interest<br />
on finance leases reported as income for the period.<br />
The result of the realised interest rate derivative used to hedge<br />
the USD-denominated private placement loan is recognised in<br />
net terms in interest expenses with the loan interest.
Exchange differences recognised in the income statement<br />
€ million <strong>2009</strong> 2008<br />
Other income 1.9 3.8<br />
Purchases and other expenses -3.1 -0.7<br />
Finance income and expenses -19.2 -3.0<br />
Total -20.4 0.1<br />
NOTE 10<br />
Income tax expense<br />
€ million <strong>2009</strong> 2008<br />
Current tax -82.7 -83.2<br />
Tax for prior periods -1.2 2.2<br />
Deferred tax 1.6 -8.4<br />
Total -82.4 -89.4<br />
Reconciliation between tax expense and tax calculated at domestic rate:<br />
Profit before tax 216.6 288.5<br />
Tax at parent's rate (26%)<br />
Effect of foreign subsidiaries' different tax<br />
-56.3 -75.0<br />
rates 2.0 3.4<br />
Effect of income not subject to tax<br />
Effect of expenses not deductible for tax<br />
1.4 9.8<br />
purposes -8.9 -10.0<br />
Effect of tax losses -17.1 -12.1<br />
Effect of consolidation and elimination 0.0 -6.8<br />
Taxes for prior periods -1.2 2.2<br />
Adjustment of prior period deferred taxes -1.2 -3.9<br />
Others -1.2 3.0<br />
Tax in the income statement -82.4 -89.4<br />
NOTE 11<br />
Components of other comprehensive income<br />
Components of other comprehensive<br />
income and related tax <strong>2009</strong><br />
Before<br />
tax<br />
Tax charge/<br />
credit<br />
After<br />
tax<br />
Currency translation<br />
differences relating to<br />
a foreign operation<br />
Cash flow hedge<br />
-2.5 -2.5<br />
revaluation<br />
Revaluation of available-<br />
-3.9 1.0 -2.9<br />
for-sale financial assets -1.9 0.5 -1.4<br />
Other components -0.3 -0.3<br />
Total -8.6 1.5 -7.1<br />
Kesko financial statements <strong>2009</strong><br />
103<br />
Components of other comprehensive<br />
income and related tax 2008<br />
Before<br />
tax<br />
Tax charge/<br />
credit<br />
After<br />
tax<br />
Currency translation<br />
differences relating to<br />
a foreign operation<br />
Cash flow hedge<br />
-6.3 -6.3<br />
revaluation<br />
Revaluation of available-<br />
-12.8 3.3 -9.5<br />
for-sale financial assets 2.2 -0.6 1.6<br />
Other components -0.3 -0.3<br />
Total -17.2 2.8 -14.5<br />
NOTE 12<br />
Earnings per share<br />
Basic earnings per share is calculated by dividing the net profit<br />
attributable to the parent's equity holders by the weighted average<br />
number of shares outstanding during the period. Diluted<br />
earnings per share is calculated by adjusting the weighted average<br />
number of all shares to assume conversion of all potentially<br />
dilutive shares. The Group operates a share option scheme with<br />
a dilutive effect, which increases the number of shares. The share<br />
options have a dilutive effect when their exercise price is lower<br />
than the fair value of a share. The dilutive effect is the number<br />
of shares which has to be issued without consideration, because<br />
the Group could not use the assets received from the exercise<br />
of the share options to issue an equal number of shares at fair<br />
value. The fair value of a share is based on the average share<br />
price during the period.<br />
<strong>2009</strong> 2008<br />
Profit for the period attributable<br />
to equity holders of the parent<br />
Continuing operations, € million 125.2 178.2<br />
Discontinued operations, € million - 41.5<br />
Kesko total, € million 125.2 219.7<br />
Number of shares<br />
Weighted average number or shares<br />
outstanding 98,061,761 97,795,685<br />
Effect of options granted<br />
Diluted weighted average number of<br />
320,423 460,550<br />
shares outstanding 98,382,184 98,256,234<br />
Earnings per share from profit<br />
attributable to equity holders of the<br />
parent<br />
Continuing operations<br />
Basic, € 1.28 1.82<br />
Diluted, € 1.27 1.81<br />
Discontinued operations<br />
Basic, € - 0.43<br />
Diluted, € - 0.43<br />
Kesko total<br />
Basic, € 1.28 2.25<br />
Diluted, € 1.27 2.24
104 Kesko financial statements <strong>2009</strong><br />
Notes to the consolidated statement<br />
of financial position<br />
NOTE 13<br />
Intangible assets<br />
€ million Goodwill Trademarks<br />
Other<br />
intangible<br />
assets Prepayments Total <strong>2009</strong><br />
Cost<br />
Cos at 1 Jan. <strong>2009</strong> 115.3 71.1 142.5 10.4 339.4<br />
Currency translation differences 6.8 5.6 4.8 17.1<br />
Additions 2.2 28.7 6.0 36.9<br />
Acquisition of subsidiary 0.0<br />
Disposals -0.9 -0.7 -15.2 -0.6 -17.5<br />
Transfers between items -3.3 -5.9 -9.2<br />
Cost at 31 Dec. <strong>2009</strong> 123.3 75.9 157.4 10.0 366.6<br />
Accumulated amortisation and impairment<br />
Accumulated amortisation and impairment at 1 Jan. <strong>2009</strong> -43.3 -28.6 -97.9 -169.7<br />
Currency translation differences -6.7 -1.3 -1.6 -9.6<br />
Accumulated amortisation of disposals and transfers 0.2 22.0 22.1<br />
Amortisation for the period<br />
Impairments<br />
-24.7 -24.7<br />
Accumulated amortisation and impairment at 31 Dec. <strong>2009</strong> -49.9 -29.8 -102.2 -181.9<br />
Carrying amount at 1 Jan. <strong>2009</strong> 72.1 42.5 44.6 10.4 169.6<br />
Carrying amount at 31 Dec. <strong>2009</strong> 73.5 46.1 55.2 10.0 184.8<br />
€ million<br />
Cost<br />
Total<br />
2008<br />
Cos at 1 Jan. 2008 163.3 78.3 124.5 13.4 379.6<br />
Currency translation differences -7.6 -7.2 -5.3 -1.3 -21.4<br />
Additions 6.4 36.8 7.4 50.6<br />
Acquisition of subsidiary 0.0 0.0<br />
Disposals -46.7 -16.7 -1.5 -64.9<br />
Transfers between items -0.1 3.1 -7.6 -4.6<br />
Cost at 31 Dec. 2008 115.3 71.1 142.5 10.4 339.4<br />
Accumulated amortisation and impairment<br />
Accumulated amortisation and impairment at 1 Jan. 2008 -29.0 -21.3 -77.2 -127.5<br />
Currency translation differences 5.9 1.3 1.6 8.8<br />
Accumulated amortisation of disposals and transfers 16.9 6.0 22.9<br />
Amortisation for the period -28.3 -28.3<br />
Impairments -37.0 -8.6 -45.6<br />
Accumulated amortisation and impairment at 31 Dec. 2008 -43.3 -28.6 -97.9 -169.7<br />
Carrying amount at 1 Jan. 2008 134.3 57.0 47.3 13.4 252.2<br />
Carrying amount at 31 Dec. 2008 72.1 42.5 44.6 10.4 169.6
Goodwill and intangible rights by segment<br />
Intangible<br />
assets * Goodwill<br />
Cash generating units have been identified at a level lower than<br />
the reportable segments. The units have been identified by<br />
chain/country, and most of them are legal entities.<br />
The useful lives of trademarks (brands) included in intangible<br />
assets have been classified as indefinite because it has been<br />
estimated that they will affect the generation of cash flows over<br />
an indefinite period. This is because no foreseeable limit to the<br />
period over which they are expected to generate net cash inflows<br />
for the Group can be seen. Trademarks are part of assets purchased<br />
in connection with acquisitions.<br />
Intangible assets with indefinite useful lives are tested annually<br />
for possible impairment and whenever there is an indication<br />
of impairment.<br />
During the 2008 financial period, Byggsenteret, part of the<br />
Norwegian Byggmakker group, was sold, and the allocated goodwill<br />
was €9.5 million.<br />
Impairment test for goodwill and intangible assets<br />
The recoverable amount of a cash-generating unit is determined<br />
based on value-in-use calculations. These calculations use cash<br />
flow projections based on financial plans approved by the management<br />
covering a period of 3 years. The key assumptions used<br />
for the plans are total market development and profitability,<br />
changes in store site network, product and service selection,<br />
pricing and trends in operating costs. Cash flows beyond the<br />
period have been extrapolated mainly based on 1.5–4% (1–4%)<br />
forecast growth rates, allowing for country-specific differences.<br />
The discount rate used is the WACC, specifed for each segment<br />
and country after tax, which is adjusted by tax effects in connection<br />
with the test. The WACC formula inputs are risk-free rate of<br />
return, market risk premium, industry-specific beta factor, target<br />
capital structure, borrowing cost and country risks. Compared<br />
with the previous year, discount rates in Russia and the Baltic<br />
countries rose as a result of higher country risks and interest rate<br />
levels.<br />
Discount rate<br />
(WACC) **<br />
Kesko financial statements <strong>2009</strong><br />
Intangible<br />
assets * Goodwill<br />
105<br />
Discount rate<br />
(WACC) **<br />
€ million <strong>2009</strong> <strong>2009</strong> <strong>2009</strong> 2008 2008 2008<br />
Building and home improvement trade<br />
Byggmakker, Norway 28.3 8.0% 24.7 8.0%<br />
Rautakesko, Estonia 1.1 13.0% 1.1 11.0%<br />
Senukai, Lithuania 17.2 14.0% 17.2 11.5%<br />
Stroymaster, Russia 14.2 15.0% 14.1 12.0%<br />
Real estate companies 7.1 5.7<br />
Home and speciality goods trade<br />
Anttila, Finland 23.4 7.0% 23.4 7.0%<br />
Indoor, Finland 17.8 4.1 7.0% 17.8 4.1 7.0%<br />
Car and machinery trade 4.4 8.0% 4.2 8.0%<br />
Others 2.1 2.2<br />
Total 46.1 73.5 42.5 72.1<br />
* intangible assets with indefinite useful lives<br />
** after tax<br />
Impairment losses<br />
For the <strong>2009</strong> accounting period, there were no impairments in<br />
goodwill or intangible rights.<br />
For the 2008 accounting period, an impairment charge of<br />
€45.6 million was made against Byggmakker Norge's intangible<br />
assets. Of this amount €37.0 million was allocated to goodwill<br />
and €8.6 million to a trademark. The impairment charge was<br />
reported as a non-recurring item. The impairment loss was due<br />
to weaker-than-expected profitability development. In addition,<br />
it was estimated that revenue expectations concerning Byggmakker<br />
had declined. Byggmakker Norge constitutes a separate<br />
cash-generating unit and belongs to the building and home<br />
improvement trade segment.<br />
Sensitivity analysis<br />
The key variables used in impairment testing are the EBITDA rate<br />
and the discount rate.<br />
The most sensitive to changes in assumptions are the intangible<br />
assets relating to the operations of Byggmakker, Indoor and<br />
Rauta-kesko Estonia.<br />
A one percentage point rise in the discount rate would not<br />
cause an impairment of any cash generating unit.<br />
For Byggmakker and Rautakesko Estonia, a reduction of residual<br />
EBITDA by over 0.8 pp would cause a need for impairment.<br />
For Indoor, a reduction of residual EBITDA by over 1.2 pp would<br />
cause a need for impairment.<br />
When the other cash generating units are estimated according<br />
to the management's assumptions, a foreseeable change in any<br />
key variable would not create a situation in which the unit's<br />
recoverable amount would be smaller than its carrying amount.
106 Kesko financial statements <strong>2009</strong><br />
NOTE 14<br />
Property, plant and equipment<br />
€ million<br />
Land and<br />
water Buildings<br />
Machinery and<br />
equipment<br />
Other<br />
tangible<br />
assets<br />
Prepayments<br />
and purchases<br />
in progress Total <strong>2009</strong><br />
Cost<br />
Cost at 1 Jan. <strong>2009</strong> 271.7 1,059.9 486.5 38.3 82.4 1,938.8<br />
Currency translation differences 1.7 2.4 3.0 0.6 0.6 8.2<br />
Additions 23.3 55.5 47.3 9.5 26.1 161.7<br />
Acquisition of subsidiary 3.2 3.2<br />
Disposals -27.2 -159.1 -26.0 -4.2 -18.3 -234.8<br />
Transfers between items 0.0 38.3 0.3 -30.4 8.3<br />
Cost at 31 Dec. <strong>2009</strong> 272.8 997.1 510.8 44.5 60.3 1,885.4<br />
Accumulated depreciation and impairment<br />
Accumulated depreciation and impairment<br />
at 1 Jan. <strong>2009</strong> -2.4 -389.6 -322.6 -14.8 -729.3<br />
Currency translation differences<br />
Accumulated depreciation of disposals and<br />
-0.4 -1.7 -0.1 -2.2<br />
transfers 45.2 15.6 2.3 63.2<br />
Depreciation for the period -38.4 -49.4 -4.4 -92.1<br />
Impairment<br />
Accumulated depreciation and impairment<br />
-0.2 -14.0 -0.1 -14.3<br />
at 31 Dec. <strong>2009</strong> -2.6 -397.2 -358.1 -17.0 0.0 -774.8<br />
Carrying amount at 1 Jan. <strong>2009</strong> 269.3 670.3 164.0 23.6 82.4 1,209.5<br />
Carrying amount at 31 Dec. <strong>2009</strong> 270.1 599.9 152.7 27.5 60.3 1,110.6<br />
Total<br />
2008<br />
Cost<br />
Cost at 1 Jan. 2008 223.2 1,140.7 481.4 36.2 29.9 1,911.3<br />
Currency translation differences -3.3 -4.1 -8.0 -1.1 -1.3 -17.8<br />
Additions 54.4 69.5 97.9 7.1 70.6 299.5<br />
Acquisition of subsidiary 2.6 9.6 0.0 12.2<br />
Disposals -11.1 -174.7 -90.5 -4.0 -0.2 -280.5<br />
Transfers between items 5.9 18.9 5.7 0.1 -16.5 14.1<br />
Cost at 31 Dec. 2008 271.7 1,059.9 486.5 38.3 82.4 1,938.8<br />
Accumulated depreciation and impairment<br />
Accumulated depreciation and impairment<br />
at 1 Jan. 2008 -3.7 -414.1 -326.3 -14.1 -758.2<br />
Currency translation differences<br />
Accumulated depreciation of disposals and<br />
0.0 1.1 4.2 0.5 5.8<br />
transfers 1.3 76.5 48.6 1.9 128.3<br />
Depreciation for the period -37.6 -49.1 -3.1 -89.5<br />
Impairment<br />
Accumulated depreciation and impairment<br />
-15.5 -15.5<br />
at 31 Dec. 2008 -2.4 -389.6 -322.6 -14.8 -729.3<br />
Carrying amount at 1 Jan. 2008 219.5 726.6 155.2 22.2 29.9 1,153.1<br />
Carrying amount at 31 Dec. 2008 269.3 670.3 164.0 23.6 82.4 1,209.5
Property, plant and equipment include assets leased under finance leases as follows:<br />
€ million Buildings<br />
Kesko financial statements <strong>2009</strong><br />
Machinery and<br />
equipment<br />
107<br />
Other<br />
tangible<br />
assets Total<br />
<strong>2009</strong><br />
Cost 38,7 37,0 0,1 75,7<br />
Accumulated depreciation -24,1 -29,8 -0,1 -54,0<br />
Carrying amount 14,6 7,2 0,0 21,7<br />
2008<br />
Cost 38,7 47,6 0,1 86,4<br />
Accumulated depreciation -23,7 -36,4 -0,1 -60,2<br />
Carrying amount 15,0 11,2 0,0 26,2<br />
NOTE 15<br />
Interests in associates<br />
€ million <strong>2009</strong> 2008<br />
Carrying amount at 1 Jan. 31.2 27.0<br />
Share of profit/loss for the period 0.2 1.9<br />
Additions 1.7 2.4<br />
Disposals -0.1 -0.1<br />
Currency translation differences<br />
Carrying amount at 31 Dec. 33.0 31.2<br />
Shares in associates are not quoted.<br />
Disclosures for the Group's associates and the Group's interests in their aggregate assets, liabilities, net sales and profits/losses:<br />
€ million Assets Liabilities Net sales Profit/loss<br />
Ownership<br />
interest, %<br />
<strong>2009</strong><br />
Valluga-sijoitus Oy, Helsinki 33.5 0.0 0.0 1.3 39.0<br />
Vähittäiskaupan Takaus Oy, Helsinki 56.0 0.2 1.2 3.2 34.4<br />
Vähittäiskaupan Tilipalvelu VTP Oy, Helsinki 3.8 2.2 10.9 0.7 30.0<br />
Others 5.3 3.7 1.9 0.0<br />
Total 98.5 6.1 14.0 5.1<br />
2008<br />
Valluga-sijoitus Oy, Helsinki 34.5 2.3 0.7 9.1 39.0<br />
Vähittäiskaupan Takaus Oy, Helsinki 52.9 0.2 1.1 2.2 34.4<br />
Vähittäiskaupan Tilipalvelu VTP Oy, Helsinki 3.4 2.2 10.0 -0.3 30.0<br />
Others 4.6 3.2 0.5 0.0<br />
Total 95.3 7.9 12.3 11.0
108 Kesko financial statements <strong>2009</strong><br />
NOTE 16<br />
Non-current available-for-sale financial assets<br />
€ million <strong>2009</strong> 2008<br />
Carrying amount at 1 Jan. 3.0 4.0<br />
Additions 0.8 0.0<br />
Disposals -0.7 -1.0<br />
Carrying amount at 31 Dec. 3.0 3.0<br />
The available-for-sale assets include unquoted shares, mainly measured at cost, because their fair values cannot be measured reliably.<br />
NOTE 17<br />
Non-current receivables<br />
€ million <strong>2009</strong> 2008<br />
Non-interest-bearing non-current receivables 2.6 10.9<br />
Finance lease receivables 59.5 51.3<br />
Loan receivables from associates 1.5 1.5<br />
Other non-current receivables 3.8 5.5<br />
Total 67.5 69.2<br />
The non-interest-bearing non-current receivables include €1.3 million in derivative revaluations and their carrying amount equals<br />
the fair value. The fair value of finance lease receivables cannot be measured reliably.<br />
Maturity analysis of non-current receivables at 31 Dec. <strong>2009</strong><br />
€ million 2011 2012 2013 2014 2015- Total<br />
Non-interest-bearing non-current receivables 0.8 0.6 0.3 0.8 0.2 2.6<br />
Finance lease receivables 11.2 11.2 11.2 11.2 14.7 59.5<br />
Loan receivables from associates 1.5 1.5<br />
Other non-current receivables 1.1 1.0 0.8 0.7 0.2 3.8<br />
Total 13.1 12.8 12.3 12.7 16.6 67.5
NOTE 18<br />
Finance lease receivables<br />
Kesko financial statements <strong>2009</strong><br />
€ million <strong>2009</strong> 2008<br />
Analysis of finance lease receivables:<br />
No later than 1 year 20.1 15.9<br />
Later than 1 year and no later than 5 years 50.9 44.0<br />
Later than 5 years 15.3 13.5<br />
Gross investment in finance leases 86.3 73.5<br />
Present value of minimum lease payments receivable:<br />
No later than 1 year 16.8 13.1<br />
Later than 1 year and no later than 5 years 44.8 38.5<br />
Later than 5 years 14.7 12.8<br />
Finance lease receivable 76.3 64.3<br />
Unearned finance income 10.0 9.1<br />
The finance lease receivables consist of store fixtures owned by Kesko Food Ltd, and store fixtures leased by it from finance companies<br />
and subleased to chain companies. During the lease term, the leased item is held as collateral, and after the actual lease term, the<br />
lessee may extend the lease over low-cost extension periods. The lease terms are between 3 and 8 years.<br />
NOTE 19<br />
Deferred income tax<br />
The movements in deferred tax assets and deferred tax liabilities in <strong>2009</strong> were as follows:<br />
€ million 31.12.2008<br />
Income<br />
statement<br />
charge<br />
Tax charged/<br />
credited to<br />
equity<br />
Exchange<br />
differences<br />
109<br />
Acquisition/sale<br />
of subsidiary 31.12.<strong>2009</strong><br />
Deferred tax assets<br />
Internal margin of inventories 1.0 0.0 0.9<br />
Finance lease assets 0.2 -0.1 0.1<br />
Provisions 9.1 -0.2 8.9<br />
Pensions 0.9 -0.4 0.5<br />
Confirmed losses 2.8 0.6 0.5 3.9<br />
Others 20.7 -2.6 -1.2 0.1 17.0<br />
Total 34.5 -2.7 -1.2 0.6 0.0 31.2<br />
Deferred tax liabilities<br />
Accumulated depreciation differences 49.5 -10.2 0.0 39.3<br />
Changes in Group composition 22.9 -0.8 1.6 1.0 24.8<br />
Pensions 79.0 4.0 83.0<br />
Others 8.5 2.8 -2.7 -0.1 8.6<br />
Total 159.9 -4.1 -2.7 1.5 0.9 155.7<br />
Net deferred tax liabilities 125.5 124.5<br />
Balance sheet division:<br />
€ million <strong>2009</strong> 2008<br />
Deferred tax assets 3.2 6.5<br />
Deferred tax liabilities 127.7 132.0<br />
The group 'Others' within deferred tax assets includes, for example, deferred tax assets on timing differences relating to depreciation,<br />
and deferred tax assets resulting from stand-alone companies applying the Group's accounting principles.
110 Kesko financial statements <strong>2009</strong><br />
The movements in deferred tax assets and deferred tax liabilities in 2008 were as follows:<br />
€ million 31.12.2007<br />
Income<br />
statement<br />
charge<br />
Tax charged/<br />
credited to<br />
equity<br />
Exchange<br />
differences<br />
Acquisition/sale<br />
of subsidiary 31.12.2008<br />
Deferred tax assets<br />
Internal margin of inventories 2.2 -1.2 0.0 0.0 1.0<br />
Finance lease assets 5.5 -5.3 0.0 0.0 0.2<br />
Provisions 6.2 2.8 -0.1 9.1<br />
Pensions 1.0 0.0 0.0 -0.1 0.9<br />
Confirmed losses 3.9 -0.8 -0.4 0.0 2.8<br />
Others 19.3 0.4 2.6 -0.6 -1.0 20.7<br />
Total 38.0 -4.1 2.6 -1.0 -1.2 34.5<br />
Deferred tax liabilities<br />
Accumulated depreciation differences 55.3 -5.0 0.0 -0.9 49.5<br />
Changes in Group composition 21.6 -1.8 -2.4 5.5 22.9<br />
Pensions 68.1 10.8 0.1 79.0<br />
Others 11.0 0.1 -0.2 -0.1 -2.3 8.5<br />
Total 156.0 4.1 -0.2 -2.5 2.4 159.9<br />
Net deferred tax liabilities 117.9 125.5<br />
Balance sheet division:<br />
€ million 2008 2007<br />
Deferred tax assets 6.5 7.7<br />
Deferred tax liabilities 132.0 125.5<br />
At 31 Dec. <strong>2009</strong>, the Group had a €63.8 million carryforward of unused confirmed tax losses not recognised for deferred tax assets,<br />
because the realisation of the related tax benefit through future taxable profits is not probable.<br />
The confirmed tax losses not recognised for tax<br />
loss carry-forwards expire as follows: 2010 2011 2012 2013 2014 2014- Total<br />
2.4 0.5 2.3 0.0 0.0 58.6 63.8<br />
Deferred income tax liabilities have not been recognised for taxes payable on subsidiaries' unremitted earnings, because the subsidiaries'<br />
distributions are at the discretion of the Group, and a distribution with tax effect is not probable in the near future.
NOTE 20<br />
Kesko financial statements <strong>2009</strong><br />
Pension assets<br />
The Group operates several retirement plans. In Finland, employees' pension insurance is partly arranged with insurance companies<br />
and partly by the Kesko Pension Fund, whose department A granting additional benefits was closed on 9 May 1998. Pension plans<br />
arranged with the Kesko Pension Fund have been treated as defined benefit plans.<br />
As regards foreign subsidiaries, the plan adopted in the Norwegian subsidiary is the only pension plan classified as a defined benefit<br />
plan. The nature of the pension plan in Norway and Norwegian legislation changed during the 2008 accounting period to the<br />
effect that a significant number of the company's employees transferred from the defined benefit plan. At 31 December <strong>2009</strong>, the net<br />
debt relating to the defined benefit plan in Norway was €0.4 million (€0.5 million).<br />
The pension plans in other foreign subsidiaires are arranged in accordance with local regulations and practices. They do not contain<br />
significant defined benefit plans.<br />
The defined benefit liability recognised in the balance sheet in respect of the Kesko Pension Fund is determined as follows:<br />
€ million <strong>2009</strong> 2008<br />
Present value of funded obligations -525.1 -530.4<br />
Fair value of plan assets 871.6 819.5<br />
Deficit/surplus 346.5 289.1<br />
Unrecognised actuarial gains (-)/losses (+) -31.4 11.1<br />
Net assets (+)/liabilities (-) recognised in the balance sheet 315.2 300.3<br />
The movements of the present value of the obligation are as follows:<br />
Plan obligation at 1 Jan. 530.4 560.6<br />
Current services cost 12.7 15.1<br />
Interest cost 28.6 28.8<br />
Benefits paid -27.7 -27.2<br />
Actuarial gains (-)/losses (+) -24.3 -47.0<br />
Others 5.5<br />
Plan obligation at 31 Dec. 525.1 530.4<br />
The movement in the fair value of plan assets is as follows:<br />
Plan assets at 1 Jan. 819.5 897.0<br />
Expected return on plan assets 54.9 63.2<br />
Contributions to plan 6.8 17.8<br />
Benefits paid -27.7 -27.2<br />
Actuarial gains (-)/losses (+)<br />
Others<br />
18.2 -131.2<br />
Plan assets at 31 Dec. 871.6 819.5<br />
The amounts recognised in the income statement were as follows:<br />
Current service cost -12.7 -15.1<br />
Interest cost -28.6 -28.8<br />
Expected return on plan assets 54.9 63.2<br />
Change -5.5<br />
Actuarial gains (-)/losses (+) 1.2<br />
Total amount recognised in the income statement 8.2 20.5<br />
Changes in net assets recognised in the balance sheet:<br />
Opening balance 300.3 262.1<br />
Income/costs recognised in the income statement 8.2 20.5<br />
Contributions to plan 6.8 17.8<br />
Closing balance 315.2 300.3<br />
111
112 Kesko financial statements <strong>2009</strong><br />
Pensions arranged with the Kesko Pension FUnd <strong>2009</strong> 2008 2007 2006 2005<br />
Present value of plan obligation -525.1 -530.4 -560.6 -440.9 -426.8<br />
Fair value of plan assets 871.6 819.5 897.0 794.8 628.7<br />
Surplus/deficit 346.5 289.1 336.4 353.9 201.8<br />
Experience adjustments on plan assets 18.2 -130.9 11.5 113.1 41.6<br />
Experience adjustments on plan liabilities 4.3 -15.6 23.2 4.8 5.9<br />
The return on plan assets was €73.0 million (€-71.6 million).<br />
In 2010, the Group expects to pay €53.0 million in contributions to defined benefit plans.<br />
Plan assets are comprised as follows, % of fair values of plan assets <strong>2009</strong> 2008<br />
Real estate 47.5% 39.7%<br />
Shares 23.2% 19.4%<br />
Long-term interest investments 19.3% 20.6%<br />
Short-term interest investments 7.9% 18.5%<br />
Other investments 2.1% 1.8%<br />
Total 100.0% 100.0%<br />
Plan assets, € million<br />
Kesko Corporation shares included in fair value<br />
Real estate leased and mostly subleased to retailers by<br />
104.3 93.5<br />
the Kesko Group 456.4 359.5<br />
Principal actuarial assumptions used: <strong>2009</strong> 2008<br />
Discount rate 5.25% 5.25%<br />
Expected return on plan assets 6.60% 6.60%<br />
Future salary increase assumption 3.50% 3.50%<br />
Inflation 2.00% 2.00%<br />
Expected average remaining service life 14–23 15–20<br />
When calculating the pension obligation of the Kesko Pension Fund's department B, the supplementary coefficient has been 1.5% for<br />
years 2010–2012, 1% for years 2013–2015, and 2.7% for 2016 and subsequent years.<br />
When calculating the Pension Fund's expected return, the invested assets are divided into five categories. The total expected<br />
returns on the investment portfolio (6.6%) is composed of the compound returns on these assets. The returns expected on different<br />
assets is based on the parameters of an investment portfolio analysis model widely used in employee pension schemes, and calculated<br />
from long-term historical data. The most significant type of assets affecting the total returns is shares, further divided into nine<br />
geographical subgroups with expected returns ranging between 8.5%-12.3%.<br />
NOTE 21<br />
Inventories<br />
€ million <strong>2009</strong> 2008<br />
Goods 662.3 864.2<br />
Prepayments 3.2 6.9<br />
Total 665.5 871.0<br />
At the end of the financial year,<br />
inventories have been written down to<br />
correspond to their net realisable value. 49.6 55.1<br />
NOTE 22<br />
Trade receivables and other current receivables<br />
€ million <strong>2009</strong> 2008<br />
Interest-bearing receivables<br />
Finance lease receivables 16.8 13.1<br />
Interest-bearing loan and other<br />
receivables 15.3 1.9<br />
Total interest-bearing receivables 32.1 14.9<br />
Trade receivabels<br />
Other non-interest-bearing receivables<br />
Non-interest-bearing loan and other<br />
593.6 633.1<br />
receivables 33.0 27.3<br />
Deferred revenue and other accruals<br />
Total other non-interest-bearing<br />
84.7 110.1<br />
receivables 117.6 137.4<br />
Total 743.3 785.5
A total amount of €12.6 million (€13.8 million) of trade receivables<br />
has been recognised within credit losses in the income<br />
statement. Credit risk is described in more detail in note 42.<br />
The deferred revenue and other accruals mainly include<br />
amortisations of marketing revenue, rebates and staff cost.<br />
The fair value of current trade and loan receivables, and the<br />
fair value of current interest-bearing receivables are estimated<br />
to nearly equal the carrying amounts based on their short<br />
maturities.<br />
NOTE 23<br />
Financial assets at fair value through profit or loss<br />
€ million <strong>2009</strong> 2008<br />
Financial assets at fair value through profit<br />
or loss 213.1 94.4<br />
Total 213.1 94.4<br />
The financial assets at fair value through profit or loss include<br />
commercial papers, certificates of bank deposits and other<br />
money market investments. An analysis of the assets is given in<br />
note 41.<br />
NOTE 24<br />
Available-for-sale financial assets<br />
€ million <strong>2009</strong> 2008<br />
Carrying amount at 1 Jan. 291.0 155.6<br />
Changes 139.0 133.2<br />
Changes in fair value -2.3 2.2<br />
Carrying amount at 31 Dec. 427.7 291.0<br />
The available-for-sale financial assets include short-term investments<br />
in commercial papers, certificates of bank deposits, other<br />
interest rate instruments and Finnish Government bonds. An<br />
analysis of the assets is given in note 41.<br />
NOTE 25<br />
Cash and cash equivalents<br />
Kesko financial statements <strong>2009</strong><br />
113<br />
€ million <strong>2009</strong> 2008<br />
Cash on hand and in banks 73.9 57.8<br />
Total 73.9 57.8<br />
NOTE 26<br />
Non-current assets classified as held for sale and<br />
related liabilities<br />
Assets held for sale<br />
€ million <strong>2009</strong> 2008<br />
Land 0.4 0.7<br />
Buildings and real estate shares 0.5 2.3<br />
Total 0.9 3.0<br />
The held-for-sale disposal group did not include liabilities at 31<br />
December <strong>2009</strong> (at 31 December 2008).
114 Kesko financial statements <strong>2009</strong><br />
NOTE 27<br />
Notes to shareholders' equity<br />
Changes in share capital<br />
Number of shares<br />
Share capital A B Total<br />
Share<br />
capital<br />
€ million<br />
Share<br />
premium<br />
€ million<br />
Total<br />
€ million<br />
1 Jan. 2008 195.5 190.4 385.9<br />
Exercise of share options - 57,089 57,089 0.1 0.2 0.3<br />
31 Dec. 2008 31,737,007 66,087,847 97,824,854 195.6 190.6 386.2<br />
Exercise of share options - 496,675 496,675 1.0 3.7 4.7<br />
31 Dec. <strong>2009</strong> 31,737,007 66,584,522 98,321,529 196.6 194.2 390.8<br />
Number of votes 317,370,070 66,584,522 383,954,592<br />
During the reporting period, the share capital was increased four times resulting from the exercise of the 2003 scheme options. The<br />
increases were made on 11 February <strong>2009</strong> (€52,392), 5 May <strong>2009</strong> (€51,250), 5 June <strong>2009</strong> (€673,146), and 17 December <strong>2009</strong><br />
(€216,562), and announced in stock exchange notifications on the same days. The subscribed shares were included on the main list of<br />
OMX Helsinki Exchanges for public trading with the old B shares on 12 February <strong>2009</strong>, 6 May <strong>2009</strong>, 6 June <strong>2009</strong>, and 18 December<br />
<strong>2009</strong>.<br />
All issued shares have been fully paid. The maximum number of A shares is 250 million and the maximum number of B shares is<br />
also 250 million, provided that the total number of shares is at maximum 400 million. One A share entitles the holder to 10 votes and<br />
one B share to 1 vote.<br />
An analysis of share-based payments is given in note 35.<br />
Dividends<br />
After the balance sheet date, the Board has proposed that €0.90 per share be distributed as dividends. A dividend of €1.00 per share<br />
was distributed on the profit for 2008.<br />
Equity and reserves<br />
Equity consists of share capital, share premium, other reserves, revaluation reserve, exchange differences and retained earnings. In<br />
addition, the portion of accumulated depreciation difference and optional provisions net of deferred tax liabilities are included in<br />
equity.<br />
Share premium<br />
The amount exceeding the par value of shares received by the enterprise in connection with share subscriptions is recorded in share<br />
premium in cases where share options were granted under the old Limited Liability Companies Act (29 Sept. 1978/734). Previously the<br />
share premium also included the entry matching the effect of share options, but the amount has been presented retrospectively in<br />
retained earnings (€9.9 million transferred from share premium to retained earnings on 1 Jan. 2008).<br />
Reserve of invested non-restricted equity<br />
The reserve of invested non-restricted equity includes other equity-related investments and share subscription prices to the extent<br />
that they are not expressly designated to be included in share capital. The payments received from the exercise of options of schemes<br />
under the new Limited Liability Companies Act (21 Jul. 2006/624, effective 1 Sept. 2006) are recorded in full in the reserve of invested<br />
non-restricted equity.<br />
Other reserves<br />
The other reserves have mainly been created and accumulated under the resolutions of the <strong>Annual</strong> General Meeting.<br />
Currency translation differences<br />
The currency translation differences arise from the translation of foreign operations' financial statements. Also the gains and losses<br />
arising from net investment hedges in foreign entities are included in currency translation differences, provided that hedge accounting<br />
requirements are fulfilled. The change in the reserve is stated within comprehensive income. Previously, the currency translation differences<br />
of retained earnings were included in retained earnings, but the amount has been retrospectively presented within currency<br />
translation differences (transfer of €0.7 million from retained earnings to currency translation differences on 1 Jan. 2008).
Kesko financial statements <strong>2009</strong><br />
Revaluation surplus<br />
The revaluation surplus includes the fair value change of available-for-sale financial instruments and the effective portion of fair value<br />
change based on hedge accounting applied to derivatives. The cash flow hedges include electricity derivatives and interest rate derivatives<br />
hedging the private placement bond interest. The changes in the reserve are stated within comprehensive income.<br />
Cash flow hedge result<br />
Hedge accounting is applied to hedging exposure to electricity price risk. As a result, the amount of €-5.0 million (€5.4 million) has<br />
been removed from equity and included in the income statement as a purchase cost adjustment, and €0.3 million (€-12.5 million)<br />
have been recognised in equity. Their combined effect on the revaluation surplus for the financial year was €5.3 million (€-17.9<br />
million) before accounting for deferred tas assets.<br />
A fair value change of €-9.1 million (€5.1 million) has been recognised in equity for the USD-denominated private placement<br />
arrangement and €-0.1 million (€-0.1 million) in the financial items of the income statement.<br />
NOTE 28<br />
Carrying amounts of financial assets and liabilities by measurement group<br />
At 31 Dec. <strong>2009</strong><br />
Balance sheet item, € million<br />
Financial assets/<br />
liabilities at fair<br />
value through<br />
profit or loss<br />
Loan Available-for-<br />
and sale financial<br />
receivables assets<br />
Financial<br />
liabilities at<br />
amortised cost<br />
Derivatives<br />
qualified for<br />
hedge<br />
accounting<br />
115<br />
Carrying<br />
amounts of<br />
balance<br />
sheet items Fair value<br />
Non-current financial assets<br />
Available-for-sale financial assets 3.0 3.0 3.0<br />
Non-current non-interest-bearing receivables 1.3 1.3 1.3<br />
- Derivatives 1.3 1.3 1.3<br />
Non-current interest-bearing receivables<br />
Current financial assets<br />
Trade receivables and other non-interest-<br />
64.9 64.9 64.9<br />
bearing receivables 709.6 709.6 709.6<br />
- Derivatives 1.5 0.2 1.7 1.7<br />
Interest-bearing receivables<br />
Financial assets at fair value through profit or<br />
32.1 32.1 32.1<br />
loss 213.1 213.1 213.1<br />
Available-for-sale financial assets 427.7 427.7 427.7<br />
Carrying amount by measurement group 214.6 807.9 430.7 1.5 1,454.7 1,454.7<br />
Non-current financial liabilities<br />
Non-current interest-bearing liabilities 244.9 244.9 267.4<br />
- Derivatives 17.1 17.1 17.4<br />
Total non-current interest-bearing liabilities 262.0 284.5<br />
Non-current non-interest-bearing liabilities 3.1 3.1 3.1<br />
- Derivatives<br />
Total non-current non-interest-bearing<br />
2.5 2.5 2.5<br />
liabilities<br />
Current financial liabilities<br />
5.7 5.7<br />
Current interest-bearing liabilities 194.2 194.2 194.2<br />
Trade payables 703.5 703.5 703.5<br />
Other non-interest-bearing liabilities 176.5 176.5 176.5<br />
- Derivatives 3.4 3.4 3.4<br />
Accrued liabilities 245.8 245.8 245.8<br />
- Derivatives 8.3 8.3 8.3<br />
Total accrued liabilities 254.1 254.1<br />
Carrying amount by measurement group 8.3 1,568.0 23.0 1,599.3 1,621.8
116 Kesko financial statements <strong>2009</strong><br />
At 31 Dec. 2008<br />
Balance sheet item, € million<br />
Financial assets/<br />
liabilities at fair<br />
value through<br />
profit or loss<br />
Loan and<br />
Available-forsale<br />
financial<br />
receivables assets<br />
Financial<br />
liabilities at<br />
amortised cost<br />
Derivatives<br />
qualified for<br />
hedge<br />
accounting<br />
Carrying<br />
amounts of<br />
balance<br />
sheet items Fair value<br />
Non-current financial assets<br />
Available-for-sale financial assets 3.0 3.0 3.0<br />
Non-current non-interest-bearing receivables 0.9 0.9 0.9<br />
- Derivatives 0.1 9.9 10.0 10.0<br />
Non-current interest-bearing receivables<br />
Current financial assets<br />
Trade receivables and other non-interest-bearing<br />
58.3 58.3 58.3<br />
receivables 755.6 755.6 755.6<br />
- Derivatives 10.2 2.1 2.6 14.9 14.9<br />
Interest-bearing receivables 14.9 14.9 14.9<br />
Financial assets at fair value through profit or loss 94.4 94.4 94.4<br />
Available-for-sale financial assets 291.0 291.0 291.0<br />
Carrying amount by measurement group 104.6 829.8 296.1 12.5 1,243.0 1,243.0<br />
Non-current financial liabilities<br />
Non-current interest-bearing liabilities 175.2 175.2 198.2<br />
- Derivatives 21.7 21.7 21.7<br />
Total non-current interest-bearing liabilities 196.9 219.9<br />
Non-current non-interest-bearing liabilities<br />
Current financial liabilities<br />
11.8 11.8 11.8<br />
Current interest-bearing liabilities 293.6 293.6 293.6<br />
Trade payables 755.6 755.6 755.6<br />
Other non-interest-bearing liabilities 181.6 181.6 181.6<br />
Accrued liabilities 237.9 237.9 237.9<br />
- Derivatives 4.1 3.5 7.6 7.6<br />
Total accrued liabilities 245.5 245.5<br />
Carrying amount by measurement group 4.1 1,655.7 25.2 1,685.0 1,708.0<br />
The fair values of loans have been calculated based on the present value of future cash flows using the 0.5%-4.0% market rates of<br />
interest at the balance sheet date. The fair value of current interest-bearing liabilities is estimated to nearly equal their carrying<br />
amount.<br />
The maturity schedule of non-current loans is presented in note 41.
NOTE 29<br />
Finance lease liabilities<br />
Kesko financial statements <strong>2009</strong><br />
€ million <strong>2009</strong> 2008<br />
The maturities of finance lease payments are as follows:<br />
No later than 1 year 20.9 27.2<br />
Later than 1 year and no later than 5 years 64.5 64.0<br />
Later than 5 years 10.9 14.1<br />
Total minimum lease payments 96.3 105.3<br />
Present value of minimum lease payments:<br />
No later than 1 year 17.3 22.6<br />
Later than 1 year and no later than 5 years 57.9 56.6<br />
Later than 5 years 10.5 13.4<br />
Total finance lease liabilities 85.7 92.7<br />
Accumulating financial expensess 10.6 12.6<br />
Contingent rents for the financial year 0.1 1.5<br />
Expected sublease rentals 61.5 64.4<br />
The finance lease receivables mainly consist of store fixtures leased by Kesko Food Ltd from finance companies and subleased to chain<br />
companies. In addition, the finance leases include real estate leases with lease payments tied to interest rate.<br />
NOTE 30<br />
Provisions<br />
€ million Onerous leases<br />
117<br />
Warranty<br />
provisions Other provisions Total<br />
Provisions at 1 Jan. <strong>2009</strong> 14.1 15.5 14.1 43.6<br />
Exchange differences 0.2 0.0 0.0 0.3<br />
Additional provisions 8.0 1.8 6.3 16.1<br />
Unused amounts reversed -5.1 -4.2 -1.0 -10.2<br />
Business arrangements -0.3<br />
Expensed in income statement 17.3 12.7 19.4 49.6<br />
Used amounts -2.6 -0.5 -2.7 -5.8<br />
Provisions at 31 Dec. <strong>2009</strong> 14.8 12.2 16.7 43.7<br />
Analysis of total provisions<br />
Non-current 5.9 5.0 3.6 14.5<br />
Current 8.8 7.3 13.1 29.2<br />
The provisions for onerous leases mainly relate to lease liabilities of premises vacated from the Group operations, and to net losses on<br />
rent of subleased premises. Warranty provisions have been recorded for vehicles and machines sold by the Group companies. The provision<br />
amount is based on experience from realised warranty obligations in previous years.
118 Kesko financial statements <strong>2009</strong><br />
NOTE 31<br />
Trade payables and other current<br />
non-interest-bearing liabilities<br />
€ million <strong>2009</strong> 2008<br />
Trade payables 703.5 755.6<br />
Other current non-interest-bearing<br />
liabilities 179.9 181.6<br />
Tax liabilities 37.0 2.9<br />
Accrued liabilities<br />
Total current non-interest-bearing<br />
217.1 245.5<br />
liabilities 1,137.5 1,185.7<br />
The accrued liabilities are mainly due to the timing of purchases<br />
and staff cost.<br />
NOTE 32<br />
Jointly controlled assets<br />
Jointly controlled assets<br />
(mutual real estate companies)<br />
These figures represent the Group's share of jointly controlled<br />
assets and liabilities and income and profit included in the<br />
consolidated statement of financial position and the income<br />
statement.<br />
€ million <strong>2009</strong> 2008<br />
Non-current assets 41.6 76.2<br />
Current assets 0.3 1.5<br />
41.9 77.8<br />
Non-current liabilities 7.0 9.8<br />
Current liabilities 19.3 32.8<br />
26.3 42.6<br />
Net assets 15.6 35.2<br />
Income 4.7 6.0<br />
Expenses 3.8 4.7<br />
Profit 0.9 1.3<br />
NOTE 33<br />
Contingent liabilities<br />
Commitments<br />
€ million<br />
Collateral given for own commitments<br />
<strong>2009</strong> 2008<br />
Pledges 91 40<br />
Mortgages 21 17<br />
Guarantees<br />
Other commitments and contingent<br />
23 18<br />
liabilities 77 50<br />
Collateral given for shareholders<br />
Guarantees 0 0<br />
Collateral given for others<br />
Other commitments and contingent<br />
liabilities 7 8<br />
Guarantees 0 0<br />
The guarantees given do not include guarantees related to items<br />
presented within liabilities in the consolidated statement of<br />
financial position or as a lease liability in note 34.<br />
NOTE 34<br />
Operating leases<br />
Group as the lessee<br />
Minimum lease payments under non-cancellable operating lease<br />
agreements:<br />
€ million <strong>2009</strong> 2008<br />
No later than 1 year 352.6 322.5<br />
Later than 1 year and no later than 5 years 1,071.5 955.0<br />
Later than 5 years 935.4 823.7<br />
Total 2,359.5 2,101.1<br />
Expected future minimum lease payments<br />
under non-cancellable sublease agreements 57.8 61.5<br />
Lease and sublease payments recognised<br />
for the financial year:<br />
Minimum lease payments 335.9 305.3<br />
Contingent rents 0.5 0.7<br />
Sublease income 26.3 21.8<br />
The <strong>2009</strong> income statement includes net rent and maintenance<br />
rent payments under operating leases, and other rents in a total<br />
amount of €383.1 million (€349.9 million). The maintenance<br />
rent payments are not included in the minimum lease payments.<br />
Kesko leases retail and logistics premises for its operating<br />
activities. Most of the leases are index-linked and in conformity<br />
with local market practice.
Group as the lessor<br />
Minimum lease payments received under non-cancellable operating lease<br />
agreements:<br />
€ million <strong>2009</strong> 2008<br />
No later than 1 year 8.6 8.8<br />
Later than 1 year and no later than 5 years 15.3 15.2<br />
Later than 5 years 13.6 13.1<br />
Total 37.5 37.1<br />
Aggregate contingent rents charged to the<br />
income statement - 0.1<br />
Kesko leases premises to entrepreneurs other than K-retailers in<br />
order that the total service offer of a store site support its profit<br />
generation potential. Such premises typically include so-called<br />
store entrance stores at large retail outlets.<br />
NOTE 35<br />
Share-based payment<br />
The Group operates option plans as part of the management's<br />
incentive and commitment arrangements. Each option gives its<br />
holder the right to subscribe for one Kesko Corporation B share at<br />
a price, and during the period, specified in the terms of the<br />
option scheme. The options are forfeit if the employee leaves the<br />
company before the end of the vesting period, unless, in an<br />
individual case, the Board decides that the option recipient may<br />
keep all or some of the options under offering obligation.<br />
Year 2003 option plan<br />
On 31 March 2003, the <strong>Annual</strong> General Meeting resolved to grant<br />
a total of 1,800,000 options with no consideration to the management<br />
of the Kesko Group as well as to a wholly-owned subsidiary<br />
of Kesko Corporation. A deviation was made from the<br />
shareholders' pre-emptive subscription rights, since the share<br />
options form a part of the incentive and commitment programme<br />
for the management. Each option entitles its holder to subscribe<br />
for one new Kesko Corporation B share. The options are marked<br />
with the symbols 2003D (KESBVEW103), 2003E (KESBVEW203) and<br />
2003F (KESBVEW303) in units of 600,000 options each. The share<br />
subscription periods of the options are:<br />
• 2003D 1 April 2005–30 April 2008<br />
(subscription period has expired)<br />
• 2003E 1 April 2006–30 April <strong>2009</strong><br />
(subscription period has expired) and<br />
• 2003F 1 April 2007–30 April 2010.<br />
The original exercise price per share of option 2003D was<br />
equal to the volume weighted average price of a Kesko Corporation<br />
B share on the Helsinki Stock Exchange between 1 April-30<br />
April 2003 (€9.63), that of option 2003E between 1 April-30<br />
April 2004 (€15.19) and that of option 2003F between 1 April-<br />
30 April 2005 (€19.08). From the share subscription price of<br />
share options shall, as per the dividend record date, be deducted<br />
the amount of the dividend decided after the beginning of the<br />
Kesko financial statements <strong>2009</strong><br />
119<br />
period for determination of the subscription price but before<br />
share subscription.<br />
After the distribution of dividends for the year 2007, the price<br />
of a B share subscribed for with option 2003D was €2.00. The<br />
subscription period expired on 30 April 2008, and a total of<br />
574,088 Kesko B shares were subscribed. 25,912 options<br />
remained ungranted and they expired. After the distribution of<br />
dividends for the year 2008, the price of a B share subscribed for<br />
with option 2003E was €7.99. The subscription period expired<br />
on 30 April <strong>2009</strong>, and a total of 576,000 Kesko B shares were<br />
subscribed. 24,000 options remained ungranted and they<br />
expired. After the distribution of dividends for the year 2008,<br />
the price of a B share subscribed for with option 2003F is<br />
€13.88, and the subscription period began on 1 April 2007.<br />
The option plan covers approximately 50 people. A total of<br />
1,800,000 new B shares can be subscribed for under this option<br />
plan, which can increase the company's share capital by a maximum<br />
of €3,600,000.<br />
Year 2007 option plan<br />
On 26 March 2007, the <strong>Annual</strong> General Meeting decided to grant<br />
a total of 3,000,000 stock options for no consideration to the<br />
management of the Kesko Group, other key personnel, and a<br />
subsidiary wholly owned by Kesko Corporation. The Company had<br />
a weighty financial reason for granting the options because they<br />
are intended to be part of <strong>Kesko's</strong> share-based incentive system.<br />
Each stock option entitles its holder to subscribe for one new<br />
Kesko Corporation B share. In addition, the option plan also<br />
includes an obligation to buy company shares for permanent<br />
ownership for the value of 25% of the proceeds from the sale of<br />
stock options. The options are marked with the symbols 2007A,<br />
2007B and 2007C in units of 1,000,000 options each. The share<br />
subscription periods of the options are:<br />
• 2007A 1 April 2010–30 April 2012<br />
• 2007B 1 April 2011–30 April 2013<br />
• 2007C 1 April 2012–30 April 2014.<br />
The original subscription price for stock option 2007A shall be the<br />
trade volume weighted average quotation of a Kesko Corporation<br />
B share on the Helsinki Stock Exchange between 1 April and 30<br />
April 2007 (€45.82), for stock option 2007B, between 1 April and<br />
30 April 2008 (€26.57), and for stock option 2007C, between<br />
1 April and 30 April <strong>2009</strong> (€16.84). The subscription prices of<br />
shares subscribed for with stock options shall be reduced by the<br />
amount decided after the beginning of the period for the determination<br />
of the subscription price but before the subscription, as<br />
at the record date for each distribution of profits or other assets.<br />
After the distribution of dividends for the year 2008, the price<br />
of a B share subscribed for with option 2007A was €43.22, with<br />
option 2007B €25.57, and with option 2007C €16.84. The subscription<br />
periods have not yet begun. The option plan covers<br />
approximately 130 people.<br />
Percentage of issued stock options<br />
out of all shares and votes<br />
If shares were subscribed for with all exercisable options, the<br />
shares subscribed for with all of the 2003 and 2007 plan options
120 Kesko financial statements <strong>2009</strong><br />
would account for 4.67% of shares and 1.23% of all votes. The<br />
subscriptions made with stock options could raise the number of<br />
the company's shares to 101,688,793. As a result of the subscriptions,<br />
the voting rights carried by all shares could increase to<br />
387,321,856 votes.<br />
STOCK OPTIONS DURING THE FINANCIAL YEAR 1 JANUARY–31 DECEMBER <strong>2009</strong><br />
Main terms and conditions of the plans 2003 STOCK OPTIONS 2007 STOCK OPTIONS<br />
Grant date 31 March 2003 26 March 2007<br />
Instrument stock option stock option<br />
Target group management management, other key personnel<br />
2003D 2003E 2003F 2007A 2007B 2007C<br />
Original number of options 600,000 600,000 600,000 1,000,000 1,000,000 1,000,000<br />
Number of shares per option 1 1 1 1 1 1<br />
Original exercise price per share 9.63 € 15.19 € 19.08 € 45.82 € 26.57 € 16.84 €<br />
Dividend adjustment Yes Yes Yes Yes Yes Yes<br />
Exercise price 31 Dec. 2006 4.53 € 12.09 € 17.98 € - - -<br />
Exercise price 31 Dec. 2007 3.03 € 10.59 € 16.48 € 45.82 € - -<br />
Exercise price 31 Dec. 2008 2.00 € 8.99 € 14.88 € 44.22 € 26.57 €<br />
Exercise price 31 Dec. <strong>2009</strong><br />
Fair value at grant date<br />
7.99 € 13.88 € 43.22 € 25.57 € 16.84 €<br />
17 Jul. 2007:2007A 50.25 €<br />
19 Sep. 2007: 2007A 45.02 €<br />
12 Dec. 2007:2007A 39.42 €<br />
29 May 2008:2007B 26.47 €<br />
27 May <strong>2009</strong>:2007C 20.12 €<br />
First allocation, date 1 Apr. 2005 1 Apr. 2006 1 Apr. 2007 1 Apr. 2010 1 Apr. 2011 1 Apr. 2012<br />
Expiry, date 30 Apr. 2008 30 Apr. <strong>2009</strong> 30 Apr. 2010 30 Apr. 2012 30 Apr. 2013 30 Apr. 2014<br />
Remaining vesting period, years expired expired 0.3 2.3 3.3 4.3<br />
Plan participants at end of financial year - - 32 116 124 128<br />
Movements in quantities and exercise prices <strong>2009</strong><br />
<strong>2009</strong> 2003D 2003E 2003F<br />
2003 STOCK OPTIONS 2007 STOCK OPTIONS<br />
Weighted<br />
average<br />
exercise<br />
price 2007A 2007B 2007C<br />
Weighted<br />
average<br />
exercise<br />
price<br />
Options outstanding at beginning of period 383,394 433,045 12.11 € 756,500 767,500 35.33 €<br />
Options available for grant at beginning of<br />
period 24,000 47,500 12.90 € 243,500 232,500 1,000,000 35.60 €<br />
Options granted during period 785,500 16.84 €<br />
Options forfeited during period 19,000 22,000 3,000 32.60 €<br />
Options exercised during period 383,394 113,281 9.33 €<br />
Options lapsed during period 24,000 7.99 €<br />
Options outstanding at end of period 319,764 13.88 € 737,500 745,500 782,500 28.30 €<br />
Options exercisable at end of period 367,264 13.88 € 1,000,000 1,000,000 1,000,000 28.54 €<br />
Average price weighted by grant date trading<br />
volume* 17.05 € 19.19 €<br />
The shares subscribed for with stock options entitle to dividends<br />
and carry other shareholder rights after the corresponding<br />
share capital increase has been entered in the Trade Register.<br />
The company has not granted other options or special rights<br />
entitling to shares.<br />
Kesko B share price at end of grant year<br />
2007 37.72 €<br />
2008 17.80 €<br />
<strong>2009</strong> 23.08 €<br />
* for 2003E: trade volume weighted average price of a B share in January-April <strong>2009</strong>, for 2003F: trade volume weighted average price of a B share in <strong>2009</strong>
Movements in quantities and exercise prices 2008<br />
2008 2003D 2003E 2003F<br />
Kesko financial statements <strong>2009</strong><br />
2003 STOCK OPTIONS 2007 STOCK OPTIONS<br />
Weighted<br />
average<br />
exercise<br />
price 2007A 2007B 2007C<br />
121<br />
Weighted<br />
average<br />
exercise<br />
price<br />
Options outstanding at beginning of period 33,150 406,133 434,245 13.23 € 786,000 45.82 €<br />
Options available for grant at beginning of<br />
period 25,912 24,000 47,500 11.45 € 214,000 1,000,000 1,000,000 45.82 €<br />
Options granted during period 776,000 26.57 €<br />
Options forfeited during period 29,500 8,500 40.27 €<br />
Options exercised during period 33,150 22,739 1,200 5.05 €<br />
Options lapsed during period 25,912 2.00 €<br />
Options outstanding at end of period 383,394 433,045 12.11 € 756,500 767,500 35.33 €<br />
Options exercisable at end of period 407,394 480,545 12.18 € 1,000,000 1,000,000 1,000,000 35.40 €<br />
Average price weighted by grant date<br />
trading volume* 30.87 € 23.61 € 23.61 €<br />
* for 2003D: trade volume weighted average price of a B share in January-April 2008, for 2003E and 2003F: trade volume weighted average price of a B share in 2008<br />
Fair value measurement<br />
For fair value measurement Kesko Corporation has consulted<br />
Alexander Corporate Finance Oy. The fair value of options has<br />
been calculated using the Black-Scholes share pricing model.<br />
The fair value of options determined on the date of the grant<br />
has been expensed over their vesting period.<br />
During the financial year 1 January-31 December <strong>2009</strong>, the<br />
options contributed €8.1 million (€5.5 million) to the Group's<br />
profit.<br />
Black-Scholes model assumptions<br />
€ million Granted in <strong>2009</strong> Granted in 2008 Granted in 2007 All options<br />
Number of options granted, pcs 785,500 776,000 789,000 2,350,500<br />
B share average (weighted) price 20.12 € 26.47 € 49.37 € 32.03 €<br />
Average (weighted) exercise price 16.84 € 26.57 € 45.82 € 29.78 €<br />
Expected average (weighted) volatility 32.0% 27.4% 21.7% 27.0%<br />
Average (weighted) vesting period 4.9 yrs 4.9 yrs 4.8 yrs 4.9 yrs<br />
Average (weighted) risk-free interest rate 3.0% 4.4% 4.5% 4.0%<br />
Returned options (weighted average) 0.4% 3.9% 6.1% 4.09%<br />
Total fair value, € 6,320,122 6,406,920 11,697,744 24,424.787<br />
The expected volatility of a Kesko B share has been estimated based on historic volatility using weekly changes over a period of time<br />
corresponding to the option's vesting period. The risk-free interest rate is the government zero coupon bond interest rate at the<br />
measurement date with a maturity equalling the option vesting period.
122 Kesko financial statements <strong>2009</strong><br />
Notes to the cash flow statement<br />
NOTE 36<br />
Non-cash flow related investments<br />
€ million <strong>2009</strong> 2008<br />
Total purchases of fixed assets, 198.0 339.6<br />
of which settlement in cash 222.6 319.9<br />
Settlement of prior period investments -16.6 -13.8<br />
Investments leased to customers -17.5 0.0<br />
Investments financed by finance lease or<br />
other borrowing 9.4 33.4<br />
NOTE 37<br />
Adjustments to cash flows<br />
from operating activities<br />
€ million <strong>2009</strong> 2008<br />
Adjustment of non-cash transactions in<br />
the income statement or items presented<br />
elsewhere in the cash flow statement:<br />
Change in provisions -0.8 6.9<br />
Income from associates -0.2 -1.9<br />
Impairment 14.4 61.1<br />
Credit losses<br />
Non-recurring gains on disposal of<br />
12.6 13.8<br />
fixed assets<br />
Non-recurring losses on disposal of<br />
-94.9 -181.9<br />
fixed assets 1.4 1.5<br />
Option expenses 8.1 5.6<br />
Defined benefit pensions -16.0 -43.4<br />
Others 1.4 8.2<br />
Total -74.0 -130.1<br />
NOTE 38<br />
Subsidiary disposals<br />
<strong>2009</strong><br />
• Real estate sold to a pension insurance company and the<br />
Kesko Pension Fund. Their aggregate contribution to the cash<br />
flow was €52.3 million.<br />
2008<br />
The aggregate cash flow contribution from subsidiary disposals<br />
was €121.3 million and it consisted of the following subsidiary<br />
disposals:<br />
• K-Rahoitus Oy, transaction completed on 31 January 2008<br />
• Tähti Optikko Group Oy, transaction completed on 31 March<br />
2008<br />
• Kauko-Telko Ltd, transaction completed on 30 April 2008<br />
• In addition the Kesko Group, the Kesko Pension Fund and<br />
Valluga-Sijoitus Oy sold 23 of their retail store properties in<br />
different parts of Finland to Aberdeen Property Fund<br />
Finland 1 Ky on 30 September 2008.<br />
NOTE 39<br />
Proceeds from available-for-sale financial assets<br />
<strong>2009</strong><br />
In <strong>2009</strong>, the proceeds from available-for-sale financial assets<br />
totalled €1.2 million.<br />
2008<br />
In <strong>2009</strong>, the proceeds from available-for-sale financial assets<br />
totalled €0.2 million.<br />
NOTE 40<br />
Cash and cash equivalents within<br />
the statement of cash flows<br />
Components of cash and cash equivalents in the statement of<br />
cash flows:<br />
€ million <strong>2009</strong> 2008<br />
Available-for-sale financial assets<br />
(maturing in less than 3 months) 417.5 261.5<br />
Cash and cash equivalents 73.9 57.8<br />
Total 491.4 319.3<br />
In the statement of cash flows, the components of cash and cash<br />
equivalents include those stated in the statement of financial<br />
position, assets and the portion of available-for-sale financial<br />
assets that mature in less than three months from acquisition.<br />
The available-for-sale financial assets in the statement of financial<br />
position (€427.7 million) also include bonds with longer<br />
maturities in the amount of €10.2 million.
NOTE 41<br />
Financial risk management<br />
With respect to financial risks, the Group observes a uniform<br />
funding policy that has been approved by the company Board of<br />
Directors. Compliance with this policy and developments in the<br />
Group's financial situation are monitored by the Board of Directors'<br />
Audit Committee. The Group's Treasury is centrally responsible<br />
for the Group funding, liquidity management, relations with<br />
providers of finance, and the management of financial risks. In<br />
the main, the Group's funding is arranged through the parent<br />
company, and the Group's Treasury arranges funding for subsidiaries<br />
in their functional currencies. For companies with significant<br />
external ownership, the Group has not guaranteed financial<br />
liabilities in excess of its ownership interest.<br />
Foreign exchange risks<br />
The Kesko Group operates in eight countries and makes purchases<br />
from numerous countries. As a result, the Group is exposed to<br />
various foreign exchange risks arising from net investments in<br />
foreign operations (translation-related risks), foreign currency<br />
assets, liabilities and forecast transactions (transaction risk).<br />
The Group companies' funding is arranged in their functional<br />
currencies. The parent company bears the ensuing foreign currency<br />
risk and hedges it by using derivatives or foreign currencydenominated<br />
loans. In the <strong>2009</strong> financial year, the hedging cost<br />
arising from subsidiary funding, in other words the interest rate<br />
differences between the euro and the hedged currencies, was<br />
€17.9 million (€4.6 million). These interest rate differences were<br />
5% p.a. on average in <strong>2009</strong>.<br />
Kesko financial statements <strong>2009</strong><br />
Group's currency translation position at 31 Dec. <strong>2009</strong><br />
€ million LVL NOK EEK SEK RUB LTL BYR<br />
Net investment 2.7 32.4 63.8 24.3 28.3 45.8 1.6<br />
Hedging derivatives 0.0 0.0 -44.7 -10.5 -19.2 -26.6 0.0<br />
Hedging loans -2.8 -18.8 0.0 0.0 0.0 0.0 0.0<br />
Open position -0.1 13.6 19.1 13.8 9.1 19.1 1.6<br />
Group's currency translation position at 31 Dec. 2008<br />
€ million LVL NOK EEK SEK RUB LTL BYR<br />
Net investment 2.0 38.6 62.9 2.0 25.1 37.5 1.9<br />
Hedging derivatives 0.0 0.0 -40.6 -1.4 -17.0 -31.9 0.0<br />
Hedging loans -4.9 -17.4 -15.7 0.0 0.0 0.0 0.0<br />
Open position -2.9 21.2 6.7 0.6 8.1 5.6 1.9<br />
The next table shows how a 10% change in the Group companies' functional currencies would affect the Group's equity. Sensitivity has been calculated from the<br />
net position, in other words, the effects of hedging derivative instruments or loans have been calculated in addition to the hedged exposure.<br />
Sensitivity analysis, effect on equity, at 31 Dec. <strong>2009</strong><br />
€ million LVL NOK EEK SEK RUB LTL BYR<br />
Change +/-10% 0.0 1.4 1.9 1.4 0.9 1.9 0.2<br />
Sensitivity analysis, effect on equity, at 31 Dec. 2008<br />
€ million LVL NOK EEK SEK RUB LTL BYR<br />
Change +/-10% -0.3 2.1 0.7 0.1 0.8 0.6 0.2<br />
123<br />
Translation risks<br />
The Group's balance sheet is exposed to currency translation risks<br />
relating to net investments in subsidiaries outside the euro area.<br />
This balance sheet exposure has been hedged by borrowings<br />
denominated in the relevant foreign currencies and forward<br />
exchange contracts. The most significant translation positions are<br />
in the Estonian kroon, Norwegian krone, Swedish krona, Russian<br />
ruble, Lithuanian litas and Latvian lat. The position does not<br />
include the non-controlling interest in equity. In proportion to<br />
the volume of operations and the balance sheet total, the foreign<br />
currency translation risk is small. The hedging percentage of the<br />
foreign currency translation exposure has been reduced further in<br />
2010.<br />
The functional currency of the real estate companies in St.<br />
Petersburg and Moscow in Russia has been determined to be the<br />
euro, which is why net investments in these companies are not<br />
exposed to foreign currency translation risk, and they are not<br />
included in the currency translation position.<br />
Transaction risks<br />
International purchasing activities and foreign currency denominated<br />
funding provided by the parent to subsidiaries expose the<br />
Group to transaction risks relating to several foreign currencies.<br />
The currency-specific transaction risk consists of receivables and<br />
liabilities denominated in foreign currencies in the balance<br />
sheet, forecast foreign currency cash flows, and foreign subsidiaries'<br />
liabilities and receivables with respect to the parent.<br />
The exposure is commercially managed by, e.g., transferring<br />
exchange rate changes to selling prices, or by replacing suppliers.<br />
The remaining positions are hedged by currency derivative
124 Kesko financial statements <strong>2009</strong><br />
instruments. The percentage of hedging in commercial transactions<br />
is decided by each relevant subsidiary within the limits of<br />
documented hedging policies. The subsidiaries report their currency<br />
exposures to the Group Treasury on a monthly basis.<br />
In the main, the subsidiaries carry out their hedging operations<br />
together with the Group Treasury, which hedges risk positions<br />
by using market transactions within the limits confirmed<br />
for each currency. Intra-Group derivatives are allocated to the<br />
segments in segment reporting.<br />
The Group does not apply hedge accounting in accordance<br />
with IAS 39 to the hedging of currency risks relating to purchases<br />
and sales. In initial measurement, derivative instruments are<br />
recognised at cost and at subsequent measurement they are recognised<br />
at fair value. The value changes of currency derivatives<br />
used to hedge purchases and sales are recognised in 'Other operating<br />
income or expenses'.<br />
Kesko Corporation's USD-denominated private placement loan<br />
has been hedged against currency risk and interest rate risk by<br />
applying hedge accounting. Currency and interest rate swaps to<br />
the same amount and with the same maturity as the loan have<br />
been designated as the hedging instruments. Consequently, the<br />
loan is entirely hedged against currency and interest rate risk.<br />
During the period, no amount of ineffectiveness has been recognised<br />
in the income statement relating to this credit facility.<br />
Loan interest rate risk and sensitivity analysis<br />
Interest rate movements affect the Group's interest expense. The<br />
interest rate hedging policy is aimed at equalising the effects of<br />
interest rate movements on the profits for different accounting<br />
periods.<br />
Interest rate risks are centrally managed by the Group Treasury,<br />
which adjusts loan duration by interest rate derivative<br />
instruments. The target duration is three years which is allowed<br />
to vary between one and a half and four years. The realised<br />
duration during the period was 3.5 (3.2) years on average.<br />
A sensitivity analysis for commercial paper liabilities realised<br />
during the period used average balance values. At the balance<br />
sheet date of 31 December <strong>2009</strong>, the effect of interest-bearing<br />
variable rate liabilities on pre-tax profit would have been<br />
€-/+3.3 million, if the interest rate level had risen or fallen by<br />
1 percentage point (€-/+3.8 million).<br />
Liabilities to K-retailers consist of two types of interest-<br />
bearing receivables payable by the Kesko Group companies to<br />
K-retailers; retailers' prepayments to Kesko, and retailers' chain<br />
rebates. Chain rebates are subsequent discounts granted to<br />
retailers and their terms vary from one store chain to another.<br />
Private placement bonds and the aggregate amount of<br />
€170.6 million in loans from financial institutions have fixed<br />
rates, and the effective interest cost was 4.8%. At the end of the<br />
year, the average rate of variable-interest-rate loans from<br />
financial institutions, liabilities to retailers and other interestbearing<br />
liabilities was 7.7%. Some of the loans are eurodenominated,<br />
private placement bonds are USD-denominated,<br />
and loans from financial institutions and commercial paper liabilities<br />
include NOK-denominated loans corresponding to €24.1<br />
million (€20.5 million) and LVL-denominated loans corresponding<br />
to €21.1 million (€29.8 million).<br />
Group's transaction position at 31 Dec. <strong>2009</strong><br />
€ million USD SEK NOK EEK LVL LTL RUB BYR<br />
Group's transaction risk -4.5 69.7 43.5 -23.9 39.8 -20.4 32.1 -2.3<br />
Hedging derivatives 10.1 -68.9 -37.8 25.8 -13.5 -3.8 -38.8 0.0<br />
Hedging loans 0.0 0.0 -5.3 0.0 -18.3 0.0 0.0 0.0<br />
Open position 5.6 0.8 0.4 1.9 7.9 -24.2 -6.7 -2.3<br />
A sensitivity analysis of the transaction position shows how a 10% exchange rate change in receivables and liabilities denominated in<br />
foreign currencies would affect the Group's profit. The calculation does not include forecast future currency-denominated cash flows,<br />
but the currency derivatives used to hedge these exposures are included in the analysis.<br />
Sensitivity analysis, effect on pre-tax profit at 31 Dec. <strong>2009</strong><br />
€ million USD SEK NOK EEK LVL LTL RUB BYR<br />
Change +/-10% 0.6 0.1 0.0 0.2 0.8 -2.4 -0.7 -0.2
Liquidity risk and sensitivity analysis for interestbearing<br />
receivables<br />
Liquidity risk management aims at maintaining sufficient liquid<br />
assets and credit lines in order to guarantee the availability of<br />
sufficient funding for the Group's business activities at all times.<br />
The aim is to invest liquidity consisting of financial assets in<br />
the money market by using efficient combinations of return and<br />
risk. At regular intervals, the Group's management approves the<br />
instruments and limits for each investment among those ana-<br />
Undiscounted cash flows from financial liabilities and related financial expenses at 31 Dec. <strong>2009</strong><br />
Kesko financial statements <strong>2009</strong><br />
125<br />
lysed by the Group Treasury. The risks and actual returns of<br />
investments are monitored regularly.<br />
A sensitivity analysis for variable-rate receivables uses average<br />
annual balance values of invested assets. The receivables include<br />
customer financing receivables, finance lease receivables, other<br />
interest-bearing receivables, and within investments, commercial<br />
papers and bond funds. The sensitivity of bond funds has<br />
been determined based on duration. At the balance sheet date,<br />
the effect of these items on the pre-tax profit would have been<br />
€+/-4.0 million (€+/-4.4 million), and +/-€1.5 million on<br />
€ million 2010 2011 2012 2013 2014 2015-<br />
Loans from financial institutions 8.2 1.2 17.8 0.9 0.7 26.7<br />
Financial expenses 4.6 3.4 2.2 1.1 1.1 1.3<br />
Private placement bonds (USD) 41.6 41.6<br />
Financial expenses 5.2 5.2 5.2 5.2 3.9 7.2<br />
Pension loans 2.9 5.8 5.8 5.8 26.3<br />
Financial expenses 1.9 1.9 1.7 1.4 1.2 2.6<br />
Finance lease liabilities 17.3 23.4 10.8 10.5 13.3 10.5<br />
Financial expenses 3.6 1.9 1.6 1.5 1.5 0.4<br />
Liabilities to K-retailers 109.7<br />
Financial expenses 0.5<br />
Other interest-bearing liabilities 56.6<br />
Financial expenses<br />
Commercial papers<br />
Financial expenses<br />
0.1<br />
Non-current non-interest-bearing liabilities<br />
Current non-interest-bearing liabilities<br />
0.0 0.0 0.0<br />
Trade payables 703.5<br />
Accruals and deferred income 245.0<br />
Other non-interest-bearing liabilities 161.6<br />
Undiscounted cash flows from financial liabilities and related financial expenses at 31 Dec. 2008<br />
€ million <strong>2009</strong> 2010 2011 2012 2013 2014-<br />
Loans from financial institutions 20.0 0.8 1.0 0.8 0.7 23.6<br />
Financial expenses 2.6 1.2 1.2 1.1 1.1 2.4<br />
Private placement bonds (USD) 0.0 0.0 86.2<br />
Financial expenses<br />
Pension loans<br />
Financial expenses<br />
5.4 5.4 5.4 5.4 5.4 11.5<br />
Finance lease liabilities 22.7 11.8 23.4 10.8 10.6 13.4<br />
Financial expenses 4.5 2.5 1.8 1.5 1.5 0.7<br />
Liabilities to K-retailers 114.1<br />
Financial expenses 4.9<br />
Other interest-bearing liabilities 83.4<br />
Financial expenses 0.6<br />
Commercial papers 47.7<br />
Financial expenses 4.0<br />
Non-current non-interest-bearing liabilities<br />
Current non-interest-bearing liabilities<br />
0.1 0.0<br />
Trade payables 755.6<br />
Accruals and deferred income 241.5<br />
Other non-interest-bearing liabilities 165.7
126 Kesko financial statements <strong>2009</strong><br />
equity, if the interest rate level had changed by +/-1 percentage<br />
point.<br />
At the balance sheet date, the counter value of undrawn committed<br />
long-term credit facilities was €227 million (€225 million).<br />
The committed credit limits mature at the end of 2010,<br />
2011 and 2012. In addition, the Group's uncommitted credit<br />
lines available contain commercial paper programmes denominated<br />
in euros to a total counter value of €329 million (€449<br />
million).<br />
The terms and conditions of the private placement credit<br />
facility and the committed limit include ordinary financial cov-<br />
Undiscounted cash flows from derivative instruments at 31 Dec. <strong>2009</strong><br />
€ million<br />
Payables<br />
2010 2011 2012 2013 2014 2015-<br />
Foreign currency hedge forward contracts of net investment<br />
Foreign currency forward contracts outside hedge<br />
141.8<br />
accounting<br />
Net settlement of payables<br />
296.4<br />
Interest rate derivatives 0.3 0.2 0.1 0.0 0.0<br />
Electricity derivatives<br />
Grain derivatives<br />
Derivatives relating to private placement bonds*<br />
3.1 2.1 0.6 0.2 0.0<br />
Foreign currency derivatives<br />
Receivables<br />
1.1 1.1 1.1 1.1 9.4 10.0<br />
Net investment hedging instruments<br />
Foreign currency forward contracts outside hedge<br />
138.0<br />
accounting<br />
Net settlement of receivables<br />
Interest rate derivatives<br />
293.4<br />
Electricity derivatives<br />
Grain derivatives<br />
Derivatives relating to private placement bonds*<br />
0.2 0.4 0.3 0.0 0.0<br />
Interest rate derivatives 0.9 0.9 0.9 0.9 0.7 1.2<br />
Undiscounted cash flows from derivative instruments at 31 Dec. 2008<br />
enants. The requirements of these covenants have been met. The<br />
loan terms included a financial covenant concerning the relation<br />
between the net debt and the amount of EBITDA, which<br />
remained well under the limit throughout the accounting period.<br />
The debt to K-retailers consist of two types of interest-bearing<br />
receivables payable by the Kesko Group companies to K-retailers:<br />
retailers' prepayments to Kesko and retailers' chain rebates.<br />
Chain rebates are subsequent discounts given to retailers and the<br />
terms vary from one chain to another. The private placement<br />
bonds include the fair value change of currency derivative instruments.<br />
€ million<br />
Payables<br />
<strong>2009</strong> 2010 2011 2012 2013 2014-<br />
Foreign currency hedge forward contracts of net investment<br />
Foreign currency forward contracts outside hedge<br />
89.6<br />
accounting<br />
Net settlement of payables<br />
Interest rate derivatives<br />
239.8<br />
Electricity derivatives 3.0 4.4 3.0 0.8 0.1 0.0<br />
Grain derivatives<br />
Derivatives relating to private placement bonds*<br />
0.0<br />
Foreign currency derivatives<br />
Receivables<br />
0.9 0.9 0.9 0.9 0.9 16.1<br />
Net investment hedging instruments<br />
Foreign currency forward contracts outside hedge<br />
91.3<br />
accounting<br />
Net settlement of receivables<br />
244.7<br />
Interest rate derivatives 0.0 0.0 0.0 0.0<br />
Electricity derivatives 0.0<br />
Grain derivatives 0.0<br />
Derivatives relating to private placement bonds* 0.0<br />
Interest rate derivatives 0.9 0.9 0.9 0.9 0.9 1.9<br />
* The cash flows of private placement bonds and related foreign currency and interest rate derivatives are settled on a net basis.
Kesko financial statements <strong>2009</strong><br />
Breakdown of liability maturities <strong>2009</strong><br />
€ million 31 Dec <strong>2009</strong> Available Total 2010 2011 2012 2013<br />
2014<br />
and later<br />
Loans from financial institutions 55.3 55.3 8.2 1.2 17.8 0.9 27.3<br />
Private placement bonds 100.0 100.0 100.0<br />
Pension loans 46.4 46.4 2.9 5.8 5.8 31.8<br />
Finance lease liabilities 85.7 85.7 17.3 23.4 10.8 10.5 23.8<br />
Liabilities to K-retailers 109.7 109.7 109.7<br />
Other interest-bearing liabilities 56.6 56.6 56.6<br />
Trade payables 703.6 703.6 703.5 0.0<br />
Accrued liabilities<br />
Other non-interest-bearing<br />
254.1 254.1 254.1<br />
liabilities 185.5 185.5 179.9 3.0 1.5 1.1 0.0<br />
Binding credit limits * 225.0 227.0 76.0 0.9 150.0<br />
Commercial papers 0.0 329.0 329.0<br />
Guarantees 23.3 23.3 0.2 1.5 0.0 0.0 21.6<br />
Total 1,620.3 554.0 2,176.2 1,405.5 33.0 185.9 18.3 204.6<br />
* The amount withdrawn from binding credit limits is included in loans from financial institutions.<br />
The financial guarantees given do not include guarantees relating to an item presented as a liability in the consolidated statement of<br />
financial position, or as a lease liability in note 34.<br />
Breakdown of liability maturities 2008<br />
€ million 31 Dec 2008 Available Total <strong>2009</strong> 2010 2011 2012<br />
2013<br />
and later<br />
Loans from financial institutions 47.1 47.1 20.2 0.8 1.0 0.8 24.3<br />
Private placement bonds 100.0 100.0 100.0<br />
Pension loans 0.0 0.0<br />
Finance lease liabilities 92.7 92.7 22.7 11.8 23.4 10.8 24.0<br />
Liabilities to K-retailers 114.1 114.1 114.1<br />
Other interest-bearing liabilities 88.9 88.9 88.9<br />
Trade payables 755.6 755.6 755.6<br />
Accrued liabilities<br />
Other non-interest-bearing<br />
245.5 245.5 245.5<br />
liabilities 196.3 196.3 184.5 11.8<br />
Binding credit limits * 246.5 247.7 75.0 21.5 150.0<br />
Commercial papers 47.7 401.3 449.0 47.7<br />
Total 1,687.9 647.8 2,336.9 723.6 99.4 45.9 161.6 148.3<br />
* The amount withdrawn from binding credit limits is included in loans from financial institutions.<br />
Fair value measurement levels for financial assets and liabilities<br />
Fair value at 31 Dec. <strong>2009</strong><br />
€ million Level 1 Level 2 Level 3 Total<br />
Financial assets at fair value through profit or loss<br />
Bank certificates of deposit and deposits 202.9 202.9<br />
Bond funds 10.1 10.1<br />
Total 10.1 202.9 213.1<br />
Derivative instruments at fair value<br />
Derivative receivables 3.5 3.5<br />
Derivative liabilities 31.9 31.9<br />
Available-for-sale financial assets<br />
Commercial papers (maturing in less than 3 months) 214.1 214.1<br />
Bank certificates of deposit and deposits (maturing in less than 3 months) 3.8 199.6 203.4<br />
Bonds 10.2 10.2<br />
Total 14.0 413.7 427.7<br />
127
128 Kesko financial statements <strong>2009</strong><br />
Financial assets and liabilities at fair value<br />
through profit or loss<br />
The Group's liquid assets have mainly been invested in the debt<br />
instruments of major Finnish companies, in certificates of deposit<br />
and in deposits in banks operating in <strong>Kesko's</strong> market area, in<br />
Finnish and Swedish government bonds, and in the bonds of<br />
selected companies. The return on these investments for <strong>2009</strong><br />
was 2.2% (4.9%). The maximum credit risk is the fair value of<br />
these investments in the balance sheet at the balance sheet date<br />
as presented below. The classification is based on the measurement<br />
hierarchy required by IFRS 7: level 1 instruments are traded<br />
in active markets and their fair values are the quoted prices. The<br />
fair values of level 2 instruments are derived from market data,<br />
but these instruments are not so actively traded. The fair values<br />
of level 3 instruments are partly based on measurement parameters<br />
that require management's judgement.<br />
Credit and counterparty risk<br />
The business companies of the Group's divisions are responsible<br />
for the management of the credit risk associated with trade<br />
receivables. The company has a credit policy and compliance<br />
with it is monitored. The aim is to secure the payment of receivables<br />
by carefully assessing customers' creditworthiness, by<br />
reviewing customer credit terms and collateral requirements, by<br />
effective credit control and credit insurances as applicable. In<br />
Finland, the main part of the Group's business activities is carried<br />
out in cooperation with retailers. According to the retailer<br />
agreements, retailers lodge bank overdrafts as collateral against<br />
their trade payables to the relevant Kesko subsidiaries.<br />
Group companies apply a uniform practice to measuring past<br />
due receivables. A receivable is written down when there is<br />
objective evidence of impairment. The ageing analysis of trade<br />
receivables at 31 December is as follows:<br />
Ageing analysis of trade receivables<br />
€ million <strong>2009</strong> 2008<br />
Trade receivables fully performing 550.0 567.7<br />
1–7 days past due 14.5 18.4<br />
8–30 days past due 9.2 20.0<br />
31–60 days past due 4.8 6.8<br />
Over 60 days past due 15.1 20.2<br />
Total 593.6 633.1<br />
Of trade receivables, €319.5 million (€298.1 million) were from<br />
chain retailers and €38.0 million (€21.4 million) were credit card<br />
receivables. The collateral for chain retailer receivables is an<br />
overdraft facility granted by a Kesko associate, Vähittäiskaupan<br />
Takaus Oy, with the maximum always limited to the realisation<br />
value of the counter collateral given by the K-retail company and<br />
entrepreneur to Vähittäiskaupan Takaus. At the end of the year,<br />
the aggregate value of the counterparty collateral was €164.1<br />
million. In addition, the collateral for receivables includes other<br />
collateral, such as business mortgages and other pledged assets.<br />
The trade receivable impairments were €19.9 million. An<br />
amount of €12.6 million in credit losses and impairments has<br />
been recognised in the net profit for the period.<br />
The amount of receivables with renegotiated terms amounted<br />
to €13.0 million at 31 December <strong>2009</strong>.<br />
Financial credit risk<br />
Financial instruments involve the risk of counterparties failing to<br />
settle their obligations. Kesko only makes currency and other<br />
derivative contracts with banks that have good creditworthiness.<br />
Liquid funds are invested annually, within the limits confirmed<br />
for each counterparty, in instruments with good creditworthiness.<br />
Company and bank-specific limits in terms of euros and<br />
time are set for interest investments. These limits are reviewed<br />
during the year depending on the market situation.<br />
Borrowing agreements at change of control<br />
(over 50% interest)<br />
According to the terms of Kesko Corporation's USD-denominated<br />
private placement loan, in a situation involving a change of control,<br />
Kesko is obligated to offer a repayment of the whole loan<br />
capital to all noteholders. The noteholders have the right to<br />
accept or refuse the repayment.<br />
According to the terms of Kesko Corporation's syndicated loan,<br />
the syndicate has the right to call in the loan and any withdrawn<br />
loan amounts.<br />
According to the terms of either loan agreement, a transfer<br />
of ownership to retailers or a retailers' association shall not be<br />
considered a change of control.<br />
Credit ratings<br />
For the present, Kesko Corporation has not applied for a credit<br />
rating, because it has not been considered necessary in the<br />
company's present financial situation.<br />
Commodity risks and their sensitivity analysis<br />
The Group uses electricity derivatives to level out energy costs.<br />
The electricity price risk is evaluated for five-year periods. The<br />
value changes of derivatives hedging the price of electricity supplied<br />
during the period are recognised within the adjustment<br />
items of purchases. Hedge accounting is applied to contracts<br />
hedging future purchases. The effective portion of derivatives<br />
that meet hedge accounting criteria are recognised in the revaluation<br />
reserve of equity and the ineffective portion in the income<br />
statement within other operating income or expenses. The<br />
change in the revaluation reserve recognised in equity is presented<br />
in the statement of comprehensive income under<br />
'Revaluation of cash flow hedge'.<br />
At the end of the year, the ineffective portion of hedge<br />
accounting was €-0.4 million (€-0.9 million).<br />
At the balance sheet date, a total quantity of 955,344 MWH<br />
(1,174,056 MWH) of electricity had been purchased with electricity<br />
derivatives, and the 1–12 month hedging rate was 70.2%<br />
(75.4%), the 13–24 month rate was 47.3% (62.3%), the 25–36<br />
month rate was 29.6% (34.1%), the 37–48 month rate was<br />
9.6% (12.6%) and the 49–60 month rate was 0.0% (9.6%).<br />
A sensitivity analysis for electricity derivatives assumes that<br />
derivatives maturing in less than 12 months have an impact on<br />
profit. If the market price of electricity derivatives changed by<br />
+/-20 percentage points from the balance sheet date 31 December<br />
<strong>2009</strong>, it would contribute €+/-3.4 million (€+/-3.5 million)<br />
to the 2010 profit and €+/-4.4 million (€+/-5.3 million) to<br />
equity. The impact has been calculated before tax.
Fair values of derivative financial instruments<br />
€ million<br />
Kesko financial statements <strong>2009</strong><br />
129<br />
31 Dec. <strong>2009</strong> 31 Dec. <strong>2009</strong> 31 Dec. <strong>2009</strong> 31 Dec. 2008<br />
Positive fair value<br />
(balance sheet value)<br />
Negative fair value<br />
(balance sheet value) Net fair value Net fair value<br />
Interest rate derivatives 0.7** -0.1 0.6 9.9<br />
Currency forwards 1.9*/** -25.9*/** -24.0 -7.6<br />
Electricity derivatives 0.9 -5.9 -5.0 -10.8<br />
Grain derivatives 0.0 0.0 0.0 0.0<br />
Nominal values of derivative financial instruments<br />
31.12.<strong>2009</strong> 31.12.2008<br />
€ million Nominal amount Nominal amount<br />
Interest rate derivatives 206.7** 204.9<br />
Currency forwards 541.7*/** 433.0<br />
Electricity derivatives 40.1 45.9<br />
Grain derivatives 0.0 0.7<br />
*) Derivative financial instruments also include currency forwards used to hedge net investments in stand-alone foreign entities, with a fair value of €0.0 million<br />
(€1.6 million) and a nominal value of €101.2 million (€90.8 million).<br />
**) Derivative financial instruments include interest rate swaps relating to a currency-denominated loan arrangement with a nominal gross value of €200.8<br />
million and a fair value of €0.6 million (€9.9 million), and currency swaps with a nominal value of €100.4 million and a fair value of €-17.2 million<br />
(€-14.2 million).<br />
The maximum credit risk of derivatives is the fair value of the balance sheet at the reporting date.<br />
The Group's agricultural trade operations use a minor amount<br />
of grain derivatives to hedge against grain price risk. At the<br />
balance sheet date, there were no open grain derivatives.<br />
Capital structure management<br />
Due to the global financial crisis and the consequent weakening<br />
of the real economy, the importance of capital structure management<br />
was increasingly emphasized in 2008, and the situation<br />
was not completely restored to normal during <strong>2009</strong>. The Kesko<br />
Group's capital management objectives include targets set for the<br />
Group's solvency and liquidity, as well as its capital productivity.<br />
The objectives for the Group's solvency and liquidity are set<br />
with the purpose of securing the Group's liquidity in all market<br />
situations, enabling the implementation of investment programmes<br />
based on the Group's strategy, and maintaining the<br />
shareholder value. Objectives have been set for the financial<br />
indicators 'equity ratio' and 'interest-bearing net debt/EBITDA'.<br />
The calculation formulas for these indicators are presented in the<br />
report by the Board. Some of the Group's interest-bearing liabilities<br />
include covenants, whose terms and conditions have been<br />
taken into account in the above target levels. The Group does not<br />
have a credit rating given by any external credit rating institution.<br />
The purpose of setting objectives for the Group's capital productivity<br />
is to steer the operating activities in increasing shareholder<br />
value on a long-term basis. The objectives for capital productivity<br />
have been set for the Group's equity and capital<br />
employed. The calculation formulas for the indicators 'return on<br />
equity' and 'return on capital employed' are presented in the<br />
report by the Board of Directors. The Group's capital structure<br />
(equity-to-debt ratio) is only optimised at the Group level, which<br />
is why at the lower levels of the organisation, i.e. in the divisions<br />
and companies, the targets relating to capital productivity have<br />
been set for the indicators 'economic value added' and 'return<br />
on capital employed'.<br />
Economic value added formula:<br />
Operating profit excluding non-recurring items<br />
- operational taxes<br />
- return requirement for average capital employed<br />
+/- other adjustment items<br />
The above target levels set for the Group's financial indicators<br />
are approved by the Board of Directors. On 4 February <strong>2009</strong>, the<br />
Board approved the following values for the Group's medium<br />
term objective.<br />
Target level<br />
Return on equity 12%<br />
Return on capital employed 14%<br />
Equity ratio 40–50%<br />
Interest-bearing net debt /EBITDA < 3<br />
Dividend policy<br />
Kesko Corporation distributes at least 50% of its earnings per<br />
share excluding non-recurring items as dividends, taking however<br />
the company's financial position and operating strategy into<br />
account.<br />
NOTE 42<br />
Risk management<br />
The Kesko Group has established a risk management process,<br />
based on the risk management policy confirmed by the Board.<br />
The divisions have made risk assessments and updated them in<br />
accordance with the strategy process and the rolling planning<br />
framework. The divisions' risks and their management responses<br />
have been discussed by the division parent companies' and the<br />
Group's management. In their respective responsibility areas, the
130 Kesko financial statements <strong>2009</strong><br />
Group units have assessed the risks threatening the Group's<br />
objectives and the management of such risks.<br />
On the basis of the divisions' and Group units' risk analyses,<br />
the corporate risk management function has prepared summaries<br />
of major risks and their management on a quarterly basis. The<br />
resulting risk report has been handled by Kesko Corporation's<br />
Board of Directors' Audit Committee. The main risks and uncertainties,<br />
and changes in the risk situation compared with the<br />
previous financial statements have been reported in the interim<br />
financial reports. The following is a description of the risks and<br />
uncertainties assessed to be significant.<br />
Strategic risks<br />
Developments in the economic situation<br />
The general economic development continues to involve significant<br />
uncertainties. Developments in the employment situation,<br />
tax increases resulting from the debt burden of the public sector,<br />
and consumers' confidence in the future have an essential<br />
impact on consumers' purchasing power, consumer demand and<br />
businesses' investment readiness.<br />
Kesko has adjusted its operations to meet the lower demand<br />
by a more efficient use of capital, and by adjusting the number<br />
of employees and costs. A prolonged or deeper economic recession<br />
would necessitate further adjustments.<br />
Competitiveness of store concepts<br />
The achievement of objectives requires efficient store concepts<br />
which are attractive to customers. In the chain business model, a<br />
competitive edge is gained by store concepts and brands that are<br />
based on customer needs and differentiated from the competition,<br />
coupled with efficient, high-quality concept implementations.<br />
Customer satisfaction and brand surveys, and competitor<br />
monitoring are used to find out customer needs and market<br />
changes. Changing customer needs are satisfied and competitiveness<br />
is reinforced by developing concepts and operating systems,<br />
and by reforming brands. High-quality concept implementation<br />
is ensured throughout the chain by strict chain control and<br />
regular concept measurements.<br />
International growth<br />
Kesko aims to achieve growth also through international expansion<br />
in selected business areas. Failures in these projects may put<br />
growth and profitability at risk. In the present economic situation,<br />
all risks involved in investments are thoroughly assessed.<br />
On the other hand, it may be possible to complete acquisitions of<br />
businesses and store sites more easily and on better terms.<br />
In international operations, uniform operating practices and<br />
processes are a prerequisite for improved efficiencies and synergy<br />
benefits. In <strong>Kesko's</strong> international operations, category management<br />
and purchasing and sourcing are steered in a centralised<br />
manner, and a supporting shared information system is being<br />
implemented.<br />
Expansion and operations in Russia involve both opportunities<br />
and risks. The unpredictability of officials and sudden<br />
changes in the interpretation and application of laws may complicate<br />
operating activities or delay expansion in Russia. This risk<br />
is managed by training personnel, and by developing operating<br />
systems and controls, and by providing guidelines.<br />
Leveraging technology<br />
<strong>Kesko's</strong> challenge is to combine the possibilities of online trading,<br />
electronic customer communication and the retailer business<br />
model into an efficient system. Kesko develops electronic customer<br />
communications and the chains' online store sites in order<br />
to improve customer satisfaction and increase sales.<br />
The automation of financial administration routines may be<br />
delayed by suppliers' and retailers' technical facilities and abilities<br />
to adopt new operating systems. Kesko is implementing a<br />
shared service centre project for the purpose of improving costefficiency<br />
and the uniformity of financial administration practices.<br />
Kesko is carrying out several significant information system<br />
projects. Insufficient resources and poor project management<br />
involve a risk that the expected benefits will be delayed or that<br />
the project costs will be exceeded. Strict control by the division's<br />
management, skilled project management and competent<br />
people are necessary for the success of these projects.<br />
Financial risks<br />
Credit loss risk<br />
As a result of the recession, B2B customers and retailers increasingly<br />
experience economic and financial difficulties, which<br />
involve a risk of growing credit losses. Division parent companies<br />
are responsible for managing credit risks related to receivables<br />
from customers. The companies have established a credit policy,<br />
whose implementation is monitored. The aim is to ensure the<br />
payment of receivables by carefully assessing customers' creditworthiness,<br />
by specifying the terms of customer credits and collateral<br />
requirements, and by efficient credit control and credit<br />
insurances where applicable.<br />
Risk of devaluation in the Baltic countries<br />
Finland is <strong>Kesko's</strong> only operating country that belongs to the euro<br />
area. International expansion has increased currency risks, and<br />
the Baltic currencies, the Latvian lats in particular, are at risk of<br />
being devalued. Hedging against currency exchange fluctuations<br />
is made more difficult by hedging costs that, in some cases, have<br />
become excessively high. The management of the Group's currency<br />
risks is centralised in the Group Treasury.<br />
Other financial risks<br />
These and other financial risks (incl. counterparty risk, liquidity<br />
risk, exchange rate risk in purchasing operations, interest rate risk<br />
and commodity risk related to electricity forward exchanges) are<br />
described in more detail in note 41 to Kesko Corporations' <strong>2009</strong><br />
financial statements.<br />
Operational risks<br />
Business interruptions and<br />
information system failures<br />
The trading sector is characterised by increasingly complicated<br />
and long supply chains and an increasing dependency on information<br />
systems, telecommunications and external service providers.<br />
Disturbances in the supply chain can cause major losses<br />
in sales and returns. These problems may affect the customer in<br />
that there are no products available in the store or the store is<br />
closed. Kesko has prioritised the most critical information systems
with regard to business operations, and the continuity management<br />
projects underway are aimed at securing undisturbed critical<br />
operations and a sufficiently fast recovery after a serious disturbance.<br />
The plans are tested regularly to ensure their efficiency<br />
and updatedness and to maintain readiness for crisis situations.<br />
Suppliers and distribution channels<br />
In divisions that are strongly dependent on individual principals<br />
and suppliers, such as the car and machinery trade, changes in<br />
ownership, or in a principal's or supplier's strategy concerning<br />
the product selection, pricing and distribution channel solutions<br />
can mean a reduction in competitiveness or sales, or a loss of<br />
business. Good market shares, growing sales and development of<br />
operations create a basis for long-term cooperation.<br />
Suppliers may have increasing difficulties in deliveries, as a<br />
result of the recession. There is also a growing risk of bankruptcies.<br />
The financial situation and delivery accuracy of the major<br />
suppliers are monitored and substitute suppliers are examined.<br />
Store sites<br />
Store sites are a significant competitive factor. Considerable<br />
amounts of capital or lease liabilities are tied up in store properties<br />
for years. As a result of the recession or changes in the competitive<br />
situation, there is a risk that store sites may become<br />
unprofitable and that operations will end while the long-term<br />
liabilities remain. The acquisition of good store sites can be<br />
slowed by scarcity of plots, zoning and permit procedures and<br />
trends in plot prices. Each operating country has its special characteristics<br />
arising from, for example, legislation and the authorities.<br />
Foreign real estate owners' readiness to make repair or<br />
extension investments has weakened in some cases as a result of<br />
the recession.<br />
These risks are managed by long-term store network planning,<br />
careful preparation of each store site investment decision<br />
and the sale-leaseback system. In cases where Kesko manages<br />
the construction, the aim is to design a store site that can be<br />
modified for different uses as necessary. In the case of leased<br />
premises, the flexibility and continuity requirement is taken into<br />
account by extension options included in the leases.<br />
Responsibility<br />
Different aspects of responsibility are increasingly important for<br />
customers, and possible responsibility failures would weaken<br />
<strong>Kesko's</strong> reputation. <strong>Kesko's</strong> challenges in responsibility work<br />
include communicating its responsibility policies to customers,<br />
retailers and suppliers, and ensuring the ethicality of production.<br />
In monitoring the social compliance of its suppliers, Kesko primarily<br />
concentrates on suppliers operating in the so- called ‘high<br />
risk’ countries. China is <strong>Kesko's</strong> most important non-EU import<br />
country, and our own local monitoring team has been established<br />
in Shanghai. Their duty is to guide, train and supervise the<br />
suppliers of <strong>Kesko's</strong> division parent companies, focusing on the<br />
terms of employment and working conditions, as well as on<br />
matters relating to compliance with environmental and chemical<br />
legislation.<br />
Malpractice and wastage<br />
Recession entails a growing risk of financial malpractice. Preventive<br />
measures have included more effective communications,<br />
Kesko financial statements <strong>2009</strong><br />
131<br />
training and guidelines as well as tightened controls. Information<br />
technology is increasingly used to trace incidental transactions,<br />
and prevent and reveal malpractices.<br />
Retail stores incur significant financial losses arising from<br />
wastage. Wastage can result, for example, from spoilage or<br />
breakage of goods, theft or other malpractice, and unsuccessful<br />
purchasing. The Group continuously develops methods and tools<br />
for more efficient wastage management and reduction. Wastage<br />
prevention training is arranged for retailers, supervisors and sales<br />
staff in different contexts, and it is a key area in training new<br />
store personnel. Wastage teams have been established in stores<br />
to find out the reasons for the store's wastage and to establish<br />
efficient wastage management measures. Best practices are<br />
adopted for wider use.<br />
Safety of payment and online transactions<br />
The requirements of stakeholders and the law for safe information<br />
handling to prevent damages and malpractice have<br />
increased, especially with respect to credit card payment and<br />
personal information. Kesko is carrying out a project to introduce<br />
chip card payment terminals. Audits and up-to-date information<br />
security solutions are used to ensure the confidentiality of customer<br />
and personal information. Appropriate guidelines are central<br />
in ensuring the confidentiality of business secrets. Critical<br />
transactions, such as payments, are protected with job descriptions,<br />
acceptance limits, access rights and system controls.<br />
Employee competence and working capacity<br />
The implementation of strategies and the achievement of goals<br />
require competent and motivated people. There is a risk that the<br />
trading sector will not attract the most competent people. The<br />
increased need for specialised expertise increases dependence on<br />
the competences of individuals and the risk of losing key people.<br />
In connection with strategy work, the competencies required for<br />
strategy implementation are identified, and personnel plans are<br />
drawn up. Personnel surveys play a central role in the development<br />
of HR management and the promotion of working capacity.<br />
<strong>Kesko's</strong> employer image is developed by systematic stakeholder<br />
cooperation and internal and external communications.<br />
Product safety and supply chain quality<br />
<strong>Kesko's</strong> objective is to provide safe products for its customers. A<br />
failure in the quality assurance of the supply chain, or in product<br />
control may result in financial losses, the loss of customer confidence<br />
or, in the worst case, a health hazard. In order to manage<br />
this risk, the Product Research Unit controls the quality of products<br />
sold by Kesko Food, Citymarket Oy and Anttila, and supervises<br />
companies manufacturing products for Kesko Food. The<br />
trading sector’s self-control practices ensure that the regulations<br />
and rules concerning foodstuffs are observed. The practice of<br />
recalling products ensures that defective products are withdrawn<br />
from sale quickly.<br />
Pandemics<br />
A pandemic, or an epidemic of widely spread disease, would<br />
have extensive effects on business operations. At least temporarily,<br />
it could impact demand and the availability and quality of<br />
goods and services. <strong>Kesko's</strong> continuity management principles<br />
concerning the safeguarding of critical functions require that the
132 Kesko financial statements <strong>2009</strong><br />
unavailability of a major part of the personnel or the key people<br />
because of an epidemic or some other reason must be prepared<br />
for. Up-to-date continuity plans and their testing maintain the<br />
abilities to control exceptional situations. Substitute arrangements<br />
are made to ensure that the resources for functions will be<br />
maintained. Ensuring efficient internal and external communications<br />
plays an important part in continuity planning.<br />
Legislation, agreements and ethical principles<br />
Compliance with legislation, agreements and <strong>Kesko's</strong> ethical<br />
principles is an important basic value in all of <strong>Kesko's</strong> operations.<br />
Non-compliance may result in fines, compensation for damages<br />
and other financial losses, and a loss of confidence or reputation.<br />
The Group has specific training programmes, especially in<br />
competition legislation, to avoid this. Self-assessments are made<br />
in matters concerning competition legislation.<br />
Contractual risks are managed by harmonising agreements<br />
and the processes of entering into agreements, and by electronic<br />
archiving of contracts. An essential issue in the chain agreements<br />
between Kesko and the retailers is finding solutions for the highquality<br />
delivery of customer promises and commitment to the<br />
chain business operation.<br />
In international operations, problems also arise from different<br />
interpretations and procedures concerning, among other things,<br />
taxation and official regulations.<br />
<strong>Report</strong>ing to the markets<br />
The objective of <strong>Kesko's</strong> corporate communications is to produce<br />
and publish reliable information at the right time. If some information<br />
published by Kesko proved to be incorrect or a release<br />
failed to meet regulations, it might result in investors and other<br />
stakeholder groups losing confidence, and possible sanctions.<br />
The accuracy of financial information is challenged by tight<br />
schedules and dependence on information systems. This risk is<br />
managed through careful scheduling and ensuring the right<br />
resources and sufficient competencies.<br />
Damage risks<br />
Damages, accidents and crimes are prevented through uniform<br />
practices and cost-efficient safety precautions. The financial consequences<br />
of damage are covered with insurance, in accordance<br />
with the policy defined by the Kesko Board of Directors. The<br />
Kesko Group uses international insurance programmes to cover,<br />
among others, property, business interruption and liability risks.<br />
The Group's risk management function steers the implementation<br />
of insurance programmes in a centralised manner.<br />
NOTE 43<br />
Related-party transactions<br />
The Group's related parties include its key management personnel<br />
(the Board of Directors, the Managing Director and the Corporate<br />
Management Board), subsidiaries, associates and the Kesko<br />
Pension Fund. The subsidiaries and associates are listed in a separate<br />
note (note 45).<br />
The following transactions were carried out with related parties:<br />
Sales of goods and services<br />
€ million<br />
Sales of goods<br />
<strong>2009</strong> 2008<br />
Board of Directors and management 37.2 24.3<br />
Kesko Pension Fund 0.2 1.3<br />
Total 37.4 25.5<br />
Sales of services<br />
Associates 0.9 1.0<br />
Board of Directors and management 4.8 1.9<br />
Kesko Pension Fund 1.5 1.3<br />
Total 7.1 4.2<br />
The related party transactions disclosed include those transactions<br />
with related parties that are not eliminated in the consolidated<br />
financial statements.<br />
Among associates consolidated using the equity method, a<br />
property owned by Valluga-Sijoitus Oy has been leased for the<br />
Group's use. Vähittäiskaupan Takaus Oy and Vähittäiskaupan Tilipalvelu<br />
Oy sell their services to <strong>Kesko's</strong> and K-retailers' retail<br />
companies. The other associates mainly include business property<br />
companies which have leased their premises and real estate<br />
to the Kesko Group. Associates that operate as mutual real estate<br />
companies have been consolidated in the financial statements in<br />
proportion to their ownership interest.<br />
Some members of <strong>Kesko's</strong> Board of Directors act as K-retailers.<br />
The Group companies sell goods and services to enterprises controlled<br />
by them.<br />
The Kesko Pension Fund is a separate legal entity which manages<br />
and holds in trust part of the pension assets of the Group's<br />
employees in Finland. Pension assets include Kesko Corporation<br />
shares in the amount of €104.3 million. Real estate and<br />
premises owned by the Pension Fund have been leased to the<br />
Kesko Group, which has subleased most of them to retailers. In<br />
<strong>2009</strong>, the Kesko Group paid a total amount of €52.5 million<br />
(€62.7 million) in contributions to the Pension Fund.<br />
Goods and services are sold to related parties on normal market<br />
terms and conditions and at market prices.<br />
In March <strong>2009</strong>, the Kesko Group sold four store properties to<br />
the Kesko Pension Fund. The debt-free selling price was about<br />
€50 million. The Group's €19.7 million gain on the disposal is<br />
included in the non-recurring items within the operating profit.<br />
Purchases of goods and services<br />
€ million<br />
Purchases of goods<br />
<strong>2009</strong> 2008<br />
Associates 0.0 0.0<br />
Board of Directors and management 1.4 2.2<br />
Total 1.4 2.2<br />
Purchases of services<br />
Associates 2.6 2.5<br />
Board of Directors and management 0.1 0.1<br />
Pension Fund 0.0 0.2<br />
Total 2.7 2.8
In addition, the other operating expenses include rents paid by<br />
the Kesko Group to the Kesko Pension Fund in a total amount of<br />
€34.7 million (€22.4 million).<br />
Financial expenses<br />
€million <strong>2009</strong> 2008<br />
Associates 0.5 1.6<br />
Pension Fund 0.0 0.2<br />
Trade receivables<br />
€ million<br />
0.5 1.8<br />
Associates 0.1 0.0<br />
Board of Directors and management 2.1 1.7<br />
Pension Fund 0.3 0.2<br />
2.5 1.9<br />
Members of <strong>Kesko's</strong> Board of Directors act as K-retailers. At the<br />
balance sheet date, the receivables resulting from sales by Kesko<br />
to enterprises controlled by them totalled €2.1 million (€1.7 million).<br />
The receivables are covered by the commercial credit collateral<br />
granted by Vähittäiskaupan Takaus Oy, a Kesko associate. The<br />
maximum amount of the collateral is always limited to the realisable<br />
value of the counter-guarantee granted by the K-retailer's<br />
enterprise and the K-retailer entrepreneur to Vähittäiskaupan<br />
Takaus. At the end of the financial year, the value of the counterguarantee<br />
was €3.2 million (€3.5 million).<br />
Other current liabilities<br />
€ million <strong>2009</strong> 2008<br />
Associates 38.6 37.4<br />
Board of Directors and management 0.8 0.6<br />
Pension Fund 3.4 2.6<br />
42.8 40.6<br />
The other current liabilities include, among other things, chain<br />
rebate liabilities payable to enterprises controlled by the three<br />
Kesko Board members acting as K-retailers. Chain rebates are<br />
paid in arrears on criteria related to the amount of actual annual<br />
sales and the quality of operations.<br />
In addition, <strong>Kesko's</strong> non-current receivables from a real estate<br />
associate total €1.5 million.<br />
Board of Directors' compensation<br />
€ thousand <strong>2009</strong> 2008<br />
Members of the Board of Directors<br />
Heikki Takamäki, Chair 81.5 67.5<br />
Seppo Paatelainen, Deputy Chair 53.0 38.5<br />
Esa Kiiskinen (from 30 March <strong>2009</strong>) 31.8<br />
Ilpo Kokkila 41.8 35.5<br />
Mikko Kosonen (from 30 March <strong>2009</strong>) 33.8<br />
Maarit Näkyvä 45.3 41.0<br />
Rauno Törrönen (from 30 March <strong>2009</strong>) 31.8<br />
Pentti Kalliala (until 30 March <strong>2009</strong>) 8.5 37.5<br />
Keijo Suila (until 30 March <strong>2009</strong>) 12.0 50.0<br />
Jukka Säilä (until 30 March <strong>2009</strong>) 8.5 35.5<br />
Kesko financial statements <strong>2009</strong><br />
Salaries and fees of the President and CEO, and the<br />
Corporate Management Board members<br />
133<br />
€ thousand <strong>2009</strong> 2008<br />
Matti Halmesmäki, President and CEO 744.6 838.6<br />
Corporate Management Board<br />
(the other members) 1,621.4 1,807.6<br />
Other top management employee benefits<br />
Share-based payments<br />
At 31 December <strong>2009</strong>, the President and CEO held 150,000 stock<br />
options, 50,000 of which were 2007C options granted in <strong>2009</strong>.<br />
Presuming that shares were subscribed for with the President<br />
and CEO's options, the options would represent 0.15% of shares<br />
and 0.04% of all voting rights. At 31 December <strong>2009</strong>, the other<br />
Corporate Management Board members held an aggregate<br />
number of 476,000 stock options. In <strong>2009</strong>, the other Corporate<br />
Management Board members were granted a total of 150,000<br />
2007C options. The options held by the Corporate Management<br />
Board have equal rules and vesting periods with the other<br />
options included in the management's option plans.<br />
Retirement benefits<br />
The retirement age of the President and CEO is 60 years and his<br />
full retirement benefit is 66% of his pensionable salary. The<br />
retirement ages of the other Corporate Management Board members<br />
mainly vary between 60 and 62, and the full retirement<br />
benefit is 66% of the pensionable salary. The retirement benefits<br />
of the CFO are determined on the basis of the Employees' Pensions<br />
Act (TyEL).<br />
Termination benefits<br />
The notice period of the President and CEO is 6 months. Severance<br />
compensation paid in addition to the salaries for the notice<br />
period corresponds to 12 months' salary. The notice period of the<br />
other Corporate Management Board members is 6 months and<br />
severance compensation paid in addition to the salaries for the<br />
notice period corresponds to 6–12 months' salary.<br />
NOTE 44<br />
Other notes<br />
Events after the balance sheet date<br />
No significant events took place in the Group after the balance<br />
sheet date.
134 Kesko financial statements <strong>2009</strong><br />
NOTE 45<br />
Subsidiaries and associates at 31 December <strong>2009</strong><br />
INTERESTS IN GROUP COMPANIES Group's Parent's<br />
Owned by the parent Domicile<br />
ownership ownership<br />
interest % interest %<br />
Anttila Oy Helsinki 100.00 100.00<br />
Asunto Oy Kirkkonummen<br />
Västeruddintie 33 Kirkkonummi 100.00 100.00<br />
Indoor Group Ltd Lahti 100.00 100.00<br />
Intersport Finland Ltd Helsinki 100.00 100.00<br />
K-instituutti Oy Helsinki 72.00 72.00<br />
K-Plus Oy Helsinki 100.00 100.00<br />
Kenkäkesko Ltd Helsinki 100.00 100.00<br />
Keslog Ltd Helsinki 100.00 54.95<br />
Kestra Kiinteistöpalvelut Oy<br />
Kiinteistö Oy Kangasalan<br />
Helsinki 100.00 100.00<br />
Palvelukeskus Kangasala 82.50 82.50<br />
Kiinteistö Oy Kemin Asemakatu 4Kemi 66.50 66.50<br />
Kiinteistö Oy Lahden Lyhytkatu 1 Lahti 50.00 50.00<br />
Kiinteistö Oy Pontsonkulma Helsinki 94.57 94.57<br />
Kiinteistö Oy Sunan Hallitalo Espoo 100.00 100.00<br />
Kiinteistö Oy Voisalmen Liiketalo Lappeenranta<br />
Kiinteistö Oy Välivainion<br />
100.00 100.00<br />
Ostoskeskus Oulu 65.97 65.97<br />
Klintcenter Ab Maarianhamina 100.00 100.00<br />
Konekesko Ltd Helsinki 100.00 100.00<br />
K-Talouspalvelukeskus Oy Helsinki 100.00 51.02<br />
Musta Pörssi Ltd Helsinki 100.00 100.00<br />
Plussa OÜ Tallinn, Estonia 100.00 100.00<br />
Rautakesko Ltd Helsinki 100.00 100.00<br />
Kesko Food Ltd Helsinki 100.00 100.00<br />
Sincera Oy Helsinki 100.00 100.00<br />
VV-Auto Group Oy Helsinki 100.00 100.00<br />
Owned by other<br />
Group companies Domicile<br />
Agro Trade Latvija SIA Riga, Latvia 100.00<br />
Antti SIA Riga, Latvia 100.00<br />
Anttila AS Viljandi, Estonia 100.00<br />
AP Real Estate SIA Riga, Latvia 100.00<br />
Asko Möbler Ab Huddinge, Sweden 100.00<br />
Auto-Span Oy Helsinki 100.00<br />
Bansemko OOO Moscow, Russia 100.00<br />
Barker-Littoinen Oy Espoo 100.00<br />
Bruland Bygg AS Förde, Norway 66.26<br />
Byggmakker Distribution AS Ski, Norway 99.92<br />
Byggmakker Norge AS Oslo, Norway 99.92<br />
Cassa Oy Helsinki 100.00<br />
Daugavkrasts M SIA Riga, Latvia 100.00<br />
Fiesta Real Estate AS Tallinn, Estonia 100.00<br />
Group's Parent's<br />
ownership ownership<br />
interest % interest %<br />
Hauhon Kiinteistö- ja<br />
Kauppakeskus Oy Hauho 100.00<br />
Hasti-Ari AS Ski, Norway 100.00<br />
Ikosen OÜ Tallinn, Estonia 100.00<br />
Indoor Group AS Tallinn, Estonia 100.00<br />
Indoor Group SIA Riga, Latvia 100.00<br />
Indoor Group UAB Vilnius, Lithuania 100.00<br />
Insofa Oy Lahti 100.00<br />
Interstroy OOO Russia 100.00<br />
Ka Jelgava SIA Jelgava, Latvia 100.00<br />
K-citymarket Oy Helsinki 100.00<br />
Keru Kiinteistöt Oy Helsinki 100.00<br />
Kesko Real Estate Latvia SIA Riga, Latvia<br />
St. Petersburg,<br />
100.00<br />
Kesko Real Estate OOO Russia<br />
St. Petersburg,<br />
100.00<br />
Kesko Real Estate Services OOO Russia 100.00<br />
Kespro LTD Helsinki 100.00<br />
Kestroy 1 ZAO Moscow, Russia 100.00<br />
Kiinteistö Oy Arolan Risteys Elimäki 100.00<br />
Kiinteistö Oy Hannunhelmi Kirkkonummi 100.00<br />
Kiinteistö Oy Liike-Jaako Rovaniemi 67.88<br />
Kiinteistö Mesta Oy Helsinki 100.00<br />
Kiinteistö Oy Piispansilta<br />
Kiinteistö Oy Pälkäneen<br />
Espoo 100.00<br />
Liikekeskus<br />
KiinteistÖ Oy Saarijärven<br />
Kangasala 79.98<br />
Postitalo Saarijärvi 100.00<br />
Kiinteistö Oy Sarviniitynkatu 4 Kerava 100.00<br />
Kiinteistö Oy Tampuri Helsinki 100.00<br />
Kiinteistö Oy Tarkkaiikka<br />
Kiinteistö Oy Vantaan<br />
Oulu 100.00<br />
Kiitoradantie 2 Vantaa 100.00
Owned by other<br />
Group companies Domicile<br />
K-Maatalouskaupat Oy Helsinki 100.00<br />
Knuto AS Ski, Norway 100.00<br />
Konekesko Eesti AS Tallinn, Estonia 100.00<br />
Konekesko Holding Oy Helsinki 100.00<br />
Konekesko Latvija SIA Riga, Latvia 100.00<br />
Konekesko Lietuva UAB Vilnius, Lithuania 100.00<br />
St. Petersburg,<br />
Group's Parent's<br />
ownership ownership<br />
interest % interest %<br />
Konekesko OOO<br />
Russia 100.00<br />
Konsoma JLLC Minsk, Belarus 8.94<br />
K Prof SIA Riga, Latvia 100.00<br />
K Rauta SIA Riga, Latvia 100.00<br />
K-Rauta AB Stockholm, Sweden 100.00<br />
KR Fastigheter AB Sollentuna, Sweden 100.00<br />
KR Fastigheter i Eskilstuna AB Sollentuna, Sweden 100.00<br />
KR Fastigheter i Järfälla AB Sollentuna, Sweden 100.00<br />
KR Fastigheter i Halmstad AB Sollentuna, Sweden 100.00<br />
KR Fastigheter i Umeå AB Sollentuna, Sweden 100.00<br />
KR Fastigheter i Täby AB Sollentuna, Sweden 100.00<br />
KR Fastigheter Servicekontor AB Sollentuna, Sweden 100.00<br />
KR Fastigheter i Sundsvall AB Sollentuna, Sweden 100.00<br />
KR Fastigheter i Uppland AB Sollentuna, Sweden 100.00<br />
K-Rauta Fastigheter i Malmö AB Sollentuna, Sweden 100.00<br />
Limingan Portti 1 Oy<br />
Loimaan Maatalous- ja<br />
Liminka 100.00<br />
Rautakauppa Oy Helsinki 100.00<br />
Match-Point OOO Kaluga, Russia<br />
St. Petersburg,<br />
100.00<br />
Masterstroyprof ZAO<br />
Russia 100.00<br />
Mezciems Real Estate SIA Riga, Latvia 100.00<br />
Norgros Handel AS Lilleström, Norway 99.92<br />
OMA OOO Minsk, Belarus 8.94<br />
Polo LS SIA Riga, Latvia 100.00<br />
Pikoil Oy Espoo 100.00<br />
Rake Bergen AS Oslo, Norway 100.00<br />
Rake Eiendom AS Oslo, Norway 100.00<br />
Rautakesko AS Tallinn, Estonia 100.00<br />
Rautakesko A/S Riga, Latvia 100.00<br />
Romos Holdingas UAB Kaunas, Lithuania 8.94<br />
Senukai UAB Kaunas, Lithuania 49.60<br />
Senuku Prekybos Centras UAB Vilnius, Lithuania 50.00<br />
Senuku Tirdzniecibas Centras SIA Riga, Latvia 50.00<br />
SPC Holding UAB Kaunas, Lithuania 50.00<br />
Stroymaster Holding Finland Oy Helsinki<br />
St. Petersburg,<br />
100.00<br />
Stroymaster ZAO<br />
Russia 100.00<br />
Sunretail ZAO Moscow, Russia 100.00<br />
Owned by other<br />
Group companies Domicile<br />
Kesko financial statements <strong>2009</strong><br />
Tampereen Länsikeskus Oy Tampere 94.43<br />
Teploschit OOO Yaroslavi, Russia 100.00<br />
TP Real Estate SIA Riga, Latvia 100.00<br />
Trögstadveien 13 AS Ski, Norway 99.92<br />
Turun VV-Auto Oy Turku 100.00<br />
Verdal Eiendom AS Ski, Norway 99.92<br />
VV-Autotalot Oy Helsinki 100.00<br />
ASSOCIATES<br />
Owned by the parent Domicile<br />
135<br />
Group's Parent's<br />
ownership ownership<br />
interest % interest %<br />
Group's Parent's<br />
ownership ownership<br />
interest % interest %<br />
Graanin Liikekeskus Oy Mikkeli 50.00 50.00<br />
Itäkeskuksen Pysäköintitalo Oy Helsinki 36.16 36.16<br />
Kiinteistö Oy Janakkalan<br />
Linnatuuli Janakkala 29.86 29.86<br />
Kiinteistö Oy Itäaukio<br />
Kiinteistö Oy Joensuun<br />
Lahti 26.20 26.20<br />
Kaupunginportti<br />
Kiinteistö Oy Mellunmäen<br />
Joensuu 22.77 22.77<br />
Liike- ja Toimintakeskus Helsinki 23.42 23.42<br />
Kiinteistö Oy Ulvilan Hansa<br />
Kiinteistö Oy Vantaanportin<br />
Ulvila 42.41 42.41<br />
Liikekeskus Vantaa 27.81 27.81<br />
Raksilan Paikoitus Oy Oulu 33.33 33.33<br />
Valluga-Sijoitus Oy Helsinki 39.00 39.00<br />
Vähittäiskaupan Takaus Oy Helsinki 34.35 34.35<br />
Vähittäiskaupan Tilipalvelu VTP Oy Helsinki 30.00 30.00<br />
Owned by other<br />
Group companies<br />
Kiinteistö Oy Meri-Pietari Helsinki 23.12<br />
Kiinteistö Oy Lahden<br />
Teollisuuskeskus Lahti 48.32<br />
Toomaxx Handels GmbH Germany 25.00<br />
Toomax Asia Ltd. Hong Kong 25.00
136 Kesko financial statements <strong>2009</strong><br />
Parent's financial statements <strong>2009</strong><br />
Parent's income statement (FAS)<br />
€ 1 Jan.-31 Dec. <strong>2009</strong> 1 Jan.-31 Dec. 2008<br />
Net sales 19,555,415.66 18,193,914.32<br />
Other operating income 261,003,344.25 299,019,437.07<br />
Materials and services 419.20 -454.51<br />
Staff expenses -10,348,598.91 -12,971,150.41<br />
Depreciation and reduction in value -31,569,693.98 -37,541,067.49<br />
Other operating expenses -122,545,157.91 -129,245,796.46<br />
Operating profit 116,095,728.31 137,454,882.52<br />
Financial income and expenses 11,208,558.82 37,555,785.57<br />
Profit before extraordinary items 127,304,287.13 175,010,668.09<br />
Extraordinary items 21,584,005.65 99,866,000.00<br />
Profit before appropriations and taxes 148,888,292.78 274,876,668.09<br />
Appropriations 39,559,034.61 26,513,831.22<br />
Profit before taxes 188,447,327.39 301,390,499.31<br />
Income taxes -49,670,354.28 -64,679,900.23<br />
Profit for the financial year 138,776,973.11 236,710,599.08
Parent's balance sheet (FAS)<br />
€ 31 Dec. <strong>2009</strong> 31 Dec. 2008<br />
ASSETS<br />
NON-CURRENT ASSETS<br />
INTANGIBLE ASSETS<br />
Other capitalised long-term<br />
expenditure<br />
Advance payments and<br />
6,173,722.48 6,455,877.43<br />
construction in progress 1,472,260.89 1,641,853.61<br />
TANGIBLE ASSETS<br />
7,645,983.37 8,097,731.04<br />
Land and waters 97,192,920.76 111,379,744.40<br />
Buildings 233,179,097.13 309,366,678.87<br />
Machinery and equipment 3,867,441.64 4,980,270.93<br />
Other tangible assets<br />
Advance payments and<br />
6,639,197.75 8,158,495.25<br />
construction in progress 4,639,483.95 7,094,125.24<br />
INVESTMENTS<br />
345,518,141.23 440,979,314.69<br />
Holdings in Group companies 264,122,468.86 273,535,019.71<br />
Participating interests<br />
Other shares and similar rights<br />
17,767,798.60 18,657,266.58<br />
of ownership 7,285,332.58 7,295,881.70<br />
CURRENT ASSETS<br />
DEBTORS<br />
Long-term<br />
Amounts owed by Group<br />
289,175,600.04 299,488,167.99<br />
companies<br />
Amounts owed by participating<br />
410,731,848.84 399,439,059.07<br />
interests<br />
Other long-term loan<br />
1,546,010.01 1,546,010.01<br />
receivables 1,454,664.32 3,310,137.35<br />
Short-term<br />
413,732,523.17 404,295,206.43<br />
Trade debtors<br />
Amounts owed by Group<br />
146,040.27 184,033.61<br />
companies<br />
Amounts owed by participating<br />
296,808,568.37 546,643,021.41<br />
interests 2,072,193.08 3,104,920.53<br />
Other receivables<br />
Prepayments and accrued<br />
197,328.26 243,510.35<br />
income 3,454,499.07 25,382,155.33<br />
INVESTMENTS<br />
302,678,629.05 575,557,641.23<br />
Other investments 635,648,380.60 383,152,895.82<br />
CASH IN HAND AND AT BANKS 11,809,147.40 22,785,663.82<br />
TOTAL ASSETS 2,006,208,404.86 2,134,356,621.02<br />
Kesko financial statements <strong>2009</strong><br />
137<br />
€ 31 Dec. <strong>2009</strong> 31 Dec. 2008<br />
LIABILITIES<br />
CAPITAL AND RESERVES<br />
Share capital 196,643,058.00 195,649,708.00<br />
Share issue - 89,900.00<br />
Share premium account 193,929,222.36 190,255,218.02<br />
Other reserves 243,415,795.55 243,415,795.55<br />
Retained earnings 669,668,254.41 531,108,065.33<br />
Profit for the financial year 138,776,973.11 236,710,599.08<br />
1,442,433,303.43 1,397,229,285.98<br />
APPROPRIATIONS<br />
Depreciation reserve 91,612,421.32 131,171,455.93<br />
PROVISIONS<br />
Other provisions 7,833,178.72 8,266,027.48<br />
CREDITORS<br />
Non-current<br />
Private placement bonds 100,418,410.04 100,418,410.04<br />
Loans from credit institutions 38,194,792.42 20,512,820.51<br />
Trade creditors - 279.45<br />
138,613,202.46 120,931,510.00<br />
Current<br />
Loans from credit institutions 7,049,203.44 -<br />
Advances received 9,922.97 90,883.83<br />
Trade creditors<br />
Amounts owed to Group<br />
2,333,672.26 3,068,581.11<br />
companies<br />
Amounts owed to participating<br />
238,966,256.30 352,147,751.01<br />
interests 38,387,884.71 37,212,846.36<br />
Other debt 13,102,883.11 69,526,049.14<br />
Accruals and deferred income 25,866,476.14 14,712,230.18<br />
325,716,298.93 476,758,341.63<br />
TOTAL LIABILITIES 2,006,208,404.86 2,134,356,621.02
138 Kesko financial statements <strong>2009</strong><br />
Parent's cash flow statement (FAS)<br />
€ 1 Jan.-31 Dec. <strong>2009</strong> 1 Jan.-31 Dec. 2008<br />
Cash flow from operating activities<br />
Profit before extraordinary items<br />
Adjustments:<br />
127,304,287.13 175,010,668.09<br />
Depreciation according to plan 22,431,800.30 22,542,266.17<br />
Financial income and expenses -11,208,558.82 -37,555,785.57<br />
Other adjustments -86,901,943.53 -115,916,129.96<br />
Change in working capital<br />
51,625,585.08 44,081,018.73<br />
Interest-free short-term trade receivables, increase/decrease (-/+) 5,013,184.12 4,314,998.23<br />
Interest-free short-term debt, increase/decrease (+/-) -7,364,940.23 3,239,414.65<br />
-2,351,756.11 7,554,412.88<br />
Interests paid -24,886,896.53 -39,864,151.14<br />
Interests received 50,091,388.56 72,980,921.01<br />
Dividends received 15,919.30 6,220,481.75<br />
Taxes paid -31,500,126.37 -62,090,706.16<br />
-6,279,715.04 -22,753,454.54<br />
Cash flow from operating activities 42,994,113.93 28,881,977.07<br />
Cash flow from investing activities<br />
Purchases of other investments - -50,000.00<br />
Investments in tangible and intangible assets -25,407,912.38 -28,940,941.87<br />
Increase in long-term receivables - -61,937,039.62<br />
Decrease in long-term receivables 14,727,559.87 -<br />
Subsidiary disposed 30,401,356.84 149,729,156.38<br />
Associated company disposed 140,000.00 1,388,000.00<br />
Proceeds from other investments - 223,047.00<br />
Proceeds from sale of tangible and intangible assets 164,968,531.04 141,294,028.63<br />
Cash flow from investing activities 184,829,535.37 201,706,250.52<br />
Cash flow from financing activities<br />
Decrease in current creditors -165,768,732.94 -106,807,060.53<br />
Increase in non-current creditors 17,681,692.46 -<br />
Decrease in non-current creditors - -4,618,842.74<br />
Increase/decrease (-/+) in short-term interest-bearing receivables 248,003,649.29 45,784,249.44<br />
Short-term money market investments -98,162,726.19 -18,400,959.74<br />
Dividends paid -97,850,410.00 -156,428,592.00<br />
Group contributions received and paid 21,584,005.65 99,866,000.00<br />
Increase in share capital 4,577,454.34 379,018.16<br />
Others -14,532,339.74 10,549,067.77<br />
Cash flow from financing activities -84,467,407.13 -129,677,119.64<br />
Change in liquid assets 143,356,242.17 100,911,107.95<br />
Liquid assets at 1 January 282,031,553.81 181,120,445.86<br />
Liquid assets at 31 December 425,387,795.98 282,031,553.81
Kesko financial statements <strong>2009</strong><br />
Notes to the parent's financial statements<br />
Principles used for preparing the parent's<br />
financial statements<br />
Kesko Corporation's financial statements have been prepared in<br />
compliance with the Finnish Accounting Standards (FAS).<br />
Non-current assets<br />
Intangible assets<br />
Intangible assets are stated in the balance sheet at cost less<br />
depreciation according to plan.<br />
Depreciation plan<br />
Other capitalised expenditure 5–14 years<br />
Tangible assets<br />
Tangible assets are stated in the balance sheet at cost less depreciation<br />
according to plan.<br />
Depreciation plan<br />
Depreciation according to plan is calculated on a straight line<br />
basis so as to write off the cost of tangible assets over their estimated<br />
useful lives.<br />
The periods adopted for depreciation are as follows:<br />
Buildings 15–33 years<br />
Fixtures and fittings 8 years<br />
Machinery and equipment 8 years<br />
or machinery and equipment<br />
purchased since 1999 25% reducing balance method<br />
Transportation fleet 5 years<br />
Information technology equipment 3–5 years<br />
Other tangible assets 5–14 years<br />
Land has not been depreciated. The total of depreciation according<br />
to plan and the change in depreciation reserve comply with<br />
the Finnish tax legislation. The change in depreciation reserve<br />
has been treated as appropriations in the parent company.<br />
Valuation of financial assets<br />
Marketable securities have been valued at lower of cost or net<br />
realisable value.<br />
Foreign currencies<br />
Items denominated in foreign currencies have been translated<br />
into Finnish currency at the average exchange rate of the European<br />
Central Bank at the balance sheet date. If a receivable or a<br />
debt is tied to a fixed rate of exchange, it has been used for<br />
translation. Exchange rate differences have been recognised in<br />
profit or loss.<br />
Derivative financial instruments<br />
Interest rate derivative contracts<br />
Interest rate derivatives are used to modify loan durations. The<br />
target duration is three years and it is allowed to vary between<br />
one and a half and four years. Cash flows arising from interest<br />
rate derivative contracts are recognised during the financial year<br />
as interest income or expenses, according to the maturity date.<br />
In the financial statements, open forward agreements, futures,<br />
options and swaps are stated at market values. Unrealised<br />
revaluation is not stated as income. Any valuation losses are<br />
included in interest expenses.<br />
139<br />
Currency derivative contracts<br />
Currency derivative instruments are used for hedging against<br />
translation and transaction risks. Forward exchange contracts are<br />
valued at the exchange rate of the balance sheet date. The rate<br />
differences arising from open derivative contracts are reported in<br />
financial items. If a derivative instrument has been used to<br />
hedge a foreign-currency-denominated asset, the value change<br />
has been recognised against that of the asset item. The premiums<br />
of option contracts are included in the balance sheet accruals<br />
until they expire, or if a value change at the balance sheet<br />
date so requires, recognition in profit or loss.<br />
Commodity derivatives<br />
Kestra Kiinteistöpalvelut Oy, a Kesko Corporation subsidiary, uses<br />
electricity derivatives to balance the energy costs of the Group<br />
and its retailers. <strong>Kesko's</strong> subsidiaries engaged in the agricultural<br />
trade use grain derivatives to hedge against the grain price risk.<br />
Kesko Corporation is an external counterparty in electricity and<br />
grain derivative contracts made with the bank, and internally<br />
hedges the corresponding price with the subsidiary. At no stage<br />
does Kesko Corporation have derivative positions, and thus there<br />
are no effects on profit or loss. The electricity price risk is<br />
reviewed on a 3-year time span. With respect to derivative contracts<br />
hedging the price of electricity supplied during the financial<br />
year, changes in value are recognised in Kesko under interest<br />
income and expenses. The unrealised gains and losses of contracts<br />
hedging future purchases are not recognised through profit<br />
or loss. With respect to grain derivative contracts, the open contracts<br />
in the income statement are recognised at market prices.<br />
Valuation differences related to open contracts are recognised in<br />
Kesko under financial items.<br />
Pension plans<br />
The pension insurances of Kesko Corporation's personnel are<br />
arranged through the Kesko Pension Fund. The Fund's A department,<br />
which provides supplementary pension benefits, was<br />
closed on 9 May 1998. The job-based retirement age agreed for<br />
some of the personnel is 60 or 62 years. Pensions are expensed<br />
in the income statement.<br />
Provisions<br />
Provisions stated in the balance sheet include items bound to by<br />
agreements or otherwise, but remain unrealised. Changes in provisions<br />
are included in the income statement. Rent liabilities for<br />
vacant rented premises no longer used for the Group business<br />
operations, as well as the losses resulting from renting the<br />
premises to outsiders, are included in provisions.<br />
Income tax<br />
Income tax includes the income tax payments for the period<br />
based on the profit for the period, and taxes payable for prior<br />
periods, or tax refunds. Deferred taxes are not included in the<br />
parent's income statement and balance sheet.
140 Kesko financial statements <strong>2009</strong><br />
Notes to the income statement<br />
€ million <strong>2009</strong> 2008<br />
1. Other operating income<br />
Profits on sales of real estate and shares 95.7 128.1<br />
Rent income 164.4 169.8<br />
Merger profit 0.0 0.8<br />
Others 0.9 0.3<br />
Total 261.0 299.0<br />
2. Average number of personnel<br />
Kesko Corporation 147 160<br />
Total 147 160<br />
3. Personnel expenses<br />
Salaries and fees<br />
Social security expenses<br />
9.1 10.0<br />
Pension expenses 0.5 2.1<br />
Other social security expenses 0.7 0.9<br />
Total 10.3 13.0<br />
Salaries and fees to the management<br />
Managing Director and his deputy 0.8 0.8<br />
Board of Directors' members 0.3 0.3<br />
Total 1.1 1.1<br />
An analysis of the management's salaries and fees is included in<br />
the notes to the consolidated financial statements.<br />
4. Depreciation and reduction in value<br />
Depreciation according to plan 22.5 22.5<br />
Reduction in value, non-current assets 9.1 15.0<br />
Total 31.6 37.5<br />
5. Other operating expenses<br />
Rent expenses 90.0 87.6<br />
Marketing expenses 1.0 2.2<br />
Maintenance of real estate and store sites 11.7 15.6<br />
Data communications expenses 12.2 12.2<br />
Losses on sales of real estate and shares 0.7 1.0<br />
Merger losses 0.0 2.7<br />
Other operating expenses 7.0 8.6<br />
Total 122.6 129.9<br />
PricewaterhouseCoopers, Authorised<br />
Public Accountants<br />
Auditor's fees 0.1 0.1<br />
Tax consultation 0.0 0.1<br />
Other fees 0.1 0.1<br />
Total 0.2 0.3<br />
€ million <strong>2009</strong> 2008<br />
6. Financial income and expenses<br />
Dividend income<br />
From Group companies 0.0 6.2<br />
Dividend income, total 0.0 6.2<br />
Other interest and financial income<br />
From Group companies 37.0 50.7<br />
From others 12.8 67.2<br />
Interest income, total<br />
Interest and other financial expenses<br />
49.8 117.9<br />
To Group companies -5.5 -27.8<br />
To others -33.1 -58.8<br />
Interest expenses, total -38.6 -86.6<br />
Total 11.2 37.6<br />
7. Items included in extraordinary<br />
income and expenses<br />
Contributions from Group companies 49.7 153.7<br />
Contributions to Group companies -28.1 -53.9<br />
Total 21.6 99.8<br />
8. Appropriations<br />
Difference between depreciation<br />
according to plan<br />
and depreciation in taxation 39.6 26.5<br />
Total 39.6 26.5<br />
9. Changes in provisions<br />
Future rent expenses for vacant business<br />
premises 0.5 -2.0<br />
Other changes -1.0 3.1<br />
Total -0.5 1.1<br />
10. Income taxes<br />
Income taxes on extraordinary items -5.6 -26.0<br />
Income taxes on operating activities -44.1 -38.6<br />
Total -49.7 -64.7<br />
Deferred taxes<br />
Deferred tax liabilities and assets have not been included in the<br />
balance sheet. The amounts are not significant.<br />
Notes to the balance sheet<br />
€ million <strong>2009</strong> 2008<br />
11. Intangible assets<br />
Other capitalised long-term expenditure<br />
Acquisition cost at 1 January 39.1 38.3<br />
Increases 1.5 0.7<br />
Decreases -1.1 -0.9<br />
Transfers between items 0.7 1.0<br />
Acquisition cost at 31 December 40.2 39.1
€ million <strong>2009</strong> 2008<br />
Accumulated depreciation at 1 January 32.6 30.6<br />
Accumulated depreciation on decreases<br />
and transfers -0.4 -0.4<br />
Depreciation for the financial year 1.8 2.4<br />
Accumulated depreciation at 31 December 34.0 32.6<br />
Book value at 31 December 6.2 6.5<br />
Advance payments<br />
Acquisition cost at 1 January 1.7 2.5<br />
Increases 0.8 0.6<br />
Decreases -0.6 -0.4<br />
Transfers between items -0.4 -1.0<br />
Acquisition cost at 31 December 1.5 1.7<br />
Book value at 31 December 1.5 1.7<br />
12. Tangible assets<br />
Land and waters<br />
Acquisition cost at 1 January 111.4 112.2<br />
Increases 1.8 8.3<br />
Decreases -16.0 -9.1<br />
Acquisition cost at 31 December 97.2 111.4<br />
Book value at 31 December 97.2 111.4<br />
Buildings<br />
Acquisition cost at 1 January 514.9 513.2<br />
Increases 9.6 24.2<br />
Decreases -99.6 -26.9<br />
Transfers between items 3.1 4.4<br />
Acquisition cost at 31 December 428.0 514.9<br />
Accumulated depreciation at 1 January<br />
Accumulated depreciation on decreases<br />
205.5 181.8<br />
and transfers -35.4 -8.6<br />
Value adjustment 9.1 15.0<br />
Depreciation for the financial year 15.6 17.3<br />
Accumulated depreciation at 31 December 194.8 205.5<br />
Book value at 31 December 233.2 309.4<br />
Machinery and equipment<br />
Acquisition cost at 1 January 24.7 25.5<br />
Increases 0.8 1.0<br />
Decreases -3.6 -1.9<br />
Transfers between items 0.2 0.1<br />
Acquisition cost at 31 December 22.1 24.7<br />
Accumulated depreciation at 1 January<br />
Accumulated depreciation on decreases<br />
19.7 19.6<br />
and transfers -2.8 -1.3<br />
Depreciation for the financial year 1.3 1.5<br />
Accumulated depreciation at 31 December 18.2 19.7<br />
Book value at 31 December 3.9 5.0<br />
Other tangible assets<br />
Acquisition cost at 1 January 15.2 13.7<br />
Increases 1.1 2.8<br />
Decreases -2.6 -1.4<br />
Transfers between items 0.0 0.1<br />
Acquisition cost at 31 December 13.7 15.2<br />
Kesko financial statements <strong>2009</strong><br />
141<br />
€ million <strong>2009</strong> 2008<br />
Accumulated depreciation at 1 January 7.0 6.5<br />
Accumulated depreciation on decreases<br />
and transfers -1.3 -0.7<br />
Depreciation for the financial year 1.4 1.2<br />
Accumulated depreciation at 31 December 7.1 7.0<br />
Book value at 31 December 6.6 8.2<br />
Advance payments and construction in<br />
progress<br />
Acquisition cost at 1 January 7.1 5.4<br />
Increases 9.2 6.3<br />
Transfers between items -11.7 -4.6<br />
Acquisition cost at 31 December 4.6 7.1<br />
Book value at 31 December 4.6 7.1<br />
Revaluation of non-current assets<br />
At the end of the financial year, Kesko Corporation's balance<br />
sheet did not contain revaluations.<br />
13. Investments<br />
Holdings in Group companies<br />
Acquisition cost at 1 January 273.6 404.0<br />
Increases 28.5 3.2<br />
Decreases -38.0 -133.6<br />
Acquisition cost at 31 December 264.1 273.6<br />
Accumulated depreciation at 1 January 0.0 1.7<br />
Value adjustments 0.0 -1.7<br />
Accumulated depreciation at 31 December 0.0 0.0<br />
Book value at 31 December 264.1 273.6<br />
Participating interests<br />
Acquisition cost at 1 January 18.7 19.8<br />
Increases 0.0 0.1<br />
Decreases -0.9 -1.2<br />
Acquisition cost at 31 December 17.8 18.7<br />
Book value at 31 December 17.8 18.7<br />
Other shares and similar rights of<br />
ownership<br />
Acquisition cost at 1 January 7.3 7.3<br />
Acquisition cost at 31 December 7.3 7.3<br />
Book value at 31 December 7.3 7.3<br />
Kesko Corporation's ownership interests in other companies as at<br />
31 December <strong>2009</strong> are presented in the notes to the consolidated<br />
financial statements.<br />
During the financial year, Kesko Corporation sold some of its<br />
real estate companies.<br />
During the 2008 financial year, Kesko Corporation sold its<br />
wholly-owned subsidiaries Kauko-Telko Ltd, Tähti Optikko Group<br />
Oy and K-Rahoitus Oy. In addition, the company founded a new<br />
subsidiary, K-talouspalvelukeskus Oy. Among subsidiaries directly<br />
owned by Kesko Corporation, other changes took place in real<br />
estate companies only.
142 Kesko financial statements <strong>2009</strong><br />
€ million <strong>2009</strong> 2008<br />
14. Debtors<br />
Amounts owed by Group companies<br />
Long-term<br />
Loan receivables 360.7 389.4<br />
Subordinated loans 50.0 10.0<br />
Long-term receivables, total 410.7 399.4<br />
Short-term<br />
Trade debtors 1.1 1.0<br />
Loan receivables 294.2 541.2<br />
Prepayments and accrued income 1.5 4.4<br />
Short-term receivables, total 296.8 546.6<br />
Total 707.5 946.0<br />
Amounts owed by participating interests<br />
Long-term<br />
Loan receivables 1.5 1.5<br />
Short-term<br />
Loan receivables 2.1 3.1<br />
Short-term receivables, total 2.1 3.1<br />
Total 3.6 4.6<br />
Prepayments and accrued income<br />
Taxes 0.0 7.3<br />
Others 3.5 18.1<br />
Total 3.5 25.4<br />
Kesko Corporation has issued capital loans of €30 million, €10<br />
million and €10 million respectively to its subsidiaries Konekesko<br />
Ltd, Indoor Group Ltd and Kiinteistö Mesta Oy.<br />
The loan issued to Konekesko Ltd will mature on 31.12.2024.<br />
The capital will be repaid in fifteen equally large instalments of<br />
€2 million payable each year on 31.12., provided that the provisions<br />
of chapter 12, section 1, paragraph 1 of the Limited Liability<br />
Companies Act are fulfilled. Interest will be payable only if the<br />
amount of the company's unrestricted equity plus all capital<br />
loans at the time of repayment exceeds the amount of loss<br />
shown in the balance sheet of the financial statements to be<br />
adopted for the company's last concluded financial year or of any<br />
more recent financial statements. The annual interest payable on<br />
the loan will comprise the reference rate and a margin to be<br />
added to it. The reference rate will be the 3-month Euribor and<br />
the margin will be 0.5% p.a. The interest will be paid in arrears<br />
on 31.12. Any unpaid interest will be treated as the borrower's<br />
debt and a sum of interest will be payable annually on it, whose<br />
rate will be the same as for the interest to be paid on the capital<br />
of the loan.<br />
The loan issued to Indoor Group Ltd will mature on<br />
31.3.2014. The capital will be repaid in five equally large instalments<br />
with the first one due on 31.3.2010. The capital will be<br />
repaid only if the provisions of chapter 12, section 1, paragraph<br />
1 of the Limited Liability Companies Act are fulfilled. Interest will<br />
be payable only if the amount of the company's unrestricted<br />
equity plus all capital loans at the time of repayment exceeds the<br />
amount of loss shown in the balance sheet of the financial<br />
statements to be adopted for the company's last concluded<br />
financial year or of any more recent financial statements. If the<br />
repayment criteria are met, 10% interest will be paid on the<br />
loan.<br />
The loan issued to Kiinteistö Mesta Oy will be repaid only if,<br />
after repayment of the loan, the restricted equity shown in the<br />
balance sheet to be adopted for the borrower's last concluded<br />
financial year and all other non-distributable items are fully<br />
funded.<br />
€ million <strong>2009</strong> 2008<br />
15. Capital and reserves<br />
Share capital at 1 January 195.6 195.5<br />
Subscriptions with options 1.0 0.1<br />
Share capital at 31 December 196.6 195.6<br />
Share issue, exercise of options at 1<br />
January 0,1 -<br />
Increase 4.6 0.4<br />
Transfer to share capital -1.0 -0.1<br />
Transfer to share premium account<br />
Share issue, exercise of options at 31<br />
-3.6 -0.2<br />
December 0.0 0.1<br />
Share premium account at 1 January 190.3 190.1<br />
Subscriptions with options 3.6 0.2<br />
Share premium account at 31 December 193.9 190.3<br />
Other reserves at 1 January 243.4 243.4<br />
Other reserves at 31 December 243.4 243.4<br />
Retained earnings at 1 January 767.8 687.8<br />
Distribution of dividends -97.8 -156.4<br />
Transfer to donations -0.3 -0.3<br />
Retained earnings at 31 December 669.7 531.1<br />
Profit for the financial year 138.8 236.7<br />
Capital and reserves, total 1,442.4 1,397.2
Increase in share capital<br />
During the reporting period, the share capital was increased four<br />
times corresponding to share subscriptions with the stock options<br />
of the 2003 option scheme. The increases were made on 11<br />
February <strong>2009</strong> (€52,392), 5 May <strong>2009</strong> (€51,250), 5 June <strong>2009</strong><br />
(€673,146) and 17 December <strong>2009</strong> (€216,562), and announced<br />
in stock exchange notifications on the same days. The subscribed<br />
shares were included on the main list of the Helsinki stock<br />
exchange for public trading with the old B shares on 12 February<br />
<strong>2009</strong>, 6 May <strong>2009</strong>, 8 June <strong>2009</strong> and 18 December <strong>2009</strong>.<br />
Distributable reserves<br />
Other reserves 243.4 243.4<br />
Retained earnings 669.7 531.1<br />
Profit for the financial year 138.8 236.7<br />
Total 1,051.9 1,011.2<br />
Breakdown of the parent company's share capital<br />
pcs<br />
counter<br />
value, € € million<br />
A shares 31,737,007 2 63.5<br />
B shares 66,584,522 2 133.2<br />
Total 98,321,529 196.6<br />
Voting rights carried by shares<br />
number of<br />
votes<br />
A share 10<br />
B share 1<br />
2003 and 2007 stock option plans<br />
On 31 March 2003, the <strong>Annual</strong> General Meeting resolved to gratuitously<br />
issue a total of 1,800,000 share options to the management<br />
of the Kesko Group as well as to a wholly-owned subsidiary<br />
of Kesko Corporation. A deviation was made from the<br />
shareholders' pre-emptive right to subscription since the options<br />
form a part of the incentive and commitment programme for the<br />
management. Each option entitles the holder to subscribe for<br />
one new Kesko Corporation B share. The options are marked with<br />
symbols 2003D (KESBVEW103), 2003E (KESBVEW203) and 2003F<br />
(KESBVEW303) in units of 600,000 options each.<br />
The <strong>Annual</strong> General Meeting of 26 March 2007 decided to<br />
grant a total of 3,000,000 stock options for no consideration to<br />
the Kesko Group management and the management of the other<br />
Group companies, to the rest of the key Kesko personnel, and to<br />
Sincera Oy, a subsidiary wholly owned by Kesko Corporation. A<br />
deviation was made from the shareholders' pre-emptive right to<br />
subscription since the options form a part of the incentive and<br />
commitment programme for the management. Each stock option<br />
entitles its holder to subscribe for one new Kesko Corporation B<br />
share. The stock options shall be marked with symbols 2007A,<br />
2007B and 2007C in units of 1,000,000 options each.<br />
Percentage of issued stock options<br />
out of all shares and votes<br />
If shares were subscribed for with all exercisable options, the<br />
shares subscribed for with all the 2003 and 2007 plan options<br />
would account for 4.67% of shares and 1.23% of all votes. The<br />
Kesko financial statements <strong>2009</strong><br />
143<br />
subscriptions made with stock options could raise the number<br />
of the company's shares to 101,688,793. As a result of the subscriptions,<br />
the voting rights carried by all shares could increase<br />
to 387,321,856 votes.<br />
The company has not granted other options or special rights<br />
entitling to shares.<br />
Authorisations of the Board of Directors<br />
<strong>Kesko's</strong> <strong>Annual</strong> General Meeting of 30 March <strong>2009</strong> authorised the<br />
Board to decide about the issuance of new B shares.<br />
B shares can be issued against payment to the company's<br />
existing shareholders in proportion to their existing shareholdings<br />
regardless of whether they consist of A or B shares, or, deviating<br />
from shareholders' pre-emptive rights in order for the<br />
issued shares to be used as consideration in possible company<br />
acquisitions, other company business arrangements, or to<br />
finance investments. The maximum number of new shares<br />
issued is 20,000,000.<br />
The Board of Directors was also authorised to decide about the<br />
subscription price of the shares, to issue shares against non-cash<br />
consideration, and to make decisions concerning any other matters<br />
relating to share issues.<br />
The authorisation is valid until 30 March 2012.<br />
The Board of Directors has no other authorisation concerning<br />
an issue of rights, convertible bonds or options valid at the<br />
moment.<br />
€ million <strong>2009</strong> 2008<br />
16. Appropriations<br />
Depreciation reserve 91.6 131.2<br />
Total 91.6 131.2<br />
17. Provisions<br />
Future rent expenses for vacant business<br />
premises 5.7 5.2<br />
Other provisions 2.1 3.1<br />
Total 7.8 8.3<br />
18. Non-current creditors<br />
Debt falling due later than within<br />
five years<br />
Private placement bonds 100.4 100.4<br />
Loans from credit institutions 38.2 20.5<br />
Total 138.6 120.9<br />
On 10 June 2004, Kesko Corporation issued a private placement<br />
of USD 120 million in the US. The arrangement consists of three<br />
bullet loans: a 10-year loan (USD 60 million), a 12-year loan<br />
(USD 36 million) and a 15-year loan (USD 24 million). Kesko has<br />
hedged the loan by using currency and interest rate swaps, as a<br />
result of which the loan capital totals €100.4 million and the<br />
fixed capital-weighted average interest rate is 5.4%.
144 Kesko financial statements <strong>2009</strong><br />
€ million <strong>2009</strong> 2008<br />
19. Current creditors<br />
Debt to Group companies<br />
Trade creditors 0.1 0.6<br />
Other creditors 237.1 349.8<br />
Accruals and deferred income 1.8 1.7<br />
Total 239.0 352.1<br />
Amounts owed to participating interests<br />
Other creditors 38.4 37.2<br />
Total 38.4 37.2<br />
Accruals and deferred income<br />
Staff expenses 2.5 2.6<br />
Taxes 12.1 0.0<br />
Others 11.3 12.1<br />
Total 25.9 14.7<br />
20. Interest-free debt<br />
Current creditors 32.0 21.3<br />
Total 32.0 21.3<br />
Other notes<br />
€ million <strong>2009</strong> 2008<br />
21. Guarantees and contingent liabilities<br />
Real estate mortgages<br />
For own debt 7 6<br />
For Group companies 10 10<br />
Pledged shares 39 14<br />
Guarantees<br />
For own debt 3 1<br />
For Group companies 36 58<br />
For others 0 1<br />
Other contingent liabilities<br />
For own debt 15 10<br />
Rent liabilities on machinery and fixtures<br />
Falling due within a year 0 1<br />
Falling due later 0 0<br />
Rent liabilities on real estate<br />
Falling due within a year 81 82<br />
Falling due later 463 422<br />
€ million <strong>2009</strong><br />
Liabilities arising from derivative<br />
instruments<br />
Value of underlying<br />
instruments at 31 Dec.<br />
Fair<br />
value 2008<br />
Fair<br />
value<br />
Interest rate derivatives<br />
Forward and future contracts 12 -0.1 -<br />
Interest rate swaps 201 0.7 201 9.9<br />
Currency derivatives<br />
Forward and future contracts<br />
Outside the Group 437 -6.6 333 6.6<br />
Inside the Group<br />
Option agreements<br />
9 0.1 20 1<br />
Bought - - - -<br />
Written 5 0 5 -0.1<br />
Currency swaps 100 -17.2 100 -14.2<br />
Commodity derivatives<br />
Electricity derivatives<br />
Outside the Group 40 -5.0 46 -10.8<br />
Inside the Group 40 5.0 46 10.8<br />
Grain derivatives 0 0.0 1 0.0
Signatures<br />
Signatures<br />
Helsinki, 4 February 2010<br />
Heikki Takamäki Seppo Paatelainen<br />
Esa Kiiskinen Ilpo Kokkila Mikko Kosonen<br />
Maarit Näkyvä Rauno Törrönen Matti Halmesmäki<br />
Managing Director<br />
To the <strong>Annual</strong> General Meeting of Kesko<br />
Corporation<br />
We have audited the accounting records, the financial statements,<br />
the report of the Board of Directors and the administration<br />
of Kesko Corporation for the year ended on 31 December,<br />
<strong>2009</strong>. The financial statements comprise the consolidated statement<br />
of financial position, income statement, statement of comprehensive<br />
income, statement of changes in equity, statement of<br />
cash flows and notes to the consolidated financial statements, as<br />
well as the parent company's statement of financial position,<br />
income statement, statement of cash flows and notes to the<br />
financial statements.<br />
Responsibility of the Board of Directors and<br />
the Managing Director<br />
The Board of Directors and the Managing Director are responsible<br />
for the preparation of the financial statements and the report of<br />
the Board of Directors and for the fair presentation of the consolidated<br />
financial statements in accordance with International<br />
Financial <strong>Report</strong>ing Standards (IFRS) as adopted by the EU, as well<br />
as for the fair presentation of the financial statements and the<br />
report of the Board of Directors in accordance with laws and regulations<br />
governing the preparation of the financial statements<br />
and the report of the Board of Directors in Finland. The Board of<br />
Directors is responsible for the appropriate arrangement of the<br />
control of the company’s accounts and finances, and the Managing<br />
Director shall see to it that the accounts of the company are<br />
in compliance with the law and that its financial affairs have<br />
been arranged in a reliable manner.<br />
Auditor’s Responsibility<br />
Our responsibility is to perform an audit in accordance with good<br />
auditing practice in Finland, and to express an opinion on the<br />
parent company’s financial statements, on the consolidated<br />
The Auditor's Note<br />
Kesko financial statements <strong>2009</strong><br />
Our auditors' report has been issued today.<br />
Helsinki, 9 February 2010<br />
PricewaterhouseCoopers Oy<br />
Authorised Public Accountants<br />
Johan Kronberg<br />
APA<br />
Auditor’s <strong>Report</strong> (Translation from the Finnish Original)<br />
145<br />
financial statements and on the report of the Board of Directors<br />
based on our audit. Good auditing practice requires that we<br />
comply with ethical requirements and plan and perform the<br />
audit to obtain reasonable assurance whether the financial<br />
statements and the report of the Board of Directors are free from<br />
material misstatement and whether the members of the Board of<br />
Directors of the parent company and the Managing Director have<br />
complied with the Limited Liability Companies Act.<br />
An audit involves performing procedures to obtain audit evidence<br />
about the amounts and disclosures in the financial statements<br />
and the report of the Board of Directors. The procedures<br />
selected depend on the auditor’s judgment, including the<br />
assessment of the risks of material misstatement of the financial<br />
statements and of the report of the Board of Directors, whether<br />
due to fraud or error. In making those risk assessments, the<br />
auditor considers internal control relevant to the entity’s preparation<br />
and fair presentation of the financial statements and the<br />
report of the Board of Directors in order to design audit procedures<br />
that are appropriate in the circumstances. An audit also<br />
includes evaluating the appropriateness of accounting policies<br />
used and the reasonableness of accounting estimates made by<br />
management, as well as evaluating the overall presentation of<br />
the financial statements and the report of the Board of Directors.<br />
The audit was performed in accordance with good auditing<br />
practice in Finland. We believe that the audit evidence we have<br />
obtained is sufficient and appropriate to provide a basis for our<br />
audit opinion.<br />
Opinion on the Consolidated Financial Statements<br />
In our opinion, the consolidated financial statements give a true<br />
and fair view of the financial posi-tion, financial performance<br />
and cash flows of the group in accordance with International<br />
Financial <strong>Report</strong>ing Standards (IFRS) as adopted by the EU.
146 Kesko financial statements <strong>2009</strong><br />
Opinion on the Company’s Financial Statements<br />
and the <strong>Report</strong> of the Board of Directors<br />
In our opinion, the financial statements and the report of the<br />
Board of Directors give a true and fair view of both the consolidated<br />
and the parent company's financial performance and<br />
financial position in accordance with the laws and regulations<br />
governing the preparation of the financial statements and the<br />
report of the Board of Directors in Finland. The information in the<br />
report of the Board of Directors is consistent with the information<br />
in the financial statements.<br />
Other Opinions<br />
We support that the financial statements should be adopted. The<br />
proposal by the Board of Directors regarding the use of distribut-<br />
Shares and shareholders<br />
Dividend policy<br />
On 4 February <strong>2009</strong>, <strong>Kesko's</strong> Board of Directors decided to revise<br />
<strong>Kesko's</strong> dividend policy published on 6 April 2005. In addition to<br />
the financial position and the operating strategy, the new policy<br />
takes account of the nature of non-recurring items. According to<br />
Kesko Corporation's revised dividend policy, Kesko Corporation<br />
distributes at least 50% of its earnings per share excluding nonrecurring<br />
items as dividends, taking however the company's<br />
financial position and operating strategy into account (stock<br />
exchange release 5 February <strong>2009</strong>).<br />
The financial objectives are presented on page 10.<br />
Proposed dividends for the year <strong>2009</strong><br />
Kesko Corporation's Board of Directors proposes to the <strong>Annual</strong><br />
General Meeting that €88,547,166.90 or €0.90 per share, be<br />
distributed as dividends from the net profit for the year <strong>2009</strong>,<br />
representing 70.5% of earnings per share and 126,8% of earnings<br />
per share excluding non-recurring items. During the past<br />
five years 83.4% of earnings per share excluding non-recurring<br />
items, on the average, has been distributed as dividends.<br />
Basic information on the shares<br />
at 31 December <strong>2009</strong><br />
A share<br />
• shortname: KESAV (OMX)<br />
• ISIN code: FI0009007900<br />
• voting rights per share: 10 votes<br />
• number of shares: 31,737,007<br />
• market capitalisation: €749 million<br />
B share<br />
• shortname: KESBV (OMX)<br />
• ISIN code: FI0009000202<br />
• voting rights per share: 1 vote<br />
• number of shares: 66,584,522<br />
• market capitalisation: €1,537 million<br />
able funds shown in the statement of financial position is in<br />
compliance with the Limited Liability Companies Act. We support<br />
that the Members of the Board of Directors and the Managing<br />
Director should be discharged from liability for the financial<br />
period audited by us.<br />
Helsinki, 9 February 2010<br />
PricewaterhouseCoopers Oy<br />
Authorised Public Accountants<br />
Johan Kronberg<br />
Authorised Public Accountant<br />
Trading unit of both share series: 1 share<br />
Total share capital: €196,643,058<br />
Total number of shares: 98,321,529<br />
Voting rights carried by all shares: 383,954,592<br />
Market capitalisation: €2,286 million<br />
Share series and share capital<br />
Kesko Corporation's share capital is divided into A share series<br />
and B share series. The company's share capital was<br />
€196,643,058.<br />
The minimum number of A shares is one (1) and the maximum<br />
number two hundred and fifty million (250,000,000) and<br />
the minimum number of B shares is one (1) and the maximum<br />
number two hundred and fifty million (250,000,000), provided<br />
that the total number of shares is at minimum two (2) and at<br />
maximum four hundred million (400,000,000). The total number<br />
of shares is 98,321,529, of which 31,737,007 (32.3%) are A<br />
shares and 66,584,522 (67.7%) are B shares.<br />
Each A share entitles the holder to 10 votes and each B share<br />
to 1 vote. Both shares give the same dividend rights. The number<br />
of votes entitled by A shares is 83% and the number of votes<br />
entitled by B shares 17% of the total voting rights.<br />
The shares are included in the book-entry securities system<br />
held by Euroclear Finland Ltd.<br />
The right to receive distributions from the company and the<br />
right to subscribe for shares when the share capital is increased<br />
belongs only to those:<br />
who are registered as shareholders in the shareholder register<br />
•<br />
on the record date<br />
whose right to receive funds has been entered by the record<br />
•<br />
date into the book-entry securities account of the shareholder<br />
registered in the shareholder register, and registered in the<br />
shareholder register, and<br />
if a share has been registered in a nominee name, into whose<br />
•<br />
book-entry securities account the share has been entered by
the record date, and whose custodian has been registered in<br />
the shareholder register as the custodian of the shares by the<br />
record date<br />
Authorisations of the Board of Directors and<br />
treasury shares<br />
<strong>Kesko's</strong> <strong>Annual</strong> General Meeting held on 30 March <strong>2009</strong> authorised<br />
the company's Board of Directors to decide about the issuance<br />
of new B shares. The new shares can be issued against payment<br />
either in a directed issue to the company's existing shareholders<br />
in proportion to their existing shareholdings regardless of<br />
whether they consist of A or B shares; or in a directed issue deviating<br />
from the shareholders' pre-emptive rights in order for the<br />
issued shares to be used as consideration in possible company<br />
acquisitions, other company business arrangements, or to<br />
finance investments. The company must have a weighty financial<br />
reason for deviating from the shareholders' pre-emptive rights.<br />
The authorisation is for the issuance of up to 20,000,000 new<br />
shares. The subscription price is recognised in the reserve of<br />
invested non-restricted equity.<br />
The Board of Directors was also given the authority to decide<br />
about the subscription price of the shares, to issue shares against<br />
non-cash consideration, and to make decisions concerning any<br />
other matters relating to share issues. The share issue authorisation<br />
will be valid until 30 March 2012. The authorisation has not<br />
been used.<br />
In addition, the company operates the 2003 and 2007 option<br />
plans. The exercise periods of the 2003 plan options have<br />
expired except for the 2003F options, whose exercise period will<br />
expire on 30 April 2010.<br />
The Board of Directors has no other valid authorisations to<br />
issue shares, to increase share capital, or to acquire or assign the<br />
company's shares.<br />
Kesko Corporation or its subsidiaries held no Kesko Corporation<br />
shares.<br />
Shareholders<br />
According to the register of <strong>Kesko's</strong> shareholders kept by the<br />
Euroclear Finland Ltd, there were 38,888 shareholders at the end<br />
of <strong>2009</strong> (38,080 at the end of 2008). The total number of shares<br />
registered in a nominee name was 19,352,409, accounting for<br />
19.68% of the shares (18,909,587 and 19.33% respectively at<br />
the end of 2008). The number of votes entitled by these shares<br />
was 19,875,903 or 5.18% of the total voting rights (19,535,132<br />
or 5.09% respectively at the end of 2008). A list of <strong>Kesko's</strong> largest<br />
shareholders, updated monthly, is available at www.kesko.fi/<br />
investors.<br />
The 2003 stock option scheme<br />
On 31 March 2003, the <strong>Annual</strong> General Meeting resolved to gratuitously<br />
issue a total of 1,800,000 stock options to the management<br />
of the Kesko Group as well as to a wholly-owned subsidiary<br />
of Kesko Corporation. A deviation was made from the shareholders'<br />
pre-emptive right to subscription since the stock options<br />
form a part of the incentive and commitment programme for the<br />
management. The scheme comprises approximately 60 persons.<br />
Kesko financial statements <strong>2009</strong><br />
147<br />
Each stock option entitles its owner to subscribe for one Kesko<br />
Corporation B share. The stock options have been marked with<br />
shortnames 2003D (KESBVEW103, ISIN code FI0009609317),<br />
2003E (KESBVEW203, ISIN code FI0009609325), and 2003F<br />
(KESBVEW303, ISIN code FI0009609333), in units of 600,000<br />
stock options each.<br />
The share subscription periods are:<br />
• for stock option 2003D 1 April 2005 - 30 April 2008,<br />
• for stock option 2003E 1 April 2006 - 30 April <strong>2009</strong>, and<br />
• for stock option 2003F 1 April 2007 - 30 April 2010.<br />
The original share subscription price for stock option 2003D<br />
was the trade volume weighted average price of a Kesko Corporation<br />
B share on the Helsinki Stock Exchange between 1 to 30<br />
April 2003 (€9.63), for stock option 2003E, the corresponding<br />
price between 1 to 30 April 2004 (€15.19) and for stock option<br />
2003F, the corresponding price between 1 to 30 April 2005<br />
(€19.08). From the prices of shares subscribed for with stock<br />
options shall be deducted the amount of the dividend per share<br />
distributed after the above period for the determination of the<br />
subscription price has ended but before the date of subscription<br />
for shares.<br />
At the end of <strong>2009</strong>, the subscription price of a B share subscribed<br />
for with stock option 2003F was €13.88. The subscription<br />
period for stock option 2003D ended on 30 April 2008, and for<br />
2003E on 30 April <strong>2009</strong>. Dividend rights and other shareholder<br />
rights of the share subscribed for with options take effect when<br />
the share capital increase has been entered in the Trade Register.<br />
The 2007 stock option scheme<br />
The <strong>Annual</strong> General Meeting of 26 March 2007 decided to grant a<br />
total of 3,000,000 stock options for no consideration to the<br />
Kesko Group management and other key Kesko personnel, and to<br />
a subsidiary wholly owned by Kesko Corporation. The company<br />
had a weighty financial reason for granting stock options because<br />
they are intended to be part of <strong>Kesko's</strong> share-based incentive<br />
system.<br />
Each stock option entitles its holder to subscribe for one new<br />
Kesko Corporation B share. The stock options shall be marked<br />
with symbols 2007A, 2007B and 2007C in units of 1,000,000<br />
options each.<br />
The exercise periods of the options shall be:<br />
• for stock option 2007A, from 1 April 2010 until 30 April 2012,<br />
• for stock option 2007B, from 1 April 2011 until 30 April 2013<br />
and<br />
• for stock option 2007C, from 1 April 2012 until 30 April 2014.<br />
The original subscription price for stock option 2007A was the<br />
trade volume weighted average quotation of a Kesko Corporation<br />
B share on the Helsinki Stock Exchange between 1 April and 30<br />
April 2007 (€45.82), for stock option 2007B between 1 April and<br />
30 April 2008 (€26.57), and for stock option 2007C between<br />
1 April and 30 April <strong>2009</strong> (€16.84). The subscription prices of<br />
shares subscribed for with stock options shall be reduced by the<br />
amount decided after the beginning of the period for the determination<br />
of the subscription price but before the subscription as
148 Kesko financial statements <strong>2009</strong><br />
at the record date for each dividend distribution or other distribution<br />
of funds.<br />
If shares were subscribed for with all exercisable options, the<br />
shares subscribed for with all the 2003 and 2007 plan options<br />
would account for 4.67% of shares and 1.23% of all votes. The<br />
subscriptions made with stock options could raise the number of<br />
the company's shares to 101,688,793. As a result of the subscriptions,<br />
the voting rights carried by all shares could increase to<br />
387,321,856 votes.<br />
Share subscriptions made with stock options<br />
In <strong>2009</strong>, the share capital was increased four times corresponding<br />
to share subscriptions with the stock options of the 2003<br />
option scheme. The increases were made on 11 February <strong>2009</strong><br />
(€52,392), 5 May <strong>2009</strong> (€51,250), 5 June <strong>2009</strong> (€673,146) and<br />
17 December <strong>2009</strong> (€216,562). In <strong>2009</strong>, the share capital was<br />
increased by a total of €993,350 (496,675 shares).<br />
By the end of <strong>2009</strong>, 574,088 B shares had been subscribed<br />
for with the 2003D options (subscription period has ended),<br />
576,000 with the 2003E options (subscription period has<br />
ended), and 232,736 with the 2003F options, or 1,382,824 B<br />
shares in aggregate. The subscribed shares have been included in<br />
the main list of the NASDAQ OMX Helsinki stock exchange for public<br />
trading.<br />
Other special shareholding rights<br />
The company has not issued other stock options, convertible<br />
bonds, bonds with warrants or other special rights to company<br />
shares.<br />
Shares and options held by the management<br />
At the end of <strong>2009</strong>, the members of Kesko Corporation's Board of<br />
Directors, the President and CEO and the corporations under their<br />
control held 224,720 Kesko Corporation A shares (202,910 at the<br />
end of 2008) and 100,820 Kesko Corporation B shares (210,370),<br />
i.e. a total of 325,540 shares (413,280), which represented<br />
0.33% (0.42%) of the company's total share capital and 0.61%<br />
(0.58%) of its voting rights.<br />
At the end of <strong>2009</strong>, the company's President and CEO held a<br />
total of 150,000 Kesko Corporation options (100,000 at the end<br />
of 2008), which represented 0.15% (0.10%) of the company's<br />
total share capital and 0.04% (0.03%) of voting rights, presuming<br />
that shares have been subscribed for with all of these<br />
options. No Board members held stock options at the end of<br />
<strong>2009</strong> (nor at the end of 2008).<br />
Detailed information on shares and options held by the management<br />
at the beginning and at the end of <strong>2009</strong> is given on<br />
pages 66–69.<br />
Trading in <strong>Kesko's</strong> shares and<br />
stock options in <strong>2009</strong><br />
Kesko Corporation's shares are listed on the NASDAQ OMX Helsinki<br />
Ltd Helsinki stock exchange. Key information about share trading<br />
in <strong>2009</strong> is given in the tables and graphs on this double page<br />
spread. The price trends of both shares followed the general<br />
share price trend. The prices of liquid B shares rose by 30 percent<br />
and those of less liquid A shares by 7 percent, while the NASDAQ<br />
OMX Helsinki All Share Index was up 19 percent. The trading in B<br />
shares dropped by over one third, and the value traded almost<br />
halved. The number of A shares traded also decreased by about<br />
30% compared with the previous year, and the value traded represented<br />
only about one half of last year's level. At the end of the<br />
year, the market capitalisation of A shares was €749 million and<br />
that of B shares €1,537 million. The total market capitalisation of<br />
the company was €2,286 million, an increase of €411 million, or<br />
22% during the year.<br />
Flagging notifications<br />
Kesko Corporation did not receive any flagging notification during<br />
<strong>2009</strong>.<br />
The company has not been informed of any agreements relating<br />
to its share ownership or the exercise of its voting rights.
Share performance<br />
indicators<br />
Trading volume of Kesko B share<br />
Earnings per share and<br />
dividend per share, €<br />
4.0<br />
3.5<br />
3.0<br />
2.5<br />
2.0<br />
1.5<br />
1.0<br />
0.5<br />
0<br />
Equity per share, €, at 31 Dec., adjusted<br />
25<br />
20<br />
15<br />
10<br />
5<br />
0<br />
Kesko financial statements <strong>2009</strong><br />
*<br />
4<br />
0<br />
2005 2006 2007 2008 <strong>2009</strong> 2005 2006 2007 2008 <strong>2009</strong><br />
Earnings/share, basic<br />
Non-recurring items Dividend<br />
* Proposal to the AGM<br />
Average share price, € Share trading, pcs<br />
60<br />
50<br />
40<br />
30<br />
20<br />
10<br />
1/2005<br />
1/2006 1/2007<br />
B share Trading volume (1,000 pcs)<br />
NASDAQ OMX Helsinki CAP NASDAQ OMX Helsinki<br />
Share price per earnings, P/E ratio,<br />
at 31 Dec., adjusted<br />
A share B share<br />
Number of shareholders,<br />
at 31 Dec.<br />
40,000<br />
35,000<br />
30,000<br />
25,000<br />
20,000<br />
15,000<br />
10,000<br />
5,000<br />
0<br />
2005 2006 2007 2008 <strong>2009</strong> 2005 2006 2007 2008 <strong>2009</strong><br />
14,000<br />
12,000<br />
10,000<br />
8,000<br />
6,000<br />
4,000<br />
2,000<br />
0<br />
1/2008 12/<strong>2009</strong><br />
Market capitalisation of Kesko shares<br />
Kesko, € million<br />
6,000<br />
5,000<br />
4,000<br />
3,000<br />
2,000<br />
1,000<br />
0<br />
1/2005<br />
A share B share<br />
20<br />
16<br />
12<br />
8<br />
1/2006 1/2007<br />
1/2008 12/<strong>2009</strong><br />
149
150 Kesko financial statements <strong>2009</strong><br />
The latest changes is share capital<br />
Year Subscription period<br />
Subscription ratio and<br />
price per option type Change New share capital, €<br />
2005 15.2.2005 1:1 à 8.87 € B stock option<br />
1:1 à 7.11 € C stock option<br />
€ 2,656,500 € 190,337,584<br />
2005 4.5.2005 1:1 à 7.87 € B stock option<br />
1:1 à 6.11 € C stock option<br />
1:1 à 5.63 € D stock option<br />
€ 912,390 € 191,249,974<br />
2005 8.6.2005 1:1 à 7.87 € B stock option<br />
1:1 à 6.11 € C stock option<br />
1:1 à 5.63 € D stock option<br />
€ 536,600 € 191,786,574<br />
2005 3.8.2005 1:1 à 7.87 € B stock option<br />
1:1 à 6.11 € C stock option<br />
1:1 à 5.63 € D stock option<br />
€ 172,676 € 191,959,250<br />
2005 28.9.2005 1:1 à 7.87 € B stock option<br />
1:1 à 6.11 € C stock option<br />
1:1 à 5.63 € D stock option<br />
€ 588,700 € 192,547,950<br />
2005 2.11.2005 1:1 à 7.87 € B stock option<br />
1:1 à 6.11 € C stock option<br />
1:1 à 5.63 € D stock option<br />
€ 97,960 € 192,645,910<br />
2005 20.12.2005 1:1 à 7.87 € B stock option<br />
1:1 à 6.11 € C stock option<br />
1:1 à 5.63 € D stock option<br />
€ 321,942 € 192,967,852<br />
2006 13.2.2006 1:1 à 7.87 € B stock option<br />
1:1 à 6.11 € C stock option<br />
1:1 à 5.63 € D stock option<br />
€ 640,500 € 193,608,352<br />
2006 4.5.2006 1:1 à 7.87 € B stock option<br />
1:1 à 6.77 € B stock option<br />
1:1 à 6.11 € C stock option<br />
1:1 à 5.01 € C stock option<br />
1:1 à 4.53 € D stock option<br />
€ 938,058 € 194,546,410<br />
2006 9.6.2006 1:1 à 4.53 € D stock option<br />
1:1 à 12.09 € E stock option<br />
€ 59,200 € 194,605,610<br />
2006 7.8.2006 1:1 à 4.53 € D stock option<br />
1:1 à 12.09 € E stock option<br />
€ 118,000 € 194,723,610<br />
2006 3.10.2006 1:1 à 4.53 € D stock option<br />
1:1 à 12.09 € E stock option<br />
€ 94,800 € 194,818,410<br />
2006 1.11.2006 1:1 à 4.53 € D stock option<br />
1:1 à 12.09 € E stock option<br />
€ 157,200 € € 194,975,610<br />
2006 21.12.2006 1:1 à 4.53 € D stock option<br />
1:1 à 12.09 € E stock option<br />
€ 64,240 € 195,039,850<br />
2007 12.2.2007 1:1 à 4.53 € D stock option<br />
1:1 à 12.09 € E stock option<br />
€ 46,376 € 195,086,226<br />
2007 26.4.2007 1:1 à 3.03 € D stock option<br />
1:1 à 10.59 € E stock option<br />
€ 86,800 € 195,173,026<br />
2007 29.5.2007 1:1 à 3.03 € D stock option<br />
1:1 à 10.59 € E stock option<br />
1:1 à 16.48 € F stock option<br />
€ 298,572 € 195,471,598<br />
2007 24.7.2007 1:1 à 3.03 € D stock option<br />
1:1 à 10.59 € E stock option<br />
€ 9,000 € 195,480,598<br />
2007 26.9.2007 1:1 à 3.03 € D stock option<br />
1:1 à 16.48 € F stock option<br />
€ 39,032 € 195,519,630<br />
2007 19.12.2007 1:1 à 3.03 € D stock option<br />
1:1 à 10.59 € E stock option<br />
€ 15,900 € 195,535,530<br />
2008 11.2.2008 1:1 à 3.03 € D stock option<br />
1:1 à 10.59 € E stock option<br />
€ 210 € 195,535,740<br />
2008 28.4.2008 1:1 à 3.03 € D stock option<br />
1:1 à 2.00 € D stock option<br />
1:1 à 8.99 € E stock option<br />
€ 38,168 € 195,573,908<br />
2008 9.6.2008 1:1 à 2.00 € D stock option<br />
1:1 à 14.88 € F stock option<br />
€ 42,200 € 195,616,108<br />
2008 28.7.2008 1:1 à 8.99 € E stock option € 8,600 € 195,624,708<br />
2008 1.10.2008 1:1 à 8.99 € E stock option € 4,000 € 195,628,708<br />
2008 27.10.2008 1:1 à 8.99 € E stock option € 6,000 € 195,634,708<br />
2008 18.12.2008 1:1 à 8.99 € E stock option € 7,500 € 195,649,708<br />
<strong>2009</strong> 11.2.<strong>2009</strong> 1:1 à 8.99 € E stock option € 52,392 € 195,702,100<br />
<strong>2009</strong> 5.5.<strong>2009</strong> 1:1 à 8.99 € E stock option<br />
1:1 à 7.99 € E stock option<br />
€ 51,250 € 195,753,350<br />
<strong>2009</strong> 5.6.<strong>2009</strong> 1:1 à 7.99 € E stock option<br />
1:1 à 13.88 € F stock option<br />
€ 673,146 € 196,426,496<br />
<strong>2009</strong> 17.12.<strong>2009</strong> 1:1 à 13.88 € F stock option € 216,562 € 196,643,058
Prices and trading of Kesko A and B shares on the Helsinki Stock Exchange in <strong>2009</strong><br />
Share Share price, €<br />
31 Dec. 2008<br />
Share price, €<br />
31 Dec. <strong>2009</strong> Change,% Lowest price, € Highest price, €<br />
Kesko financial statements <strong>2009</strong><br />
151<br />
Trading volume, Total value traded,<br />
1,000 pcs € million<br />
A share 22.00 23.60 +7.3 18.73 25.00 993 21,955<br />
B share 17.80 23.08 +29.7 14.99 24.00 78,189 1,500,605<br />
During the year, the NASDAQ OMXHelsinki All Share Index rose by 19.5% and the NASDAQ OMXHelsinkiCAP Index by 36.2%, and<br />
the Helsinki Stock Exchange Consumer Staples Index by 30.8%. Up-to-date information on shares and shareholders is available at<br />
www.kesko.fi<br />
10 largest shareholders by number of shares (A- and B-series) at 31.12.<strong>2009</strong><br />
Number of shares, pcs % of shares Number of votes % of votes<br />
1 Kesko Pension Fund 4,438,885 4.51 35,388,850 9.22<br />
2 The K-Retailers´ Association 3,400,724 3.46 33,639,590 8.76<br />
3 Vähittäiskaupan Takaus Oy 2,991,771 3.04 26,648,568 6.94<br />
4 Ilmarinen Mutual Pension Insurance Company 1,938,980 1.97 3,916,838 1.02<br />
5 Valluga-sijoitus Oy 1,340,439 1.36 13,404,390 3.49<br />
6 Varma Mutual Pension Insurance Company 1,210,986 1.23 1,210,986 0.32<br />
7 Tapiola Mutual Pension Insurance Company 1,019,858 1.04 1,019,858 0.27<br />
8 Oy The English Tearoom Ab 1,008,400 1.03 1,008,400 0.26<br />
9 Foundation for Vocational Training in the Retail Trade 936,085 0.95 7,989,898 2.08<br />
10 The State Pension Fund 850,000 0.86 850,000 0.22<br />
10 largest, total 19,136,128 19.45 125,077,378 32.58<br />
Ownership structure 31.12.<strong>2009</strong><br />
All shares Number of shares % of all shares<br />
Non-financial corporations and housing corporations 25,624,351 26.06<br />
Financial and insurance corporations 6,101,976 6.21<br />
General Government* 11,342,495 11.54<br />
Households 28,889,275 29.38<br />
Non-profit institutions serving households** 6,238,327 6.34<br />
Rest of the world 772,696 0.79<br />
Nominee registered 19,352,409 19.68<br />
Total 98,321,529 100.00<br />
A shares Number of shares % of A shares % of all shares<br />
Non-financial corporations and housing corporations 18,335,606 57.77 18.65<br />
Financial and insurance corporations 1,384,377 4.36 1.41<br />
General Government* 3,662,847 11.54 3.73<br />
Households 6,677,770 21.04 6.79<br />
Non-profit institutions serving households** 1,613,405 5.08 1.64<br />
Rest of the world 4,836 0.02 0.00<br />
Nominee registered 58,166 0.18 0.06<br />
Total 31,737,007 100.00 32.28<br />
B shares Number of shares % of B shares % of all shares<br />
Non-financial corporations and housing corporations 7,288,745 10.95 7.41<br />
Financial and insurance corporations 4,717,599 7.09 4.80<br />
General Government* 7,679,648 11.53 7.81<br />
Households 22,211,505 33.36 22.59<br />
Non-profit institutions serving households** 4,624,922 6.95 4.70<br />
Rest of the world 767,860 1.15 0.78<br />
Nominee registered 19,294,243 28.98 19.62<br />
Total 66,584,522 100.00 67.72<br />
* General government includes municipalities, the provincial administration of Åland, employment pension institutions and social security funds.<br />
** Non-profit institutions include foundations awarding scholarships, organisations safeguarding certain interests, charitable associations.
152 Kesko financial statements <strong>2009</strong><br />
10 largest shareholders by number of votes at 31.12.<strong>2009</strong><br />
Number of shares % of shares Number of votes % of votes<br />
1 Kesko Pension Fund 4,438,885 4.51 35,388,850 9.22<br />
2 K-Retailers' Association 3,400,724 3.46 33,639,590 8.76<br />
3 Vähittäiskaupan Takaus Oy 2,991,771 3.04 26,648,568 6.94<br />
4 Valluga-sijoitus Oy 1,340,439 1.36 13,404,390 3.49<br />
5 Foundation for Vocational Training in the Retail Trade 936,085 0.95 7,989,898 2.08<br />
6 Ilmarinen Mutual Pension Insurance Company 1,938,980 1.97 3,916,838 1.02<br />
7 Ruokacity Myyrmäki Oy 389,541 0.40 3,895,410 1.01<br />
8 K-Food Retailers' Club 351,822 0.36 3,518,220 0.92<br />
9 Heimo Välinen Oy 313,707 0.32 2,961,570 0.77<br />
10 Svenska litteratursällskapet i Finland r.f. 350,000 0.36 2,150,000 0.56<br />
10 largest, total 16,451,954 16.73 133,513,334 34.77<br />
Distribution of share ownership at 31.12.<strong>2009</strong><br />
All shares<br />
Number of shares<br />
Number of<br />
shareholders % of shareholders Shares total % of shares<br />
1–100 11,057 28.43 649,923 0.66<br />
101–500 14,363 36.93 3,994,056 4.06<br />
501–1 000 5,689 14.63 4,466,636 4.54<br />
1 001–5 000 5,992 15.41 13,313,691 13.54<br />
5 001–10 000 955 2.46 6,812,170 6.93<br />
10 001–50 000 688 1.77 14,227,131 14.47<br />
50 001–100 000 80 0.21 5,661,411 5.76<br />
100 001–500 000 49 0.13 9,906,666 10.08<br />
500 001– 15 0.04 39,289,845 39.96<br />
Total 38,888 100.00 98,321,529 100.00<br />
A shares<br />
Number of shares<br />
Number of<br />
shareholders<br />
% of holders of A<br />
shares A shares total % of A shares<br />
1–100 1,707 26.41 86,919 0.27<br />
101–500 1,378 21.32 365,747 1.15<br />
501–1 000 977 15.11 841,461 2.65<br />
1 001–5 000 1,610 24.91 3,973,792 12.52<br />
5 001–10 000 405 6.27 2,856,168 9.00<br />
10 001–50 000 334 5.17 7,030,846 22.15<br />
50 001–100 000 35 0.54 2,471,378 7.79<br />
100 001–500 000 13 0.20 2,559,208 8.06<br />
500 001– 5 0.08 11,551,488 36.40<br />
Total 6,464 100.00 31,737,007 100.00<br />
B shares<br />
Number of shares<br />
Number of<br />
shareholders<br />
% of holders of B<br />
shares B shares total % of B shares<br />
1–100 10,270 29.49 612,459 0.92<br />
101–500 13,819 39.68 3,846,514 5.78<br />
501–1 000 5,000 14.36 3,864,363 5.80<br />
1 001–5 000 4,719 13.55 10,123,854 15.20<br />
5 001–10 000 554 1.59 4,032,498 6.06<br />
10 001–50 000 379 1.09 7,589,624 11.40<br />
50 001–100 000 38 0.11 2,683,974 4.03<br />
100 001–500 000 32 0.09 6,925,951 10.40<br />
500 001– 11 0.03 26,905,285 40.41<br />
Total 34,822 100.00 66,584,522 100.00<br />
* General government includes municipalities, the provincial administration of Åland, employment pension institutions and social security funds.<br />
** Non-profit institutions include foundations awarding scholarships, organisations safeguarding certain interests, charitable associations.
Share capital and shares<br />
Kesko financial statements <strong>2009</strong><br />
153<br />
2005 2006 2007 2008 <strong>2009</strong><br />
Share capital € million 193 195 196 196 197<br />
Number of shares at 31 Dec. 1,000 pcs 96,483.9 97,519.9 97,767.8 97,824.9 98,321.5<br />
Adjusted number of shares at 31 Dec 1,000 pcs 96,483.9 97,519.9 97,767.8 97,824.9 98,321.5<br />
Adjusted average number of shares during the year 1,000 pcs 97,215.5 98,027.0 98,395.3 98,256.2 98,382.2<br />
of which A shares % 33 32 32 32 32<br />
of which B shares % 67 68 68 68 68<br />
Market capitalisation, A share € million 768 1,220 1,201 698 749<br />
Market capitalisation, B share € million 1,551 2,632 2,491 1,176 1,537<br />
Number of shareholders at 31 Dec. pcs 29,339 28,414 28,925 38,080 38,888<br />
Share turnover<br />
A share € million 29 61 161 41 22<br />
B share € million 1,383 2,410 5,294 2,859 1,501<br />
Share turnover<br />
A share million pcs 1 2 4 1 1<br />
B share million pcs 66 77 122 121 78<br />
Turnover rate<br />
A share % 4.1 6.4 11.5 4.5 3.1<br />
B share % 101.5 117.1 185.3 183.3 117.4<br />
Change in turnover<br />
A share % 7.6 57.2 78.8 -61.0 -30.4<br />
B share % -24.0 15.4 58.8 -1.0 -35.4<br />
Share price at 31 Dec.<br />
A share € 24.19 38.43 37.85 22.00 23.60<br />
B share € 23.95 40.02 37.72 17.80 23.08<br />
Average share price<br />
A share € 21.93 30.10 43.85 28.30 21.92<br />
B share € 21.04 31.34 43.36 23.51 19.18<br />
Highest share price during the year<br />
A share € 24.60 38.99 53.44 38.20 25.00<br />
B share € 24.44 40.48 54.85 38.12 24.00<br />
Lowest share price over the year<br />
A share € 18.61 23.72 34.52 21.33 18.73<br />
B share € 17.80 23.80 34.40 15.31 14.99<br />
Earnings per share, diluted € 1.87 3.76 2.90 2.24 1.27<br />
Earnings per share, basic € 1.89 3.80 2.92 2.25 1.28<br />
Equity per share, adjusted € 15.35 17.94 19.53 20.09 20.39<br />
Dividend per share € 1.10 1.50 1.60 1.00 0.90*<br />
Payout ratio % 58.1 39.5 54.8 44.5 70.5*<br />
Dividend as percentage of profit excl. non-recurring items % 66.7 82.0 72.4 69.4 126.8*<br />
Cash flow from operating activities per share, adjusted € 3.07 3.35 2.52 1.37 3.86<br />
Price per earnings ratio (P/E), A share, adjusted 11.86 10.22 13.07 9.84 18.54<br />
Price per earnings ratio (P/E), B share, adjusted 11.74 10.64 13.02 7.96 18.13<br />
Dividend yield, A share % 4.6 3.9 4.2 4.6 3.8*<br />
Dividend yield, B share % 4.6 3.8 4.2 5.6 3.9*<br />
Effective dividend yield of A share for the last five periods % 15.4 29.3 26.6 10.9 9.2<br />
Effective dividend yield of B share<br />
for the last five periods % 29.2 42.8 36.1 12.9 10.3<br />
for the last ten periods % 18.6 22.7 18.7 11.7 14.9<br />
*proposal to the <strong>Annual</strong> General Meeting
154 Kesko financial statements <strong>2009</strong><br />
Information for shareholders<br />
Financial reporting calendar and<br />
key dates in 2010<br />
Year <strong>2009</strong> financial statements release 5 February 2010<br />
Year <strong>2009</strong> <strong>Annual</strong> <strong>Report</strong> and<br />
audited financial statements Week 9<br />
Year 2010 <strong>Annual</strong> General Meeting 29 March 2010<br />
Interim report for the first three months of 2010 27 April 2010<br />
Interim report for the first six months of 2010 23 July 2010<br />
Interim report for the first nine months of 2010 26 October 2010<br />
In addition, the Kesko Group's sales figures are published<br />
monthly and the K-Group's retail sales figures are published in<br />
connection with the interim reports.<br />
<strong>Annual</strong> General Meeting<br />
The <strong>Annual</strong> General Meeting of Kesko Corporation will be held in<br />
the Helsinki Fair Centre's congress wing, Messuaukio 1 (congress<br />
wing entrance), Helsinki, on 29 March 2010 at 13.00.<br />
All shareholders entered in the register of Kesko Corporation<br />
shareholders kept by Euroclear Finland Ltd on 17 March 2010<br />
(<strong>Annual</strong> General Meeting record date) are entitled to attend the<br />
<strong>Annual</strong> General Meeting.<br />
Shareholders wishing to attend the meeting should notify, not<br />
later than 24 March <strong>2009</strong> at 16.00, to Kesko Corporation/Legal<br />
Affairs, FI-00016 Kesko, by fax to +358 1053 23421, by telephone<br />
to +358 1053 23211, by e-mail to taina.hohtari@kesko.<br />
fi, or through the Internet at www.kesko.fi/investors. The notifications<br />
must be received by the end of the registration period.<br />
Any proxies authorising the holders to attend the <strong>Annual</strong> General<br />
Meeting shall be sent to the above mailing address by the end of<br />
the registration period. Holders of nominee registered shares are<br />
advised to request necessary instructions for registering in the<br />
shareholder register, submitting proxies and registering for the<br />
<strong>Annual</strong> General Meeting from their custodian banks.<br />
More information about the <strong>Annual</strong> General Meeting, attendance<br />
and decision-making is given under the heading 'Corporate<br />
Governance' on pages 54–65.<br />
The resolutions of the <strong>Annual</strong> General Meeting are published<br />
without delay after the meeting in a stock exchange release.<br />
Payment of dividends<br />
The Board of Directors has decided to propose to the <strong>Annual</strong><br />
General Meeting that a dividend of €0.90 per share be paid for<br />
<strong>2009</strong>. The dividend will be paid to all shareholders entered in<br />
the register of Kesko Corporation shareholders kept by Euroclear<br />
Finland Ltd on 1 April 2010 (record date for the payment of dividend).<br />
Registration practice takes three banking days, so the dividends<br />
are paid to those who hold the shares at the close of the<br />
date of the <strong>Annual</strong> General Meeting on 29 March 2010. Dividends<br />
of the shares traded on the date of the <strong>Annual</strong> General<br />
Meeting are paid to buyers.<br />
According to the Board of Directors' proposal, the payment of<br />
dividends starts on 12 April 2010.<br />
Financial publications<br />
Kesko publishes a printed <strong>Annual</strong> <strong>Report</strong> in Finnish and English.<br />
The company maintains an <strong>Annual</strong> <strong>Report</strong> mailing list. Those who<br />
wish to be included on the mailing list may fill in the form at<br />
www.kesko.fi/material.<br />
The financial statements release, three interim reports,<br />
monthly sales figures and other key releases are available on the<br />
company's website at www.kesko.fi/media.<br />
Kesko publishes a printed Corporate Responsibility <strong>Report</strong> in<br />
Finnish and English.<br />
Publications may be ordered from<br />
Kesko Corporation/Corporate Communications and Responsibility<br />
Satamakatu 3<br />
FI-00016 Kesko<br />
Tel. +358 1053 22404<br />
www.kesko.fi/material<br />
Changes of address<br />
Shareholders should notify changes of address to the bank, brokerage<br />
firms or other account operator with which they have a<br />
book-entry securities account.
Information about Kesko for investors<br />
Communications policy and principles<br />
The purpose of <strong>Kesko's</strong> communications is to promote the business<br />
of the Group and its business partners by taking the initiative<br />
in providing stakeholders with correct information on Group<br />
objectives and operations. The general principles followed in<br />
providing communications also include openness, topicality and<br />
truthfulness. No comments are made on confidential or unfinished<br />
business, nor on competitors' affairs.<br />
The primary objective of communications is to describe what<br />
added value Kesko and its cooperation partners generate to consumers<br />
and other customers, whose impressions and behaviour<br />
ultimately decide <strong>Kesko's</strong> success.<br />
Investor relations<br />
In line with its IR strategy, Kesko continually produces correct and<br />
up-to-date information for the markets as a basis for the formation<br />
of Kesko Corporation's share price. The aim is to make <strong>Kesko's</strong><br />
activities better known and to increase the transparency of<br />
investor information and, therefore, the attraction of Kesko as an<br />
investment target.<br />
In its investor communications, Kesko follows the principle of<br />
impartiality and publishes all investor information on its web<br />
pages in Finnish and English.<br />
Kesko publishes the printed <strong>Annual</strong> <strong>Report</strong> in Finnish and<br />
English. The financial statements release and three interim<br />
reports are available on <strong>Kesko's</strong> web pages. The company maintains<br />
the <strong>Annual</strong> <strong>Report</strong> mailing list. Those who wish to be<br />
included on the mailing list may fill in the form at www.kesko.fi/<br />
material. <strong>Kesko's</strong> stock exchange and press releases sent by<br />
e-mail can also be ordered at www.kesko.fi/material.<br />
Brokerage firms analysing Kesko:<br />
ABG Sundal Collier, Stockholm<br />
Christian Anderson<br />
Tel. +46 8 5662 8651<br />
firstname.lastname@abgsc.se<br />
Bank of Åland Plc, Helsinki Evli Pankki Oyj, Helsinki<br />
Martin Sundman<br />
Mika Karppinen<br />
Tel. +358 204 293 777<br />
Tel. +358 9 476 690<br />
firstname.lastname@alandsbanken.fi firstname.lastname@evli.com<br />
Carnegie Investment Bank AB,<br />
Finland Branch, Helsinki<br />
Tia Lehto<br />
Tel. +358 9 6187 1236<br />
firstname.lastname@carnegie.fi<br />
Cheuvreux, Stockholm<br />
Daniel Ovin<br />
Tel. +46 8 723 5175<br />
dovin@cheuvreux.com<br />
Danske Markets Equities,<br />
Helsinki<br />
Kalle Karppinen<br />
Tel. +358 10 236 4794<br />
firstname.lastname@danskebank.<br />
com<br />
Deutsche Bank, Helsinki<br />
Manu Rimpelä<br />
Tel. +358 9 2525 2550<br />
firstname.lastname@db.com<br />
Fim Pankki Oy, Helsinki<br />
Jonas Spohr<br />
Tel. +358 9 6134 6508<br />
firstname.lastname@fim.com<br />
Handelsbanken<br />
Capital Markets, Helsinki<br />
Maria Wikström<br />
Tel. +358 1044 42425<br />
mawi05@handelsbanken.se<br />
ICECAPITAL Securities Oy,<br />
Helsinki<br />
Robin Santavirta<br />
Tel. +358 9 6220 5092<br />
firstname.lastname@icecapital.fi<br />
Nordea Markets, Helsinki<br />
Hanna-Maria Heikkinen<br />
Tel. +358 9 1655 9926<br />
firstname.lastname@nordea.com<br />
Pohjola Bank Plc., Helsinki<br />
Jari Räisänen<br />
Tel. +358 1025 24504<br />
firstname.lastname@pohjola.fi<br />
SEB Enskilda, Helsinki<br />
Jutta Rahikainen<br />
Tel. +358 9 6162 8713<br />
firstname.lastname@seb.fi<br />
Sofia Bank Plc, Helsinki<br />
Paavo Ahonen<br />
Tel. +358 10 241 5192<br />
firstname.lastname@sofia.fi<br />
Kesko financial statements <strong>2009</strong><br />
Standard & Poor's Equity<br />
Research, London<br />
James Monro<br />
Tel. +44 20 7176 7798<br />
firstname_lastname@sandp.com<br />
Swedbank Markets, Helsinki<br />
Jarkko Soikkeli<br />
Tel. +358 20 746 9152<br />
firstname.lastname@swedbank.fi<br />
155<br />
Kesko arranges press conferences for analysts and the media<br />
at the time of publishing financial statements or other significant<br />
news, and holds Capital Market Days for analysts and institutional<br />
investors on various themes 1–2 times a year.<br />
Kesko observes a two-week period of silence before publishing<br />
its results releases. At other times, we are happy to answer<br />
the enquiries of analysts and investors by phone or e-mail, or at<br />
the investor meetings arranged.<br />
IR contacts<br />
Riikka Toivonen, Investor Relations Manager<br />
Tel. +358 1053 23495<br />
Mobile +358 500 708 337<br />
Arja Talma, Senior Vice President, CFO<br />
Tel. +358 1053 22113<br />
E-mail: IR@kesko.fi<br />
Corporate communications and responsibility<br />
Paavo Moilanen, Senior Vice President<br />
Tel. +358 1053 22764<br />
E-mail: firstname.lastname@kesko.fi<br />
E. Öhman J:or Securities Finland<br />
Ltd, Helsinki<br />
Elina Pennala<br />
Tel. +358 9 8866 6043<br />
firstname.lastname@ohmangroup.fi
156 Kesko financial statements <strong>2009</strong><br />
Organisation, management and contact information<br />
Kesko Corporation's Board of Directors and<br />
Corporate Management Board are presented<br />
on pages 66–67 and 68–69.<br />
Kesko Corporation<br />
Satamakatu 3, Helsinki, FI-00016 Kesko<br />
Tel. +358 10 5311, fax +358 9 174 398<br />
E-mail (unless otherwise stated):<br />
firstname.lastname@kesko.fi<br />
President and CEO Matti Halmesmäki<br />
Finance:<br />
Senior Vice President, CFO Arja Talma<br />
Corporate Accounting: Vice President,<br />
Corporate Controller Jukka Erlund<br />
Treasury: Vice President, Group Treasurer<br />
Heikki Ala-Seppälä<br />
Finance and Accounting Services:<br />
Vice President Eija Jantunen<br />
Corporate IT:<br />
Vice President, CIO Arto Hiltunen<br />
Human Resources:<br />
Senior Vice President Riitta Laitasalo<br />
Legal Affairs, Risk Management and Internal<br />
Audit: Vice President, General Counsel<br />
Anne Leppälä-Nilsson<br />
Chief Audit Executive Pasi Mäkinen<br />
Corporate Communications and Responsibility:<br />
Senior Vice President Paavo Moilanen<br />
Subsidiaries<br />
K-instituutti Oy<br />
Siikajärventie 88–90, FI-02860 Espoo<br />
Tel. customer service +358 1053 37370,<br />
reception +358 1053 37271<br />
www.k-instituutti.fi<br />
Managing Director Juha Dahlman<br />
K-Plus Oy<br />
Satamakatu 3, Helsinki, FI-00016 Kesko<br />
Tel. +358 10 53020<br />
www.plussa.com<br />
Managing Director Niina Ryynänen<br />
K-talouspalvelukeskus Oy<br />
P.O.B. 330, FI-33101 Tampere<br />
Tel. +358 10 5311<br />
Managing Director Eija Jantunen<br />
District operations<br />
The Greater Helsinki area, Helsinki<br />
Satamakatu 3, Helsinki, FI-00016 Kesko<br />
Tel. +358 10 5311<br />
District Director Antti Palomäki<br />
Uusimaa, Helsinki<br />
Satamakatu 3, Helsinki, FI-00016 Kesko<br />
Tel. +358 10 5311<br />
District Director Timo Huurtola<br />
Eastern Finland, Kuopio<br />
Siunauskappelintie 2, P.O.B. 46,<br />
FI-70701 Kuopio<br />
Tel. +358 10 5311<br />
The Finnish Lakeland, Jyväskylä<br />
c/o K-citymarket Seppälä<br />
Vasarakatu 29, FI-40320 Jyväskylä<br />
Tel. +358 10 5311<br />
District Director Merja Haverinen<br />
Southeastern Finland, Lahti<br />
c/o K-citymarket Lahti Laune<br />
Ajokatu 53, FI-15500 Lahti<br />
Tel. +358 10 5311<br />
District Director Timo Heikkilä<br />
Southwestern Finland, Turku<br />
Lemminkäisenkatu 50, P.O.B. 116,<br />
FI-20101 Turku<br />
Tel. +358 10 5311<br />
District Director Olli Setänen<br />
Pirkanmaa, Tampere<br />
Jokipohjantie 28, P.O.B. 330, FI-33101<br />
Tampere<br />
Tel. +358 10 5311<br />
District Director Jari Alanen<br />
Ostrobothnia, Seinäjoki<br />
c/o K-maatalous Seinäjoki<br />
Hautomonkatu 2, FI-60100 Seinäjoki<br />
Tel. +358 10 5311<br />
District Director Heikki Tynjälä<br />
Northern Finland, Oulu<br />
Äimäkuja 6, P.O.B. 16, FI-90401 Oulu<br />
Tel. +358 10 5311<br />
District Director Jari Saarinen<br />
(e-mail: jari.k.saarinen@kesko.fi)<br />
Kesko Food Ltd<br />
Satamakatu 3, Helsinki, FI-00016 Kesko<br />
Tel. +358 10 53030<br />
President Terho Kalliokoski<br />
K-citymarket, Food:<br />
Vice President Mika Rautiainen<br />
K-supermarket:<br />
Vice President Jaana Hertsberg<br />
K-market (K-market, K-extra):<br />
Vice President Ari Svensk<br />
Commerce: Vice President Minna Kurunsaari<br />
Customer Relationship:<br />
Vice President Niina Ryynänen<br />
Retail Services: Vice President Kari Heiskanen<br />
(e-mail: kari.j.heiskanen@kesko.fi)<br />
Logistics and Finance:<br />
Vice President Petteri Niemi<br />
Subsidiaries<br />
Kespro Ltd<br />
Sähkötie 1, Vantaa, P.O.B. 15,<br />
FI-00016 Kesko<br />
Tel. +358 10 53040<br />
www.kespro.com<br />
Managing Director Jorma Rauhala<br />
Pikoil Oy<br />
Satamakatu 3, Helsinki, FI-00016 Kesko<br />
Tel. +358 20 742 2000<br />
Managing Director Harri Ojala<br />
Keslog Ltd<br />
Jokiniementie 31, P.O.B. 47,<br />
FI-01301 Vantaa<br />
Tel. +358 10 53050<br />
www.keslog.fi<br />
Managing Director Mika Salmijärvi<br />
Anttila Oy<br />
Valimotie 17, Helsinki, P.O.B. 1060,<br />
FI-00016 Kesko<br />
Tel. +358 10 5343<br />
www.anttila.fi<br />
President Matti Leminen<br />
Subsidiaries<br />
Estonia<br />
Anttila AS<br />
Uus 33, EE-71033 Viljandi, Estonia<br />
Tel. +372 43 53 360<br />
E-mail: anttila@anttila.ee<br />
www.anttila.ee<br />
Managing Director Tauno Tuula<br />
Latvia<br />
SIA Antti<br />
Jersikas iela 12/14, LV-1003 Riga, Latvia<br />
Tel. +371 703 3301<br />
E-mail: anttila@anttila.lv<br />
www.anttila.lv<br />
Director Kalle Lill<br />
K-citymarket Oy<br />
Kutojantie 4, FI-02630 Espoo<br />
Tel. +358 10 5311<br />
www.k-citymarket.fi<br />
President Ari Akseli<br />
Indoor Group Ltd<br />
Tikkurilantie 10, FI-01380 Vantaa<br />
Tel. +358 1053 46600<br />
www.indoorgroup.fi<br />
President Seppo Hämäläinen<br />
Intersport Finland Ltd<br />
Kutojantie 4, FI-02630 Espoo<br />
Tel. +358 10 5311<br />
www.intersport.fi<br />
President Juha Nurminen<br />
Musta Pörssi Ltd<br />
Kutojantie 4, FI-02630 Espoo<br />
Tel. +358 10 5311<br />
www.mustaporssi.fi<br />
President Jussi Mikkola
Kenkäkesko Ltd<br />
Kutojantie 4, FI-02630 Espoo<br />
Tel. +358 10 5311<br />
www.andiamo.fi, www.k-kenka.fi<br />
President Martti Toivanen<br />
Rautakesko Ltd<br />
Tikkurilantie 10, P.O.B. 75, FI-01301 Vantaa<br />
Tel. +358 10 53032<br />
E-mail: rautakesko.info@kesko.fi<br />
www.rautakesko.com<br />
President Jari Lind<br />
Human Resources: HR Director Anu Wiikeri<br />
Concepts:<br />
Concept Director Jaakko-Pekka Vehmas<br />
Subsidiaries and Finance:<br />
Vice President Jouko Björkman<br />
Store Sites, Risk Management and Legal<br />
Affairs: Director Juhani Järvi<br />
Global Process Development & IT:<br />
Development Director Johannes Milén<br />
Commerce (Hardware and Agricultural<br />
Trade): Vice President Antti Ollila<br />
K-rauta chain: Vice President Jani Karotie<br />
Rautia chain, K-maatalous chain and<br />
K-customer contract stores:<br />
Vice President Kimmo Vilppula<br />
B2B Sales: Vice President Olli Honkasaari<br />
Norway and Sweden:<br />
Region Director Jarmo Turunen<br />
Baltics and Russia:<br />
Region Director Raul Kadaru<br />
Country Director, Russia: Mikko Pasanen<br />
K-maatalous Experimental Farm<br />
Hahkialantie 57, FI-14700 Hauho<br />
Tel. +358 10 53032<br />
www.k-koetila.fi<br />
Subsidiaries<br />
Norway<br />
Byggmakker Norge AS<br />
Snipetjernveien 7, Postboks 650,<br />
NO-1401 Ski, Norway<br />
Tel. +47 6491 4000<br />
E-mail: firmapost@byggmakker.no<br />
www.byggmakker.no<br />
Managing Director Espen Hoff<br />
Sweden<br />
K-rauta AB<br />
Bagarbyvägen 61,<br />
SE-19134 Sollentuna, Sweden<br />
Tel. +46 8 588 18 900<br />
E-mail: info@k-rauta.se<br />
www.k-rauta.se<br />
Managing Director Jani Jylhä<br />
Estonia<br />
Rautakesko AS<br />
Tähetorni 100a, EE-11625 Tallinn, Estonia<br />
Tel. +372 6 257 501<br />
E-mail: info@rautakesko.ee<br />
www.rautakesko.ee<br />
Managing Director Alo Ivask<br />
Latvia<br />
AS Rautakesko<br />
Tiraines st. 15, LV-1058 Riga, Latvia<br />
Tel. +371 7 810 090<br />
E-mail: rautakesko@rautakesko.lv<br />
www.k-rauta.lv<br />
Managing Director Peteris Stupans<br />
Lithuania<br />
UAB Senuku prekybos centras<br />
Pramones pr. 6,<br />
LT-51500, Kaunas-31, Lithuania<br />
Tel. +370 37 304 999<br />
E-mail: marketing@senukai.lt<br />
www.senukai.lt<br />
President Arturas Rakauskas<br />
Russia<br />
ZAO Stroymaster<br />
Bolshoi Sampsonievskij Prospekt 68,<br />
lit N, RU-194100 St. Petersburg, Russia<br />
Tel. +7 812 326 9231<br />
E-mail: info@kesko.ru<br />
www.k-rauta.ru<br />
Managing Director Aleksandr Rudenko<br />
Belarus<br />
OOO OMA<br />
Office 36, Per. Promyshlenny 12a<br />
Minsk 220075, Belarus<br />
Tel. +375 17 244 9303<br />
E-mail: mh@oma.by<br />
Managing Director Mikhail Khamichonak<br />
VV-Auto Group Oy<br />
Hitsaajankatu 7 B, P.O.B. 80,<br />
FI-00811 Helsinki<br />
Tel. +358 9 75 831<br />
www.audi.fi, www.volkswagen.fi<br />
President Pekka Lahti<br />
Audi: Director Eljas Saastamoinen (since 1<br />
April 2010)<br />
Volkswagen passenger cars:<br />
Brand Manager Lauri Haapala<br />
Volkswagen commercial vehicles:<br />
Brand Manager Carl-Gustaf Sergejeff (until<br />
1 June 2010)<br />
Brand Manager Heikki Leskinen (since 1<br />
May 2010)<br />
After-sales services: Director Jarmo Toivanen<br />
Business support:<br />
Financial Director Arto Manninen<br />
Dealer network and business development:<br />
Director Mia Miettinen<br />
Kesko financial statements <strong>2009</strong><br />
Subsidiaries<br />
Auto-Span Oy<br />
Hitsaajankatu 7 C, P.O.B. 80,<br />
FI-00811 Helsinki<br />
Tel. +358 9 75 831<br />
www.seat.fi<br />
Managing Director Kimmo Vainio<br />
VV-Autotalot Oy<br />
Mekaanikonkatu 10, FI-00880 Helsinki<br />
Tel. +358 1053 33200<br />
www.vv-auto.fi<br />
Managing Director Timo Virtanen<br />
Turun VV-Auto Oy<br />
Rieskalähteentie 89, FI-20300 Turku<br />
Tel. +358 2 338 881<br />
www.vv-auto.fi<br />
Managing Director Timo Virtanen<br />
Konekesko Ltd<br />
Vanha Porvoontie 245, P.O.B. 145,<br />
FI-01301 Vantaa<br />
Tel. +358 10 53034<br />
www.konekesko.com<br />
Managing Director Aatos Kivelä<br />
Subsidiaries<br />
Konekesko Eesti AS<br />
Põrguvälja tee 3 a, Pildiküla, Rae vald,<br />
EE-75301 Harju mk, Estonia<br />
Tel. +372 605 9100<br />
www.konekesko.com/ee/<br />
Managing Director Tõnu Kelder<br />
Konekesko Latvija SIA<br />
Tiraines iela 15, LV-1058 Riga, Latvia<br />
Tel. +371 6706 4304<br />
www.konekesko.com/lv/<br />
Managing Director Antra Spickus<br />
UAB Konekesko Lietuva<br />
Savanoriu pr. 191, LT-02300 Vilnius,<br />
Lithuania<br />
Tel. +370 5 247 7400<br />
www.konekesko.com/lt/<br />
Managing Director Lina Morkunaite<br />
OOO Konekesko<br />
Urhov pereulok, 7 A,<br />
198095 St. Petersburg, Russia<br />
Tel. +7 812 326 4653<br />
Area Director Pekka Mankinen<br />
Service numbers<br />
K-Plussa customer service<br />
Mon–Fri 8.00–18.00<br />
Tel. +358 100 86044<br />
E-mail: plussa@kesko.fi<br />
Kesko Food's consumer service<br />
Mon–Fri 9.00–13.00<br />
Tel. +358 800 0 1000<br />
E-mail: ruokakesko.kuluttajapalvelu@<br />
kesko.fi<br />
157
158 Kesko financial statements <strong>2009</strong><br />
Glossary In this glossary we have compiled a list of some key terms used in the <strong>Annual</strong> <strong>Report</strong>.<br />
After-sales marketing refers in the car<br />
and machinery trade in particular to<br />
after-sales activities, such as maintenance,<br />
repairs, sales of spare parts, accessories<br />
and equipment.<br />
AMS is an abbreviation of AMS Sourcing<br />
BV. Kesko Food works in cooperation with<br />
the leading European food chains in AMS,<br />
and is a partner in the World- Wide Retail<br />
Exchange. The WWRE is a business-tobusiness<br />
web marketplace.<br />
Brand is a trademark, logo or branded<br />
product. It is an embodiment of all information<br />
relating to the company product<br />
or service. A brand is an image, created by<br />
the way of doing things, by quality and<br />
the willingness to reach the set destination.<br />
Certification of goods sold by stores is an<br />
audit carried out by an independent third<br />
to verify the compliance of operating systems<br />
with certain criteria (e.g. with an ISO<br />
standard).<br />
Chain agreement is a contract between<br />
the retailer and Kesko that enables the<br />
retailer join one of Kesko’s retail store<br />
chains. Under the terms of the chain<br />
agreement, the retailer and Kesko agree<br />
on their rights and responsibilities<br />
regarding chain operations.<br />
Chain concept is a comprehensive<br />
description of retail business operations<br />
and guidelines for their similar implementation<br />
in all stores of the chain.<br />
Chain selection in the K-Group is that<br />
part of a selection which is the same in all<br />
stores of the chain. The chain unit makes<br />
decisions concerning the selection.<br />
Chain unit is the Kesko unit responsible<br />
for store chain operations and chain concept<br />
development in the K-Group. It has<br />
decision-making power in matters concerning<br />
the chain.<br />
Corporate responsibility refers to voluntary<br />
responsibility towards key stakeholders.<br />
It is measurable, based on the company’s<br />
values and objectives, and is<br />
divided into economic, social and environmental<br />
responsibility.<br />
Dealer, for instance in the car trade, is a<br />
company authorised by the importer to<br />
sell and service branded products. The<br />
dealer meets the quality standards set by<br />
the manufacturer and the importer.<br />
Department store is a retail store that<br />
sells a wide variety of goods. Its sales area<br />
is at least 2,500 m 2 . In a department<br />
store, no product category accounts for<br />
over half of the total sales area.<br />
Distance sales refers to trading activities<br />
where customers do not visit store<br />
premises, but instead trade through the<br />
Internet, other electronic media or mail<br />
order.<br />
Fair trade is a form of international trade,<br />
illustrated by a formalised parrot logo. The<br />
logo indicates that business is carried out<br />
directly with small producers of the third<br />
world without intermediaries. Producers<br />
receive a guaranteed price for their products<br />
that is usually significantly higher<br />
that the world market price. They are also<br />
given guarantees of long contracts and<br />
opportunities for advance financing.<br />
Groceries refer to food and other everyday<br />
products that people are used to buying<br />
when they shop for food. Groceries<br />
include food, beverages, tobacco, home<br />
chemical products, household papers,<br />
magazines and cosmetics.<br />
Grocery store is, in most cases, a selfservice<br />
food store that sells the full range of<br />
the above groceries. Food accounts for<br />
about 80% of grocery stores’ total sales.<br />
Home and speciality goods stores include<br />
clothing, shoe, sports, home technology,<br />
home goods, furniture and interior decoration<br />
stores.<br />
HoReCa is a category consisting of large<br />
customers in the food trade, including<br />
hotels, restaurants and other catering<br />
companies.<br />
Hypermarket is a retail store selling a<br />
wide variety of goods mainly on the selfservice<br />
principle. Its sales area exceeds<br />
2,500 m². In a hypermarket, food<br />
accounts for about half of the total area,<br />
but sales focus on groceries (food and<br />
other everyday items).<br />
K-Group consists of the K-retailers, the<br />
K-Retailers’ Association and the Kesko<br />
Group.<br />
K-retailer is an independent chain entrepreneur<br />
who, through good service, competence<br />
and local expertise, provides<br />
additional strength for chain operations.<br />
The K-retailer entrepreneurs are responsible<br />
for their stores’ customer satisfaction,<br />
personnel and profitable business operations.<br />
K-Retailers’ Association is a body that<br />
looks after the interests of the K-retailers.<br />
Its key function is to promote and<br />
strengthen the conditions for the entrepreneurial<br />
activities of K-retailers. All the<br />
K-retailers – about 1,302– are members<br />
of the K-Retailers’ Association.<br />
Logistics is a process in which information<br />
management is used to direct the goods<br />
flow and related services throughout the<br />
entire supply chain. Logistics help optimise<br />
the quality and cost-efficiency of<br />
operations.<br />
Neighbourhood store is usually a small<br />
grocery store, located close to consumers<br />
and easily accessible by foot. It is usually<br />
a self-service store of less than 400 m². In<br />
Finland they have unrestricted opening<br />
hours even in town plan areas.<br />
New establishment (greenfielding) refers<br />
to new store sites or business premises.
Operations control system (ERP Enterprise<br />
Resource Planning system) is an information<br />
system that supports the planning<br />
and control of business operations. It<br />
includes the information systems supporting<br />
the core processes of the company,<br />
such as category management and<br />
purchasing logistics in the trading sector,<br />
e.g. SAP R3.<br />
Organic product is, according to the EU<br />
regulation on organic production, a product<br />
in which at least 95% of the raw<br />
materials of agricultural origin have been<br />
organically produced.<br />
Private label (own brand, house brand)<br />
product is a branded product made for<br />
the trading company by a manufacturer<br />
and marketed as part of a larger product<br />
family under one brand name. A company<br />
markets its private label products through<br />
its own network.<br />
Retail trade refers to sales to consumer<br />
customers.<br />
Sales area refers to the store area reserved<br />
for sales, such as goods areas, aisles,<br />
service counters, checkout areas and air<br />
lock entrances.<br />
Selection is the range of products sold for<br />
the same purpose, for instance a selection<br />
of bread. Speciality stores carry a deep<br />
selection in the category.<br />
Self-control is an entrepreneur’s own<br />
control system, the purpose of which is to<br />
prevent problems arising in food hygiene.<br />
In compliance with legislation, self-control<br />
is based on HACCP (Hazard Analysis<br />
and Critical Control Points) principles. The<br />
hazards related to products are assessed,<br />
the critical control points needed for<br />
hazard monitoring are identified and<br />
then controlled. The system is applied<br />
to the hygiene of manufacturing plants’<br />
machinery and equipment, the quality of<br />
raw materials and products, the effectiveness<br />
of manufacturing processes, and<br />
transportation and warehousing conditions.<br />
Service company is an enterprise that<br />
offers all the products and services<br />
wanted or expected by customers at the<br />
same time. The service company provides<br />
customers with a combination of products<br />
and related services, taking care of product<br />
assemblies and other user functions<br />
that may be required.<br />
Shopping centre houses many trading<br />
companies, but has joint management<br />
and marketing. A shopping centre has one<br />
or more main companies, but no individual<br />
store accounts for over 50% of the<br />
total business premises. A shopping centre<br />
has a minimum of 10 stores, in most<br />
cases joined by a common mall.<br />
Store-specific selection in the K-Group is<br />
that part of the selection of a store that is<br />
adapted for the special needs of the local<br />
market.<br />
Store site is a business property or<br />
premises where the chain concept and<br />
related auxiliary services are carried out.<br />
Store site fee is the term used for the<br />
payment made by the retailer to Kesko as<br />
a compensation for the use of the store<br />
site under the chain agreement and the<br />
related services offered by Kesko. The<br />
store site fee is, as a rule, calculated as a<br />
percentage of the retailer’s gross profit or<br />
net sales.<br />
Strategy is a comprehensive plan of the<br />
means the organisation intends to use in<br />
order to achieve its visions and goals.<br />
Supermarket is a grocery store that<br />
focuses on food sales and works on a selfservice<br />
principle. Its sales area is at least<br />
400 m², with food accounting for over<br />
half of the total sales area.<br />
Wholesale trade is purchasing from suppliers<br />
in large quantities and then selling<br />
to enterprises engaged in the retail trade.<br />
Kesko financial statements <strong>2009</strong><br />
159
Photos:<br />
Numi Nummelin,<br />
Rami Hanafi,<br />
Mats Vuorenjuuri,<br />
Antti Vettenranta and<br />
Kesko’s image banks<br />
Printed by:<br />
Libris Oy
www.kesko.fi<br />
Business ID 0109862-8