You also want an ePaper? Increase the reach of your titles
YUMPU automatically turns print PDFs into web optimized ePapers that Google loves.
Year <strong>2007</strong><br />
Divisions The Group<br />
Financial statements<br />
Prices and trading of Kesko A and B shares on the Helsinki Stock Exchange in <strong>2007</strong><br />
Share<br />
Share price, €<br />
31 Dec. 2006<br />
Share price, €<br />
31 Dec. <strong>2007</strong> Change,% Lowest price, € Highest price, €<br />
Further<br />
information<br />
Trading volume,<br />
1,000 pcs<br />
147<br />
Total value, €<br />
thousand<br />
A share 38.43 37.85 - 1.5 34.52 53.44 3,656 161,035<br />
B share 40.02 37.72 - 5.7 34.40 54.85 122,361 5,294,130<br />
During the <strong>year</strong>, OMXHelsinki All Share Index rose by 20.5%, OMXHelsinkiCAP Index by 3.8%, and the Helsinki Stock Exchange Consumer Staples Index<br />
by 5.4%.<br />
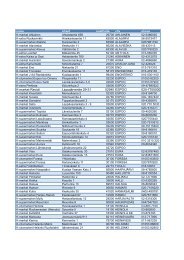
10 largest shareholders by number of shares (A and B series) at 31.12.<strong>2007</strong><br />
Number<br />
of shares, pcs % of shares Number of votes % of votes<br />
1 Kesko Pension Fund 3,438,885 3.52 34,388,850 8.97<br />
2 The K-Retailers´ Association 3,221,539 3.30 31,847,740 8.31<br />
3 Vähittäiskaupan Takaus Oy 2,628,533 2.69 26,285,330 6.86<br />
4 Valluga-sijoitus Oy 1,340,439 1.37 13,404,390 3.50<br />
5 Oy The English Tearoom Ab 1,008,400 1.03 1,008,400 0.26<br />
6 Varma Mutual Pension Insurance Company 930,158 0.95 930,158 0.24<br />
7 Foundation for Vocational Training in the Retail Trade 895,679 0.92 7,585,838 1.98<br />
8 The State Pension Fund 746,000 0.76 746,000 0.19<br />
9 Tapiola Mutual Pension Insurance Company 559,500 0.57 559,500 0.15<br />
10 Ilmarinen Mutual Pension Insurance Company 543,392 0.56 3,333,392 0.87<br />
10 largest shareholders, total 15,312,525 15.67 120,089,598 31.33<br />
Breakdown of share ownership by shareholder category at 31 Dec. <strong>2007</strong><br />
All shares Number of shares, pcs % of all shares<br />
Non-financial corporations and housing corporations 23,153,111 23.68<br />
Financial and insurance corporations 3,299,783 3.38<br />
General Government* 7,584,105 7.76<br />
Households 24,758,084 25.32<br />
Non-profit institutions serving households** 5,537,050 5.66<br />
Rest of the world 265,394 0.27<br />
Nominee registered 33,170,238 33.93<br />
Total 97,767,765 100<br />
A shares Number of shares, pcs % of A shares % of all shares<br />
Non-financial corporations and housing corporations 18,058,619 56.90 18.47<br />
Financial and insurance corporations 1,341,306 4.23 1.37<br />
General Government* 3,979,747 12.54 4.07<br />
Households 6,694,087 21.09 6.85<br />
Non-profit institutions serving households** 1,596,083 5.03 1.63<br />
Rest of the world 4,582 0.01 0.00<br />
Nominee registered 62,583 0.20 0.06<br />
Total 31,737,007 100 32.46<br />
B shares Number of shares, pcs % of B shares % of all shares<br />
Non-financial corporations and housing corporations 5,094,492 7.72 5.21<br />
Financial and insurance corporations 1,958,477 2.97 2.00<br />
General Government* 3,604,358 5.46 3.69<br />
Households 18,063,997 27.36 18.48<br />
Non-profit institutions serving households** 3,940,967 5.97 4.03<br />
Rest of the world 260,812 0.39 0.27<br />
Nominee registered 33,107,655 50.14 33.86<br />
Total 66,030,758 100 67.54<br />
* General government includes municipalities, the provincial administration of Åland, employment pension institutions and social security funds.<br />
** Non-profit institutions include foundations awarding scholarships, organisations safeguarding certain interests, charitable associations.