Create successful ePaper yourself
Turn your PDF publications into a flip-book with our unique Google optimized e-Paper software.
Kesko’s <strong>year</strong><br />
<strong>2007</strong>
Milla<br />
liked Kodin Ykkönen<br />
because of<br />
sensible<br />
prices<br />
moving<br />
to study<br />
interior decoration<br />
trends<br />
Plussa<br />
offers
Year <strong>2007</strong><br />
Contents<br />
Divisions The Group Financial statements Further information 1<br />
Year <strong>2007</strong> Divisions<br />
The Group<br />
2 Kesko in brief<br />
10 Kesko Food<br />
4 Year <strong>2007</strong> in brief 16 Rautakesko<br />
6 Review by the President 21 VV-Auto<br />
and CEO<br />
24 Anttila<br />
8 Operating environment 27 Kesko Agro<br />
31 Other operating<br />
activities<br />
Konekesko<br />
Intersport Finland<br />
Indoor Group<br />
Musta Pörssi<br />
Kenkäkesko<br />
Tähti Optikko<br />
Kauko-Telko<br />
Financial<br />
statements<br />
Further<br />
information<br />
38 Vision, values and goals 70 Contents<br />
143 Shares and share-<br />
40 Strategic emphases 71 Report by the Board of holders<br />
44 Individual customer Directors<br />
150 Information for<br />
approach -K-Plussa 81 Consolidated financial shareholders<br />
46 Real estate operations statements (IFRS) 151 Information about<br />
48 Kesko is a good work- 85 Notes to the consolidat- Kesko for investors<br />
placeed<br />
financial statements 152 Contact information<br />
51 Competitive advantage 134 Parent’s financial 154 Glossary<br />
from chain operations<br />
and K-retailer<br />
entrepreneurship<br />
52 Corporate responsibility<br />
in Kesko<br />
57 Corporate Governance<br />
Statement<br />
66 Board of Directors<br />
68 Corporate Management<br />
Board<br />
statements (FAS)
2<br />
<strong>Kesko's</strong> <strong>year</strong> <strong>2007</strong><br />
Kesko in brief<br />
Kesko is the leading provider of trading<br />
sector services and a highly valued<br />
listed company. Through its stores,<br />
Kesko offers quality to the daily lives<br />
of consumers. Kesko has about 2,000<br />
stores engaged in chain operations in<br />
the Nordic and Baltic countries, Russia<br />
and Belarus.<br />
Our core competence areas<br />
Development and management of store<br />
concepts and brands<br />
Development of store site network<br />
International retail expertise<br />
Generating sourcing, logistics and support<br />
services for cooperation partners<br />
Combining retailer entrepreneurship<br />
and chain operations efficiently<br />
Leveraging centralised resources and<br />
economies of scale<br />
●●<br />
●●<br />
●●<br />
●●<br />
●●<br />
●●<br />
Divisions<br />
Kesko Food | Page 10<br />
Kesko Food’s retail chains in Finland are<br />
K-citymarket, K-supermarket, K-market and<br />
K-extra. Kesko Food manages K-food store<br />
chains and combines their purchasing power,<br />
arranges efficient logistics, acquires store<br />
sites and guarantees strong marketing and<br />
development support for K-food stores. K-food<br />
retailers are responsible for delivering the<br />
customer promise in their K-stores. All K-food<br />
stores in Finland are run by K-retailer entrepreneurs.<br />
Kesko Food’s subsidiary Kespro Ltd<br />
offers delivery sales and wholesale services<br />
to HoReCa customers.<br />
Rautakesko | Page 16<br />
Rautakesko is engaged in the building and<br />
home improvement trade through the<br />
K-rauta, Rautia, Byggmakker and Senukai<br />
retail chains. Rautakesko operates in Finland,<br />
Sweden, Norway, the Baltic countries, Russia<br />
and Belarus. It manages and develops its<br />
retail chains and B-to-B Service sales in its<br />
operating area. Rautakesko is responsible<br />
for the chains’ concepts, marketing, sourcing<br />
and logistics services, store network and<br />
retailer resources. Working in cooperation<br />
with its customers, Rautakesko enhances living<br />
and aims to be the leading service provider<br />
in the building and home improvement<br />
trade in its operating area.<br />
VV-Auto | Page 21<br />
VV-Auto imports Volkswagen, Audi and Seat<br />
passenger cars and Volkswagen commercial<br />
vehicles. VV-Auto is also engaged in car retailing<br />
and provides after-sales services.<br />
Anttila | Page 24<br />
Anttila is the leading home and speciality<br />
goods retailer in Finland. Anttila serves its<br />
customers with two department store concepts<br />
– the Anttila department stores and the<br />
Kodin Ykkönen department stores for interior<br />
decoration and home goods – and with the<br />
NetAnttila concept focused on distance sales.<br />
NetAnttila provides products and services in<br />
Finland, Estonia and Latvia. Anttila’s customers<br />
value, above all, diversified, up-to-date and<br />
low-priced selections, and good service.<br />
Kesko Agro | Page 27<br />
Kesko Agro operates the K-maatalous and<br />
Kesko Agro chains. The company purchases<br />
and sells animal feed, chemicals and machinery<br />
to agricultural entrepreneurs and trades<br />
in grain. Kesko Agro is active in Finland and<br />
in all the Baltic countries.<br />
Other operating activities | Page 31<br />
Konekesko is a service company specialised<br />
in the import and sale of earthwork and environmental<br />
machinery, trucks and buses, and<br />
recreational machinery. Konekesko also sells<br />
forest machinery in the Baltic countries,<br />
arranges the manufacture of and sells<br />
Yamarin boats manufactured in Finland and<br />
exports them to other European countries,<br />
including Russia.<br />
Sports trade The K-Group’s sports store<br />
chains are Intersport, Budget Sport and<br />
Kesport.<br />
Furniture and interior decoration trade<br />
Indoor Group is a retailer of home furniture<br />
and interior decoration items, which operates<br />
in Finland and its neighbouring countries. Its<br />
retail chains are Asko and Sotka.<br />
Home technology trade The Musta Pörssi<br />
chain offers home technology products and<br />
services.<br />
Shoe trade The K-Group’s specialist shoe<br />
stores are K-kenkä and Andiamo.<br />
Tähti Optikko is a chain of optical stores in<br />
Finland.<br />
Kauko-Telko specialises in international<br />
technical trading in the Nordic countries, the<br />
Baltic countries, Poland, China and Russia.
Year <strong>2007</strong><br />
the best<br />
offers<br />
Divisions The Group Financial statements Further information 3<br />
the Aaltonen’s<br />
competitive prices<br />
having been to K-citymarket<br />
recipe for choice was<br />
the broadest<br />
selection<br />
all<br />
under the<br />
same roof
4<br />
<strong>Kesko's</strong> <strong>year</strong> <strong>2007</strong><br />
Year <strong>2007</strong> in brief Sales and profit increased<br />
considerably<br />
Kesko’s sales and profit continued to increase<br />
considerably in <strong>2007</strong>. The strong development<br />
of operating profit excluding non-recurring<br />
items continued for the sixth successive <strong>year</strong>.<br />
Kesko Food and Rautakesko increased their<br />
profit most. Particularly encouraging was the<br />
growth in the sales of K-food stores. Rautakesko<br />
continued its successful expansion and<br />
Kesko continued its strong<br />
performance in <strong>2007</strong><br />
●●<br />
●●<br />
●●<br />
●●<br />
●●<br />
●●<br />
●●<br />
●●<br />
●●<br />
●●<br />
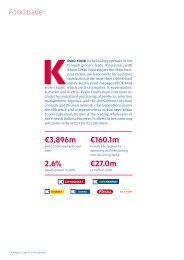
Retail sales of the K-Group increased<br />
by 9.7% to €11,575.6 million (incl. VAT).<br />
The Kesko Group’s net sales increased<br />
by 9.0% to €9,534 million.<br />
Net sales in Finland increased by 6.0%<br />
to €7,357 million.<br />
Net sales outside Finland grew by 20.4%<br />
to €2,177 million, accounting for 22.8%<br />
of the total net sales.<br />
Operating profit excluding non-recurring<br />
items increased by €45.3 million to €325.1<br />
million.<br />
Kesko Food’s sales grew by 7.7%.<br />
Rautakesko’s strong internationalisation<br />
continued.<br />
Earnings per share were €2.61 (€2.45).<br />
The market capitalisation of the company<br />
was €3,692 million (€3,852 million) at the<br />
end of the <strong>year</strong>.<br />
A dividend of €1.50 per share was distributed<br />
for the <strong>year</strong> 2006. The Board of Directors<br />
proposes to the Annual General Meeting<br />
that €1.60 per share be distributed as<br />
a dividend for <strong>2007</strong>.<br />
achieved strong growth particularly in international<br />
operations.<br />
Investments in new store sites and the<br />
renovation of existing ones were are at a high<br />
level in Finland. 27 new K-food stores were<br />
opened, and several stores were refurbished<br />
or expanded. Investments in the building and<br />
home improvement sector mainly focused on<br />
the development of the international network,<br />
but stores were opened and improved in Finland,<br />
too. Out of the 16 new building and<br />
home improvement stores opened during the<br />
<strong>year</strong>, eleven were outside Finland. The eighth<br />
K-rauta outlet in St. Petersburg was opened in<br />
December. Major investments in store sites<br />
will continue over the next few <strong>year</strong>s.<br />
Corporate strategy was specified<br />
In spring, the Board of Directors revised the<br />
company’s financial targets and specified the<br />
strategy. Due to the expanding international<br />
operations and outlook for business development,<br />
objectives for return on equity and<br />
invested capital were raised. The company is<br />
preparing for sizable store site investments in<br />
the next few <strong>year</strong>s in all the countries where it<br />
operates. Strategic emphases include healthy,<br />
focused growth, the focus on sales and services<br />
to consumer-customers, and responsible<br />
and cost-efficient operations.<br />
K-Plussa is undergoing a reform<br />
Kesko and the K-retailers started a thorough<br />
reform of the K-Plussa customer loyalty programme.<br />
The choice of cards became more<br />
diversified and the benefits for loyal customers<br />
increased. The new K-Plussa combination<br />
card can be used as a means of payment both<br />
at home and abroad. The popularity of the<br />
new cards exceeded expectations: their total<br />
number has already exceeded 400,000.<br />
Pirkka magazine revamped<br />
The content and appearance of Pirkka, the<br />
K-Group’s customer loyalty magazine, were<br />
changed. The first new-look Pirkka magazine<br />
was published in February and was well<br />
received by readers. According to the survey<br />
published by the National Media Research<br />
KMT in September, Pirkka has increased its<br />
readership by 60,000 to over 2.5 million readers<br />
and is the most widely read magazine in<br />
Finland.<br />
Recognition for responsible<br />
operating practices<br />
Kesko continues to be one of the top companies<br />
in the world judged by sustainability<br />
indicators and was again included among<br />
’The Global 100 Most Sustainable Corporations’<br />
list published by the World Economic<br />
Forum. Furthermore, Kesko was listed for the<br />
fifth time in the Dow Jones sustainability<br />
index. In the review for <strong>2007</strong>, Kesko’s environmental<br />
performance was evaluated to be the<br />
best in the retailing sector.<br />
Actions promoting a healthier<br />
way of life<br />
Kesko started a campaign to promote children’s<br />
and adolescents’ physical activity in<br />
cooperation with the Young Finland Association.<br />
Kesko promised to donate 0.25 cents to<br />
support children’s and adolescents’ healthy<br />
way of life every time a customer uses a<br />
K-Plussa card in a K-Group store. The total<br />
sum raised was about €500,000.<br />
Market capitalisation<br />
The company’s market capitalisation was €3.7<br />
billion, showing a decrease of about €150 million<br />
compared with the end of 2006. The proportion<br />
of foreign owners of the B shares was<br />
about 50% at end of the <strong>year</strong>.
Year <strong>2007</strong><br />
Financial<br />
highlights<br />
for <strong>2007</strong><br />
Group's net sales*, € million<br />
10,000<br />
9,000<br />
8,000<br />
7,000<br />
6,000<br />
5,000<br />
4,000<br />
3,000<br />
2,000<br />
1,000<br />
0<br />
< FAS IFRS ><br />
2003 2004 2004 2005 2006 <strong>2007</strong><br />
FINlAND OThER COuNTRIES<br />
* continuing operations<br />
●●1. Kesko Food 40.5%<br />
●●2. Rautakesko 26.5%<br />
●●3. VV-Auto 8.4%<br />
●●4. Anttila 5.9%<br />
●●5. Kesko Agro 8.3%<br />
●●6. Other operating activities 10.4%<br />
* continuing operations<br />
Divisions The Group Financial statements Further information 5<br />
Key indicators for <strong>2007</strong><br />
<strong>2007</strong> 2006 Change, %<br />
Net sales* € million 9,534 8,749 9.0<br />
Operating profit* € million 332 363 -8.5<br />
Operating profit excl. non-recur-<br />
ring items* € million 325 280 16.1<br />
Profit before tax* € million 369 358 3.2<br />
Investments* € million 234 251 -6.6<br />
Cash flow from operating activities € million 248 328 -24.3<br />
Personnel (average) 21,176 23,767 -10.9<br />
Dividend per share** € 1.60 1.50 6.7<br />
Earnings per share, diluted € 2.90 3.76 -22.9<br />
Earnings per share, diluted* € 2.61 2.45 6.6<br />
Equity per share, diluted € 19.53 17.94 8.8<br />
% points<br />
Return on invested capital % 17.4 22.6 -5.2<br />
Return on equity % 16.4 23.1 -6.7<br />
Equity ratio % 48.5 47.0 1.5<br />
Gearing % 14.0 11.9 2.0<br />
* continuing operations **proposal to the Annual General Meeting<br />
Group’s operating profit<br />
excl. non-recurring items*, € million<br />
350<br />
300<br />
250<br />
200<br />
150<br />
100<br />
50<br />
0<br />
< FAS IFRS ><br />
2003 2004 2004 2005 2006 <strong>2007</strong><br />
* continuing operations<br />
●●1. Kesko Food 42.6%<br />
●●2. Rautakesko 32.7%<br />
●●3. VV-Auto 7.3%<br />
●●4. Anttila 7.1%<br />
●●5. Kesko Agro 3.5%<br />
●●6. Other operating activities 67%<br />
* continuing operations<br />
Earnings per share and dividend<br />
per share, €<br />
EARNINGS PER ShARE, DIluTED DIVIDEND PER ShARE<br />
Net sales <strong>2007</strong>* Operating profit excl. non-recurring items <strong>2007</strong>*<br />
4.<br />
3.<br />
5.<br />
6.<br />
2.<br />
1.<br />
4.0<br />
3.5<br />
3.0<br />
2.5<br />
2.0<br />
1.5<br />
1.0<br />
0.5<br />
0<br />
3.<br />
4.<br />
< FAS IFRS ><br />
2003 2004 2004 2005 2006 <strong>2007</strong><br />
** proposal to the Annual General Meeting<br />
2.<br />
5. 6.<br />
1.<br />
**
6<br />
<strong>Kesko's</strong> <strong>year</strong> <strong>2007</strong><br />
Review by the<br />
President and CEO<br />
Increasing Kesko’s shareholder value requires<br />
healthy growth in sales and profit. The<br />
K-Group stores offer the best quality, the most<br />
comprehensive selections and the best service<br />
at competitive prices. Kesko and the<br />
K-retailers daily serve about one million customers<br />
in nearly 2,000 stores. We want to<br />
exceed our customers’ expectations every day.<br />
The Kesko Group’s nine per cent sales<br />
increase in <strong>2007</strong> and our record profit level<br />
show that the strategy we have chosen is<br />
soundly based and that its implementation is<br />
progressing well.<br />
Measured by retail sales, the K-Group is<br />
Finland’s biggest trading sector company<br />
whose main businesses are the food trade and<br />
the building and home improvement trade. In<br />
<strong>2007</strong>, we strengthened our position both<br />
domestically and internationally.<br />
The retail sales of our building and home<br />
improvement stores increased significantly<br />
in <strong>2007</strong>, especially in Russia and the Baltic<br />
countries. The profitable growth recorded particularly<br />
in foreign operations encourages us<br />
to expand in Russia and our other countries<br />
of operation, and to commence the building<br />
and home improvement trade in new<br />
countries.<br />
Kesko Food’s positive sales and profit performance<br />
continued in <strong>2007</strong>. The K-retailers’<br />
professional skills and commitment to common<br />
objectives provided a strong foundation<br />
for efficient cooperation and improved competitiveness.<br />
Investments in the retail store<br />
network will rapidly increase sales in the<br />
coming <strong>year</strong>s. Kesko Food is continuing to<br />
actively seek opportunities to expand operations<br />
to Russia and the Baltic countries.<br />
The main factor behind Kesko’s record<br />
result was that almost every profit centre of<br />
the Group improved their profits or were able<br />
to maintain them at a high level. The biggest<br />
improvements were recorded by Kesko Food<br />
and Rautakesko.<br />
The Group strategy emphasizes healthy<br />
focused growth, sales to consumer-customers,<br />
and services, combined with responsible and<br />
cost-efficient business models. Kesko has<br />
dozens of successful product and chain<br />
brands. In order to strengthen the position of<br />
our brands we introduced an extensive brand<br />
strategy initiative. This was complemented by<br />
the establishment of a steering group chaired<br />
by the President and CEO and composed of<br />
Kesko staff representatives and external<br />
members.<br />
Customer loyalty is becoming increasingly<br />
important. Through our customer loyalty programmes<br />
and various forms of customer communication,<br />
we strengthen our service capability<br />
and customer satisfaction. We initiated<br />
a reform of the K-Plussa customer loyalty programme<br />
and an online customer communications<br />
project. The new K-Plussa card gives our<br />
customers more benefits than before and<br />
access to a combination of payment features.<br />
The reformed Pirkka magazine was positively<br />
received by our customers.<br />
Efficient use of modern information technology,<br />
increasing store sizes, labour shortages<br />
and soaring costs require that we constantly<br />
develop our operating processes. The<br />
objective of the work and productivity programme<br />
we launched in the Kesko Group and<br />
the K-stores is to significantly improve our<br />
service and price competitiveness.<br />
Customers expect companies to operate in<br />
an increasingly responsible way. Kesko’s longterm<br />
responsibility work once again received<br />
world-wide recognition last <strong>year</strong>. For the third<br />
<strong>year</strong> in succession, we were included in The<br />
Global 100 Most Sustainable Corporations
Year <strong>2007</strong><br />
list. In 2008, we intend to announce an extensive<br />
environmental, economic and social<br />
responsibility programme.<br />
Important development projects include a<br />
continuous strengthening of the price competitiveness<br />
of each chain, and the expansion<br />
of store services and selections. To improve<br />
customer satisfaction, we will invest heavily<br />
in new stores and the improvement of existing<br />
stores. During the next three <strong>year</strong>s, we<br />
will open nearly two hundred new stores both<br />
in Finland and the other countries.<br />
A service package that exceeds customers’<br />
expectations is only achieved by the work<br />
of a skilled and competent staff. Kesko and<br />
the K-stores employ some 50,000 retail professionals.<br />
Maintaining and developing their<br />
competencies are important success factors.<br />
During the <strong>year</strong>, some 20,000 trading sector<br />
professionals participated in training programmes<br />
at the K-instituutti.<br />
The <strong>year</strong> <strong>2007</strong> was, once again, a busy one.<br />
I wish to extend my warmest thanks to all<br />
Kesko employees for their diligence and commitment<br />
to our common objectives. I would<br />
also like to thank our shareholders, the K-retailers<br />
and their staff, and all our partners for<br />
their trust and successful cooperation during<br />
<strong>2007</strong>.<br />
Helsinki, 7 February 2008<br />
Matti Halmesmäki<br />
President and CEO<br />
Divisions The Group Financial statements Further information 7<br />
Matti halmesmäki
8<br />
<strong>Kesko's</strong> <strong>year</strong> <strong>2007</strong><br />
Operating<br />
environment<br />
Trends in the trading sector<br />
●●<br />
Internationalisation continues in<br />
the trading sector.<br />
●●<br />
Importance of customer loyalty is<br />
increasing.<br />
●●<br />
Consumers’ purchasing behaviour is<br />
becoming fragmented; consumers seek<br />
simplicity, experiences, a healthy way<br />
of life and variation.<br />
●●<br />
Corporate responsibility and ethics are<br />
emphasised.<br />
●●<br />
The manufacturing industry’s brands<br />
remain strong.<br />
●●<br />
The number and market share of store<br />
private label products are increasing.<br />
●●<br />
Use of the Internet and online sales are<br />
growing.<br />
●●<br />
The trading sector’s role as a producer<br />
of services is strengthening.<br />
●●<br />
New store concepts are being developed.<br />
●●<br />
New operations control systems improve<br />
the efficiency of store operations.<br />
Sweden<br />
9.1 million<br />
consumers<br />
Norway<br />
4.6 million<br />
consumers<br />
●●Building and home<br />
improvement trade<br />
●●120 K-Group<br />
stores<br />
Belarus<br />
9.8 million<br />
consumers<br />
●●Building and home<br />
improvement trade<br />
●●3 K-Group stores<br />
Sources: Nordea and Statistics Finland<br />
●●Building and home<br />
improvement trade,<br />
technical trade<br />
●●19 K-Group stores<br />
Market areas<br />
Kesko’s main operating areas are Finland,<br />
Sweden, Norway, Estonia, Latvia, Lithuania,<br />
Northwestern Russia and Belarus.<br />
Strong growth, about 4.0%, continued in<br />
the Finnish economy in <strong>2007</strong>. However,<br />
growth slowed down towards the end of the<br />
<strong>year</strong>. Private consumption continued to grow<br />
briskly, by some 3.7%, but consumer confidence<br />
in the economy dropped during the latter<br />
half of the <strong>year</strong>. The Finnish economic<br />
growth is expected to slow down to some 2.6%<br />
in 2008, mainly due to a decline in export<br />
demand. Private consumption is estimated to<br />
increase by around 3.0% and investments by<br />
about 3.6%. Consumer prices are expected to<br />
rise by 2.7%. Housing production is expected<br />
to decline in 2008.<br />
The Swedish economy is expected to grow<br />
by 2.1% and private consumption by 2.7% in<br />
2008. Consumer prices are expected to rise by<br />
3.2%.<br />
The Norwegian economy is estimated to<br />
grow by 2.9% and private consumption by<br />
3.0% in 2008. Consumer prices are expected<br />
to rise by about 3.3%.<br />
The growth of the Estonian economy is<br />
expected to slow down in 2008 and remain at<br />
about 4.0%. Private consumption is estimated<br />
to grow by about 6.0%. Consumer prices are<br />
expected to rise by 7.9%.<br />
The Latvian economy is expected to grow<br />
by 5.6% in 2008. Private consumption is<br />
anticipated to slow down slightly and remain<br />
at around 7.0%. Consumer prices are<br />
expected to rise by 12.0%.<br />
The Lithuanian economy is expected to<br />
grow by 7.4% in 2008. Private consumption is<br />
anticipated to continue growing with a rate of<br />
around 14.0%. Consumer prices will rise by<br />
about 7.0%.<br />
In Russia, growth in private consumption<br />
varies strongly from one region to another;<br />
the average growth rate is estimated to be<br />
about 7.0% in 2008. Private consumption is<br />
anticipated to grow by 10.0% and investments<br />
by 21.0%. Consumer prices are expected to<br />
rise by 12.0%.<br />
Trends in the market areas of each division<br />
are discussed in division-specific<br />
presentations.<br />
Finland<br />
5.3 million<br />
consumers<br />
The Baltic<br />
countries<br />
7.2 million<br />
consumers<br />
Russia<br />
St. Petersburg 4.6<br />
million. Moscow<br />
10.4 million<br />
consumers<br />
●●All Kesko’s<br />
divisions<br />
●●1,850 K-Group<br />
stores<br />
●●Building and<br />
home improvement,agricultural,<br />
machinery<br />
and technical<br />
trade<br />
●●Furniture trade<br />
and Anttila<br />
distance retail<br />
sales (Estonia<br />
and latvia)<br />
●●52 K-Group<br />
stores<br />
●●Building and<br />
home improvement<br />
trade,<br />
technical trade<br />
●●8 K-Group<br />
stores
Year <strong>2007</strong><br />
Competitive environment<br />
Food trade<br />
Finland, market share 33.8%<br />
Competitors: S Group, Tradeka,<br />
Lidl<br />
HoReCa<br />
Finland, Kespro’s sales have<br />
grown at the rate of the market<br />
growth<br />
Competitors: Meiranova, Heinon<br />
Tukku, Wihuri Metro<br />
Building and home<br />
improvement trade<br />
Finland, market share 36%<br />
Competitors: Starkki, Puukeskus,<br />
S Group, Bauhaus<br />
Sweden, market share 4.5%<br />
Competitors: Bauhaus,<br />
Byggmax, DT Group, and local<br />
speciality stores<br />
Norway, market share 18%<br />
Competitors: Monter/Optimera<br />
(Saint Gobain), Maxbo, COOP<br />
Estonia, market share 17%<br />
Competitors: Ehitus ABC,<br />
Bauhof and Espak<br />
Latvia, market share 16%<br />
Competitors: Depo DIY, Tapeks/<br />
Aile and Kursi<br />
Lithuania, market share 25%<br />
Competitors: local building supplies<br />
and speciality stores<br />
Russia, St. Petersburg,<br />
market share 15%<br />
Competitors in St. Petersburg<br />
area: Maxidom, Metrica, OBI,<br />
Castorama, Leroy Merlin (2008)<br />
Divisions The Group Financial statements Further information 9<br />
The market shares for <strong>2007</strong> are specified by division and market area.<br />
The market shares are Kesko’s own estimates of the retail trade for <strong>2007</strong>, unless another source is given. Markets and market shares<br />
always depend on definitions. They depend on the definitions of product lines and geographical market areas, for example, and on the data<br />
available. The market share estimates presented on this page and elsewhere in the report are based on the best sources and research<br />
available.<br />
Car trade<br />
Finland<br />
Volkswagen cars,<br />
market share 10.2%<br />
Audi cars, market share 3.3%<br />
Volkswagen vans,<br />
market share 18.0%<br />
Department store trade<br />
Anttila, K-citymarket home and<br />
speciality goods, Kodin Ykkönen<br />
The market share cannot be<br />
calculated.<br />
Competitors: department stores,<br />
hypermarkets, speciality stores<br />
and online stores<br />
Agricultural trade<br />
Finland, market share 35%<br />
Competitor: S Group (the<br />
Agrimarket chain of Hankkija-<br />
Maatalous)<br />
Tractor trade: Valtra and Agritek<br />
Estonia, market share 25%<br />
Competitors:<br />
Agricultural supplies: Kemira<br />
GrowHow and Farm Plant<br />
Agricultural machinery:<br />
Stokker, Tatoli, Agriland and<br />
Taure<br />
Animal husbandry machinery:<br />
De Laval<br />
Latvia, market share 26%<br />
Competitors:<br />
Agricultural supplies: Kemira<br />
GrowHow and Latagra<br />
Agricultural machinery:<br />
Stokker, BFSC and Preiss<br />
Animal husbandry machinery:<br />
De Laval<br />
Lithuania, market share 11%<br />
Competitors:<br />
Agricultural supplies: Kemira<br />
GrowHow, Agrokoncernas and<br />
Litagra<br />
Agricultural machinery: Olsen<br />
Baltic, Lytagra, Rovaltra and<br />
Dotnuvos projektai<br />
Animal husbandry machinery:<br />
De Laval<br />
Machinery trade<br />
Finland, market share:<br />
Konekesko 6–34% depending<br />
on product group<br />
Competitors: Otto Brandt,<br />
Marine Power (Brunsvik),<br />
Suzuki Finland, SGN Group,<br />
Vator, Volvo CE Finland Oy<br />
(Rolac), Witraktor (Caterpillar),<br />
Rotator, Suomen Rakennuskone,<br />
Volvo, Scania, Veho, Sisu-Auto<br />
Estonia, market share 10%<br />
Competitors: Intrac, Ladur,<br />
Komatsu, Witractor, Swecon,<br />
Balti Technica<br />
Latvia, market share 15%<br />
Competitors: Intrac, Ladur,<br />
Komatsu, Witractor, Swecon<br />
Lithuania, market share 10%<br />
Competitors: Intrac, Ladur,<br />
Komatsu, Witractor, Swecon<br />
Speciality goods trade<br />
Furniture trade<br />
Finland, market share: Asko and<br />
Sotka 17%<br />
Competitors: Furniture and<br />
interior decoration stores<br />
Sports trade<br />
Market share: Intersport, Budget<br />
Sport and Kesport 33%<br />
Competitors: Sportia, Top Sport,<br />
Stadium, department stores<br />
and hypermarkets, and other<br />
speciality sports stores<br />
Home technology trade<br />
Market share: Musta Pörssi 9.5%<br />
Competitors: speciality home<br />
technology stores, hypermarkets<br />
and online stores<br />
Shoe trade<br />
Market share: K-kenkä,<br />
Andiamo, Kenkäexpertti 11%<br />
Competitors: other speciality<br />
stores, department stores, hypermarkets<br />
and sports stores<br />
Optical trade<br />
Market share: Tähti Optikko 16%<br />
Competitors: Instrumentarium<br />
and Silmäasema
10<br />
<strong>Kesko's</strong> <strong>year</strong> <strong>2007</strong><br />
Divisions<br />
Kesko Food<br />
Kesko Food’s retail chains are<br />
K-citymarket, K-supermarket, K-market<br />
and K-extra. The K-food stores offer the<br />
highest quality and most comprehensive<br />
product selections on the market<br />
combined with the best service at<br />
competitive prices.<br />
K-food stores are visited by nearly 820,000<br />
customers every day. In <strong>2007</strong> the total<br />
number of customer visits reached 300 million.<br />
From the viewpoint of success, every customer<br />
visit is decisive.<br />
The operations of Kesko Food and its<br />
chains always aim to provide customers with<br />
a successful shopping experience. This is<br />
ensured by the highest quality and most comprehensive<br />
product selections on the market<br />
combined with the best service, competitive<br />
prices and by taking customers’ wishes into<br />
account.<br />
The K-retailer entrepreneur is responsible<br />
for his or her store’s customer satisfaction,<br />
personnel, and profitability of business. Good<br />
service, competence and knowledge of local<br />
circumstances provide competitive edge.<br />
Kesko Food provides K-retailers with strong<br />
support for price competition, building selections,<br />
marketing and service. These are supported<br />
by efficient international sourcing,<br />
acquisitions of store sites, advanced logistical<br />
solutions and diverse research and training.<br />
Kesko Food’s subsidiary Kespro Ltd offers<br />
delivery and wholesale services for business<br />
customers. Kespro Ltd is the leading wholesaler<br />
in the HoReCa business in Finland. Its<br />
customers include hotels, restaurants, catering<br />
companies, service station stores, kiosks,<br />
bakeries, the manufacturing industry and<br />
distributors. Kespro serves its customers on a<br />
comprehensive basis and offers the best<br />
sourcing solutions.<br />
Over 1,000 K-food stores<br />
for different customer needs<br />
The K-food store concepts cater for various<br />
consumer needs from daily local services to<br />
hypermarkets where customers may shop for<br />
the needs of the whole week.<br />
The key features and customer promises<br />
of the K-food store concepts are:<br />
K-citymarkets are hypermarkets, which<br />
offer their customers diversified and wide<br />
selections of food, non-food, and home and<br />
speciality goods. The low price level and the<br />
best selections of K-citymarkets strengthen<br />
the customer promise which is “Good shopping.<br />
And a whole lot more.” There are 56<br />
K-citymarkets in Finland in 43 towns.<br />
K-supermarkets are food stores and their<br />
customer promise is “A better than average<br />
food store”. Competitive advantages include<br />
food expertise as well as wide and diversified<br />
selections of fresh products. K-supermarkets<br />
have a total of over 160 employees with specialist<br />
qualification for foods managers.<br />
These meat and fish experts give customers<br />
cooking advice. The chain consists of 158<br />
stores.<br />
K-markets are high-quality and reliable<br />
food stores near customers. In addition to the<br />
good basic selections, K-markets offer customers<br />
freshly baked local bread, high-quality<br />
fruit and vegetables, versatile ready-to-eat<br />
food choices and the best local services.<br />
K-market retailers and their staff ensure<br />
friendly service. Many service stations also<br />
have a K-market on their premises. The customer<br />
promise is “The retailer takes care of<br />
it”. There are 453 K-markets.<br />
K-extras are neighbourhood stores in<br />
which customers can find daily essentials and<br />
which focus on personal service. Additionally,<br />
as the name implies, many K-extras located in<br />
the countryside offer extra services, such as<br />
the sale of agricultural and builders’ supplies,<br />
fuel distribution, lottery and postal services.<br />
The customer promise of the K-extra chain is<br />
“Good service for you”. There are 223 K-extras.<br />
The best food ideas and<br />
solutions at low prices<br />
K-food stores provide their customers with<br />
the best food ideas and solutions at low<br />
prices. Kesko Food’s strategy focuses on:<br />
●●<br />
individual service and approach<br />
for each customer<br />
●●<br />
chain concepts that comply with<br />
the customer structure<br />
●●<br />
competitive price level<br />
●●<br />
strong store network<br />
●●<br />
active renewing, learning and<br />
management<br />
●●<br />
the basis is customer information and<br />
improved use of it in all activities<br />
The individual service and approach refer<br />
to the chain and store-specific wide selections<br />
and customer programmes. The wide selections<br />
also comprise high-quality Pirkka products.<br />
Each customer is given a reply to the<br />
question “What are we having today?”.<br />
K-food retailers and their staff are responsible<br />
for taking customers’ wishes into<br />
account. In addition to the chain-specific<br />
selection, the stores also sell local suppliers’<br />
products and local food.
Year <strong>2007</strong><br />
Divisions The Group Financial statements Further information 11<br />
Nina’s and Roni’s<br />
shopping in K-market<br />
was influenced by<br />
a helpful<br />
retailer<br />
the good feeling<br />
in the store<br />
a desire<br />
to try new things<br />
the K-RuokaPirkka<br />
recipe
12<br />
<strong>Kesko's</strong> <strong>year</strong> <strong>2007</strong><br />
Reliable quality<br />
Quality assurance of Pirkka products is made<br />
by the in-house Product Research Unit and<br />
the K-test kitchen, which give their approval<br />
to all own brands and also develop and test<br />
all the recipes to be published. In <strong>2007</strong> the<br />
Product Research Unit tested some 9,200<br />
samples and developed about 650 recipes.<br />
Kesko Food’s Product Research Unit also has<br />
a special Consumer Service Unit, the duties<br />
of which include answering phone calls and<br />
email messages concerning Pirkka products.<br />
In <strong>2007</strong> the Consumer Service Unit received<br />
20,300 contacts.<br />
Extensive information about the customer<br />
groups’ purchasing behaviour which is produced<br />
by K-Plussa, the K-Group’s customer<br />
loyalty card, is used for the benefit of customers<br />
in selection planning, targeted special<br />
offers and rewarding customers.<br />
The right to know what you<br />
are eating – Pirkka<br />
The Pirkka product range, which has been<br />
part of Finnish consumers’ life for over 20<br />
<strong>year</strong>s, is an important competitive asset for<br />
K-food stores. There are over 1,600 Pirkka<br />
products, and new ones are continuously<br />
being developed. The sales of Pirkka products<br />
grew by 16.7% in <strong>2007</strong>.<br />
The theme of Pirkka products is “The<br />
right to know what you are eating”. This is<br />
manifested in product safety and uniform<br />
quality. The selection is diversified and meets<br />
the demands set by various eating habits.<br />
Recipes created around Pirkka products<br />
are published in the K-Group’s customer loyalty<br />
magazine Pirkka and the largest Finnish<br />
online cookery book Pirkka.fi. The recipes are<br />
also presented in the K-RuokaPirkka leaflet<br />
that is published weekly and available in all<br />
K-food stores and on the TV programme<br />
“What are we having today?”. These recipes<br />
form an essential part of the affordable food<br />
solutions and services offered to customers.<br />
The concepts based on the customer<br />
structure are founded on the strengths shared<br />
by all chains, their customer structure and<br />
the local market situation. K-food retailers<br />
are responsible for delivering chain-specific<br />
customer promises and taking local customer<br />
needs into account.<br />
A competitive price level is a prerequisite<br />
for growth and customer satisfaction. Price<br />
competitiveness is strengthened by efficient<br />
practices all the way from customer to supplier,<br />
cooperation between chains and longterm<br />
cooperation models with selected<br />
partners.<br />
Systematic building of selections, logistics<br />
and purchasing create a basis for efficient<br />
business operations. Domestic purchasing<br />
volumes and the international sourcing<br />
cooperation (AMS) generate considerable<br />
price benefits.<br />
A strong store network is important for<br />
growth. Development of store sites and the<br />
store network will be strong. During the next<br />
three <strong>year</strong>s Kesko Food will open 20 new<br />
K-citymarkets, 50 new K-supermarkets and<br />
40 new K-markets.<br />
Active renewal, learning and management.<br />
The best retailer expertise is maintained<br />
and increased by ongoing training.<br />
The K-instituutti training centre arranges<br />
training for Kesko Food people, retailers and<br />
store staff and for key stakeholder groups. A<br />
strong pioneering position requires adopting<br />
new technologies.<br />
In June, Kesko Food received an award for<br />
efficient use of GIS technology. The international<br />
prize, which is presented annually, was<br />
awarded by ESRI (Environmental Systems<br />
Research Institute, Inc.).<br />
Customer information and its better use<br />
in all operation is based on the customer and<br />
product group level information produced by<br />
K-Plus Oy. In addition, customer behaviour<br />
and market prices, for example, are studied.<br />
Key customer programmes are built on the<br />
basis of customer information.
Year <strong>2007</strong><br />
Kesko Food<br />
Divisions The Group Financial statements Further information 13<br />
K-Group’s food stores<br />
Number Number Sales*, € million Sales*, € million<br />
<strong>2007</strong> 2006 <strong>2007</strong> 2006<br />
K-citymarket 56 54 1,808 1,700<br />
K-supermarket 158 152 1,478 1,360<br />
K-market 453 428 1,349 1,227<br />
Other K-food stores and<br />
mobile stores 403 437 410 413<br />
Finland total 1,070 1,071 5,046 4,699<br />
Food stores total 1,070 1,071 5,046 4,699<br />
* (incl. VAT)<br />
Kesko Food financial highlights, continuing operations<br />
<strong>2007</strong> 2006<br />
Net sales € million 3,871 3,615<br />
Operating profit € million 151.3 173.2<br />
Operating profit as % of net sales % 3.9 4.8<br />
Operating profit excl. non-recurring items € million 151.4 128.6<br />
Operating profit as % of net sales<br />
excl. non-recurring items % 3.9 3.6<br />
Depreciation € million 60.1 64.9<br />
Investments<br />
Return on net assets excl. non-recurring<br />
€ million 117.6 82.2<br />
items* % 18.4 14.0<br />
Personnel average<br />
* Cumulative average<br />
5,964 6,171<br />
Net sales <strong>2007</strong>, continuing operations<br />
€ million change, %<br />
K-citymarket 1,221 7.9<br />
K-supermarket 887 10.4<br />
K-market and K-extra 915 6.4<br />
Kespro ltd 669 2.6<br />
Others and intra-division 179 7.1<br />
Kesko Food total 3,871 7.1<br />
Net assets at 31 December, € million<br />
<strong>2007</strong> 2006<br />
Non-current assets 906 854<br />
Inventories 170 170<br />
Short-term receivables 308 271<br />
./. Non-interest-bearing debt -527 -494<br />
./. Provisions -7 -7<br />
Net assets* 850 794<br />
* net assets at the end of month
14<br />
<strong>Kesko's</strong> <strong>year</strong> <strong>2007</strong><br />
the things that brought<br />
Venla<br />
to K-supermarket were<br />
the delicious food<br />
feeling<br />
good<br />
the best<br />
selection<br />
freshness
Year <strong>2007</strong><br />
Health-promoting and responsible<br />
services and products<br />
Health and responsibility are increasingly<br />
important for Finnish consumers. Kesko Food<br />
makes healthy choices easier and actively<br />
develops responsible operating practices,<br />
products and services.<br />
In February, a new cooperation agreement<br />
was signed with the Association for Promoting<br />
Fairtrade in Finland and new Pirkka Fairtrade<br />
products have been introduced to the<br />
market as a result. In April we launched UTZcertified<br />
Pirkka Costa Rica, which made<br />
K-food stores the Finnish market leader in the<br />
sales of responsibly produced coffee. UTZ<br />
CERTIFIED is one the world’s largest certifier<br />
of responsibly produced coffee.<br />
GDA labels were introduced to Pirkka<br />
products in September. The GDA (guideline<br />
daily amounts) label provides information on<br />
how much of each nutrient one serving of the<br />
product contains out of the daily requirement.<br />
Kesko Food is a pioneer in the introduction of<br />
voluntary labelling in Finland.<br />
An agreement was signed on launching<br />
the Nutritioncode service, which had been<br />
piloted in some K-supermarkets for about a<br />
<strong>year</strong>, to all K-food stores for the use of Plussa<br />
customers. The Nutritioncode service is free<br />
of charge and will be introduced during 2008.<br />
It provides an easy way to monitor and<br />
develop the quality of family nutrition.<br />
Pirkka 100% biodegradable shopping bags<br />
and Pirkka non-disposable bags as an alternative<br />
for plastic bags were introduced to K-food<br />
store checkouts in autumn <strong>2007</strong>.<br />
The aim of these concrete actions is to<br />
support customers’ health-promoting and<br />
responsible choices.<br />
Divisions The Group Financial statements Further information 15<br />
Market<br />
The Finnish grocery retail market (market<br />
definition according to the store register)<br />
totalled about €13 billion in <strong>2007</strong>. The price<br />
trend in basic groceries remained moderate,<br />
but accelerated towards the end of the <strong>year</strong>.<br />
The estimated market share of the K-food<br />
stores is 33.8% (Kesko Food’s own estimate).<br />
K-food stores’ main competitors are the S<br />
Group, Tradeka and Lidl.<br />
Purchases in the Finnish HoReCa market<br />
totalled slightly less than €2.4 billion in <strong>2007</strong>.<br />
Kesko Food’s subsidiary Kespro Ltd is the<br />
leading wholesaler in the Finnish HoReCa<br />
business. Kespro’s main competitors are Meiranova,<br />
Heinon Tukku and Metrotukku.<br />
Year <strong>2007</strong><br />
Kesko Food’s net sales totalled €3,871 million<br />
in <strong>2007</strong>. The growth in net sales was good,<br />
7.1%. Kesko Food’s operating profit excluding<br />
non-recurring items was €151.4 million,<br />
which exceeded the figure for 2006 by €22.8<br />
million. The retail sales of K-food store chains<br />
totalled €5,046 million in <strong>2007</strong>, an increase<br />
of 7.4% over the previous <strong>year</strong>.<br />
It is estimated that the total grocery market<br />
in Finland has grown in January-December<br />
<strong>2007</strong> by approximately 5% over the previous<br />
<strong>year</strong> (own estimate) and the average<br />
monthly price increase was about 2% (Statistics<br />
Finland).<br />
During the <strong>year</strong>, one new K-citymarket,<br />
five K-supermarkets, and several K-markets<br />
and K-extras were established. One K-supermarket<br />
was extended into a K-citymarket. A<br />
total of 27 K-food stores were opened. Several<br />
renovations were also carried out.<br />
In <strong>2007</strong> Kesko Food looked into opportunities<br />
to dispose of Kespro Ltd and its sourcing<br />
operations. Accounts and assessments proved<br />
that the price would have remained low considering<br />
the sales and profit expectations of<br />
Kespro. Therefore a decision was made to continue<br />
developing Kespro as an independent<br />
subsidiary of Kesko Food.<br />
Objectives and outlook<br />
The implementation of Kesko Food’s strategy<br />
aims at growth faster than market, increased<br />
customer satisfaction and competitiveness.<br />
Kesko Food’s opportunities for internationalisation<br />
will also be actively surveyed.<br />
Kesko Food’s net sales are expected to<br />
grow in 2008. Owing to major investments in<br />
store sites and information systems, Kesko<br />
Food’s operating profit excluding non-recurring<br />
items in 2008 is expected to match the<br />
level of <strong>2007</strong>.
16<br />
<strong>Kesko's</strong> <strong>year</strong> <strong>2007</strong><br />
Rautakesko<br />
Rautakesko is engaged in the building<br />
and home improvement trade in<br />
Finland, Sweden, Norway, the Baltic<br />
countries, Russia, and Belarus. It<br />
manages and develops its retail chains<br />
K-rauta, Rautia, Byggmakker and<br />
Senukai as well as its B-to-B sales.<br />
Rautakesko is responsible for the chains’<br />
concepts, marketing, sourcing and<br />
logistics services, store network<br />
and retailer resources. Working in<br />
cooperation with its customers,<br />
Rautakesko enhances living and aims<br />
to be the leading service provider in<br />
the building and home improvement<br />
trade in its operating area.<br />
Market<br />
Rautakesko’s retail store chains K-rauta,<br />
Rautia, Byggmakker and Senukai serve both<br />
consumer and professional customers. Consumer<br />
customers mainly comprise home<br />
builders, renovators and interior decorators.<br />
Professional customers include construction<br />
companies, manufacturers of prefabricated<br />
houses and public institutions.<br />
The total retail market of this sector in<br />
Rautakesko’s operating area is about €17 billion.<br />
Home building and improvement markets<br />
are becoming concentrated and international<br />
retail chains are establishing stores in<br />
the largest cities. The market is growing<br />
strongly in Russia and the Baltic countries,<br />
whereas growth in the established Nordic<br />
market is more moderate. Retail sales of<br />
Rautakesko’s chains totalled €3,588.2 million<br />
(incl. VAT) in <strong>2007</strong>.<br />
Finland<br />
The Finnish retail market in the building and<br />
home improvement sector totals some €4.0<br />
billion. It increased by approximately 11.7% in<br />
<strong>2007</strong> (Finnish Hardware Association, DIY).<br />
The K-Group’s market share in this sector was<br />
about 36% (own estimate).<br />
In Finland, Rautakesko operates the<br />
K-rauta and Rautia retail chains and Rautakesko<br />
B-to-B Service for construction companies,<br />
the manufacturing industry and other<br />
professional customers. The K-rauta chain<br />
consists of 41 stores, about 70% of whose customers<br />
are consumers. The Rautia chain consists<br />
of 104 stores, of which 45 also operate as<br />
K-maatalous stores engaged in the agricultural<br />
trade. In the sales structure of Rautia,<br />
the emphasis is on basic building products.<br />
All Finnish K-rauta and Rautia stores are run<br />
by retailer entrepreneurs.<br />
The combined sales of the K-rauta and<br />
Rautia chains, Rautakesko B-to-B Service and<br />
K-customer agreement stores in Finland were<br />
€1,575.3 million (incl. VAT). Principal competitors<br />
in Finland are Starkki, Puukeskus, the<br />
S Group and Bauhaus.<br />
Sweden<br />
The Swedish building and home improvement<br />
market totals some €4.3 billion, an increase<br />
of 10% in <strong>2007</strong> (SCB).<br />
At the end of <strong>2007</strong>, Rautakesko had 16 own<br />
K-rauta stores and one retailer-owned store in<br />
Sweden. K-rauta stores’ retail sales in Sweden<br />
totalled €231.8 million (incl. VAT). Rauta-<br />
kesko’s market share is about 4.5% (own estimate).<br />
Private customers account for around<br />
85% of K-rauta customers. Principal competitors<br />
are Bauhaus, local speciality stores,<br />
Byggmax and DT Group.<br />
Norway<br />
The Norwegian building and home improvement<br />
market totals some €5.2 billion (TBF),<br />
up by 15% in <strong>2007</strong> (own estimate).<br />
In Norway, Rautakesko owns Byggmakker<br />
Norge AS, which manages the Byggmakker<br />
chain of 120 building and home improvement<br />
stores, 22 of which are owned by Byggmakker.<br />
Retailer entrepreneurs have a chain agreement<br />
with Byggmakker. Retail sales of the<br />
chain’s stores totalled €1,194.3 million in<br />
<strong>2007</strong>. Rautakesko’s market share in Norway<br />
is about 18% (own estimate). More than half<br />
of all sales go to professional customers. Principal<br />
competitors are Monter/Optimera (Saint<br />
Gobain), Maxbo and Coop.<br />
Estonia<br />
The Estonian building and home improvement<br />
market totals some €0.45 billion, an<br />
increase of 8.0% in <strong>2007</strong> (own estimate). Rautakesko<br />
has five retail stores and a nationwide<br />
network of wholesale outlets in Estonia.<br />
Retail sales of K-rauta stores totalled €108.7<br />
million (incl. VAT) in <strong>2007</strong>. Professional customers<br />
account for some 63% of all customers.<br />
Rautakesko’s market share in Estonia is<br />
about 17% (own estimate). Principal competitors<br />
are Ehituse ABC, Bauhof and Espak.<br />
Latvia<br />
The Latvian building and home improvement<br />
market totals approximately €0.6 billion, an<br />
increase of 9–10% in <strong>2007</strong> (CSB). Rautakesko<br />
has seven K-rauta stores of its own, two<br />
K-rauta partner stores and a wholesale network<br />
covering the whole of Latvia. Retail<br />
sales of K-rauta stores totalled €100.2 million<br />
(incl. VAT) in <strong>2007</strong>. It is estimated that Rautakesko’s<br />
market share in Latvia has grown to<br />
16% (own estimate). Principal competitors are<br />
Depo DIY, Tapeks/Aile and Kursi.<br />
Lithuania<br />
The Lithuanian building and home improvement<br />
market totals some €0.6 billion (own<br />
estimate) and it increased by 15% in <strong>2007</strong><br />
(own estimate). In Lithuania, Rautakesko has<br />
the majority shareholding in UAB Senuku<br />
Prekybos centras, which is the market leader
Year <strong>2007</strong><br />
Divisions The Group Financial statements Further information 17<br />
Mika’s<br />
and Siiri’s<br />
quality<br />
materials<br />
most important reasons<br />
for trusting Rautia<br />
reliable<br />
service<br />
a new<br />
addition to<br />
the family<br />
a common<br />
future
18<br />
<strong>Kesko's</strong> <strong>year</strong> <strong>2007</strong><br />
in Lithuania with a share of about 25%. The<br />
Senukai chain consists of 14 own stores and<br />
76 partnershop stores. Retail sales of Senukai<br />
totalled €537,6 million (incl. VAT) in <strong>2007</strong>.<br />
Senukai sells to both consumers and business<br />
customers. Senukai’s competitors<br />
include local building supplies outlets and<br />
speciality stores.<br />
Russia<br />
The building and home improvement market<br />
in the St. Petersburg area totals some €1.0 billion<br />
(own estimate), an increase of about<br />
15–20% in <strong>2007</strong> (Ros Business Consulting and<br />
own estimate). There are eight K-rauta stores<br />
in St. Petersburg. Retail sales of stores in Russia<br />
totalled €177.7 million (incl. VAT) in <strong>2007</strong>.<br />
Rautakesko’s market share in the St. Petersburg<br />
area is about 15% (own estimate). Rautakesko’s<br />
competitors are Maxidom, Metrica,<br />
OBI, Castorama and Leroy Merlin (2008).<br />
The total market in Moscow is about 2.5€<br />
billion (source: Ros Business Consulting<br />
RBC), representing an increase of 15–20% in<br />
<strong>2007</strong>. Competitors are Starik Hottabyz, Master<br />
dom, Tvoy Dom, OBI, Leroy Merlin, Castorama,<br />
the open building supplies market and<br />
speciality goods stores. Rautakesko is planning<br />
to open several new K-rauta stores in<br />
Moscow in the next few <strong>year</strong>s.<br />
Belarus<br />
The building and home improvement market<br />
in Belarus totals some €1.3 billion (own estimate).<br />
OMA, acquired by Senukai in Belarus<br />
in July <strong>2007</strong>, has three stores. The market<br />
share of OMA is about 5% of the total market<br />
(own estimate) and its retail sales amounted<br />
to €38.1 million (incl. VAT) in July-December.<br />
Strengths<br />
Rautakesko’s operations are based on good<br />
customer knowledge and the strong chain<br />
concepts developed on the basis of that.<br />
K-rauta is Rautakesko’s international concept.<br />
K-rauta operates in Finland, Sweden,<br />
Estonia, Latvia and St. Petersburg, Russia.<br />
K-rauta meets the customer demand for safe<br />
ideas and solutions for building and living. In<br />
addition to products, K-rauta offers a comprehensive<br />
range of design and assembly<br />
services.<br />
The K-rauta concept has inherent<br />
strengths that differentiate it from the traditional<br />
European DIY concepts. The K-rauta<br />
concept has succeeded to combine the service,<br />
selections and business models for consumers,<br />
builders and professional customers.<br />
Furthermore, the K-rauta chain’s competitive<br />
advantages include, on average, larger stores<br />
and attached builders’ yards than its<br />
competitors.<br />
The Rautia chain is the largest building<br />
and home improvement store chain in Finland.<br />
Its selections are targeted at builders,<br />
renovators and building professionals in particular.<br />
Key competitive advantages include<br />
comprehensive customer service, knowledge<br />
of the local market and the cooperation network.<br />
Many Rautia stores also complement<br />
their range with agricultural items.<br />
The Byggmakker chain is the largest<br />
building and home improvement store chain<br />
in Norway. Its characteristic features include<br />
reliable, high-quality operations and retailer<br />
entrepreneurship. Special strengths include<br />
sales of building supplies and sales to professional<br />
customers.<br />
The Senukai chain is the market leader in<br />
Lithuania. The chain also incorporates the<br />
Mega Store concept, which offers customers<br />
just about every product related to building<br />
and living at its stores of over 20,000 m 2 . The<br />
chain’s special strengths include the competence<br />
and skills of its personnel.<br />
Rautakesko B-to-B Service operates in<br />
Finland. Its customers include national building<br />
firms, the manufacturing industry and<br />
other professional customers. Customers benefit<br />
from close collaboration with the B-to-B<br />
Service; the unit plans, directs and executes<br />
duties related to purchasing, allowing the customer<br />
company to effectively concentrate on<br />
its core business. Rautakesko B-to-B Service’s<br />
strengths also include close cooperation with<br />
the Finnish network of K-rauta and Rautia<br />
stores, through which a significant part of<br />
deliveries are made.<br />
Rautakesko combines – operating in the<br />
background – the chains’ category management,<br />
purchasing, logistics, information system<br />
control and network improvements. The<br />
synergy benefits and economies of scale<br />
achieved enable the company to offer products<br />
and services to customers at competitive<br />
prices. Joint training programmes between<br />
the chains and Rautakesko enhance the competencies<br />
of the personnel.<br />
In terms of its chains’ retail sales, Rautakesko<br />
is one of the five largest companies<br />
in the European building and home improve-<br />
ment market. Rautakesko’s competitors in<br />
the European market include Castorama,<br />
Leroy Merlin, OBI, DT Group / Starkki, Bauhaus<br />
and Hornbach. (Sources: Verdict <strong>2007</strong>,<br />
DIY in Europe statistics 5/<strong>2007</strong>, corporate<br />
annual reports and web pages)<br />
Interest in home and interior decoration is<br />
increasing. The product groups experiencing<br />
growth include, above all, interior surface<br />
materials and yard and garden supplies.<br />
Increasing numbers of families hire a professional<br />
designer to assist them in designing<br />
decoration for their houses or gardens.<br />
Demand for various services, such as design,<br />
transport and installation is growing<br />
strongly. The products sold are increasingly<br />
processed and, in addition to individual products<br />
and services sold separately (DIY = do it<br />
yourself), design models help stores sell more<br />
and more total solutions (DIFM = do it for me)<br />
for homes.<br />
Customers’ purchasing behaviour and consumption<br />
habits are getting more diversified.<br />
Traditional visits to stores are being increasingly<br />
complemented by the Internet as an<br />
information source and purchasing channel.<br />
New international service providers are entering<br />
the market and new forms of cooperation<br />
are emerging.<br />
Energy efficiency, environmental values<br />
and responsibility are gaining more importance<br />
in consumers’ decision-making. Rautakesko<br />
promotes energy efficiency under a<br />
special theme, with Motiva and the Pulmonary<br />
Association Heli as cooperation partners.<br />
Product ranges will also be complemented<br />
with items that contribute to energy<br />
savings. Environmental values and responsibility<br />
are promoted with Rautakesko’s responsible<br />
timber sourcing policy.<br />
Year <strong>2007</strong><br />
Rautakesko’s net sales totalled €2,537.3 million,<br />
an increase of 19.2%. Net sales in Finland<br />
amounted to €909.3 million, up by 10.7%. The<br />
net sales of subsidiaries in other countries<br />
totalled €1,625 million, an increase of 24.4%.<br />
Foreign subsidiaries accounted for 64.0% of<br />
Rautakesko’s net sales.<br />
Rautakesko’s operating profit excluding<br />
non-recurring items was €115.9 million, an<br />
increase of €24.8 million. The growth in the<br />
operating profit was attributable to the<br />
expansion of business and increase in sales<br />
in line with the strategy. Rautakesko’s invest-
Year <strong>2007</strong><br />
Rautakesko<br />
Divisions The Group Financial statements Further information 19<br />
K-Group’s building and home improvement stores (incl. B-to-B)<br />
Number Number Sales*, € million Sales*, € million<br />
<strong>2007</strong> 2006 <strong>2007</strong> 2006<br />
K-rauta 41 40 653 601<br />
Rautia 104 105 547 501<br />
K-customer agreement stores 34 35 59 56<br />
B-to-B service 316 273<br />
Finland total 179 180 1,575 1,431<br />
K-rauta, Sweden 17 14 232 194<br />
K-rauta, Estonia 5 4 109 87<br />
K-rauta, latvia 7 5 100 72<br />
Senukai, lithuania 14 14 538 428<br />
OMA, Belarus 3 38<br />
Stroymaster, Russia 8 7 178 121<br />
Byggmakker, Norway 120 118 1,194 1,080<br />
Other countries, total 174 162 2,388 1,981<br />
Building and home<br />
improvement stores total 353 342 3,963 3,412<br />
* (incl. VAT)<br />
Rautakesko financial highlights, continuing operations<br />
<strong>2007</strong> 2006<br />
Net sales € million 2,537 2,129<br />
Operating profit € million 117.8 139.3<br />
Operating profit as % of net sales % 4.6 6.5<br />
Operating profit excl. non-recurring items € million 115.9 91.2<br />
Operating profit as % of net sales<br />
excl. non-recurring items % 4.6 4.3<br />
Depreciation € million 25.7 23.4<br />
Investments<br />
Return on net assets excl. non-recurring<br />
€ million 77.0 75.8<br />
items* % 22.7 20.9<br />
Personnel average<br />
* cumulative average<br />
9,111 7,420<br />
Net sales <strong>2007</strong>, continuing operations<br />
€ million change, %<br />
Rautakesko ltd 915 10.7<br />
K-rauta AB, Sweden 184 19.3<br />
Byggmakker, Norway 618 12.9<br />
Rautakesko AS, Estonia 92 24.7<br />
A/S Rautakesko, latvia 85 40.0<br />
Senukai Group, lithuania 486 34.9<br />
Senukai (excl. OMA) 454 25.9<br />
OMA 32 (..)<br />
Stroymaster, Russia 151 47.4<br />
Others and intra-division 7 64.0<br />
Rautakesko total 2,537 19.2<br />
(..) change over 100%<br />
Net assets at 31 December, € million<br />
<strong>2007</strong> 2006<br />
Non-current assets 446 387<br />
Inventories 249 191<br />
Short-term receivables 216 193<br />
./. Non-interest-bearing debt -328 -310<br />
./. Provisions -11 -3<br />
Net assets* 573 458<br />
* net assets at the end of month
20<br />
<strong>Kesko's</strong> <strong>year</strong> <strong>2007</strong><br />
Own brands<br />
High-quality and inexpensive Prof, Cello, FXA<br />
and Fiorin product ranges help customers<br />
implement their building, interior decoration<br />
and renovation projects. International development<br />
work was continued by launching<br />
several new products and categories in <strong>2007</strong>.<br />
The new store look and new product ranges<br />
were received well in all the countries where<br />
Rautakesko operates.<br />
The Cello range of interior decoration<br />
items strengthens the sales and market position<br />
of Rautakesko’s chains in these products.<br />
The aim is to help customers reach purchasing<br />
decisions with the help of a comprehensive<br />
Cello collection. The new web site www.<br />
cello-info.com was opened in summer <strong>2007</strong>.<br />
The Cello range grew by 150 new products<br />
during the <strong>year</strong>.<br />
The Prof product range offers high-quality<br />
materials, supplies and tools related to building<br />
and renovation for consumers and professionals.<br />
The range grew by 200 products<br />
during the <strong>year</strong>.<br />
Inexpensive FXA hand tools were<br />
launched in Finland, Sweden, Latvia and<br />
Estonia in the autumn.<br />
At the end of <strong>2007</strong>, there were more than<br />
1,000 different Prof, Cello, Fiorin and FXA<br />
products on the market.<br />
ments totalled €77.0 million, of which investments<br />
outside Finland accounted for 59.3%.<br />
In Finland, new K-rauta stores were<br />
opened during the <strong>year</strong> in Hyvinkää, Kirkkonummi<br />
and Kotka, and new Rautia stores in<br />
Kurikka, Mäntyharju and Klaukkala, Nurmijärvi.<br />
Refurbished K-rauta stores were opened<br />
in Joensuu, Kouvola, Välivainio and Äimärautio<br />
in Oulu, and Rautia stores in Alajärvi,<br />
Kaavi, Konnevesi, Oulainen, Raahe and Salo.<br />
In Sweden, new K-rauta stores were<br />
opened in Umeå and Växjö, and the refurbished<br />
and expanded K-rauta was opened in<br />
Gävle where its predecessor had been<br />
destroyed by fire a <strong>year</strong> before. Byggmakker<br />
stores were opened in Oslo and Haugesund,<br />
Norway. In Tallinn, Rautakesko opened its<br />
biggest store in Estonia. In Latvia, K-rauta<br />
stores were opened in Tukums and Daugavpils.<br />
In St. Petersburg, Russia, Rautakesko<br />
opened its eighth K-rauta outlet in December.<br />
Rautakesko renewed its cooperation<br />
agreement with the Pulmonary Association<br />
Heli in the ’Mould Trap’ project, effective in<br />
<strong>2007</strong> and 2008. The K-rauta and Rautia<br />
chains support the renovation of mouldaffected<br />
one-family houses by delivering the<br />
required supplies for interior decoration, sanitary<br />
areas and ventilation free of charge.<br />
Rautia participated in the Hämeenlinna<br />
housing fair with the Vieska house brand and<br />
K-rauta with the Avainkoti house brand.<br />
The Latvia Building Material Traders’<br />
Association chose K-rauta Ulmana in Riga as<br />
the best building materials retail company in<br />
2006. K-rauta Liepaja was rated third in the<br />
contest.<br />
Several new import projects were started<br />
in <strong>2007</strong> through the Shanghai sourcing<br />
agency established with Kauko-Telko at the<br />
end of the previous <strong>year</strong>. Thanks to a sourcing<br />
agency of our own we can leverage the purchasing<br />
power and logistics of the entire<br />
international Rautakesko to the benefit of our<br />
customers.<br />
In July, Senukai acquired the majority of<br />
voting rights in the Lithuanian UAB Romos<br />
Holdingas, which owns OMA, a Belarussian<br />
DIY operator.<br />
Objectives and outlook<br />
Rautakesko will significantly expand and<br />
modernise the present store network in every<br />
operating country, particularly in Russia, during<br />
the next three <strong>year</strong>s. The target is to<br />
increase the proportion of services out of<br />
total sales and to achieve market leadership<br />
in all operating countries.<br />
Eight K-rauta and four Rautia outlets will be<br />
refurbished in Finland in 2008. Four new stores<br />
will be opened in Sweden, one in Norway, six in<br />
the Baltic countries and two in Russia.<br />
The store concepts of the retail chains will<br />
be enhanced actively. The stores in Sweden,<br />
Estonia and Russia will be reformed to comply<br />
with the revised K-rauta store concept. A<br />
project has been started to upgrade the Rautia<br />
store concept, which will reach the pilot<br />
stage during the <strong>year</strong> 2008. In Norway, 25–30<br />
Byggmakker stores will be annually converted<br />
to the revised concept.<br />
Rautakesko will develop its operations<br />
and support the retail chains with joint business<br />
models and systems in all the operating<br />
countries. Synergy benefits are sought with<br />
uniform product ranges, own brands, productised<br />
services, logistics solutions, centralised<br />
information management, partnership cooperation<br />
projects, and improving staff<br />
competencies.<br />
Rautakesko will gradually adopt the joint<br />
information system of its retail chains (Best<br />
Practice Retail Solutions, BPRS) in all its<br />
operating countries by the end of 2011. The<br />
information system will be first adopted in<br />
Norway in early 2008. Furthermore, an internationally<br />
uniform logistics network is also<br />
being planned.<br />
The starting point is strengthening the<br />
market position in all operating countries.<br />
With the view to achieving the best customer<br />
satisfaction Rautakesko focuses on motivated<br />
and skilled staff and on close joint operations<br />
while taking the local market situation<br />
into account. The management’s role as trainers<br />
and motivators by setting an example will<br />
be emphasised.<br />
Rautakesko’s fast expansion in many<br />
countries has necessitated taking cultural<br />
differences into account and introducing new<br />
joint business models. During the following<br />
three <strong>year</strong>s, the focus will be on arranging<br />
training in sales and customer service and<br />
common international training events.<br />
In 2008, Rautakesko will continue to<br />
invest in new store sites, employee competencies<br />
and a uniform information system. It is<br />
expected that Rautakesko’s net sales will<br />
grow in 2008. Its operating profit excluding<br />
non-recurring items is expected to grow<br />
slightly in 2008.
Year <strong>2007</strong><br />
VV-Auto<br />
VV-Auto imports and markets<br />
Volkswagen and Audi passenger cars<br />
and Volkswagen commercial vehicles<br />
in Finland. VV-Auto is also engaged in<br />
car retailing and provides after-sales<br />
services in its own outlets in the Greater<br />
helsinki area and in Turku. VV-Auto’s<br />
subsidiary Auto-Span Oy imports and<br />
markets Seat passenger cars in Finland,<br />
Estonia and latvia.<br />
Divisions The Group Financial statements Further information 21<br />
Market<br />
In <strong>2007</strong>, a total of 125,608 new passenger cars<br />
and 16,885 vans were registered in Finland.<br />
The passenger car market decreased by<br />
13.8%. During the first part of the <strong>year</strong>, discussion<br />
about car taxation, the dropping price<br />
level of trade-in cars and the rising interest<br />
rates slowed down the sales of new passenger<br />
cars. The change in car tax, announced by the<br />
government on 2 November <strong>2007</strong>, nearly<br />
stopped passenger car sales in November-<br />
December and postponed deliveries to customers<br />
to 2008. Registrations of new vans<br />
increased by 10.6% over the previous <strong>year</strong>.<br />
Volkswagen has maintained its market<br />
share and the second place in the registration<br />
statistics. The proportion of diesel passenger<br />
cars out of all new registrations in Finland<br />
grew to nearly 30%. Volkswagen is one of the<br />
leading brands in diesel passenger cars. Audi<br />
also maintained its market share and attraction<br />
as number one among premium brands.<br />
The introduction of new Seat models and<br />
improved price competitiveness increased the<br />
brand’s market share. The increase in Seat’s<br />
market share was particularly good in the<br />
Baltic countries. Minibuses included,<br />
Volkswagen was the most purchased commercial<br />
vehicle.<br />
The Volkswagen passenger car range continued<br />
to expand in <strong>2007</strong>. New launches to<br />
the market included the revised Golf Variant<br />
and, towards the end of the <strong>year</strong>, the range<br />
expanded with the new Tiguan. The Audi<br />
range was complemented with the new Audi<br />
A5 coupe and the new Audi A4, first presented<br />
at the Helsinki Motor Show. Seat Altea XL<br />
and Freetrack, and Ibiza Cupra and Leon<br />
Cupra strengthened the sporty image of Seat.<br />
In <strong>2007</strong> the market share of Volkswagen passenger<br />
cars in Finland was 10.2%, while Audi<br />
had a market share of 3.3% and Seat’s share<br />
was 1.2%. Seat’s market share in Estonia was<br />
1.2% and 0.8% in Latvia.<br />
Year <strong>2007</strong><br />
VV-Auto’s net sales totalled €804.8 million in<br />
<strong>2007</strong>, up by 2.0% over the previous <strong>year</strong>. The<br />
operating profit excluding non-recurring<br />
items was €26.1 million, compared with €29.5<br />
million in 2006. The car tax reform considerably<br />
effected VV-Auto’s sales in November-<br />
December and the combined sales of <strong>2007</strong><br />
increased only slightly from the previous<br />
<strong>year</strong>.<br />
In terms of vehicle numbers, VV-Auto’s<br />
own outlets in the Greater Helsinki area and<br />
Turku accounted for about one third of all<br />
new Volkswagen and Audi retail sales.<br />
VV-Auto’s retail sales network consists of<br />
40 outlets selling Volkswagens and 62 service<br />
centres providing maintenance and repair<br />
services for them. The corresponding numbers<br />
for Audis are 17 and 44. Seats are sold by<br />
25 outlets and maintained and repaired by 43<br />
centres, three of which are located in the Baltic<br />
countries.<br />
Customer service was further enhanced by<br />
focusing on technology and customer service<br />
training in after-sales services. VV-Auto’s own<br />
training centre in Herttoniemi, Helsinki provides<br />
5,000 training days annually. The most<br />
important investment of the <strong>year</strong> was a centralised<br />
customer relationship management<br />
system, which will be introduced at the beginning<br />
of 2008. Three new service products<br />
were launched to help customers in car purchasing<br />
and maintenance: Plussa leasing,<br />
Plussa finance and Plussa insurance. The<br />
K-Plussa customer loyalty system was<br />
expanded to VV-Auto’s outlets in late <strong>2007</strong>.<br />
Plussa points are accrued from spare parts<br />
purchases and maintenance services. In<br />
December, VV-Auto and SE Mäkinen Logistics<br />
Ltd signed an agreement according to which<br />
SE Mäkinen will offer import-related transport,<br />
maintenance and storage services for<br />
the cars imported by VV-Auto. The agreement<br />
will enter into force at the completion of the<br />
Vuosaari harbour at the end of 2008.
22<br />
<strong>Kesko's</strong> <strong>year</strong> <strong>2007</strong><br />
Sami decided<br />
on a Volkswagen because of<br />
it retains<br />
its value<br />
the service contract<br />
space<br />
for family<br />
and things<br />
customer<br />
service
Year <strong>2007</strong><br />
Divisions The Group Financial statements Further information 23<br />
Objectives and outlook<br />
It is forecast that the car tax solution will<br />
have a significant part to play in the growth of<br />
the passenger car market in 2008, while the<br />
total market for vans is anticipated to slightly<br />
decrease compared with <strong>2007</strong>. The change in<br />
car taxation is expected to contribute to consumers<br />
choosing lower-emission models.<br />
Consumers will continue to value safety, comfort<br />
and the high level of accessories. The<br />
number of diesel cars is expected to grow considerably<br />
in 2008.<br />
The annual vehicle tax will be based on<br />
carbon dioxide emissions as of 2010, which is<br />
also expected to contribute positively to the<br />
sales of new, low-consumption cars.<br />
K-Group’s car stores (Finland)<br />
VV-Auto helsinki and<br />
VV-Auto aims to increase the market share<br />
of the brands it represents during 2008 and<br />
to continue to enhance its network of retail<br />
outlets. The focus will be on expanding the<br />
range of services, strengthening the concept<br />
for trade-in cars, and expanding the centralised<br />
customer relationship management<br />
system.<br />
In 2008, VV-Auto’s net sales and the operating<br />
profit excluding non-recurring items<br />
are expected to markedly exceed the previous<br />
<strong>year</strong>’s level.<br />
Number Number Sales*, € million Sales*, € million<br />
<strong>2007</strong> 2006 <strong>2007</strong> 2006<br />
Turun VV-Auto 5 5 426 396<br />
* (incl. VAT)<br />
Financial highlights, continuing operations<br />
<strong>2007</strong> 2006<br />
Net sales € million 805 789<br />
Operating profit € million 26.1 29.4<br />
Operating profit as % of net sales % 3.2 3.7<br />
Operating profit excl. non-recurring items € million 26.1 29.5<br />
Operating profit as % of net sales excl.<br />
non-recurring items % 3.2 3.7<br />
Depreciation € million 5.7 7.7<br />
Investments<br />
Return on net assets excl. non-recurring<br />
€ million 6.3 34.2<br />
items* % 22.0 22.9<br />
Personnel average<br />
* cumulative average<br />
737 621<br />
Net sales <strong>2007</strong>, continuing operations<br />
€ million change, %<br />
VV-Auto Group 805 2.0<br />
Net assets at 31 December, € million<br />
<strong>2007</strong> 2006<br />
Non-current assets 44 59<br />
Inventories 130 104<br />
Short-term receivables 31 31<br />
./. Non-interest-bearing debt -44 -44<br />
./. Provisions -11 -11<br />
Net assets* 151 139<br />
* Net assets at the end of month
24<br />
Anttila<br />
<strong>Kesko's</strong> <strong>year</strong> <strong>2007</strong><br />
Anttila is the leading home and<br />
speciality goods retailer in Finland.<br />
Anttila serves its customers with two<br />
department store concepts – the Anttila<br />
department stores and the Kodin<br />
Ykkönen department stores for interior<br />
decoration and home goods – and with<br />
the NetAnttila concept focused on<br />
distance sales. NetAnttila provides its<br />
online and catalogue sales services and<br />
products in Finland, Estonia and latvia.<br />
Anttila’s customers value, above all,<br />
diversified, up-to-date and low-priced<br />
selections, and good service.<br />
Market<br />
In Finland there are 28 Anttila department<br />
stores, eight Kodin Ykkönen department<br />
stores for interior decoration and home<br />
goods, and the Kodin1.com online store.<br />
NetAnttila is engaged in distance sales and<br />
serves its customers online and by catalogue.<br />
Anttila retails entertainment, fashion and<br />
home goods, whose total market is estimated<br />
to be €7–8 billion. The annual growth in the<br />
market is about 3–5%.<br />
Customers of Anttila department stores<br />
value good, expert service and diversified leisure,<br />
clothing and home goods selections<br />
combined with a low price level.<br />
Kodin Ykkönen is Finland’s widest and<br />
most diversified chain of speciality department<br />
stores. Customers of Kodin Ykkönen<br />
value diversified selections, interior decoration<br />
ideas and good design and other service.<br />
Customers of NetAnttila value ease of<br />
shopping, low prices, reliability and flexible<br />
payment options. NetAnttila operates in Finland,<br />
Estonia and Latvia.<br />
Anttila’s competitors include department<br />
stores, hypermarkets, speciality store chains<br />
and online stores. The importance of discounters<br />
as competitors to Anttila is growing<br />
as they form chains and start to focus on<br />
branded goods.<br />
Strengths<br />
Anttila focuses on home and speciality goods<br />
retailing. Approximately 26 million customers<br />
visit Anttila every <strong>year</strong>. There are about<br />
2,100 employees in Anttila’s customer service.<br />
Anttila bases its selections on customer<br />
wishes, purchasing behaviour and over<br />
50,000 annual items of customer feedback.<br />
Anttila differentiates itself from competitors<br />
not only through its comprehensive selections,<br />
but also through its focus on stores providing<br />
ideas and sales-oriented service.<br />
Centralised purchasing and effective support<br />
activities enable competitive pricing and<br />
quick reactions to market changes.<br />
Year <strong>2007</strong><br />
In <strong>2007</strong> Anttila’s net sales totalled €563.7 million,<br />
an increase of 2.9%. Sales performance<br />
was affected by the closing down of the City<br />
department store in Helsinki in January <strong>2007</strong>,<br />
due to termination of the lease. The Kodin1.<br />
com online department store was opened in<br />
May <strong>2007</strong> and a new department store in<br />
Mikkeli in October <strong>2007</strong>. Anttila’s operating<br />
profit excluding non-recurring items was<br />
€25.2 million.<br />
The focus on service and customer-orientation<br />
was reflected in good sales growth, particularly<br />
towards the end of the <strong>year</strong>. In Estonia,<br />
distance sales declined by 16.9%, which<br />
can be attributed to the expansion of the traditional<br />
store network and the decrease in the<br />
number of catalogues. In Latvia, distance<br />
sales increased by 9.4% thanks to the successful<br />
customer credit system.<br />
Objectives and outlook<br />
The market for home and speciality goods is<br />
estimated to grow overall by 3–4% in 2008,<br />
but there will be differences between product<br />
lines. The <strong>2007</strong> sales growth in home electronics<br />
can, to a great extent, be attributed to<br />
the strong sales of digital equipment in the<br />
late summer. Interior decoration and home<br />
technology will continue to be important for<br />
consumers. Anttila’s objective is to grow<br />
faster than the market and it will continue to<br />
highlight customer service and sales training<br />
for the staff. The range of services related to<br />
home and speciality goods will be developed<br />
and they will be marketed actively.<br />
Anttila’s strategic objectives include<br />
strengthening its market position on a profitable<br />
basis, improving customer loyalty,<br />
achieving a high level of competence, and<br />
increasing online services. New Anttila<br />
department stores will be opened in Pori and<br />
Rovaniemi in 2008 and the second Kodin<br />
Ykkönen department store will be opened in<br />
Tampere in autumn 2009. The proportion of<br />
branded products in store selections will<br />
grow. The average purchase and the number<br />
of customer visits will be increased through<br />
higher customer loyalty. The range of products<br />
and services available online will also be<br />
increased.<br />
In 2008, Anttila’s net sales are expected to<br />
grow, and its operating profit excluding nonrecurring<br />
items is expected to match the level<br />
of <strong>2007</strong>.
Year <strong>2007</strong><br />
Heini<br />
a suitable<br />
price<br />
in Anttila<br />
was influenced by<br />
Divisions The Group Financial statements Further information 25<br />
a varied<br />
selection<br />
a nice salesperson<br />
a song<br />
on the<br />
radio
26<br />
<strong>Kesko's</strong> <strong>year</strong> <strong>2007</strong><br />
Anttila<br />
Number Number Sales*, € million Sales*, € million<br />
<strong>2007</strong> 2006 <strong>2007</strong> 2006<br />
Anttila department stores 28 27 398 391<br />
Kodin Ykkönen<br />
department stores 8 8 184 172<br />
Distance sales (Mail order,<br />
NetAnttila, Kodin1.com) 2 - 89 84<br />
Finland total 38 35 671 648<br />
Anttila mail order,<br />
Estonia and latvia 2 - 19 20<br />
Other countries total 2 - 19 20<br />
Anttila total 40 35 689 668<br />
* (incl. VAT)<br />
Anttila financial highlights, continuing operations<br />
<strong>2007</strong> 2006<br />
Net sales € million 564 548<br />
Operating profit € million 27.2 38.7<br />
Operating profit as % of net sales % 4.8 7.1<br />
Operating profit excl. non-recurring items € million 25.2 26.5<br />
Operating profit as % of net sales excl.<br />
non-recurring items % 4.5 4.8<br />
Depreciation € million 6.1 8.1<br />
Investments<br />
Return on net assets excl. non-recurring<br />
€ million 5.8 4.6<br />
items* % 18.3 17.0<br />
Personnel average<br />
* cumulative average<br />
2,045 2,122<br />
Net sales <strong>2007</strong>, continuing operations<br />
€ million change, %<br />
Anttila Group 564 2.9<br />
Net assets at 31 December, € million<br />
<strong>2007</strong> 2006<br />
Non-current assets 53 67<br />
Inventories 99 90<br />
Short-term receivables 43 39<br />
./. Non-interest-bearing debt -75 -72<br />
./. Provisions -1 0<br />
Net assets* 120 125<br />
* net assets at the end of month
Year <strong>2007</strong><br />
Kesko Agro<br />
Kesko Agro’s K-maatalous chain<br />
purchases and sells animal feed,<br />
chemicals and machinery to agricultural<br />
entrepreneurs and trades in grain. Kesko<br />
Agro is active in Finland and in all the<br />
Baltic countries.<br />
Market<br />
In Finland, Kesko Agro and 95 K-maatalous<br />
agricultural stores form the K-maatalous<br />
chain. About half of the stores in the chain<br />
are combined with Rautia under the name<br />
’Rautia-K-maatalous’, or with K-rauta under<br />
the name ’K-rauta-K-maatalous’. The K-maatalous<br />
chain’s major customer groups are agricultural<br />
entrepreneurs (farmers) and contractors.<br />
K-maatalous provides agricultural entrepreneurs<br />
with solutions that help them<br />
efficiently produce the safe and pure foodstuffs<br />
that are valued by consumers.<br />
The total Finnish agricultural market is<br />
valued at about €2 billion. There are two big<br />
operators: the Agrimarket chain of Hankkija-<br />
Divisions The Group Financial statements Further information 27<br />
Maatalous is the market leader with a share<br />
of 46%, while the K-maatalous chain ranks<br />
second with a market share of about 35%.<br />
Valtra and Agritek are major competitors in<br />
the tractor trade.<br />
Kesko Agro Eesti AS in Estonia, SIA Kesko<br />
Agro Latvija in Latvia and UAB Kesko Agro<br />
Lietuva in Lithuania are the Kesko Agro subsidiaries<br />
that are involved in the agricultural<br />
trade in the Baltic countries. The Baltic market<br />
is currently valued at about €1.2 billion.<br />
Kesko Agro is the market leader in the Baltic<br />
agricultural trade with a market share of<br />
about 25% in Estonia, about 26% in Latvia<br />
and about 11% in Lithuania.<br />
Strengths<br />
The K-maatalous chain’s strengths in Finland<br />
include the K-maatalous retailers, who know<br />
the local customers and circumstances, and<br />
the wide product range combined with the<br />
comprehensive services and network. In the<br />
Baltic countries, its strengths include Kesko<br />
Agro’s position in the machinery trade and<br />
the comprehensive sales and service network.<br />
The best-known product brands represented<br />
by Kesko Agro include Massey Ferguson<br />
tractors, Claas combines and forage harvesters,<br />
and the Tume and Elho agricultural<br />
implements made in Finland.<br />
Active contacts and sales and the utilisation<br />
of data and information technology provide<br />
the basis for close cooperation between<br />
farmers and K-maatalous and Kesko Agro.<br />
The popular trade-in machinery service, the<br />
web trading place and revised web pages provide<br />
many kinds of information and services<br />
to farmers and other partners.<br />
Kesko Agro and Rautakesko are working<br />
together to develop the combined Rautia-Kmaatalous<br />
stores into innovators in the sector.<br />
The chains aim to duplicate the best practices<br />
of individual stores throughout the<br />
entire chain and, in that way, improve customer<br />
service and operational efficiency.<br />
The Cultivation Programme of K-maatalous<br />
provides solutions that improve the profitability<br />
of cultivation while meeting the<br />
needs of each farmer. The cultivation programme<br />
includes guidelines on the choice of<br />
seed, on fertilisation, on plant protection and<br />
liming. The K-Experimental Farm in Hauho<br />
does pioneering research and development<br />
for agriculture by testing plant varieties, fertilisation<br />
and protection.<br />
The annual Kone-Forum exhibition, the<br />
most important event in the agricultural<br />
machinery calendar, gives customers an<br />
opportunity to become acquainted with the<br />
new products and machinery offered for the<br />
coming season. Experts of K-maatalous assist<br />
customers in questions related to the use of<br />
machinery and in the planning of machinery<br />
purchases, while taking farm-specific needs<br />
into account.<br />
Year <strong>2007</strong><br />
In <strong>2007</strong> Kesko Agro’s net sales were €793.4<br />
million, an increase of 5.1% over the previous<br />
<strong>year</strong>. In the Baltic countries Kesko Agro’s net<br />
sales increased by 7.9% to €294.6 million.<br />
Kesko Agro’s operating profit excluding nonrecurring<br />
items was €12.4 million in <strong>2007</strong>,<br />
which was €4.6 million more than in the previous<br />
<strong>year</strong>.<br />
Kesko Agro improved its operational efficiency<br />
in <strong>2007</strong> by renewing its organisation<br />
and business models.<br />
K-maatalous and Kesko Agro will continue<br />
to focus on improving customer satisfaction<br />
by offering the best solutions, a diversified<br />
product range and excellent services.<br />
Objectives and outlook<br />
The objective of K-maatalous is to improve its<br />
profitability in the agricultural trade. To do<br />
this, it will focus on developing the machinery<br />
trade and after-sales services in Finland and<br />
the Baltic countries. Another area of development<br />
in Finland will be the Cultivation<br />
Programme.<br />
The rising prices of grain and other agricultural<br />
products are creating positive expectations<br />
for next <strong>year</strong>’s agricultural trade.<br />
Regardless of the structural changes taking<br />
place in the sector, it is expected that in<br />
2008, Kesko Agro’s net sales and operating<br />
profit excluding non-recurring items will<br />
match the level of <strong>2007</strong>.
28<br />
<strong>Kesko's</strong> <strong>year</strong> <strong>2007</strong><br />
expert<br />
service<br />
a familiar<br />
salesperson<br />
Ville<br />
was directed<br />
towards K-maatalous by<br />
a good<br />
price<br />
well-known<br />
brands
Year <strong>2007</strong><br />
Kesko Agro<br />
Divisions The Group Financial statements Further information 29<br />
K-Group’s agricultural stores<br />
Number Number Sales*, € million Sales*, € million<br />
<strong>2007</strong> 2006 <strong>2007</strong> 2006<br />
K-maatalous 95 99 674 602<br />
Finland total 95 99 674 602<br />
Kesko Agro Eesti 6 6 81 74<br />
Kesko Agro latvija 4 4 127 115<br />
Kesko Agro lietuva 3 3 84 105<br />
Other countries total 13 13 293 294<br />
Agricultural stores total 108 112 967 896<br />
*(incl. VAT)<br />
Kesko Agro financial highlights, continuing operations<br />
<strong>2007</strong> 2006<br />
Net sales € million 793 755<br />
Operating profit € million 12.9 9.2<br />
Operating profit as % of net sales % 1.6 1.2<br />
Operating profit excl. non-recurring items € million 12.4 7.8<br />
Operating profit as % of net sales<br />
excl. non-recurring items % 1.6 1.0<br />
Depreciation € million 4.3 3.9<br />
Investments<br />
Return on net assets excl. non-recurring<br />
€ million 7.6 11.8<br />
items* % 9.4 6.0<br />
Personnel average<br />
* cumulative average<br />
797 885<br />
Net sales <strong>2007</strong>, continuing operations<br />
€ million change, %<br />
Kesko Agro ltd 507 5.2<br />
Kesko Agro Eesti AS 80 5.8<br />
SIA Kesko Agro latvija 131 27.5<br />
uAB Kesko Agro lietuva 75 -24.5<br />
Kesko Agro total 793 5.1<br />
Net sales at 31 December, € million<br />
<strong>2007</strong> 2006<br />
Non-current assets 41 36<br />
Inventories 136 109<br />
Short-term receivables 69 83<br />
./. Non-interest-bearing debt -122 -113<br />
./. Provisions -1 -1<br />
Net assets* 123 114<br />
* Net assets at the end of month
30<br />
<strong>Kesko's</strong> <strong>year</strong> <strong>2007</strong><br />
the most relevant things in<br />
Esa’s and Niko’s<br />
choice were<br />
good<br />
handling<br />
well-known<br />
brands<br />
the upcoming<br />
fishing trips<br />
a new<br />
summer cottage
Year <strong>2007</strong><br />
Other operating<br />
activities<br />
Other business operations include<br />
Konekesko, Intersport Finland, Indoor,<br />
Musta Pörssi, Kenkäkesko, Tähti Optikko<br />
and Kauko-Telko.<br />
Divisions The Group Financial statements Further information 31<br />
Konekesko<br />
Konekesko is a service company specialising<br />
in the import and sales of earthwork, environmental<br />
machinery, trucks and buses, and recreational<br />
machinery. Konekesko also sells forest<br />
machinery in the Baltic countries.<br />
Konekesko arranges the manufacture of and<br />
sells Yamarin boats in Finland and exports<br />
them to the Nordic and several other European<br />
countries, including Russia.<br />
Market<br />
Konekesko’s sales of recreational machinery<br />
are based on over 40 <strong>year</strong>s of close cooperation<br />
with Yamaha Motor Co. Quality-conscious<br />
consumers are served by the nationwide<br />
Yamaha dealer network. The Finnish<br />
market for recreational machinery totals<br />
about €0.4 billion.<br />
Export sales of Konekesko’s own range of<br />
Yamarin boats account for about 76% of total<br />
sales. In Finland, Yamarin is the market<br />
leader of glass-reinforced plastic boats.<br />
Yamaha outboard motors have been market<br />
leaders for as many as 30 <strong>year</strong>s, and their<br />
market share was 33.8% in <strong>2007</strong>. Market<br />
shares of Yamaha motorcycles, mopeds, ATVs<br />
and snowmobiles vary between 6–20%<br />
depending on the size category.<br />
Earthwork and environmental machinery<br />
and MAN trucks and buses are marketed<br />
through Konekesko’s own sales organisation.<br />
The Finnish market for earthwork and environmental<br />
machinery totals approximately<br />
€0.4 billion and for trucks (weight class of<br />
over 6 tons) about €0.7 billion. The most<br />
important customers in this market include<br />
transportation and service sector companies,<br />
towns and municipalities, and industrial and<br />
service entrepreneurs.<br />
Strengths<br />
Konekesko offers its customers the leading<br />
brands and is responsible for their marketing<br />
and sales throughout the marketing area.<br />
Konekesko also offers after-sales services to<br />
its customers either through its own or a contract<br />
service network.<br />
Konekesko’s strengths include its comprehensive<br />
products and services, skilled network,<br />
efficient operating methods, and competent<br />
and service-oriented staff. The goal is<br />
to reach a sales growth exceeding that of the<br />
market in selected business areas.<br />
Year <strong>2007</strong><br />
In <strong>2007</strong>, Konekesko’s net sales increased by<br />
14.3% to €229.3 million. Net sales from export<br />
operations were €35.8 million and accounted<br />
for 15.6% of the total net sales.<br />
Investments in <strong>2007</strong> totalled €1.1 million,<br />
most of them in boat moulds.<br />
The dealer network for recreational<br />
machinery was reorganised and strengthened.<br />
The new Yamarin models for the <strong>2007</strong><br />
boating season were well received by customers.<br />
Exports of Yamarin boats increased particularly<br />
in countries outside the Nordic area,<br />
such as the UK, Russia and Italy.<br />
The growth targets set for market shares<br />
in the earthwork and environmental machinery,<br />
as well as in the MAN business, were<br />
achieved.<br />
Outlook<br />
In 2008, the market for product lines represented<br />
by Konekesko in Finland is estimated<br />
to remain at the level of the previous <strong>year</strong>.<br />
With respect to the recreational machinery<br />
sector, it is estimated that boat exports and<br />
ATV sales will increase.<br />
Sports trade<br />
Intersport Finland<br />
Intersport Finland’s retail store chains in Finland<br />
are Intersport, Budget Sport and Kesport.<br />
Intersport Finland is responsible for the<br />
marketing, sourcing and logistics services,<br />
store network and retailer resources of the<br />
chains.<br />
The Intersport chain is the market leader<br />
in the Finnish sports retailing. Intersport’s<br />
customers are quality-conscious consumers<br />
who actively engage in sport and physical<br />
exercise and who value good service. Intersport<br />
stores are located in downtown areas<br />
and shopping centres. Their strengths include<br />
the chain’s high reliability and recognition<br />
among customers, wide and diversified selections,<br />
and its expert and service-minded staff,<br />
whose sales and service competence is systematically<br />
enhanced.<br />
The Kesport stores are located in smaller<br />
rural centres and are the leading sports stores<br />
in their areas.<br />
Budget Sport is a new sports store format<br />
of Intersport International Corporation.<br />
Based on cost-effective operations and low<br />
prices, it offers the sector’s largest selections
32<br />
<strong>Kesko's</strong> <strong>year</strong> <strong>2007</strong><br />
expert service<br />
in Intersport<br />
Anne’s<br />
choice was influenced by<br />
top brands<br />
the upcoming<br />
marathon<br />
a broad<br />
selection
Year <strong>2007</strong><br />
Divisions The Group Financial statements Further information 33<br />
in outdoor activity-related product groups.<br />
Budget Sport’s customers are interested in<br />
outdoor activities and value low prices and<br />
ease of purchasing.<br />
There are 56 Intersport stores, 39 Kesport<br />
stores and two Budget Sport stores in Finland,<br />
of which 90 are owned by retailer entrepreneurs<br />
and seven by Intersport Finland.<br />
Market<br />
The sports trade market in Finland is growing<br />
at the rate of 3–4% per <strong>year</strong>. People’s interest<br />
in their own health and wellbeing has<br />
increased, which is reflected in the sales<br />
growth of special sports and fitness equipment,<br />
for example.<br />
The main competitors of the Intersport<br />
Finland chains include Sportia, Top Sport,<br />
Stadium, department stores and hypermarkets,<br />
and other speciality stores.<br />
Year <strong>2007</strong><br />
The net sales of Intersport Finland were €147<br />
million in <strong>2007</strong>, representing an increase of<br />
3.4%. The combined retail sales of the company’s<br />
store formats were €274.1 million, up by<br />
6.7%.<br />
In <strong>2007</strong>, an Intersport megastore was<br />
opened in the centre of Turku and the second<br />
Intersport was opened in Lappeenranta.<br />
The second outlet in the Budget Sport<br />
chain was opened in the Ideapark shopping<br />
centre in Lempäälä in April.<br />
Objectives and outlook<br />
Stable growth will continue in the sports market.<br />
Foreign rivals and increased price competition<br />
will tighten competition in the sector.<br />
The chains of Intersport Finland aim at<br />
growth exceeding the market average. This<br />
will be achieved by enhancing the staff’s sales<br />
and service competence and improving the<br />
store concepts.<br />
The next Budget Sport stores will be<br />
opened in Espoo and Raisio in spring 2008.<br />
Intersport Finland is also making preparations<br />
to open sports stores in the Baltic<br />
countries.<br />
Furniture and interior<br />
decoration trade<br />
Indoor Group<br />
Indoor Group is a furniture and interior decoration<br />
retailer which operates through the<br />
Asko and Sotka store chains in Finland and<br />
the Baltic countries. Asko and Sotka together<br />
have 85 stores in Finland, six in Latvia, five in<br />
Estonia and two in Sweden. In Finland, 51 of<br />
the stores are owned by Asko, while 34 operate<br />
as a franchise. Asko serves quality- and<br />
brand-conscious home decorators with up-todate<br />
and competitive product ranges that<br />
cover all interior decoration needs. Sotka<br />
offers the sector’s most competitive furniture,<br />
in terms of its price-quality ratio, to customers<br />
who value low prices.<br />
Market<br />
There continued to be strong interest in<br />
home furnishing in <strong>2007</strong>. Consumers spent<br />
an increasing amount of money on home<br />
comfort, focusing on both entertainment electronics<br />
and interior decoration. The sizable<br />
investments of many chains in their store networks<br />
further intensified competition. The<br />
Finnish furniture market grew to nearly €1.3<br />
billion. Despite the keener competition, the<br />
Asko and Sotka chains maintained their position<br />
as Finnish market leader and increased<br />
their position in the Baltic countries.<br />
Year <strong>2007</strong><br />
Indoor Group’s net sales totalled €196.5 million<br />
in <strong>2007</strong>. The retail sales of the Asko and<br />
Sotka chains in Finland were €211.5 million.<br />
Indoor Group expanded its store network vigorously<br />
in <strong>2007</strong>. New Asko and Sotka stores<br />
were opened in Kemi, Joensuu, Kajaani,<br />
Hyvinkää, Lahti and Vantaa. A new Sotka<br />
store was opened in Huittinen and a new Asko<br />
store in Rovaniemi. In Latvia, the third Asko<br />
and Sotka stores were opened in Riga.<br />
Indoor Group continued to focus on customer<br />
service in its chains by improving the<br />
reliability of its deliveries and the service<br />
skills of its staff.<br />
Objectives and outlook<br />
It is estimated that high interest in home furnishing<br />
and decoration will continue. Competition<br />
in the furniture sector will be intense<br />
and, consequently, it will be increasingly<br />
challenging to meet customer expectations.<br />
Indoor Group will continue to differentiate its
34<br />
<strong>Kesko's</strong> <strong>year</strong> <strong>2007</strong><br />
Other operating<br />
Other operating activities<br />
activities Number<br />
<strong>2007</strong><br />
Number<br />
2006<br />
Sales*, € million<br />
<strong>2007</strong><br />
Sales*, € million<br />
2006<br />
Kesko’s machinery stores<br />
Yamaha Center 1 1 17 20<br />
Finland total<br />
K-Group’s speciality goods<br />
stores<br />
1 1 17 20<br />
Intersport 58 60 245 231<br />
Kesport 39 37 29 27<br />
Asko 32 31 95 93<br />
Sotka 53 53 117 114<br />
Musta Pörssi 55 57 203 184<br />
Andiamo and K-kenkä 49 52 46 49<br />
Kenkäexpertti 42 44 13 14<br />
Tähti Optikko 131 130 48 48<br />
Finland total<br />
Furniture stores Sweden,<br />
459 464 795 758<br />
Estonia, latvia 13 12 47 34<br />
Other countries total 13 12 47 34<br />
Speciality goods stores total<br />
Other operating activities<br />
472 476 842 792<br />
total<br />
*(incl. VAT)<br />
473 477 860 812<br />
Financial highlights, continuing operations<br />
<strong>2007</strong> 2006<br />
Net sales € million 997 946<br />
Operating profit € million 21.2 4.9<br />
Operating profit as % of net sales % 2.1 0.5<br />
Operating profit excl. non-recurring items € million 24.0 21.6<br />
Operating profit as % of net sales excl.<br />
non-recurring items % 2.4 2.3<br />
Depreciation € million 11.7 8.6<br />
Investments € million 14.6 35.6<br />
Return on net assets excl. non-recurring<br />
items* % 11.0 9.5<br />
Personnel average<br />
* cumulative average<br />
2,233 2,135<br />
Net sales <strong>2007</strong>, continuing operations<br />
€ million change, %<br />
Konekesko 229 14.3<br />
Intersport 147 3.4<br />
Indoor 197 7.9<br />
Musta Pörssi 148 11.8<br />
Kenkäkesko 23 -3.4<br />
Tähti Optikko 21 7.3<br />
Kauko-Telko 234 -5.7<br />
Total 997 5.4<br />
Net assets at 31 December, € million<br />
<strong>2007</strong> 2006<br />
Non-current assets 164 171<br />
Inventories 138 124<br />
Short-term receivables 136 144<br />
./. Non-interest-bearing debt -201 -192<br />
./. Provisions -2 -2<br />
Net assets* 235 244<br />
* Net assets at the end of month
Year <strong>2007</strong><br />
Divisions The Group Financial statements Further information 35<br />
chain concepts for the needs of various customer<br />
groups by further enhancing the Asko<br />
brand. Indoor Group will divest its operations<br />
in Sweden by summer 2008. The focal points<br />
in 2008 will also include improvements in<br />
cost-efficiency and further improving the<br />
accuracy of deliveries.<br />
home technology trade<br />
Musta Pörssi<br />
The Musta Pörssi chain offers its customers<br />
home technology products to make housework<br />
easier, enhance communications and<br />
provide entertainment. In addition, Musta<br />
Pörssi offers a comprehensive range of product-related<br />
services. The chain consists of 55<br />
stores specialising in home technology, of<br />
which 46 are owned by retailer entrepreneurs<br />
and nine by Musta Pörssi Oy.<br />
Market<br />
The Finnish total market for home technology<br />
products is about €2.1 billion. The market continued<br />
to grow as Finnish households moved<br />
into the era of digital TV broadcasts. Sales of<br />
flat screen TVs and digital adapters in particular<br />
grew strongly.<br />
Year <strong>2007</strong><br />
The net sales of Musta Pörssi Oy were €147.5<br />
million, representing an increase of 11.8%.<br />
The retail sales of the Musta Pörssi chain<br />
were €203 million and, an increase of 10.1%<br />
over the previous <strong>year</strong>. The growth of the<br />
Musta Pörssi chain exceeded that of the total<br />
market.<br />
Objectives and outlook<br />
The increase in consumers’ purchasing power<br />
and their interest in home technology products<br />
will continue to keep demand high.<br />
Rapid technological development will<br />
decrease the prices of products. In spite of<br />
this, in terms of euros the demand for home<br />
technology products is estimated to increase<br />
more than the average consumer demand.<br />
The Musta Pörssi chain aims to achieve<br />
sales growth exceeding that of the sector.<br />
This will be achieved by offering customers<br />
the best service package at a competitive<br />
price. The package consists of good customer<br />
service and availability of products. Besides<br />
home technology products, Musta Pörssi<br />
offers customers diversified installation services<br />
and user guidance.<br />
Shoe trade<br />
Kenkäkesko<br />
Kenkäkesko’s two chain store formats are<br />
K-kenkä and Andiamo. K-kenkä is a shoe<br />
store for the whole family, offering its customers<br />
a wide selection of branded footwear<br />
and expert service. Andiamo’s main target<br />
group is trendy and fashion-conscious shoppers,<br />
for whom the store offers a continuously<br />
renewing and fashionable selection of shoes.<br />
The K-Group’s speciality shoe outlets also<br />
include the Kenkäexpertti stores which operate<br />
in the smallest towns.<br />
Market<br />
The total retail market for shoes in Finland is<br />
approximately €540 million, of which<br />
Kenkäkesko’s store types account for about<br />
11%. Shoe retailing has become more of a multiple-channel<br />
business and the hypermarkets<br />
have taken the largest share of the market<br />
growth.<br />
Year <strong>2007</strong><br />
The net sales of Kenkäkesko were €23 million<br />
in <strong>2007</strong>, a decrease of 3.4% from the previous<br />
<strong>year</strong>. The sales of the Andiamo and K-kenkä<br />
stores decreased by 6.6%, and the combined<br />
sales of all of the K-Group’s speciality shoe<br />
stores amounted to €58.9 million.<br />
There were 30 K-kenkä, 19 Andiamo and<br />
42 Kenkäexpertti stores at the end of <strong>2007</strong>.<br />
Four of them are owned by Kenkäkesko and<br />
the others by retailer entrepreneurs.<br />
Objectives and outlook<br />
The shoe market is anticipated to increase by<br />
3–4% in 2008. Specialist shoe retailing will<br />
have an increasing number of distribution<br />
channels and will continue to concentrate on<br />
downtown areas and shopping centres.<br />
The K-kenkä and Andiamo stores aim to<br />
exceed the average sales growth in the sector,<br />
and to achieve this by increasing the store<br />
network and offering customers comprehensive<br />
selections of footwear with a competitive<br />
price/quality ratio. The operational priorities<br />
also include enhancing staff skills throughout<br />
the whole chain, in particular retail sales<br />
and service competence, and improving the<br />
cost-efficiency of the operations chain.
36<br />
<strong>Kesko's</strong> <strong>year</strong> <strong>2007</strong><br />
Optical trade<br />
Tähti Optikko Group<br />
Tähti Optikko is a chain of speciality stores in<br />
the optical trade. The chain consists of 131<br />
stores, of which 99 are owned by retailerentrepreneurs<br />
and 32 by Tähti Optikko Group.<br />
Market<br />
Retail sales in the Finnish optical trade<br />
totalled some €282 million in <strong>2007</strong>, an<br />
increase of 3.3%. According to our estimates,<br />
the total retail sales of optical goods valued at<br />
approximately €255 million. Based on this,<br />
the market share of the Tähti Optikko chain<br />
was about 16%.<br />
Year <strong>2007</strong><br />
The net sales of Tähti Optikko Group<br />
amounted to €20.8 million in <strong>2007</strong>, representing<br />
an increase of 7.3%. The retail sales of the<br />
Tähti Optikko chain totalled €48.2 million, a<br />
growth of 0.6%.<br />
New stores were established in Helsinki,<br />
Kerava and Mikkeli. The outlet in downtown<br />
Jyväskylä moved into larger premises and the<br />
operations of two outlets were combined in<br />
Helsinki.<br />
Objectives and outlook<br />
The objective of the Tähti Optikko chain is to<br />
grow faster than the sector average.<br />
The Tähti Optikko chain will increasingly<br />
focus on a reliable and safe product range,<br />
quality of service, individuality and delivery<br />
speed. Special attention will be paid to clear<br />
pricing by highlighting different price groups<br />
ranging from simple basic products to hightech<br />
solutions. This will make it easy for the<br />
customer to decide which price range to<br />
choose. The ageing of baby-boomers increases<br />
the demand for multifocal lenses and consumers’<br />
various hobbies place increasing<br />
requirements on sports spectacles. In addition,<br />
faster changes in trends and increased<br />
use of different technical display units contribute<br />
positively to the total demand in the<br />
sector.<br />
The number of store sites in the Tähti<br />
Optikko chain will be boosted through new<br />
establishments and by increasing the number<br />
of retailer-entrepreneurs.<br />
Kauko-Telko<br />
Kauko-Telko specialises in international technical<br />
trading. Kauko-Telko’s principal market<br />
areas include the Nordic countries, Russia,<br />
the Baltic countries, Poland and China.<br />
The most important customer groups are<br />
the manufacturing industry, public and private<br />
utilities, and corporations.<br />
The most important products include raw<br />
materials for the manufacturing industry,<br />
machines and equipment, packaging technology,<br />
electronics, and system and concept<br />
solutions.<br />
Year <strong>2007</strong><br />
Kauko-Telko’s net sales amounted to €234<br />
million in <strong>2007</strong>, representing a decrease of<br />
6%, which can be attributed to the structural<br />
changes implemented according to plan.<br />
Kauko-Telko’s continuing business activities<br />
increased particularly in Russia. Two relatively<br />
small company acquisitions, supporting<br />
the strategy, were implemented in the<br />
Nordic countries. The company’s profitability<br />
improved.<br />
In May <strong>2007</strong>, Kesko announced that it<br />
would look into opportunities to sell Kauko-<br />
Telko.
Year <strong>2007</strong><br />
Divisions The Group Financial statements Further information 37<br />
Marko and Saara<br />
friendly<br />
service<br />
durable<br />
materials<br />
in Asko<br />
were pleased with<br />
reliable delivery<br />
soft<br />
sofas
38<br />
<strong>Kesko's</strong> <strong>year</strong> <strong>2007</strong><br />
The Group<br />
Values<br />
Kesko’s values guide our operations:<br />
We exceed our<br />
customers’<br />
expectations<br />
We recognise our customers’<br />
needs and expectations. We strive<br />
to offer them positive experiences<br />
through the continual reform of<br />
our operations and emphasis on<br />
entrepreneurial activity.<br />
The most<br />
satisfied customers<br />
– growing<br />
customer value<br />
We are the best<br />
operator in the<br />
trading seetor<br />
Values<br />
We offer our customers the<br />
best products and services in<br />
the market to ensure our competitiveness<br />
and success.<br />
Goals<br />
We create a<br />
good working<br />
community<br />
We operate in an open, interactive<br />
working community where<br />
people are respected and every<br />
individual can contribute to<br />
the full and use his or her<br />
initiative.<br />
We bear our<br />
corporate<br />
responsibility<br />
Our operations are<br />
responsible and we follow ethically<br />
acceptable principles in<br />
all actions within our<br />
working community and in<br />
relations with our partners.<br />
Goals<br />
The goals of the Group guide the setting of the divisions’ and chains’ goals and objectives and the implementation of strategies.<br />
●●Exceeding customer<br />
expectations<br />
●●The best in industry – leadership<br />
in selected markets<br />
Excellent<br />
practices, stores<br />
and services<br />
●●The best practices and<br />
performance in the trading<br />
sector<br />
●●High corporate<br />
responsibility<br />
●<br />
Vision<br />
Kesko is the leading provider of trading sector<br />
services and a highly valued listed company.<br />
Competent<br />
and motivated<br />
people<br />
●●Management by values<br />
●●Systematic development of<br />
competencies<br />
Good<br />
performance –<br />
increasing shareholder<br />
value<br />
●●Return on equity 14%<br />
●●Return on invested capital 16%<br />
●●Growth in Finland in excess of<br />
market growth<br />
●●Proportion of international<br />
operations on the increase
Year <strong>2007</strong><br />
high<br />
quality<br />
Divisions The Group Financial statements Further information 39<br />
Jelena<br />
the trustworthy<br />
store<br />
the best<br />
selection<br />
went to K-rauta<br />
and her decisions<br />
were influenced by<br />
a well set out<br />
store
40<br />
<strong>Kesko's</strong> <strong>year</strong> <strong>2007</strong><br />
Strategic<br />
emphases<br />
BUSINESS<br />
Kesko is a Finnish retail specialist which<br />
provides products and services valued by<br />
consumers in the Nordic and Baltic countries,<br />
Russia, and Belarus in close cooperation with<br />
retailer entrepreneurs and other partners.<br />
Kesko manages retail store chains, develops<br />
store concepts and business models, data<br />
management and logistics services. Kesko’s<br />
operations include food, building and home<br />
improvement, car, department store, home<br />
and speciality goods, agricultural and<br />
machinery trade.<br />
healthy, focused growth<br />
Increasing shareholder value<br />
by improving profit<br />
Kesko’s strategic objective is to strengthen<br />
shareholder value by focusing on increasing<br />
business divisions’ sales and market shares<br />
and improving profitability. The proportion of<br />
international business will be increased. The<br />
target return on invested capital is 16%, while<br />
the target return on equity is 14%. The key<br />
issue in increasing the shareholder value is<br />
achieving customer satisfaction exceeding<br />
that of competitors.<br />
Main divisions are expanding<br />
to high-growth markets<br />
In Kesko’s strategy, the emphasis in investment<br />
and internationalisation is above all on<br />
the food, and building and home improvement<br />
trade. Growth is achieved with considerable<br />
store site investments and business<br />
acquisitions supporting the growth strategy.<br />
Outside Finland, growth is sought particularly<br />
from the high-growth Russian and Baltic<br />
markets.<br />
Kesko’s strategic emphases<br />
healthy,<br />
focused<br />
growth<br />
● We increase the shareholder<br />
value by improving profit<br />
● We expand our main divisions<br />
to the high-growth markets<br />
● We increase our market share<br />
particularly in the domestic<br />
food trade<br />
● We expand our store network<br />
strongly in the food and<br />
building and home improvement<br />
trade<br />
Sales and<br />
services for<br />
consumer-<br />
customers<br />
● Our customer satisfaction<br />
exceeds that of<br />
competitors<br />
● Retailers’ local knowledge<br />
is our competitive<br />
asset<br />
● We leverage customer<br />
information efficiently<br />
● We develop electronic<br />
commerce and<br />
services<br />
The spearhead in Kesko’s growth and<br />
internationalisation process has been the<br />
building and home improvement trade, which<br />
is being expanded in accordance with the<br />
strategy by opening new store sites in Russia,<br />
the Nordic countries and the Baltic states. In<br />
addition to store site investments, business<br />
has also been grown through acquisitions.<br />
The Russian market in particular offers significant<br />
growth potential in the building and<br />
home improvement trade. In addition to St.<br />
Petersburg and Moscow, Rautakesko’s objective<br />
is to open new stores in other large Russian<br />
cities, too. Support for Rautakesko’s<br />
growth is provided by investments in the joint<br />
enterprise resource planning system and centrally<br />
directed logistics network and by leveraging<br />
economies of scale in sourcing and<br />
purchasing.<br />
Kesko Food’s objective is to expand business<br />
to Russia, and the Baltic market is also<br />
being investigated. Expansion to the Baltic<br />
countries in the sports trade is also being<br />
studied. Kesko will also strengthen its position<br />
in the Baltic machinery and furniture<br />
trade.<br />
Responsible<br />
and cost-effi-<br />
cient business<br />
models<br />
● Our operating practices are<br />
responsible<br />
● We combine retailer entrepreneurship<br />
and chain operations<br />
efficiently<br />
● We leverage our economies of<br />
scale to the benefit of customers<br />
● We guide business with efficient<br />
data management<br />
● We have the best practices and<br />
competence in the trading<br />
sector
Year <strong>2007</strong><br />
Divisions The Group Financial statements Further information 41<br />
Increasing market share particularly in<br />
domestic food trade<br />
Besides Kesko’s international growth, a key<br />
strategic objective is growing the market<br />
share in Finland on a long-term basis, particularly<br />
in the food trade. Large store site investments<br />
and improvement in customer satisfaction<br />
will contribute to this growth in market<br />
share. K-food stores aim to offer their customers<br />
the best food ideas and solutions at low<br />
prices. This is achieved with customer-driven,<br />
high-quality and diversified selections, individual<br />
service and competitive pricing.<br />
Sales and services<br />
to consumer-customers<br />
Customer satisfaction exceeding<br />
that of competitors<br />
Kesko’s strategic growth area is sales to consumer-customers.<br />
The target is customer satisfaction<br />
that exceeds that of competitors and<br />
sales growth. Success in the consumer-customer<br />
trade requires clear customer and<br />
brand promises and delivering these promises<br />
on every visit to the store. Customer<br />
promises are delivered with high-quality and<br />
competitively priced products, a comprehensive<br />
store network and good service.<br />
Kesko has dozens of successful product and<br />
chain brands. Extensive brand strategy work<br />
has been started to strengthen the position of<br />
these brands. A steering group, comprising<br />
Kesko people and outside memebers, has<br />
been established to steer this work.<br />
Creation of customer-driven selections<br />
and targeted marketing are supported by the<br />
K-Plussa customer loyalty system, whose<br />
reward and debit card features underwent a<br />
major reform in <strong>2007</strong>. The objective of the<br />
K-Plussa system is to offer considerable product<br />
and service benefits to customers, encouraging<br />
them to centralise their purchases in<br />
the K-Group.<br />
Customer-driven business models<br />
The business models applied in Kesko’s sales<br />
to consumer-customers are retailing through<br />
retailer entrepreneurs and own retailing.<br />
Kesko is also engaged in B-to-B sales.<br />
1) Retailer entrepreneurs’ retailing<br />
The principal business model in the Finnish<br />
market is the chain business model, in which<br />
independent K-retailers run retail stores in<br />
the chains managed by Kesko. In Finland, for<br />
example, all food and building and home<br />
improvement stores in the K-Group are run by<br />
retailer entrepreneurs. With its chain operations,<br />
Kesko provides a first-class setting for<br />
its retailer entrepreneurs to serve their customers<br />
as well as possible. The K-retailer<br />
entrepreneur is responsible for his or her<br />
store’s customer satisfaction, personnel and<br />
profitability of business. Good service, competence<br />
and knowledge of local circumstances<br />
provide a competitive edge.<br />
At the end of <strong>2007</strong>, Kesko had 1,285<br />
K-retailer entrepreneurs as partners and, in<br />
addition, about 250 other retailer partners in<br />
the Asko, Sotka, Tähti Optikko, Byggmakker<br />
and Senukai chains. Kesko’s sales to retailer<br />
partners accounted for 43% of Kesko’s net<br />
sales in <strong>2007</strong>.<br />
2) Kesko’s own retailing<br />
Kesko acts as a retailer in business operations<br />
where the competitive advantage is<br />
based on the centrally directed chain concept.<br />
Kesko’s own retail stores in Finland include<br />
the Anttila and Kodin Ykkönen department<br />
stores. In addition, Kesko is also responsible<br />
for retailing home and speciality goods in the<br />
K-citymarket chain. Kesko’s own retailing is<br />
the principal model used in expanding business<br />
operations outside Finland, where rapid<br />
growth and efficient risk management play<br />
key roles, particularly in the Baltic and Russian<br />
markets. In <strong>2007</strong> Kesko’s own retailing<br />
accounted for 31% of net sales.<br />
3) B-to-B sales<br />
Kesko is engaged in B-to-B sales particularly<br />
in those business operations that support<br />
consumer-customer sales. Typical business<br />
customers include building companies, VV-<br />
Auto dealers, agricultural entrepreneurs, the<br />
manufacturing industry, institutional kitchens<br />
and the public sector. In <strong>2007</strong> Kesko’s<br />
B-to-B sales accounted for 26% of net sales.<br />
Development of electronic commerce<br />
and services<br />
Electronic commerce is rapidly gaining<br />
ground in consumer-customer sales. Kesko’s<br />
strategic objective is to grow business and<br />
improve customer satisfaction through<br />
e-commerce and services. In order to achieve<br />
this objective, a project covering online customer<br />
communications has been started.<br />
Kesko holds a strong position in online busi-
42<br />
Suppliers and<br />
service<br />
providers<br />
<strong>Kesko's</strong> <strong>year</strong> <strong>2007</strong><br />
ness in home and speciality goods with the<br />
NetAnttila and Kodin1.com concepts. There is<br />
plenty of scope for expansion in e-commerce<br />
in other product lines, too.<br />
Responsible and cost-efficient<br />
business models<br />
Cost-efficient operations build price competitiveness<br />
and customer satisfaction in retailing.<br />
This is also a basic requirement for<br />
increasing Kesko’s profitability and shareholder<br />
value.<br />
Sustainable development and responsible<br />
operating practices<br />
The principles of sustainable development<br />
and responsible operating practices are highlighted<br />
in Kesko’s strategy. Consumer-customers<br />
require that the trading sector bear<br />
responsibility for products’ safety and healthiness,<br />
and for the environmental and social<br />
impact of business operations. Responsible<br />
operating practices are an integral part of<br />
Kesko in the value chain of trade<br />
Data<br />
management<br />
and<br />
logistics<br />
Data management<br />
Sourcing services<br />
logistics services<br />
Marketing and<br />
store support<br />
● Development of store<br />
concepts<br />
● Customer loyalty marketing<br />
and K-Plussa<br />
● Brand management<br />
● Store sites<br />
● Retailer resources<br />
● hR development<br />
● Other support services<br />
Kesko and its chains. The results of responsible<br />
operations are reported annually in Kesko’s<br />
Corporate Responsibility Report.<br />
Efficient combination of retailer<br />
entrepreneurship and chain operations<br />
and leveraging economies of scale<br />
Kesko’s strategic objectives include the combination<br />
of retailer entrepreneurship and efficient<br />
chain operations. Consequently cooperation<br />
between K-retailers and Kesko takes<br />
place in close chains. K-retailers are responsible<br />
for customer service, local selections and<br />
delivering the customer promise in their<br />
stores.<br />
Kesko’s efficient chain operations and<br />
joint processes provide support to retailers.<br />
Chain operations offer the retailer a joint<br />
business concept which includes, among<br />
other things, chain control and business management<br />
support related to chain selection,<br />
maximum pricing and marketing. The chains’<br />
joint, division-specific processes generate<br />
synergy benefits in purchasing, private labels,<br />
Customer<br />
service<br />
Retailing through retailer<br />
entrepreneurs<br />
●43% of Kesko’s net sales<br />
Own retailing<br />
●●31% of Kesko’s net sales<br />
B-to-B sales<br />
●●26% of Kesko’s net sales<br />
Information<br />
and cash<br />
flow<br />
Goods and<br />
services<br />
flow<br />
Consumer<br />
customers
Year <strong>2007</strong><br />
Divisions The Group Financial statements Further information 43<br />
logistics, information systems and acquisition<br />
of store sites.<br />
Kesko participates in international purchasing<br />
cooperation in various product lines,<br />
which increases purchasing volumes and efficiency.<br />
The most important joint organisations<br />
in which Kesko participates include<br />
AMS Sourcing B.V. in the grocery trade, Euro-<br />
Mat in the building and home improvement<br />
trade, Intersport International Corporation in<br />
the sports trade and Electronic Partner International<br />
in the home technology trade.<br />
Data management in guiding business<br />
Efficient data management has a key position<br />
in creating customer-driven selections, guiding<br />
the flow of merchandise efficiently, in targeted<br />
customer marketing and in steering<br />
international business. Kesko’s information<br />
systems are developed for the particular<br />
needs of each division, while also leveraging<br />
the Group-wide synergy benefits achieved<br />
through centralisation. When e-commerce<br />
continues to spread, the importance of data<br />
Financial objectives<br />
management will be emphasised further.<br />
The planning systems Kesko has chosen are<br />
largely based on the SAP enterprise resource<br />
planning system.<br />
Best retailing competence<br />
Developing the competence of personnel is<br />
a key factor in the K-Group’s competitiveness.<br />
Emphasis areas in HR development include<br />
competence in retailing and international<br />
trading, customer and service competence<br />
and development of management skills.<br />
K-instituutti, the K-Group’s training centre,<br />
specialises in the training of retail store staff,<br />
managers and retailers. In <strong>2007</strong>, a total of<br />
about 22,100 persons participated in the<br />
K-instituutti training programmes.<br />
Objective Target level Realised <strong>2007</strong><br />
Growth in net sales In Finland growth<br />
exceeding that of market<br />
Increasing proportion of<br />
international operations<br />
Realised: Kesko Food,<br />
VV-Auto, Konekesko,<br />
Intersport Finland,<br />
Musta Pörssi<br />
Growth 2.2% points<br />
(continuing operations)<br />
Return on equity 14% 16%<br />
excl. non-recurring<br />
items 12.7%<br />
Return on invested capital 16% 17%<br />
excl. non-recurring<br />
items 14.5%<br />
Interest-bearing net debt/<br />
EBITDA < 3 0.6<br />
Equity ratio 40–45% 48%<br />
Economic value added Internal indicator growing<br />
positive EVA Realised
44<br />
<strong>Kesko's</strong> <strong>year</strong> <strong>2007</strong><br />
Individual<br />
customer<br />
approach<br />
– K-Plussa<br />
The <strong>year</strong> <strong>2007</strong> was a time of reform for<br />
K-Plussa. Kesko and the K-retailers<br />
started a programme to thoroughly<br />
develop the K-Plussa customer loyalty<br />
system – the K-Plussa Supercard. The<br />
reform concerns a total of 3.5 million<br />
K-Plussa customers.<br />
The reform will increase and diversify the<br />
customers’ choice of cards and benefits, and<br />
many customers will need just one card for<br />
payments both at home and abroad. The first<br />
stage of the development programme started<br />
in May, which also marked the beginning of<br />
significant cooperation with the OP Bank<br />
Group.<br />
More interaction between<br />
the K-store and the customer<br />
Information is gathered from K-Group stores<br />
to further improve selections and services<br />
and to increase interaction between the<br />
K-store and the customer. The more the customer<br />
uses the services of the Plussa network,<br />
the more he or she gets benefits. There<br />
are nearly 3,000 shopping outlets, and we<br />
want to continue to actively increase the<br />
number of our best cooperation partners. The<br />
reform also increases the centralisation and<br />
loyalty benefits the K-Plussa customer<br />
gets from his or her regular<br />
K-store and other Plussa<br />
partners.<br />
Customer programmes<br />
for all chains<br />
With this reform, the chains<br />
of the K-Group, such as<br />
K-market, K-supermarket,<br />
K-citymarket, K-rauta, Anttila,<br />
Kodin Ykkönen, Intersport,<br />
Asko and Sotka will<br />
considerably increase the<br />
benefits they offer to K-Plussa customers<br />
in their own and joint customer loyalty<br />
programmes.<br />
Besides special offers, customers in the<br />
Ykkösasiakas programme of Kodin Ykkönen<br />
are offered a free van for their use when they<br />
buy furniture at Kodin Ykkönen, a discount<br />
for the assembly service, moving boxes<br />
against a returnable deposit, and several<br />
other services and benefits.<br />
K-Plussa’s joint benefits increased<br />
The diversified partnership with OP Bank<br />
Group, including cooperation concerning<br />
Pohjola Insurance Company, started at the<br />
beginning of May. Thanks to the partnership,<br />
OP-Visa and OP-Visa Electron cards with the<br />
K-Plussa feature, which can be used in a normal<br />
way as debit or charge cards, and the new<br />
Plussa MasterCard with no annual fee have<br />
become available to customers. Cooperation<br />
in the card sector expanded in November with<br />
the launch of the new Nordea Visa Electron<br />
with the Plussa feature.<br />
The reforms implemented made collecting<br />
Plussa benefits increasingly easy. K-Plussa’s<br />
loyal customers can also choose to deposit<br />
their K-Plussa points in their bank accounts.<br />
The reward level (up to 5%) remained<br />
unchanged.<br />
The Pirkka magazine that is distributed<br />
as a K-Plussa loyal customer benefit also<br />
underwent a reform in <strong>2007</strong>. The modernisation<br />
was well received, and according to the<br />
National Media Research KMT, Pirkka reinforced<br />
its position as the most widely read<br />
magazine in Finland in <strong>2007</strong>. The NiksiPirkka<br />
column, which has published Finnish<br />
tips and hints in the Pirkka magazine for<br />
33 <strong>year</strong>s, received significant recognition in<br />
April <strong>2007</strong>, when it was awarded the Media-<br />
KONSTA prize as a major promoter of invention<br />
and innovation.<br />
healthy living with the Plussa card<br />
At the beginning of <strong>2007</strong> Kesko started a<br />
campaign to promote physical exercise and<br />
healthy eating habits among children with<br />
the Young Finland Association, its cooperation<br />
partner of many <strong>year</strong>s. Every time a customer<br />
used a K-Plussa card in a K-Group<br />
store, 0.25 cents were donated to promote<br />
children’s healthy living. The total sum collected<br />
was €500,000, of which €250,000 was<br />
spent immediately to buy exercise equipment<br />
for schoolchildren to increase their physical<br />
activity during breaks.
Year <strong>2007</strong><br />
Divisions The Group Financial statements Further information 45<br />
Retailers also arranged presentations for<br />
their best Plussa customers, in which Dietician<br />
Hanna Partanen spoke about the importance<br />
of healthy eating habits in families with<br />
children. The presentation tour will continue<br />
in spring 2008.<br />
An agreement to extend the Nutritioncode<br />
service to other K-food stores as a free-ofcharge<br />
Plussa benefit during 2008 was<br />
signed in September. The service had been<br />
piloted in K-supermarkets for a <strong>year</strong> prior to<br />
this. The web service enables Plussa customers<br />
to monitor the quality of their food basket<br />
and receive practical advice on how to develop<br />
the nutrition of the whole household in a<br />
healthier direction.<br />
Making donations to charitable causes is<br />
also made easy for Plussa customers. They<br />
can choose to donate their Plussa points<br />
through the OmaPlussa site available at<br />
www.plussa.com to five different recipients:<br />
the Young Finland Association, UNICEF,<br />
WWF Finland, the Finnish War Veterans’ Federation,<br />
and the Cancer Society of Finland. If<br />
the donor does not want to define the recipient,<br />
the sum donated will be divided equally<br />
between all the above recipients.<br />
Individual customer benefits<br />
To enable us to develop the most rewarding<br />
benefit levels and customer programmes we<br />
need a sufficient amount of information<br />
about customer relationships and competence<br />
to analyse and make use of this information.<br />
Collecting and saving reliable customer<br />
information in sufficient quantity is of<br />
primary importance in customer relationship<br />
analysis. The purchases registered in the<br />
Plussa system cover consumers’ purchases<br />
from K-Group stores and Plussa partners.<br />
K-Plus Oy collects and analyses this information<br />
in the K-Group.<br />
Customers’ privacy protection is ensured<br />
when customer information is collected and<br />
made use of. K-Plus Oy processes customers’<br />
purchasing data on the sum total or product<br />
group level. Division parent companies can<br />
process anonymous receipt line level purchasing<br />
data in their analyses.<br />
Customer information in the Plussa system<br />
is household-specific. Utilising this database,<br />
K-Plus Oy produces services that are<br />
based on customer information and support<br />
business operations for the K-Group’s chains<br />
and stores and the partners belonging to the<br />
Plussa network. Key areas of customer information<br />
application include chain concepts,<br />
selection planning, marketing and customer<br />
relationship management. This expertise has<br />
a central role in the implementation of the<br />
chains’ customer programmes.<br />
The use of customer information is<br />
increasing continuously with respect to both<br />
addressed and unaddressed marketing material.<br />
The results obtained from targeting have<br />
been very good at both store and chain levels.<br />
Direct marketing campaigns have also gained<br />
official recognition, of which one example is<br />
the second prize in the Huippusuora <strong>2007</strong><br />
competition organised by the Finnish Direct<br />
Marketing Association in May.<br />
New analysis tools have contributed to the<br />
good results achieved. A good example of this<br />
is the classification of eating habit information<br />
which allows the identification of customer<br />
groups which value health aspects or<br />
traditions and the establishment of a centralised<br />
approach to them.<br />
At the end of <strong>2007</strong>, 3.5 million Finns in 1.9<br />
million households had a K-Plussa card which<br />
is accepted by nearly 3,000 stores and other<br />
operators. The K-Plussa customer loyalty programme<br />
won nearly 160,000 new customers.
46<br />
<strong>Kesko's</strong> <strong>year</strong> <strong>2007</strong><br />
Real estate<br />
operations<br />
A store site is a strategic competitive<br />
factor for Kesko. Store sites provide<br />
opportunities for developing business<br />
operations and increasing sales and<br />
market share.<br />
Each of Kesko’s division parent companies is<br />
responsible for its own store sites across their<br />
life cycles. The companies plan their own<br />
retail networks and, on the basis of their network<br />
and business plans, make the investments<br />
in accordance with the Group’s real<br />
estate strategy. The division parent companies<br />
develop their own store sites, manage<br />
their construction, and are responsible for<br />
maintaining, managing, leasing and selling<br />
them.<br />
Real estate property management<br />
For the management of Kesko’s real estate<br />
assets and liabilities, the retail stores and<br />
other real estate properties are classified as<br />
follows:<br />
●●<br />
●●<br />
●●<br />
●●<br />
Strategic properties are large retail stores<br />
which Kesko prefers to own.<br />
Standard properties are premises owned<br />
by the Group. They can be sold and leased<br />
back for use in the Group’s business<br />
operations.<br />
Realisation properties are those for which<br />
the business has no further use.<br />
Development properties are those needing<br />
further development for their intended<br />
use.<br />
Investments<br />
Kesko’s real estate investments aim to enable<br />
the creation of trading services valued by customers<br />
by anticipating changes in customer<br />
behaviour and the operating environment<br />
and by maintaining the technical condition of<br />
properties.<br />
Kesko invests only in properties needed in<br />
its own business operations. As a result of<br />
Kesko’s internationalisation, investments<br />
outside Finland have become increasingly<br />
important. In Finland, the focus of investments<br />
is changing from new construction to<br />
rebuilding and expansion.<br />
Life cycle affordable and eco-efficient real<br />
estate operations<br />
Kesko’s construction activity is based on life<br />
cycle affordability and eco-efficiency. This<br />
means optimising the costs and decreasing<br />
the environmental burden across the entire<br />
life cycle of a store site. The aim is to build<br />
business premises with the lowest life cycle<br />
costs in the trading sector.<br />
Further development of the eco-efficiency<br />
of existing properties is focused on monitoring<br />
energy consumption and improving<br />
energy use. The aim is to reduce both consumption<br />
and costs.<br />
Kesko has received much recognition for<br />
environmentally responsible construction.<br />
Property maintenance<br />
Maintenance relies on systematisation and<br />
proactivity. Repair work is scheduled to coincide<br />
with the rebuilding necessitated by business<br />
operations.<br />
The management and maintenance of<br />
properties owned or leased by Kesko has been<br />
outsourced to YIT Kiinteistötekniikka Oy and<br />
Ovenia Oy, which carry out the work in<br />
accordance with Kesko’s requirements.<br />
Kestra Real Estate Services Oy, owned by<br />
Kesko, is responsible for purchasing electricity<br />
for the Group.<br />
Kesko participates in<br />
the Fennovoima project<br />
The maintenance and development of the<br />
retail service structure necessitate that<br />
energy production is ensured. A considerable<br />
amount of new basic generation capacity is<br />
needed in Finland by the <strong>year</strong> 2020. For its<br />
part, Kesko wants to support the total solution<br />
which directs production to the carbon<br />
dioxide free sector, reduces Finland’s dependency<br />
on imported energy and improves the<br />
operation of the electricity market.<br />
Kesko participates in the preliminary survey<br />
stage of the Fennovoima project together<br />
with dozens of local energy companies, and<br />
industrial and service enterprises.
Year <strong>2007</strong><br />
Real estate<br />
operations<br />
indicators<br />
for <strong>2007</strong><br />
●●1. Strategic properties 76%<br />
●●2. Standard properties 18%<br />
●●3. Realisation properties 0%<br />
●●4. Development properties 6%<br />
Divisions The Group Financial statements Further information 47<br />
Owned properties<br />
Capital, € million <strong>2007</strong> 2006<br />
Finland 739 717<br />
Other Nordic countries 43 40<br />
Baltic countries 47 63<br />
Russia 26 26<br />
Total 855 846<br />
Area, m 2 <strong>2007</strong> 2006<br />
Finland 807,000 810,000<br />
Other Nordic countries 52,000 36,000<br />
Baltic countries 102,000 129,000<br />
Russia 20,000 20,000<br />
Total 981,000 995,000<br />
leased properties<br />
Lease liabilities, € million <strong>2007</strong> 2006<br />
Finland 1,640 1,477<br />
Other Nordic countries 148 148<br />
Baltic countries 115 105<br />
Russia 40 7<br />
Total 1,943 1,737<br />
Area, m 2 <strong>2007</strong> 2006<br />
Finland 2,091,000 2,012,000<br />
Other Nordic countries 199,000 185,000<br />
Baltic countries 335,000 293,000<br />
Russia 26,000 18,000<br />
Total 2,651,000 2,508,000<br />
Breakdown of owned properties <strong>2007</strong> Breakdown of owned properties 2006<br />
2.<br />
3. 4.<br />
1.<br />
●●1. Strategic properties 72%<br />
●●2. Standard properties 23%<br />
●●3. Realisation properties 0%<br />
●●4. Development properties 5%<br />
2.<br />
3.4.<br />
1.
48<br />
<strong>Kesko's</strong> <strong>year</strong> <strong>2007</strong><br />
Kesko is a good<br />
workplace<br />
Kesko employees by gender, incl.<br />
operations outside Finland, %<br />
2.<br />
●●1. Men 45.6%<br />
●●2. Women 54.4%<br />
1.<br />
At the end of <strong>2007</strong>, the aggregate number of<br />
the Kesko Group personnel was 25,890, and<br />
converted into full-time employees with joint<br />
ventures included, the average total in <strong>2007</strong><br />
was 21,180. Of these, 11,338 worked in Finland<br />
and 9,842 in other countries. Kesko’s most<br />
international division is still Rautakesko,<br />
with 96% of its employees working abroad.<br />
Kesko and its chain stores employ nearly<br />
50,000 people in eight different countries.<br />
In <strong>2007</strong>, the basis of Kesko’s HR management<br />
was revised and the HR policy and HR<br />
principles were updated. The guide ’Our<br />
Responsible Working Principles’ was published.<br />
It contains two elements, namely the<br />
Code of Conduct and day-to-day responsibility.<br />
The manual implementation among personnel<br />
was begun at the end of the <strong>year</strong> and<br />
will be continued in 2008, complemented by<br />
e-learning material for the countries in which<br />
Kesko operates.<br />
Aiming to be the most attractive<br />
workplace in the trading sector<br />
Kesko and the K-stores offer motivating and<br />
rewarding jobs working with products and<br />
services valued by customers. Kesko is a good<br />
and responsible working community where<br />
employees are treated on an equal and fair<br />
basis.<br />
In <strong>2007</strong>, Kesko employed approximately<br />
12,000 new people, including operations outside<br />
Finland. 6,000 of them are permanent<br />
and the rest work on a fixed term or seasonal<br />
basis. Regional job induction days concentrating<br />
on customer service were arranged for the<br />
K-Group’s summer employees and were<br />
attended by over 200 people in all.<br />
In <strong>2007</strong>, some 1,500 people transferred<br />
internally to new jobs, including operations<br />
outside Finland. Internal job rotation is<br />
encouraged to promote diversified career<br />
paths in the K-Group and various trading sector<br />
duties. The efficiency of the K-Group’s<br />
internal labour market coupled with the promotion<br />
of controlled job rotation will continue<br />
to be emphasized.<br />
Kesko’s first K-trainee recruitment and<br />
training programme was completed by 18<br />
young trading sector professionals ready to<br />
take on managerial and specialist duties. The<br />
recruitment of recently graduated university<br />
and polytechnic students for the next<br />
K-trainee programme began in September.<br />
There were more than 700 applicants of<br />
whom 18 were admitted to the next programme<br />
started in 2008.<br />
Kesko also ranked high in employer profile<br />
surveys in <strong>2007</strong>. Among commercial students,<br />
Kesko’s ranking in the list of ideal<br />
employers improved from 42nd to 23rd. The<br />
increase was even greater in the ranking by<br />
young professionals with a university degree,<br />
namely from 28th to 16th (Universum).<br />
The most competent and motivated<br />
people in the trading sector<br />
Kesko and the K-stores offer their employees<br />
competitive benefits and opportunities to<br />
develop their competencies in a target oriented<br />
manner. K-instituutti is the service<br />
centre for the K-Group’s competence development.<br />
In <strong>2007</strong>, its training programmes were<br />
attended by 22,100 people. Programmes relating<br />
to the reform of the K-Plussa customer<br />
loyalty system constituted the biggest single<br />
programme in terms of the number of participants,<br />
who totalled some 2,200 trading sector<br />
professionals.<br />
The responsibility for the implementation<br />
of the Master Sales Assistant training, which<br />
is Finland’s largest adult training programme,<br />
was transferred from the K-Retailers’<br />
Association to K-instituutti at the beginning<br />
of <strong>2007</strong>. The purpose was to increasingly<br />
integrate the Master Sales Assistant training<br />
in the staff development programmes. In<br />
<strong>2007</strong>, there were over 15,000 participants in<br />
12 different product lines. In addition, 6,000<br />
students participated in the Master Sales<br />
Assistant training in about one hundred business<br />
colleges and polytechnics.<br />
Customer and service competence was<br />
the focal area in competence development<br />
in every chain. For example, the Best Service<br />
sales training in the Anttila and Kodin<br />
Ykkönen department stores was attended<br />
by some 2,000 employees during the <strong>year</strong>.<br />
Management and leadership<br />
At Kesko, management is conducted in a<br />
responsible manner and in compliance with<br />
the corporate values. One of the key tools in<br />
efficient performance management and the<br />
motivating leadership of immediate superiors<br />
is the annual performance and development<br />
review whose implementation is included in<br />
the annual job satisfaction survey.
Year <strong>2007</strong><br />
Johanna<br />
was attracted to<br />
Kodin Ykkönen by<br />
career<br />
opportunities<br />
an interesting<br />
field<br />
Divisions The Group Financial statements Further information 49<br />
the desire<br />
to learn<br />
nice<br />
colleagues
50<br />
<strong>Kesko's</strong> <strong>year</strong> <strong>2007</strong><br />
A developing and motivating working community<br />
is a prerequisite for the wellbeing<br />
and excellent performance of employees. At<br />
Kesko, the development of the workplace is<br />
measured using a job satisfaction survey.<br />
The survey measures satisfaction with one’s<br />
own job, the superior’s performance, one’s<br />
own unit’s operations and Kesko’s operations<br />
in general. The response rate was 63.5%.<br />
Leadership skills and career progress are<br />
supported by Kesko’s own three-step superior<br />
and management training.<br />
In addition since 2004, Kesko has implemented<br />
a long-term development programme<br />
for the management and potential management.<br />
There are some 200 participants in the<br />
programme, whose purpose is to ensure adequate<br />
managerial resources both in terms of<br />
quality and quantity. The main themes of<br />
management training in <strong>2007</strong> included customer<br />
loyalty and responsible management.<br />
In August, the K-Group launched its first own<br />
K-retail eMBA programme in cooperation<br />
with the Helsinki University of Technology.<br />
The programme aims to train top experts in<br />
international retail management.<br />
For the best personnel<br />
productivity in the trading sector<br />
The importance of work productivity has<br />
increased. Good productivity relies on efficient<br />
and uniform business models determined<br />
specifically for each chain, supporting<br />
information technology and personnel competence.<br />
The immediate supervisors’ good<br />
leadership ensures that every employee can<br />
work efficiently, knows his duties and targets,<br />
and is given feedback on his performance.<br />
hR strategy goals and critical success factors<br />
of hR management at Kesko and its stores<br />
the best<br />
personnel<br />
productivity<br />
● Kesko’s and the stores’ good reputation<br />
as employers<br />
● Responsible and value-guided<br />
management<br />
● Efficient performance leadership and<br />
motivating immediate superiors<br />
● Competitive salary and benefits<br />
In the trading sector<br />
the most<br />
competent and<br />
motivated<br />
personnel<br />
Kesko’s Occupational Health unit focuses<br />
on operations that maintain work capacity<br />
and promote the wellbeing of the working<br />
community. In Finland, 35–45% of the aggregate<br />
costs of occupational health are allocated<br />
to these activities. Long-term projects<br />
focusing on wellbeing at the workplace are<br />
being implemented by several companies. The<br />
aim is to increase work productivity by reducing<br />
sickness absences and raising retirement<br />
age.<br />
Work productivity is also raised through<br />
different working time systems, which are<br />
being increasingly adopted.<br />
The Kesko Staff Club encourages and supports<br />
the personnel’s hobby and recreational<br />
activities.<br />
In <strong>2007</strong>, all of the Kesko Group companies<br />
in Finland adopted the SAP HR Master main<br />
system for personnel data management. The<br />
system is planned for adoption abroad and in<br />
retail stores in the next few <strong>year</strong>s.<br />
The work and productivity programme<br />
launched in <strong>2007</strong> defines the most important<br />
HR goals and actions for the new strategy<br />
period.<br />
Information about the personnel can also<br />
be found in the Corporate Responsibility<br />
Report for <strong>2007</strong>, which will be published in<br />
spring 2008.<br />
the most<br />
attractive<br />
workplace<br />
● Competence management and diverse<br />
development of competencies in<br />
the whole chain<br />
● Service centre of competence<br />
development supporting business<br />
operations<br />
● Capable and committed key persons
Year <strong>2007</strong><br />
Competitive<br />
advantage from<br />
chain operations<br />
and K-retailer<br />
entrepreneurship<br />
The principal business model in the Finnish<br />
market is the chain business model, in which<br />
independent K-retailers run retail stores in<br />
the chains managed by Kesko. At the end of<br />
<strong>2007</strong>, Kesko had 1,285 K-retailer entrepreneurs<br />
as partners, as well as 250 other<br />
retailer partners.<br />
Cooperation between K-retailers and<br />
Kesko – chain operations – is based on the<br />
equality of both parties, voluntary participation,<br />
willingness to develop joint operations<br />
and on open cooperation. The objective is<br />
improving competitiveness and performance,<br />
increasing uniform quality and lowering<br />
costs. The obligations and rights of K-retail-<br />
Path to a K-food retailer career<br />
Divisions The Group Financial statements Further information 51<br />
ers and Kesko have been specified in the<br />
chain agreement.<br />
Competitive edge is gained by combining<br />
systematic chain operations and the<br />
K-retailer operations based on entrepreneurship.<br />
Kesko is responsible for the constant<br />
development of the business model and the<br />
store concepts, for chain operations management<br />
and for sourcing and purchasing of the<br />
products included in the chain selections. The<br />
K-retailer entrepreneur is responsible for his<br />
or her store’s customer satisfaction, personnel<br />
and profitability of business. The local<br />
implementation of chain operations and the<br />
management of people and operations by<br />
independent retailers in their stores create<br />
competitive edge.<br />
To ensure success, it is important that a<br />
new retailer’s professional and other skills<br />
are at as high level as possible at the start of<br />
his/her career.<br />
About 200 stores are affected by retailer<br />
changes annually in the K-Group. The annual<br />
need for new entrepreneurs, ready to start<br />
their K-retailer careers, is approximately 100.<br />
The K-Group systematically trains new<br />
retailers to ensure a sufficient supply of people<br />
with the appropriate professional skills.<br />
New candidates interested in a K-retailer<br />
Need Screening Assessment Selection<br />
50–100 novice<br />
retailers every<br />
<strong>year</strong><br />
K-retailer career<br />
Marketing<br />
● K-stores and Kesko<br />
● Manufacturing<br />
industry<br />
● Competitors<br />
● Entrepreneurs in<br />
different sectors<br />
● Educational<br />
institutes<br />
● Others<br />
● Attitude<br />
● Values<br />
● Experience/development<br />
areas<br />
● Suitability<br />
assessment<br />
K-retailer reserve<br />
● (personality, knowledge, skills)<br />
career are sought through different channels.<br />
There are about 500 contacts annually. The<br />
requirement for new retailers is estimated for<br />
1–3 <strong>year</strong>s ahead.<br />
Approximately 50% of those starting the<br />
K-retailer trainee programme have a fair<br />
amount of retailing experience, but in recent<br />
<strong>year</strong>s the number of students transferring<br />
from other fields or having just finished their<br />
general education has grown. When evaluating<br />
applicants for the K-retailer trainee programme,<br />
attention is paid to their development<br />
potential, values, work experience and<br />
education.<br />
After selection, would-be K-retailers start<br />
the trainee programme, which consists of<br />
three parts: practical training in a retail store<br />
under the guidance of a mentor, theoretical<br />
training at the K-instituutti training centre,<br />
and regional K-trainee seminars. The studies<br />
last 6–14 months depending on the participant’s<br />
education and previous experience.<br />
Approximately 100 K-retailer trainees complete<br />
the programme every <strong>year</strong>.<br />
After completion, the trainees are ready to<br />
start as independent K-retailer entrepreneurs.<br />
The K-Group gives its retailers strong background<br />
support and opportunities for further<br />
training and progress in their careers.<br />
● Key areas of selfdevelopment<br />
● Planning of a personal<br />
training<br />
programme<br />
● Apprenticeship<br />
contract<br />
K-retailer<br />
trainee<br />
programme<br />
● Food retailer training<br />
at K-instituutti<br />
● On-the-job retailer<br />
work training under<br />
mentor retailer<br />
● Regional training<br />
(theme days)<br />
● Further qualification in entrepreneurship
52<br />
<strong>Kesko's</strong> <strong>year</strong> <strong>2007</strong><br />
Corporate<br />
responsibility in<br />
Kesko<br />
Kesko’s corporate responsibility comprises<br />
good corporate governance, economic, social<br />
and environmental responsibility and the<br />
work carried out on behalf of product safety<br />
and consumer protection. Kesko’s corporate<br />
responsibility principles were approved by<br />
the Corporate Management Board in January<br />
<strong>2007</strong>. The K-Group’s revised environmental<br />
policy was approved at the same time. Both<br />
have been published at<br />
www.kesko.fi/responsibility.<br />
Corporate responsibility is an integral<br />
part of Kesko’s management system and<br />
implemented through normal daily activities<br />
in the line organisation. Bearing the main<br />
responsibility for development, coordination<br />
and performance reporting is the corporate<br />
responsibility team that operates within the<br />
Corporate Communications and Responsibility<br />
Unit. The team’s work is supported by a<br />
Corporate Responsibility Advisory Board,<br />
consisting of Kesko’s management, appointed<br />
by the Corporate Management Board. The<br />
duties of the Advisory Board include determining<br />
the responsibility strategy and the<br />
operating policies and systems needed for its<br />
implementation, and monitoring the implementation<br />
of objectives. An Environmental<br />
Steering Group is responsible for developing<br />
and coordinating of environmental issues in<br />
different countries. Kesko Food, the biggest<br />
division parent company, has established corresponding<br />
steering groups to manage<br />
responsibility work in its own organisation.<br />
One of the training programmes provided<br />
for Kesko’s current and potential managers in<br />
spring <strong>2007</strong> – ’Responsible Management’ programme<br />
– was designed to help participants<br />
recognise the importance of responsibility in<br />
day-to-day activities and profitable business<br />
and to integrate the indicators used in measuring<br />
different dimensions of responsibility<br />
with business performance indicators and<br />
scorecards. In the autumn, the training programme<br />
was also implemented at the HR,<br />
environmental and communications specialist<br />
levels, which raised the total number of<br />
participants to some 250.<br />
Kesko is an Organisational Stakeholder of<br />
the Global Reporting Initiative (GRI) and complies,<br />
in its corporate responsibility reporting,<br />
with the sustainability guidelines drawn up<br />
by the GRI. Kesko’s Board of Directors annually<br />
handles the Corporate Responsibility<br />
Report after it has been published. Kesko’s<br />
corporate responsibility reporting has been<br />
assured by an independent party since 2002.<br />
As in 2006, the <strong>2007</strong> report is assured by csr<br />
network, a UK-based CSR consultancy, and by<br />
PricewaterhouseCoopers Oy with respect to<br />
economic responsibility. The <strong>2007</strong> Corporate<br />
Responsibility Report will be published in<br />
April 2008.<br />
Top-of-the-world performance continues<br />
Kesko’s work for responsibility once again<br />
received recognition in many international<br />
comparisons evaluating companies’ responsibility.<br />
For the fifth time in succession, Kesko<br />
was included in the Dow Jones sustainability<br />
indexes, DJSI World and DJSI STOXX. Kesko’s<br />
work for the environment, in particular, was<br />
highly appreciated in the Dow Jones indexes.<br />
In January <strong>2007</strong> the World Economic Forum<br />
listed Kesko for the third time among the 100<br />
best companies in the world in sustainable<br />
development.<br />
Economic responsibility<br />
Good financial performance makes it easier<br />
to assume environmental and social responsibility<br />
and, conversely, environmental and<br />
social responsibility contribute to reducing<br />
costs and promoting job satisfaction. In the<br />
Corporate Responsibility Report, economic<br />
performance is viewed from the perspective<br />
of different stakeholders.<br />
Manufacturing industry<br />
an important partner<br />
Kesko’s operations produce economic benefit<br />
for many different parties. Kesko’s purchases<br />
from suppliers of products and services<br />
totalled about €8.1 billion in <strong>2007</strong>. Kesko had<br />
about 25,100 active suppliers (from which<br />
Kesko’s annual purchases exceed €1,000).<br />
Approximately 12,500 of these operate in<br />
Finland, accounting for 68% of the total purchases.<br />
Kesko’s investments totalled €233.9<br />
million, of which €177.5 million were spent in<br />
Finland. Breakdowns of economic benefits<br />
from Kesko’s operations in Finland by stakeholder<br />
group and region, and the breakdown<br />
of imports by country, are given in the Corporate<br />
Responsibility Report.<br />
In January-December, the average number<br />
of personnel in the Kesko Group was 21,180<br />
converted into full-time employees. There was<br />
a decrease of 2,587 employees compared with<br />
the corresponding period of the previous <strong>year</strong>.<br />
In Finland, the average decrease was 244<br />
employees and outside Finland 2,343. The<br />
number of personnel mainly decreased as
Year <strong>2007</strong><br />
Divisions The Group Financial statements Further information 53<br />
the things emphasized in<br />
Henri’s<br />
shopping bag were<br />
care for<br />
the environment<br />
product<br />
safety<br />
a good<br />
feeling<br />
a smooth running<br />
service
54<br />
<strong>Kesko's</strong> <strong>year</strong> <strong>2007</strong><br />
a result of the disposal of the joint venture<br />
Rimi Baltic in December 2006. At the end of<br />
December <strong>2007</strong>, the total number of personnel<br />
was 25,890, of whom 14,192 worked in Finland<br />
and 11,698 in other countries. Compared<br />
with the end of December 2006, there was an<br />
increase of 43 employees in Finland and 2,092<br />
in other countries. The total amount of salaries<br />
paid was €501.1 million.<br />
More information on the personnel is<br />
given on pages 48–50.<br />
Comprehensive store network for<br />
customers<br />
Together with the K-retailers, Kesko is responsible<br />
for a nationwide store network in Finland.<br />
Its services are complemented by a mail<br />
order business and e-commerce.<br />
At the end of <strong>2007</strong>, there was one K-food<br />
store fewer than the <strong>year</strong> before, i.e. 1,070<br />
store located in 367 of Finland’s 416 cities and<br />
municipalities. 118 new K-retailers started<br />
during the <strong>year</strong>.<br />
There were a total of 179 building and<br />
home improvement stores of the K-Group in<br />
Finland, 95 agricultural stores, 27 Anttila<br />
department stores and 460 speciality stores.<br />
In the Baltic countries, there were 26 building<br />
and home improvement stores, 13 agricultural<br />
stores and 11 furniture stores. In the other<br />
Nordic countries, there were 137 building and<br />
home improvement stores and 2 furniture<br />
stores. In Russia, there were 8 building and<br />
home improvement stores, of which three<br />
operate in conformity with the new K-rauta<br />
concept.<br />
Sales to the K-retailers accounted for<br />
nearly 43% of Kesko’s total sales. Kesko’s<br />
own retail stores accounted for 31% of the<br />
company’s total sales.<br />
Support for the public good<br />
Kesko and its subsidiaries gave financial support<br />
amounting to approximately €2.3 million<br />
to about one hundred organisations and institutions<br />
operating for the public good. The biggest<br />
individual campaign was implemented<br />
in cooperation with the Young Finland Association<br />
to promote physical activity at schools<br />
during breaks, for which purpose Kesko<br />
donated 2,600 exercise gear bags to schools.<br />
The donation was part of the ’Use your<br />
K-Plussa card to put children on the move’, in<br />
which €500,000 were collected to support<br />
physical exercise for children.<br />
Environmental responsibility<br />
The direct impact of Kesko and the K-stores<br />
on the environment includes emissions into<br />
the air from the generation of energy used by<br />
buildings and in transportation, and the<br />
waste generated in warehousing and by the<br />
stores. The indirect environmental impact<br />
arises from the manufacture, use and disposal<br />
of the products sold by Kesko, including<br />
their packaging.<br />
Environmental management<br />
All of Kesko’s operations that have a major<br />
impact on the environment continued to be<br />
certified by the ISO 14001 environmental system.<br />
The ISO 14001 certification of Keslog Ltd<br />
was revised during the <strong>year</strong>. VV-Autotalot Oy<br />
and Turun VV-Auto Oy received the certificates<br />
granted by the Finnish Central Organisation<br />
for Motor Trades and Repairs in October<br />
<strong>2007</strong>. The action plan fulfils the requirements<br />
of the ISO 14001 environmental<br />
system. ISO 14001 certification also covered<br />
Anttila Oy’s all operations. At the Anttila<br />
department store opened in Mikkeli in October,<br />
the building of the environmental system<br />
had not yet been completed by the end of the<br />
<strong>year</strong>. Business partners providing property<br />
construction, maintenance and waste management<br />
services for Kesko also have a corresponding<br />
system in place.<br />
At the end of the <strong>year</strong>, 382 K-food stores, 47<br />
K-rauta and Rautia stores and 23 K-maatalous<br />
stores fulfilled the requirements of the<br />
K-stores’ environmental management concept<br />
and qualified for the K-environmental store<br />
diploma. Those stores operating as a combination<br />
of both building and home improvement<br />
stores and agricultural stores are included in<br />
the statistics for K-rauta and Rautia stores.<br />
The K-instituutti training centre is responsible<br />
for environmental store training, while<br />
BVQI Finland audits the K-food stores. The<br />
concept helps stores improve the efficiency of<br />
their energy consumption and waste management,<br />
enhance their selection of environmentally<br />
sound products and encourage customers<br />
to make sustainable consumption choices.<br />
Energy<br />
Energy consumption in the office, warehouse<br />
and store properties managed by Kesko and<br />
the implementation of consumption targets<br />
is monitored in Finland by the EnerKey programme.<br />
Electricity consumption is monitored<br />
in 81% of properties, while 63% of properties<br />
are covered by multi-energy monitor-
Year <strong>2007</strong><br />
Divisions The Group Financial statements Further information 55<br />
ing. Most of these fall under the scope of<br />
remote terminal reading via the telephone<br />
network, which enables fast reaction to any<br />
deviations.<br />
In <strong>2007</strong>, the combined electricity consumption<br />
of Kesko and the K-stores operating<br />
in Kesko’s premises in Finland exceeded 746<br />
GWh. Consumption increased by 2%, while<br />
the total area of real estate increased by 3.6%.<br />
Specific consumption decreased in all the<br />
largest property types of Kesko Food. The<br />
total consumption of heat (291 GWh)<br />
remained at the level of the previous <strong>year</strong>.<br />
Kesko bought, on a centralised basis, 77% of<br />
the electricity used. In the generation of the<br />
electricity bought by Kesko, the proportion of<br />
fossil raw materials had decreased from<br />
2004, but rose in <strong>2007</strong> back to the level of the<br />
<strong>year</strong> 2004, increasing by 25% over the previous<br />
<strong>year</strong>. Fossil fuels and peat were used particularly<br />
in condensing power generation,<br />
which replaced some of the hydroelectric<br />
power and electricity imports.<br />
Kesko was covered by the real estate and<br />
construction sector energy saving agreement<br />
(KRESS), which terminated at the end of<br />
<strong>2007</strong>. In <strong>2007</strong>, the specific consumption of<br />
electricity in the properties included in the<br />
agreement increased by 1.2% and the specific<br />
consumption of water increased by 3.3%. The<br />
increase in the specific consumption of electricity<br />
can be attributed mainly to a new<br />
banana ripening plant. The specific consumption<br />
of heat dropped by as much as 5.1%, in<br />
which the K-citymarket’s decrease of 4.9%<br />
was significant.<br />
Transport<br />
In <strong>2007</strong>, Keslog’s transport reporting was<br />
expanded to cover distance distribution and<br />
trunk transportation. In addition, this reporting<br />
now covered all outsourced transportation<br />
rather than just refrigerated transportation<br />
by contract drivers (+2 operators), as had<br />
been the case in previous <strong>year</strong>s. Therefore the<br />
transport statistics are not comparable with<br />
those for previous <strong>year</strong>s. Of the 15.9 million<br />
kilometres driven in distribution, 11.6 million<br />
kilometres were distance and trunk transportation<br />
and 6.7 million kilometres in outsourced<br />
transportation. Compared with the<br />
previous <strong>year</strong>, the amount of goods transported<br />
by Keslog increased by approximately<br />
10%. The kilometres driven in transportation<br />
increased by about 6% per load. The transportation<br />
efficiency increased by about one per<br />
cent both per kilo and per ton.<br />
Waste management and recycling<br />
In waste management the focus was on minimising<br />
the amount of mixed waste generated<br />
and achieving a high recovery rate. In Kesko<br />
Food’s warehouse operations, the total<br />
amount of waste dropped by 5% and the waste<br />
recovery rate was nearly 90%. Anttila Oy’s<br />
high recovery rate (98%) matched the level of<br />
the previous <strong>year</strong>. The number of recoverable<br />
and reusable packages collected by the K-food<br />
stores’ return logistics at K-stores and customer<br />
restaurants totalled over 92 million.<br />
The number of returned cans increased by<br />
nearly one half to 81.6 million.<br />
Social responsibility<br />
Kesko’s social responsibility is divided into<br />
the direct responsibility that applies to its<br />
own personnel, and to the indirect responsibility<br />
that applies to the personnel participating<br />
in the production of the merchandise sold<br />
by Kesko.<br />
Core areas of Kesko’s social responsibility<br />
concerning corporate personnel include job<br />
satisfaction, equality, competence development,<br />
and health and safety. The social<br />
responsibility indicators describe the current<br />
status and progress of the working community<br />
from many perspectives and they are<br />
related to Kesko’s HR strategy.<br />
In late <strong>2007</strong>, a revised guidebook entitled<br />
’Our Responsible Working Principles’ was<br />
published by Kesko and the K-Group and its<br />
message was reinforced by the publication of<br />
a web training programme and an animated<br />
series. The guidebook has been translated into<br />
all the languages used in the Kesko Group and<br />
concerns every employee of the K-Group.<br />
Responsible purchasing<br />
In <strong>2007</strong>, Kesko established a steering group to<br />
develop and coordinate responsible purchasing.<br />
During the <strong>year</strong> the group launched several<br />
projects to improve the efficiency of Kesko’s<br />
supplier audits in developing countries.<br />
Kesko is an active member of the Business<br />
Social Compliance Initiative (BSCI), a joint<br />
organisation established by European importers<br />
to promote social audits in the supplier<br />
companies located in developing countries.<br />
By the end of the <strong>year</strong>, the BSCI already had<br />
more than 90 companies as its members.<br />
At the end of <strong>2007</strong>, BSCI members had a<br />
total of 2,582 supplier audits either underway<br />
or completed, mainly in Asia. Nearly 30 of<br />
these were Kesko’s suppliers, and audits have
56<br />
<strong>Kesko's</strong> <strong>year</strong> <strong>2007</strong><br />
been carried out with 22 of them. Kesko also<br />
has 28 suppliers with SA 8000 certification.<br />
The BSCI arranged supplier training in<br />
China and Turkey, and supplier and stakeholder<br />
meetings related to agricultural supplier<br />
audits in Morocco, South Africa and<br />
Almería, Spain.<br />
Some of Kesko’s Vietnamese suppliers<br />
participate in the joint three-<strong>year</strong> development<br />
project by the Social Responsibility in<br />
Importing network, the Trade Union Solidarity<br />
Centre of Finland (SASK) and the Central<br />
Organisation of Finnish Trade Unions -SAK.<br />
A BSCI audit was carried out in the supplier<br />
companies participating in this project during<br />
<strong>2007</strong>. The companies also received training<br />
in issues related to employees’<br />
unionisation.<br />
Responsibility in product trade<br />
At the end of <strong>2007</strong>, Kesko Food offered a selection<br />
of about 500 organic products and 550<br />
products with environmental labelling. In<br />
addition, individual K-retailers continue to<br />
purchase local organic and other foods to<br />
meet their customers’ wishes. The selections<br />
included 65 Fairtrade products, eight of which<br />
were in the Pirkka range. The extent of the<br />
selection varies by store chain. The selection<br />
and marketing policies concerning organic<br />
and Fairtrade products and products with<br />
environmental labelling are included in the<br />
K-food stores’ chain concepts.<br />
In early <strong>2007</strong> Kesko Food signed an extensive<br />
cooperation agreement with the Association<br />
for Promoting Fairtrade in Finland.<br />
Kesko Food aims to be the market leader in<br />
the sales of Fairtrade products in Finland and<br />
actively seeks new Fairtrade products for the<br />
selection. Fairtrade carnations and mixed<br />
bunches were launched in autumn <strong>2007</strong> to<br />
complement the Fairtrade roses that had been<br />
a huge success.<br />
In April <strong>2007</strong> the K-food stores’ own coffee<br />
brand, Costa Rica, was replaced by the UTZcertified<br />
Pirkka Costa Rica. The new coffee<br />
soon became the most bought responsibly<br />
produced coffee in Finland. The UTZ certification<br />
is based on complying with the demanding<br />
Code of Conduct, which includes both<br />
environmental and social aspects. Consumers<br />
can trace the UTZ-certified coffee all the way<br />
back to the coffee plantation with the help of<br />
the coffee pack’s ’best before’ labelling.<br />
Since the end of <strong>2007</strong>, K-food stores have<br />
offered the Pirkka 100% biodegradable shop-<br />
ping bag as an alternative for a plastic bag.<br />
A new Pirkka non-disposable shopping bag<br />
was introduced to the stores at the same time.<br />
The promotion of a healthy way of life is a<br />
central part of Kesko Food’s responsibility<br />
work. The GDA (guideline daily amounts)<br />
label was introduced to the Pirkka range, and<br />
the amount of salt was reduced in six and the<br />
amount of fat in four Pirkka products. The<br />
reformulation of Pirkka products with respect<br />
to their salt, fat and sugar content will continue<br />
during 2008. In cooperation with Dietician<br />
Hanna Partanen, Kesko Food has started<br />
a series of lectures called ’The best choices of<br />
the day’, organised by K-food retailers for<br />
their customers throughout Finland. The<br />
total number of events will reach about 100.<br />
Anttila became the first Nordic retailer to<br />
introduce the Swiss Switcher clothing collection<br />
in its department stores. Switcher pays<br />
special attention to ethical aspects and the<br />
environmental impact of the whole production<br />
chain. Switcher products have a unique<br />
DNA code, which enable the consumer to trace<br />
the production phases of the garment all the<br />
way back to the cotton field.<br />
Rautakesko offers a wide selection of<br />
products with environmental, energy or emission<br />
category labelling. The proportion of certified<br />
timber out of total timber sales was<br />
around 90%. A total of 753 tons of impregnated<br />
timber were recycled through the<br />
K-rauta and Rautia stores. Tropical wood and<br />
timber accounted for under two percent of<br />
Rautakesko’s total sales. In line with Kesko’s<br />
sourcing policy, the garden furniture sold by<br />
all K-Group stores is either FSC-certified or<br />
made of cultivated tropical wood species.<br />
Rautakesko develops cost and eco-efficient<br />
service solutions for construction and<br />
living. The heat renovation service of the<br />
K-rauta and Rautia chains finds the most<br />
suitable heating technique for the customer,<br />
surveys opportunities for energy savings and<br />
pays special attention to the building’s energy<br />
efficiency. Rautakesko will publish a guide<br />
with advice and hints on sustainable living in<br />
March 2008. The themes of the guide are<br />
energy, water, internal air, waste management,<br />
maintenance and repairs, as well as<br />
safety and security. Texts for the guide to be<br />
distributed at the K-rauta and Rautia stores<br />
have been produced by Motiva, the Ministry<br />
of the Environment, the Pulmonary Association<br />
Heli, and the Confederation of Finnish<br />
Construction Industries.<br />
Product safety<br />
The Product Research Unit of Kesko Food is<br />
responsible for ensuring the quality of purchases,<br />
keeping abreast of food legislation,<br />
maintaining and providing support for the<br />
self-control plans required by law and for<br />
developing private label products together<br />
with purchasing and marketing units. The<br />
recipe service of the unit generates hundreds<br />
of recipes for both the K-Group units and<br />
directly for consumers. Kesko Food’s Consumer<br />
Service answers consumer inquiries<br />
and receives feedback. In <strong>2007</strong>, there were<br />
20,300 such contacts.<br />
Quality control in purchasing is implemented<br />
by auditing the operations of product<br />
manufacturers and analysing product composition<br />
and quality. In <strong>2007</strong>, the Product<br />
Research Unit audited 28 suppliers, 14 of<br />
which were Finnish. These companies mainly<br />
included suppliers of Kesko’s private labels.<br />
A total of 5,022 food novelties and product<br />
development samples, and 1,262 product lot<br />
and other self-control samples were analysed.<br />
Kesko’s Product Research Unit also plays a<br />
key role in exceptional situations, when a<br />
product launched on the market fails to meet<br />
safety or quality requirements. A total of 35<br />
product recalls took place, most of which<br />
related to defective quality or taste, or a manufacturing<br />
or packaging error. Nine of the<br />
recall cases were Kesko Food’s private label<br />
products; in other cases the Product Research<br />
Unit assisted the manufacturing industry.<br />
Two of the recall cases were public recalls,<br />
involving potential health hazards.<br />
Indian guar gum containing dioxin caused<br />
extensive recalls in the EU area in early<br />
autumn. Guar gum (E412) is used as a thickening<br />
additive in very many types of groceries.<br />
The Product Research Unit followed the<br />
situation carefully and ensured that no polluted<br />
lots of guar gum ended up to the manufacturers<br />
of Pirkka products. The laboratory<br />
also made spot-check type determinations of<br />
dioxin, which revealed no deviations. Safety<br />
questions of textiles, such as formaldehyde<br />
and nonylphenol contents, aroused a lot of<br />
discussion throughout the autumn. No contents<br />
exceeding the permitted values were<br />
found in the analyses made by the Product<br />
Research Unit. The new Decree on Food<br />
Premises (STMa 905/<strong>2007</strong>) entered into force<br />
on 1 November <strong>2007</strong>. The requirements of the<br />
revised decree concerning temperatures, for<br />
example, will be updated in the K-Group’s selfcontrol<br />
plans during the transition periods.
Year <strong>2007</strong><br />
Decision-making<br />
Divisions The Group Financial statements Further information<br />
Corporate Governance Statement<br />
Rules and regulations to be applied and<br />
the Corporate Governance code<br />
Kesko Corporation (Kesko or the company) is a Finnish public limited<br />
company in which the duties and responsibilities of the executive bodies<br />
are defined according to the Finnish law. The international Kesko<br />
Group comprises the parent company, Kesko, and its subsidiaries. The<br />
company is domiciled in Helsinki.<br />
Kesko’s decision-making and administration comply with the Limited<br />
Liability Companies Act, other regulations concerning publicly<br />
traded companies, the company’s Articles of Association, and the rules<br />
and regulations of the OMX Nordic Exchange Helsinki. In addition, the<br />
company complies with the Corporate Governance Recommendation<br />
for Listed Companies published jointly by the OMX Nordic Exchange<br />
Helsinki, the Central Chamber of Commerce of Finland and the Confederation<br />
of Finnish Industry and Employers, which entered into force on<br />
1 July 2004 (Corporate Governance Recommendation).<br />
The highest decision-making power in Kesko is exercised by the<br />
company’s shareholders at a General Meeting. Kesko is managed by the<br />
Board of Directors and a Managing Director, who is the President and<br />
CEO.<br />
General Meetings<br />
General Meetings are divided into Annual and Extraordinary General<br />
Meetings. The Annual General Meeting, which is held on a date by the<br />
end of every June designated by the company’s Board of Directors, handles<br />
the business specified for the Annual General Meeting in the company’s<br />
Articles of Association and any other proposals that may be<br />
made to the Meeting. Kesko’s Annual General Meeting has usually been<br />
held in March or April. All General Meetings are convened by the company’s<br />
Board of Directors. If needed, an Extraordinary General Meeting<br />
is convened by the Board of Directors. General Meetings usually handle<br />
the matters placed on the agenda by the company’s Board of Directors.<br />
According to the Limited Liability Companies Act, a shareholder has<br />
the right to have a matter specified for a General Meeting handled at a<br />
General Meeting, if he/she requests so in writing to the Board of Directors<br />
early enough for the matter to be included in the notice of the<br />
meeting.<br />
Major matters subject to the decision-making power of a General<br />
Meeting include<br />
●●<br />
●●<br />
●●<br />
●●<br />
●●<br />
●●<br />
●●<br />
●●<br />
amendments to the Articles of Association,<br />
decisions on share issues,<br />
decisions on increases in the share capital,<br />
decisions on the distribution of the company’s earnings, such as<br />
distribution of profit and decreases in the share capital,<br />
decisions on the number of the Board members,<br />
the election of all Board members and decisions on their fees,<br />
the election of the auditor and<br />
the adoption of the financial statements.<br />
57<br />
Shareholders are invited to a General Meeting by a notice published<br />
in at least two nationwide newspapers, specifying the time and place<br />
and listing the matters on the agenda. The notice and the proposals of<br />
the company’s Board of Directors to a General Meeting are also published<br />
in a stock exchange release and posted on the company’s Internet<br />
pages.<br />
Those wishing to attend a General Meeting must notify their intention<br />
in advance by the time announced in the notice of the meeting.<br />
Shareholders may attend the meeting themselves or through an<br />
authorised representative. Each shareholder or representative may<br />
have one assistant at the meeting. Minutes are taken at a General<br />
Meeting and are made available to shareholders for inspection within<br />
two (2) weeks afterwards. The decisions made by a General Meeting are<br />
also published in a stock exchange release immediately after the<br />
meeting.<br />
Kesko’s aim is that all members of the company’s Board of Directors<br />
and the President and CEO are present at the Annual General Meeting.<br />
First-time candidates for the Board of Directors are present at the General<br />
Meeting which elects the members, unless there is a particularly<br />
weighty reason for their absence.<br />
Further information about the decisions made at Kesko’s <strong>2007</strong><br />
Annual General Meeting is available at www.kesko.fi.<br />
Share series<br />
The company has two share series, A and B, which differ as to the votes<br />
to which they give entitlement. Each A share entitles its holder to ten<br />
(10) votes and each B share to one (1) vote at a General Meeting. When<br />
votes are taken, the proposal supported by more than half of the votes<br />
will, in accordance with the Limited Liability Companies Act, normally<br />
be the decision of the General Meeting. According to the Limited Liability<br />
Companies Act, there are, however, several matters, such as amendments<br />
to the Articles of Association and decisions concerning directed<br />
share issues, in which a higher qualified majority in relation to the<br />
number of shares and the votes to which they give entitlement is<br />
needed before a decision is reached.<br />
Kesko’s Articles of Association do not include any redemption<br />
clauses or voting restrictions. No shareholder agreements on the use of<br />
voting rights in the company or agreements on restricting the transfer<br />
of company shares are known to the company.<br />
Supervisory Board<br />
The company has no Supervisory Board.<br />
Board of Directors<br />
Composition and term<br />
According to the Articles of Association, Kesko’s Board of Directors<br />
consists of a minimum of five (5) and a maximum of eight (8) members.<br />
According to the Articles of Association, the term of office of each<br />
Board member is three (3) <strong>year</strong>s with the term starting at the close of
58 <strong>Kesko's</strong> <strong>year</strong> <strong>2007</strong><br />
Kesko Group’s Corporate Governance structure<br />
Kesko<br />
Food ltd<br />
Internal<br />
Audit<br />
Rautakesko<br />
ltd<br />
Konekesko ltd<br />
Intersport Finland ltd<br />
Indoor Group ltd<br />
the General Meeting electing the member and expiring at the close of<br />
the third (3rd) Annual General Meeting after the election.<br />
The General Meeting elects all members of the Board of Directors.<br />
According to the Corporate Governance Recommendation, the majority<br />
of the Board members must be independent of the company. A member<br />
is considered to be independent of the company if he/she has no significant<br />
connection to the company other than membership of the Board of<br />
Directors. In addition, at least two (2) of the members belonging to the<br />
above majority must be independent of the company’s significant<br />
shareholders. The Board of Directors evaluates the independence of its<br />
members annually in accordance with the Corporate Governance<br />
Recommendation.<br />
The Board of Directors elects a Chairman and a Deputy Chairman<br />
from among its members annually after the Annual General Meeting.<br />
Deviation from the Corporate Governance recommendation<br />
The terms of the members of Kesko’s Board of Directors deviate from<br />
the term of one <strong>year</strong> specified in item 12 of the Corporate Governance<br />
Recommendation. A General Meeting makes decisions on all amendments<br />
concerning the Articles of Association. A shareholder which,<br />
together with controlled companies, holds over 10% of all voting rights<br />
attached to Kesko’s shares, has informed the company’s Board of Direc-<br />
Annual<br />
General Meeting<br />
Board of Directors<br />
Audit Committee<br />
Compensation Committee<br />
VV-Auto<br />
Group Oy<br />
Musta Pörssi ltd<br />
Kenkäkesko ltd<br />
Tähti Optikko Group Oy<br />
Kesko Corporation<br />
President<br />
and CEO<br />
tors that it considers the term of three <strong>year</strong>s good for the company’s<br />
long-term development and sees no need to shorten the term of office<br />
set in the Articles of Association.<br />
Duties<br />
The function of Kesko’s Board of Directors is to duly arrange the company’s<br />
management, operations and accounting, and to supervise the<br />
company’s financial management. The Board of Directors has confirmed<br />
the written rules of procedure that specify the Board of Directors’<br />
duties, business to be handled, meeting practice and decisionmaking<br />
process. According to the rules of procedure, the Board of<br />
Directors handles and decides on all matters that are financially, commercially<br />
or fundamentally significant for the Group’s operations.<br />
According to the rules of procedure, the responsibilities of the Board of<br />
Directors include:<br />
●●<br />
●●<br />
●●<br />
●●<br />
Anttila Oy<br />
Kauko-Telko ltd<br />
K-instituutti Oy<br />
K-Plus Oy<br />
Auditors<br />
Corporate<br />
Management<br />
Board<br />
Kesko<br />
Agro ltd<br />
other subsidiaries<br />
making decisions on Group strategy and confirming strategies for<br />
the divisions,<br />
making decisions on Group structure and organisation,<br />
handling and adopting interim financial reports, consolidated<br />
financial statements and the Annual Report,<br />
confirming the Group’s operating plan, budget and investment plan,
●●<br />
●●<br />
●●<br />
●●<br />
●●<br />
●●<br />
●●<br />
●●<br />
●●<br />
●●<br />
Year <strong>2007</strong><br />
Divisions The Group Financial statements Further information<br />
making decisions on strategically or financially important individual<br />
capital expenditure, acquisitions, disposals or other arrangements,<br />
and contingent liabilities,<br />
confirming the Group’s risk management and reporting practice,<br />
confirming the Group’s insurance policy,<br />
approving the Group’s financing policy,<br />
making decisions on reward and incentive schemes for Group<br />
management,<br />
establishing a dividend policy and being responsible for the development<br />
of shareholder value,<br />
appointing the company’s Managing Director and determining his/<br />
her remuneration,<br />
appointing the Managing Directors of the major subsidiaries,<br />
confirming Kesko’s values to be applied in the Group, and<br />
handling the Corporate Responsibility Report.<br />
Decision-making<br />
Kesko’s Board of Directors is always obliged to act in the interests of<br />
the company and in such a way that their operations will not give an<br />
unjustifiable advantage to a shareholder or other party at the expense<br />
of the company or another shareholder. A member of the company’s<br />
Board of Directors is disqualified to participate in the handling of any<br />
matter between him/her and the company. The Chairman of the Board<br />
of Directors is responsible for convening and conducting Board meetings.<br />
When a vote is taken, the Board of Directors’ decision will be the<br />
opinion of the majority. If the vote results in a tie, the decision will be<br />
the opinion seconded by the Chairman. If the votes cast at an election<br />
end in a tie, the result will be decided by drawing lots.<br />
Meeting practice and self-assessment of operations<br />
Kesko’s Board of Directors meets about 10 times a <strong>year</strong>. The Board of<br />
Directors has not distributed any special areas of focus in terms of<br />
business monitoring to its members. The Board of Directors’ Audit<br />
Committee and Compensation Committee assist the Board by preparing<br />
the matters that must be decided by the Board. The Board of Directors<br />
regularly assesses its operations and working practices by carrying<br />
out a self-assessment once a <strong>year</strong>.<br />
Fees and other benefits of the Board of Directors<br />
The Annual General Meeting makes decisions on the fees paid to the<br />
members of Kesko’s Board of Directors and the basis for compensation<br />
for their expenses annually. Fees to the members of the Board of Directors<br />
are paid as monetary compensation. Board members have no<br />
share-linked fee systems.<br />
Committees of the Board of Directors<br />
Kesko has the Board of Directors’ Audit Committee and Compensation<br />
Committee, both of which consist of three (3) Board members. The<br />
Board of Directors elects the Chairs and the members of the Committees<br />
from among its members for one <strong>year</strong> at a time. In accordance with<br />
the Corporate Governance Recommendation, all members of the Audit<br />
Committee are independent of the company and its significant shareholders.<br />
The Board of Directors has confirmed written rules of procedure<br />
for the Committees that lay down their key duties and operating<br />
policies.<br />
The Committees have no independent decision-making power, but<br />
the Board makes decisions based on the preparations made by the<br />
Committees.<br />
59<br />
Audit Committee<br />
The Audit Committee prepares for the Board of Directors matters relating<br />
to the monitoring of financial position, the supervision and control<br />
of reporting and the risk management of the Kesko Group. The Audit<br />
Committee monitors the development of the Group’s financial position<br />
and financing and supervises its financial reporting. The Committee<br />
also evaluates the adequacy of internal auditing and risk management<br />
and handles the plans and reports of the Internal Audit Department<br />
and confirms the plan of action. Additionally, the Committee prepares<br />
the proposal concerning the election of external auditors to be made by<br />
the Board of Directors to the General Meeting. The Committee also<br />
monitors and evaluates the quality and independence of the Kesko<br />
Group’s external auditing, and other expert services of auditing firms<br />
used by the company.<br />
Compensation Committee<br />
The duties of the Compensation Committee include the preparation of<br />
the compensation and other benefits of the company’s President and<br />
CEO for the company’s Board of Directors, the preparation of the compensation<br />
matters of the Group’s senior management, and the preparation<br />
of the appointment matters of the President and CEO and the company’s<br />
senior management, and the assessment of their successors.<br />
Other duties of the Compensation Committee include the preparation<br />
of other matters concerning compensation systems for the Board of<br />
Directors.<br />
As for the members of the Corporate Management Board, Kesko’s<br />
Board of Directors decides on the compensation and benefits paid to<br />
the Presidents of sub-groups, based on the preparation by the Compensation<br />
Committee. Kesko’s Board of Directors decides the basis for and<br />
the maximum amounts of bonuses paid and the quantity of stock<br />
options given to all members of the Corporate Management Board,<br />
based on the preparation of the Compensation Committee. The Board<br />
of Directors also decides the amounts of bonuses paid to the President<br />
and CEO and the Presidents of sub-groups.<br />
Other committees<br />
Kesko’s Board of Directors has not established any other committees in<br />
addition to the Audit and Compensation Committees.<br />
Further information about Kesko’s Board of Directors and its Committees<br />
is available on pages 60–61 and at www.kesko.fi.<br />
President and CEO<br />
Kesko has a Managing Director who is known as the President and<br />
CEO. His duty is to manage the company’s activities in accordance with<br />
the company’s Board of Directors’ instructions and rules and to inform<br />
the Board of Directors about the development of the company’s business<br />
and financial situation. He is also responsible for arranging the<br />
company’s day-to-day administration and ensuring that the financial
60 <strong>Kesko's</strong> <strong>year</strong> <strong>2007</strong><br />
administration of the company has been arranged reliably. The Board<br />
of Directors elects the President and CEO.<br />
Corporate Management Board<br />
The Kesko Group has a Corporate Management Board, the Chairman of<br />
which is Kesko’s President and CEO.<br />
The Corporate Management Board has no authority based on legislation<br />
or the Articles of Association. The Corporate Management Board<br />
is responsible for dealing with Group-wide development projects and<br />
Group-level principles and practices. In addition, the Corporate Management<br />
Board deals with the Group’s and the division parent companies’<br />
business plans, profit performance and matters that are handled<br />
by Kesko’s Board of Directors, and it also participates in the preparation<br />
of these matters. The Corporate Management Board meets 8–10<br />
times a <strong>year</strong>.<br />
Subsidiary management<br />
Board members of the major subsidiaries are elected from among the<br />
management of the Kesko Group. The most important duties of the<br />
subsidiary boards include drawing up the companies’ and their subgroups’<br />
strategies, operating plans and budgets, and making decisions<br />
on investments, acquisitions and contingent liabilities within the<br />
authorities given by Kesko’s Board of Directors.<br />
Reward and incentive schemes<br />
Kesko’s Board of Directors has approved the principles of a performance-based<br />
bonus system for the Group’s management for the <strong>year</strong><br />
<strong>2007</strong>. Depending on the requirements for and profit impact of each<br />
management position, the maximum bonuses can vary up to an<br />
amount corresponding to a manager’s salary for 3–8 months. The<br />
bonus system criteria consist of Group-level and responsibility areaspecific<br />
profit targets, customer and personnel indicators, and an overall<br />
assessment. The bonus system covers about 80 executives of the<br />
Kesko Group.<br />
In addition to the bonus system, Kesko has a valid <strong>year</strong> 2003 stock<br />
option scheme for the Kesko Group’s management and a valid <strong>year</strong><br />
<strong>2007</strong> stock option scheme for the Group management and other key<br />
people. The <strong>2007</strong> option scheme includes the obligation made by Kesko’s<br />
Board of Directors to option recipients to use 25% of their option<br />
income to buy company shares for permanent ownership. Kesko’s<br />
Board of Directors makes decisions on the distribution of stock options<br />
based on the proposal by the Compensation Committee.<br />
The company has no valid incentive schemes in which the company<br />
would reward the management with company shares.<br />
The key terms and conditions of the 2003 and <strong>2007</strong> stock option<br />
scheme are available in full at www.kesko.fi.<br />
Auditing<br />
According to the Articles of Association, Kesko has one (1) auditor,<br />
which shall be a firm of auditors authorised by the Central Chamber of<br />
Commerce. The Board of Directors’ Audit Committee prepares the<br />
Board’s proposal concerning the company’s auditor for presentation at<br />
a General Meeting. The term of an auditor is the company’s financial<br />
<strong>year</strong> (a calendar <strong>year</strong>) and an auditor’s duties terminate at the close of<br />
the Annual General Meeting following the election.<br />
The auditor presents the audit report required by law to Kesko’s<br />
shareholders together with the company’s financial statements, and<br />
regularly reports to the Audit Committee of Kesko’s Board of Directors<br />
and to the Board.<br />
Further information about Kesko’s management, auditor and their<br />
fees is available on page 61 and at www.kesko.fi.<br />
Group-wide financial reporting<br />
The Group’s financial performance and the achievement of financial<br />
objectives are monitored via Group-wide financial reporting. Monthly<br />
performance reporting includes Group-, division- and subsidiary-specific<br />
results, progress compared to the previous <strong>year</strong>, comparisons with<br />
financial plans, and forecasts for the next 12 months. The Group’s<br />
short-term financial planning is based on plans drawn up by the quarter,<br />
extending for 15 months. The financial indicator for growth is sales<br />
growth, while that for profitability is the accumulation of economic<br />
value added, monitored via monthly internal reporting. When calculating<br />
economic value added, the requirements concerning return on capital<br />
are determined annually on market terms. In profit requirements,<br />
risk-related division- and country-specific differences have been taken<br />
into account. Information about the Group’s financial situation is given<br />
by interim financial reports and the financial statements release. The<br />
Group’s sales figures are published in a stock exchange release each<br />
month.<br />
Corporate governance – information for <strong>2007</strong><br />
Board of Directors<br />
Kesko’s Annual General Meeting held on 27 March 2006 elected seven<br />
(7) members to the company’s Board of Directors. In accordance with<br />
the Articles of Association, the term of the Board members started on<br />
27 March 2006 and will expire at the close of the 2009 Annual General<br />
Meeting. The Annual General Meeting elected the following members<br />
to the Board of Directors: Retailer Pentti Kalliala, Ilpo Kokkila, Deputy<br />
CEO Maarit Näkyvä, Seppo Paatelainen, Keijo Suila, retailer Jukka<br />
Säilä, and retailer Heikki Takamäki. The Annual General Meeting held<br />
on 26 March <strong>2007</strong> confirmed the number of Board members to be<br />
seven.<br />
In its organisation meeting on 27 March 2006, the Board of Directors<br />
elected Heikki Takamäki as Chairman and Keijo Suila as Deputy<br />
Chairman.<br />
In <strong>2007</strong> Kesko’s Board of Directors convened eight (8) times. The<br />
average attendance percentage, a figure that illustrates the participation<br />
of Board members in the work of the Board, was about 98%.<br />
Board of Directors’ Committees<br />
The Chair of the Board of Directors’ Audit Committee was Maarit<br />
Näkyvä, with Seppo Paatelainen and Keijo Suila as members. The Committee<br />
met five (5) times during the <strong>year</strong>.
Year <strong>2007</strong><br />
Divisions The Group Financial statements Further information<br />
The Chair of the Board of Directors’ Compensation Committee was<br />
Heikki Takamäki, with Pentti Kalliala and Keijo Suila as members. The<br />
Committee met four (4) times during the <strong>year</strong>.<br />
Attendance of Board members at the meetings of the Board of<br />
Directors and its Committees in <strong>2007</strong>:<br />
Audit<br />
Compensation<br />
Board Committee Committee<br />
Attend-<br />
ance<br />
% (all)<br />
Attend-<br />
ance %<br />
(all)<br />
Kalliala, Pentti 7/8 4/4 88 92<br />
Kokkila, Ilpo 8/8 100 100<br />
Näkyvä, Maarit 7/8 5/5 88 92<br />
Paatelainen, Seppo 8/8 5/5 100 100<br />
Suila, Keijo 8/8 5/5 4/4 100 100<br />
Säilä, Jukka 8/8 100 100<br />
Takamäki, heikki 8/8 4/4 100 100<br />
Board of Directors’ fees<br />
Kesko’s Board member fees have been paid as monetary compensation.<br />
The monthly and meeting fees paid to the Board members in <strong>2007</strong><br />
totalled €291,500 (€274,060 totally in 2006), of which fees paid to<br />
Audit Committee members accounted for €10,000 (€8,840) and the<br />
fees paid to Compensation Committee members for €6,000 (€3,000).<br />
No company shares, stock options or other special rights to company<br />
shares have been distributed to Board members. Kesko has given no<br />
loans to its Board members or no guarantees or other contingent liabilities<br />
for them.<br />
Based on a decision made by the Annual General Meeting<br />
on 26 March <strong>2007</strong>, the monthly and meeting fees paid in <strong>2007</strong><br />
were the following:<br />
Monthly fees Fee per month, €<br />
Chair of the Board 5,000<br />
Deputy Chair of the Board 3,500<br />
Board member 2,500<br />
Meeting fees Fee per meeting, €<br />
Fee for Board meeting 500<br />
Fee for Committee meeting 500<br />
Fee for Chair of a Committee meeting if he/she is<br />
not also Chair or Deputy Chair of the Board 1,000<br />
Board members are also entitled to daily allowances and compensation<br />
for travelling expenses in accordance with the general travel rules of<br />
Kesko.<br />
Further information about the members of the Board of Directors and<br />
the fees paid to them is available on pages 66–67 and at www.kesko.fi.<br />
Board of Directors’ monthly and meeting fees 2003–<strong>2007</strong>:<br />
Monthly fees Fee per month, €<br />
2006–<strong>2007</strong> 2003–2005<br />
Chair of the Board 5,000 3,800<br />
Deputy Chair of the Board 3,500 2,400<br />
Board member 2,500 2,000<br />
61<br />
Meeting fees Fee per meeting, €<br />
2006–<strong>2007</strong> 2003–2005<br />
Fee for Board meeting 500 420<br />
Fee for Committee meeting 500 420<br />
Fee for Chair of a Committee<br />
meeting if he/she is not also Chair<br />
or Deputy Chair of the Board 1,000 420<br />
Evaluation of independence<br />
Kesko’s Board of Directors elected at the Annual General Meeting on 27<br />
March 2006 evaluated the independence of the company’s Board members<br />
and its significant shareholders, in accordance with item 18 of the<br />
Corporate Governance Recommendation, most recently on 26 March<br />
<strong>2007</strong>. Based on the evaluation, the following persons were found to be<br />
independent of the company: Keijo Suila, Deputy Chairman of the<br />
Board of Directors, and Ilpo Kokkila, Maarit Näkyvä and Seppo<br />
Paatelainen, Board members. The following persons were dependent on<br />
the company: Heikki Takamäki, Chairman of the Board of Directors,<br />
and Pentti Kalliala and Jukka Säilä, Board members. Pentti Kalliala,<br />
Jukka Säilä and Heikki Takamäki are K-retailers, who have a chain<br />
agreement with a Kesko Group company.<br />
The Board of Directors evaluated that all its members were independent<br />
of significant shareholders of the company as referred to in<br />
the Corporate Governance Recommendation.<br />
President and CEO<br />
In <strong>2007</strong>, the salaries, bonuses and fringe benefits paid to Matti Halmesmäki,<br />
President and CEO, who started in the position at the beginning<br />
of March 2005, totalled €736,060 (€598,200 in 2006), of which<br />
regular salaries accounted for €500,680 (€446,880), the 2006 bonus<br />
paid under the performance-based bonus system for €216,000<br />
(€132,000) and fringe benefits for €19,380 (€19,320).<br />
The President and CEO was paid the maximum bonus for 2006,<br />
which equalled his regular salaries for 6 months. Kesko’s Board of<br />
Directors will make a decision on the <strong>2007</strong> bonuses in spring 2008.<br />
During the <strong>year</strong>, the President and CEO sold 10,000 stock options<br />
2003E and 42,000 stock options 2003F. At the end of the <strong>year</strong>, he held<br />
50,000 stock options <strong>2007</strong>A, the subscription period for which will<br />
begin on 1 April 2010.<br />
The retirement ages of the President and CEO is 60 <strong>year</strong>s and his<br />
full pension is 66% of the pensionable salary. The President and CEO’s<br />
notice period is 6 months. A severance pay paid in addition to the salaries<br />
for the period of notice corresponds to 12 months’ salary.<br />
Corporate Management Board<br />
Starting from 1 June <strong>2007</strong>, the Corporate Management Board has comprised<br />
Chairman Matti Halmesmäki, Kesko’s President and CEO, and<br />
members Terho Kalliokoski, President of Kesko Food Ltd; Jari Lind,<br />
President of Rautakesko Ltd; Matti Leminen, President of Anttila Oy;<br />
Pekka Lahti, President of VV-Auto Group Oy, as well as Arja Talma,<br />
Senior Vice President, CFO; Riitta Laitasalo, Senior Vice President,<br />
Human Resources; and Paavo Moilanen, Senior Vice President, Corporate<br />
Communications and Responsibility, of Kesko. Juhani Järvi, the
62 <strong>Kesko's</strong> <strong>year</strong> <strong>2007</strong><br />
former Corporate Executive Vice President, Deputy to the President<br />
and CEO, renounced his membership in the Corporate Management<br />
Board as of 1 June <strong>2007</strong>.<br />
In <strong>2007</strong>, the members of the Corporate Management Board, excluding<br />
the President and CEO, received* €1,378,699 (€1,358,570 in 2006)<br />
in salaries, €100,172 (€117,879) in fringe benefits and €218,210<br />
(€174,804) in bonuses, €1,697,081 (€1,651,253) in all.<br />
During <strong>2007</strong>, the members of the Corporate Management Board,<br />
excluding the President and CEO, sold 5,000 stock options 2003D,<br />
46,000 stock options 2003E and 90,500 stock options 2003F. At the<br />
end of the <strong>year</strong>, they had a total of 13,000 stock options 2003E, 56,500<br />
stock options 2003F and 145,000 <strong>2007</strong>A stock options, the subscription<br />
period for which will begin on 1 April 2010. Further information<br />
about Kesko’s Corporate Management Board is available on pages<br />
68–69 and at www.kesko.fi.<br />
Auditing<br />
The <strong>2007</strong> Annual General Meeting of Kesko elected one auditor for the<br />
company: PricewaterhouseCoopers Oy, Authorised Public Accountants,<br />
with Pekka Nikula, APA, as the auditor with principal responsibility.<br />
The fees paid in <strong>2007</strong> to firms that belong to the Pricewaterhouse-<br />
Coopers chain in Finland and other countries for auditing Kesko Group<br />
companies totalled €786,815 (€1,122,780 in 2006), while the fees paid<br />
for consulting services, including tax and IFRS consultation, totalled<br />
€363,201 (€411,420). In some Kesko Group companies, auditing is carried<br />
out by auditors other than those belonging to the Pricewaterhouse-<br />
Coopers chain. The amount of auditing fees paid to all auditors totalled<br />
€905,351 (€1,271,860) in <strong>2007</strong>.<br />
Insider administration<br />
Kesko’s insider regulations<br />
Kesko’s Board of Directors has confirmed Kesko’s insider regulations<br />
for permanent and project-specific insiders. They take into account the<br />
regulations of the Market Securities Act and the standard on insider<br />
holdings and insider registers issued by the Financial Supervision<br />
Authority. The contents of the regulations also correspond with the<br />
insider rules of the OMX Nordic Exchange Helsinki. Kesko’s insider<br />
regulations have been distributed to all insiders.<br />
Kesko’s permanent insiders and insider registers<br />
In accordance with the Securities Markets Act, Kesko’s permanent public<br />
insiders include Kesko’s Board members, the President and CEO,<br />
and the auditor with principal responsibility in the firm of auditors.<br />
Kesko Corporation’s Board of Directors has also stipulated that, in<br />
addition to the President and CEO, other members of the Corporate<br />
Management Board are regarded as the company’s permanent public<br />
insiders. All permanent public insiders and the statutory information<br />
about them, their related persons and the corporations that are controlled<br />
by related persons or in which they exercise influence, have been<br />
entered in Kesko’s register of public insiders.<br />
Other permanent insiders of Kesko include such persons working in<br />
positions determined by the Board of Directors, who in their duties<br />
receive insider information on a regular basis and who are thus entered<br />
in the company’s own, non-public insider register. Kesko’s company-<br />
specific insider register is divided into individual registers that consist<br />
of permanent insiders and of possible insider projects and persons<br />
participating in their preparation.<br />
Monitoring<br />
The Group’s Legal Affairs Unit monitors the compliance with insider<br />
regulations and maintains the company’s insider registers in cooperation<br />
with the Finnish Central Securities Depository Ltd. The Legal<br />
Affairs Unit sends, at regular intervals, permanent public insiders an<br />
extract of the information in the insider register and monitors the permanent<br />
insiders’ compliance with trading restrictions. Kesko’s permanent<br />
insiders may not acquire or transfer securities issued by the company,<br />
including securities or derivative financial instruments entitling<br />
to them, during 21 days prior to the publication of interim financial<br />
reports and during 28 days prior to publication of annual financial<br />
statements. These dates of publication are announced annually in<br />
advance by stock exchange release. Furthermore, the persons involved<br />
in possible insider projects may not trade in such securities or derivative<br />
financial instruments during the project.<br />
Further information about the holdings of Kesko’s permanent public<br />
insiders is available on pages 143–144 or see updated information at<br />
www.kesko.fi.<br />
Stock exchange releases<br />
The General Counsel is responsible for ensuring that the rules related<br />
to stock exchange releases are observed at Kesko. The Group’s Senior<br />
Vice President, CFO is responsible for the financial content of stock<br />
exchange releases as well as for investor information. The Corporate<br />
Communications and Responsibility Unit produces Group-level communications<br />
material and is responsible for providing stock exchange<br />
and financial information.<br />
In its investor communications, Kesko follows the principle of<br />
impartiality and publishes all investor information on its Internet<br />
pages in Finnish, Swedish and English.<br />
Risk management at Kesko<br />
The objective of Kesko’s risk management is to ensure the fulfilment of<br />
the Group’s customer promises, the improvement of shareholder value,<br />
good profit performance, the ability to pay dividends and the continuation<br />
of business. Efficient risk management is a competitive advantage<br />
for Kesko. In the Kesko Group, a risk has been defined as any kind of<br />
uncertainty factor that may lead to:<br />
●●<br />
●●<br />
a failure to exploit business opportunities,<br />
events or reasons which prevent or hinder the attainment of objectives<br />
or cause other unwanted consequences.<br />
1 COSO ERM refers to the Enterprise Risk Management (ERM) – Integrated Framework<br />
published by the Committee of Sponsoring Organizations (COSO) of the Treadway Commission<br />
in September 2004. The framework defines essential ERM components, suggests<br />
a common ERM language and provides clear direction and guidance for enterprise<br />
risk management.<br />
*Juhani Järvi is included in the <strong>year</strong> <strong>2007</strong> figures until 31 May <strong>2007</strong>. In the <strong>year</strong> 2006<br />
figures, Juhani Järvi is included for the whole <strong>year</strong>.
Year <strong>2007</strong><br />
Divisions The Group Financial statements Further information<br />
The risk management policy approved by the Board of Directors<br />
guides risk management in the Kesko Group. This policy is based on<br />
the COSO ERM Integrated Framework and the Corporate Governance<br />
Recommendation. The policy defines the objectives, principles, organisation,<br />
responsibilities and key practices of risk management. Risk<br />
management is an essential part of management and day-to-day operations.<br />
The risk management process generates information about risks<br />
and the status of management responses. It leads, if necessary, to<br />
remedial actions or the consideration of changes in strategy.<br />
Principles of risk management<br />
The Kesko Group’s risk management system is based on the following<br />
principles:<br />
●●<br />
●●<br />
●●<br />
●●<br />
●●<br />
●●<br />
●●<br />
●●<br />
●●<br />
Conscious and carefully evaluated risks are taken in selecting strategies,<br />
e.g. in expanding business operations, in enhancing market<br />
position and power, and in creating new business.<br />
Financial, operational and damage/loss risks are avoided or<br />
reduced.<br />
A safe shopping environment for customers and product safety is<br />
ensured.<br />
A safe working environment is created for employees.<br />
Information about risks and risk management is provided to<br />
stakeholders.<br />
Opportunities for unhealthy phenomena, crime or malpractice are<br />
minimised through operating principles, controls and supervision.<br />
The continuity of operations is ensured by safeguarding critical<br />
functions and essential resources.<br />
Crisis management, continuity and disaster recovery plans are prepared<br />
in case any risks are realised.<br />
The costs and resources involved in risk management are in proportion<br />
to the obtainable benefits.<br />
Risk management organisation and responsibilities<br />
The business management is responsible for risk management in practice.<br />
Persons responsible for risk management have been appointed in<br />
the divisions to coordinate and report on risk management activities.<br />
Kesko Food and Rautakesko also have a risk management function of<br />
their own, which supports the implementation of risk management in<br />
the division.<br />
The Corporate Risk Management Unit is responsible for developing<br />
and maintaining risk management tools, introducing best practices to<br />
the Group and reporting on risk management to the Group management.<br />
The Unit is also responsible for Group-level principles concerning<br />
non-life insurances, for insurance programmes and coordination of<br />
non-life insurances.<br />
Kesko has a Risk Management Steering Group, which is chaired by<br />
the President and CEO, and has representatives of various divisions<br />
and Group units as members. The Steering Group approves risk management<br />
procedures and guidelines, and discusses and assesses the<br />
Group’s risks and the implementation of risk management responses.<br />
Risks are reported to the Audit Committee of Kesko’s Board of<br />
Directors on a regular basis. Kesko Corporation’s Board of Directors<br />
considers the major risks and assesses the functioning of risk management<br />
at least once a <strong>year</strong>.<br />
The Internal Audit Department assesses the functioning of risk<br />
management annually and reports on the level of risk management to<br />
Kesko’s Board of Directors’ Audit Committee.<br />
63<br />
Risk management developments in <strong>2007</strong><br />
Systematic implementation of the new risk management policy continued<br />
in the business divisions and units. Assessment and reporting of<br />
risks and their management activities have been enhanced and specified.<br />
The divisions have assessed the risks in connection with the strategy<br />
cycle and prioritised them according to their criticality and management<br />
level. The impact of risk materialisation has been evaluated in<br />
euros. The division parent companies’ risks and their management<br />
activities have been discussed by the companies’ management. The<br />
divisions have updated their risk assessments quarterly, and separate<br />
risk analyses have been made for major projects. Group units, such as<br />
Corporate Accounting, Treasury, Corporate Communications and<br />
Responsibility, Legal Affairs and IT Management, have analysed the<br />
risks threatening the objectives and their management. On the basis of<br />
the Divisions’ and Group units’ risk analyses, the Corporate Risk Management<br />
Unit has prepared summaries of major risks and their management<br />
on a quarterly basis for Kesko Corporation’s Board of Directors’<br />
Audit Committee.<br />
Kesko’s Corporate Management Board has analysed and prioritised<br />
the major risks of the Group.<br />
The Group has confirmed the new information security policy, principles<br />
of continuity management, loss prevention principles and directions<br />
concerning the inspection and reporting of malpractice. Their<br />
implementation has started and, for example, malpractice is regularly<br />
reported to senior management and the Board of Directors’ Audit Committee.<br />
Quarterly reports have also been prepared for the management<br />
on topical issues and best practices related to risk management.<br />
Kesko has Group-level cooperation networks in risk management,<br />
and corporate and information security. They aim to increase risk<br />
awareness, leverage expertise and share best practices across division<br />
and country boundaries.<br />
Risk management emphases in 2008<br />
Key issues in operative risk management include improving continuity<br />
management and the efficiency of loss prevention. The new deviation<br />
reporting system produces information about disturbances in operating<br />
activities, so as to effectively prevent disturbances in advance.<br />
Risks and their management<br />
The Kesko Group’s risk analyses have, for example, addressed the following<br />
risks and their management in <strong>2007</strong>.<br />
Delivering the customer promise<br />
The price-quality ratio is a key competitive factor. If Kesko does not<br />
succeed in this competition, it will not achieve the sales targets. The<br />
general cost development can also endanger the implementation of<br />
objectives. Enhancing price competitiveness calls for improvements in<br />
the efficiency of operations throughout the supply chain from the supplier<br />
to the store shelf. There are several programmes underway to<br />
improve cost-efficiency and total management of the operations chain,
64 <strong>Kesko's</strong> <strong>year</strong> <strong>2007</strong><br />
which serve to increase price competitiveness and consumer-customers’<br />
satisfaction with retail stores’ offering and selection.<br />
Product safety and quality of the supply chain<br />
Kesko’s goal is to provide safe products for its customers. A failure in<br />
the quality assurance of the supply chain or in product control may<br />
result in financial losses, the loss of customer confidence or, in the<br />
worst case, a health hazard. In order to manage this risk the Product<br />
Research Unit controls the quality of products sold by Kesko Food and<br />
Anttila and also supervises companies manufacturing products for<br />
Kesko Food.<br />
The trading sector’s self-control practices play a key role in ensuring<br />
the quality of foodstuffs sold and the observance of regulations and<br />
rules concerning them. The practice of recalling products ensures that<br />
defective products are withdrawn from sale quickly. Ethical purchasing<br />
principles and related guidelines secures the ethical quality of<br />
products.<br />
Store sites<br />
Store sites are a strategic competitive factor. Considerable amounts of<br />
capital are tied up in store properties for decades. Local competitive situations<br />
can change fast and there is a risk that operations at the store<br />
site will become unprofitable. The risk is managed by long-term planning<br />
of the store network, by careful preparation of each store site<br />
investment decision and by applying a sell-lease back approach. When<br />
arranging construction, Kesko aims to ensure that the use of each<br />
store site can be flexibly changed, should a need arise.<br />
Contracts made on leased properties also take flexibility into<br />
account. The acquisition of new store sites can be delayed not only by<br />
shortage of sites, town planning and permit practices, but also by the<br />
price trends of sites and construction. Different countries also have<br />
their specific features. Online sales are growing, which affects the store<br />
network. Success in e-commerce requires a completely new kind of<br />
business expertise, logistics and information security solutions.<br />
Suppliers and distribution channels<br />
In business divisions that are strongly dependent on individual principals,<br />
changes in a principal’s or supplier’s strategy concerning the<br />
product selection, pricing and distribution channel solutions can mean<br />
a reduction in competitiveness or sales or loss of business. Good market<br />
shares, growing sales and development of operations create a basis<br />
for long-term cooperation.<br />
Shrinkage<br />
The retail trade involves a high risk of shrinkage. Shrinkage can result<br />
for example from spoilage or breakage of goods, theft or other malpractice,<br />
and unsuccessful purchasing, for example. The most important<br />
loss prevention activities include uniform measuring and monitoring<br />
of shrinkage, and the consequent development and introduction of new<br />
management methods. Loss resulting from unsuccessful purchasing is<br />
managed by surveying customer needs, planning selections carefully,<br />
and monitoring.<br />
Internationalisation<br />
Internationalisation aims at growth either through business acquisitions<br />
or expanding the existing store network. Success in international<br />
growth requires careful planning of acquisitions and expansion<br />
projects, resources and risk management. Challenges include different<br />
cultures, local business practices, authorities’ actions and fast-changing<br />
operating environments. Finnish retail trade operating processes<br />
and control practices cannot always be introduced as such outside Finland.<br />
The efficient steering of operations and the achievement of synergy<br />
benefits require implementation of common practices and information<br />
systems across country and organisational boundaries.<br />
Personnel<br />
Competition for skilled employees has intensified in the labour market.<br />
Recruiting competent employees and retaining their commitment is<br />
challenging particularly in the Baltic countries and Russia. Implementation<br />
of strategies requires competent and motivated personnel. There<br />
is a risk that the trading sector will not attract the most skilled people.<br />
Specialisation increases dependence on the competence of individuals.<br />
In updating strategies, the competencies required to implement the<br />
strategy are identified, and personnel plans are drawn up on that basis.<br />
Job satisfaction surveys play a central role in the development of management<br />
and leadership. Kesko’s employer image is redefined by systematic<br />
internal and external communications and stakeholder<br />
cooperation.<br />
Continuity of operations and information security<br />
The trading sector is characterised by increasingly complicated and<br />
long supply chains and their dependency on information systems, telecommunications<br />
and external service providers. Disturbances in the<br />
supply chain can cause major losses in sales and profit. These problems<br />
may be reflected to the customer in that there are no products<br />
available in the store or the store is closed. Kesko has continuity management<br />
projects underway which aim to secure undisturbed critical<br />
operations and a sufficiently fast recovery after a serious disturbance.<br />
The importance of information in business operations is increasing<br />
all the time. The requirements of stakeholders and the legislation to<br />
safeguard the handling of information in case of accidents and misuse<br />
have grown. Confidentiality of customer and employee information is<br />
protected with up-to-date information security solutions. Appropriate<br />
guidelines are also of key importance for keeping business secrets confidential.<br />
Critical transactions, such as payments, are protected with<br />
job descriptions, acceptance limits, access rights and system controls.<br />
Legislation, agreements and ethical principles<br />
Compliance with legislation, regulations, agreements and Kesko’s ethical<br />
principles is an important basic value. Non-compliance may result<br />
in fines, compensation for damages and other financial losses, and a<br />
loss of confidence or reputation. The Group has specific Compliance<br />
programmes to avoid this. Self-assessments are made in matters concerning<br />
competition legislation.<br />
Contractual risks are managed by harmonising agreements and<br />
agreement-making processes. An essential issue in the chain agreements<br />
between Kesko and the retailers is finding solutions for the<br />
high-quality delivery of customer promise and commitment to the<br />
chain business. The efficient steering of chain operations is, to some<br />
extent, complicated by interpretations of competition legislation.<br />
Kesko has specified its guidelines concerning responsible working<br />
principles and commenced the related communications and introduction.<br />
Discussions between managers and other employees are being<br />
arranged in connection with the key contents of the guide.
Year <strong>2007</strong><br />
Divisions The Group Financial statements Further information<br />
The goal of Kesko’s corporate communications is to produce and<br />
publish reliable information at the right time. If some information published<br />
by Kesko proves to be wrong or a release fails to meet regulations,<br />
this may result in investors and other stakeholder groups losing<br />
confidence and in possible sanctions. Further pressure is put on the<br />
accuracy of financial information by the tightening of information disclosure<br />
schedules and the dependence on information systems. These<br />
risks are minimised by careful scheduling and control of the process<br />
and by ensuring proper resources and sufficient competence.<br />
Other risks<br />
Damage, accidents and crimes are prevented with uniform practices<br />
and cost-efficient safety precautions. Financial losses and interruptions<br />
in operations are covered with Group-wide and appropriate insurance,<br />
revised on a regular basis.<br />
Financial risks<br />
With respect to financial risks, the Group observes a uniform financial<br />
policy that has been approved by Kesko’s Board of Directors. The Corporate<br />
Treasury unit is responsible centrally for Group funding, liquidity<br />
management, relations with providers of finance, and the management<br />
of financial risks. Financial risks include the currency risk, the interest<br />
rate risk, the liquidity risk, the credit risk and commodity risks. Further<br />
information about them is available in Note 44 of the financial<br />
statements, ’Financial risk management’.<br />
Internal audit<br />
Roles of management and the Internal Audit Department<br />
in internal control<br />
The Audit Committee of Kesko’s Board of Directors has confirmed Kesko’s<br />
internal audit policies, which are based on good auditing principles,<br />
widely accepted internationally. The main duty of the Group’s<br />
Internal Audit Department is to support Kesko’s President and CEO,<br />
the Board of Directors and management in their task of control.<br />
Internal control is an essential part of corporate governance and<br />
management. The Board of Directors and the Managing Director are<br />
responsible for organising internal control. The Board of Directors is<br />
accountable to shareholders and the Managing Director to the Board of<br />
Directors. The chain of responsibilities continues throughout Kesko’s<br />
organisation so that the direct subordinates of the President and CEO<br />
report to him, and each Kesko employee is accountable for the internal<br />
control of his/her area of responsibility to his/her immediate superior.<br />
Kesko’s Internal Audit Department is responsible for the independent<br />
corporate assessment and assurance functions required of a listed<br />
company that systematically evaluate and verify the effectiveness of<br />
risk management, control, management and governance. In addition,<br />
support is given to the management and organisation in their work of<br />
ensuring that the Group’s goals and objectives are achieved and that<br />
the monitoring system is developed further.<br />
Organisation and focus of internal audit<br />
The operating policies of Kesko’s Internal Audit Department have been<br />
defined in the Charter confirmed by the Audit Committee. The department<br />
is subject to the Group’s President and CEO and the Audit Committee,<br />
and it reports about its plans and activities to them on a regular<br />
65<br />
basis. Audit findings, recommendations and the progress of actions are<br />
reported to the auditee management, the President and CEO, the Audit<br />
Committee and the external auditors. The Audit Committee regularly<br />
handles a summary of the Internal Audit Department’s reports and<br />
activities.<br />
The Internal Audit Department is divided into foreign audit, group<br />
audit and IT audit. Auditing is based on risk analyses and the control<br />
discussions carried on with Group and divisional management. The<br />
department cooperates with the Corporate Risk Management Unit and<br />
participates in the work of the Group’s Risk Management Steering<br />
Group. The department assesses the effectiveness of Kesko’s risk management<br />
system annually.<br />
When recruiting people to conduct auditing outside Finland, special<br />
attention has been paid to their competence and knowledge of local circumstances<br />
in Kesko’s main geographical areas. The Internal Audit<br />
Department’s foreign operations team represents four nationalities<br />
and masters seven languages. IT auditing has been strengthened by<br />
increasing resources, developing IT-assisted audit models and enhancing<br />
all internal auditors’ IT competence.<br />
Auditing evaluates the effectivity and efficiency of operations, the<br />
reliability of financial and operational reporting, the compliance with<br />
laws and regulations, and the safeguarding of assets. Focus areas<br />
include foreign operations and retailing, especially controls of goods<br />
and money in purchasing and the supply chain, finance and reporting,<br />
information systems and information security.<br />
Special attention is paid to good communications with management<br />
and providing support in adopting good audit practices. The<br />
Internal Audit Department communicates and consults on good audit<br />
solutions within the Group by preparing reports and arranging events<br />
for exchanging experiences. Controls are constantly compared with the<br />
best Finnish and international practices with the aim to identify the<br />
most efficient solutions from the viewpoint of Kesko.<br />
Ensuring professional competence<br />
According to its Charter, the Internal Audit Department must have sufficient<br />
resources available and the knowledge, skills and other competencies<br />
needed for performing its duties. The President and CEO and<br />
the Audit Committee approve the Department’s annual plan and decide<br />
on its resources.<br />
The auditors’ competencies are developed by systematic professional<br />
education and examinations. Kesko’s Internal Audit Department<br />
has six employees with the international qualification of Certified<br />
Internal Auditor and two employees with the qualification of Certified<br />
Information System Auditor, both qualifications granted by the Institute<br />
of Internal Auditors (IIA).<br />
The extent and competence of auditing is ensured and coordinated<br />
by regular contacts and exchange of information with the Group’s<br />
other internal assurance operations and external auditors. In addition,<br />
the Department acquires external services for occasional needs or<br />
assessment assignments that require special competence.<br />
International guidelines of the IIA require that an external quality<br />
assurance audit be conducted in internal audit operations every five<br />
<strong>year</strong>s. According to the audit carried out at Kesko in 2005, Kesko´s<br />
Internal Audit Department mainly complies with the international professional<br />
and ethical IIA standards.<br />
Up-to-date information on Kesko’s Corporate Governance is available<br />
at www.kesko.fi.
66<br />
<strong>Kesko's</strong> <strong>year</strong> <strong>2007</strong><br />
Board of Directors on 31 December <strong>2007</strong><br />
heikki Takamäki Keijo Suila Pentti Kalliala Ilpo Kokkila<br />
Heikki Takamäki<br />
b. 1947.<br />
Domicile: Tampere, Finland.<br />
Chairman<br />
(Chairman of the Compensation<br />
Committee)<br />
Principal occupation: Retailer,<br />
K-rauta Rauta-Otra Nekala.<br />
Main employment history: K-rauta<br />
retailer since 1979. Kesport-<br />
Intersport retailer 1995–1999.<br />
Board member since: 1 January 2001.<br />
Main simultaneous positions of trust:<br />
-<br />
Fees in <strong>2007</strong>: €65,500.<br />
Kesko shares and stock options held<br />
on 1 January <strong>2007</strong>: 104,470 A shares<br />
and 42,120 B shares held by him or<br />
his company. No stock options.<br />
On 31 December <strong>2007</strong>: 104,470 A<br />
shares and 42,120 B shares. No stock<br />
options.<br />
Keijo Suila<br />
b. 1945, B.Sc. (Econ.)<br />
Domicile: Helsinki, Finland.<br />
Deputy Chairman (member of the<br />
Audit Committee, member of the<br />
Compensation Committee)<br />
Principal occupation: -<br />
Main employment history:<br />
Huhtamäki Oyj: President of Leaf<br />
Europe 1985–1988; President of Leaf<br />
Group 1988–1998; Huhtamäki Oy:<br />
Executive Vice President 1992–1998.<br />
Finnair Plc: President and CEO<br />
1999–2005.<br />
Board member since: 1 January 2001.<br />
Main simultaneous positions of trust:<br />
the Finnish Fair Corporation: Supervisory<br />
Board Deputy Chairman, the<br />
Confederation of Finnish Industry<br />
and Employers Foundation: member<br />
of the Board of Directors, Nokia<br />
Corporation: member of the Board<br />
of Directors.<br />
Fees in <strong>2007</strong>: €49,500.<br />
Kesko shares and stock options held<br />
on 1 January <strong>2007</strong>: No shares.<br />
No stock options.<br />
On 31 December <strong>2007</strong>: No shares.<br />
No stock options.<br />
Pentti Kalliala<br />
b. 1948.<br />
(member of the Compensation<br />
Committee)<br />
Domicile: Raisio, Finland.<br />
Principal occupation: Retailer,<br />
K-supermarket Raisio Center.<br />
Main employment history: K-food<br />
retailer 1980–1992. K-supermarket<br />
retailer since 1992.<br />
Board member since: 31 March 2003.<br />
Main simultaneous positions of trust:<br />
K-Retailers’ Association: Chairman,<br />
Foundation for Vocational Training<br />
in the Retail Trade: Chairman of the<br />
Board of Directors, SV-kauppiaskanava<br />
Oy: Chairman of the Board<br />
of Directors, Vähittäiskaupan Tilipalvelu<br />
VTP Oy: member of the<br />
Board of Directors, Commercial<br />
Employers’ Association: deputy<br />
member of the Board of Directors,<br />
Employers’ Confederation of Service<br />
Industries (PT): Supervisory Board<br />
member, the Federation of Finnish<br />
Commerce: member of the Board of<br />
Directors, Raisio plc: Supervisory<br />
Board member, Confederation of<br />
Finnish Industries EK: member of<br />
Delegation for Entrepreneurs.<br />
Fees in <strong>2007</strong>: €35,000.<br />
Kesko shares and stock options held<br />
on 1 January <strong>2007</strong>: 88,560 A shares<br />
and 111,200 B shares held by him or<br />
his company. No stock options.<br />
On 31 December <strong>2007</strong>: 88,560 A<br />
shares and 111,200 B shares held by<br />
him or his company. No stock<br />
options.<br />
Ilpo Kokkila<br />
b. 1947, M.Sc. (Techn.)<br />
Domicile: Helsinki, Finland.<br />
Principal occupation: SRV Group Plc:<br />
Chairman of the Board of Directors.<br />
Main employment history: A-Betoni<br />
Oy: constructor 1972–1974, Perusyhtymä<br />
Oy: director 1974–1987, SRV<br />
Group Plc: Chairman of the Board of<br />
Directors 1987–, Pontos Ltd: Chairman<br />
of the Board of Directors 2002–<br />
Board member since: 27 March 2006.<br />
Main simultaneous positions of trust:<br />
JTO School of Management: Chairman<br />
of the Board of Directors, the<br />
Finnish Lifeboat Society: Delegation<br />
member, the Association for Promoting<br />
Voluntary National Defence<br />
of Finland: Delegation member,<br />
Finnish-Russian Chamber of<br />
Commerce (FRCC): Deputy Chairman<br />
of the Board of Directors.<br />
Fees in <strong>2007</strong>: €34,000.<br />
Kesko shares and stock options held<br />
on 1 January <strong>2007</strong>: 16,100 B shares<br />
held by him. No stock options.<br />
On 31 December <strong>2007</strong>: 16,100 B shares<br />
held by him. No stock options.
Year <strong>2007</strong><br />
Maarit Näkyvä<br />
b. 1953, M.Sc. (Econ.)<br />
(Chairman of the Audit Committee)<br />
Domicile: Kirkkonummi, Finland.<br />
Principal occupation: Sampo Bank<br />
plc: Deputy CEO.<br />
Main employment history: Unitas<br />
Bank Ltd.: Director 1990–1995,<br />
Merita Bank Ltd.: Director<br />
1995–1996, Merita Fund Management<br />
Ltd: President 1996–1997,<br />
Leonia Bank plc: member of the<br />
Board of Directors 1998–2000.<br />
Sampo plc’s Executive Vice President<br />
2001–2006. Sampo Bank plc’s<br />
Deputy CEO since 15 October 2005.<br />
Board member since: 1 January 2001.<br />
Main simultaneous positions of trust:<br />
Sampo Pankki plc: member of the<br />
Board of Directors.<br />
Fees in <strong>2007</strong>: €37,500.<br />
Kesko shares and stock options held<br />
on 1 January <strong>2007</strong>: No shares.<br />
No stock options.<br />
On 31 December <strong>2007</strong>: No shares.<br />
No stock options.<br />
Divisions The Group Financial statements Further information 67<br />
Maarit Näkyvä Seppo Paatelainen Jukka Säilä<br />
Seppo Paatelainen<br />
b. 1944, M.Sc. (Agr&For)<br />
(member of the Audit Committee)<br />
Domicile: Seinäjoki, Finland.<br />
Principal occupation: -<br />
Main employment history: Luja-<br />
Yhtiöt: director, Itikka Lihabotnia<br />
Oy and Itikka Co-operative:<br />
CEO 1988–1991, Atria Group plc:<br />
CEO 1991–2006.<br />
Board member since: 27 March 2006.<br />
Main simultaneous positions of trust:<br />
Ilkka-Yhtymä Oyj: member of the<br />
Board of Directors.<br />
Fees in <strong>2007</strong>: €36,000.<br />
Kesko shares and stock options held<br />
on 1 January <strong>2007</strong>: No shares.<br />
No stock options.<br />
On 31 December <strong>2007</strong>: No shares.<br />
No stock options.<br />
The term of each Board member will expire at the close of the 2009 Annual General Meeting.<br />
Jukka Säilä<br />
b. 1949, Business College Graduate.<br />
Domicile: Tampere, Finland.<br />
Principal occupation: Retailer,<br />
K-kenkä Koskikeskus, K-kenkä<br />
Turtola, K-kenkä Ideapark.<br />
Main employment history: Ovako<br />
Koverhar: Purchasing Department<br />
Manager 1979–1988, K-kenkä<br />
retailer since 1988.<br />
Board member since: 27 March 2006.<br />
Main simultaneous positions of trust:<br />
Confederation of Finnish Industries<br />
EK: member of the regional advisory<br />
board of Pirkanmaa.<br />
Fees in <strong>2007</strong>: €34,000.<br />
Kesko shares and stock options held<br />
on 1 January <strong>2007</strong>: 4,000 A shares<br />
and 1,100 B shares held by him or<br />
his company. No stock options.<br />
On 31 December <strong>2007</strong>: 4,000 A shares<br />
and 1,100 B shares held by him or<br />
his company. No stock options.
68<br />
<strong>Kesko's</strong> <strong>year</strong> <strong>2007</strong><br />
Corporate Management Board on 31 December <strong>2007</strong><br />
Matti halmesmäki Terho Kalliokoski Jari lind Matti leminen<br />
Matti Halmesmäki<br />
b. 1952, M.Sc. (Econ.), LL.M.<br />
Kesko Corporation’s President and<br />
CEO, Chairman of the Corporate<br />
Management Board.<br />
Domicile: Helsinki, Finland.<br />
Other major duties: Confederation<br />
of Finnish Industries EK: Deputy<br />
Chairman of the Board of Directors,<br />
the Finnish Fair Corporation: member<br />
of the Board of Directors, the<br />
Federation of Finnish Commerce:<br />
member of the Board of Directors,<br />
Varma Mutual Pension Insurance<br />
Company: Supervisory Board member,<br />
Luottokunta: Chairman of the<br />
Supervisory Board, Foundation for<br />
Economic Education: member of the<br />
Board of Directors, Finnish Business<br />
and Policy Forum EVA: member,<br />
Helsinki Region Chamber of<br />
Commerce: Delegation member, Helsinki<br />
School of Economics: Advisory<br />
Board member, the Association for<br />
Promoting Voluntary National<br />
Defence of Finland: Delegation<br />
member, the Association for the<br />
Finnish Cultural Foundation: member,<br />
the Central Chamber of Commerce<br />
in Finland: Board member,<br />
ICC Finland – the Finnish Section<br />
of International Chamber of Commerce:<br />
Executive Board member,<br />
Savonlinna Opera Festival Patrons’<br />
Association, member of the Board<br />
of Trustees.<br />
Employment history: employed by<br />
Kesko Corporation since 1980:<br />
Director of the Accounting and<br />
Office Administration Department<br />
1985–1989, Executive Vice President,<br />
Finance and Accounting<br />
1989–1993, Executive Vice President,<br />
Agricultural and Builders’ Supplies<br />
Division 1993–1995, Executive<br />
Vice President, Speciality Goods<br />
Division 1995–1996, Managing<br />
Director of Tuko Oy 1996–1997,<br />
Executive Vice President, Speciality<br />
Goods Trade 1997–2000. Member of<br />
Kesko Corporation’s Board of Directors<br />
1989–2000. President of Rautakesko<br />
Ltd and Kesko Agro Ltd<br />
2001–2005. Kesko Corporation’s<br />
Managing Director and the Kesko<br />
Group’s President and CEO since<br />
1 March 2005.<br />
Kesko shares and stock options held<br />
on 1 January <strong>2007</strong>: 10,000 E and<br />
42,000 F stock options.<br />
On 31 December <strong>2007</strong>: 50,000 A stock<br />
options.<br />
Retirement age and benefits: 60<br />
<strong>year</strong>s. Full pension is 66% of the<br />
pensionable salary.<br />
Notice period and severance pay:<br />
6 months. A severance pay paid<br />
in addition to the salaries for the<br />
period of notice corresponds to 12<br />
months’ salary.<br />
Corporate Management Board<br />
member since: 1 January 2001.<br />
Terho Kalliokoski<br />
b. 1961, M.Sc. (Econ.).<br />
President of Kesko Food Ltd.<br />
Domicile: Kirkkonummi, Finland<br />
Other major duties: the Finnish Food<br />
Marketing Association: Deputy<br />
Chairman of the Board of Directors,<br />
the Association of Finnish Advertisers:<br />
member of the Board of Directors,<br />
Association for the Finnish<br />
Work: member of the Council.<br />
Employment history: employed by<br />
Kesko Corporation since 1985:<br />
Project Planner, Store Site Office<br />
(Helsinki) 1985–1987, Investment<br />
Manager, Real Estate Department<br />
(Helsinki) 1988–1990, Financial<br />
Manager, Northern Finland (Oulu)<br />
1990–1995, Retail Services<br />
Manager, Grocery Retail Services<br />
(Oulu) 1995–1996, Sales Director,<br />
Supermarket Chain Unit (Oulu)<br />
1996–1997, District Director, Northern<br />
Finland (Oulu) 1998–2002, Senior<br />
Vice President, Kesko Real Estate<br />
(Helsinki), 2002–2005. President of<br />
Kesko Food Ltd since 1 May 2005.<br />
Kesko shares and stock options held<br />
on 1 January <strong>2007</strong>: 21,000 F stock<br />
options.<br />
On 31 December <strong>2007</strong>: 1,500 B shares<br />
and 21,000 A stock options.<br />
Retirement age and benefits: 62<br />
<strong>year</strong>s. Full pension is 66% of the<br />
pensionable salary.<br />
Notice period and severance pay:<br />
6 months. A severance pay paid<br />
in addition to the salaries for the<br />
period of notice corresponds to<br />
6 months’ salary.<br />
Corporate Management Board<br />
member since: 17 March 2005.<br />
Jari Lind<br />
b. 1958, Engineer.<br />
President of Rautakesko Ltd.<br />
Domicile: Vantaa, Finland.<br />
Other major duties: –<br />
Employment history: employed by<br />
Kesko Corporation since 1990: Rautakesko,<br />
Purchase Logistics Director<br />
2000–2001, Vice President for<br />
the K-rauta chain and B-to-B Service<br />
2002–2004. Rautakesko Ltd’s President<br />
since 1 March 2005.<br />
Kesko shares and stock options held<br />
on 1 January <strong>2007</strong>: 24,000 F stock<br />
options.<br />
On 31 December <strong>2007</strong>: 25,000 A stock<br />
options.<br />
Retirement age and benefits:<br />
62 <strong>year</strong>s. Full pension is 66%<br />
of pensionable salary.<br />
Notice period and severance pay:<br />
6 months. A severance pay paid<br />
in addition to the salaries for the<br />
period of notice corresponds to<br />
6 months’ salary.<br />
Corporate Management Board<br />
member since: 1 March 2005.<br />
Matti Leminen<br />
b. 1951, B.Sc. (Econ.)<br />
President of Anttila Oy.<br />
Domicile: Espoo, Finland.<br />
Other major duties: Textile and<br />
Fashion Suppliers and Retailers<br />
Finland: member.<br />
Employment history: employed by<br />
Kesko Ltd since 1982: Director of the<br />
Vaatehuone chain 1990–1991, Director<br />
of the Leisure Goods Department<br />
1992–1995, Director of Kesko Sports<br />
1995–1998, Executive Vice President<br />
of Keswell Ltd 2005–2006. President<br />
of Anttila Oy since 10 June 1998.<br />
Kesko shares and stock options held<br />
on 1 January <strong>2007</strong>: 10,500 E and<br />
15,000 F stock options.<br />
On 31 December <strong>2007</strong>: 20,000 A,<br />
7,000 E and 12,000 F stock options<br />
Retirement age and benefits:<br />
60 <strong>year</strong>s. Full pension is 66%<br />
of pensionable salary.<br />
Notice period and severance pay:<br />
6 months. A severance pay paid<br />
in addition to the salaries for the<br />
period of notice corresponds to 12<br />
months’ salary.<br />
Corporate Management Board member<br />
since: 1 January <strong>2007</strong>.
Year <strong>2007</strong><br />
Pekka Lahti<br />
b. 1955, M.Sc. (Agr.).<br />
President of VV-Auto Group Oy.<br />
Domicile: Vantaa, Finland.<br />
Other major duties: -<br />
Employment history: employed by<br />
Kesko Corporation since 1981: Vice<br />
President, Kesko Machinery 2000,<br />
Managing Director of Konekesko<br />
since 2001 and President of Kesko<br />
Agro Ltd 2005. Chairman of the<br />
Boards of Kesko Agro Ltd and<br />
Konekesko Ltd since 1 November<br />
2005. President of VV-Auto Group<br />
Oy since 1 February 2006.<br />
Kesko shares and stock options held<br />
on 1 January <strong>2007</strong>: 10,500 E and<br />
24,000 F stock options.<br />
On 31 December <strong>2007</strong>: 20,000 A and<br />
23,500 F stock options.<br />
Retirement age and benefits:<br />
62 <strong>year</strong>s. Full pension is 66%<br />
of pensionable salary.<br />
Notice period and severance pay:<br />
6 months. A severance pay paid<br />
in addition to the salaries for the<br />
period of notice corresponds to 6<br />
months’ salary.<br />
Corporate Management Board<br />
member since: 1 March 2005.<br />
Divisions The Group Financial statements Further information 69<br />
Pekka lahti Riitta laitasalo Arja Talma Paavo Moilanen<br />
Riitta Laitasalo<br />
b. 1955, M.Sc. (Econ.).<br />
Senior Vice President, Human<br />
Resources.<br />
Domicile: Espoo, Finland.<br />
Other major duties: Edita Plc: member<br />
of the Board of Directors, JTO<br />
School of Management: member of<br />
the Board of Directors, the Finnish<br />
Institute for International Trade<br />
Fintra: member of the Board of<br />
Directors.<br />
Employment history: employed by<br />
Kesko Corporation since 1979: Personnel<br />
Director 1995–1997, Vice<br />
President, Accounting and Finance<br />
Division 1997–1998, Vice President,<br />
Finance and Administration Division<br />
1998–1999, Senior Vice President,<br />
Administration 2000–2005.<br />
Senior Vice President, Human<br />
Resources since 30 March 2005.<br />
Kesko shares and stock options held<br />
on 1 January <strong>2007</strong>: 5,000 D, 21,000 E<br />
and 21,000 F stock options.<br />
On 31 December <strong>2007</strong>: 15,000 A, 5,000<br />
E and 21,000 F stock options.<br />
Retirement age and benefits: 60<br />
<strong>year</strong>s. Full pension is 66% of the<br />
pensionable salary.<br />
Notice period and severance pay:<br />
6 months. A severance pay paid<br />
in addition to the salaries for the<br />
period of notice corresponds to 12<br />
months’ salary.<br />
Corporate Management Board<br />
member since: 1 January 2001.<br />
Arja Talma<br />
b. 1962, M.Sc. (Econ.), eMBA.<br />
Senior Vice President, CFO.<br />
Domicile: Helsinki, Finland.<br />
Other major duties: Sponda Plc:<br />
member of the Board of Directors<br />
and Chairman of the Audit Committee,<br />
VR-Group Ltd: member of the<br />
Board of Directors and Chairman of<br />
the Audit Committee.<br />
Employment history: KPMG Wideri<br />
Oy Ab: APA 1992–2001, partner<br />
2000–2001. Oy Radiolinja Ab: Executive<br />
Vice President, Finance and<br />
Administration 2001–2003.<br />
Employed by Kesko Corporation<br />
since 2004: Vice President, Corporate<br />
Controller 2004–2005. Senior<br />
Vice President, CFO since 17 March<br />
2005.<br />
Kesko shares and stock options held<br />
on 1 January <strong>2007</strong>: 9,000 E and<br />
21,000 F stock options.<br />
On 31 December <strong>2007</strong>: 25,000 A stock<br />
options.<br />
Retirement age and benefits: General<br />
retirement age and pensionable<br />
salary based on the Employees’<br />
Pensions Act (TyEL).<br />
Notice period and severance pay:<br />
6 months. A severance pay paid<br />
in addition to the salaries for the<br />
period of notice corresponds to 6<br />
months’ salary.<br />
Corporate Management Board<br />
member since: 17 March 2005.<br />
Paavo Moilanen<br />
b. 1951, Business College Graduate.<br />
Senior Vice President, Corporate<br />
Communications and<br />
Responsibility.<br />
Domicile: Espoo, Finland.<br />
Other major duties: Kaleva Mutual<br />
Insurance Company: Supervisory<br />
Board member<br />
Employment history: employed by<br />
Kesko Corporation since 1974:<br />
Kajaani District Director<br />
1986–1989; Jyväskylä District Director<br />
1989–1991; Seinäjoki District<br />
Director 1991–1995; Director of the<br />
Neighbourhood Store Chain Unit<br />
1995–1996; Director of the Speciality<br />
Goods Division 1996–1997, Vice<br />
President, Builders’ and Agricultural<br />
Supplies Division 1998–2000,<br />
Managing Director of the<br />
K-Retailers’ Association 2000–2005.<br />
Kesko Group: Senior Vice President,<br />
Corporate Communications since<br />
13 October 2005.<br />
Kesko shares and stock options held<br />
on 1 January <strong>2007</strong>: 8,000 E stock<br />
options.<br />
On 31 December <strong>2007</strong>: 500 A shares<br />
and 15,000 A and 1,000 E stock<br />
options.<br />
Retirement age and benefits: Retirement<br />
age 60 <strong>year</strong>s. Full pension is<br />
66% of the pensionable salary.<br />
Notice period and severance pay:<br />
6 months. A severance pay paid<br />
in addition to the salaries for the<br />
period of notice corresponds to 12<br />
months’ salary.<br />
Corporate Management Board<br />
member since: 13 October 2005.
70 <strong>Kesko's</strong> <strong>year</strong> <strong>2007</strong><br />
Financial statements<br />
71 Report by the Board of Directors<br />
80 Proposal for profit distribution<br />
81 Consolidated financial statements (IFRS)<br />
81 Consolidated income statement<br />
82 Consolidated balance sheet<br />
83 Consolidated cash flow statement<br />
84 Consolidated statement of changes in equity<br />
85 Notes to the consolidated financial statements<br />
85 Accounting policies for consolidated financial statements<br />
91 Segment information<br />
94 Acquisitions<br />
95 Discontinued operations and disposal of other assets<br />
96 Notes to the consolidated income statement<br />
99 Notes to the consolidated balance sheet<br />
115 Share-based payments<br />
118 Notes to the cash flow statement<br />
120 Financial risk management<br />
125 Risk management<br />
126 Related party transactions<br />
127 Other notes<br />
128 Financial indicators<br />
131 Share ownership structure<br />
132 Subsidiaries and associates<br />
134 Parent's financial statements (FAS)<br />
134 Parent's income statement<br />
135 Parent's balance sheet<br />
136 Parent's cash flow statement<br />
137 Notes to the parent's financial statements<br />
142 Signatures<br />
142 Audit report
Year <strong>2007</strong><br />
Divisions The Group<br />
Financial<br />
statements<br />
Further information<br />
Report by the Board of Directors<br />
Net sales and profit, continuing operations<br />
Net sales and profit in October-December<br />
The Group’s net sales in October-December <strong>2007</strong> were €2,455 million,<br />
which is 6.5% up on the corresponding period of the previous <strong>year</strong><br />
(€2,304 million). The Group's net sales increased by 4.6% in Finland and<br />
by 13.2% abroad. Excluding business acquisitions and disposals, the<br />
Group's net sales increase was 6.1%. Exports and foreign operations<br />
accounted for 23.3% (21.9%) of net sales.<br />
In October-December, the K-Group’s (i.e. Kesko’s and the chain stores’)<br />
retail sales were €3,125.9 million, an increase of 8.8% on the corresponding<br />
period of the previous <strong>year</strong>.<br />
The Group’s profit before taxes for October-December was €68.9 million<br />
(€31.3 million). The operating profit excluding non-recurring items<br />
was €74.5 million (€71.4 million), representing 3.0% of net sales (3.1%).<br />
Especially Rautakesko improved its profit excluding non-recurring<br />
items. The operating profit was €70.8 million (€37.6 million), decreased<br />
by a net total of €-3.7 million (€-33.8 million) in non-recurring gains and<br />
losses from disposal of fixed assets and businesses, and impairment<br />
charges. The non-recurring items include €4.3 million of costs relating to<br />
the discontinuation of Asko Möbler AB's operations.<br />
The consolidated earnings per share from continuing operations were<br />
€0.41 (€0.21). Equity per share was €19.53 (€17.94).<br />
Net sales and profit in January-December <strong>2007</strong><br />
The Group’s net sales in January-December <strong>2007</strong> were €9,534 million,<br />
which is 9.0% up on the previous <strong>year</strong> (€8,749 million). The Group's net<br />
sales increased by 6.0% in Finland and by 20.4% abroad. Excluding business<br />
acquisitions and disposals, the Group's net sales increase was 8.9%.<br />
Exports and foreign operations accounted for 22.8% (20.7%) of net sales.<br />
In the whole of <strong>2007</strong>, the K-Group’s (i.e. Kesko’s and the chain stores’)<br />
retail sales were €11,575.6 million, an increase of 9.7% on the previous<br />
<strong>year</strong>.<br />
The Group’s profit before taxes for January-December was €369.3 million<br />
(€357.8 million). The Group’s profit before taxes included €37.1 million<br />
in non-recurring gains on the sale of SATO Corporation shares. The<br />
operating profit excluding non-recurring items was €325.1 million<br />
(€279.8 million), up €45.3 million on the previous <strong>year</strong>. Especially Kesko<br />
Food and Rautakesko improved their operating profits excluding nonrecurring<br />
items. The operating profit excluding non-recurring items<br />
represented 3.4% (3.2%) of net sales.<br />
The Group’s operating profit was €331.9 million (€362.6 million).<br />
The operating profit included a net total of €6.8 million (€82.8 million)<br />
in non-recurring gains and losses from disposal of fixed assets and<br />
businesses, and impairment charges. In 2006, the gains from disposal<br />
of fixed assets included €99.3 million received by Kesko from selling<br />
its retail store properties to Niam Retail Holding Finland AB.<br />
The consolidated earnings per share from continuing operations were<br />
€2.61 (€2.45). Equity per share was €19.53 (€17.94).<br />
Investments<br />
The Group’s investments in October-December totalled €69.9 million<br />
(€88.0 million), which is 2.8% (3.8%) of net sales. Investments in retail<br />
store sites amounted to €62.1 million (€71.4 million). Investments in<br />
acquisitions were €0.9 million (€6.9 million) of total investments. The<br />
Group’s other investments were €6.8 million. Investments in foreign<br />
operations represented 24.3% of total investments.<br />
The Group’s investments in January-December totalled €233.9 million<br />
(€250.5 million), which is 2.5% (2.9%) of net sales. Investments in retail<br />
store sites amounted to €189.0 million (€186.6 million). Investments in<br />
acquisitions were €6.0 million (€16.2 million) of total investments. The<br />
Group’s other investments were €38.9 million. Investments in foreign<br />
operations represented 24.1% of total investments.<br />
71<br />
Finance<br />
In October-December, the cash flow from operating activities was €70.2<br />
million (€118.5 million) and the cash flow from investing activities was<br />
€-71.0 million (€146.9 million). The latter included €5 million in proceeds<br />
received from the disposal of fixed assets.<br />
In January-December, the cash flow from operating activities was<br />
€248.4 million (€327.9 million) and the total cash flow from investing<br />
activities was €-84.7 million (€202.7 million). The latter included €50<br />
million received from the disposal of food store properties in the Baltic<br />
countries, and €46 million from selling SATO Corporation shares. The<br />
comparable cash flow from investing activities was increased by the over<br />
€200 million amount received in March 2006 from selling real estate,<br />
and the €190 million amount received in December 2006 from the sale of<br />
Rimi Baltic AB shares.<br />
At the end of the period, liquid funds totalled €351 million (€398 million).<br />
The amount was affected by the disposal of food store properties in<br />
the Baltic countries and the disposal of SATO Corporation shares mentioned<br />
above. Interest-bearing net debt was €275 million (€212 million).<br />
At the end of the period, equity ratio was 48.5% (47.0%) and gearing<br />
14.0% (11.9%).<br />
In October-December, the Group’s net financial expenses were €1.9<br />
million (€5.9 million). In January-December, the Group's net financial<br />
income was €37.0 million (€-5.5 million). They were increased by the<br />
€37.1 million non-recurring gain on the sale of SATO shares and interest<br />
income from liquid funds, and decreased by the costs of currency risk<br />
hedging.<br />
Taxes<br />
In October-December, the Group’s taxes were €21.4 million (€8.4 million).<br />
The effective tax rate was 31.1% (26.8%). In January-December, the<br />
Group’s income taxes were €90.2 million (€107.1 million), corresponding<br />
to an effective tax rate of 24.4% (29.9%).<br />
The taxes for October-December include €5.8 million relating to Rautakesko<br />
Ltd's fiscal <strong>year</strong> 2001 in consequence of the Helsinki Administrative<br />
Court's decision. The taxes for January-December 2006 included<br />
taxes from prior periods to the amount of €24.5 million. Rautakesko Ltd<br />
and Kesko Corporation apply for leave to appeal against the Administrative<br />
Court's decisions from the Supreme Administrative Court.<br />
Discontinued operations<br />
The sale to Rimi Baltic AB of food store properties that had been leased<br />
to it was concluded in January. The gain on the disposal was €28.2<br />
million.<br />
Seasonal nature of operations<br />
The Group’s operating activities are affected by seasonal fluctuations.<br />
The net sales and operating profits of its business segments are not<br />
earned evenly throughout the <strong>year</strong>. Instead they vary by quarter depending<br />
on the characteristics of each business segment.
72 <strong>Kesko's</strong> <strong>year</strong> <strong>2007</strong><br />
Personnel<br />
In October-December, the average number of personnel in the Kesko<br />
Group was 22,023 (23,534) converted into full-time employees. There was<br />
a decrease of 1,511 employees compared with the corresponding period of<br />
the previous <strong>year</strong>. In Finland, the average decrease was 68 employees,<br />
while outside Finland it was 1,443.<br />
In January-December, the average number of personnel in the Kesko<br />
Group was 21,180 (23,767) converted into full-time employees. There was<br />
a decrease of 2,587 employees compared with the corresponding period<br />
of the previous <strong>year</strong>. In Finland, the average decrease was 244 employees,<br />
while outside Finland it was 2,343. The number of personnel mainly<br />
decreased as a result of the disposal of the joint venture Rimi Baltic AB<br />
in December 2006.<br />
At the end of December <strong>2007</strong>, the total number of personnel was<br />
25,890 (23,755), of whom 14,192 (14,149) worked in Finland and 11,698<br />
(9,606) in other countries. Compared with the end of December 2006,<br />
there was an increase of 43 employees in Finland and 2,092 in other<br />
countries.<br />
Market review<br />
In <strong>2007</strong>, the Finnish economy continued its strong growth at a rate of<br />
about 4.0%. Towards the end of the <strong>year</strong>, however, the growth slowed<br />
down. In Finland, the strong growth of private consumption continued. It<br />
is forecast that the growth rate of the Finnish economy will decelerate in<br />
2008 compared with <strong>2007</strong>, mainly as a result of weakening export<br />
demand. The worsened outlook for the US economy will affect the growth<br />
of the whole euro zone economy. In Finland, private consumption is forecast<br />
to grow by some 3% and investments by about 3.6%. The increase in<br />
consumer prices is forecast to reach 2.7%. Housing production is<br />
expected to shrink during this <strong>year</strong> (Nordea).<br />
According to the preliminary data of Statistics Finland, in January-<br />
November <strong>2007</strong>, the volume of Finnish retail trade increased by 8.0%<br />
compared with the corresponding period of the previous <strong>year</strong>. The<br />
increase in the wholesale trade volume was 12% in the same period.<br />
According to Statistics Finland’s consumer survey of January 2008,<br />
consumers' confidence in the economy has been waning steadily since<br />
summer <strong>2007</strong>, and Finland's economic growth is estimated to slow down<br />
further in the near future. Consumers also anticipate that inflation will<br />
clearly speed up over the next 12 months. Consumers' views concerning<br />
their saving possibilities continue to be bright, although in other<br />
respects their views concerning their own finances are more cautious<br />
than before. Buying durable goods was considered particularly cost-effective<br />
in January.<br />
In 2008, the Estonian economy is forecast to grow by 4.0%, the<br />
Latvian economy by 5.6% and the Lithuanian economy by 7.4%. Private<br />
consumption is estimated to grow by about 6.0% in Estonia, by 7.0% in<br />
Latvia and by 14.0% in Lithuania. Consumer prices are forecast to rise by<br />
7.9% in Estonia, by 12.0% in Latvia and by 7.0% in Lithuania (Nordea).<br />
The Swedish economy is forecast to grow by 2.1% and private consumption<br />
by 2.7% in 2008. Consumer prices are expected to increase at a<br />
rate of 3.2% (Nordea). The increase in investments is forecast to slow<br />
down and that of housing construction to level off (Nordea).<br />
The Norwegian economy is forecast to grow by 2.9% and private consumption<br />
by 3.0% in 2008. Consumer prices are expected to increase by<br />
about 3.3% (Nordea).<br />
The Russian economy is forecast to grow by 7.0% in 2008. Private<br />
consumption is estimated to increase by 10% and investments by 21%.<br />
Consumer prices are expected to increase by 12% (Nordea).<br />
The market and outlook for each of <strong>Kesko's</strong> business divisions are<br />
discussed in the division reviews of this financial statements release.<br />
Divisions<br />
Kesko Food<br />
In October-December, Kesko Food's net sales totalled €1,046 million, up<br />
7.7%. In January-December, the net sales were €3,871 million, an increase<br />
of 7.1%.<br />
In October-December, Kesko Food’s operating profit excluding nonrecurring<br />
items was €39.8 million (3.8% of net sales), up by €2.8 million<br />
and relatively at the same level as in the previous <strong>year</strong>. Kesko Food’s operating<br />
profit was €40.0 million (€36.9 million).<br />
In January-December, Kesko Food’s operating profit excluding nonrecurring<br />
items was €151.4 million (3.9% of net sales), i.e. €22.8 million,<br />
or 0.4 percentage points, more than in the previous <strong>year</strong>. The operating<br />
profit increased as a result of good retail sales growth and improved cost<br />
efficiency. The operating profit was €151.3 million (€173.2 million). The<br />
comparable operating profit was increased by non-recurring gains on the<br />
disposal of real estate and businesses.<br />
In October-December, Kesko Food's investments totalled €37.8 million<br />
(€36.4 million), of which investments in retail store sites were €36.7<br />
Net sales by division, continuing operations<br />
€ million <strong>2007</strong> 2006 change, %<br />
Kesko Food, Finland 3,854 3,597 7.1<br />
Kesko Food, other countries* 17 17 -3.1<br />
Kesko Food, total 3,871 3,615 7.1<br />
Rautakesko, Finland 909 821 10.7<br />
Rautakesko, other countries* 1,628 1,308 24.5<br />
Rautakesko, total 2,537 2,129 19.2<br />
VV-Auto, Finland 779 769 1.3<br />
VV-Auto, other countries* 26 20 27.1<br />
VV-Auto, total 805 789 2.0<br />
Anttila, Finland 544 527 3.1<br />
Anttila, other countries* 20 20 -2.3<br />
Anttila, total 564 548 2.9<br />
Kesko Agro, Finland 499 482 3.5<br />
Kesko Agro, other countries* 295 273 7.9<br />
Kesko Agro, total 793 755 5.1<br />
Other operating activities, Finland 806 776 3.8<br />
Other operating activities, other<br />
countries* 192 170 12.9<br />
Other operating activities, total<br />
Common operations and<br />
997 946 5.4<br />
eliminations -34 -32 5.7<br />
Finland, total 7,357 6,941 6.0<br />
Other countries, total* 2,177 1,808 20.4<br />
Group, total 9,534 8,749 9.0<br />
*Export and net sales in other countries than Finland.
Year <strong>2007</strong><br />
Divisions The Group<br />
Financial<br />
statements<br />
Further information<br />
million (€34.6 million). In January-December, investments totalled €117.6<br />
million (€82.2 million), of which investments in retail store sites were<br />
€104.8 million (€74.2 million).<br />
In October-December, the retail sales of the K-food stores increased by<br />
10.8%, totalling €1,387 million (incl. VAT). In January-December, the<br />
retail sales increased by 7.4% to €5,046 million (incl. VAT). At the end of<br />
December, there were a total of 1,070 K-food stores.<br />
Kesko Food continued the intensive development of the K-food store<br />
network. In October-December, a K-citymarket was opened in Kerava,<br />
K-supermarkets in downtown Lahti and Mikkeli, in Muhos and Kiiminki,<br />
and K-markets in Aurinkolahti, Helsinki, in downtown Kuopio, in Aittaranta,<br />
Joensuu, in the rural municipality of Jyväskylä, in Mouhijärvi and<br />
Ii. The K-citymarket in Rauma was reopened after extension. Other renovations<br />
and extensions were also implemented.<br />
The most important store sites being built are K-citymarkets in<br />
Päiväranta, Kuopio, in Pori, Tornio, Jämsä, Klaukkala, Ylöjärvi, and in the<br />
Skanssi shopping centre in Turku, as well as the transformation of a<br />
K-supermarket into a K-citymarket in Rusko, Oulu, and K-supermarkets<br />
being built in Hämeenlinna and Hämeenkyrö, in the Anttila shopping<br />
Operating profit by division, continuing operations<br />
€ million <strong>2007</strong> 2006 change<br />
Kesko Food 151.3 173.2 -21.9<br />
Rautakesko 117.8 139.3 -21.5<br />
VV-Auto 26.1 29.4 -3.4<br />
Anttila 27.2 38.7 -11.5<br />
Kesko Agro 12.9 9.2 3.7<br />
Other operating activities 21.2 4.9 16.2<br />
Common operations and<br />
eliminations -24.5 -32.1 7.7<br />
Group's operating profit 331.9 362.6 -30.8<br />
Net financial income and expenses 37.0 -5.5 42.5<br />
Associates 0.4 0.7 -0.2<br />
Profit before taxes 369.3 357.8 11.5<br />
Group indicators by quarter<br />
73<br />
centre in Joensuu, in Kuninkoja, Raisio, in Mustasaari, Alavus, Haukipudas,<br />
Viitasaari, Rauma and Konala, Helsinki.<br />
The growth rate of the total grocery trade market in Finland for January-December<br />
is estimated at about 5% up on the previous <strong>year</strong>. Prices<br />
increased at an average monthly rate of about 2% compared with the previous<br />
<strong>year</strong> (Statistics Finland).<br />
Kesko Food’s net sales are expected to grow in 2008. Owing to major<br />
investments in store sites and information systems, Kesko Food's operating<br />
profit excluding non-recurring items in 2008 is expected to match<br />
the level of <strong>2007</strong>.<br />
Rautakesko<br />
In October-December, Rautakesko’s net sales amounted to €622.3 million,<br />
an increase of 15.1%. The contribution of acquisitions excluded, the<br />
net sales growth was 12.3%. Net sales in Finland were €195.4 million, an<br />
increase of 7.1%. The net sales of foreign subsidiaries were €426.1 million,<br />
up 19.1%. Foreign subsidiaries contributed 68.5% to Rautakesko’s<br />
net sales.<br />
Operating profit excl. non-recurring items by division,<br />
continuing operations<br />
€ million <strong>2007</strong> 2006 change<br />
Kesko Food 151.4 128.6 22.8<br />
Rautakesko 115.9 91.2 24.8<br />
VV-Auto 26.1 29.5 -3.4<br />
Anttila 25.2 26.5 -1.2<br />
Kesko Agro 12.4 7.8 4.6<br />
Other operating activities 24.0 21.6 2.4<br />
Common operations and<br />
eliminations -29.9 -25.3 -4.6<br />
Total 325.1 279.8 45.3<br />
10–12/2006 1–3/<strong>2007</strong> 4–6/<strong>2007</strong> 7–9/<strong>2007</strong> 10–12/<strong>2007</strong><br />
Net sales, € million* 2,304 2,193 2,464 2,421 2,455<br />
Change in net sales, %* 8.2 11.3 8.2 10.2 6.5<br />
Operating profit, € million* 37.6 62.4 103.2 95.4 70.8<br />
Operating profit, %* 1.6 2.8 4.2 3.9 2.9<br />
Operating profit excl. non-recurring items, € million* 71.4 59.8 96.8 94.0 74.5<br />
Operating profit excl. non-recurring items, %* 3.1 2.7 3.9 3.9 3.0<br />
Financial income/expenses, € million* -5.9 37.9 -1.7 2.8 -1.9<br />
Profit before tax, € million* 31 101 101 98 69<br />
Profit before tax, %* 1.4 4.6 4.1 4.1 2.8<br />
Return on invested capital, % 30.4 23.5 18.6 17.4 12.4<br />
Return on equity, % 36.4 24.4 17.3 16.2 9.8<br />
Equity ratio, % 47.0 44.6 46.5 47.4 48.5<br />
Investments, € million* 88.0 51.6 62.8 49.6 69.9<br />
Earnings per share, €* 0.21 0.77 0.72 0.70 0.41<br />
Equity per share, € 17.94 17.52 18.32 19.08 19.53<br />
*continuing operations
74 <strong>Kesko's</strong> <strong>year</strong> <strong>2007</strong><br />
In Sweden, the net sales of K-rauta AB increased by 10.2% to €42.3<br />
million in October-December. In Estonia, Rautakesko's net sales were up<br />
by 11.9% to €21.8 million. In Lithuania, the net sales of UAB Senuku<br />
Prekybos Centras (Senukai), in which Rautakesko has a majority interest,<br />
increased by 35.6% to €139.9 million, of which the contribution of the<br />
Belorussian OOO OMA, acquired by Senukai in July, was €15.4 million. In<br />
Latvia, Rautakesko's net sales increased by 13.3% to €21.4 million. In Russia,<br />
Stroymaster's net sales grew by 32.8% to €42.3 million. In Norway,<br />
Byggmakker's net sales grew by 8.2% and were €155.4 million.<br />
In January-December, Rautakesko’s net sales amounted to €2,537.3<br />
million, an increase of 19.2%. The contribution of acquisitions excluded,<br />
the net sales growth was 17.7%. Net sales in Finland were €909.3 million,<br />
an increase of 10.7%. The net sales of foreign subsidiaries were €1,625.0<br />
million, up 24.4%. Foreign subsidiaries contributed 64.0% to Rautakesko’s<br />
net sales.<br />
Divisions’ net sales by quarter, continuing operations<br />
In Sweden, in January-December, the net sales increased by 19.3% to<br />
€184.3 million. In Estonia, the net sales were up by 24.7% to €92.1 million.<br />
The net sales of Senukai, operating in Lithuania, increased by 34.9%<br />
to €485.8 million, of which the contribution of its Belorussian subsidiary,<br />
OOO OMA, was €32.3 million. In Latvia, the net sales increased by<br />
40.0% to €84.8 million. In Russia, Stroymaster’s net sales grew by 47.4%<br />
to €150.6 million. In Norway, the net sales grew by 12.9% and were €617.7<br />
million.<br />
In October-December, Rautakesko’s operating profit excluding nonrecurring<br />
items was €21.9 million (3.5% of net sales), i.e. €5.4 million, or<br />
0.5 percentage points more than in the previous <strong>year</strong>. Rautakesko’s operating<br />
profit for October-December was €22.1 million (€16.5 million). During<br />
the review period, one store was opened in St. Petersburg.<br />
In January-December, Rautakesko’s operating profit excluding nonrecurring<br />
items was €115.9 million (4.6% of net sales), i.e. €24.8 million,<br />
€ million 10–12/2006 1–3/<strong>2007</strong> 4–6/<strong>2007</strong> 7–9/<strong>2007</strong> 10–12/<strong>2007</strong><br />
Kesko Food 971 883 983 959 1,046<br />
Rautakesko 541 534 687 694 622<br />
VV-Auto 152 248 218 195 144<br />
Anttila 185 120 111 143 189<br />
Kesko Agro 206 168 216 196 213<br />
Other operating activities 257 248 259 243 248<br />
Common operations and eliminations -7 -7 -9 -9 -8<br />
Group's net sales 2,304 2,193 2,464 2,421 2,455<br />
Divisions’ operating profits by quarter, including non-recurring items<br />
€ million 10–12/2006 1–3/<strong>2007</strong> 4–6/<strong>2007</strong> 7–9/<strong>2007</strong> 10–12/<strong>2007</strong><br />
Kesko Food 36.9 29.2 40.9 41.2 40.0<br />
Rautakesko 16.5 18.6 37.6 39.5 22.1<br />
VV-Auto 1.5 11.7 8.1 6.8 -0.5<br />
Anttila 21.4 -0.9 0.1 6.3 21.6<br />
Kesko Agro 0.3 -0.6 7.9 3.5 2.1<br />
Other operating activities -17.4 10.7 10.1 5.3 -4.9<br />
Common operations -21.6 -6.1 -1.6 -7.3 -9.5<br />
Group's operating profit 37.6 62.4 103.2 95.4 70.8<br />
Divisions’ operating profits excl. non-recurring items by quarter, continuing operations<br />
€ million 10–12/2006 1–3/<strong>2007</strong> 4–6/<strong>2007</strong> 7–9/<strong>2007</strong> 10–12/<strong>2007</strong><br />
Kesko Food 37.0 29.0 41.4 41.1 39.8<br />
Rautakesko 16.5 16.3 38.7 39.0 21.9<br />
VV-Auto 1.5 11.7 8.1 6.8 -0.5<br />
Anttila 21.4 -0.9 -1.8 6.3 21.6<br />
Kesko Agro 0.3 -0.6 7.9 3.0 2.1<br />
Other operating activities 2.7 10.6 9.9 5.3 -1.9<br />
Common operations -8.0 -6.3 -7.5 -7.6 -8.5<br />
Group's operating profit 71.4 59.8 96.8 94.0 74.5
Year <strong>2007</strong><br />
Divisions The Group<br />
Financial<br />
statements<br />
Further information<br />
or 0.3 percentage points, more than in the corresponding period of the<br />
previous <strong>year</strong>. The operating profit excluding non-recurring items<br />
increased due to good sales growth and regardless of the fact that a total<br />
of 16 new stores, of which 11 abroad, were opened in January-December.<br />
Rautakesko’s operating profit for January-December was €117.8 million<br />
(€139.3 million). During the comparable period, the operating profit was<br />
increased by non-recurring gains on disposal of real estate.<br />
In October-December, Rautakesko’s investments totalled €21.2 million<br />
(€31.1 million), of which 75.5% (74.9%) was abroad. In January-<br />
December, the investments were €77.0 million (€75.8 million), of which<br />
59.3% (65.4%) was abroad.<br />
At the end of December, the K-rauta chain in Finland comprised 41<br />
stores and the Rautia chain 104 stores. In October-December, the sales<br />
of the K-Group’s building and home improvement stores in Finland<br />
increased by 5.2% to €277.6 million (incl. VAT). The sales of the Rautakesko<br />
B-to-B Service increased by 5.1%. In January-December, the sales of<br />
the K-Group’s building and home improvement stores in Finland<br />
increased by 8.8% to €1,199.8 million (incl. VAT). The sales of the<br />
Rautakesko B-to-B Service increased by 15.9%.<br />
Rautakesko operates 17 K-rauta stores in Sweden, one of which is<br />
owned by the retailer. The latest K-rauta was opened in Växjö in April.<br />
A new K-rauta was opened in Gävle in August <strong>2007</strong> to replace the outlet<br />
destroyed in a fire in August 2006. In Estonia, Rautakesko has five<br />
K-rauta stores, the latest of which opened in Tallinn in March. In Latvia,<br />
Rautakesko has seven stores of its own and two partner stores. A new<br />
K-rauta was opened in Tukums in June and another in Daugavpils in<br />
September.<br />
In Lithuania, UAB Senuku Prekybos Centras (Senukai) operates 14<br />
Senukai stores and 76 Partnershops. On 12 July <strong>2007</strong>, Senukai signed an<br />
agreement to acquire an approximately 21% ownership interest in the<br />
Lithuanian UAB Romos Holdingas, the owner of 99.99% of the shares of<br />
the Belorussian DIY operator, OOO OMA. According to the vote transfer<br />
agreement included in the deal, Senukai has the majority of voting rights<br />
in Romos Holdingas. The total price of the acquisition is €4 million, of<br />
which €2 million was paid for the ownership interest acquired in <strong>2007</strong>.<br />
According to the terms and conditions of the deed, the buyer has the<br />
right to cancel the transaction if the terms and conditions are not<br />
fulfilled.<br />
In Norway, Rautakesko owns Byggmakker Norge AS, a company managing<br />
the Byggmakker chain of building and home improvement stores.<br />
The chain comprises 120 stores, 22 of which are owned by Byggmakker.<br />
The other stores of the chain are owned by retailer-entrepreneurs who<br />
have signed a chain agreement with Byggmakker. Byggmakker Norge AS<br />
opened a new Byggmakker store in Oslo in March and another in Haugesund<br />
in September. There are eight K-rauta stores in St. Petersburg, Russia,<br />
three of which are new and operate in conformity with the K-rauta<br />
concept. The latest K-rauta in St. Petersburg opened in December.<br />
The building and home improvement trade market is anticipated to<br />
grow in all countries in which Rautakesko operates. In 2008, a growth<br />
rate of about 3–5% is forecast for the Nordic countries and 5–7% for the<br />
Baltic countries. The growth forecast for the St. Petersburg area is about<br />
10%. (Own estimate)<br />
In 2008, Rautakesko will continue to invest in new store sites,<br />
employee competencies and a uniform information system. It is expected<br />
that Rautakesko's net sales will grow in 2008. Its operating profit excluding<br />
non-recurring items is expected to grow slightly in 2008.<br />
75<br />
VV-Auto<br />
In October-December, VV-Auto's net sales totalled €143.7 million, down by<br />
5.3%. The net sales trend was significantly affected by the change in the<br />
car tax, announced by the Finnish government on 2 November <strong>2007</strong>. In<br />
January-December, VV-Auto's net sales totalled €804.8 million, up 2.0%.<br />
The new Volkswagen and Audi retail businesses acquired by VV-Auto at<br />
the beginning of March 2006 contributed 0.6 percentage points to the<br />
growth of VV-Auto's net sales in January-December.<br />
In October-December, the operating profit excluding non-recurring<br />
items was €-0.5 million (-0.4% of net sales), down €2.1 million, or 1.4 percentage<br />
points, compared with the corresponding period of the previous<br />
<strong>year</strong>. The operating profit excluding non-recurring items was negatively<br />
affected by the amendment of the Car Tax Act, which postponed sales to<br />
2008 and caused an impairment charge of €3.6 million to be recognised<br />
for the total of all vehicles. In January-December, the operating profit was<br />
€26.1 million (3.2% of net sales), down €3.4 million, or 0.5 percentage<br />
points, compared with the corresponding period of the previous <strong>year</strong>.<br />
Investments totalled €1.3 million (€4.6 million) in October-December.<br />
In January-December, investments were €6.3 million (€34.2 million).<br />
In January-December, first registrations of new passenger cars<br />
totalled 125,608 in Finland, down by 13.8% on the previous <strong>year</strong>. Compared<br />
with the previous <strong>year</strong>, first registrations of vans were up by 10.6%<br />
to 16,885. During the first months of the <strong>year</strong>, the sale of new cars was<br />
constrained by the car tax debate, the fall of used car prices and a rise in<br />
interest rates. The amendment of car tax legislation announced by the<br />
government nearly stopped passenger car sales in November-December<br />
and postponed a significant number of car deliveries to customers to<br />
2008. In October-December, the first registrations of passenger cars<br />
dropped by 34.6% compared with the previous <strong>year</strong>.<br />
In October-December, VV-Auto's retail sales volume decreased by<br />
8.0% in consequence of the new Car Tax Act. In January-December, the<br />
retail sales grew by 7.6% compared with the corresponding period of the<br />
previous <strong>year</strong>. The growth is mainly attributable to the business acquisition<br />
completed in March 2006.<br />
In January-December, the registrations of Volkswagen passenger cars<br />
totalled 12,772 and their market share was 10.2%, compared with 10.3% in<br />
the previous <strong>year</strong>. The number of Volkswagen vans registered was 3,042,<br />
while the market share was 18.0% (17.0%). In January-December, the first<br />
registrations of Audis were 4,161, and the market share was 3.3% (3.3%).<br />
The registrations of new Seat passenger cars totalled 1,497 in Finland,<br />
697 in Estonia and 261 in Latvia. The market share in Finland was 1.2%,<br />
compared with 0.8% in the previous <strong>year</strong>.<br />
It is estimated that Finland’s total market for passenger cars will<br />
grow compared with <strong>2007</strong>. The total market for vans is expected to<br />
decrease slightly compared with the previous <strong>year</strong> (Road Transport Forecasting<br />
Group).<br />
In 2008, VV-Auto’s net sales and the operating profit excluding nonrecurring<br />
items are expected to markedly exceed the previous <strong>year</strong>’s<br />
level.<br />
Anttila<br />
In October-December, Anttila's net sales totalled €189.5 million, up 2.7%<br />
(€4.9 million). The net sales for the whole <strong>year</strong> were €563.7 million, an<br />
increase of 2.9%. Anttila's sales growth and result for <strong>2007</strong> were affected<br />
by the closing down of the City department store in Helsinki due to the<br />
expiry of the lease in January.
76 <strong>Kesko's</strong> <strong>year</strong> <strong>2007</strong><br />
In October-December, Anttila’s operating profit excluding non-recurring<br />
items was €21.6 million (11.4% of net sales), showing an increase of<br />
€0.2 million, but a relative decrease of 0.2 percentage points, on the corresponding<br />
period of the previous <strong>year</strong>. Anttila’s operating profit was<br />
€21.6 million (€21.4 million).<br />
In January-December, the operating profit excluding non-recurring<br />
items was €25.2 million (4.5% of net sales), showing a decrease of €1.2<br />
million, or 0.4 percentage points, on the corresponding period of the previous<br />
<strong>year</strong>. Anttila’s operating profit was €27.2 million (€38.7 million).<br />
Non-recurring items included €1.9 million in gains on the disposal of real<br />
estate. In the corresponding period of the previous <strong>year</strong>, the gains on the<br />
disposal of real estate were €12.2 million.<br />
In January-December, the retail sales of the Anttila department stores<br />
were €397.9 million, up 1.7%, which was affected by the closing down of<br />
the City department store in Helsinki in January and the opening of the<br />
department store in Mikkeli in October. The retail sales of the Kodin<br />
Ykkönen department stores for home goods and interior decoration were<br />
€183.7 million, up 6.7%. Distance retail sales in Finland were €88.9 million,<br />
up 5.5%. In line with strategy, the number of illustrated catalogues<br />
in distance sales was reduced while concentrating on the development of<br />
online sales. Online sales increased by 22.1%, with the biggest growth in<br />
home electronics and information technology.<br />
Trends in the home and speciality goods sales vary by product line.<br />
The growth is forecast to average 3–5% in 2008 (own estimate).<br />
In 2008, Anttila’s net sales are expected to grow, and its operating<br />
profit excluding non-recurring items is expected to match the level of<br />
<strong>2007</strong>.<br />
Kesko Agro<br />
In October-December, Kesko Agro's net sales were €212.9 million, an<br />
increase of 3.5%. The net sales from foreign operations were €82.9 million,<br />
accounting for 38.9% of net sales.<br />
In October-December, Kesko Agro’s net sales in Finland were €130.0<br />
million, up 7.4%, which is attributable to the positive trend in the grain<br />
and tractor trade. In October-December, the net sales from foreign operations<br />
dropped by 2.0%, which is due to the discontinuation of the grain,<br />
animal feed and chemicals trade in Lithuania.<br />
In January-December, Kesko Agro's net sales were €793.4 million, an<br />
increase of 5.1%. The net sales from foreign operations were €294.6 million,<br />
accounting for 37.1% of net sales.<br />
In January-December, Kesko Agro’s net sales in Finland were €498.7<br />
million, up 3.5%, which is mostly attributable to the successful grain<br />
trade. The net sales from foreign operations increased by 7.9% in January-December,<br />
which is in line with the trend in the agricultural and<br />
earthwork machinery trade.<br />
In October-December, Kesko Agro’s operating profit excluding nonrecurring<br />
items was €2.1 million (1.0% of net sales), i.e. €1.8 million, or<br />
0.9 percentage points, bigger than in the corresponding period of the<br />
previous <strong>year</strong>.<br />
In January-December, the operating profit excluding non-recurring<br />
items was €12.4 million (1.6% of net sales), which was €4.6 million, or 0.5<br />
percentage points bigger than in the corresponding period of the previous<br />
<strong>year</strong>. The operating profit, non-recurring items excluded, was<br />
affected by sales growth, and cost savings in Finland. In January-December,<br />
Kesko Agro’s operating profit was €12.9 million (€9.2 million), positively<br />
affected by the €0.5 million (€0.8 million) non-recurring gain on<br />
the disposal of business.<br />
In October-December, investments totalled €0.9 million, 21.2% of<br />
which were in projects abroad. In January-December, investments<br />
totalled €7.6 million, 67.1% of which were in projects abroad.<br />
At the end of the period under review, the K-maatalous chain comprised<br />
95 agricultural stores in Finland. The sales of the K-maatalous<br />
chain increased by 19.7% in October-December to €192 million (incl. VAT).<br />
In January-December, the sales increased by 12.0% to €674 million. Kesko<br />
Agro has six stores in Estonia, four in Latvia and three in Lithuania.<br />
It is estimated that in 2008, Finland’s total agricultural trade market<br />
will increase slightly on the previous <strong>year</strong>. The total Baltic market is<br />
anticipated to grow by about 5–10% (own estimate).<br />
In <strong>2007</strong>, Kesko Agro discontinued its grain, animal feed and chemicals<br />
trade in Lithuania because of its poor profitability. With the company<br />
concentrating on the machinery trade in Lithuania, the profitability<br />
of the business is expected to improve.<br />
Regardless of the structural changes taking place in the sector, it is<br />
expected that in 2008, Kesko Agro's net sales and operating profit<br />
excluding non-recurring items will match the level of <strong>2007</strong>.<br />
Other operating activities<br />
Other operating activities comprise the reporting for Konekesko, Intersport<br />
Finland, Indoor, Musta Pörssi, Kenkäkesko, Tähti Optikko and<br />
Kauko-Telko.<br />
In October-December, the aggregate net sales from other operating<br />
activities were €247.9 million, down 3.7%. Net sales from foreign operations<br />
were €48.3 million, contributing 19.5% to the net sales.<br />
In January-December, the net sales were €997.3 million, up 5.4%. Net<br />
sales from foreign operations were €191.7 million, contributing 19.2% to<br />
the net sales.<br />
In October-December, the aggregate operating profit from other operating<br />
activities, non-recurring items excluded, was €-1.9 million (-0.8% of<br />
net sales), which was down by €4.6 million, or 1.8 percentage points, on<br />
the corresponding period of the previous <strong>year</strong>. The decline in operating<br />
profit excluding non-recurring items is mainly attributable to the weakened<br />
profitability of the furniture trade. The operating profit from other<br />
operating activities was €-4.9 million (€-17.4 million) and includes €4.3<br />
million in costs relating to the discontinuation of Asko Möbler AB. The<br />
operating profit of the comparable period was negatively affected by<br />
€30.3 million in impairment charges for intangible rights relating to<br />
Indoor Group Ltd.<br />
In January-December, the operating profit excluding non-recurring<br />
items was €24.0 million (2.4% of net sales), which was €2.4 million, or 0.1<br />
percentage points bigger than in the corresponding period of the previous<br />
<strong>year</strong>. The operating profit was €21.2 million (€4.9 million). The operating<br />
profit was improved by the €0.4 million non-recurring gain on the<br />
disposal of fixed assets. The operating profit for the comparable period<br />
included €3.7 million in non-recurring gains on the disposal of businesses<br />
and fixed assets.<br />
In October-December, investments totalled €5.7 million. In January-<br />
December, investments were €14.6 million.<br />
Konekesko's net sales in October-December were €42.8 million (€46.4<br />
million), a decrease of 7.7% on the previous <strong>year</strong>. In Finland, sales were<br />
€36.1 million, down by 7.2% in October-December. Konekesko’s export<br />
sales totalled €6.7 million, a decrease of 10.0%. In January-December, the<br />
net sales were €229.3 million (€200.7 million), an increase of 14.3%. In<br />
Finland, sales were €193.5 million, up by 13.2% in January-December.<br />
Konekesko’s export sales totalled €35.8 million, an increase of 20.5%.
Year <strong>2007</strong><br />
Divisions The Group<br />
Financial<br />
statements<br />
Further information<br />
Intersport Finland's net sales in October-December were €41 million<br />
(€43 million), down 3.7%. The net sales in January-December were €147<br />
million, (€142 million), an increase of 3.4%.<br />
Indoor's net sales in October-December were €50.6 million (€50.8 million),<br />
down 0.5%. In October-December, the aggregate net sales of the<br />
furniture trade in the Baltic countries and Sweden were €12.2 million, a<br />
decrease of 1.2%. In January-December, the net sales were €196.5 million<br />
(€182.2 million), up 7.9%. In January-December, the aggregate net sales of<br />
the furniture trade in the Baltic countries and Sweden were €51.2 million,<br />
an increase of 28.3%. In <strong>2007</strong>, Indoor's profitability weakened significantly<br />
because of the unprofitability of the business in Sweden. A decision<br />
has been made to discontinue Indoor's operatings in Sweden during<br />
the spring of 2008.<br />
Musta Pörssi Ltd's net sales in October-December were €41.8 million<br />
(€43.6 million), down 4.2%. In January-December, the net sales were<br />
€147.5 million (€132.0 million), up 11.8%.<br />
Kenkäkesko Ltd's (former WellStep Ltd) net sales in October-December<br />
were €5 million (€5 million), an increase of 14.3%. In January-December,<br />
the net sales dropped by 3.4% to €23 million (€24 million).<br />
Tähti Optikko's net sales in October-December were €4.8 million (€4.5<br />
million), up 7.6%. In January-December, the net sales were €20.8 million<br />
(€19.4 million), an increase of 7.3%.<br />
Kauko-Telko’s net sales in October-December were €62 million (€65<br />
million), down 5%. In October-December, foreign operations contributed<br />
€30 million, or 46%, to the net sales. In January-December, the net sales<br />
were €234 million (€248 million), down by 5.8% from the previous <strong>year</strong>.<br />
In January-December, foreign operations contributed €113 million, or<br />
48%, to the net sales. Kauko-Telko's profitability improved.<br />
In May, Kesko announced that it would look into opportunities to sell<br />
Kauko-Telko (stock exchange release on 23 May <strong>2007</strong>). Kauko-Telko will<br />
be classified as a discontinuing operation in compliance with the IFRS 5<br />
when it meets the criteria of the standard.<br />
It is expected that in 2008, the net sales of other operating activities<br />
will increase somewhat. The operating profit excluding non-recurring<br />
items is expected to grow mainly as a result of the discontinuation of<br />
Indoor's loss-making business in Sweden.<br />
Changes in Group structure<br />
No significant changes took place in the Group structure during the<br />
period under review.<br />
Decisions of the Annual General Meeting<br />
Kesko Corporation’s Annual General Meeting held on 26 March <strong>2007</strong><br />
adopted the financial statements for 2006 and discharged the members<br />
of the Board of Directors and the Managing Director from liability. The<br />
Annual General Meeting also decided to distribute a dividend of €1.50<br />
per share, as proposed by the Board of Directors, or total dividends of<br />
€146,314,669.50.<br />
The Annual General Meeting decided to leave the number of Board<br />
members unchanged at seven. The members of the Board of Directors<br />
elected by the Annual General Meeting of 27 March 2006 are Pentti Kalliala,<br />
Ilpo Kokkila, Maarit Näkyvä, Seppo Paatelainen, Keijo Suila, Jukka<br />
Säilä and Heikki Takamäki. The Board Chairman is Heikki Takamäki<br />
and the Deputy Chairman is Keijo Suila. The term of office of each Board<br />
member, in accordance with the Articles of Association, is three <strong>year</strong>s,<br />
with the term starting at the close of the General Meeting electing the<br />
member and expiring at the close of the third Annual General Meeting<br />
after the election (in 2009).<br />
The Annual General Meeting elected PricewaterhouseCoopers Oy,<br />
Authorised Public Accountants, as the company's auditor. The auditor<br />
with principal authority has been Pekka Nikula, B.Sc. (Econ.), APA.<br />
The decisions of the Annual General Meeting were published in more<br />
detail in a stock exchange release on the day of the meeting and in the<br />
3-month interim financial report.<br />
77<br />
Corporate governance<br />
Kesko Food Ltd and Rautakesko Ltd, major subsidiaries fully owned by<br />
Kesko Corporation, elected the members of their Boards of Directors at<br />
their Annual General Meetings held on 23 March <strong>2007</strong>. The compositions<br />
of the Boards were announced in a stock exchange release on 23 March<br />
<strong>2007</strong>.<br />
The organising meeting of Kesko Corporation's Board of Directors<br />
held after the Annual General Meeting on 26 March <strong>2007</strong> decided to<br />
leave the compositions of its committees unchanged. The Board elected<br />
Maarit Näkyvä as the Chairman of its Audit Committee, and Seppo<br />
Paatelainen and Keijo Suila as its members. The Board elected Heikki<br />
Takamäki as the Chairman of its Compensation Committee, and Pentti<br />
Kalliala and Keijo Suila as its members. The committees' terms of office<br />
always expire at the Annual General Meeting. On the basis of the evaluation<br />
of independence carried out by the Board of Directors, all members<br />
of the Audit Committee are independent of the company and its significant<br />
shareholders. The decisions of the organising meeting of the Board<br />
of Directors were published in a stock exchange release on the day of the<br />
meeting.<br />
Juhani Järvi resigned from the positions of Kesko’s Corporate Executive<br />
Vice President and Deputy to the President and CEO as of 1 June<br />
<strong>2007</strong>. He also gave up membership in the Corporate Management Board<br />
and in the Boards of Kesko Food Ltd and Rautakesko Ltd. Järvi’s duties<br />
have been divided between the other Corporate Management Board members.<br />
His responsibility areas included corporate development, IT management,<br />
real estate services, and corporate responsibility and business<br />
development. A more detailed stock exchange release about the matter<br />
was published on 24 May <strong>2007</strong>.<br />
Shares, securities market and Board authorisations<br />
At the end of the review period, Kesko Corporation's share capital totalled<br />
€195,535,530. Of all shares 31,737,007 or 32.5% are A shares and<br />
66,030,758 or 67.5% B shares. The aggregate number of shares was<br />
97,767,765. Each A share entitles to ten (10) votes and each B share to one<br />
(1) vote. During the review period, the share capital was increased six<br />
times by share subscriptions with the stock options of the <strong>year</strong> 2003<br />
option scheme. The increases were made on 12 February <strong>2007</strong> (€46,376),<br />
26 April <strong>2007</strong> (€86,800), 29 May <strong>2007</strong> (€298,572), 24 July <strong>2007</strong> (€9,000),<br />
26 September <strong>2007</strong> (€39,032) and on 19 December <strong>2007</strong> (€15,900), and<br />
were announced in stock exchange notifications on the respective dates.<br />
The subscribed shares were included on the main list of the Helsinki<br />
Stock Exchange for public trading with the old B shares on 13 February<br />
<strong>2007</strong>, 27 April <strong>2007</strong>, 30 May <strong>2007</strong>, 25 July <strong>2007</strong>, 27 September <strong>2007</strong> and<br />
20 December <strong>2007</strong>.<br />
The price of a Kesko A share was €38.43 at the end of 2006 and<br />
€37.85 at the end of <strong>2007</strong>, representing a decrease of 1.5%. The price of a<br />
B share was €40.02 at the end of 2006 and €37.72 at the end of <strong>2007</strong>,<br />
down 5.7%. During the period under review, the highest A share quota-
78 <strong>Kesko's</strong> <strong>year</strong> <strong>2007</strong><br />
tion was €53.44 and the lowest was €34.52. For B shares, they were<br />
€54.85 and €34.40 respectively. During <strong>2007</strong>, the Helsinki Stock<br />
Exchange All Share index (OMX Helsinki) rose by 20.5%, the weighted<br />
OMX Helsinki CAP index by 3.8%, while the Consumer Staples Index<br />
dropped by 5.4% during the review period.<br />
At the end of the review period, the market capitalisation of A shares<br />
was €1,201 million, while that of B shares was €2,491 million. Their combined<br />
market capitalisation was €3,692 million, a decrease of €159 million<br />
from the beginning of the <strong>year</strong>. In <strong>2007</strong>, about 3.6 million A shares<br />
were traded on the Helsinki Stock Exchange at a total value of €161 million,<br />
while 122.4 million B shares were traded at a total value of €5,294<br />
million.<br />
The 2003D stock options of the <strong>year</strong> 2003 option scheme were<br />
included on the main list of the Helsinki Stock Exchange on 1 April 2005.<br />
The number of 2003D options traded during the review period was<br />
87,888 at a total value of €3.4 million.<br />
The 2003E stock options were included on the main list of the Helsinki<br />
Stock Exchange on 3 April 2006. The number of 2003E options<br />
traded during the review period was 169,108 at a total value of €5.7<br />
million.<br />
The 2003F stock options were included on the main list of the Helsinki<br />
Stock Exchange on 2 April <strong>2007</strong>. The number of 2003F options<br />
traded during the review period was 243,637 at a total value of €7.8<br />
million.<br />
The Board of Directors was authorised by the Annual General Meeting<br />
of 26 March <strong>2007</strong> to issue a maximum of 20,000,000 new B shares<br />
against payment. The authorisation also includes a right to deviate, for a<br />
weighty financial reason, from the shareholders’ pre-emptive right with a<br />
rights issue so that the issued shares can be used as consideration in<br />
possible company acquisitions, other arrangements concerning the company’s<br />
operations, or to finance investments. The authorisation is valid<br />
for two <strong>year</strong>s from the decision of the Annual General Meeting.<br />
The Annual General Meeting of 26 March <strong>2007</strong> decided to grant new<br />
stock options for no consideration to the Kesko Group management,<br />
other key Kesko personnel, and to Sincera Oy, a subsidiary wholly owned<br />
by Kesko Corporation. The stock options are marked with the symbols<br />
<strong>2007</strong>A, <strong>2007</strong>B and <strong>2007</strong>C, and their total number is 3,000,000 at the<br />
Group’s net sales, € million*<br />
10,000<br />
9,000<br />
8,000<br />
7,000<br />
6,000<br />
5,000<br />
4,000<br />
3,000<br />
2,000<br />
1,000<br />
0<br />
< FAS IFRS ><br />
2003 2004 2004 2005<br />
2006 <strong>2007</strong><br />
Finland other countries<br />
*continuing operations<br />
Group’s operating profit<br />
excl. non-recurring items, € million*<br />
350<br />
300<br />
250<br />
200<br />
150<br />
100<br />
50<br />
0<br />
< FAS IFRS ><br />
2003 2004 2004 2005 2006 <strong>2007</strong><br />
maximum. Each option entitles its holder to subscribe for one B share, so<br />
that a maximum of 3,000,000 new B shares can be subscribed for with<br />
the options in compliance with the terms and conditions of the stock<br />
option plan.<br />
The Board’s share issue authorisation and the <strong>year</strong> <strong>2007</strong> stock option<br />
scheme were disclosed in more detail in a stock exchange release on 26<br />
March <strong>2007</strong>. The Board's decision to grant the <strong>year</strong> <strong>2007</strong> stock options<br />
to persons in the Kesko Group management, other key personnel and<br />
Sincera Oy, a subsidiary wholly-owned by Kesko Corporation, was<br />
announced in a stock exchange release on 18 July <strong>2007</strong>.<br />
The Board has no other valid authorisation concerning an issue of<br />
shares, options or other special rights entitling to shares.<br />
Flagging notifications<br />
Under Chapter 2, Section 9 of the Finnish Securities Market Act, Kesko<br />
Corporation was notified by Barclays Plc, that the aggregate ownership<br />
interest of Barclays Plc's fund management companies in Kesko Corporation<br />
shares had exceeded 5% on 4 April <strong>2007</strong>. The matter was disclosed<br />
without delay after receipt of the notification in a stock exchange notification<br />
on 4 October <strong>2007</strong>.<br />
Under Chapter 2, Section 9 of the Finnish Securities Market Act,<br />
Kesko Corporation was notified by Barclays Plc and Barclays Global<br />
Investor UK Limited on 13 December <strong>2007</strong> that the ownership interest of<br />
Barclays Plc in Kesko Corporation had fallen below 5% of the total<br />
number of shares on 11 December <strong>2007</strong>, whilst Barclays Global Investor<br />
UK Limited holds over 5% of the total number of Kesko Corporation<br />
shares (stock exchange notification on 13 December <strong>2007</strong>).<br />
Main events<br />
Fiesta Real Estate AS, an Estonian subsidiary of Kesko Corporation, sold<br />
the food trade properties leased by Rimi Baltic AB in Estonia to Rimi Baltic<br />
for €50 million. The €28.2 million gain on the disposal was recognised<br />
in discontinued operations for the first quarter of <strong>2007</strong> (stock<br />
exchange release on 4 January <strong>2007</strong>).<br />
On 16 February <strong>2007</strong>, Kesko Corporation and Varma Mutual Pension<br />
Insurance Company completed a deal in which Kesko sold its SATO Corporation<br />
shares to Varma. <strong>Kesko's</strong> ownership interest in SATO was<br />
Group’s operating profit as %<br />
of net sales*<br />
*continuing operations *continuing operations<br />
5<br />
4<br />
3<br />
2<br />
1<br />
0<br />
< FAS IFRS ><br />
2003 2004 2004 2005 2006 <strong>2007</strong>
Year <strong>2007</strong><br />
Key indicators<br />
Group’s equity ratio, %<br />
60<br />
50<br />
40<br />
30<br />
20<br />
10<br />
0<br />
< FAS IFRS ><br />
2003 2004 2004 2005 2006 <strong>2007</strong><br />
Payout ratio, %<br />
300<br />
250<br />
200<br />
150<br />
100<br />
50<br />
0<br />
< FAS IFRS ><br />
2003 2004 2004 2005 2006 <strong>2007</strong><br />
* proposal to the Annual General Meeting<br />
Divisions The Group<br />
Financial<br />
statements<br />
Further information<br />
*<br />
Group’s profit before tax, € million*<br />
400<br />
350<br />
300<br />
250<br />
200<br />
150<br />
100<br />
50<br />
0<br />
< FAS IFRS ><br />
2003 2004 2004 2005 2006 <strong>2007</strong><br />
*continuing operations<br />
Group’s return on equity, %<br />
25<br />
20<br />
15<br />
10<br />
5<br />
0<br />
< FAS IFRS ><br />
2003 2004 2004 2005 2006 <strong>2007</strong><br />
Group’s return on invested<br />
capital, %<br />
25<br />
20<br />
15<br />
10<br />
5<br />
0<br />
< FAS IFRS ><br />
2003 2004 2004 2005 2006 <strong>2007</strong><br />
Group’s investments, € million*<br />
400<br />
350<br />
300<br />
250<br />
200<br />
150<br />
100<br />
50<br />
0<br />
< FAS IFRS ><br />
79<br />
2003 2004 2004 2005 2006 <strong>2007</strong><br />
*continuing operations<br />
Equity per share, €, at 31 Dec., diluted<br />
25<br />
20<br />
15<br />
10<br />
5<br />
0<br />
< FAS IFRS ><br />
2003 2004 2004 2005 2006 <strong>2007</strong><br />
Earnings per share and dividend<br />
per share, €<br />
4,0<br />
3,5<br />
3,0<br />
2,5<br />
2,0<br />
1,5<br />
1,0<br />
0,5<br />
0<br />
< FAS IFRS ><br />
2003 2004 2004 2005 2006 <strong>2007</strong><br />
Earnings per share, diluted<br />
Dividend per share<br />
*proposal to the Annual General Meeting<br />
*
80 <strong>Kesko's</strong> <strong>year</strong> <strong>2007</strong><br />
approximately 16.5%. The price of the shares was about €46 million and<br />
the gain on the disposal (€37.1 million) was recognised for the first quarter<br />
of <strong>2007</strong> (stock exchange releases on 7 and 16 February <strong>2007</strong>).<br />
In its meeting, Kesko Corporation’s Board of Directors specified the<br />
company strategy. Based on the expansion of the Group’s international<br />
operations and the current business outlook, the targets for return on<br />
capital were raised. The target value for return on equity was raised from<br />
12% to 14% and that of invested capital from 12% to 16%. Large-scale store<br />
site investments in Finland and the other operating countries are<br />
expected to be made during the next few <strong>year</strong>s. The Board also decided to<br />
look into possibilities to dispose of Kauko-Telko (stock exchange release<br />
on 23 May <strong>2007</strong>).<br />
During the summer, Kesko Food Ltd looked into opportunities to sell<br />
its HoReCa wholesaling subsidiary, Kespro Ltd, and its sourcing operations.<br />
The investigation of sales opportunities carried out during the<br />
summer showed that the selling price would be low in relation to the<br />
sales and profit expectations of Kespro. Therefore, it was decided that<br />
Kespro will continue to be developed as an independent subsidiary of<br />
Kesko Food (stock exchange release on 12 October <strong>2007</strong>).<br />
On 2 November <strong>2007</strong>, VV-Auto announced that its net sales and profit<br />
for the last months of <strong>2007</strong> would remain below earlier expectations, as a<br />
significant number of passenger car deliveries would be postponed to<br />
2008 in consequence of the change in the Finnish car taxation (stock<br />
exchange release on 2 November <strong>2007</strong>).<br />
The Administrative Court of Helsinki decided not to accept the €22.5<br />
million write-down made by Rautakesko Ltd on the shares of its Swedish<br />
subsidiary, K-rauta AB, in its taxation for the <strong>year</strong> 2001. The impact of<br />
the Administrative Court's decision on the Kesko Group's result for the<br />
financial <strong>year</strong> <strong>2007</strong>, consequences for default included, was approximately<br />
€-6.4 million (stock exchange release on 14 November <strong>2007</strong>).<br />
Indoor Group Ltd started an extensive development programme<br />
aimed to strengthen the company's market position in the home furniture<br />
and interior decoration trade in Finland and the Baltic countries. At<br />
the same time Indoor Group will dispose of its operations in Sweden. The<br />
disposal was treated as a non-recurring item, and it had no effect on the<br />
future outlook previously published by Kesko (stock exchange release on<br />
13 December <strong>2007</strong>).<br />
Kesko Corporation and OKO Bank plc signed an agreement by which<br />
OKO Bank will acquire the share capital of K-Rahoitus Oy, a subsidiary<br />
wholly owned by Kesko. The purchase price was estimated at about 30<br />
million euros. The final price will be established based on the amount of<br />
equity at the transaction closing date and a fixed amount of goodwill.<br />
The transaction will be concluded after clearance from the authorities<br />
during the first part of 2008 (stock exchange release on 21 December<br />
<strong>2007</strong>).<br />
Environmental factors and other information presented<br />
in the notes to the financial statements in compliance<br />
with the Companies Act<br />
In April 2008, Kesko will publish a separate corporate responsibility<br />
report which analyses the Group's performance in economic, social and<br />
environmental responsibility. An assurance statement will be provided<br />
by an independent external party. The notes to the financial statements<br />
provide information about the Group's risk, uncertainty factors and risk<br />
management. The notes also include information about the company<br />
insiders, option scheme rules and financial indicators.<br />
Events after the end of the review period<br />
The deal between Kesko Corporation and OKO Bank plc to sell K-Rahoitus<br />
Oy's share capital to OKO Bank was concluded on 31 January 2008.<br />
The preliminary price paid in connection with the conclusion of the deal<br />
was about 30 million euros. The final price will be established based on<br />
the amount of equity at the transaction closing date and a fixed amount<br />
of goodwill. The cash inflow from the transaction will be about €240 million,<br />
which is attributable to financial liabilities repayable to Kesko<br />
(stock exchange release on 31 January 2008).<br />
Future outlook<br />
In 2008, the Kesko Group divisions are expected to perform as described<br />
in the above division reviews.<br />
The Group's operating activities are affected by the economic outlook<br />
in its different market areas and especially by the growth rate of private<br />
consumption and any changes therein. Markets in the Baltic countries<br />
and in Russia are expected to continue to grow more rapidly than markets<br />
in the Nordic countries, although there are clear signs of a slowdown<br />
in construction in Finland, the Baltic countries and the other Nordic<br />
countries. In Finland, consumer demand in other respects is expected<br />
to remain at a good level, which is attributable to the growth of consumers'<br />
real earnings.<br />
Although the peak of the economic cycle has passed, the sales from<br />
the Group's continuing operations are expected to grow during the next<br />
six months, which is partly attributable to the significant increase in car<br />
sales forecast for the first part of 2008. Due to the more rapid market<br />
growth and the expansion of the retail store network, the Group's sales<br />
will grow more strongly in other countries than Finland.<br />
It is estimated that the Kesko Group's profitability will remain good<br />
regardless of the fact that the result will be negatively affected by the<br />
intensive expansion and renovation of the retail store network carried<br />
out especially during the first months of the <strong>year</strong>. The operating profit<br />
for the next six months, non-recurring items excluded, is expected to<br />
remain at a level slightly lower than in the corresponding period of the<br />
previous <strong>year</strong>.<br />
Proposal for profit distribution<br />
Parent's distributable earnings are €931,252,452.88 of which net profit<br />
for the period is €194,273,776.22.<br />
• The Board of Directors proposes to the Annual General Meeting that<br />
the distributable earnings be used as follows:<br />
• To be paid to shareholders as dividends €1.60 per share,<br />
€156,428,592.00.<br />
• To be reserved for charitable donations at the discretion of the Board<br />
of Directors €300,000.00.<br />
•<br />
To be carried forward as retained earnings €774,523,860.88.
Year <strong>2007</strong><br />
Divisions The Group<br />
Financial<br />
statements Further information 81<br />
Consolidated Financial Statements <strong>2007</strong><br />
Consolidated income statement, IFRS <strong>2007</strong> 2006<br />
1 Jan.–31 Dec. Note € million % € million %<br />
Continuing operations<br />
Net sales 1 9,533.8 100.0 8,749.2 100.0<br />
Cost of sales -8,142.1 -85.4 -7,474.2 -85.4<br />
Gross profit 1,391.6 14.6 1,275.0 14.6<br />
Other operating income 4, 6 577.6 6.1 660.8 7.6<br />
Staff cost 7, 37 -576.1 -6.0 -544.2 -6.2<br />
Depreciation and impairment charges 11, 12 -119.2 -1.3 -159.9 -1.8<br />
Other operating expenses 5, 6 -942.1 -9.9 -869.1 -9.9<br />
Operating profit 331.9 3.5 362.6 4.1<br />
Financial income 8 87.1 0.9 38.1 0.4<br />
Financial expenses 8 -50.1 -0.5 -43.6 -0.5<br />
Total financial income and expenses 8 37.0 0.4 -5.5 -0.1<br />
Income from associates 0.4 0.0 0.7 0.0<br />
Profit before taxes 369.3 3.9 357.8 4.1<br />
Income tax 9 -90.2 -0.9 -107.1 -1.2<br />
Net profit from continuing operations 279.1 2.9 250.7 2.9<br />
Net profit from discontinued operations 3 28.2 0.3 128.7 1.5<br />
Net profit 307.4 3.2 379.4 4.3<br />
Attributable to:<br />
Equity holders of the parent company 285.0 368.7<br />
Minority interest 22.4 10.7<br />
307.4 379.4<br />
Earnings per share attributable to the equity holders<br />
of the parent company, continuing operations:<br />
Basic, € 10 2.63 2.47<br />
Diluted, € 10 2.61 2.45<br />
Earnings per share attributable to the equity holders<br />
of the parent company, discontinued operations:<br />
Basic, € 10 0.29 1.33<br />
Diluted, € 10 0.29 1.31<br />
Earnings per share attributable to the equity holders<br />
of the parent company, Kesko total:<br />
Basic, € 10 2.92 3.80<br />
Diluted, € 10 2.90 3.76
82<br />
<strong>Kesko's</strong> <strong>year</strong> <strong>2007</strong><br />
Consolidated balance sheet, IFRS<br />
€ million Note 31 Dec. <strong>2007</strong> % 31 Dec. 2006 %<br />
ASSETS<br />
Non-current assets<br />
Intangible assets 11 252.2 248.0<br />
Tangible assets 12 1,153.1 1,115.1<br />
Interests in associates 13, 50 27.0 25.5<br />
Available-for-sale assets 14 4.0 12.0<br />
Long-term receivables 15, 16 36.9 120.2<br />
Deferred tax assets 17 7.7 5.8<br />
Pension assets 18 261.6 219.5<br />
Total non-current assets 1,742.5 42.6 1,746.1 45.9<br />
Current assets<br />
Inventories<br />
Trade receivables and other non-interest-bearing<br />
19 922.3 788.8<br />
receivables 20 823.8 760.8<br />
Interest-bearing receivables 21 16.3 91.6<br />
Financial assets at fair value through profit or loss 22 105.5 140.7<br />
Available-for-sale assets 23 155.6 200.4<br />
Cash and cash equivalents 24 89.7 56.5<br />
Total current assets 2,113.3 51.6 2,038.9 53.6<br />
Assets held for sale 3, 25 236.9 5.8 22.2 0.6<br />
Total assets 4,092.7 100.0 3,807.2 100.0<br />
EQUITY AND LIABILITIES<br />
Equity attributable to parent's equity holders<br />
Share capital 26 195.5 195.0<br />
Share premium 27 200.3 195.9<br />
Other reserves 27 247.1 246.3<br />
Translation differences -3.4 -5.7<br />
Revaluation surplus 27 9.5 -0.7<br />
Retained earnings 1,260.0 1,119.2<br />
1,909.1 46.6 1,749.9 46.0<br />
Minority interest 55.3 1.4 27.1 0.7<br />
Total equity 1,964.4 48.0 1,777.1 46.7<br />
Non-current liabilities<br />
Pension obligations 18 4.1 3.6<br />
Interest-bearing long-term borrowings 28, 29, 30 314.2 316.8<br />
Non-interest-bearing long-term liabilities 11.5 18.3<br />
Deferred tax liabilities 17 125.5 112.8<br />
Provisions 31 15.5 17.6<br />
Total non-current liabilities 470.8 11.5 469.1 12.3<br />
Current liabilities<br />
Interest-bearing short-term borrowings 311.2 293.0<br />
Trade payables 32 837.8 789.2<br />
Other non-interest-bearing liabilities 32 191.6 177.6<br />
Tax liabilities 32 13.4 26.0<br />
Accrued liabilities 32 277.2 260.9<br />
Provisions 31 23.0 14.3<br />
Total current liabilities 1,654.2 40.4 1,561.0 41.0<br />
Liabilities relating to assets held for sale 3, 25 3.3 -<br />
Total liabilities 2,128.3 52.0 2,030.1 53.3<br />
Total equity and liabilities 4,092.7 100.0 3,807.2 100.0
Year <strong>2007</strong><br />
Consolidated cash flow statement, IFRS<br />
Divisions The Group<br />
Financial<br />
statements Further information 83<br />
€ million Note <strong>2007</strong> 2006<br />
Cash flow from operating activities<br />
Profit before tax, continuing operations 369.3 357.8<br />
Profit before tax, discontinued operations<br />
Adjustments:<br />
28.2 129.1<br />
Planned depreciation 118.7 141.5<br />
Financial income and expenses -37.0 7.1<br />
Other adjustments 39 -75.2 -215.5<br />
Change in working capital<br />
6.5 -66.9<br />
Current non-interest-bearing receivables, increase (-)/decrease (+) -37.3 -84.9<br />
Inventories increase (-)/decrease (+) -123.1 -35.9<br />
Current non-interest-bearing liabilities, increase (+)/decrease (-) 95.5 142.2<br />
-65.0 21.4<br />
Interest paid -31.1 -35.6<br />
Interest received 33.2 20.7<br />
Dividends received 0.1 5.0<br />
Tax paid -92.9 -103.6<br />
-90.7 -113.5<br />
Net cash flow from operating activities 248.4 327.9<br />
Cash flow from investing activities<br />
Acquisition of subsidiary, net of cash acquired -21.9 -20.6<br />
Investments in available-for-sale assets -1.2 -1.0<br />
Investments in tangible and intangible assets -214.0 -215.5<br />
Disposal of subsidiary, net of cash disposed of 40 1.5 40.6<br />
Disposal of associate 41 0.6 204.8<br />
Proceeds from available-for-sale investments 42 46.9 10.3<br />
Proceeds from tangible and intangible assets 97.1 194.0<br />
Increase in long-term loan receivables 0.0 -9.9<br />
Decrease in long-term loan receivables 6.3 0.0<br />
Net cash used in investing activities -84.7 202.7<br />
Cash flow from financing activities<br />
Increase in current liabilities 15.7 18.4<br />
Decrease in non-current liabilities -5.2 -119.6<br />
Repayments of finance lease liabilities -14.5 -14.6<br />
Current interest-bearing receivables, increase (-) / decrease (+) -52.1 -24.6<br />
Dividends paid -155.6 -112.7<br />
Share capital increase 2.6 6.4<br />
Short-term money market investments 35.2 -140.5<br />
Others 0.7 -2.7<br />
Net cash used in financing activities -173.1 -389.9<br />
Change in cash and cash equivalents and<br />
current available-for-sale financial assets -9.4 140.7<br />
Cash and cash equivalents at 1 January 256.9 114.6<br />
Translation difference adjustment -0.4 1.7<br />
Cash and cash equivalents relating to available-for-sale assets 43 1.8 0.0<br />
Cash and cash equivalents at 31 December 245.3 256.9
84<br />
<strong>Kesko's</strong> <strong>year</strong> <strong>2007</strong><br />
Consolidated statement of changes in equity<br />
€ million<br />
Share<br />
capital<br />
Attributable to equity holders of the parent company<br />
Issue of<br />
share<br />
capital<br />
Share<br />
premium<br />
Other<br />
reserves<br />
Currency<br />
translation<br />
differences<br />
Re-<br />
valuation<br />
surplus<br />
Retained<br />
earnings<br />
Minority<br />
interest<br />
Balance at 1 January 2006 193.0 0.7 188.7 245.8 -3.7 -0.4 857.3 26.5 1,507.9<br />
Currency translation differences -3.1 -0.8 -3.9<br />
Cost of options granted 2.1 2.1<br />
Cash flow hedges:<br />
Hedging result amortised in equity 1.0 -0.4 0.6<br />
Taxes recorded in equity 0.1 0.1<br />
Items recognised directly in equity 2.1 -2.1 -0.3 -0.8 -1.1<br />
Net profit for the period 368.7 10.7 379.4<br />
Total recognised income and expenses<br />
for the period 2.1 -2.1 -0.3 367.9 10.7 378.3<br />
Dividend -106.5 -5.7 -112.2<br />
Shares subscribed for with options 2.0 -0.7 5.1 6.4<br />
Other changes 0.5 0.1 0.5 -4.4 -3.3<br />
Balance at 31 December 2006 195.0 0.0 195.9 246.3 -5.7 -0.7 1,119.2 27.1 1,777.1<br />
Balance at 1 January <strong>2007</strong> 195.0 0.0 195.9 246.3 -5.7 -0.7 1,119.2 27.1 1,777.1<br />
Currency translation differences 2.2 0.8 3.0<br />
Cost of options granted<br />
Cash flow hedges:<br />
2.3 2.3<br />
Hedging result amortised in equity 0.1 13.8 13.9<br />
Taxes recorded in equity -3.6 -3.6<br />
Items recognised directly in equity 2.3 2.3 10.2 0.8 15.6<br />
Net profit for the period<br />
Total recognised income and expenses<br />
285.1 22.4 307.5<br />
for the period 2.3 2.3 10.2 285.9 22.4 323.1<br />
Dividend -146.3 -9.3 -155.6<br />
Shares subscribed for with options 0.5 0.0 2.1 2.6<br />
Other changes 0.8 1.3 15.1 17.2<br />
Balance at 31 December <strong>2007</strong> 195.5 0.0 200.3 247.1 -3.4 9.5 1,260.0 55.3 1,964.4<br />
Further information about share capital is given in Note 26 and about reserves in Note 27.<br />
Other changes include a minority interest in entities acquired during the accounting period.<br />
An amount of €-2.2 million (€7.6 million) in cash flow hedges, here electricity hedges, has been removed from equity and recognised in purchase<br />
adjustment items in the income statement, and €4.9 million (€3.6 million) has been recorded in equity. A fair value change of €6.6 million (€3.6 million)<br />
of the USD-denominated private placement arrangement has been recognised in equity, and €-0.1 million (€0.4 million) in the financial items of<br />
the income statement.<br />
Total<br />
equity
Year <strong>2007</strong><br />
Divisions The Group<br />
Financial<br />
statements<br />
Further information<br />
Notes to the consolidated<br />
financial statements<br />
General information about the company<br />
Kesko is a Finnish retail specialist whose stores offer quality to the daily<br />
lives of consumers through valued products and services at competitive<br />
prices. Kesko has about 2,000 stores engaged in chain operations in the<br />
Nordic and Baltic countries, Russia and Belarus.<br />
<strong>Kesko's</strong> operations are divided into five business segments which are<br />
Kesko Food operating in the grocery trade, Rautakesko in the building<br />
and home improvement trade, VV-Auto specialising in car importing,<br />
marketing and retailing, Anttila in the department store trade, and<br />
Kesko Agro in the agricultural trade. In addition, other operating activities<br />
comprise the reporting for Konekesko engaging in the machinery<br />
trade, Indoor in the furniture and interior decoration trade, Intersport<br />
Finland in the sports trade, Musta Pörssi in the home technology trade,<br />
Kenkäkesko in the shoe trade, Tähti Optikko in the optical trade, and<br />
Kauko-Telko specialising in the international technical trade.<br />
The Group's parent company, Kesko Corporation, is a Finnish public<br />
limited company constituted in accordance with the laws of Finland. The<br />
company's business ID is 0109862-8, it is domiciled in Helsinki and its<br />
registered address is Satamakatu 3, FI-00016 Kesko. Copies of Kesko<br />
Corporation's financial statements and the consolidated financial statements<br />
are available at Kesko Corporation, Satamakatu 3, FI-00016<br />
Kesko, and on the Internet at www.kesko.fi.<br />
Accounting policies for<br />
consolidated financial statements<br />
Basis of preparation<br />
<strong>Kesko's</strong> consolidated financial statements have been prepared in accordance<br />
with the International Financial Reporting Standards (IFRSs), and<br />
International Accounting Standards (IASs), IFRS standards and their<br />
IFRIC and SIC Interpretations valid at 31 December <strong>2007</strong> have been<br />
applied. The International Reporting Standards refer to the Finnish<br />
Accounting Standards and regulations based on them, approved for<br />
adoption within the EU in accordance with the procedure enacted in EC<br />
regulation 1606/2002. Accounting standards not yet effective have not<br />
been adopted voluntarily.<br />
The notes to the consolidated financial statements also include compliance<br />
with the Finnish accounting legislation and Community<br />
legislation.<br />
All amounts in the consolidated financial statements are in millions<br />
of euros and are based on original cost, with the exception of items identified<br />
separately, which have been measured at fair value in compliance<br />
with the standards.<br />
Starting from 1 January <strong>2007</strong>, the Group has adopted the following new<br />
and revised standards:<br />
• IFRS 7 Financial Instruments: Disclosures. IFRS 7 requires disclosures<br />
that report on the significance of financial instruments for the<br />
entity's financial position and performance, and the nature and<br />
extent of risks arising from financial instruments. The adoption of<br />
the standard increases the number of notes to the financial<br />
statements.<br />
• The amendment to IAS 1, Presentation of Financial Statements,<br />
increases the number of notes on the entity's capital management<br />
objectives.<br />
•<br />
85<br />
In addition, the following interpretations have become effective during<br />
the financial period but have no effect on the company's financial<br />
statements: IFRIC 8 Scope of IFRS 2, IFRIC 9 Reassessment of<br />
Embedded Derivatives, and IFRIC 10 Interim Financial Reporting and<br />
Impairment.<br />
Use of estimates<br />
The preparation of consolidated financial statements in conformity with<br />
IFRS requires the use of certain estimates and assumptions about the<br />
future that affect the reported amounts of assets and liabilities, contingent<br />
liabilities, and income and expense. The actual results may differ<br />
from these estimates and assumptions. Furthermore, the application of<br />
accounting policies is based on the management's judgements, for example,<br />
in the classification of assets and in determining whether risks and<br />
rewards incident to ownership of financial assets and leased assets have<br />
substantially transferred to the other party. The most significant estimates<br />
relate to the following.<br />
Allocation of cost of acquisition<br />
Assets and liabilities acquired in business combinations are measured at<br />
their fair values at the date of acquisition. The fair values on which cost<br />
allocation is based are determined by reference to market values to the<br />
extent they are available. If market values are not available, the measurement<br />
is based on the estimated performance of the asset and its future<br />
use in <strong>Kesko's</strong> operating activities. The measurement of intangible<br />
assets, in particular, is based on discounted cash flows and requires management<br />
estimates and assumptions regarding future cash flows and the<br />
use of assets.<br />
Impairment test<br />
The amount recoverable from a cash generating unit's operating activities<br />
is based on value in use calculations in impairment testing. In the<br />
calculations, forecast cash flows are based on financial plans approved<br />
by the management, covering a period of 3–5 <strong>year</strong>s (Note 11).<br />
Employee benefits<br />
The Group operates various retirement benefit plans for its employees.<br />
Several factors are used in the calculation of items relating to employee<br />
benefits. Pension calculations under defined benefit plans in compliance<br />
with IAS 19 include the following factors that rely on management estimates<br />
(Note 18):<br />
• expected return on plan assets<br />
• discount rate used in calculating pension expenses and obligations<br />
for the period<br />
• future salary level<br />
• employee service life<br />
Consolidation principles<br />
Subsidiaries<br />
The consolidated financial statements combine the financial statements<br />
of Kesko Corporation and all subsidiaries controlled by the Group. Control<br />
exists when the Group owns more than 50% of the voting rights of a<br />
subsidiary or otherwise exerts control. Control refers to the power to govern<br />
the financial and operating policies of an enterprise so as to obtain<br />
benefits from its activities. Acquired subsidiaries are consolidated from<br />
the date on which the Group gains control until the date on which control
86 <strong>Kesko's</strong> <strong>year</strong> <strong>2007</strong><br />
ceases. When determining the existence of control, the potential voting<br />
rights that are currently exercisable have been taken into account. The<br />
main subsidiaries are listed in Note 50.<br />
Internal shareholdings are eliminated by using the acquisition cost<br />
method. The cost of acquisition is determined on the basis of the fair<br />
value of the acquired assets as on the date of acquisition, the issued<br />
equity instruments and liabilities resulting from or assumed on the date<br />
of the exchange transaction, plus the direct expenses relating to the<br />
acquisition. The identifiable assets, liabilities and contingent liabilities<br />
of the acquiree are measured at the fair value on the date of acquisition,<br />
gross of minority interest.<br />
All intra-group transactions, receivables and payables, unrealised<br />
gains and internal distribution of profits are eliminated when preparing<br />
the consolidated financial statements. Unrealised losses are not eliminated,<br />
if the loss is due to the impairment of an asset. Minority interests<br />
in the net profit are disclosed in the income statement and the amount of<br />
equity attributable to minority interest is disclosed separately in the<br />
Group's equity in the balance sheet.<br />
Associates<br />
Associates are enterprises in which the Group owns 20–50% of the voting<br />
rights, or otherwise has significant influence, but not control. Associates<br />
are consolidated by using the equity method. A share of an associate's<br />
net profit for the period corresponding to the Group’s ownership interest<br />
is disclosed separately in the consolidated financial statements. The<br />
Group's share of an associate's post-acquisition net profit is added to the<br />
acquisition cost of the associate's shares in the consolidated balance<br />
sheet. Conversely, the Group’s share of an associate's post acquisition net<br />
losses is deducted from the acquisition cost of the shares. If the Group's<br />
share of an associate's losses is in excess of the carrying amount, the<br />
part in excess is not deducted unless the Group has undertaken to fulfil<br />
the associate's obligations. Unrealised gains between the Group and<br />
associates are eliminated in proportion to the Group's ownership interest.<br />
Dividends received from associates are deducted from the Group's<br />
profit and the cost of the shares. An investment in an associate includes<br />
the goodwill generated by the acquisition. Goodwill is not amortised. The<br />
main associates are listed in Note 50.<br />
Joint ventures<br />
Joint ventures are enterprises in which the Group and another party exercise<br />
joint control by virtue of contractual arrangements. The Group's<br />
interests in joint ventures are consolidated proportionally on a line-byline<br />
basis. The consolidated financial statements disclose the Group's<br />
share of a joint venture's assets, liabilities, income and expenses. At the<br />
end of the accounting period, the Group has no joint ventures.<br />
Mutual real estate companies<br />
In compliance with IAS 31, mutual real estate companies are consolidated<br />
as assets under joint control on a line-by-line basis in proportion to<br />
ownership.<br />
Foreign currency items<br />
The consolidated financial statements are presented in euros, which is<br />
both the functional currency of the Group’s parent company and the<br />
reporting currency. On initial recognition, the figures relating to the<br />
result and financial position of Group entities located outside the euro<br />
zone are recorded in the functional currency of their operating<br />
environment.<br />
Monetary foreign currency transactions are recorded in euros by<br />
applying the exchange rate at the date of the transaction. Foreign currency<br />
receivables and liabilities are translated into euros using the closing<br />
rate. Profits and losses from foreign currency transactions and from<br />
receivables and liabilities are recognised in the income statement with<br />
the exception of those loan exchange rate movements designated to provide<br />
a hedge against foreign net investments and regarded as effective.<br />
Foreign exchange gains and losses from operating activities are included<br />
in the respective items above operating profit. Gains and losses from forward<br />
exchange contracts and options used to hedge financial transactions,<br />
and from foreign currency loans are included in financial income<br />
and expenses.<br />
The income statements of Group entities operating outside the euro<br />
zone have been translated into euros at the average rate of the reporting<br />
period, and the balance sheets at the closing rate. The translation difference<br />
resulting from the use of different rates is recognised in equity. The<br />
translation differences arising from the elimination of the acquisition<br />
cost of subsidiaries outside the euro zone, and the hedging result of net<br />
investments made in them, are recognised in equity. In connection with<br />
the disposal of a subsidiary, currency translation differences are disclosed<br />
in the income statement as part of the gains or losses on the<br />
disposal.<br />
As of 1 January 2004, the goodwill arising from the acquisition of foreign<br />
units and the fair value adjustments of assets and liabilities made<br />
upon their acquisition have been treated as assets and liabilities of these<br />
foreign units and translated into euros at the closing rate. The goodwill<br />
and fair value adjustments of acquisitions made prior to 1 January 2004<br />
have been recorded in euros.<br />
Financial assets<br />
As of 1 January 2005, the Group has applied IAS 32 Financial Instruments:<br />
Disclosure and Presentation, and IAS 39 Financial Instruments:<br />
Recognition and Measurement, as well as IFRS 7 Financial Instruments:<br />
Disclosures starting from 1 January <strong>2007</strong>.<br />
The Group classifies financial assets in the following categories: 1)<br />
financial assets at fair value through profit or loss, 2) available-for-sale<br />
financial assets, and 3) loans and receivables. The classification of financial<br />
assets is determined on the basis of why they were originally<br />
acquired. Purchases and sales of financial assets are recognised using<br />
the ‘regular way’ method. Financial assets are classified as non-current<br />
assets if they have a maturity date greater than twelve months after the<br />
balance sheet date. If financial assets are going to be held for less than 12<br />
months, they are classified as current assets. Financial assets at fair<br />
value through profit or loss are classified as current assets. Financial<br />
assets are derecognised when the contractual rights to the cash flow of<br />
the financial asset expire or have been transferred to another party, and<br />
when the risks and rewards of ownership flown from the Group.<br />
At each reporting date, the Group assesses whether there is any indication<br />
that a financial asset may be impaired. If any such indication<br />
exists, the recoverable amount of the asset is estimated. The recoverable<br />
amount is the fair value based on the market price or the present value of<br />
cash flows. An impairment loss is recognised if the carrying amount of<br />
an asset exceeds its recoverable amount. The impairment loss is disclosed<br />
in the financial expenses of the income statement, net of interest<br />
income.
Year <strong>2007</strong><br />
Divisions The Group<br />
Financial<br />
statements<br />
Further information<br />
1) Financial assets at fair value through profit or loss<br />
All derivatives which do not qualify for hedge accounting in compliance<br />
with IAS 39 are classified as financial assets at fair value through profit<br />
or loss. Derivatives are carried at fair value using prices quoted in active<br />
markets. The results of derivatives hedging purchases and sales are recognised<br />
in other operating income or expenses. The results of derivatives<br />
used to hedge financial items are recognised in financial items, unless<br />
the derivative has been designated as a hedging instrument. The subcategory<br />
of financial assets at fair value through profit of loss in initial recognition<br />
includes investments in bond and special investment funds, as<br />
defined by the Group's treasury policy, as well as investments in other<br />
interest-bearing papers with over 3-month maturities. The interest<br />
income and fair value changes of these financial assets, as well as any<br />
commissions returned by funds are presented on a net basis in the<br />
income statement in the interest income of the category in question.<br />
2) Available-for-sale financial assets<br />
Available-for-sale financial assets are assets designated as available for<br />
sale at the date of initial recognition. Available-for-sale financial assets<br />
are measured at fair value at the balance sheet date and their fair value<br />
changes are recognised in equity. The fair value of publicly quoted financial<br />
assets is determined based on their market value. Financial assets<br />
not quoted publicly are measured at cost if their fair values cannot be<br />
measured reliably. The dividends from equity investments included in<br />
available-for-sale financial assets are recognised in financial items in the<br />
income statement. The interest income from available-for-sale financial<br />
assets is recognised in the financial items of the relevant category.<br />
3) Loans and receivables<br />
Loans and receivables are non-derivative assets with fixed or measurable<br />
payments. The Group's loans and receivables include trade receivables.<br />
They are recognised at amortised cost using the effective interest<br />
method.<br />
Cash and cash equivalents<br />
Cash and cash equivalents are carried at cost in the balance sheet. Cash<br />
and cash equivalents include cash on hand and balances with banks. The<br />
cash and cash equivalents in the consolidated balance sheet also include<br />
amounts relating to the retail operations of division parent companies,<br />
used as cash floats in stores, or amounts being transferred to the respective<br />
companies.<br />
Financial liabilities<br />
Financial liabilities have initially been recognised at fair value, net of<br />
transaction costs. In the financial statements, financial liabilities are<br />
measured at amortised cost using the effective interest rate method. The<br />
arrangement fees related to lines of credit are amortised over the validity<br />
period of the credit. Financial liabilities having a maturity period of over<br />
12 months after the balance sheet date are classified as non-current liabilities.<br />
Those having a maturity period of less than 12 months after the<br />
balance sheet date are classified as current liabilities.<br />
Derivative financial instruments and hedge accounting<br />
When acquired, derivative financial instruments are carried at fair value<br />
and subsequently measured at fair value at the balance sheet date. The<br />
changes in the fair value of derivatives that do not fulfil the hedge<br />
accounting requirements of IAS 39 are disclosed in the income state-<br />
87<br />
ment. The results of instruments hedging commercial currency risks are<br />
recognised in other operating income or expenses. The portion of derivatives<br />
hedging financial transactions to be recognised in the income statement<br />
is included in financial items.<br />
When entered into, derivative contracts are treated either as fair<br />
value hedges of receivables or liabilities, or in the case of currency risk,<br />
as cash flow hedges, as hedges of net investments in a foreign entity, or<br />
as derivative contracts that do not meet the hedge accounting criteria.<br />
When a hedging arrangement is entered into, the relationship<br />
between the item being hedged and the hedging instrument, as well as<br />
the objectives of the Group's risk management are documented. The<br />
effectiveness of the hedging relationship is tested regularly and the<br />
effective portion is recognised, against the change in the fair value of the<br />
hedged item, in translation differences in equity, or in the revaluation<br />
surplus. The ineffective portion is recognised in financial items or other<br />
operating income and expenses. The effective portion of the fair value<br />
change of instruments hedging cash flow, such as a long-term credit<br />
facility, is recognised in the equity hedging reserve. The value change of<br />
currency derivative instruments relating to the credit facility is recognised<br />
in the loan account, and the fair value changes of interest rate<br />
derivative instruments in other non-interest-bearing debt and<br />
receivables.<br />
Hedge accounting is discontinued when the hedging instrument<br />
expires or is sold, the contract is terminated or exercised. Any cumulative<br />
gain or loss existing in equity remains in equity until the forecast transaction<br />
has occurred.<br />
Measurement principles<br />
The fair value of forward rate agreements is determined by reference to<br />
the market price of the balance sheet date. The fair value of interest rate<br />
swaps is calculated on the basis of the present value of future cash flows<br />
using the market prices at the balance sheet date. The fair value of forward<br />
exchanges is determined by measuring the forward contracts at the<br />
forward rate of the balance sheet date. Currency options are measured by<br />
using the counterparty's price quotation, but the Group verifies the price<br />
with the help of the Black-Scholes method. Electricity and grain derivatives<br />
are measured at fair value using the market quotations of the balance<br />
sheet date.<br />
Hedging a net investment in a foreign entity<br />
The Group applies hedge accounting in accordance with IAS 39 to hedge<br />
foreign currency net investments in foreign units. Forward exchanges or<br />
foreign currency loans are used as hedging instruments. Spot price<br />
changes in forward exchanges are recognised as translation differences<br />
under equity, and changes in the interest rate difference are recognised<br />
as income under financial items. The exchange differences of foreign<br />
currency loans are stated as translation differences under equity. When a<br />
foreign entity is disposed of or wound up, the accumulated gains or<br />
losses from hedging instruments are recognised in profit or loss.<br />
Embedded derivatives<br />
The Group has prepared method descriptions to identify embedded derivatives<br />
and applies fair value measurement. Fair value is determined<br />
using the market prices of the measurement date and the value change is<br />
recognised in the income statement.
88 <strong>Kesko's</strong> <strong>year</strong> <strong>2007</strong><br />
Goodwill and other intangible assets<br />
Goodwill represents the excess of the Group's share of the fair value of<br />
the acquiree's net assets at the date of the acquisition. The goodwill of<br />
companies acquired prior to 1 January 2004 corresponds to their carrying<br />
amounts reported in accordance with the previous accounting practices,<br />
and the carrying amount is used as the deemed cost. The classification<br />
and accounting treatment of business combinations entered into<br />
prior to 1 January 2004 were not adjusted in preparing the consolidated<br />
IFRS opening balance sheet.<br />
Goodwill is not amortised but tested annually for impairment and<br />
whenever there is an indication of impairment. For impairment testing<br />
purposes goodwill is allocated to the cash generating units. Goodwill is<br />
measured at original cost and the share acquired prior to 1 January 2004<br />
at deemed cost net of impairment. Any negative goodwill is immediately<br />
recognised as income in accordance with IFRS 3.<br />
Intangible assets with indefinite useful lives are not amortised. They<br />
are tested for impairment annually and whenever there is an indication<br />
of impairment. These intangible assets include trademarks capitalised<br />
upon acquisition. The costs of intangible rights with definite useful lives<br />
are stated in the balance sheet and recognised as expenses during their<br />
useful lives. Such intangible assets include software licences and customer<br />
relationships to which acquisition cost has been allocated upon<br />
acquisition. The estimated useful lives are:<br />
Computer software and licences 3–5 <strong>year</strong>s<br />
Customer and supplier relationships 10 <strong>year</strong>s<br />
Research and development<br />
The cost of research and development activities is recognised as an<br />
expense in the income statement. The Group has not had such development<br />
expenses which, under certain conditions, should be recognised as<br />
assets and written off during their useful lives in accordance with IAS 38.<br />
Computer software<br />
The labour costs and other direct expenditure of persons employed by the<br />
Group, working on development projects related to the acquisition of new<br />
computer software, are capitalised as part of the software cost. In the balance<br />
sheet, computer software is included in intangible assets and its<br />
cost is written off during the useful life of the software. Software maintenance<br />
expenditure is recognised as an expense when incurred.<br />
Tangible assets<br />
Tangible assets mainly comprise land, buildings, machinery and equipment.<br />
Tangible assets are carried at original cost net of planned depreciation<br />
and any impairment. The tangible assets of acquired subsidiaries<br />
are measured at fair value at the date of acquisition.<br />
The machinery and equipment of buildings are treated as separate<br />
assets and any significant expenditure related to their replacement is<br />
capitalised. Subsequent expenditure relating to a fixed asset is only<br />
added to the carrying amount of the asset when it is probable that future<br />
economic benefits relating to the asset will flow to the Group and that<br />
the cost of the asset can be reliably measured. The repair, service and<br />
maintenance expenditure of other tangible assets is recognised as an<br />
expense when incurred.<br />
Tangible assets are written off on a straight-line basis during their<br />
estimated useful lives.<br />
The most common estimated useful lives are:<br />
Buildings 10–40 <strong>year</strong>s<br />
Components of buildings 8–10 <strong>year</strong>s<br />
Machinery and equipment 3–8 <strong>year</strong>s<br />
Cars and transport equipment 5 <strong>year</strong>s<br />
The residual values, useful lives and depreciation methods applied to<br />
tangible assets are reviewed at least at the end of each accounting period.<br />
If the estimates of useful life and the expected pattern of economic benefits<br />
are different from previous estimates, the change in the estimate is<br />
accounted for in accordance with IAS 8.<br />
The depreciation of a tangible asset ceases when the asset is classified<br />
as held for sale in accordance with IFRS 5. Land is not depreciated.<br />
Gains and losses from sales and disposals of tangible assets are recognised<br />
in the income statement and presented as other operating<br />
income and expenses.<br />
Investment properties<br />
Investment properties are properties held by the enterprise mainly to<br />
earn rentals or for capital appreciation. The Group does not hold real<br />
estate classified as investment properties.<br />
Impairment<br />
At each reporting date, the Group assesses whether there is any indication<br />
that an asset may be impaired. If any such indication exists, the<br />
recoverable amount of the asset is estimated. The recoverable amount of<br />
goodwill and intangible assets with indefinite useful lives is assessed<br />
every <strong>year</strong> whether or not there is an indication of impairment. In addition,<br />
an impairment test is performed whenever there is an indication of<br />
impairment.<br />
The recoverable amount is the higher of an asset's net selling price<br />
less the costs of disposal, and its value in use. Often it is not possible to<br />
assess the recoverable amount for an individual asset. Then, as in the<br />
case of goodwill, the recoverable amount is determined for the cash generating<br />
unit to which the goodwill or asset belongs. The recoverable<br />
amount of available-for-sale financial assets is the fair value based on<br />
either the market price or the present value of cash flows.<br />
An impairment loss is recognised if the carrying amount of an asset<br />
exceeds its recoverable amount. The impairment loss is disclosed in the<br />
income statement. An impairment loss recognised for an asset in prior<br />
<strong>year</strong>s is reversed if there has been an increase in the reassessed recoverable<br />
amount. The reversal of an impairment loss of an asset should not<br />
exceed the carrying amount of the asset without an impairment loss recognition.<br />
For goodwill, a recognised impairment loss is not reversed<br />
under any circumstances.<br />
Leases<br />
In accordance with IAS 17, leases that substantially transfer all the risks<br />
and rewards incident to ownership to the Group are classified as finance<br />
leases. An asset leased under a finance lease is recognised in the balance<br />
sheet at the lower of its fair value at the inception date and the present<br />
value of minimum lease payments. The rental obligations of finance<br />
leases are recorded in interest-bearing liabilities in the balance sheet.<br />
Lease payments are allocated between interest expense and reduction of<br />
the lease liability. Finance lease assets are amortised over the shorter<br />
period of the useful life and the lease term.
Year <strong>2007</strong><br />
Divisions The Group<br />
Financial<br />
statements<br />
Further information<br />
Leases in which assets are leased out by the Group, and substantially<br />
all the risks and rewards incident to ownership are transferred to the lessee,<br />
are classified as finance leases. Assets leased under such contracts<br />
are recognised as receivables in the balance sheet and are stated at<br />
present value. The financial income from finance leases is determined so<br />
as to achieve a constant periodic rate of return on the remaining net<br />
investment for the lease term.<br />
Leases in which risks and rewards incident to ownership are not<br />
transferred to the lessee are classified as operating leases. Lease payments<br />
related to them are recognised in the income statement on a<br />
straight-line basis over the lease term.<br />
In sale and leaseback transactions the sale price and the future lease<br />
payments are usually interdependent. If a sale and leaseback transaction<br />
results in a finance lease, any excess of sales proceeds over the carrying<br />
amount is not immediately recognised as income. Instead it is deferred<br />
and amortised over the lease term. If a sale and leaseback transaction<br />
results in an operating lease and the transaction is established at fair<br />
value, any profit or loss is recognised immediately.<br />
If the sale price is below fair value, any profit or loss is recognised<br />
immediately unless the loss is compensated by future lease payments at<br />
below market price, in which case the loss is deferred and amortised over<br />
the period for which the asset is expected to be used. If the sale price is<br />
above fair value, the excess over fair value is deferred and amortised over<br />
the period for which the asset is expected to be used. If the fair value at<br />
the time of a sale and leaseback transaction is less than the carrying<br />
amount of the asset, a loss equal to the amount of the difference between<br />
the carrying amount and fair value is recognised immediately.<br />
Inventories<br />
Inventories are measured at the lower of cost and net realisable value.<br />
Net realisable value is the estimated selling price in the ordinary course<br />
of business less the estimated costs necessary to make the sale. The cost<br />
is primarily assigned by using the weighted average cost formula. The<br />
cost of certain classifications of inventory is assigned by using the FIFO<br />
formula. The cost of finished products comprises all costs of purchase<br />
including freight. The cost of self-constructed goods comprise all costs of<br />
conversion including direct costs and allocations of variable and fixed<br />
production overheads.<br />
Trade receivables<br />
Trade receivables are recognised at the original invoice amount. Impairment<br />
is recognised when there is objective evidence of impairment loss.<br />
The Group has established a uniform basis for the determination of<br />
impairment of trade receivables based on the time receivables have been<br />
outstanding. In addition, impairment is recognised if there is other evidence<br />
of a debtor's insolvency, bankruptcy or liquidation. Losses on loans<br />
and advances are recognised as an expense in the income statement.<br />
Assets held for sale and discontinued operations<br />
Assets (or a disposal group) and liabilities relating to discontinued operations<br />
are classified as held for sale, if their carrying amount will be recovered<br />
principally through the disposal of the assets rather than through<br />
continuing use. For this to be the case, the sale must be highly probable,<br />
the asset (or disposal group) must be available for immediate sale in its<br />
present condition subject only to terms that are usual and customary, the<br />
management must be committed to selling and the sale should be<br />
89<br />
expected to qualify for recognition as a completed sale within one <strong>year</strong><br />
from the date of classification.<br />
Non-current assets held for sale (or assets included in the disposal<br />
group) and assets and liabilities linked to a discontinuing operation are<br />
measured at the lower of the carrying amount and fair value net of estimated<br />
costs to sell. After an asset has been classified as held for sale, or<br />
if it is included in the disposal group, it is not depreciated. If the classification<br />
criterion is not met, the classification is reversed and the asset is<br />
measured at the lower of its balance sheet value prior to the classification<br />
less depreciation and impairment, and recoverable amount. A noncurrent<br />
asset held for sale and assets included in the disposal group classified<br />
as held for sale are disclosed separately in the balance sheet. Liabilities<br />
included in the disposal group of assets held for sale are also<br />
disclosed separately in the balance sheet. The profit from discontinued<br />
operations is disclosed as a separate line item in the income statement.<br />
The Group has classified certain real estate properties removed from<br />
business use as assets held for sale.<br />
Provisions<br />
A provision is recognised when the Group has a present legal or constructive<br />
obligation as a result of a past event, and it is probable that an outflow<br />
of resources embodying economic benefits will be required to settle<br />
the obligation, and that a reliable estimate can be made of the amount of<br />
the obligation. Provision amounts are reviewed at each balance sheet<br />
date and adjusted to reflect the current best estimate. Changes in provisions<br />
are recorded in the income statement in the same item in which the<br />
provision was originally recognised. The most significant part of the<br />
Group's provisions relates to warranties given to products sold by the<br />
Group, and to onerous leases.<br />
A warranty provision is recognised when a product fulfilling the<br />
terms is sold. The provision amount is based on historical experience<br />
about the level of warranty expenses. Leases become onerous if the<br />
leased premises become vacant, or if they are subleased at a rate lower<br />
than the original. A provision is recognised for an estimated loss from<br />
vacant lease premises over the remaining lease term, and for losses from<br />
subleased premises.<br />
Pension plans<br />
The Group operates several pension plans classified either as defined<br />
contribution plans or defined benefit plans. The contributions payable<br />
under defined contribution plans are recognised as an expense in the<br />
income statement of the period in which they incur.<br />
In defined benefit plans, after the Group has paid the amount for the<br />
period, obligations or assets may result. The pension obligation represents<br />
the present value of future cash flows from payable benefits. The<br />
present value of pension obligations has been calculated using the Projected<br />
Unit Credit Method. The assets corresponding to the pension obligation<br />
of the retirement benefit plan are carried at fair values at the balance<br />
sheet date. Actuarial gains and losses are recognised in the income<br />
statement for the average remaining service lives of the employees participating<br />
in the plan to the extent that they exceed 10 percent of the<br />
higher of the present value of the defined benefit plans and the fair value<br />
of assets belonging to the plan.<br />
Relating to the arrangements taken care of by the Kesko Pension<br />
Fund, the funded portion and the disability portion under the Finnish<br />
Employees' Pensions Act are treated as defined benefit plans. In addition,
90 <strong>Kesko's</strong> <strong>year</strong> <strong>2007</strong><br />
the Group operates a pension plan in Norway which is treated as a<br />
defined benefit plan.<br />
Share-based payments<br />
The stock options issued as part of the Group management's incentive<br />
and commitment programme are measured at fair value at the issue date<br />
and expensed on a straight-line basis over the option's vesting period.<br />
The expenditure determined at the issue date is based on the Group's<br />
estimate of the number of options expected to vest at the end of the vesting<br />
period. The fair value of the options has been calculated using the<br />
Black-Scholes option pricing model.<br />
Revenue recognition policies<br />
Net sales include the sale of products, services and energy. For net sales,<br />
sales revenue is adjusted by indirect taxes, sales adjustment items and<br />
the exchange differences of foreign currency sales.<br />
Revenue from the sale of goods is recognised when the significant<br />
risks of ownership of the goods have transferred to the buyer, and it is<br />
probable that the economic benefits associated with the transaction will<br />
flow to the Group. Normally revenue from the sale of goods can be recognised<br />
at the time of delivery of the goods. Revenue from the rendering of<br />
services is recognised after the service has been rendered and when a<br />
flow of economic benefits associated with the service is probable. The<br />
revenue and costs of construction contracts are recognised as revenue<br />
and expenses by reference to the stage of completion of the contract<br />
when the total contract revenue can be measured reliably. Interest is recognised<br />
as revenue on a time proportion basis.<br />
Dividends are recognised as revenue when the right to receive payment<br />
is established.<br />
Other operating income and expenses<br />
Other operating income includes income other than that associated with<br />
the sale of goods or services, such as rent income, store site and chain<br />
fees and various other service fees and commissions. Profits and losses<br />
from the sale and disposal of tangible assets are recognised in the<br />
income statement and disclosed in other operating income and expenses.<br />
Other operating income and expenses also include realised and unrealised<br />
profits and losses from derivatives used to hedge commercial currency<br />
risks.<br />
Borrowing costs<br />
Borrowing costs are recognised as an expense in the period in which they<br />
are incurred. Borrowing costs are not capitalised as part of asset costs.<br />
Directly attributable transaction costs clearly associated with a certain<br />
borrowing are included in the original amortised cost of the borrowing<br />
and amortised to interest expense by using the effective interest method.<br />
Income taxes<br />
The taxes disclosed in the consolidated income statement recognise the<br />
Group companies' taxes on current net profits on an accrual basis, prior<br />
period tax adjustments and changes in deferred taxes. The Group companies'<br />
taxes are calculated from the taxable profit of each company determined<br />
by local jurisdiction.<br />
Deferred tax assets and liabilities are recognised for all temporary<br />
differences between the tax bases and carrying amounts of assets and<br />
liabilities. Deferred tax has not been calculated on goodwill insofar as<br />
goodwill is not tax deductible. Deferred tax on subsidiaries' undistributed<br />
earnings is not recognised if the distribution of earnings is not probable<br />
and causes tax consequences.<br />
Deferred tax is calculated using tax rates enacted by the balance<br />
sheet date, and if the rates change, at the new rate expected to apply.<br />
A deferred tax asset is recognised to the extent that it is probable that it<br />
can be utilised against future profit. The Group's deferred tax assets and<br />
liabilities are offset when they relate to income taxes levied by the same<br />
taxation authority.<br />
The most significant temporary differences arise from defined benefit<br />
plans, tangible assets (depreciation difference, finance lease) and<br />
measurement at fair value of asset items in connection with business<br />
acquisitions.<br />
Dividend distribution<br />
The dividend proposed by the Board to the Annual General Meeting has<br />
not been deducted from equity. Instead dividends are recognised on the<br />
basis of the decision of the Annual General Meeting.<br />
New IFRS standards and interpretations<br />
In <strong>2007</strong>, the IASB (International Accounting Standards Board) published<br />
the following standards, amendments to standards, and interpretations<br />
whose application will become mandatory in 2008 or later. They will be<br />
adopted by the Group as they become effective.<br />
IFRS 8, Operating Segments (effective from accounting periods<br />
beginning after 1 January 2009). IFRS 8 supersedes IAS 14, Segment<br />
Reporting. The standard requires the 'management approach' in the<br />
sense that segment information is reported on the same principles as<br />
those used internally by the management for monitoring segment performance.<br />
The Group's management assesses that the standard will not<br />
change the present segment reporting in any material way, because the<br />
business segments determined in accordance with internal reporting are<br />
the Group's primary reporting format. The standard has been endorsed<br />
by the European Union.<br />
IAS 1, (revised) Presentation of Financial Statements (effective from<br />
accounting periods beginning after 1 January 2009). The revised standard<br />
will mainly have an impact on the face of financial statements. The<br />
Group's management assesses that the revision of the standard will<br />
mainly have an impact on the presentation of the income statement and<br />
the statement of changes in equity. The revised standard has not yet been<br />
endorsed by the European Union.<br />
IFRS 3 (revised), Business Combinations. The revised standard continues<br />
to apply the acquisition method to business combinations, with<br />
some significant changes. For example, all payments to purchase a business<br />
are to be recorded at fair value at the acquisition date, with some<br />
contingent payments subsequently re-measured at fair value through<br />
income. Goodwill may be calculated based on the parent’s share of net<br />
assets or it may include goodwill related to the minority interest. All<br />
transaction costs will be expensed. The Group's management estimates<br />
that the change will affect the accounting for business acquisitions. The<br />
revised standard has not yet been endorsed for application in the EU.<br />
Amendment to IAS 23, Borrowing Costs (effective from accounting<br />
periods beginning after 1 January 2009). The amendment of the standard<br />
removes the option of immediately expensing borrowing costs attributable<br />
to the acquisition, construction or production of a qualifying asset as<br />
part of the cost of that asset. These borrowing costs are eligible for capitalisation<br />
as part of the cost of the asset. The Group presently recognises<br />
borrowing costs for the accounting period in which they incur. The
Year <strong>2007</strong><br />
Divisions The Group<br />
Financial<br />
statements<br />
Further information<br />
Group's management assesses that the amendment will not have a significant<br />
impact on the consolidated profit. The revised standard has not yet<br />
been endorsed by the European Union.<br />
IAS 27 (revised), Consolidated and Separate Financial Statements.<br />
The revised standard requires that all transactions with non-controlling<br />
interests be recorded in equity if there is no change in control. Consequently,<br />
minority transactions will no longer result in the recognition of<br />
goodwill or profit or loss in the income statement. The standard also<br />
specifies the accounting for transactions when control is transferred.<br />
The Group's management estimates that the change will have an impact<br />
in possible business arrangement situations. The revised standard has<br />
not yet been endorsed by the European Union.<br />
IFRIC 13, Customer Loyalty Programmes (effective from accounting<br />
periods beginning after 1 July 2008). The interpretation will be applied to<br />
the recognition and measurement of refunds linked to customer loyalty<br />
systems. Presently the Group recognises the expenditure of customer<br />
loyalty programmes in other operating expenses. The Group's management<br />
assesses that the interpretation will impact the Group's net sales,<br />
but the impact will not be material. The interpretation will not impact<br />
the Group's operating profit. The interpretation has not yet been<br />
endorsed by the European Union.<br />
IFRIC 14, The Limit on a Defined Benefit Asset, Minimum Funding<br />
Requirements and Their Interaction. The interpretation applies to the<br />
extent to which the excess of a defined benefit plan can be recognised.<br />
The Group's management assesses that the interpretation will not be relevant<br />
to the Group's financial statements. The interpretation has not yet<br />
been endorsed by the European Union.<br />
Note 1<br />
Segment information<br />
In segment reporting, a business segment has been determined as the<br />
primary reporting format and a geographical segment as the secondary<br />
reporting format. Business segments are based on the Group's internal<br />
organisation and internal financial reporting.<br />
The basis of inter-segment pricing is fair market price.<br />
The segment income statement is disclosed down to operating profit.<br />
Segment assets and liabilities consist of items used by the segment in its<br />
operating activities, or items justifiably allocated to segments. Segment<br />
assets comprise intangible assets including goodwill, tangible assets,<br />
inventories, trade receivables and deferred revenue and other accruals<br />
linked to operating activities. Segment liabilities consist of trade payables,<br />
accrued liabilities and provisions linked to operating activities. The<br />
Group's real estate assets and their revenue and costs have been allocated<br />
to the segments. The division parent companies have profit responsibility<br />
for real estate during their whole lifecycles.<br />
The Group changed its business segment classification with effect<br />
from the beginning of the <strong>2007</strong> accounting period. The change was due<br />
to the reorganisation of the home and speciality goods chains. Consequently,<br />
these companies are accounted for as separate entities. The<br />
information for the comparison <strong>year</strong> has been modified to correspond to<br />
the new segment classification.<br />
Business segments<br />
Business segments are composed of the Group's business divisions.<br />
91<br />
Kesko Food operates in the Finnish grocery market and its retail chains<br />
are K-citymarket, K-supermarket, K-market and K-extra. With effect from<br />
10 October 2006, the Baltic joint venture was classified as a discontinuing<br />
operation. Kesko Food manages K-food store chains and combines<br />
their purchasing power, arranges efficient logistics, acquires store sites<br />
and guarantees strong marketing and development support for K-food<br />
stores. Kesko Food’s subsidiary Kespro Ltd offers delivery sales and<br />
wholesale services to HoReCa customers.<br />
Rautakesko operates in the building and home improvement trade in the<br />
Nordic countries, the Baltic countries, Russia and Belarus. Its retail<br />
chains are K-rauta, Rautia, Byggmakker and Senukai. Rautakesko manages<br />
its chains and combines their purchasing power, arranges efficient<br />
logistics, acquires store sites and guarantees strong marketing and<br />
development support for the stores. Rautakesko's B-to-B Service serves<br />
building firms, industrial and other professional customers.<br />
VV-Auto imports and markets Volkswagen, Audi and Seat passenger cars<br />
and Volkswagen commercial vehicles in Finland. VV-Auto is also engaged<br />
in car retailing and provides after-sales services in its own retail outlets.<br />
Anttila concentrates on the department store trade. Anttila comprises<br />
the Anttila department stores and the Kodin Ykkönen department stores<br />
for home goods and interior decoration, Anttila MailOrder and the<br />
NetAnttila online department store.<br />
Kesko Agro's K-agriculture chain purchases and sells animal feed, chemicals<br />
and machinery to agricultural entrepreneurs and trades in grain<br />
with them. Kesko Agro is active in Finland and in the Baltic countries.<br />
Other operating activities comprise the reporting for Konekesko, engaging<br />
in the machinery trade, Indoor in the furniture and interior decoration<br />
trade, Intersport Finland in the sports trade, Musta Pörssi in the<br />
home technology trade, Kenkäkesko in the shoe trade, Tähti Optikko in<br />
the optical trade, and Kauko-Telko specialising in the international technical<br />
trade.<br />
Common operations include joint intra-Group support functions.<br />
Geographical segments, continuing operations<br />
The geographical segments are composed of the four geographical areas<br />
with different economic situations in which the Group is active, namely<br />
Finland, the other Nordic countries, the Baltic countries and other<br />
countries.<br />
The net sales of the geographical segments are allocated based on the<br />
country in which the customers are located and assets are allocated<br />
based on where the assets are located.
92<br />
<strong>Kesko's</strong> <strong>year</strong> <strong>2007</strong><br />
Business segments <strong>2007</strong>, continuing operations<br />
€ million Kesko Food<br />
Rauta-<br />
kesko VV-Auto Anttila Kesko Agro<br />
Other<br />
operating<br />
activities<br />
Common<br />
operations<br />
Elimi-<br />
nations Total<br />
External sales 3,920.9 2,580.1 820.3 565.6 797.9 1,011.3 151.6 9,847.7<br />
Inter-segment sales -185.1 -185.1<br />
Adjustment items -50.1 -42.8 -15.5 -1.9 -4.5 -14.0 -128.8<br />
Net sales 3,870.8 2,537.3 804.8 563.7 793.4 997.3 151.6 -185.1 9,533.8<br />
Other operating income 378.7 104.7 0.6 13.4 7.3 63.6 26.5 594.8<br />
Other inter-segment income -17.2 -17.2<br />
Total other operating income 378.7 104.7 0.6 13.4 7.3 63.6 26.5 -17.2 577.6<br />
Operating profit 151.3 117.8 26.1 27.2 12.9 4.2 -20.0 12.4 331.9<br />
Operating profit excl.<br />
non-recurring items 151.4 115.9 26.1 25.2 12.4 24.0 -30.1 0.2 325.1<br />
Financial income and expenses 37.0<br />
Income from associates 0.4<br />
Income tax expense -90.2<br />
Net profit from discontinued operations 28.2<br />
Net profit 307.4<br />
Other information<br />
Segment assets 1,355.3 901.3 205.9 195.5 244.2 416.1 83.1 3,401.4<br />
Assets held for sale 236.9 236.9<br />
Interests in associates 27.0<br />
Unallocated assets 427.6<br />
Eliminations -0.2 -0.2<br />
Total assets 1,355.3 901.3 205.9 195.5 244.2 416.1 320.0 -0.2 4,092.7<br />
Segment liabilities 521.8 290.4 54.7 75.6 129.9 200.2 80.7 1,353.3<br />
Liabilities related to assets held for sale 3.3 3.3<br />
Unallocated liabilities 800.1<br />
Eliminations -28.4 -28.4<br />
Total liabilities 521.8 290.4 54.7 75.6 129.9 200.2 84.0 -28.4 2,128.3<br />
Investments 117.6 77.0 6.3 5.8 7.6 14.6 9.7 -4.7 233.9<br />
Depreciation 60.1 25.9 5.7 6.1 4.3 11.7 5.4 -0.3 118.7<br />
Impairment 0.5 0.5
Year <strong>2007</strong><br />
Business segments 2006, continuing operations<br />
€ million Kesko Food<br />
Divisions The Group<br />
Financial<br />
statements Further information 93<br />
Rauta-<br />
kesko VV-Auto Anttila Kesko Agro<br />
Other<br />
operating<br />
activities<br />
Common<br />
operations<br />
Elimi-<br />
nations Total<br />
External sales 3,653.2 2,167.2 806.6 547.7 758.6 959.3 151.7 9,044.3<br />
Inter-segment sales -183.1 -183.1<br />
Adjustment items -38.7 -38.3 -17.5 -0.1 -3.9 -13.4 -0.2 -112.1<br />
Net sales 3,614.5 2,128.9 789.1 547.6 754.7 945.9 151.5 -183.1 8,749.2<br />
Other operating income 403.8 140.5 0.4 21.9 8.8 62.0 32.7 670.1<br />
Other inter-segment income -9.3 -9.3<br />
Total other operating income 403.8 140.5 0.4 21.9 8.8 62.0 32.7 -9.3 660.8<br />
Operating profit 173.2 139.3 29.4 38.7 9.2 4.9 -23.6 -8.5 362.6<br />
Operating profit excl.<br />
non-recurring items 128.6 91.2 29.5 26.5 7.8 21.6 -26.4 1.1 279.9<br />
Financial income and expenses -5.5<br />
Income from associates 0.7<br />
Income tax expense -107.1<br />
Net profit from discontinued operations 128.7 128.7<br />
Net profit 379.4<br />
Other information<br />
Segment assets 1,271.0 764.6 193.3 196.7 226.7 396.2 85.5 3,134.0<br />
Assets held for sale 22.2 22.2<br />
Interests in associates 25.5<br />
Unallocated assets 627.1<br />
Eliminations -1.6 -1.6<br />
Total assets 1,271.0 764.6 193.3 196.7 226.7 396.2 107.7 -1.6 3,807.2<br />
Segment liabilities 486.8 273.4 54.5 71.7 125.2 192.7 90.5 1,294.8<br />
Liabilities related to assets held for sale<br />
Unallocated liabilities 782.9<br />
Eliminations -47.8 -47.8<br />
Total liabilities 486.8 273.4 54.5 71.7 125.2 192.7 90.5 -47.8 2,029.9<br />
Investments 82.2 75.8 34.2 4.6 11.8 35.6 16.0 -9.7 250.5<br />
Depreciation 64.9 23.4 7.7 8.1 3.9 8.6 12.4 -0.3 128.7<br />
Impairment 30.3 0.6 0.2 31.1
94 <strong>Kesko's</strong> <strong>year</strong> <strong>2007</strong><br />
Geographical segments <strong>2007</strong><br />
€ million Finland<br />
Note 2<br />
Acquisitions<br />
Acquisitions in <strong>2007</strong><br />
In <strong>2007</strong>, the Kesko Group acquired companies at immaterial cost. Their<br />
acquisition cost totalled €6.0 million and the cash outflow, additional<br />
purchase prices included, €21.9 million.<br />
Acquisitions in 2006<br />
VV-Auto Group<br />
VV-Auto Oy and its retail company Helsingin VV-Auto Oy acquired the<br />
Volkswagen and Audi business operations from Stockmann Auto Oy on 1<br />
March 2006. The deal covered Stockmann Auto Oy Ab's sales and aftersales<br />
services concerning Audi and Volkswagen in Helsinki, Espoo and<br />
Vantaa. The deal included two real properties. The debt-free transaction<br />
price was about €26 million.<br />
The operations acquired in 2006 contributed net sales of €38.4 million<br />
and operating profit of €-0.4 million to the Kesko Group for the<br />
10-month period. If the acquisition had been consolidated from the<br />
beginning of 2006, its contribution to the Group's net sales for 2006<br />
would have been €47.9 million and to the operating profit €-0.1 million.<br />
No goodwill was generated on the acquisition.<br />
Other Nordic<br />
countries<br />
Baltic<br />
countries<br />
Purchase consideration<br />
(acquired operations excluding real estate)<br />
€ million<br />
Cash paid 15.8<br />
Costs allocated to acquisitions -<br />
Total consideration 15.8<br />
Fair value of net assets acquired 15.8<br />
Goodwill 0.0<br />
Analysis of net assets acquired<br />
Other<br />
countries<br />
Eliminations,<br />
€ million Fair value<br />
Acquiree's<br />
carrying<br />
amount<br />
Intangible assets 1.1 1.1<br />
Property, plant and equipment 2.3 2.3<br />
Inventories 3.1 1.5<br />
Receivables 11.1 11.0<br />
Non-interest-bearing debt 0.1 0.1<br />
Pension obligations -1.9 -1.9<br />
Net assets acquired 15.8 14.1<br />
Minority interest acquired 0.0 0.0<br />
Fair value of net assets acquired 15.8 14.1<br />
Consideration settled in cash 15.8<br />
Cash outflow on acquisition 15.8<br />
unallocated Total<br />
Net sales 7,515.9 848.0 978.9 233.7 -42.7 9,533.8<br />
Segment assets 2,621.0 269.2 359.6 93.1 512.9 3,855.8<br />
Assets held for sale 102.8 134.1 236.9<br />
Investments 177.7 29.2 20.6 6.6 -0.2 233.9<br />
Geographical segments 2006<br />
€ million Finland<br />
Other Nordic<br />
countries<br />
Baltic<br />
countries<br />
Other<br />
countries<br />
Eliminations,<br />
unallocated Total<br />
Net sales 7,083.1 740.9 824.5 143.9 -43.2 8,749.2<br />
Segment assets 2,458.6 226.7 349.5 64.3 708.1 3,807.2<br />
Assets held for sale 1.6 20.7 22.2<br />
Investments 189.4 15.5 24.8 21.4 -0.6 250.5<br />
In addition, the Kesko Group acquired companies with immaterial financial<br />
impact, most of which are real estate companies. The cost of these<br />
acquisitions totalled €10.8 million. The total cash outflow from all acquisitions<br />
was €-20.6 million.
Year <strong>2007</strong><br />
Note 3<br />
Divisions The Group<br />
Financial<br />
statements<br />
Further information<br />
Discontinued operations and disposal of other assets<br />
Discontinued operations in <strong>2007</strong><br />
In 2006, Kesko Food Ltd sold its 50% ownership interest in Rimi Baltic<br />
AB. The real estate included in the deal was sold in January <strong>2007</strong>. The<br />
gain on the disposal of the properties, €28.2 million, is presented in the<br />
results of discontinued operations.<br />
Disposal group in <strong>2007</strong><br />
In December <strong>2007</strong>, Kesko Corporation signed an agreement by which it<br />
sells the share capital of K-Rahoitus Oy, a subsidiary wholly owned by it.<br />
K-Rahoitus Oy provides financing services to business customers, mainly<br />
to professional customers of Kesko Agro, Konekesko and the agricultural<br />
retailers in Finland, Estonia, Latvia and Lithuania. The company has 7<br />
employees in Finland and 15 in the Baltic countries. The whole personnel<br />
will transfer to the new employer. The transaction will be concluded after<br />
clearance from the authorities during the first part of 2008. When the<br />
deal is concluded, Kesko will recognise a non-recurring gain on the disposal<br />
of about 10 million euros. K-Rahoitus Oy's on-balance-sheet items<br />
are presented as assets held for sale and related liabilities (Note 25).<br />
Discontinued operations in 2006<br />
Rimi Baltic AB<br />
In October 2006, Kesko Food Ltd and ICA Baltic AB signed an agreement<br />
that ICA Baltic would acquire Kesko Food's 50% shareholding in Rimi<br />
Baltic AB. Consequently Rimi Baltic AB was classified as a discontinued<br />
operation. The transaction was closed on 18 December 2006. It was also<br />
agreed that Rimi Baltic would acquire the food trade properties leased by<br />
it in Estonia and owned by Fiesta Real Estate AS, an Estonian subsidiary<br />
of Kesko. That part of the deal was concluded in January <strong>2007</strong>. The selling<br />
price of the shares was €190 million and that of the properties<br />
€50million. <strong>Kesko's</strong> gain on the disposal of the shares was €131.2 million.<br />
The properties included in the transaction were reported in assets held<br />
for sale in the financial statements for 2006.<br />
Net assets of discontinued operations at date of disposal<br />
€ million <strong>2007</strong> 2006<br />
Cash - 10.9<br />
Intangible assets - 23.1<br />
Property, plant and equipment - 85.1<br />
Inventories - 33.8<br />
Receivables - 11.6<br />
Non-interest-bearing debt - -64.5<br />
Interest-bearing debt - -42.3<br />
Deferred tax liabilities (net) - 1.1<br />
58.8<br />
Gains/losses on disposal - 131.2<br />
Total consideration - 190.0<br />
95<br />
€ million <strong>2007</strong> 2006<br />
Received in cash - 190.0<br />
Received in shares -<br />
Cash and cash equivalents in disposed entity - -10.9<br />
Cash inflow on disposal - 179.2<br />
Income statement for discontinued operations<br />
€ million <strong>2007</strong> 2006<br />
Net sales - 461.9<br />
Expenses - 464.0<br />
Profit before tax - -2.1<br />
Income taxes - -0.4<br />
Profit after tax - -2.5<br />
Profit before tax on disposal of operations - 131.2<br />
Net profit on the disposal of operations - 128.7<br />
Cash flow statement for discontinued operations<br />
Milj.€ <strong>2007</strong> 2006<br />
Cash flow from operating activities - 10.8<br />
Cash flow from investing activities - -21.0<br />
Cash flow from financing activities - -3.2<br />
Cash flow from discontinued operations - -13.4<br />
Other assets sold in 2006<br />
BT warehouse technology<br />
Konekesko Ltd sold its warehouse technology business in Finland to BT<br />
Industries AB of Sweden. The warehouse technology business included<br />
Konekesko's forklift and warehouse racking sales and their after-sales<br />
service operations. In connection with the transaction, all of the warehouse<br />
technology product line staff (about 70 people) were transferred to<br />
the new company under their previous conditions. In 2005, the assets<br />
had been classified as assets held for sale. The business deal was concluded<br />
on 1 January 2006. The gain on business disposal was €2.6<br />
million.<br />
Real estate sold<br />
Kesko Corporation sold 77 retail properties in various parts of Finland to<br />
Niam Retail Holding Finland AB. The price was about €200 million. The<br />
Kesko Group's gain on the disposal was €99.8 million. The Kesko Group's<br />
lease liabilities, covering all properties leased at the time of sale and<br />
totalling approximately €144 million, were not classified as finance<br />
leases. Lease liabilities concerning the real estate sold by the Kesko<br />
Group amounted to €118 million. Out of the 77 real estate properties covered<br />
by the deal, 57 are used by K-food store chains, 14 by the K-rauta and<br />
Rautia chains, four by the K-maatalous chain and two by the chain of<br />
Anttila department stores. In 2005, these properties were reported as<br />
assets held for sale.
96 <strong>Kesko's</strong> <strong>year</strong> <strong>2007</strong><br />
Notes to the consolidated income<br />
statement<br />
Note 4<br />
Other operating income<br />
€ million <strong>2007</strong> 2006<br />
Sales of services 433.0 403.7<br />
Rent income 35.4 42.6<br />
Gains on disposal of tangible assets 13.9 120.1<br />
Gains from derivative instruments 2.2 2.6<br />
Others 93.1 91.8<br />
Total 577.6 660.8<br />
Sales of services mainly consist of chain and store site fees paid by chain<br />
companies for chain concepts.<br />
Note 5<br />
Other operating expenses<br />
€ million <strong>2007</strong> 2006<br />
Rent expenses -317.7 -290.1<br />
Marketing costs -258.9 -235.4<br />
Occupancy costs of real estate and store sites -112.7 -104.7<br />
Data communications costs -62.3 -62.0<br />
Other trading expenses -186.7 -170.6<br />
Losses from disposal of tangible assets -1.7 -3.8<br />
Losses from derivative instruments * ) -2.1 -2.5<br />
Total -942.1 -869.1<br />
*) Includes revaluations of embedded derivatives.<br />
Note 6<br />
Non-recurring items<br />
€ million <strong>2007</strong> 2006<br />
Gains on disposal of real estate and shares 13.9 122.2<br />
Losses on disposal of real estate and<br />
shares and impairment -1.6 -3.2<br />
Impairment losses -0.5 -31.1<br />
Others -5.0 -5.1<br />
Total 6.8 82.8<br />
Extraordinary transactions that are not related to ordinary operating<br />
activities are treated as non-recurring items and allocated to segments.<br />
The Group classifies as non-recurring items gains and losses on the disposal<br />
of real estate, shares, operating activities, and impairment and discontinuation<br />
costs of significant operating activities. The gains on disposal<br />
are presented in the income statement in other operating income,<br />
and the losses on disposal in other operating expenses.<br />
Impairment losses<br />
During the period, a total amount of €0.5 million (€31.3million) in<br />
impairment losses was recognised as an expense in the income<br />
statement.<br />
Impairment losses or their reversals have not been recognised<br />
directly in equity.
Year <strong>2007</strong><br />
Note 7<br />
Staff costs, number of employees and<br />
management's salaries<br />
Divisions The Group<br />
Financial<br />
statements<br />
Further information<br />
€ million <strong>2007</strong> 2006<br />
Salaries and fees -501.1 -459.5<br />
Social security costs -47.8 -43.9<br />
Pension costs -24.9 -38.7<br />
Defined benefit plans 25.0 11.2<br />
Defined contribution plans -49.9 -49.9<br />
Stock options granted -2.3 -2.1<br />
Total -576.1 -544.2<br />
The employee benefits and loans of the Group's management are disclosed<br />
in Note 46 Related party transactions and information concerning<br />
stock option plans are presented in Note 37.<br />
Salaries and fees of Group companies' Managing Directors and<br />
Boards of Directors<br />
Salaries of managing directors<br />
(incl. fringe benefits) 6.6 7.8<br />
Fees of Board members 0.3 0.4<br />
Total 6.9 8.2<br />
Average number of the Group employees <strong>2007</strong> 2006<br />
Kesko Food 5,964 6,171<br />
Rautakesko 9,111 7,420<br />
VV-Auto 737 621<br />
Anttila 2,058 2,058<br />
Kesko Agro 797 885<br />
Other operating activities 2,233 2,135<br />
Other entities 276 372<br />
Total Group companies 21,176 19,662<br />
Joint ventures - 4,105<br />
Total Kesko Group 21,176 23,767<br />
Note 8<br />
Financial income and expenses<br />
97<br />
€ million <strong>2007</strong> 2006<br />
Financial income<br />
Dividend income from available-for-sale<br />
financial assets<br />
Interest income from loans and other<br />
0.1 2.8<br />
receivables<br />
Interest income from financial assets car-<br />
26.9 20.1<br />
ried at fair value through profit or loss<br />
Interest income from available-for-sale<br />
4.1 0.2<br />
financial assets 7.6 2.7<br />
Interest income<br />
Exchange differences and fair value changes<br />
of derivative financial instruments and currency-denominated<br />
loans and bank<br />
38.6 23.0<br />
accounts not qualified for hedge accounting<br />
Gains from disposals of available-for-sale<br />
11.1 8.5<br />
financial assets 37.2 3.8<br />
Total 87.1 38.1<br />
Financial expenses<br />
Interest expenses on financial liabilities<br />
carried at amortised cost<br />
Exchange differences and fair value changes<br />
of derivative financial instruments and<br />
currency-denominated loans and bank<br />
-33.1 -32.2<br />
accounts not qualified for hedge accounting -15.7 -7.7<br />
Other financial expenses -1.3 -3.7<br />
Total -50.1 -43.6<br />
Total financial income and expenses 37.0 -5.5<br />
The gains on disposal of available-for-sale financial assets include the<br />
€37.1 million gain on the disposal of SATO shares.<br />
Other financial expenses include €0.6 million (€3.0 million) in servicing<br />
fees for customer finance receivables sold.<br />
Financial expenses include €10.8 (€10.5 million) in interest on<br />
finance leases recognised as expenses for the period. Financial income<br />
include €1.6 (€1.4 milion) in interest on finance leases reported as<br />
income for the period.<br />
The profit from the realised interest rate derivative instruments used<br />
to hedge the USD-denominated private placement loan is recognised in<br />
net terms in interest expenses with the loan interest.<br />
Exchange differences recognised in the income statement<br />
€ million <strong>2007</strong> 2006<br />
Net sales -0.1 -0.2<br />
Purchases and other expenses -4.5 6.0<br />
Financial income and expenses -4.7 0.5<br />
Total -9.3 6.3
98 <strong>Kesko's</strong> <strong>year</strong> <strong>2007</strong><br />
Note 9<br />
Income taxes<br />
Income taxes in the income statement<br />
€ million <strong>2007</strong> 2006<br />
Current tax -78.2 -95.1<br />
Tax for prior periods -7.5 -24.2<br />
Deferred taxes -4.5 12.2<br />
Total -90.2 -107.1<br />
Reconciliation between tax expense recognised in the income statement<br />
and tax calculated at domestic rate:<br />
Profit before tax 369.3 357.8<br />
Tax at parent's rate (26%) -96.0 -93.0<br />
Effect of foreign subsidiaries' different<br />
tax rates 5.0 6.0<br />
Effect of income not subject to tax<br />
Effect of expenses not deductible for<br />
12.8 1.4<br />
tax purposes -11.0 -8.3<br />
Effect of tax losses -0.7 7.8<br />
Effect of consolidation and elimination 2.2 0.5<br />
Taxes for prior periods -7.5 -24.2<br />
Adjustment of prior period deferred taxes 2.4 0.0<br />
Others 2.6 2.7<br />
Taxes in the income statement -90.2 -107.1<br />
Most part, €–5.8 million, of prior period taxes relate to Rautakesko Ltd's<br />
2001 fiscal <strong>year</strong>, on which the Helsinki Administrative Court gave its<br />
decision in <strong>2007</strong>. Most part of the prior period taxes in the amount of<br />
€–24.2 million recorded in 2006 consisted of the recovery of the €67.3<br />
million impairment made by Kesko Corporation on the shares of<br />
Hämeenkylän Kauppa Oy (former Tuko Oy) in 1996.<br />
Note 10<br />
Earnings per share<br />
Basic earnings per share is calculated by dividing the net profit attributable<br />
to the parent's equity holders by the weighted average number of<br />
shares outstanding during the period. Diluted earnings per share is<br />
calculated by adjusting the weighted average number of all shares to<br />
assume conversion of all potentially dilutive shares. The Group operates<br />
a stock option scheme with a dilutive effect, which increases the number<br />
of stocks. The stock options have a dilutive effect when their exercise<br />
price is lower than the fair value of a share. The dilutive effect is the<br />
number of shares which has to be issued without consideration, because<br />
the Group could not use the assets received from the exercise of the stock<br />
options to issue an equal number of shares at fair value. The fair value of<br />
a share is based on the average share price during the period.<br />
€ million <strong>2007</strong> 2006<br />
Profit for the period attributable<br />
to parent's equity holders, € million<br />
Profit for the period attributable<br />
to parent's equity holders, continuing<br />
285.0 368.7<br />
operations, € million<br />
Profit for the period attributable<br />
to parent's equity holders, discontinued<br />
256.8 240.0<br />
operations, € million 28.2 128.7<br />
Number of shares<br />
Weighted average of outstanding shares 97,665,884 97,152,281<br />
Effect of options granted<br />
Diluted weighted average<br />
729,435 874,714<br />
of outstanding shares 98,395,319 98,026,995<br />
Basic earnings per share 2.92 3.80<br />
Diluted earnings per share 2.90 3.76<br />
Basic earnings per share from continuing<br />
operations<br />
Diluted earnings per share from<br />
2.63 2.47<br />
continuing operations 2.61 2.45<br />
Basic earnings per share from<br />
discontinued operations<br />
Diluted earnings per share from<br />
0.29 1.33<br />
discontinued operations 0.29 1.31
Year <strong>2007</strong><br />
Divisions The Group<br />
Financial<br />
statements Further information 99<br />
Notes to the consolidated balance sheet<br />
Note 11<br />
Intangible assets<br />
€ million Goodwill Trademarks<br />
Other<br />
intangible<br />
assets<br />
Pre-<br />
payments<br />
Cost<br />
Cost at 1 January <strong>2007</strong> 161.0 77.0 112.3 9.7 360.1<br />
Currency translation differences 1.7 1.3 0.7 3.7<br />
Additions 3.2 22.0 8.5 33.7<br />
Acquisition of subsidiary -1.3 1.8 0.5<br />
Disposals -1.5 -3.8 -1.3 -6.6<br />
Transfers between groups 0.2 -8.5 -3.5 -11.7<br />
Cost at 31 December <strong>2007</strong> 163.3 78.3 124.5 13.4 379.7<br />
Accumulated amortisation<br />
Accumulated amortisation and impairment at 1 January <strong>2007</strong> -30.2 -21.3 -60.5 -112.1<br />
Currency translation differences -0.1 -0.1<br />
Accumulated amortisation of disposals and transfers 1.2 9.1 10.3<br />
Amortisation for the period -25.6 -25.6<br />
Impairment 0.0<br />
Accumulated amortisation and impairment at 31 December <strong>2007</strong> -29.0 -21.3 -77.2 -127.5<br />
Carrying amount at 1 January <strong>2007</strong> 130.8 55.7 51.8 9.7 248.0<br />
Carrying amount at 31 December <strong>2007</strong> 134.3 57.0 47.3 13.4 252.2<br />
€ million<br />
Cost<br />
Total<br />
2006<br />
Cost at 1 January 2006 172.4 88.3 118.4 2.9 382.0<br />
Currency translation differences -1.5 -1.2 -0.5 -3.2<br />
Additions 4.2 0.1 15.2 9.4 28.9<br />
Acquisition of subsidiary -1.8 0.0 1.5 -0.3<br />
Disposals -15.9 -6.9 -18.9 -1.2 -42.9<br />
Transfers between groups 3.6 -3.3 -3.4 -1.4 -4.5<br />
Cost at 31 December 2006 161.0 77.0 112.3 9.7 360.1<br />
Accumulated amortisation<br />
Accumulated amortisation and impairment at 1 January 2006 -20.6 -53.8 -74.4<br />
Currency translation differences 0.1<br />
Accumulated amortisation of disposals and transfers 18.8 18.8<br />
Amortisation for the period -25.6 -25.6<br />
Impairment -9.6 -21.3 -30.9<br />
Accumulated amortisation and impairment at 31 December 2006 -30.2 -21.3 -60.5 -112.1<br />
Carrying amount at 1 January 2006 151.8 88.3 64.6 2.9 307.6<br />
Carrying amount at 31 December 2006 130.8 55.7 51.8 9.7 248.0<br />
Total<br />
<strong>2007</strong>
100 <strong>Kesko's</strong> <strong>year</strong> <strong>2007</strong><br />
Goodwill and intangible assets by segment<br />
Intangible<br />
assets * Goodwill<br />
The useful lives of trademarks (brands) included in intangible assets<br />
have been classified as indefinite because it has been estimated that they<br />
will affect the generation of cash flows over an indefinite period. This is<br />
because no foreseeable limit to the period over which they are expected<br />
to generate net cash inflows for the Group can be seen. Trademarks are<br />
part of assets purchased in connection with acquisitions.<br />
Intangible assets with indefinite lives are tested annually for possible<br />
impairment and whenever there is an indication of impairment.<br />
Impairment test for goodwill and intangible assets<br />
The recoverable amount of a cash-generating unit is determined based<br />
on value-in-use calculations. These calculations use cash flow projections<br />
based on financial plans approved by the management covering a<br />
period of 3–5 <strong>year</strong>s. The key assumptions used for the plans are total market<br />
development and profitability, changes in store network, product and<br />
service selection and pricing. Cash flows beyond the period are extrapolated<br />
using mainly 1–2% growth rates. The discount rate used is the<br />
WACC, specifed for each division and country after tax, which is adjusted<br />
by tax effects in connection with the test. The WACC formula inputs are<br />
risk-free rate of return, market risk premium, industry-specific beta factor,<br />
target capital structure, borrowing cost and country risks.<br />
Impairment losses<br />
During the <strong>2007</strong> accounting period, impairment was not allocated to<br />
goodwill and trademarks with indefinite useful lives.<br />
For the 2006 accounting period, an impairment charge of €30.3 million<br />
was made against intangible assets relating to Indoor Group operations<br />
(Finland). Of this amount €21.3 million was allocated to trademarks<br />
and €9.0 million to goodwill, with both amounts reported as non-recur-<br />
Discount rate<br />
(WACC) **<br />
Intangible<br />
assets * Goodwill<br />
Discount rate<br />
(WACC) **<br />
€ million <strong>2007</strong> <strong>2007</strong> <strong>2007</strong> 2006 2006 2006<br />
Rautakesko<br />
Other Nordic countries 39.2 48.9 7.5% 37.9 46.8 7.0%<br />
Baltic countries 18.3 9.0–11.0% 18.3 9.0%<br />
Others 14.0 12.0% 13.9 12.0%<br />
Anttila<br />
Finland 23.4 7.0% 17.8 23.4 6.5%<br />
Other operating activities<br />
Finland 17.8 29.8 7.0–7.5% 28.4 6.5–7.0%<br />
Other countries 1.5<br />
Total 57.0 134.3 55.7 130.8<br />
* intangible assets with indefinite useful lives ** after tax<br />
Cash-generating units have mainly been identified at a level lower than business segments. The units have been identified by chain/country, which<br />
substantially corresponds to the legal structure.<br />
ring items. The impairment loss was due to weaker-than-expected profitability<br />
and a tightened competitive situation especially in the Greater<br />
Helsinki area. In addition, retail sales failed to meet expectations despite<br />
the expanded retail network. Consequently, revenue expectations concerning<br />
Indoor Group were estimated to have declined. Indoor Group's<br />
operations and its existing retail chains will be developed by investing<br />
heavily in its competitiveness any by increasing the stores' selling areas.<br />
Investments will be made in the trademarks in order to improve their<br />
appeal. Indoor Group is a separate cash generating unit and belongs to<br />
the Other operating activities segment.<br />
Additionally, an impairment charge of €0.6 million relating to the<br />
Intersport operations was made for the period, due to the business being<br />
transferred outside the Group without compensation.<br />
Sensitivity analysis<br />
The key variables used in the impairment test are EBITDA percentage<br />
and discount rate.<br />
When cash generating units are estimated according to the management's<br />
assumptions, a foreseeable possible change in any key variable<br />
would not create a situation in which the recoverable amounts of cash<br />
generating units would be less than their carrying amounts. The intangible<br />
assets related to Indoor Group's and Bryggmakker's operating activities<br />
are the most sensitive to changes in assumptions. A change of 1 percentage<br />
point in their discount rates would not cause impairment. A 0.5<br />
percentage point change in future <strong>year</strong>s' operating margins would not<br />
result in impairment either.
Year <strong>2007</strong><br />
Note 12<br />
Tangible assets<br />
€ million<br />
Divisions The Group<br />
Financial<br />
statements Further information 101<br />
Land and<br />
water Buildings<br />
Machinery and<br />
equipment<br />
Other<br />
tangible<br />
assets<br />
Pre-payments<br />
and purchases<br />
in progress<br />
Cost<br />
Cost at 1 January <strong>2007</strong> 212.7 1,079.4 465.8 25.7 25.1 1,808.6<br />
Currency translation differences -0.8 -1.4 -0.6 -0.1 -0.2 -3.1<br />
Additions 22.6 56.6 82.5 6.1 29.9 197.7<br />
Acquisition of subsidiary 1.6 6.6 2.5 0.0 1.8 12.5<br />
Disposals -7.7 -27.0 -67.7 -0.4 -1.2 -104.0<br />
Transfers between groups -5.2 26.3 -1.1 4.9 -25.5 -0.6<br />
Cost at 31 December <strong>2007</strong> 223.2 1,140.7 481.4 36.2 29.9 1,911.3<br />
Accumulated depreciation<br />
Accumulated depreciation and impairment at 1<br />
January <strong>2007</strong> -2.4 -376.8 -305.5 -9.0 -693.9<br />
Currency translation differences<br />
Accumulated depreciation of disposals and<br />
0.3 0.3 0.6<br />
transfers -1.3 3.8 28.4 -2.4 28.5<br />
Depreciation for the period -41.4 -48.9 -2.7 -92.8<br />
Impairment -0.5 -0.5<br />
Accumulated depreciation at 31 December <strong>2007</strong> -3.7 -414.1 -326.3 -14.1 -758.2<br />
Carrying amount at 1 January <strong>2007</strong> 210.3 702.6 160.3 16.7 25.1 1,114.7<br />
Carrying amount at 31 December <strong>2007</strong> 219.5 726.5 155.1 22.1 29.9 1,153.1<br />
Total<br />
2006<br />
Cost<br />
Cost at 1 January 2006 185.1 1,150.3 509.8 27.9 18.7 1,891.7<br />
Currency translation differences 0.1 0.0 0.2 0.0 0.1 0.4<br />
Additions 44.0 58.2 85.2 3.6 34.4 225.4<br />
Acquisition of subsidiary 1.2 12.3 0.4 0.0 0.0 13.9<br />
Disposals -38.2 -227.8 -130.0 -9.4 -0.9 -406.3<br />
Transfers between groups 20.5 86.4 0.2 3.6 -27.2 83.5<br />
Cost at 31 December 2006 212.7 1,079.4 465.8 25.7 25.1 1,808.6<br />
Accumulated depreciation<br />
Accumulated depreciation and impairment at<br />
1 January 2006 -2.5 -425.2 -308.9 -10.9 -1.5 -749.1<br />
Currency translation differences<br />
Accumulated depreciation of disposals<br />
-0.1 -0.1 -0.2<br />
and transfers 0.2 96.0 68.4 4.8 1.6 171.1<br />
Depreciation for the period -48.3 -64.8 -2.7 -0.3 -116.1<br />
Impairment -0.1 0.8 -0.1 -0.2 0.4<br />
Accumulated depreciation at 31 December 2006 -2.4 -376.8 -305.5 -9.0 -0.2 -693.9<br />
Carrying amount at 1 January 2006 182.6 725.1 200.9 17.0 17.2 1,142.7<br />
Carrying amount at 31 December 2006 210.4 702.6 160.3 16.7 24.9 1,115.1<br />
Total<br />
<strong>2007</strong>
102<br />
<strong>Kesko's</strong> <strong>year</strong> <strong>2007</strong><br />
Tangible assets include assets leased under finance leases as follows:<br />
€ million Buildings<br />
Machinery and<br />
equipment<br />
Other<br />
tangible<br />
assets Total<br />
<strong>2007</strong><br />
Cost 150.8 69.8 0.1 220.7<br />
Accumulated depreciation -67.0 -42.0 -0.1 -109.1<br />
Carrying amount 83.8 27.8 0.0 111.6<br />
2006<br />
Cost 149.9 67.8 0.1 217.8<br />
Accumulated depreciation -60.3 -36.9 -0.1 -97.2<br />
Carrying amount 89.6 31.0 0.0 120.6<br />
Note 13<br />
Investments in associates<br />
€ million <strong>2007</strong> 2006<br />
Carrying amount at 1 January 25.5 29.4<br />
Share of income for the period 0.4 0.6<br />
Additions 2.2 -0.6<br />
Disposals -1.1 -3.9<br />
Currency translation differences 0.0 0.0<br />
Carrying amount at 31 December 27.0 25.5<br />
Price quotations of associates have not been published.<br />
The Group's associates, their aggregate assets, liabilities, net sales and profits/losses:<br />
€ million Assets Liabilities Net sales Profit/loss<br />
Ownership<br />
interest, %<br />
<strong>2007</strong><br />
Valluga-sijoitus Oy, Helsinki 23.2 0.1 1.0 0.7 39.0<br />
Vähittäiskaupan Takaus Oy, Helsinki 50.8 0.2 1.1 3.9 34.0<br />
Vähittäiskaupan Tilipalvelu VTP Oy, Helsinki 3.7 2.7 9.3 0.1 30.0<br />
Others 3.9 2.2 3.0 -0.1<br />
Total 81.6 5.2 14.4 4.6<br />
2006<br />
Valluga-sijoitus Oy, Helsinki 24.4 3.7 1.3 0.6 39.0<br />
Vähittäiskaupan Takaus Oy, Helsinki 47.1 0.3 1.0 2.8 34.0<br />
Vähittäiskaupan Tilipalvelu VTP Oy, Helsinki 3.3 2.5 8.7 0.2 30.0<br />
Others 11.0 7.4 33.7 0.7<br />
Total 85.8 13.9 44.7 4.3
Year <strong>2007</strong><br />
Note 14<br />
Long-term available-for-sale financial assets<br />
Divisions The Group<br />
Financial<br />
statements Further information 103<br />
Available-for-sale financial assets include unquoted shares primarily measured at cost because their fair values cannot be reliably measured.<br />
€ million <strong>2007</strong> 2006<br />
Carrying amount at 1 January 12.0 11.6<br />
Additions 1.2 0.5<br />
Disposals -9.2 -0.1<br />
Changes in fair value 0.0 0.0<br />
Carrying amount at 31 December 4.0 12.0<br />
In <strong>2007</strong>, €37.1 million of gains on disposal of available-for-sale financial assets were recognised in financial items.<br />
Note 15<br />
Long-term receivables<br />
€ million <strong>2007</strong> 2006<br />
Non-interest-bearing long-term receivables 8.8 2.4<br />
Finance lease receivables 27.0 23.5<br />
Loan receivables from associates 0.9 1.0<br />
Other long-term receivables 0.2 93.3<br />
Total 36.9 120.2<br />
In 2006, other long-term receivables included customer finance receivables, which were classified as available-for-sale assets in <strong>2007</strong><br />
(Note 3, 25). The non-interest-bearing long-term receivables include €8.0 million in derivative value changes, the balance sheet value of which<br />
corresponds to their fair value. The fair values of finance lease receivables cannot be reliably measured.<br />
Maturities of long-term receivables at 31 Dec. <strong>2007</strong><br />
€ million 2009 2010 2011 2012 2013- Total<br />
Non-interest-bearing long-term receivables 2.5 0.6 0.0 0.0 5.7 8.8<br />
Finance lease receivables 8.1 7.4 5.2 3.1 3.3 27.0<br />
Loan receivables from associates 0.9 0.9<br />
Other long-term receivables 0.2 0.2<br />
Total 10.6 8.0 5.2 3.1 10.0 36.9
104<br />
Note 16<br />
<strong>Kesko's</strong> <strong>year</strong> <strong>2007</strong><br />
Finance lease receivables<br />
€ million <strong>2007</strong> 2006<br />
Finance lease receivables fall due as follows:<br />
Not later than one <strong>year</strong> 8.9 7.7<br />
Later than one <strong>year</strong> and not later than five <strong>year</strong>s 25.5 22.6<br />
Later than five <strong>year</strong>s 4.2 3.1<br />
Gross investment in finance leases 38.6 33.4<br />
Present value of minimum lease receivables:<br />
Not later than one <strong>year</strong> 7.4 6.5<br />
Later than one <strong>year</strong> and not later than five <strong>year</strong>s 23.0 20.5<br />
Later than five <strong>year</strong>s 4.0 3.0<br />
Total finance lease receivables 34.4 30.0<br />
Unearned financial income 4.2 3.4<br />
The finance lease receivables comprise store fixtures leased by Kesko Food Ltd from finance companies and subleased to chain companies. During the<br />
lease term, the lease item is used as collateral. After the actual lease term, the lessee may extend the lease over low-cost extension periods. The agreement<br />
with the finance company includes a lease limit of €60 million. The lease terms are 3–8 <strong>year</strong>s.<br />
Note 17<br />
Deferred taxes<br />
Changes in deferred taxes during <strong>2007</strong>:<br />
€ million<br />
31 Dec.<br />
2006<br />
Charged/credited<br />
to the income<br />
statement<br />
Charged<br />
to equity<br />
Exchange rate<br />
differences<br />
Subsidiaries<br />
acquired/<br />
disposed of<br />
31 Dec.<br />
Deferred tax assets<br />
Margin included in inventories 2.3 -0.1 2.2<br />
Finance lease assets 5.2 0.3 5.5<br />
Provisions 6.0 0.3 6.3<br />
Pensions 1.6 -0.6 1.0<br />
Confirmed losses 3.3 0.8 -0.1 -0.1 3.9<br />
Others 16.7 3.1 -0.5 19.3<br />
Total 34.9 3.8 -0.5 -0.1 -0.1 38.0<br />
Deferred tax liabilities<br />
Accumulated depreciation differences 57.3 -1.7 -0.3 55.3<br />
Changes in Group structure 21.5 -2.0 0.5 1.6 21.6<br />
Pensions 57.1 11.1 -0.1 68.1<br />
Others 6.1 1.2 3.1 0.5 11.0<br />
Total 142.0 8.6 3.1 0.5 1.7 156.0<br />
Net deferred tax liability 107.1 118.0<br />
Balance sheet division: <strong>2007</strong> 2006<br />
Deferred tax assets 7.7 5.8<br />
Deferred tax liabilities 125.5 112.8<br />
The 'Others' group of deferred tax assets include e.g. timing differences of deferred tax assets relating to gains on sale and leaseback transactions, and<br />
timing differences relating to depreciation.<br />
<strong>2007</strong>
Year <strong>2007</strong><br />
Changes in deferred taxes during 2006:<br />
€ million<br />
Divisions The Group<br />
Financial<br />
statements Further information 105<br />
31 Dec.<br />
2005<br />
Charged/credited<br />
to the in- come<br />
statement<br />
Charged<br />
to equity<br />
Exchange rate<br />
differences<br />
Subsidiaries<br />
acquired/<br />
disposed of<br />
31 Dec.<br />
Deferred tax assets<br />
Margin included in inventories 2.1 0.2 0.0 2.3<br />
Finance lease assets 4.8 0.4 0.0 5.2<br />
Provisions 5.8 0.2 0.0 6.0<br />
Pensions 1.6 0.0 0.0 0.0 1.6<br />
Unused tax losses 3.4 2.1 0.1 -2.3 3.3<br />
Others 14.8 2.5 -0.9 0.3 16.7<br />
Total 32.5 5.3 -0.9 0.1 -1.9 35.1<br />
Deferred tax liabilities<br />
Accumulated depreciation differences 61.6 -4.6 0.3 57.3<br />
Change in Group structure 29.4 -5.5 -0.5 -1.9 21.5<br />
Pensions 54.6 2.5 0.0 57.1<br />
Others 7.5 1.0 -1.0 -1.4 6.1<br />
Total 153.1 -6.6 -1.0 -0.5 -3.0 142.0<br />
Net deferred tax liability 120.6 106.9<br />
2006 2005<br />
Balance sheet division:<br />
Deferred tax assets 5.8 4.4<br />
Deferred tax liabilities 112.8 124.9<br />
At 31 December <strong>2007</strong>, the Group had €10.1 million of unused tax losses not recognised as carry-forwards, because it is probable that the Group will not<br />
be able to accumulate an equivalent taxable profit against which the losses could be used.<br />
Unused tax losses not recognised<br />
as tax assets expire as follows: 2008 2009 2010 2011 2012 2012- Total<br />
0.7 1.4 0.2 1.3 0.1 6.4 10.1<br />
The consolidated financial statements do not recognise deferred tax liabilities for the undistributed earnings of subsidiaries and associates, because<br />
the distribution of profit is at the discretion of the Group, and is not probable in the near future. At 31 December <strong>2007</strong>, the amount of such earnings<br />
was immaterial.<br />
2006
106<br />
Note 18<br />
<strong>Kesko's</strong> <strong>year</strong> <strong>2007</strong><br />
Pension assets<br />
The Group operates several retirement plans. In Finland, employees' pension insurance is partly arranged with insurance companies and partly by the<br />
Kesko Pension Fund, whose department A granting additional benefits was closed on 9 May 1998. Pension plans arranged with the Kesko Pension<br />
Fund have been treated as defined benefit plans.<br />
As regards foreign subsidiaries, the plan adopted in the Norwegian subsidiary is classified as a defined benefit plan. Retirement plans in other foreign<br />
subsidiaries are arranged in accordance with local regulations and practices. They do not include any significant defined benefit pension plans.<br />
<strong>2007</strong> 2006<br />
€ million Finland Norway Finland Norway<br />
Obligation arising from plan at 31 December -560.6 -12.6 -440.9 -11.5<br />
Plan assets at 31 December 897.0 8.5 794.8 7.6<br />
Unrecognised actuarial profits/losses (-)/(+) -74.3 1.2 -134.4 1.4<br />
Net assets (+) /liabilities (-) recognised in the balance sheet* 262.1 -2.9 219.5 -2.4<br />
Obligation arising from plan at 1 January 440.9 11.5 426.8 9.2<br />
Current service cost 12.0 1.2 7.1 1.9<br />
Interest cost 24.8 0.5 20.6 0.4<br />
Benefits paid -26.7 -0.2 -25.6<br />
Actuarial losses 68.5 -0.8 11.9<br />
Others 41.1 0.4<br />
Obligation arising from plan at 31 December 560.6 12.6 440.9 11.5<br />
Plan assets at 1 January 794.8 7.6 628.7 7.2<br />
Expected return on plan assets 56.2 0.3 39.6 0.4<br />
Contributions to plan 16.1 0.9 -2.7<br />
Benefits paid -26.7 -0.2 -25.6<br />
Actuarial profits 11.8 0.1 154.8<br />
Others 44.8 -0.2<br />
Plan assets at 31 December 897.0 8.5 794.8 7.6<br />
Expense recognised in the income statement:<br />
Current service cost -12.0 -1.2 -7.1 -0.8<br />
Interest cost -24.8 -0.5 -20.6 -0.4<br />
Expected return on plan assets 56.2 0.3 39.6 0.4<br />
Change 3.8<br />
Actuarial profits (+) and losses (-) 3.3 -0.1 0.5<br />
Others -0.4<br />
Total expense recognised in the income statement 26.5 -1.5 12.4 -1.2<br />
Change in net assets recognised in the balance sheet:<br />
Beginning of the period 219.5 -2.3 209.8 -2.1<br />
Income/expenses recognised in the income statement 26.5 -1.5 12.4 -1.2<br />
Benefits paid from funds 0.1<br />
Contributions to plan 16.1 0.9 -2.7 0.8<br />
End of the period* 262.1 -2.9 219.5 -2.4
Year <strong>2007</strong><br />
Note 19<br />
Inventories<br />
Divisions The Group<br />
Financial<br />
statements<br />
Further information<br />
Finland <strong>2007</strong> 2006 2005 2004<br />
Plan obligation -560.6 -440.9 -426.8 -420.6<br />
Plan assets 897.0 794.8 628.7 608.2<br />
Actuarial profits and losses -74.3 -134.4 8.1 8.1<br />
Net receivable in the balance sheet* 262.1 219.5 209.9 195.6<br />
*€0.5 million of the net receivable is attributable to K-Rahoitus Oy, which is presented in available-for-sale assets.<br />
The return on plan assets (Finland) was €68.0 million (€152.9 million).<br />
In 2008, the Group expects to pay €37.7 million in contributions to defined benefit plans.<br />
Plan assets by category, % of plan asset fair values <strong>2007</strong> 2006<br />
Real estate 34.7% 34.5%<br />
Shares 33.6% 37.8%<br />
Long-term interest investments 17.6% 19.7%<br />
Short-term interest investments 8.8% 3.4%<br />
Alternative investments 5.3% 4.6%<br />
Total 100.0% 100.0%<br />
Plan assets, € million<br />
Kesko Corporation shares included in fair value<br />
Real estate leased and primarily subleased to retailers<br />
130.2 132.2<br />
by the Kesko Group, included in fair value 341.5 297.2<br />
<strong>2007</strong> 2006<br />
Principal actuarial assumptions used: Finland Norway Finland Norway<br />
Discount rate 5.00% 5.00% 5.00% 4.35%<br />
Expected return on plan assets 6.60% 6.00% 6.60% 5.50%<br />
Future salary increase assumption 3.50% 4.50% 3.50% 4.50%<br />
Inflation 2.00% 2.00%<br />
Expected average remaining service life, <strong>year</strong>s 15–20 13–15<br />
In calculating the Pension Fund's expected income, the invested assets are divided into five categories. The total expected income from the investment<br />
portfolio (6.6%) is composed of the combined income from these assets. The income expected from different assets is based on the parameters of an<br />
investment portfolio analysis model widely used in employee pension schemes, and calculated from long-term historical data. The most significant type<br />
of assets affecting the total income is shares, further divided into nine geographical subgroups with expected income ranging between 6.9%–9.9%.<br />
€ million <strong>2007</strong> 2006<br />
Goods 913.7 782.6<br />
Prepayments 8.6 6.2<br />
Total 922.3 788.8<br />
During the period, inventories have been<br />
written down to correspond to their net<br />
realisable value 18.4 16.4<br />
Note 20<br />
Trade receivables and other short-term<br />
non-interest-bearing receivables<br />
107<br />
€ million <strong>2007</strong> 2006<br />
Trade receivables 682.1 646.3<br />
Other non-interest-bearing receivables<br />
Non-interest-bearing loan and other<br />
receivables 26.8 19.6<br />
Deferred revenue and other accruals<br />
Total other non-interest-bearing<br />
114.9 94.9<br />
receivables<br />
Total short-term non-interest-bearing<br />
141.7 114.5<br />
receivables 823.8 760.8<br />
A total amount of €5.0 million (€3.7 million) of trade receivables has been<br />
recognised in the income statement as losses on loans and advances.<br />
Credit risk is described in more detail in Note 44.
108 <strong>Kesko's</strong> <strong>year</strong> <strong>2007</strong><br />
Deferred revenue and other accruals mainly include amortisation of<br />
marketing revenue, rebates and staff cost.<br />
The fair value of short-term trade and loan receivables is assumed to<br />
nearly equal the carrying amounts based on their short maturities.<br />
Note 21<br />
Short-term interest-bearing receivables<br />
€ million <strong>2007</strong> 2006<br />
Interest-bearing loan and other<br />
receivables 8.9 85.0<br />
Finance lease receivables<br />
Total short-term interest-bearing<br />
7.4 6.6<br />
receivables 16.3 91.6<br />
The fair value of short-term trade and loan receivables is assumed to<br />
nearly equal the carrying amounts based on their short maturities. In<br />
2006, interest-bearing loans and other receivables included K-Rahoitus<br />
Oy's customer receivables which in <strong>2007</strong> are presented in available-forsale<br />
assets.<br />
Note 22<br />
Financial assets at fair value through profit or loss<br />
€ million <strong>2007</strong> 2006<br />
Financial assets at fair value through<br />
profit or loss 105.5 140.7<br />
Total 105.5 140.7<br />
Financial assets at fair value through profit or loss include interest and<br />
special investment fund investments and other investments with over<br />
3-month maturities.<br />
Note 23<br />
Available-for-sale financial assets<br />
€ million <strong>2007</strong> 2006<br />
Carrying amount at 1 January 200.4 38.3<br />
Changes -44.8 162.1<br />
Changes in fair value - -<br />
Carrying amount at 31 December 155.6 200.4<br />
Available-for-sale short-term financial assets include commercial papers,<br />
certificates of bank deposits and other money market investments.<br />
Note 24<br />
Cash and cash equivalents<br />
€ million <strong>2007</strong> 2006<br />
Cash on hand and balances with banks 89.7 56.5<br />
Total 89.7 56.5<br />
Note 25<br />
Assets classified as held-for-sale and related liabilities<br />
Assets held for sale<br />
€ million <strong>2007</strong> 2006<br />
Land 5.9 3.2<br />
Buildings and real estate shares 1.9 19.0<br />
Long-term receivables 95.0 -<br />
Short-term receivables 134.1 -<br />
Total 236.9 22.2<br />
In December <strong>2007</strong>, Kesko Corporation signed an agreement by which it<br />
sells the share capital of K-Rahoitus Oy during the first part of 2008. The<br />
assets relating to K-Rahoitus Oy are presented in available-for-sale<br />
assets. In addition to available-for-sale assets, the disposal entity<br />
includes current assets eliminated in the Kesko Group in the amount of<br />
€2.4 million and current liabilities in the amount of €211.3 million.<br />
In 2006, in connection with the disposal of Rimi Baltic AB shares by<br />
Kesko Food Ltd, it was agreed that Rimi Baltic would acquire the properties<br />
leased by it from an Estonian subsidiary of Kesko. The transaction<br />
was concluded in January <strong>2007</strong>. The €20.7 million balance sheet value of<br />
the properties was included in assets held for sale in 2006. In addition,<br />
some retail store properties used for the Group’s operating activities<br />
have become vacant because they are no longer needed for the purpose<br />
they were acquired for. Buyers for such properties are being actively<br />
sought. Assets classified as held-for-sale include vacant retail store properties<br />
and real estate shares totalling €7.7 million (€1.6 million).<br />
Liabilities included in held-for-sale disposal group<br />
€ million <strong>2007</strong> 2006<br />
Current non-interest-bearing liabilities 2.1 -<br />
Non-current non-interest-bearing<br />
liabilities 1.2 -<br />
Total 3.3 -<br />
In December <strong>2007</strong>, Kesko Corporation signed an agreement by which it<br />
sells the share capital of K-Rahoitus Oy during the first part of 2008. Liabilities<br />
relating to K-Rahoitus's asset items are presented as liabilities<br />
linked to assets held for sale.
Year <strong>2007</strong><br />
Note 26<br />
Changes in share capital<br />
Divisions The Group<br />
Financial<br />
statements Further information 109<br />
Number of shares<br />
Share capital A B Total<br />
Share<br />
capital<br />
€ million<br />
Share<br />
premium<br />
€ million<br />
Total<br />
€ million<br />
At 1 January 2006 31,737,007 64,746,919 96,483,926 193.0 188.7 381.7<br />
Exercise of stock options - 1,035,999 1,035,999 2.0 7.2 9.2<br />
At 31 December 2006 31,737,007 65,782,918 97,519,925 195.0 195.9 390.9<br />
Exercise of stock options - 247,840 247,840 0.5 4.4 4.9<br />
At 31 December <strong>2007</strong> 31,737,007 66,030,758 97,767,765 195.5 200.3 395.8<br />
Number of votes 317,370,007 66,030,758 383,400,765<br />
In <strong>2007</strong>, the share capital was increased six times as a result of stock subscriptions pursuant to stock options: by €46,376 in February, by €86, 800 in<br />
April, by €298,572 in May, by €9,000 in July, by €39,032 in September and by €15,900 in December. The corresponding numbers of shares subscribed<br />
for were 23,188; 43,400; 149,286; 4,500; 19,516 and 7,950. The increases were entered in the Trade Register respectively on 12 February, 26 April, 29<br />
May, 24 July, 26 September and 19 December <strong>2007</strong>.<br />
All issued shares have been fully paid. The maximum number of A shares is 250,000,000 and the maximum number of B shares is also 250,000,000,<br />
provided that the total number of shares is at maximum 400,000,000. One A share entitles the holder to 10 votes and one B share to 1 vote.<br />
The book counter value of the shares is €2.<br />
An analysis of share-based payments is given in Note 37.<br />
Dividends<br />
After the balance sheet date, the Board has proposed that €1.60 per share be distributed as dividends.<br />
Note 27<br />
Equity and reserves<br />
Restricted and non-restricted equity<br />
Restricted equity is made up of share capital and share premium, and non-restricted equity is made up of other reserves, revaluation surplus and<br />
retained earnings. Non-restricted equity also includes the accumulated depreciation difference and untaxed reserves recognised in equity.<br />
Share premium<br />
The amount exceeding the par value of shares received by the enterprise in connection with share subscription, gains on sale of treasury shares, and in<br />
some cases unraised amounts from sale of unsubscribed shares are recognised in the share premium account. The share premium includes the premium<br />
received on exercise of share options.<br />
Other reserves<br />
The other reserves have mainly been created and accumulated as a result of decisions by the Annual General Meeting.<br />
Revaluation surplus<br />
The revaluation surplus includes the effective portion of fair value based on hedge accounting applied to electricity derivatives and to interest rate<br />
derivatives hedging a private placement bond. The revaluation surplus will dissolve by the <strong>year</strong> 2019.<br />
Currency translation differences<br />
Currency translation differences arise from the consolidation of the results of foreign operations. Also gains and losses arising from net investment<br />
hedges in foreign entities are included in currency translation differences provided that hedge accounting requirements are fulfilled.
110<br />
Note 28<br />
<strong>Kesko's</strong> <strong>year</strong> <strong>2007</strong><br />
Maturities of interest-bearing liabilities<br />
€ million<br />
At 31 Dec.<br />
<strong>2007</strong> Available Total 2008 2009 2010 2011<br />
2012<br />
and later<br />
Loans from financial institutions 67.8 67.8 2.8 33.8 0.6 0.9 29.7<br />
Private placement bonds (USD) 99.9 99.9 99.9<br />
Pension loans 2.8 2.8 0.8 0.8 0.8 0.4<br />
Finance lease liabilities 166.1 166.1 18.8 24.2 16.5 26.8 79.8<br />
Debt to K-retailers 122.2 122.2 122.2<br />
Other interest-bearing liabilities 68.5 68.5 68.5<br />
Binding credit limits 225.0 225.0<br />
Commercial papers 98.1 443.6 541.7 98.1<br />
Total 625.4 668.6 1,294.0 311.2 58.8 17.9 28.1 209.4<br />
€ million<br />
At 31 Dec.<br />
2006 Available Total <strong>2007</strong> 2008 2009 2010<br />
2011<br />
and later<br />
Loans from financial institutions 107.5 107.5 42.5 19.6 18.3 0.6 26.5<br />
Private placement bonds (USD) 99.9 99.9 99.9<br />
Pension loans 14.3 14.3 11.5 0.8 0.8 0.8 0.4<br />
Finance lease liabilities 168.1 168.1 19.0 21.9 20.3 12.6 94.3<br />
Debt to K-retailers 121.7 121.7 121.7<br />
Other interest-bearing liabilities 76.1 76.1 76.1<br />
Binding credit limits 225.0 225.0<br />
Commercial papers 22.2 399.5 421.7 22.2<br />
Total 609.8 624.5 1,234.2 293.0 42.3 39.4 14.0 221.1<br />
Debt to K-retailers consist of two types of interest-bearing receivables payable by the Kesko Group companies to K-retailers: retailers' prepayments to<br />
Kesko and retailers' chain rebates. Chain rebates are subsequent discounts given to retailers and the terms vary from one chain to another. The same<br />
documented terms are applied to prepayments and chain rebates for all retailers in a chain. The private placement bonds include the fair value change<br />
of currency derivative instruments.
Year <strong>2007</strong><br />
Note 29<br />
Divisions The Group<br />
Financial<br />
statements Further information 111<br />
Carrying amounts of financial assets and liabilities by measurement group at 31 Dec. <strong>2007</strong><br />
Balance sheet item, € million<br />
Financial assets/<br />
liabilities at fair<br />
value through<br />
profit or loss<br />
Loans and<br />
receivables<br />
Available-<br />
for-sale<br />
financial<br />
assets<br />
Financial<br />
liabilities<br />
at amortised<br />
cost<br />
Derivatives<br />
qualified amounts of<br />
for hedge<br />
Carrying<br />
balance<br />
accounting sheet items Fair value<br />
Non-current financial assets<br />
Available-for-sale financial assets 4.0 4.0 4.0<br />
Long-term interest-bearing receivables 28.9<br />
- Derivatives<br />
Current financial assets<br />
Trade receivables and other non-interest-bearing<br />
8.0 36.9 36.9<br />
receivables 817.4<br />
- Derivatives 1.4 4.9 823.7 823.7<br />
Interest-bearing receivables 16.4 16.4 16.4<br />
Financial assets at fair value through profit or loss 105.5 105.5 105.5<br />
Available-for-sale financial assets 155.6 155.6 155.6<br />
Carrying amounts by measurement group 106.9 862.7 159.6 12.9 1,142.1 1,142.1<br />
Non-current financial liabilities<br />
Interest-bearing long-term liabilities 295.3<br />
- Derivatives 18.9 314.2 324.2<br />
Non-interest-bearing long-term liabilities<br />
Current financial liabilities<br />
11.5 11.5 11.5<br />
Current interest-bearing liabilities 311.2 311.2 311.2<br />
Trade payables 837.8 837.8 837.8<br />
Other non-interest-bearing liabilities 191.6 191.6 191.6<br />
Accrued liabilities 275.5<br />
- Derivatives 1.5 0.2 277.2 277.2<br />
Carrying amounts by measurement group 1.5 1,922.9 19.1 1,943.5 1,953.4
112<br />
<strong>Kesko's</strong> <strong>year</strong> <strong>2007</strong><br />
Carrying amounts of financial assets and liabilities by measurement group at 31 Dec. 2006<br />
Balance sheet item, € million<br />
Financial assets/<br />
liabilities at fair<br />
value through<br />
profit or loss<br />
Loans and<br />
receivables<br />
Available-<br />
for-sale<br />
financial<br />
assets<br />
Financial<br />
liabilities<br />
at amortised<br />
cost<br />
Derivatives<br />
qualified amounts of<br />
for hedge<br />
Carrying<br />
balance<br />
accounting sheet items Fair value<br />
Non-current financial assets<br />
Available-for-sale financial assets 12.0 12.0 12.0<br />
Long-term interest-bearing receivables 119.1<br />
- Derivatives<br />
Current financial assets<br />
Trade receivables and other non-interest-bearing<br />
1.1 120.2 120.2<br />
receivables 759.8<br />
- Derivatives 1.0 760.8 760.8<br />
Interest-bearing receivables 91.6 91.6 91.6<br />
Financial assets at fair value through profit or loss 140.7 140.7 140.7<br />
Available-for-sale financial assets 200.4 200.4 200.4<br />
Carrying amounts by measurement group 141.4 970.5 212.4 1.1 1,325.7 1,325.7<br />
Non-current financial liabilities<br />
Interest-bearing long-term liabilities 307.5<br />
- Derivatives 9.3 316.8 324.2<br />
Non-interest-bearing long-term liabilities 16.5<br />
- Derivatives<br />
Current financial liabilities<br />
1.8 18.3 18.3<br />
Current interest-bearing liabilities 293.0 293.0 293.0<br />
Trade payables 789.2 789.2 789.2<br />
Other non-interest-bearing liabilities 177.6 177.6 177.6<br />
Accrued liabilities 259.7<br />
- Derivatives 0.8 0.4 260.9 260.9<br />
Carrying amounts by measurement group 0.8 1,843.5 11.5 1,855.8 1,863.2<br />
The fair values of loans have been calculated based on the present value of future cash flows using the 4.2%–5.6% market rates of interest at the balance<br />
sheet date. The fair value of current interest-bearing liabilities is estimated to nearly equal their balance sheet value.<br />
The maturity schedule of long-term loans is presented in Note 40.
Year <strong>2007</strong><br />
Note 30<br />
Finance lease liabilities<br />
Divisions The Group<br />
Financial<br />
statements Further information 113<br />
€ million <strong>2007</strong> 2006<br />
The maturities of finance lease liabilities are as follows:<br />
Not later than 1 <strong>year</strong> 27.8 28.2<br />
Later than 1 <strong>year</strong> and not later than 5 <strong>year</strong>s 103.4 111.7<br />
Later than 5 <strong>year</strong>s 86.1 93.9<br />
Total minimum lease payments 217.3 233.8<br />
Present values of minimum lease payments:<br />
Not later than 1 <strong>year</strong> 18.8 19.0<br />
Later than 1 <strong>year</strong> and not later than 5 <strong>year</strong>s 78.8 76.7<br />
Later than 5 <strong>year</strong>s 68.5 72.3<br />
Finance lease liabilities 166.1 168.0<br />
Accumulating financial expenses 51.2 65.8<br />
Contingent rents recognised for the period 1.5 1.5<br />
Expected sublease rentals 33.2 33.2<br />
Finance lease liabilities relate to real estate, machinery and equipment leases. The Kesko Group has leased large retail outlets under long-term leases.<br />
Most of the lease payments are tied to interest rates and most leases include a call option.<br />
Note 31<br />
Provisions<br />
€ million Onerous leases Warranty provisions Other provisions Total<br />
Provisions at 1 Jan. <strong>2007</strong> 9.1 11.7 11.1 31.9<br />
Exchange rate effects 0.0<br />
Additional provisions 2.9 1.7 14.3 18.9<br />
Unused amounts reversed -0.9 -0.2 -7.5 -8.6<br />
Expensed in income statement 11.1 13.2 17.9 42.2<br />
Used amounts -2.0 -0.3 -1.4 -3.7<br />
Provisions at 31 Dec. <strong>2007</strong> 9.1 12.9 16.5 38.5<br />
Analysis of total provisions<br />
Non-current 5.2 9.1 1.2 15.5<br />
Current 3.9 3.8 15.3 23.0<br />
Provisions for onerous leases mainly relate to lease liabilities of premises vacated from the Group operations, and to net losses on rent of subleased<br />
premises. Warranty provisions have been recorded for vehicles and machines sold by the Group companies. The provision amount is based on experience<br />
from realised warranty obligations in previous <strong>year</strong>s. Other provisions mainly relate to pensions and residual taxes.
114 <strong>Kesko's</strong> <strong>year</strong> <strong>2007</strong><br />
Note 32<br />
Trade payables and other current non-interest-bearing liabilities<br />
€ million <strong>2007</strong> 2006<br />
Trade payables 837.8 789.2<br />
Other current non-interest-bearing liabilities 191.6 177.6<br />
Tax liabilities 13.4 26.0<br />
Accrued liabilities 277.2 260.9<br />
Total current non-interest-bearing liabilities 1,320.0 1,253.7<br />
Accrued liabilities are mainly due to the timing of purchases and staff costs.<br />
Note 33<br />
Major subsidiaries directly owned by parent<br />
Name<br />
State of<br />
registration<br />
Ownership<br />
interest, %<br />
Voting<br />
power, %<br />
Anttila Oy Finland 100.0 100.0<br />
Indoor Group Ltd Finland 100.0 100.0<br />
Intersport Finland Ltd Finland 100.0 100.0<br />
Kauko-Telko Ltd Finland 100.0 100.0<br />
Kenkäkesko Ltd Finland 45.1 100.0<br />
Keslog Ltd * Finland 100.0 100.0<br />
Kesko Agro Ltd Finland 100.0 100.0<br />
Musta Pörssi Ltd Finland 100.0 100.0<br />
Kesko Food Ltd Finland 100.0 100.0<br />
Rautakesko Ltd Finland 100.0 100.0<br />
Tähti Optikko Group Oy Finland 100.0 100.0<br />
VV-Auto Group Oy Finland 100.0 100.0<br />
* the Group's ownership interest is 100%<br />
A complete analysis of Group companies is included in Note 50.<br />
Note 34<br />
Jointly controlled assets<br />
Jointly controlled assets (mutual real estate companies)<br />
These figures represent the Group's share of jointly controlled assets and<br />
liabilities and income and profit included in the consolidated balance<br />
sheet and income statement.<br />
€ million <strong>2007</strong> 2006<br />
Non-current assets 48.5 48.7<br />
Current assets 3.7 0.7<br />
52.2 49.4<br />
Non-current liabilities 20.4 20.8<br />
Current liabilities 7.5 12.7<br />
27.9 33.5<br />
Net assets 24.3 15.9<br />
Income 7.0 6.5<br />
Expenses 6.3 6.1<br />
Profit 0.7 0.4
Year <strong>2007</strong><br />
Note 35<br />
Contingent liabilities<br />
Divisions The Group<br />
Financial<br />
statements<br />
Further information<br />
Commitments<br />
€ million<br />
Collateral given for own commitments<br />
<strong>2007</strong> 2006<br />
Pledges 38 57<br />
Mortgages 26 26<br />
Guarantees<br />
Other commitments and contingent<br />
101 118<br />
liabilities 50 62<br />
Collateral given for shareholders<br />
Guarantees 1 1<br />
Collateral given for others<br />
Other commitments and contingent<br />
liabilities 6 9<br />
Guarantees 3 4<br />
Note 36<br />
Operating leases<br />
Group as the lessee<br />
Minimum lease payments under non-cancellable operating lease<br />
agreements:<br />
€ million <strong>2007</strong> 2006<br />
Not later than 1 <strong>year</strong> 285.3 191.9<br />
Later than 1 <strong>year</strong> and<br />
not later than 5 <strong>year</strong>s 830.5 767.3<br />
Later than 5 <strong>year</strong>s 675.8 570.9<br />
Total 1,791.5 1,530.1<br />
Expected future minimum lease<br />
payments under non-cancellable<br />
sublease agreements 46.4 40.3<br />
Lease and sublease payments recognised<br />
for the period:<br />
Minimum lease expenses 262.6 246.5<br />
Contingent lease expenses 0.3 2.0<br />
Sublease payments (-income/+expense) -16.4 -17.6<br />
The <strong>2007</strong> income statement includes operating lease payments in a total<br />
amount of €317.7 million (€290.1 million).<br />
Kesko leases retail and logistics premises for its operating activities.<br />
Most of the leases are index-linked and in conformity with local market<br />
practice. Future minimum lease payments for the comparison <strong>year</strong><br />
(2006) have been adjusted to correspond to their actual amounts.<br />
Group as the lessor<br />
Minimum lease payments based on non-cancellable operating leases:<br />
115<br />
€ million <strong>2007</strong> 2006<br />
Not later than 1 <strong>year</strong> 8.9 11.2<br />
Later than 1 <strong>year</strong> and<br />
not later than 5 <strong>year</strong>s 15.1 18.3<br />
Later than 5 <strong>year</strong>s 20.0 22.5<br />
Total 44.1 52.0<br />
Aggregate contingent rents charged to<br />
the income statement 0.2 0.7<br />
Kesko leases premises to entrepreneurs other than K-retailers in order<br />
that the total service offer of a store site support its profit generation<br />
potential. Such premises typically include so-called store entrance stores<br />
at large retail outlets.<br />
Note 37<br />
Share-based payments<br />
The Group operates option plans as part of the management's incentive<br />
and commitment arrangements. Each option gives its holder the right to<br />
subscribe for one Kesko Corporation B share at a price and during the<br />
period specified in the terms of the option scheme. The options are forfeit<br />
if the employee leaves the company before the end of the vesting<br />
period.<br />
Year 2003 option plan<br />
On 31 March 2003, the Annual General Meeting resolved to grant a total<br />
of 1,800,000 options with no consideration to the management of the<br />
Kesko Group as well as to a wholly-owned subsidiary of Kesko Corporation.<br />
A deviation was made from the shareholders' pre-emptive subscription<br />
rights, since the stock options form a part of the incentive and commitment<br />
programme for the management. Each option entitles its holder<br />
to subscribe for one new Kesko Corporation B share. The options are<br />
marked with the symbols 2003D (KESBVEW103), 2003E (KESBVEW203)<br />
and 2003F (KESBVEW303) in units of 600,000 options each. The share<br />
subscription periods of options are:<br />
• 2003D 1 April 2005–30 April 2008<br />
• 2003E 1 April 2006–30 April 2009 and<br />
• 2003F 1 April <strong>2007</strong>–30 April 2010.<br />
The original exercise price per share of option 2003D was equal to the<br />
volume weighted average price of a Kesko Corporation B share on the<br />
Helsinki Stock Exchange between 1 April-30 April 2003 (€9.63), that of<br />
option 2003E between 1 April-30 April 2004 (€15.19) and that of option<br />
2003F between 1 April-30 April 2005 (€19.08). The exercise prices were<br />
reduced by the amounts of dividends per share distributed after the end<br />
of the above period for the determination of the exercise price, but before<br />
the exercise date. At the end of <strong>2007</strong>, the price of a B share subscribed for<br />
with option 2003D was €3.03 and with option 2003E it was €10.59, and<br />
the exercise period started on 1 April 2006. At the end of <strong>2007</strong>, the price
116 <strong>Kesko's</strong> <strong>year</strong> <strong>2007</strong><br />
of a B share subscribed for with option 2003F was €16.48 and the exercise<br />
period started on 1 April <strong>2007</strong>. The option plan covers approximately<br />
50 employees.<br />
Year <strong>2007</strong> option plan<br />
On 26 March <strong>2007</strong>, the Annual General Meeting decided to grant a total<br />
of 3,000,000 stock options for no consideration to the management of<br />
the Kesko Group, other key personnel, and a subsidiary wholly owned by<br />
Kesko Corporation. The Company had a weighty financial reason for<br />
granting the options because they are intended to be part of <strong>Kesko's</strong><br />
share-based incentive system. Each stock option entitles its holder to<br />
subscribe for one new Kesko Corporation B share. The stock options<br />
shall be marked with symbols <strong>2007</strong>A, <strong>2007</strong>B and <strong>2007</strong>C in units of<br />
1,000,000 options each. The exercise periods of options shall be:<br />
• <strong>2007</strong>A 1 April 2010–30 April 2012<br />
• <strong>2007</strong>B 1 April 2011–30 April 2013<br />
• <strong>2007</strong>C 1 April 2012–30 April 2014<br />
The original subscription price for stock option <strong>2007</strong>A shall be the<br />
trade volume weighted average quotation of a Kesko Corporation B share<br />
on the Helsinki Stock Exchange between 1 April and 30 April <strong>2007</strong><br />
(€45.82), for stock option <strong>2007</strong>B, between 1 April and 30 April 2008, and<br />
for stock option <strong>2007</strong>C, between 1 April and 30 April 2009. The subscrip-<br />
Stock options during the period 1 January <strong>2007</strong>–31 December <strong>2007</strong><br />
tion prices of shares subscribed for with stock options shall be reduced<br />
by the amount decided after the beginning of the period for the determination<br />
of the subscription price but before the subscription as at the<br />
record date for each dividend distribution or other distribution of funds.<br />
Share of issued stock options of shares and votes<br />
Presuming that shares are subscribed for with all of the 1,800,000 stock<br />
options granted under the <strong>year</strong> 2003 plan and with all of the 3,000,000<br />
stock options of the <strong>year</strong> <strong>2007</strong> plan, the shares subscribed for with stock<br />
options account for 4.72% of shares and 1.24% of all votes. The subscriptions<br />
made with stock options may raise the number of the company's<br />
shares to 101,738,705, and the voting rights of all shares to 387,371,768<br />
votes.<br />
The company has not granted other options or special rights entitling<br />
to shares.<br />
Stock options 2003 Stock options <strong>2007</strong><br />
Grant date 31 March 2003 26 March <strong>2007</strong><br />
Instrument stock option stock option<br />
Target group management management, other key personnel<br />
2003D 2003E 2003F <strong>2007</strong>A <strong>2007</strong>B <strong>2007</strong>C<br />
Original number of options 600,000 600,000 600,000 1,000,000 1,000,000 1,000,000<br />
Number of shares per option 1 1 1 1 1 1<br />
Original exercise price per share € 9.63 € 15.19 € 19.08 € 45.82 - -<br />
Dividend adjustment Yes Yes Yes Yes Yes Yes<br />
Exercise price 31 Dec. 2005 € 5.63 € 13.19 € 19.08 - - -<br />
Exercise price 31 Dec. 2006 € 4.53 € 12.09 € 17.98 - - -<br />
Exercise price 31 Dec. <strong>2007</strong>* € 3.03 € 10.59 € 16.48 € 45.82 € 0.00 € 0.00<br />
First allocation, date 1.4.2005 1.4.2006 1.4.<strong>2007</strong> 1.4.2010 1.4.2011 1.4.2012<br />
Expiry, date 30.4.2008 30.4.2009 30.4.2010 30.4.2012 30.4.2013 30.4.2014<br />
Remaining vesting period, <strong>year</strong>s 0.3 1.3 2.3 4.3 5.3 6.3<br />
Plan participants at end of period 13 27 36 100 - -<br />
* for <strong>2007</strong>B option, the exercise price is the trading volume weighted average price of a Kesko B share in April 2008, and for <strong>2007</strong>C<br />
option, the exercise price is the trading volume weighted average price of a Kesko B share in April 2009
Year <strong>2007</strong><br />
Divisions The Group<br />
Financial<br />
statements<br />
Further information<br />
Stock options 2003 Stock options <strong>2007</strong><br />
117<br />
Subscription<br />
<strong>2007</strong> 2003D 2003E 2003F <strong>2007</strong>A <strong>2007</strong>B <strong>2007</strong>C Total (weighted)<br />
At 1 Jan. <strong>2007</strong><br />
Options granted at beginning of period 574,088 576,000 552,500 1,702,588 11.45 €<br />
Options available for grant at beginning of<br />
period<br />
Shares subscribed for with options at<br />
25,912 24,000 47,500 97,412 12.95 €<br />
beginning of period 446,300 134,920 581,220 6.28 €<br />
Options outstanding at beginning of period 127,788 441,080 552,500 1,121,368 14.13 €<br />
Movements during period<br />
Options granted during period 789,000 789,000 45.82 €<br />
Options returned during period<br />
Shares subscribed for with options during<br />
3,000 3,000 45.82 €<br />
period<br />
Average price weighted by grant<br />
94,638 34,947 118,255 247,840 10.51 €<br />
date trading volume * ) Options lapsed during period<br />
42.92 € 42.92 € 43.99 €<br />
At 31 Dec. <strong>2007</strong><br />
Options granted at end of period 574,088 576,000 552,500 789,000 2,491,588 21.31 €<br />
Options expected to vest<br />
Number of granted options sold<br />
0 0 0 789,000 789,000 45.82 €<br />
(by original holder) 534,088 362,444 211,000 0 1,107,532 8.07 €<br />
Options available for grant at end of period<br />
Shares subscribed for with options at<br />
25,912 24,000 47,500 214,000 1,000,000 1,000,000 2,311,412 35.07 €<br />
end of period 540,938 169,867 118,255 0 829,060 6.50 €<br />
Options outstanding at end of period 33,150 406,133 434,245 786,000 1,659,528 28.67 €<br />
*) for 2003D and 2003E: the <strong>year</strong> <strong>2007</strong> trade volume weighted average price of a B share, and for 2003F: trade volume weighted average price of a B<br />
share in April-December <strong>2007</strong><br />
Stock options 2003<br />
price<br />
Subscription<br />
2006 2003D 2003E 2003F Total (weighted)<br />
At 1 Jan. 2006<br />
Options granted at beginning of period 574,088 576,000 579,000 1,729,088 12.65 €<br />
Options available for grant at beginning of period 25,912 24,000 21,000 70,912 12.17 €<br />
Shares subscribed for with options at beginning of period 195,400 0 0 195,400 5.63 €<br />
Options outstanding at beginning of period 378,688 576,000 579,000 1,533,688 13.55 €<br />
Movements during period<br />
Options granted during period 17,000 17,000 17.98 €<br />
Options returned during period 43,500 43,500 17.98 €<br />
Shares subscribed for with options during period 250,900 134,920 385,820 7.17 €<br />
Average price weighted by grant date trading volume * ) 31.28 € 32.84 €<br />
Options lapsed during period<br />
At 31 Dec. 2006<br />
Options granted at end of period 574,088 576,000 552,500 1,702,588 11.45 €<br />
Options expected to vest 0 576,000 552,500 1,128,500 14.97 €<br />
Number of granted options sold (by original holder) 448,800 216,500 0 665,300 6.99 €<br />
Options available for grant at end of period 25,912 24,000 47,500 97,412 12.95 €<br />
Shares subscribed for with options at end of period 446,300 134,920 0 581,220 6.28 €<br />
Options outstanding at end of period 127,788 441,080 552,500 1,121,368 14.13 €<br />
*) for 2003D and 2003E: trade volume weighted average price of a B share in April-December 2006<br />
price
118 <strong>Kesko's</strong> <strong>year</strong> <strong>2007</strong><br />
Fair value measurement<br />
For fair value measurement Kesko Corporation has consulted Alexander Corporate Finance Oy. The fair value of options has been calculated using the<br />
Black-Scholes share pricing model. The fair value of options determined on the date of the grant has been expensed over their vesting period.<br />
During the period 1 January–31 December <strong>2007</strong>, the options contributed €2.3 million (€2.2 million) to the Group's profit.<br />
Black-Scholes model assumptions Granted in <strong>2007</strong> Granted in 2006 All options<br />
Number of options granted 789,000 17,000 2,601,500<br />
B share average (weighted) price €49.37 €26.91 €25.72<br />
Average (weighted) subscription price €45.82 €18.56 €24.11<br />
Expected average (weighted) volatility 21.7% 21.9% 24.6%<br />
Average (weighted) term of option 4.8 yrs 4.0 yrs 4.9 yrs<br />
Average (weighted) risk-free interest rate 4.5% 3.4% 3.5%<br />
Returned options (weighted average) 9.2% 14.0% 8.1%<br />
Total fair value, € 11,312,665 166,332 19,414,210<br />
The expected volatility of a Kesko B share has been estimated based on historic volatility using weekly changes over a period of time corresponding to<br />
the option's exercise period. The risk-free interest rate is the government zero coupon bond interest rate at the measurement date with a maturity<br />
equalling the option exercise period.<br />
Notes to the cash flow statement<br />
Note 38<br />
Non-cash flow related investments<br />
€ million <strong>2007</strong> 2006<br />
Total purchases of fixed assets, 233.9 281.9<br />
of which settlement in cash 238.3 237.5<br />
Settlement of prior period investments -35.4 -16.0<br />
Investments financed by finance lease or<br />
other borrowing 31.0 60.4<br />
Note 39<br />
Adjustments to cash flows from operating activities<br />
€ million <strong>2007</strong> 2006<br />
Adjustment of non-cash transactions in<br />
the income statement or items presented<br />
elsewhere in the cash flow statement:<br />
Change in provisions 1.7 5.4<br />
Income from associates -0.4 -0.7<br />
Impairment 0.5 30.4<br />
Losses on loans and advances<br />
Non-recurring gains on disposal<br />
5.0 3.7<br />
of fixed assets<br />
Non-recurring losses on disposal<br />
-43.8 -252.4<br />
of fixed assets 1.7 3.8<br />
Option expenses 2.3 2.1<br />
Defined benefit pensions -43.1 -9.8<br />
Others 0.9 2.0<br />
Total -75.2 -215.5
Year <strong>2007</strong><br />
Note 40<br />
Divisions The Group<br />
Financial<br />
statements<br />
Further information<br />
Subsidiary disposals<br />
<strong>2007</strong><br />
Kauko-Telko Ltd sold its ownership interests in Glastech Oy, Glastech<br />
Eesti AS and UAB Glastech on 20 February <strong>2007</strong>.<br />
2006<br />
• Byggmakker Norge AS, a subsidiary of Rautakesko Ltd, sold its<br />
ownership interest in Norgros Eiendom AS on 1 March 2006.<br />
• Indoor Group Ltd, a subsidiary of Keswell Ltd, sold its ownership<br />
interest in Kiinteistö Oy Tourulan Liikekeskus on 6 March 2006.<br />
• Kesko Corporation and Hämeenkylän Kauppa Oy sold 77 retail store<br />
properties to Niam Retail Holding Finland AB on 3 March 2006. In<br />
addition to directly owned properties, the transaction included real<br />
estate companies consolidated as subsidiaries and associates. The<br />
subsidiary disposals contributed €27 million to the cash flow.<br />
• Keswell Ltd, a subsidiary of Kesko Corporation, sold its ownership<br />
interest in Academica Oy on 6 October 2006.<br />
Note 41<br />
Associate disposals<br />
€ million <strong>2007</strong> 2006<br />
Cash flow from disposals<br />
Proceeds Rimi Baltic AB (Note 3)<br />
Cash and cash equivalents Rimi Baltic AB<br />
0.0 190.0<br />
(Note 3) 0.0 -10.9<br />
Proceeds other associates 0.6 25.7<br />
Net cash inflow 0.6 204.8<br />
Note 42<br />
119<br />
Proceeds from available-for-sale financial assets<br />
<strong>2007</strong><br />
In <strong>2007</strong>, the proceeds from available-for-sale financial assets totalled<br />
€46.9 million, of which €46 million is attributable to SATO Corporation<br />
shares sold by Kesko Corporation to Varma Mutual Pension Insurance<br />
Company.<br />
Note 43<br />
Cash and cash equivalents and current<br />
available-for-sale financial assets<br />
€ million <strong>2007</strong> 2006<br />
Available-for-sale financial assets 155.6 200.4<br />
Cash on hand and balances with banks 89.7 56.5<br />
Total 245.3 256.9
120 <strong>Kesko's</strong> <strong>year</strong> <strong>2007</strong><br />
Note 44<br />
Financial risk management<br />
Financial risk management<br />
With respect to financial risks, the Group observes a uniform funding<br />
policy that has been approved by the company's Board of Directors. Compliance<br />
with this policy and developments in the Group's financial situation<br />
are monitored by the Audit Committee of the Board of Directors. The<br />
policy covers the sectors for which Corporate Treasury holds central<br />
responsibility, namely Group funding, liquidity management, bank relations<br />
and the management of financial risks. In the main, the Group's<br />
funding is arranged through the parent company, and the Corporate<br />
Treasury arranges intra-Group loans for the funding of subsidiaries in<br />
their local currencies. For companies with significant external ownership,<br />
the Group has not guaranteed financial liabilities in excess of its<br />
ownership interest.<br />
Currency risk and sensitivity analysis<br />
The Group's balance sheet is exposed to translation risks in connection<br />
with investments in subsidiaries outside the eurozone. This balance<br />
sheet exposure has been hedged by using currency-denominated loans<br />
and forward fx agreements if the translation risk is in excess of €1 million.<br />
The most significant balance sheet exposure positions are in Estonian<br />
kroon, Norwegian krone, Swedish krona, Russian rouble, Lithuanian<br />
lit and Latvian lat.<br />
The Group has not hedged foreign currency denominated goodwill<br />
(incl. allocated goodwill) with a counter value of €112.4 million (€105.6<br />
million) at 31 December <strong>2007</strong>.<br />
The currency risk exposed to translation risk, excluding foreign-currency-denominated<br />
goodwill, is small in proportion to the volume of<br />
operations and the balance sheet total. A simultaneous 10% weakening<br />
of the six central currencies (NOK, EEK, LTL, RUB, LVL, SEK) against the<br />
euro would result in a €4.6 million negative change in equity at 31<br />
December <strong>2007</strong> (€7.3 million).<br />
Translation risk and hedging at 31 December <strong>2007</strong><br />
€ million Latvia Norway Estonia Sweden Russia Lithuania Others Total<br />
Equity exposed to translation risk*) 7.9 27.2 78.6 3.0 21.0 39.8 7.9 185.4<br />
Hedging derivatives 3.6 37.7 5.3 18.9 13.8 79.3<br />
Hedging loans 2.2 22.6 25.9 9.8 60.5<br />
Open position 2.1 4.6 15.0 -2.3 2.1 16.2 7.9 45.6<br />
*) equity excl. allocated goodwill<br />
Translation risk and hedging at 31 December 2006<br />
€ million Latvia Norway Estonia Sweden Russia Lithuania Others Total<br />
Equity exposed to translation risk*) 7.6 42.6 39.1 9.3 18.8 29.5 4.1 151.0<br />
Hedging derivatives 2.9 9.7 2.2 8.7 15.9 39.4<br />
Hedging loans 24.3 9.6 4.3 38.2<br />
Open position 4.7 8.6 29.5 7.1 10.1 9.3 4.1 73.4<br />
*) equity excl. allocated goodwill<br />
Kesko Corporation's USD-denominated private placement loan has<br />
been hedged against currency risk and interest rate risk by applying<br />
hedge accounting. Currency and interest rate swaps in the same amount<br />
and maturity as the loan have been designated as the hedging instruments.<br />
Consequently, the loan is entirely hedged against currency and<br />
interest rate risk. During the period, no amount of ineffectiveness has<br />
been recognised in the income statement relating to this credit facility.<br />
International purchasing activity exposes the Group to transaction<br />
risks relating to several foreign currencies. Due to the fast turnover of<br />
some products, the exposure related to their purchases cannot grow to a<br />
significant level because the selling prices of these products can be<br />
changed as necessary. The percentage of hedging is decided by the subsidiaries<br />
and business units concerned. Transaction risk exposures<br />
mainly relate to the US dollar. Business units carry out their hedging<br />
operations together with Corporate Treasury, which hedges risk positions<br />
using market transactions within the limits confirmed for each currency.<br />
A sensitivity analysis for the currency risk relating to the USD, prepared<br />
in compliance with IFRS 7, would have contributed a pre-tax profit<br />
of €+/-0.4 million (€+/-0.7 million) at the balance sheet date of 31 December<br />
<strong>2007</strong>, had the USD rate change been +/-10%. It is assumed that the<br />
other variables remain unchanged. The calculation includes foreign currency<br />
denominated trade payables, trade receivables and currency derivatives<br />
recognised in the balance sheet. Their combined net position totals<br />
€6.4 million (€9.7 million). The analysis does not consider the foreign<br />
currency denominated orders, some of which are also hedged.<br />
The Group's foreign subsidiaries also buy currency independently for<br />
commercial purchases. Such purchases do not, however, constitute a significant<br />
proportion of total purchases.<br />
The Group does not apply hedge accounting in accordance with IAS<br />
39 to hedge commercial currency risks. In initial recognition, derivative<br />
instruments are recorded at fair value and at subsequent measurement<br />
they are recognised at fair value. Value changes of currency derivatives<br />
used to hedge purchases and sales are recognised in other operating<br />
income or expenses.<br />
The Group companies are financed in the local currency of each company.<br />
The parent company hedges against related foreign currency risks
Year <strong>2007</strong><br />
Divisions The Group<br />
Financial<br />
statements<br />
Further information<br />
using derivative instruments or foreign currency denominated<br />
borrowing.<br />
Loan interest rate risk and sensitivity analysis<br />
Changes in the interest rate level affect the Group's interest expenses.<br />
The interest rate level correlates negatively with private consumer<br />
demand and investment demand, which is why financial results in a rising<br />
interest rate environment are affected by higher interest expenses,<br />
while the demand for products and services slackens. Interest rate hedging<br />
is used to equalise the effects of interest rate movements on the profits<br />
for different financial periods.<br />
Interest rate risks are centrally managed by Corporate Treasury,<br />
which adjusts loan duration using interest rate derivative instruments.<br />
The target duration is three <strong>year</strong>s and it is allowed to vary from one and a<br />
half (1.5) to four (4) <strong>year</strong>s. The actual duration during the period was 3.0<br />
<strong>year</strong>s on average (2.9 <strong>year</strong>s).<br />
A sensitivity analysis for variable rate loans and commercial paper<br />
liabilities realised during the period, prepared in compliance with IFRS,<br />
uses average balance values realized during the period. At the balance<br />
sheet date of 31 December <strong>2007</strong>, the interest-bearing variable rate liabilities<br />
and interest rate derivatives hedging loans from financial institutions<br />
would have contributed €–/+4.6 million to the profit, had the interest<br />
rate level risen or fallen by 1 percentage point (€–/+4.8 million).<br />
Liabilities to K-retailers consist of two types of interest-bearing<br />
receivables payable by the Kesko Group companies to K-retailers: retailers'<br />
prepayments to Kesko, and retailers' chain rebates. Chain rebates are<br />
subsequent discounts granted to retailers and their terms vary from one<br />
store chain to another. All retailers in a chain have the same terms applicable<br />
to prepayments and chain rebates.<br />
Private placement notes, pension loans and the amount of €128.3 million<br />
of loans from financial institutions have fixed rates and the effective<br />
interest cost represents 5.2%. At the end of period, the average rate of<br />
Cash flows from financial liabilities and related financial expenses at 31 Dec. <strong>2007</strong><br />
€ million 2008 2009 2010 2011 2012 2013- Total<br />
Loans from financial institutions 17.4 19.3 0.6 0.9 0.7 28.9 67.8<br />
financial expenses 3.7 2.9 1.4 1.4 1.3 4.1 14.8<br />
Private placement bonds (USD) 81.5 81.5<br />
financial expenses 5.1 5.1 5.1 5.1 5.1 15.9 41.2<br />
Pension loans 0.8 0.8 0.8 0.4 2.8<br />
financial expenses 0.1 0.1 0.0 0.0 0.3<br />
Finance lease liabilities 18.8 24.2 16.5 26.8 11.2 68.6 166.1<br />
financial expenses 8.9 8.1 7.3 6.0 5.2 18.2 53.6<br />
Liabilities to K-retailers 122.2 122.2<br />
financial expenses 4.3 4.3<br />
Other interest-bearing liabilities 62.4 0.0 0.0 62.4<br />
financial expenses 1.4 1.4<br />
Commercial papers 98.1 98.1<br />
financial expenses 3.8 3.8<br />
Non-current non-interest-bearing liabilities 0.0 0.0 0.1 0.1<br />
Current non-interest-bearing liabilities<br />
Trade payables 837.8 837.8<br />
Accruals and deferred income 272.1 272.1<br />
Other non-interest-bearing liabilities 159.2 159.2<br />
121<br />
loans from financial institutions with variable interest rates, liabilities<br />
to retailers and other interest-bearing liabilities was 5.9%. Some of the<br />
loans are euro-denominated, private placement notes are USD-denominated,<br />
and loans from financial institutions and commercial paper liabilities<br />
include NOK-denominated loans corresponding to €25.1 million<br />
(€24.3 million), EEK-denominated loans corresponding to €26.0 million<br />
(€15.1 million), LVL-denominated loans corresponding to €47.6 million<br />
(€24.3 million) and LTL-denominated loans corresponding to €24.4 million<br />
(€18.9 million).<br />
Liquidity risk and sensitivity analysis<br />
for interest-bearing receivables<br />
Liquidity risk management aims at maintaining sufficient liquid assets<br />
and credit lines in order to guarantee the availability of sufficient funding<br />
for the Group's business activities at all times. The aim is to invest liquidity<br />
consisting of cash and cash equivalents in the money market by using<br />
efficient combinations of return and risk. At regular intervals, the Group's<br />
management approves the instruments and limits for each investment.<br />
The Group's treasury policy includes a portfolio classification, which<br />
organises liquid funds by their usage in investments in the money market.<br />
The nature of the cash portfolio is more liquid, with a maximum duration<br />
of 2 months. In <strong>2007</strong>, the average duration was 1 month (1 month).<br />
The target duration of the money market portfolio is 6 months, and the<br />
average duration was 4.8 months in <strong>2007</strong> (6 months). Financial assets<br />
have been invested in euro zone commercial papers, bank certificates of<br />
deposit, and deposits. At 31 December <strong>2007</strong>, investments in commercial<br />
papers totalled €176.6 million (€165.3 million), in bank certificates of<br />
deposit and deposits €17.5 million (€58.6 million). Financial assets at fair<br />
value through profit or loss include globally investing bond and special<br />
investment funds. At 31 December <strong>2007</strong>, these investments totalled €66.9<br />
million (€117.2 million). The maximum credit risk of these investments is<br />
their fair value in the balance sheet at the balance sheet date.
122 <strong>Kesko's</strong> <strong>year</strong> <strong>2007</strong><br />
Cash flows from derivative instruments at 31 Dec. <strong>2007</strong><br />
€ million 2008 2009 2010 2011 2012 2013- Total<br />
Payables<br />
Foreign currency hedge forward contracts<br />
of net investment<br />
Foreign currency forward contracts outside<br />
79.0 79.0<br />
hedge accounting<br />
Net settlement of payables<br />
265.6 7.2 272.7<br />
Interest rate derivatives<br />
Electricity derivatives<br />
0.1 0.1<br />
Grain derivatives<br />
Derivatives relating to private placement<br />
bonds*<br />
0.4 0.4<br />
Foreign currency derivatives<br />
Receivables<br />
1.2 1.2 1.2 1.2 1.1 22.6 28.5<br />
Net investment hedging instruments<br />
Foreign currency forward contracts outside<br />
78.8 78.8<br />
hedge accounting<br />
Net settlement of receivables<br />
265.7 7.5 273.1<br />
Interest rate derivatives 0.0 0.0 0.0 0.0 0.0 0.1<br />
Electricity derivatives 0.0 2.9 0.7 0.0 8.4<br />
Grain derivatives<br />
Derivatives relating to private placement<br />
0.0 0.0<br />
bonds* 0.0<br />
Interest rate derivatives 0.9 0.9 0.9 0.9 0.9 2.8 7.1<br />
Cash flows from financial liabilities and relating financial expenses at 31 Dec. 2006<br />
€ million <strong>2007</strong> 2008 2009 2010 2011 2012- Total<br />
Loans from financial institutions 42.5 19.6 18.3 0.6 0.5 26.0 107.5<br />
financial expenses 4.6 2.8 2.2 1.2 1.2 4.5 16.5<br />
Private placement bonds (USD) 0.0 0.0 0.0 0.0 0.0 91.1 91.1<br />
financial expenses 5.7 5.7 5.7 5.7 5.7 23.4 51.7<br />
Pension loans 11.5 0.8 0.8 0.8 0.4 14.3<br />
financial expenses 0.3 0.1 0.1 0.0 0.0 0.6<br />
Finance lease liabilities 19.0 21.9 20.3 12.6 11.8 82.5 168.1<br />
financial expenses 9.6 8.8 8.2 7.3 7.1 19.5 60.5<br />
Liabilities to K-retailers 121.7 121.7<br />
financial expenses 2.9 2.9<br />
Other interest-bearing liabilities 68.9 0.0 0.0 0.0 0.0 0.0 68.9<br />
financial expenses 0.8 0.0 0.0 0.0 0.0 0.0 0.8<br />
Commercial papers 22.2 22.2<br />
financial expenses 0.7 0.7<br />
Non-current non-interest-bearing liabilities 1.0 0.9 0.9 0.0 0.0 2.9<br />
Current non-interest-bearing liabilities<br />
Trade payables 789.2 789.2<br />
Accrued liabilities 258.6 258.6<br />
Other non-interest-bearing liabilities 159.8 159.8
Year <strong>2007</strong><br />
Divisions The Group<br />
Financial<br />
statements<br />
Further information<br />
Cash flows from derivative instruments at 31 Dec. 2006<br />
€ million <strong>2007</strong> 2008 2009 2010 2011 2012- Total<br />
Payables<br />
Foreign currency hedge forward contracts of<br />
net investment<br />
Foreign currency forward contracts outside<br />
39.3 39.3<br />
hedge accounting<br />
Net settlement of payables<br />
217.2 7.1 7.2 231.4<br />
Interest rate derivatives 0.3 0.3<br />
Electricity derivatives 1.6 0.4 0.1 0.0 2.1<br />
Grain derivatives<br />
Derivatives relating to private placement<br />
bonds*<br />
0.0<br />
Foreign currency derivatives<br />
Receivables<br />
0.6 0.6 0.6 0.6 0.6 11.7 14.6<br />
Net investment hedging instruments<br />
Foreign currency forward contracts outside<br />
39.0 39.0<br />
hedge accounting<br />
Net settlement of receivables<br />
217.3 7.3 7.3 231.8<br />
Interest rate derivatives 0.0 0.0<br />
Electricity derivatives<br />
Derivatives relating to private placement<br />
bonds*<br />
1.6 1.4 0.3 0.0 3.2<br />
Interest rate derivatives 0.9 0.9 0.9 0.9 0.9 3.6 8.0<br />
* The cash flows of private placement bonds and relating foreign currency and interest rate derivatives are settled on net basis.<br />
A sensitivity analysis for variable rate receivables, prepared in compliance<br />
with IFRS, uses average balance values of invested assets. The<br />
receivables include customer financing receivables, finance lease receivables,<br />
other interest-bearing receivables, and investments in commercial<br />
papers and bond funds. The sensitivity of bond funds has been determined<br />
based on duration. These items would have contributed €+/-4.4<br />
million (€+/-2.4 million) to the pre-tax profit at the balance sheet date,<br />
had the interest rate level changed by +/-1 percentage point. The variable<br />
rate receivables include receivables of the K-Rahoitus group and excluding<br />
them, the profit contribution would have been €+/-2.5 million (€+/-1.0<br />
million).<br />
At the balance sheet date, the total value of undrawn committed longterm<br />
credit facilities was €225 million (€225 million). In addition, the<br />
Group's euro-denominated uncommitted credit lines available contain<br />
commercial paper programmes denominated in Estonian kroon, Lithuanian<br />
lit and Latvian lat to a total counter value of €541.7 million (€421.7<br />
million).<br />
The terms and conditions of the private placement credit facility and<br />
the committed limit include financial covenants. The requirements of<br />
these covenants have been met.<br />
Credit risk<br />
The business companies of the Group's divisions are responsible for managing<br />
credit risks related to receivables from customers. They prepare<br />
and maintain a documented credit policy. In Finland, the main part of the<br />
Group's business activities is carried out in cooperation with retailers.<br />
According to the retailer agreements, retailers lodge bank overdrafts as<br />
collateral against their trade payables to the relevant Kesko subsidiaries.<br />
123<br />
The Group companies apply a uniform practice to measuring overdue<br />
receivables. A receivable is written down when there is objective evidence<br />
of impairment.<br />
Breakdown by maturity of trade receivables<br />
€ million <strong>2007</strong> 2006<br />
Trade receivables not matured 613.2 582.7<br />
1–7 days mature 17.1 10.6<br />
8–30 days mature 27.8 33.5<br />
31–60 days mature 11.2 9.6<br />
over 60 days mature 13.0 9.9<br />
Total 682.1 646.3<br />
Of trade receivables, €214.4 million (€203.0 million) were from K-food<br />
store, K-rauta and Rautia retailers, and €27.4 million (€22.5 million) were<br />
credit card receivables.<br />
Among the Group divisions, Kesko Agro has the biggest customer<br />
finance needs. A Kesko Corporation subsidiary, K-Rahoitus Oy, with its<br />
subsidiary provide interest-bearing financing to Kesko Agro's and<br />
Konekesko's professional customers in Finland and the Baltic countries.<br />
At the end of the period, K-rahoitus Oy's interest-bearing financial receivables<br />
totalled €199.9 million (€170.7 million). K-Rahoitus Oy's non-Group<br />
receivables are reported in available-for-sale assets (Notes 3 and 25).<br />
Financial credit risk<br />
Financial instruments involve the risk that a counterparty fails to discharge<br />
an obligation. Kesko only makes currency and other derivative
124 <strong>Kesko's</strong> <strong>year</strong> <strong>2007</strong><br />
contracts with banks that have good creditworthiness. Liquid funds are<br />
invested annually, within limits confirmed separately for each counterparty,<br />
in instruments with good creditworthiness.<br />
Borrowing agreements at change of control (over 50% interest)<br />
According to the terms of Kesko Corporation's USD-denominated private<br />
placement loan, in a situation involving a change of control, Kesko is<br />
obligated to offer a repayment of the whole loan capital to all noteholders.<br />
The noteholders have the right to accept or refuse the repayment.<br />
According to the terms of Kesko Corporation's syndicated loan, the<br />
syndicate has the right to call in the loan and any withdrawn loan<br />
amounts.<br />
According to the terms of either loan agreement, a transfer of ownership<br />
to retailers or a retailers' association shall not be considered a<br />
change of control.<br />
Credit ratings<br />
For the present, Kesko Corporation has not applied for a credit rating,<br />
because it has not been considered necessary in the company's present<br />
treasury situation.<br />
Commodity risks and their sensitivity analysis<br />
The Group uses electricity derivatives to even out energy costs. The electricity<br />
price risk is assessed for three-<strong>year</strong> periods. The value changes of<br />
derivatives hedging the price of electricity supplied during the period are<br />
included in the adjustment items of purchases. Hedge accounting is<br />
applied to contracts hedging future purchases. The effective portion of<br />
derivatives that meet hedge accounting criteria are recognised in the<br />
revaluation reserve of equity and the ineffective portion in other operat-<br />
Fair values of derivative financial instruments<br />
€ million<br />
Positive fair value<br />
(balance sheet<br />
ing income or expenses in the income statement. Hedge accounting<br />
resulted in no significant ineffectiveness.<br />
At the balance sheet date, a total quantity of 853,044 MWH (949.244<br />
MWH in 2006) of electricity had been purchased with derivatives and the<br />
1–12 month hedging rate was 75.8% (86.8%), the 13–24 month rate was<br />
47.2% (61.4%) and the 25–36 month rate was 20.2% (32.8%).<br />
A sensitivity analysis for electricity derivatives, prepared in compliance<br />
with IFRS, assumes that derivatives maturing within less than 12<br />
months have an impact on profit. If the market price of electricity derivatives<br />
had changed by +/-10 percentage points at the balance sheet date 31<br />
December <strong>2007</strong>, it would have contributed €+/-1.9 million (€(+/-2.1 million)<br />
to equity and €+/-1.5 million (€+/-1.5 million) to profit. The impact<br />
has been calculated before tax.<br />
The Group's agricultural division uses an insignificant amount of<br />
grain derivatives to hedge against grain price risk.<br />
Capital structure management<br />
The Kesko Group's capital management objectives include targets set for<br />
the Group's capital productivity, solvency and liquidity.<br />
The purpose of setting objectives for the Group's capital productivity<br />
is to guide the divisions to work for increased shareholder value on a<br />
long-term basis. The objectives of capital productivity have been set to<br />
equity (target 14%) and to the total of invested capital (target 16%). The<br />
calculation formulas for the indicators 'return on equity' and 'return on<br />
capital invested’ are presented in the financial statements, p. 130. The<br />
Group’s capital structure (equity-to-debt ratio) is only optimised at the<br />
Group level, which is why at the lower levels of divisions and companies,<br />
the targets relating to the productivity of capital have been set to the<br />
indicators 'economic value added' and 'return on net assets.<br />
<strong>2007</strong> <strong>2007</strong> <strong>2007</strong> 2006<br />
value)<br />
Negative fair value<br />
(balance sheet<br />
value) Net fair value Net fair value<br />
Interest rate derivatives 4.9 ** -0.1 4.8 -2.0<br />
Forward exchanges 1.4 */** -20.1 */** -18.7 -9.2<br />
Currency options (bought)<br />
Electricity derivatives 7.9 7.9 1.0<br />
Grain derivatives 0.0 -0.4 -0.4 0.0<br />
Nominal values of derivative financial instruments<br />
31 Dec. <strong>2007</strong> 31 Dec. 2006<br />
€ million Nominal value Nominal value<br />
Interest rate derivatives 240.7 ** 231.9<br />
Forward exchanges 466.3 */** 372.1<br />
Currency options (bought)<br />
Electricity derivatives 36.6 38.1<br />
Grain derivatives 5.0 0.7<br />
*) Derivative financial instruments also include fx agreements used to hedge net investments in foreign entities with a fair value of €-0.2 million (€-0.3 million) and<br />
a nominal value of €79.3 million (€39.4 million).<br />
**) Derivative financial instruments include interest rate swaps relating to a currency-denominated loan arrangement with a nominal gross value of €200.8 million and a fair value of<br />
€4.9 million (€-1.8 million), and currency swaps with a nominal value of €100.4 million and a fair value of €-18.9 million (€-9.3 million).<br />
The maximum credit risk of derivatives is the fair value of the balance sheet at the reporting date.
Year <strong>2007</strong><br />
Economic value added formula:<br />
Operating profit excluding non-recurring items<br />
less operational taxes<br />
less return requirement for average restricted capital<br />
+/- other adjustment items<br />
Divisions The Group<br />
Financial<br />
statements<br />
Further information<br />
The objectives for the Group's solvency and liquidity are set with the purpose<br />
of securing the Group's liquidity in all market situations, enabling<br />
the implementation of investment programmes based on the Group's<br />
strategy and maintaining the shareholder value. Objectives have been set<br />
to equity ratio (target 40–45%) and interest-bearing net debt/operating<br />
margin (target < 3). The calculation formulas for these indicators are presented<br />
in the financial statements, p. 130. The Group's interest-bearing<br />
debt include covenants, whose terms and conditions have been taken<br />
into account in the target levels. The Group does not have a credit rating<br />
given by any external credit rating institution.<br />
The above target levels set for consolidated financial indicators are<br />
revised annually as part of the Group's strategy process and changes are<br />
submitted for approval to the Group's Board of Directors.<br />
Target level <strong>2007</strong> 2006<br />
Return on equity 14% 12%<br />
Return on invested capital 16% 12%<br />
Equity ratio 40–45% 40–45%<br />
Interest-bearing net debt/operating<br />
margin < 3 < 3<br />
Note 45<br />
Risk management<br />
<strong>Kesko's</strong> risk management policy<br />
The risk management policy approved by the Board of Directors guides<br />
risk management in the Kesko Group. The divisions have assessed the<br />
risks in connection with the strategy cycle and have updated their risk<br />
assessments quarterly. Separate risk analyses have been made for major<br />
projects. Also the Group units have analysed the risks threatening the<br />
objectives and their management.<br />
On the basis of the Divisions' and Group units' risk analyses, the Corporate<br />
Risk Management Unit has prepared summaries of major risks<br />
and their management on a quarterly basis for Kesko Corporation's<br />
Board of Directors' Audit Committee. <strong>Kesko's</strong> Corporate Management<br />
Board has analysed and prioritised the major risks of the Group.<br />
Risks and their management<br />
The Kesko Group's risk analyses have, for example, addressed the following<br />
risks and their management in <strong>2007</strong>.<br />
Delivering the customer promise<br />
The price-quality ratio is a key competitive factor. If Kesko does not succeed<br />
in this competition, it will not achieve the sales targets. The general<br />
cost development can also endanger the implementation of objectives.<br />
Enhancing price competitiveness calls for improvements in the efficiency<br />
of operations throughout the supply chain from the supplier to<br />
the store shelf.<br />
125<br />
Product safety and quality of the supply chain<br />
<strong>Kesko's</strong> goal is to provide safe products for its customers. A failure in the<br />
quality assurance of the supply chain or in product control may result in<br />
financial losses, the loss of customer confidence or, in the worst case, a<br />
health hazard. Product research, the trading sector's self-control and<br />
manufacturer audits ensure the quality and safety of the products sold.<br />
Store sites<br />
Store sites are a strategic competitive factor. Considerable amounts of<br />
capital are tied up in store properties for decades. Local competitive situations<br />
can change fast and there is a risk that operations at the store site<br />
will become unprofitable. The risk is managed by long-term planning of<br />
the store network, by careful preparation of each store site investment<br />
decision and by applying a sale and lease back approach.<br />
The acquisition of new store sites can be delayed not only by shortage<br />
of sites, town planning and permit practices, but also by the price trends<br />
of sites and construction. Different countries also have their specific features.<br />
Online sales are growing, which affects the store network. Success<br />
in e-commerce requires a completely new kind of business expertise,<br />
logistics and information security solutions.<br />
Suppliers and distribution channels<br />
In business divisions that are strongly dependent on individual principals<br />
and suppliers, changes in a principal's or supplier's strategy concerning<br />
the product selection, pricing and distribution channel solutions<br />
can mean a reduction in competitiveness or sales or loss of business.<br />
Good market shares, growing sales and development of operations create<br />
a basis for long-term cooperation.<br />
Shrinkage<br />
Shrinkage is a significant problem in the retail trade. Shrinkage can<br />
result from spoilage or breakage of goods, theft or other malpractice, and<br />
unsuccessful purchasing, for example. The most important loss prevention<br />
activities include uniform measuring and monitoring of shrinkage,<br />
and the consequent development and introduction of new management<br />
methods.<br />
Internationalisation<br />
Internationalisation aims at growth either through business acquisitions<br />
or expanding the existing store network. Success in international<br />
growth requires careful planning of acquisitions and expansion projects,<br />
resources and risk management. Challenges include different cultures,<br />
local business practices, authorities' actions and fast-changing operating<br />
environments. Finnish retail trade operating processes and control practices<br />
cannot always be introduced as such outside Finland. The efficient<br />
steering of operations and the achievement of synergy benefits require<br />
implementation of common practices and information systems across<br />
country and organisational boundaries.<br />
Personnel<br />
Competition for skilled employees has intensified in the labour market.<br />
Recruiting competent employees and retaining their commitment is<br />
challenging particularly in the Baltic countries and Russia. Implementation<br />
of strategies requires competent and motivated personnel. There is a<br />
risk that the trading sector will not attract the most skilled people. Specialisation<br />
increases dependence on the competence of individuals. In<br />
updating strategies, the competencies required to implement the strat-
126 <strong>Kesko's</strong> <strong>year</strong> <strong>2007</strong><br />
egy are identified, and personnel plans are drawn up on that basis. <strong>Kesko's</strong><br />
employer image is redefined by systematic internal and external<br />
communications and stakeholder cooperation.<br />
Continuity of operations and information security<br />
The trading sector is characterised by increasingly complicated and long<br />
supply chains and their dependency on information systems, telecommunications<br />
and external service providers. Disturbances in the supply<br />
chain can cause major losses in sales and profit. These problems may be<br />
reflected to the customer in that there are no products available in the<br />
store or the store is closed. Kesko has continuity management projects<br />
underway which aim to secure undisturbed critical operations and a sufficiently<br />
fast recovery after a serious disturbance.<br />
The importance of information in business operations is increasing<br />
all the time. The requirements of stakeholders and the legislation to safeguard<br />
the handling of information have grown. Confidentiality of customer<br />
and employee information, and business secrets is protected with<br />
up-to-date practices and information security solutions.<br />
Legislation, agreements and ethical principles<br />
Compliance with legislation, agreements and <strong>Kesko's</strong> ethical principles is<br />
an important basic value. Non-compliance may result in fines, compensation<br />
for damages and other financial losses, and a loss of confidence or<br />
reputation. The Group has specific Compliance programmes to avoid this.<br />
Self-assessments are made in matters concerning competition legislation.<br />
An essential issue in the chain agreements between Kesko and the<br />
retailers is finding solutions for the high-quality delivery of customer<br />
promise and commitment to the chain business. The efficient steering of<br />
chain operations is, to some extent, complicated by interpretations of<br />
competition legislation.<br />
One of the goals of <strong>Kesko's</strong> corporate communications is to produce<br />
and publish reliable information at the right time. If some information<br />
published by Kesko proved to be wrong or a release failed to meet regulations,<br />
this may result in investors and other stakeholder groups losing<br />
confidence and in possible sanctions.<br />
Litigations<br />
No major litigations are pending, and the Board of Directors is not aware<br />
of any other legal risks that would have a material effect on the Group's<br />
performance.<br />
Other risks<br />
Damage, accidents and crimes are prevented with uniform practices and<br />
cost-efficient safety precautions. Financial losses and interruptions in<br />
operations are covered with Group-wide and appropriate insurance,<br />
revised on a regular basis.<br />
Note 46<br />
Related party transactions<br />
The Group's related parties include its directors (the Board of Directors,<br />
the Managing Director and the Corporate Management Board), subsidiaries,<br />
associates, joint ventures and the Kesko Pension Fund. The subsidiaries,<br />
joint ventures and associates are listed in a separate note.<br />
The following transactions were carried out with related parties:<br />
Sales of goods and services<br />
€ million<br />
Sales of goods<br />
<strong>2007</strong> 2006<br />
Associates 0.0 0.3<br />
Board of Directors and management 24.1 25.9<br />
Other related party 4.6 0.0<br />
28.7 26.2<br />
Sales of services<br />
Associates 0.7 1.6<br />
Board of Directors and management 1.8 3.0<br />
Kesko Pension Fund 1.5 1.2<br />
4.0 5.8<br />
The related party transactions disclosed include those transactions with<br />
related parties that are not eliminated in the consolidated financial<br />
statements.<br />
Among associates consolidated using the equity method, a property<br />
owned by Valluga-Sijoitus Oy has been leased for the Group's use. Vähittäiskaupan<br />
Takaus Oy and Vähittäiskaupan Tilipalvelu Oy sell their services<br />
to <strong>Kesko's</strong> and K-retailers' retail companies. The other associates<br />
mainly include business property companies which have leased their<br />
premises and real estate to the Kesko Group. Associates that operate as<br />
mutual real estate companies have been consolidated in the financial<br />
statements in proportion to their ownership interest.<br />
Three members of <strong>Kesko's</strong> Board of Directors act as K-retailers. The<br />
Group companies sell goods and services to enterprises controlled by<br />
them.<br />
The Kesko Pension Fund is a separate legal entity which manages and<br />
holds in trust part of the pension assets of the Group's employees in Finland.<br />
Pension assets include Kesko Corporation shares in the amount of<br />
€130.2 million. Real estate and premises owned by the Pension Fund have<br />
been leased to the Kesko Group, which has subleased most of them to<br />
retailers. In <strong>2007</strong>, the Kesko Group paid a total amount of €45.6 million<br />
(€18.8 million) in contributions to the Pension Fund.<br />
The sales of goods and services to related parties have been carried<br />
out on general market terms and conditions and at market prices.<br />
Purchases of goods and services<br />
€ million<br />
Purchases of goods<br />
<strong>2007</strong> 2006<br />
Associates 0.4 14.2<br />
Board of Directors and management 2.9 2.4<br />
Total 3.3 16.6<br />
Purchases of services<br />
Associates 1.9 7.2<br />
Board of Directors and management 0.0 0.1<br />
Pension Fund 0.0 0.1<br />
Total 1.9 7.4<br />
In addition, other operating expenses include rents paid by the Kesko<br />
Group to the Kesko Pension Fund in a total amount of €18.4 million<br />
(€15.6 million).
Year <strong>2007</strong><br />
Divisions The Group<br />
Financial<br />
statements<br />
Further information<br />
Board of Directors' remunerations<br />
€ thousands<br />
Members of the Board of Directors<br />
<strong>2007</strong> 2006<br />
Heikki Takamäki, Chairman 65.5 61.2<br />
Keijo Suila, Deputy Chairman<br />
Matti Kavetvuo, Deputy Chairman<br />
49.5 43.4<br />
(until 27 March 2006) - 8.0<br />
Pentti Kalliala 35.0 33.3<br />
Eero Kasanen (until 27 March 2006) - 6.8<br />
Ilpo Kokkila (from 27 March 2006) 34.0 25.5<br />
Maarit Näkyvä 37.5 35.8<br />
Seppo Paatelainen (from 27 March 2006) 36.0 27.5<br />
Kari Salminen (from 30 March 2005) - 6.8<br />
Jukka Säilä (from 27 March 2006) 34.0 25.5<br />
Salaries and fees of Managing Director, Deputy Managing Director and<br />
Corporate Management Board<br />
€ thousands<br />
Matti Halmesmäki, Managing Director<br />
<strong>2007</strong> 2006<br />
(from 1 March 2005)<br />
Juhani Järvi, Deputy Managing Director<br />
736.1 598.2<br />
(17 March 2005–31 May <strong>2007</strong>)<br />
Corporate Management Board<br />
124.6 254.3<br />
(other members) 1,697.1 1,397.0<br />
Other top management employee benefits<br />
Share-based payments<br />
At 31 December <strong>2007</strong>, the Managing Director held 50,000 stock options<br />
and the other Corporate Management Board members held a total of<br />
214,000 stock options In <strong>2007</strong>, the other Corporate Management Board<br />
members were granted a total of 145,000 <strong>2007</strong> A options. The options held<br />
by the Corporate Management Board have equal terms and vesting periods<br />
with the other options included in the management's option plans.<br />
Retirement benefits<br />
The retirement age of the Managing Director is 60 <strong>year</strong>s and his full<br />
retirement benefit is 66% of his pensionable salary. The retirement benefits<br />
of the other Corporate Management Board members are determined<br />
on the basis of the Employees' Pensions Act (TyEL), or based on a separate<br />
agreement, in which case the retirement age varies between 60 and<br />
62, and the full retirement benefit is 66% of the pensionable salary.<br />
Termination benefits<br />
The notice period of Managing Director is 6 months. Severance compensation<br />
paid in addition to the salaries for the notice period corresponds<br />
to 12 months' salary. The notice period of the other Corporate Management<br />
Board members is 6 months and severance compensation paid in<br />
addition to the salaries for the notice period corresponds to 6–12 months'<br />
salary.<br />
Financial income<br />
€ million <strong>2007</strong> 2006<br />
Associates 0.0 0.0<br />
0.0 0.0<br />
Financial expenses<br />
127<br />
€ million <strong>2007</strong> 2006<br />
Associates 1.2 1.0<br />
Board of Directors and management 0.0 0.0<br />
Pension Fund 0.1 0.0<br />
Trade receivables<br />
1.3 1.0<br />
€ million <strong>2007</strong> 2006<br />
Associates 0.1 0.3<br />
Board of Directors and management 1.7 1.9<br />
Pension Fund 0.5 0.1<br />
2.3 2.3<br />
Three members of <strong>Kesko's</strong> Board of Directors act as K-retailers. At the<br />
balance sheet date, the receivables resulting from sales by Kesko to enterprises<br />
controlled by them totalled €1.7 million (€2.1 million). The receivables<br />
are covered by the commercial credit collateral granted by Vähittäiskaupan<br />
Takaus Oy, a Kesko associate. The maximum amount of the<br />
collateral is always limited to the realisable value of the counter-guaranteee<br />
granted by the K-retailer's enterprise and the K-retailer entrepreneur<br />
to Vähittäiskaupan Takaus. At the end of the period, the value of the<br />
counter-guarantee was €5.9 million (€6.0 million).<br />
Other current liabilities<br />
€ million <strong>2007</strong> 2006<br />
Associates 24.1 37.0<br />
Board of Directors and management 0.9 0.8<br />
Pension Fund 1.9 2.6<br />
26.9 40.4<br />
Other current liabilities include e.g. chain rebate liabilities payable to the<br />
companies controlled by three members of <strong>Kesko's</strong> Board of Directors<br />
acting as K-retailers. Chain rebates are paid in arrears on criteria linked<br />
to the amount of realised annual sales and the quality of operations.<br />
In addition, <strong>Kesko's</strong> long-term receivable from a real estate associate<br />
totals €1.0 million.<br />
Note 47<br />
Other notes<br />
Events after the balance sheet date<br />
The deal between Kesko Corporation and OKO Bank plc to sell K-Rahoitus<br />
Oy's share capital to OKO Bank was concluded on 31 January 2008.<br />
The preliminary price paid in connection with the conclusion of the deal<br />
was about 30 million euros. The final price will be established based on<br />
the amount of equity at the transaction closing date and a fixed amount<br />
of goodwill.
128 <strong>Kesko's</strong> <strong>year</strong> <strong>2007</strong><br />
Note 48<br />
Financial statement indicators<br />
Continuing operations<br />
Income statement<br />
Net sales € million 7,509 7,922 8,749 9,534<br />
Change in net sales % 6.2 5.5 10.4 9.0<br />
Staff cost € million 386 477 544 576<br />
Staff cost of net sales % 5.1 6.0 6.2 6.0<br />
Depreciation and impairment charges € million 132 149 160 119<br />
Operating profit € million 251 245 363 332<br />
Operating profit of net sales % 3.3 3.1 4.2 3.5<br />
Operating profit excl. non-recurring items € million 201 216 280 325<br />
Operating profit excl. non-recurring items of net sales % 2.7 2.7 3.2 3.4<br />
Financial income and expenses € million -11 -1 -6 37<br />
Income from associates € million 2 2 1 0<br />
Profit before taxes € million 241 236 358 369<br />
Profit before taxes % 3.2 3.0 4.1 3.9<br />
Income tax € million 56 50 107 90<br />
Discontinued operations € million 3 128 28<br />
Investments € million 367.3 250.5 233.9<br />
Investments of net sales % 4.6 2.9 2.5<br />
Personnel, average number for the period 19,650 19,651 21,176<br />
Personnel at 31 Dec., incl. part-time employees 21,952 23,755 25,890<br />
Earnings/share, diluted 1.83 2.45 2.61<br />
Earnings/share, basic 1.86 2.47 2.63<br />
2004<br />
IFRS<br />
2005<br />
IFRS<br />
2006<br />
IFRS<br />
<strong>2007</strong><br />
IFRS
Year <strong>2007</strong><br />
Consolidated operations<br />
Divisions The Group<br />
Financial<br />
statements<br />
Further information<br />
Profit for the period (incl. minority interest) € million 185 189 379 307<br />
Profit for the period of net sales % 2.3 2.3 4.2 3.2<br />
Attributable to equity holders of the parent company 176 181 369 285<br />
Attributable to minority interest € million 9 8 10 22<br />
Profitability<br />
Return on equity % 12.8 13.0 23.1 16.4<br />
Return on invested capital % 14.3 12.5 22.6 17.4<br />
Finance and financial position<br />
Gearing % 37.0 42.4 11.9 14.0<br />
Equity ratio % 44.2 42.3 47.0 48.5<br />
Other indicators<br />
Investments € million 192 454 282 234<br />
Investments of net sales % 2.6 5.4 3.1 2.5<br />
Personnel, average number for the period 17,275 21,305 23,756 21,176<br />
Personnel at 31 Dec., incl. part-time employees 22,146 26,608 23,755 25,890<br />
Share indicators<br />
Consolidated indicators<br />
Earnings/share, diluted € 1.89 1.87 3.76 2.90<br />
Earnings/share, basic € 1.92 1.89 3.80 2.92<br />
Equity/share, adjusted € 14.73 15.35 17.94 19.53<br />
Dividend/share € 1.00 1.10 1.50 1.60*<br />
Payout ratio % 52.9 58.8 39.9 55.2*<br />
Cash flow from operating activities/share, adjusted € 2.29 3.07 3.35 2.52<br />
Price/earnings ratio (P/E), A share, adjusted 10.12 11.86 10.22 13.07<br />
Price/earnings ratio (P/E), B share, adjusted 9.50 11.74 10.64 13.02<br />
Effective dividend yield, A share % 5.3 4.6 3.9 4.2*<br />
Effective dividend yield, B share % 5.6 4.6 3.8 4.2*<br />
Share price at 31 Dec. €<br />
A share 18.90 24.19 38.43 37.85<br />
B share 17.95 23.95 40.02 37.72<br />
Average share price €<br />
A share 19.12 21.93 30.10 43.85<br />
B share 16.49 21.04 31.34 43.36<br />
Market capitalisation, A share € million 600 768 1,220 1,201<br />
Market capitalisation, B share € million 1,115 1,551 2,632 2,491<br />
Turnover million pcs<br />
A share 1 1 2 4<br />
B share 83 66 77 122<br />
Turnover rate %<br />
A share 3.8 4.1 6.4 11.5<br />
B share 133.6 101.5 117.1 185.3<br />
Adjusted number of shares at 31 Dec. million pcs 93 97 98 98<br />
Yield of A share<br />
Yield of B share<br />
% 14.3 16.7 21.4 30.3<br />
For the last five financial periods % 14.7 25.9 38.9 59.9<br />
For the last ten financial periods<br />
* proposal to the Annual General Meeting<br />
% 13.0 16.3 19.0 23.3<br />
2004<br />
IFRS<br />
2005<br />
IFRS<br />
2006<br />
IFRS<br />
129<br />
<strong>2007</strong><br />
IFRS
130 <strong>Kesko's</strong> <strong>year</strong> <strong>2007</strong><br />
Calculation of financial indicators<br />
Profitability<br />
Return on equity, % (ROE) =<br />
profit before tax – income tax<br />
shareholders' equity + minority interest (average for the <strong>year</strong>)<br />
Return on invested capital, % (ROI) = profit before tax + interest and other financial expenses<br />
balance sheet total – non-interest-bearing liabilities (average for the <strong>year</strong>)<br />
Return on net assets, % (RONA) =<br />
Finance and financial position<br />
Equity ratio, % =<br />
Debt to equity ratio, % =<br />
Gearing =<br />
Share performance indicators<br />
Earnings/share, diluted =<br />
Earnings/share =<br />
Equity/share =<br />
Payout ratio, % =<br />
Price/earnings ratio, (P/E) =<br />
Effective dividend yield, % =<br />
operating profit<br />
net assets (= balance sheet total – cash and cash equivalents – noninterest-bearing<br />
liabilities – provisions) average<br />
shareholders' equity + minority interest<br />
balance sheet total – advances received<br />
debt + provisions<br />
balance sheet total – advances received<br />
x 100<br />
x 100<br />
x 100<br />
x 100<br />
x 100<br />
interest-bearing debt – marketable securities – cash on hand and<br />
balances with banks x 100<br />
shareholders' equity + minority interest<br />
profit before extraordinary items – income tax ± minority interest<br />
average number of shares adjusted for share issues and dilutive effect of<br />
options<br />
profit before extraordinary items – income tax ± minority interest<br />
average number of shares adjusted for share issues<br />
shareholders' equity<br />
adjusted number of shares<br />
dividend/share<br />
earnings/share<br />
share price at balance sheet date<br />
earnings/share<br />
dividend/share<br />
share price at balance sheet date<br />
Market capitalisation = share price at balance sheet date x number of shares<br />
Cash flow from operating activities/share =<br />
cash flow from operating activities<br />
average number of shares<br />
Yield of A share and B share = change in share price + annual dividend yield<br />
Others<br />
Cash flow from operating activities =<br />
operating profit + depreciation, amortisation and impairment ± change in<br />
net working capital ± financial income and expenses – income tax<br />
x 100<br />
x 100
Year <strong>2007</strong><br />
Note 49<br />
Divisions The Group<br />
Financial<br />
statements<br />
Further information<br />
Analysis of shareholdings by type at 31 Dec. <strong>2007</strong><br />
All shares Number of shares % of all shares<br />
Non-financial corporations and housing corporations 23,153,111 23.68<br />
Financial and insurance corporations 3,299,783 3.38<br />
General government 7,584,105 7.76<br />
Households 24,758,084 25.32<br />
Non-profit institutions serving households 5,537,050 5.66<br />
Rest of the world 265,394 0.27<br />
Nominee registered 33,170,238 33.93<br />
Total 97,767,765 100.00<br />
10 largest shareholdings by size at 31 Dec. <strong>2007</strong><br />
131<br />
Number of shares % of shares Number of votes % of votes<br />
1. The Kesko Pension Fund 3,438,885 3.52 34,388,850 8.97<br />
2. The K-Retailers' Association 3,221,539 3.30 31,847,740 8.31<br />
3. Vähittäiskaupan Takaus Oy 2,628,533 2.69 26,285,330 6.86<br />
4. Valluga-Sijoitus Oy 1,340,439 1.37 13,404,390 3.50<br />
5. Oy The English Tearoom Ab 1,008,400 1.03 1,008,400 0.26<br />
6. Varma Mutual Pension Insurance Company 930,158 0.95 930,158 0.24<br />
7. Foundation for Vocational Training in the Retail Trade 895,679 0.92 7,585,838 1.98<br />
8. The State Pension Fund 746,000 0.76 746,000 0.19<br />
9. Tapiola Mutual Insurance Company 559,500 0.57 559,500 0.15<br />
10. Ilmarinen Mutual Pension Insurance Company 543,392 0.56 3,333,392 0.87<br />
10 largest shareholders by number of votes at 31 Dec. <strong>2007</strong><br />
Number of shares % of shares Number of votes % of votes<br />
1. The Kesko Pension Fund 3,438,885 3.52 34,388,850 8.97<br />
2. The K-Retailers' Association 3,221,539 3.30 31,847,740 8.31<br />
3. Vähittäiskaupan Takaus Oy 2,628,533 2.69 26,285,330 6.86<br />
4. Valluga-Sijoitus Oy 1,340,439 1.37 13,404,390 3.50<br />
5. Foundation for Vocational Training in the Retail Trade 895,679 0.92 7,585,838 1.98<br />
6. Ruokacity Myyrmäki Oy 389,541 0.40 3,895,410 1.02<br />
7. Ilmarinen Mutual Pension Insurance Company 543,392 0.56 3,333,392 0.87<br />
8. The K-Food Retailers' Club 318,955 0.33 3,189,550 0.83<br />
9. Heimo Välinen Oy 274,009 0.28 2,740,090 0.71<br />
10. Mutual Insurance Company Pension-Fennia 362,400 0.37 2,402,358 0.63<br />
Shares held by the management<br />
At the end of December <strong>2007</strong>, the members of Kesko Corporation’s Board of Directors, the Managing Director and the corporations under their control<br />
held 197,030 Kesko Corporation A shares and 170,520 Kesko Corporation B shares, i.e. a total of 367,550 shares which represented 0.38% of the company's<br />
total share capital and 0.56% of its voting rights.
132 <strong>Kesko's</strong> <strong>year</strong> <strong>2007</strong><br />
Note 50<br />
Subsidiaries and associates at 31 Dec. <strong>2007</strong><br />
INTERESTS IN GROUP COMPANIES<br />
Owned by the parent Domicile<br />
Group's Parent's<br />
ownership ownership<br />
interest % interest %<br />
Anttila Oy Helsinki 100.00 100.00<br />
Fiesta Real Estate AS Tallinn, Estonia 100.00 100.00<br />
Hirvensalon LiikeKiinteistö Oy Turku 100.00 100.00<br />
Indoor Group Ltd Lahti 100.00 100.00<br />
Intersport Group Ltd Helsinki 100.00 100.00<br />
K-instituutti Oy Helsinki 90.00 90.00<br />
K-Plus Oy Helsinki 100.00 100.00<br />
K-rahoitus Oy Helsinki 100.00 100.00<br />
Kauko-Telko Ltd Espoo 100.00 100.00<br />
Kempeleen Ostokeskus Oy Kempele 67.27 67.27<br />
Kenkäkesko Ltd Helsinki 100.00 100.00<br />
Keru Kiinteistöt Oy Helsinki 100.00 100.00<br />
Kesko Real Estate Latvia Sia Riga, Latvia 100.00 100.00<br />
Keslog Ltd Helsinki 100.00 45.05<br />
Kestra Kiinteistöpalvelut Oy Helsinki 100.00 100.00<br />
Kiinteistö Oy Joutsentulli Oulu 100.00 100.00<br />
Kiinteistö Oy Kangasalan<br />
Palvelukeskus Kangasala 82.50 82.50<br />
Kiinteistö Oy Kemin Asemakatu 4 Kemi 66.50 66.50<br />
Kiinteistö Oy Keravan Viertolan<br />
Market Kerava 100.00 100.00<br />
Kiinteistö Oy Kouvolan<br />
Länsikeskus Espoo 100.00 100.00<br />
Kiinteistö Oy Lahden Lyhytkatu 1 Lahti 50.00 50.00<br />
Kiinteistö Oy Pallintalo Turku 100.00 100.00<br />
Kiinteistö Oy Pontsonkulma Helsinki 94.57 94.57<br />
Kiinteistö Oy Porin<br />
Hyväntuulentie 2 Pori 70.80 70.80<br />
Kiinteistö Oy Päivärannantie 18 Kuopio 100.00 100.00<br />
Kiinteistö Oy Riipilän<br />
Kauppakeskus Vantaa 100.00 100.00<br />
Kiinteistö Oy Soppeenmäen<br />
market Ylöjärvi 100.00 100.00<br />
Kiinteistö Oy Sunan Hallitalo Espoo 100.00 100.00<br />
Kiinteistö Oy Turun Noutotukku Turku 100.00 100.00<br />
Kiinteistö Oy Turvesuonkatu 10 Tampere 100.00 100.00<br />
Kiinteistö Oy Voisalmen Liiketalo Lappeenranta 100.00 100.00<br />
Kiinteistö Oy Välivainion<br />
Ostoskeskus Oulu 65.97 65.97<br />
Klintcenter Ab Mariehamn 100.00 100.00<br />
Kesko Agro Ltd Helsinki 100.00 100.00<br />
Malmintorin Pysäköintitalo Oy Helsinki 99.91 99.91<br />
Musta Pörssi Ltd Helsinki 100.00 100.00<br />
Pirkkalaistorin Liikekeskus Oy Nokia 51.66 51.66<br />
Plussa Oü Tallinn, Estonia 100.00 100.00<br />
Rautakesko Ltd Helsinki 100.00 100.00<br />
Roihuvuoren Liiketalot Oy Helsinki 74.00 74.00<br />
Kesko Food Ltd Helsinki 100.00 100.00<br />
Sincera Oy Helsinki 100.00 100.00<br />
Tähti Optikko Group Oy Helsinki 100.00 100.00<br />
Variston Liikekeskus Oy Vantaa 75.00 75.00<br />
VV-Auto Group Oy Helsinki 100.00 100.00<br />
Owned by other Group<br />
companies Domicile<br />
Group's Parent's<br />
ownership ownership<br />
interest % interest %<br />
Antti Sia Riga, Latvia 100.00<br />
Anttila As Viljandi, Estonia 100.00<br />
Ap Real Estate Sia Riga, Latvia 100.00<br />
Asko Möbler Ab Huddinge, Sweden 100.00<br />
Asm Sweden Ab Malmö, Sweden 100.00<br />
Auto-Span Oy Helsinki 100.00<br />
Baltic Tape Uab Klaipeda, Lithuania 100.00<br />
Barker-Littoinen Oy Espoo 100.00<br />
Bruland Bygg As Förde, Norway 66.30<br />
Byggmakker Distribution As Ski, Norway 100.00<br />
Byggmakker Norge As Oslo, Norway 99.92<br />
Byggsenteret As Steinkjer, Norway 100.00<br />
Cassa Oy Helsinki 100.00<br />
Citymarket Oy Helsinki 100.00<br />
Daugavkrasts M Sia Riga, Latvia 100.00<br />
Focus Eesti As Tallinn, Estonia 80.00<br />
Glastech ZP<br />
Härkätien Maatalous- ja<br />
Minsk, Belarus 100.00<br />
Rautakauppa Oy Helsinki 100.00<br />
Ikosen Oü Tallinn, Estonia 100.00<br />
Indoor Group As Tallinn, Estonia 100.00<br />
Indoor Group Sia Riga, Latvia 100.00<br />
Indoor Group Uab Vilna, Lithuania 100.00<br />
Indoorpalvelu Oy Lahti 100.00<br />
Insofa Oy Lahti 100.00<br />
Ka Jelgava Sia Jelgava, Latvia 100.00<br />
Kauko Time Ab Stockholm, Sweden 100.00<br />
Kauko Zao Moscow, Russia 100.00<br />
Kesko Agro Eesti As Tallinn, Estonia 100.00<br />
Kesko Agro Lietuva Uab Vilna, Lithuania 100.00<br />
Kesko Agro Latvija Sia Riga, Latvia 100.00<br />
Keslog As Tallinn, Estonia 100.00<br />
Kespro Ltd Helsinki 100.00<br />
Kestroy 1 Zao Moscow, Russia 100.00<br />
K-Finance Estonia As Viro 100.00<br />
Kiinteistö Oy Ahtialan Liiketalo Lahti 100.00<br />
Kiinteistö Oy Arolan Risteys Elimäki 100.00<br />
Kiinteistö Oy Hannunhelmi<br />
Kiinteistö Oy Imatran<br />
Kirkkonummi 100.00<br />
Lappeentie 44 Imatra 100.00
Year <strong>2007</strong><br />
Owned by other Group<br />
companies Domicile<br />
Divisions The Group<br />
Financial<br />
statements<br />
Further information<br />
Group's Parent's<br />
ownership ownership<br />
interest % interest %<br />
Kiinteistö Oy Kemin Asematie 4 Kemi 66.50<br />
Kiinteistö Oy Kotkan<br />
Kauppahuone Kotka 100.00<br />
Kiinteistö Oy Kuninkojan Ranta 100.00<br />
Kiinteistö Oy Länsi-Kaisla Espoo 100.00<br />
Kiinteistö Mesta Oy Helsinki 100.00<br />
Kiinteistö Oy Muhoksen Puoti Helsinki 100.00<br />
Kiinteistö Oy Paavolantori Lahti 96.90<br />
Kiinteistö Oy Sarviniitynkatu 4 Kerava 100.00<br />
Kiinteistö Oy Tampuri 100.00<br />
Kiinteistö Oy Vantaan<br />
Kiitoradantie 2 Vantaa 100.00<br />
Knuto As Norway 100.00<br />
Konekesko Ltd Helsinki 100.00<br />
K Prof Sia Riga, Latvia 100.00<br />
K Rauta Sia Riga, Latvia 100.00<br />
K-rauta AB Stockholm, Sweden 100.00<br />
Kesko Fastigheter Ab Sollentuna, Sweden 100.00<br />
Kr Fastigheter i Eskilstuna Sollentuna, Sweden 100.00<br />
Kr Fastigheter I Järfalla Ab Sollentuna, Sweden 100.00<br />
Kr Fastigheter i Karlstad Ab Sollentuna, Sweden 100.00<br />
Kr Fastigheter i Umeå Ab Sollentuna, Sweden 100.00<br />
Kr Fastigheter i Täby Ab Sollentuna, Sweden 100.00<br />
Kr Fastigheter i Sundsvall Ab Sollentuna, Sweden 100.00<br />
K-rauta Fastigheter I Malmö Ab Sollentuna, Sweden 100.00<br />
Leipurien Tukku Oy Espoo 100.00<br />
Leipurien Tukku Eesti As Tallinn, Estonia 100.00<br />
Leitok Oy Espoo 100.00<br />
Limingan Portti 100.00<br />
Loimaan Maatalous- ja<br />
Rautakauppa Oy Helsinki 100.00<br />
OOO Leipurien Tukku St. Petersburg,<br />
Russia 100.00<br />
OOO Kesko Real Estate St. Petersburg,<br />
Russia 100.00<br />
Master Oil Ab Göteborg, Sweden 100.00<br />
Metex Deutschland Gmbh Lucka, Germany 100.00<br />
Mezciems Real Estate Sia Riga, Latvia 100.00<br />
Molub-Alloy Ab Göteborg, Sweden 100.00<br />
Nmt Prekyba Uab Kaunas, Lithuania 100.00<br />
Nordica Plast & Gummi Ab Malmö, Sweden 100.00<br />
Norgros Handel As Lilleström, Norway 100.00<br />
Optiimi Oy Tampere 100.00<br />
Optikem Oy Helsinki 100.00<br />
Polo Ls Sia Riga, Latvia 100.00<br />
Pikoil Oy Helsinki 100.00<br />
Rake Bergen As Oslo, Norway 100.00<br />
Rake Eiendom As Oslo, Norway 100.00<br />
Rautakesko AS Tallinn, Estonia 100.00<br />
Rautakesko A/S Riga, Latvia 100.00<br />
Ruokakeskon Kiinteistöt Oy Helsinki 100.00<br />
Senukai Uab Kaunas, Lithuania 99.20<br />
Senuku Prekybos Centras Vilna, Lithuania 50.00<br />
Senuku Tirdzniecibas Centras Sia Riga, Latvia 100.00<br />
133<br />
Group's Parent's<br />
Owned by other Group<br />
ownership ownership<br />
companies Domicile<br />
interest % interest %<br />
Sotka Eesti Oü Tallinn, Estonia 100.00<br />
Stroymaster Holding Finland Oy Helsinki 100.00<br />
Stroymaster Zao St.Petersburg, Russia 100.00<br />
Tampereen Silmälaboratorio Oy Tampere 66.67<br />
Telko Denmark A/S Copenhagen,<br />
Denmark 100.00<br />
Telko Hong Kong LTD Hong Kong, China 100.00<br />
Telko Shanghai LTD Shanghai, China 100.00<br />
OOO Telko Rus St.Petersburg, Russia 100.00<br />
SIA Telko Latvia Riga, Latvia 100.00<br />
Telko Poland Warsaw, Poland 100.00<br />
Tp Real Estate Sia Riga, Latvia 100.00<br />
Trögstadveien 13 As Ski, Norway 100.00<br />
Turun VV-Auto Oy Turku 100.00<br />
Ulkokaupat Eesti As Tallinn, Estonia 100.00<br />
Ulkokaupat Vilnius Uab Vilna, Lithuania 100.00<br />
Verdal Eiendom As Ski, Norway 100.00<br />
VV-Autotalot Oy Helsinki 100.00<br />
Associates<br />
owned by the parent Domicile<br />
Group's Parent's<br />
ownership ownership<br />
interest % interest %<br />
Graanin Liikekeskus Oy Mikkeli 50.00 50.00<br />
Itäkeskuksen Pysäköintitalo Oy Helsinki 44.49 44.49<br />
Kiinteistö Oy Janakkalan<br />
Linnatuuli Janakkala 29.86 29.86<br />
Kiinteistö Oy Itäaukio Lahti 26.20 26.20<br />
Kiinteistö Oy Joensuun<br />
Kaupunginportti Joensuu 22.77 22.77<br />
Kiinteistö Oy Lentokentän<br />
Palvelutalo Vantaa 32.59 32.59<br />
Kiinteistö Oy Mellunmäen<br />
Liike- Ja Toimintakeskus Helsinki 23.42 23.42<br />
Kiinteistö Oy Rauman<br />
Viaporinaukio 3:n Vsuoja Rauma 43.80 43.80<br />
Kiinteistö Oy Ulvilan Hansa Ulvila 42.41 42.41<br />
Kiinteistö Oy Vantaanportin<br />
Liikekeskus Vantaa 27.87 27.87<br />
Levin Aquahovi Kiinteistöt Oy Kittilä 25.00 25.00<br />
Mukkulan Ostoskeskus Oy Lahti 35.76 35.76<br />
Raksilan Paikoitus Oy Oulu 33.33 33.33<br />
Valluga-sijoitus Oy Helsinki 39.00 39.00<br />
Vähittäiskaupan Takaus Oy Helsinki 34.35 34.35<br />
Vähittäiskaupan Tilipalvelu<br />
VTP Oy Helsinki 30.00 30.00<br />
Owned by other Group<br />
companies<br />
Helsingin Reunahiomo Hrh Oy Helsinki 50.00<br />
Kajaanin Pienteollisuustalo Oy Kajaani 34.00<br />
Kiinteistö Oy Meri-Pietari Helsinki 23.12<br />
Kiinteistö Oy Lahden<br />
Teollisuuskeskus Lahti 48.32<br />
Nordic Optical Partners A/s Albertslund,<br />
Denmark 33.30<br />
Nordic Optical Alliance Ab Väsby, Sweden 25.00
134 <strong>Kesko's</strong> <strong>year</strong> <strong>2007</strong><br />
Parent's financial statements <strong>2007</strong><br />
Parent's income statement (FAS) 1.1.-31.12.<strong>2007</strong> 1.1.-31.12.2006<br />
Net sales 16,761,333.00 16,407,204.37<br />
Other operating income 249,816,297.07 487,660,165.50<br />
Materials and services -274.98 2,604.22<br />
Personnel expenses -13,651,741.54 -11,863,486.34<br />
Depreciation and value adjustments -24,045,119.06 -28,537,648.47<br />
Other operating expenses -172,452,664.52 -232,033,609.10<br />
Operating profit 56,427,829.97 231,635,230.18<br />
Financial income and expenses 47,808,921.74 10,565,408.15<br />
Profit before extraordinary items 104,236,751.71 242,200,638.33<br />
Extraordinary items 138,632,000.00 129,673,784.00<br />
Profit before appropriations and taxes 242,868,751.71 371,874,422.33<br />
Appropriations 5,797,754.74 21,708,520.51<br />
Profit before taxes 248,666,506.45 393,582,942.84<br />
Income tax -54,392,730.23 -86,558,154.41<br />
Net profit 194,273,776.22 307,024,788.43
Year <strong>2007</strong><br />
Divisions The Group<br />
Financial<br />
statements<br />
Further information<br />
Parent's balance sheet<br />
(FAS) 31.12.<strong>2007</strong> 31.12.2006<br />
ASSETS<br />
NON-CURRENT ASSETS<br />
Intangible assets<br />
Other capitalised expenditure<br />
Advance payments and construc-<br />
7,714,791.78 10,391,131.28<br />
tion in progress 2,451,132.91 2,158,578.08<br />
Tangible assets<br />
10,165,924.69 12,549,709.36<br />
Land and water 112,152,662.59 114,513,468.94<br />
Buildings 331,402,014.49 337,721,596.03<br />
Machinery and equipment 5,972,140.83 6,776,859.81<br />
Other tangible assets<br />
Advance payments and construc-<br />
7,205,486.53 7,114,024.62<br />
tion in progress 5,410,734.59 5,190,383.18<br />
Investments<br />
462,143,039.03 471,316,332.58<br />
Holdings in Group companies 402,270,848.48 387,830,032.45<br />
Holdings in participating interests<br />
Other shares and similar rights of<br />
19,761,572.65 19,991,322.33<br />
ownership 7,284,058.60 16,252,345.69<br />
Current assets<br />
Receivables<br />
Long-term<br />
Receivables from Group<br />
429,316,479.73 424,073,700.47<br />
companies<br />
Receivables from participating<br />
384,426,543.03 354,337,563.67<br />
interests 891,396.01 891,396.01<br />
Short-term<br />
385,317,939.04 355,228,959.68<br />
Trade receivables<br />
Receivables from Group<br />
1,752,057.86 2,147,110.34<br />
companies<br />
Receivables from participating<br />
589,954,855.91 506,759,172.25<br />
interests 4,175,243.23 5,223,736.22<br />
Loan receivables - -<br />
Other receivables 220,795.53 228,676.87<br />
Prepayments and accrued income 30,012,572.21 4,404,912.45<br />
Marketable securities<br />
626,115,524.74 518,763,608.13<br />
Other marketable securities 261,072,406.31 341,094,016.95<br />
Cash on hand and at bank 25,554,085.64 3,720,533.88<br />
Total assets 2,199,685,399.18 2,126,746,861.05<br />
LIABILITIES<br />
Shareholders' equity<br />
135<br />
31.12.<strong>2007</strong> 31.12.2006<br />
Share capital 195,535,530.00 195,039,850.00<br />
Share issue 733.95 -<br />
Share premium account 190,079,543.91 187,934,757.64<br />
Revaluation reserve - -<br />
Other reserves 243,415,795.55 243,415,795.55<br />
Retained earnings 493,562,881.11 332,837,613.94<br />
Profit for the financial <strong>year</strong> 194,273,776.22 307,024,788.43<br />
Appropriations<br />
1,316,868,260.74 1,266,252,805.56<br />
Depreciation reserve 157,685,287.15 163,483,041.89<br />
Provisions<br />
Other provisions 7,210,259.65 8,344,307.01<br />
Liabilities<br />
Non-current<br />
Private placement bonds<br />
Loans from financial<br />
100,418,410.04 100,418,410.04<br />
institutions 25,131,942.70 24,277,737.31<br />
Current<br />
125,550,352.74 124,696,147.35<br />
Loans from financial institutions - 9,262,482.96<br />
Advances received 2,570.85 37,620.93<br />
Trade payables 5,340,301.42 3,089,163.71<br />
Debt to Group companies 437,093,346.44 454,373,029.20<br />
Debt to participating interests 23,966,613.67 36,434,382.97<br />
Other debt 113,939,237.49 40,089,385.17<br />
Accruals and deferred income 12,029,169.03 20,684,494.30<br />
592,371,238.90 563,970,559.24<br />
Total liabilities 2,199,685,399.18 2,126,746,861.05
136 <strong>Kesko's</strong> <strong>year</strong> <strong>2007</strong><br />
Parent's cash flow statement 1.1.-31.12.<strong>2007</strong> 1.1.-31.12.2006<br />
Cash flow from operating activities<br />
Profit before extraordinary items<br />
Adjustments:<br />
104,236,751.71 242,200,638.33<br />
Depreciation according to plan 22,521,937.84 28,535,592.36<br />
Financial income and expenses -47,808,921.74 -10,565,408.15<br />
Other adjustments -35,269,899.81 -212,876,837.42<br />
Change in working capital<br />
43,679,868.00 47,293,985.12<br />
Interest-free short-term trade receivables, increase/decrease (-/+) 1,038,689.43 7,400,219.61<br />
Interest-free short-term debt, increase/decrease (+/-) 2,570,437.40 5,122,390.29<br />
3,609,126.83 12,522,609.90<br />
Interests paid -32,455,510.98 -31,016,632.50<br />
Interests received 57,896,930.59 33,637,541.04<br />
Dividends received 23,407,952.75 6,787,979.43<br />
Taxes paid -75,024,522.45 -86,195,918.27<br />
-26,175,150.09 -76,787,030.30<br />
Cash flow from operating activities 21,113,844.74 -16,970,435.28<br />
Cash flow from investing activities<br />
Subsidiary acquired 0.00 -6,531,336.11<br />
Associated company acquired 0.00 -9,920.00<br />
Purchases of other investments -700,000.00 -13,141.67<br />
Investments in tangible and intangible assets -32,866,218.80 -22,414,792.11<br />
Increase in long-term receivables -50,088,979.36 -46,330,556.40<br />
Subsidiary disposed 35,273.57 12,479,707.53<br />
Associated company disposed 411,440.00 22,435,185.39<br />
Proceeds from other investments 46,582,184.00 5,471,442.91<br />
Proceeds from sale of tangible and intangible assets 19,903,490.88 145,576,472.97<br />
Cash flow from investing activities -16,722,809.71 110,663,062.51<br />
Cash flow from financing activities<br />
Increase in current liabilities 36,109,586.99 55,643,141.86<br />
Increase in non-current liabilities 854,205.39 0.00<br />
Decrease of non-current liabilities 0.00 -89,223,889.05<br />
Increase/decrease (-/+) of short-term interest-bearing receivables -95,648,887.51 -67,402,825.34<br />
Short-term money market investments 35,175,640.48 140,469,842.03<br />
Dividends paid -146,312,550.32 -106,484,593.60<br />
Group contributions received and paid 138,632,000.00 129,673,784.00<br />
Increase in shareholders' equity 2,641,200.22 6,377,964.03<br />
Others 1,145,351.32 -5,381,209.81<br />
Cash flow from financing activities -27,403,453.43 63,672,214.12<br />
Change in liquid funds -23,012,418.40 157,364,841.35<br />
Liquid funds at 1 January 204,132,864.26 46,768,022.91<br />
Liquid funds at 31 December 181,120,445.86 204,132,864.26
Year <strong>2007</strong><br />
Divisions The Group<br />
Financial<br />
statements<br />
Further information<br />
Notes to the parent's financial statements<br />
Principles used for preparing the parent's<br />
financial statements<br />
Kesko Corporation's financial statements have been prepared in compliance<br />
with the Finnish Accounting Standards (FAS).<br />
Valuation of fixed assets<br />
Fixed assets are stated in the balance sheet at cost less depreciation<br />
according to plan.<br />
Depreciation plan<br />
Depreciation according to plan is calculated on a straight line basis so as<br />
to write off the cost of fixed assets over their estimated useful lives.<br />
The periods adopted for depreciation are as follows:<br />
Buildings 15–33 <strong>year</strong>s<br />
Fixtures and fittings 8 <strong>year</strong>s<br />
Machinery and equipment 8 <strong>year</strong>s<br />
or machinery and equipment<br />
purchased since 1999 25% reducing balance method<br />
Transportation fleet 5 <strong>year</strong>s<br />
Information technology equipment 3–5 <strong>year</strong>s<br />
Other tangible assets<br />
and other capitalised expenditure 5–14 <strong>year</strong>s<br />
Land has not been depreciated.<br />
The total of depreciation according to plan and the change in depreciation<br />
reserve comply with the Finnish tax legislation. The change in<br />
depreciation reserve has been treated as appropriations in the parent<br />
company.<br />
Valuation of financial assets<br />
Marketable securities have been valued at lower of cost or net realisable<br />
value.<br />
Foreign currencies<br />
Items denominated in foreign currencies have been translated into Finnish<br />
currency at the average exchange rate of the European Central Bank<br />
on the balance sheet date. If a receivable or a debt is tied to a fixed rate of<br />
exchange, it has been used for translation.<br />
Profits and losses arising from foreign currency transactions have<br />
been dealt with in the income statement.<br />
Derivative financial instruments<br />
Interest rate derivative contracts<br />
Interest rate derivatives are used to modify loan durations. The target<br />
duration is three <strong>year</strong>s and it is allowed to vary between one and a half<br />
and four <strong>year</strong>s. Cash flows arising from interest rate derivative contracts<br />
are recognised during the financial <strong>year</strong> as interest income or expenses,<br />
according to the maturity date. In the financial statements, open forward<br />
agreements, futures, options and swaps are stated at market values.<br />
Unrealised revaluation is not stated as income. Any valuation losses are<br />
included in interest expenses.<br />
137<br />
Currency derivative contracts<br />
Currency derivative instruments are used for hedging against translation<br />
and transaction risks. Forward exchange contracts are valued at the<br />
exchange rate of the balance sheet date. The rate differences arising from<br />
open derivative contracts are reported in financial items. If a derivative<br />
instrument has been used to hedge a foreign-currency-denominated<br />
asset, the value change has been recognised against that of the asset<br />
item. The premiums of option contracts are included in the balance sheet<br />
accruals until they expire, or if a value change at the balance sheet date<br />
so requires, recognition in profit or loss.<br />
Commodity derivatives<br />
Kestra Kiinteistöpalvelut Oy, a Kesko Corporation subsidiary, uses electricity<br />
derivatives to balance the energy costs of the Group and its retailers.<br />
<strong>Kesko's</strong> subsidiaries engaged in the agricultural trade use grain<br />
derivatives to hedge against the grain price risk. Kesko Corporation is an<br />
external counterparty in electricity and grain derivative contracts made<br />
with the bank, and internally hedges the corresponding price with the<br />
subsidiary. At no stage does Kesko Corporation have derivative positions,<br />
and thus there are no effects on profit or loss. The electricity price risk is<br />
reviewed on a 3-<strong>year</strong> time span. With respect to derivative contracts<br />
hedging the price of electricity supplied during the financial <strong>year</strong>,<br />
changes in value are recognised in Kesko under interest income and<br />
expenses. The unrealised gains and losses of contracts hedging future<br />
purchases are not recognised through profit or loss. With respect to<br />
grain derivative contracts, the open contracts in the income statement<br />
are recognised at market prices. Valuation differences related to open<br />
contracts are recognised in Kesko under financial items.<br />
Pension plans<br />
The pension insurances of Kesko Corporation's personnel are arranged<br />
through the Kesko Pension Fund. The Fund's A department, which provides<br />
supplementary pension benefits, was closed on 9 May 1998. The<br />
job-based retirement age agreed for a number of directors and other<br />
superiors in the Group is 60 or 62 <strong>year</strong>s.<br />
Provisions<br />
Provisions stated in the balance sheet include items bound to by agreements<br />
or otherwise, but remain unrealised. Changes in provisions are<br />
included in the income statement. Rent liabilities for vacant rented<br />
premises no longer used for the Group business operations, as well as the<br />
losses resulting from renting the premises to outsiders, are included in<br />
provisions.<br />
Income tax<br />
Income tax includes the taxes for the period based on the profit for the<br />
period, and taxes payable for prior periods, or tax refunds. Deferred taxes<br />
are not included in the parent's income statement and balance sheet.
138 <strong>Kesko's</strong> <strong>year</strong> <strong>2007</strong><br />
Notes to the income statement<br />
€ million <strong>2007</strong> 2006<br />
1. Other operating income<br />
Profits on sales of real estate and shares 51.9 95.5<br />
Rent income 197.4 271.9<br />
Merger profit - 120.0<br />
Others 0.5 0.3<br />
Total 249.8 487.7<br />
2. Average number of personnel<br />
Kesko Corporation 174 179<br />
Total 174 179<br />
3. Personnel expenses<br />
Salaries and fees<br />
Social security expenses<br />
10.6 9.9<br />
Pension expenses 2.1 1.0<br />
Other social security expenses 1.0 1.0<br />
Total 13.7 11.9<br />
Salaries and fees to the management<br />
Managing Director and his deputy 0.7 0.6<br />
Board of Directors' members 0.3 0.3<br />
Total 1.0 0.9<br />
An analysis of the management's salaries and fees is included<br />
in the notes to the consolidated financial statements.<br />
4. Depreciation and value adjustments<br />
Depreciation according to plan 22.5 28.5<br />
Value adjustments, non-current assets 1.5 0.0<br />
Total 24.0 28.5<br />
5. Other operating expenses<br />
Rent expenses 117.1 194.2<br />
Marketing expenses 3.0 0.7<br />
Maintenance of real estate and store sites 17.1 15.6<br />
Data communications expenses 11.1 10.0<br />
Losses on sales of real estate and shares 0.1 3.3<br />
Merger losses 16.2 -<br />
Other operating expenses 8.0 8.2<br />
Total 172.5 232.0<br />
6. Financial income and expenses<br />
Dividend income<br />
From Group companies 23.4 2.6<br />
From participating interests - 1.5<br />
From others 0.0 2.7<br />
Dividend income, total<br />
Other interest and financial income<br />
23.4 6.8<br />
From Group companies 47.9 32.4<br />
From others 26.4 12.8<br />
Interest income, total 74.3 45.2<br />
€ million <strong>2007</strong> 2006<br />
Interest and other financial expenses<br />
To Group companies -21.4 -21.7<br />
To others -28.5 -19.7<br />
Interest expenses, total -49.9 -41.4<br />
Total 47.8 10.6<br />
7. Items included in extraordinary<br />
income and expenses<br />
Contributions from Group companies 171.3 161.0<br />
Contributions to Group companies -32.7 -31.3<br />
Total 138.6 129.7<br />
8. Appropriations<br />
Difference between depreciation<br />
according to plan<br />
and depreciation in taxation 5.8 21.7<br />
Total 5.8 21.7<br />
9. Changes in provisions<br />
Future rent expenses for vacant business<br />
premises -1.1 -0.8<br />
Other changes 0.0 0.2<br />
Total -1.1 -0.6<br />
10. Income taxes<br />
Income taxes on extraordinary items -36.0 -33.7<br />
Income taxes on operating activities -18.3 -52.8<br />
Total -54.4 -86.4<br />
Deferred taxes<br />
Deferred tax liabilities and assets have not been included in the balance<br />
sheet. The amounts are not significant.<br />
Notes to the balance sheet<br />
€ million <strong>2007</strong> 2006<br />
11. Other capitalised expenditure<br />
Acquisition cost at 1 January 39.7 41.8<br />
Increases 0.1 0.8<br />
Decreases -1.5 -3.1<br />
Transfers between groups 0.0 0.2<br />
Acquisition cost at 31 December 38.3 39.7<br />
Accumulated depreciation at 1 January<br />
Accumulated depreciation on decreases<br />
29.3 28.0<br />
and transfers -0.9 -1.8<br />
Depreciation for the financial <strong>year</strong> 2.2 3.1<br />
Accumulated depreciation at 31 December 30.6 29.3<br />
Book value at 31 December 7.7 10.4
Year <strong>2007</strong><br />
Divisions The Group<br />
Financial<br />
statements<br />
Further information<br />
€ million <strong>2007</strong> 2006<br />
Advance payments<br />
Acquisition cost at 1 January 2.2 0.4<br />
Increases 1.6 2.9<br />
Decreases -1.3 -1.0<br />
Transfers between groups 0.0 -0.2<br />
Acquisition cost at 31 December 2.5 2.2<br />
Book value at 31 December 2.5 2.2<br />
12. Tangible assets<br />
Land and water<br />
Acquisition cost at 1 January 114.5 121.5<br />
Increases 4.3 10.7<br />
Decreases -6.7 -17.7<br />
Transfers between groups 0.0 -<br />
Acquisition cost at 31 December 112.2 114.5<br />
Book value at 31 December 112.2 114.5<br />
Buildings<br />
Acquisition cost at 1 January 503.9 564.4<br />
Increases 19.1 24.5<br />
Decreases -13.6 -85.4<br />
Transfers between groups 3.9 0.4<br />
Acquisition cost at 31 December 513.2 503.9<br />
Accumulated depreciation at 1 January<br />
Accumulated depreciation on decreases<br />
166.2 176.1<br />
and transfers -1.7 -32.0<br />
Depreciation for the financial <strong>year</strong> 17.4 22.1<br />
Accumulated depreciation at 31 December 181.8 166.2<br />
Book value at 31 December 331.4 337.7<br />
Machinery and equipment<br />
Acquisition cost at 1 January 25.1 29.2<br />
Increases 1.0 1.1<br />
Decreases -0.8 -5.2<br />
Transfers between groups 0.2 0<br />
Acquisition cost at 31 December 25.5 25.1<br />
Accumulated depreciation at 1 January<br />
Accumulated depreciation on decreases<br />
18.4 18.6<br />
and transfers -0.6 -2.5<br />
Depreciation for the financial <strong>year</strong> 1.8 2.2<br />
Accumulated depreciation at 31 December 19.6 18.3<br />
Book value at 31 December 6.0 6.8<br />
Other tangible assets<br />
Acquisition cost at 1 January 12.5 14.9<br />
Increases 1.1 0.5<br />
Decreases -0.3 -2.9<br />
Transfers between groups 0.4 0<br />
Acquisition cost at 31 December 13.7 12.5<br />
139<br />
€ million <strong>2007</strong> 2006<br />
Accumulated depreciation at 1 January 5.4 5.4<br />
Accumulated depreciation on decreases<br />
and transfers 0.0 -1.0<br />
Depreciation for the financial <strong>year</strong> 1.1 1.0<br />
Accumulated depreciation at 31 December 6.5 5.4<br />
Book value at 31 December 7.2 7.1<br />
Advance payments and construction in<br />
progress<br />
Acquisition cost at 1 January 5.2 1.5<br />
Increases 4.7 4.1<br />
Decreases - -<br />
Transfers between groups -4.5 -0.4<br />
Acquisition cost at 31 December 5.4 5.2<br />
Book value at 31 December 5.4 5.2<br />
Revaluation of non-current assets<br />
At the end of the financial <strong>year</strong>, Kesko Corporation's balance sheet did<br />
not contain revaluations.<br />
13. Investments<br />
Holdings in Group companies<br />
Acquisition cost at 1 January 388.0 731.3<br />
Increases 109.7 8.0<br />
Decreases -93.7 -351.3<br />
Acquisition cost at 31 December 404.0 388.0<br />
Accumulated depreciation at 1 January 0.2 67.4<br />
Value adjustments 1.5 -67.2<br />
Accumulated depreciation at 31 December 1.7 0.2<br />
Book value at 31 December 402.3 387.8<br />
Holdings in participating interests<br />
Acquisition cost at 1 January 20.0 29.3<br />
Increases - 0.2<br />
Decreases -0.2 -9.5<br />
Acquisition cost at 31 December 19.8 20.0<br />
Book value at 31 December 19.8 20.0<br />
Other shares and similar rights<br />
of ownership<br />
Acquisition cost at 1 January 16.3 17.0<br />
Increases 0.7 1.0<br />
Decreases -9.7 -1.8<br />
Acquisition cost at 31 December 7.3 16.3<br />
Book value at 31 December 7.3 16.3<br />
Kesko Corporation's ownership interests in other companies as at 31<br />
December <strong>2007</strong> are presented in the notes to the consolidated financial<br />
statements.<br />
During the period, Keswell Ltd, a subsidiary wholly-owned by Kesko Corporation,<br />
was merged into Kesko Corporation. Among subsidiaries<br />
directly owned by Kesko Corporation, other changes took place in real<br />
estate companies only. A total of two real estate companies were sold outside<br />
the Group.
140 <strong>Kesko's</strong> <strong>year</strong> <strong>2007</strong><br />
€ million <strong>2007</strong> 2006<br />
14. Receivables<br />
Receivables from Group companies<br />
Long-term<br />
Loan receivables 374.4 343.6<br />
Subordinated loans 10.0 10.7<br />
Long-term receivables, total 384.4 354.3<br />
Short-term<br />
Trade receivables 1.4 4.1<br />
Loan receivables 586.0 501.3<br />
Other receivables - 0.0<br />
Prepayments and accrued income 2.6 1.4<br />
Short-term receivables, total 590.0 506.8<br />
Total 974.4 861.1<br />
Receivables from participating interests<br />
Long-term<br />
Loan receivables 0.9 0.9<br />
Short-term<br />
Trade receivables 0.0 0.1<br />
Loan receivables 4.1 5.1<br />
Short-term receivables, total 4.2 5.2<br />
Total 5.1 6.1<br />
Prepayments and accrued income<br />
Taxes 8.7 1.2<br />
Others 21.3 3.2<br />
Total 30.0 4.4<br />
15. Shareholders' equity<br />
Share capital at 1 January 195.0 193.0<br />
Subscriptions with options 0.5 2.0<br />
Share capital at 31 December 195.5 195.0<br />
Share issue, exercise of options at 1<br />
January - 0.7<br />
Increase 2.6 6.3<br />
Transfer to share capital -0.5 -2.0<br />
Transfer to share premium account<br />
Share issue, exercise of options at 31<br />
-2.1 -5.0<br />
December 0.0 0.0<br />
Share premium account at 1 January 187.9 182.9<br />
Subscriptions with options 2.1 5.0<br />
Share premium account at 31 December 190.1 187.9<br />
Revaluation reserve at 1 January - 0.3<br />
Change in revaluation reserve - -0.3<br />
Revaluation reserve at 31 December - -<br />
€ million <strong>2007</strong> 2006<br />
Other reserves at 1 January 243.4 243.4<br />
Other reserves at 31 December 243.4 243.4<br />
Retained earnings at 1 January 639.9 439.6<br />
Distribution of dividends -146.3 -106.5<br />
Transfer to donations -0.3 -0.3<br />
Expired dividends 1997–2001 0.3 -<br />
Retained earnings at 31 December 493.6 332.8<br />
Profit for the financial <strong>year</strong> 194.3 307.0<br />
Shareholders' equity, total 1,316.9 1,266.3<br />
Increase in share capital<br />
In <strong>2007</strong>, the share capital was increased six times as a result of share<br />
subscriptions pursuant to share options: by €46,376 in February, by<br />
€86,800 in April, by €298,572 in May, by €9,000 in July, by €39,032 in<br />
September, and by €15,900 in December. The corresponding numbers of<br />
shares subscribed for were 23,188; 43,400; 149,286; 4,500; 19,516 and<br />
7,950. The increases were entered in the Trade Register respectively on 12<br />
February, 26 April, 29 May, 24 July, 26 September and 19 December <strong>2007</strong>.<br />
Distributable reserves<br />
Other reserves 243.4 243.4<br />
Retained earnings 493.6 332.8<br />
Profit for the financial <strong>year</strong> 194.3 307.0<br />
Total 931.3 883.3<br />
Breakdown of parent company's share capital<br />
pcs<br />
counter<br />
value, € € million<br />
A shares 31,737,007 2 63.5<br />
B shares 66,030,758 2 132.1<br />
Total 97,767,765 195.5<br />
Voting rights given by shares:<br />
number<br />
of votes<br />
A share 10<br />
B share 1<br />
Year 2003 and <strong>2007</strong> stock option plans<br />
On 31 March 2003, the Annual General Meeting resolved to gratuitously<br />
issue a total of 1,800,000 share options to the management of the Kesko<br />
Group as well as to a wholly-owned subsidiary of Kesko Corporation. A<br />
deviation was made from the shareholders' pre-emptive right to subscription<br />
since the options form a part of the incentive and commitment programme<br />
for the management. Each option entitles the holder to subscribe<br />
for one new Kesko Corporation B share. The options are marked<br />
with symbols 2003D (KESBVEW103), 2003E (KESBVEW203) and 2003F<br />
(KESBVEW303) in units of 600,000 options each.<br />
The Annual General Meeting of 26 March <strong>2007</strong> decided to grant a<br />
total of 3,000,000 stock options for no consideration to the Kesko Group<br />
management and the management of the other Group companies, to the<br />
rest of the key Kesko personnel, and to Sincera Oy, a subsidiary wholly<br />
owned by Kesko Corporation. A deviation was made from the shareholders'<br />
pre-emptive right to subscription since the options form a part of the<br />
incentive and commitment programme for the management. Each stock<br />
option entitles its holder to subscribe for one new Kesko Corporation B<br />
share. The stock options shall be marked with symbols <strong>2007</strong>A, <strong>2007</strong>B<br />
and <strong>2007</strong>C in units of 1,000,000 options each.
Year <strong>2007</strong><br />
Divisions The Group<br />
Financial<br />
statements<br />
Further information<br />
Share of granted options of share capital and votes<br />
Presuming that shares are subscribed for with all of the 1,800,000 options<br />
issued under the <strong>year</strong> 2003 plan, and with all of the 3,000,000 options<br />
issued under the <strong>year</strong> <strong>2007</strong> plan, the shares subscribed for with options<br />
account for 4.72% of shares and 1.24% of all votes. The subscriptions made<br />
with stock options may raise the number of the company's shares to<br />
101,738,705, and the voting rights of all shares to 387,371,768 votes.<br />
The company has no other options, convertible bonds or bonds with<br />
warrants in issue.<br />
Authorisations of the Board of Directors<br />
<strong>Kesko's</strong> Annual General Meeting of 26 March <strong>2007</strong> authorised the Board<br />
to decide about the issuance of new B shares.<br />
B shares can be issued against payment to the company's existing<br />
shareholders in proportion to their existing shareholdings regardless of<br />
whether they consist of A or B shares, or, deviating from shareholders'<br />
pre-emptive rights in order for the issued shares to be used as consideration<br />
in possible company acquisitions, other company business arrangements,<br />
or to finance investments. The maximum number of new shares<br />
issued is 20,000,000.<br />
The Board of Directors was also authorised to decide about the subscription<br />
price of the shares, to issue shares against non-cash consideration,<br />
and to make decisions concerning any other matters relating to<br />
share issues.<br />
The authorisation is valid for two (2) <strong>year</strong>s after the decision by the<br />
Annual General Meeting.<br />
The Board of Directors has no other authorisation concerning an<br />
issue of rights, convertible bonds or options valid at the moment.<br />
€ million <strong>2007</strong> 2006<br />
16. Appropriations<br />
Depreciation reserve 157.7 163.5<br />
Total 157.7 163.5<br />
17. Provisions<br />
Future rent expenses for vacant business premises 7.1 8.2<br />
Other provisions 0.1 0.1<br />
Total 7.2 8.3<br />
18. Non-current liabilities<br />
Debt falling due later than within five <strong>year</strong>s<br />
Private placement bonds 100.4 100.4<br />
Loans from financial institutions 25.1 24.3<br />
Total 125.6 124.7<br />
On 10 June 2004, Kesko Corporation issued a private placement of USD 120<br />
million in the US. The arrangement consists of three bullet loans: a 10-<strong>year</strong><br />
loan (USD 60 million), a 12-<strong>year</strong> loan (USD 36 million) and a 15-<strong>year</strong> loan<br />
(USD 24 million). Kesko has hedged the loan by using currency and interest<br />
rate swaps, as a result of which the loan capital totals €100.4 million and<br />
the fixed capital-weighted average interest rate is 5.4%.<br />
19. Current liabilities<br />
Debt to Group companies<br />
Advances received - 0.0<br />
Trade payables 2.0 1.7<br />
Other debt 433.6 451.2<br />
Accruals and deferred income 1.5 1.5<br />
Total 437.1 454.4<br />
Debt to participating interests<br />
141<br />
Trade payables 0.0 0.0<br />
Other debt 24.0 36.4<br />
Accruals and deferred income - 0.0<br />
Total 24.0 36.4<br />
Accruals and deferred income<br />
Personnel expenses 2.5 2.5<br />
Taxes - 13.5<br />
Others 9.6 4.7<br />
Total 12.0 20.7<br />
20. Interest-free debt<br />
Short-term liabilities 21.5 29.5<br />
Total 21.5 29.5<br />
Other notes<br />
€ million <strong>2007</strong> 2006<br />
21. Securities given and<br />
contingent liabilities<br />
Debt for the security of which mortgages<br />
have been given<br />
Other short-term debt 0.9 0.8<br />
Mortgages given<br />
Debt for the security of which shares<br />
have been given<br />
6.0 6.0<br />
Other short-term debt 2.0 1.7<br />
Pledged shares<br />
Other contingent liabilities<br />
Real estate mortgages<br />
13.6 13.6<br />
For own debt 1 1<br />
For Group companies<br />
Guarantees<br />
10 10<br />
For Group companies 101 184<br />
For shareholders 1 1<br />
For others<br />
Other contingent liabilities<br />
0 1<br />
For own debt<br />
Leasing liabilities<br />
11 37<br />
Falling due within a <strong>year</strong> 0 0<br />
Falling due later 1 1<br />
Liabilities arising from derivative instruments<br />
€ million <strong>2007</strong><br />
Value of underlying instruments at 31 Dec.<br />
Interest rate derivatives<br />
fair<br />
value 2006<br />
fair<br />
value<br />
Forward and future contracts 34 -0.1 26 -0.2<br />
Interest rate swaps 201 4.9 204 -1.8<br />
Currency derivatives<br />
Forward and future contracts 366 0.2 272 0.1<br />
Option agreements<br />
Bought - - - -<br />
Written - - - -<br />
Currency swaps 100 -18.9 100 -9.3<br />
Commodity derivatives<br />
Electricity derivatives 37 7.9 38 1.0<br />
Grain derivatives 5 -0.4 1 0.0
142 <strong>Kesko's</strong> <strong>year</strong> <strong>2007</strong><br />
Signatures<br />
Audit Report<br />
To the shareholders of Kesko Corporation<br />
We have audited the accounting records, the financial statements, the<br />
report of the Board of Directors and administration of Kesko Corporation<br />
for the period 1 January–31 December <strong>2007</strong>. The Board of Directors and<br />
the Managing Director have prepared the consolidated financial statements,<br />
prepared in accordance with International Financial Reporting<br />
Standards (IFRS) as adopted by the EU, as well as the report of the Board<br />
of Directors and the parent company's financial statements, prepared in<br />
accordance with prevailing regulations in Finland, containing the parent<br />
company's balance sheet, income statement, cash flow statement and<br />
notes to the financial statements. Based on our audit, we express an<br />
opinion on the consolidated financial statements, as well as on the parent<br />
company's financial statements, the report of the Board of Directors<br />
and the administration.<br />
We conducted the audit in accordance with good auditing practice,<br />
which requires that we perform an audit of the accounting records, the<br />
accounting policies and those for preparing the Board of Directors'<br />
Report, their contents and disclosure in order to obtain reasonable assurance<br />
that the financial statements and the Board of Directors' report are<br />
free of material misstatement. The audit of administration was conducted<br />
to verify that the operations of the members of the parent company's<br />
Board of Directors and the Managing Director are in compliance<br />
with the rules of the Limited Liability Companies' Act.<br />
Consolidated financial statements<br />
The consolidated financial statements, prepared in accordance with<br />
International Financial Reporting Standards (IFRS) as adopted by the<br />
EU, give a true and fair view, as defined in those standards and the Finnish<br />
Accounting Act, of the consolidated results of operations as well as of<br />
the financial position.<br />
Helsinki, 4 February 2008<br />
Heikki Takamäki Keijo Suila<br />
Pentti Kalliala Ilpo Kokkila Maarit Näkyvä<br />
Seppo Paatelainen Jukka Säilä Matti Halmesmäki<br />
Managing Director<br />
The Auditors' Note<br />
The above financial statements and the Report of the Board of Directors<br />
have been prepared in accordance with generally accepted accounting principles.<br />
Our auditors' report has been issued today.<br />
Helsinki, 7 February 2008<br />
PricewaterhouseCoopers Oy, Authorised Public Accountants<br />
Pekka Nikula, Authorised Public Accountant<br />
Parent company's financial statements, report of the Board of<br />
Directors and administration<br />
The parent company's financial statements have been prepared in accordance<br />
with the Finnish Accounting Act and other applicable rules and regulations,<br />
and give a true and fair view of the parent company's result of<br />
operations and of the financial position as defined in the Finnish<br />
Accounting Act.<br />
The report of the Board of Directors has been prepared in accordance<br />
with the Finnish Accounting Act and other applicable rules and regulations.<br />
The report of the Board of Directors is consistent with the financial<br />
statements and gives a true and fair view of the parent company's result<br />
of operations and of the financial position as defined in the Finnish<br />
Accounting Act.<br />
The consolidated financial statements and the parent company's<br />
financial statements can be adopted and the members of the parent company's<br />
Board of Directors and the Managing Director can be discharged<br />
from liability for the period audited by us. The proposal by the Board of<br />
Directors concerning the disposal of distributable funds is in compliance<br />
with the Limited Liability Companies' Act.<br />
Helsinki, 7 February 2008<br />
PricewaterhouseCoopers Oy<br />
Authorised Public Accountants<br />
Pekka Nikula<br />
Authorised Public Accountant
Year <strong>2007</strong><br />
Shares and shareholders<br />
Divisions The Group<br />
Financial objectives<br />
Kesko Corporation measures its long-term performance and balance<br />
sheet development with several financial indicators, the target levels of<br />
which are:<br />
Objective Target level Realised <strong>2007</strong><br />
Growth in net<br />
sales<br />
In Finland growth<br />
exceeding that of market<br />
Realised: Kesko Food, VV-Auto,<br />
Konekesko, Intersport Finland,<br />
Musta Pörssi<br />
Increasing proportion of<br />
Growth 2.2% points<br />
international operations<br />
(continuing operations)<br />
Return<br />
16%<br />
on equity 14%<br />
excl. non-recurring items 12.7%<br />
Return on<br />
17%<br />
invested capital<br />
Interest-bearing<br />
16%<br />
excl. non-recurring items 14.5%<br />
net debt/EBITDA < 3 0.6<br />
Equity ratio 40–45% 48%<br />
Economic value Internal indicator growing<br />
added<br />
positive EVA Realised<br />
Dividend policy<br />
Kesko Corporation distributes at least half of its earnings per share as<br />
dividends, taking however the company's financial position and operating<br />
strategy into account.<br />
Proposed dividends for the <strong>year</strong> <strong>2007</strong><br />
Kesko Corporation's Board of Directors proposes to the Annual General<br />
Meeting that €156,428,592.00 or €1.60 per share, be distributed as dividends<br />
from the net profit for the <strong>year</strong> <strong>2007</strong>, representing 55.2% of earnings<br />
per share. In 2002–2006, an average of 81.5% of earnings per share<br />
was distributed in dividends.<br />
Basic information on the shares at 31 December <strong>2007</strong><br />
A share<br />
• shortname: KESAV (OMX)<br />
• ISIN code: FI0009007900<br />
• voting rights per share: 10 votes<br />
• number of shares: 31,737,007<br />
• market value: €1,201 million<br />
B share<br />
• shortname: KESBV (OMX)<br />
• ISIN code: FI0009000202<br />
• voting rights per share: 1 vote<br />
• number of shares: 66,030,758<br />
• market value: €2,491 million<br />
Trading unit of both share series: 1 share<br />
Total share capital: €195,535,530<br />
Total number of shares: 97,767,765<br />
Voting rights carried by all shares: 383,400,828<br />
Market capitalisation: €3,692 million<br />
Share series and share capital<br />
Kesko Corporation's share capital is divided into A shares and B shares.<br />
On December 31 <strong>2007</strong>, the company's share capital was €195,535,530.<br />
The minimum number of A shares is one (1) and the maximum<br />
number two hundred and fifty million (250,000,000) and the minimum<br />
number of B shares is one (1) and the maximum number two hundred and<br />
fifty million (250,000,000), provided that the total number of shares is at<br />
minimum two (2) and at maximum four hundred million (400,000,000).<br />
Financial statements<br />
Further<br />
information<br />
143<br />
On 31 December <strong>2007</strong>, the total number of shares was 97,767,765,<br />
of which 31,737,007 (32.5%) were A shares and 66,030,758 (67.5%) were<br />
B shares.<br />
Each A share entitles the holder to 10 votes and each B share to 1 vote.<br />
Both shares give the same dividend rights. On 31 December <strong>2007</strong>, the<br />
number of votes entitled by A shares was 83% and the number of votes<br />
entitled by B shares was 17% of the total voting rights.<br />
The shares are included in the book-entry securities system held by<br />
the Finnish Central Securities Depository Ltd.<br />
The share-based right to receive funds distributed by the company<br />
and to receive shares or similar rights belongs to those who hold the<br />
shares on the date of fund distribution, share issue or a record date set in<br />
any other resolution.<br />
Authorisations of the Board of Directors and treasury shares<br />
The Kesko Annual General Meeting, held on 26 March <strong>2007</strong>, authorised<br />
the company's Board of Directors to decide about the issuance of new B<br />
shares. The new B shares can be issued against payment either to the company's<br />
shareholders in proportion to their existing shareholdings, regardless<br />
of whether they consist of A or B shares, or in a directed issue deviating<br />
from shareholders' pre-emptive rights in order for the issued shares to<br />
be used as consideration in possible company acquisitions, other company<br />
business arrangements, or financial investments. The company<br />
must have a weighty financial reason for deviating from pre-emptive<br />
rights. The maximum number of new shares issued shall be 20,000,000.<br />
The authorisation also includes an authorisation given by the Board<br />
of Directors to decide on the subscription price of the issued shares, the<br />
right to issue shares against non-cash consideration and the right to<br />
make decisions concerning any other matters relating to share issues.<br />
The authorisation shall be valid for two (2) <strong>year</strong>s after the decision in<br />
the General Meeting. The Board of Directors had no other valid authorisation<br />
to issue shares, to increase the share capital, or to acquire or<br />
assign treasury shares. Kesko Corporation or any of its subsidiaries held<br />
no Kesko Corporation shares.<br />
Shareholders<br />
According to the register of <strong>Kesko's</strong> shareholders kept by the Finnish<br />
Central Securities Depository Ltd, there were 28,925 shareholders at the<br />
end of <strong>2007</strong> (28,414 at the end of 2006). The total number of shares registered<br />
in a nominee name was 33,170,238, accounting for 33.93% of the<br />
share capital (32,535,936 and 33.36% respectively at the end of 2006). The<br />
number of votes entitled by these shares was 33,733,485, or 8.8% of the<br />
total voting rights (33,299,883 or 8.7% respectively at the end of 2006).<br />
The shares registered in a nominee name accounted for 50.14% of the B<br />
shares at the end of the <strong>year</strong>. A list of <strong>Kesko's</strong> largest shareholders,<br />
updated monthly, is available at www.kesko.fi/investors.<br />
Year 2003 stock option scheme<br />
On 31 March 2003, the Annual General Meeting resolved to gratuitously<br />
issue a total of 1,800,000 stock options to the management of the Kesko<br />
Group as well as to a wholly-owned subsidiary of Kesko Corporation. A<br />
deviation was made from the shareholders' pre-emptive right to subscription<br />
since the stock options form a part of the incentive and commitment<br />
programme for the management. The scheme comprises approximately<br />
60 persons.<br />
Each stock option entitles its owner to subscribe for one Kesko Corporation<br />
B share. The stock options have been marked with shortnames<br />
2003D (KESBVEW103,ISIN code FI0009609317), 2003E (KESBVEW203,
144 <strong>Kesko's</strong> <strong>year</strong> <strong>2007</strong><br />
ISIN code FI0009609325), and 2003F (KESBVEW303, ISIN code<br />
FI0009609333), in units of 600,000 stock options each.<br />
The share subscription periods are:<br />
• for stock option 2003D 1 April 2005–30 April 2008,<br />
• for stock option 2003E 1 April 2006–30 April 2009, and<br />
• for stock option 2003F 1 April <strong>2007</strong>–30 April 2010.<br />
The original share subscription price for stock option 2003D was the<br />
trade volume weighted average price of a Kesko Corporation B share on<br />
the Helsinki Stock Exchange between 1 to 30 April 2003 (€9.63), for stock<br />
option 2003E, the corresponding price between 1 to 30 April 2004<br />
(€15.19) and for stock option 2003F, the corresponding price between 1 to<br />
30 April 2005 (€19.08). From the prices of shares subscribed for with<br />
stock options shall be deducted the amount of the dividend per share distributed<br />
after the above period for the determination of the subscription<br />
price has ended but before the date of subscription for shares.<br />
At the end of <strong>2007</strong>, the subscription price of a B share subscribed for<br />
with stock option 2003D was €3.03, with stock option 2003E €10.59 and<br />
with stock option 2003F €16.48. Dividend rights and other shareholder<br />
rights of the share subscribed for with options shall take effect when the<br />
share capital increase has been entered in the Trade Register.<br />
The 2003D stock options were listed on the Helsinki Stock Exchange<br />
on 1 April 2005, the 2003E stock options on 1 April 2006 and the 2003F<br />
stock options on 1 April <strong>2007</strong>.<br />
Year <strong>2007</strong> stock option scheme<br />
The Annual General Meeting of 26 March <strong>2007</strong> decided to grant a total of<br />
3,000,000 stock options for no consideration to the Kesko Group management<br />
and other key Kesko personnel, and to a subsidiary wholly<br />
owned by Kesko Corporation. The company had a weighty financial reason<br />
for granting stock options because they are intended to be part of<br />
<strong>Kesko's</strong> share-based incentive system.<br />
Each stock option entitles its holder to subscribe for one new Kesko<br />
Corporation B share. The stock options shall be marked with symbols<br />
<strong>2007</strong>A, <strong>2007</strong>B and <strong>2007</strong>C in units of 1,000,000 options each.<br />
The exercise periods of the options shall be:<br />
• for stock option <strong>2007</strong>A, from 1 April 2010 until 30 April 2012,<br />
• for stock option <strong>2007</strong>B, from 1 April 2011 until 30 April 2013 and<br />
• for stock option <strong>2007</strong>C, from 1 April 2012 until 30 April 2014.<br />
The original subscription price for stock option <strong>2007</strong>A shall be the<br />
trade volume weighted average quotation of a Kesko Corporation B share<br />
on the Helsinki Stock Exchange between 1 April and 30 April <strong>2007</strong><br />
(€45.82), for stock option <strong>2007</strong>B between 1 April and 30 April 2008, and<br />
for stock option <strong>2007</strong>C between 1 April and 30 April 2009. The subscription<br />
prices of shares subscribed for with stock options shall be reduced<br />
by the amount decided after the beginning of the period for the determination<br />
of the subscription price but before the subscription as at the<br />
record date for each dividend distribution or other distribution of funds.<br />
Presuming that shares are subscribed for with all of the 1,800,000<br />
stock options granted under the <strong>year</strong> 2003 plan and all of the 3,000,000<br />
stock options granted under the <strong>year</strong> <strong>2007</strong> plan, the shares subscribed<br />
for with stock options account for 4.72% of shares and 1.24% of all votes.<br />
The subscriptions made with stock options may raise the number of the<br />
company's shares to 101,738,705, and the voting rights of all shares to<br />
387,371,768 votes.<br />
Share subscriptions made with stock options<br />
In <strong>2007</strong>, the share capital was raised six times corresponding to share subscriptions<br />
made with stock options: in February (12 Feb.) by €46,376 (23,188<br />
shares), in April (26 April) by €86,800 (43,400 shares), in May (29 May) by<br />
€298,572 (149,286 shares), in July (24 July) by €9,000 (4,500 shares), in September<br />
(26 Sept.) by €39,032 (19,516 shares), and in December (19 Dec.) by<br />
€15,900 (7,950 shares), or by €495,680 (247,840 shares) in aggregate.<br />
By 4 December <strong>2007</strong>, 540,938 B shares had been subscribed for with<br />
the 2003D options, 169,867 B shares with the 2003E options and 118,255<br />
B shares with the 2003F options, or 829,060 B shares in aggregate. The<br />
subscribed shares have been included in the main list of the Helsinki<br />
Stock Exchange for public trading.<br />
Other special shareholding rights<br />
The company has not issued other stock options, convertible bonds,<br />
bonds with warrants or other special rights to company shares.<br />
Shares and stock options held by the management<br />
At the end of <strong>2007</strong>, the members of Kesko Corporation's Board of Directors,<br />
the Managing Director and the corporations under their control<br />
held 197,030 Kesko A shares (197,030 A shares at the end of 2006) and<br />
170,520 Kesko B shares (170,520), i.e. a total of 367,550 shares (367,550),<br />
which represented 0.38% (0.38%) of the company's total share capital and<br />
0.56% (0.56%) of its voting rights.<br />
At the end of <strong>2007</strong>, the company's Managing Director held a total of<br />
50,000 Kesko stock options (73,000 at the end of 2006), which represented<br />
0.05% (0.07%) of the company's total share capital and 0.01%<br />
(0.02%) of voting rights, presuming that shares have been subscribed for<br />
with all of these options. No Board members held stock options at the<br />
end of <strong>2007</strong> (nor at the end of 2006).<br />
Detailed information on shares and stock options held by the management<br />
at the beginning and at the end of <strong>2007</strong> is given on pages 68–69.<br />
Trading in <strong>Kesko's</strong> shares and stock options in <strong>2007</strong><br />
Kesko Corporation's shares are listed on the OMX Helsinki Stock<br />
Exchange. Key information about share trading in <strong>2007</strong> is given in the<br />
tables and graphs on this double page spread. The price trends of both<br />
shares were fluctuated exceptionally; after a strong increase during the<br />
first months of the <strong>year</strong>, the prices took a downward trend in the summer<br />
and fell below the market average towards the end of the <strong>year</strong>. As a result,<br />
the overall price trends of both shares were slightly decreasing for the<br />
whole <strong>year</strong>. Share trading was lively; the number of B shares traded<br />
increased by about 60% and their total value by nearly 120%. At the end<br />
of the <strong>year</strong>, the market value of A shares was €1,201 million and that of B<br />
shares €2,491 million. The total market capitalisation of the company<br />
was €3,692 million, a decrease of €159 million during the <strong>year</strong>.<br />
Flagging notifications<br />
On 3 October <strong>2007</strong> Kesko Corporation was notified by Barclays Plc that<br />
the aggregate ownership interest of Barclays Plc's fund management companies<br />
in Kesko Corporation shares had exceeded 5% on 4 April <strong>2007</strong>.<br />
On 13 December <strong>2007</strong> Kesko Corporation was notified by Barclays Plc<br />
and Barclays Global Investor UK Limited that the ownership interest of<br />
Barclays Plc's in Kesko Corporation shares had dropped below 5% on 11<br />
December <strong>2007</strong>, but that the ownership interest of Barclays Global Investor<br />
UK Limited in Kesko Corporation shares had exceeded 5%.<br />
The company has not been informed of any agreements relating to its<br />
share ownership or the exercising of its voting rights.
Year <strong>2007</strong><br />
Key indicators<br />
Share prices per earnings, P/E ratio,<br />
at 31 Dec., diluted<br />
25<br />
20<br />
15<br />
10<br />
5<br />
0<br />
< FAS IFRS ><br />
2003 2004 2004 2005 2006 <strong>2007</strong><br />
Kesko A and Kesko B share<br />
price trends, €<br />
60.00<br />
50.00<br />
40.00<br />
30.00<br />
20.00<br />
10.00<br />
0.00<br />
1/2003 1/2004 1/2005 1/2006 12/<strong>2007</strong><br />
Divisions The Group<br />
Number of shareholders, at 31 Dec.<br />
30,000<br />
25,000<br />
20,000<br />
15,000<br />
10,000<br />
5,000<br />
0<br />
Equity per share, €, 31 Dec., diluted<br />
25<br />
20<br />
15<br />
10<br />
5<br />
0<br />
2003 2004 2005 2006 <strong>2007</strong><br />
< FAS IFRS ><br />
2003 2004 2004 2005 2006 <strong>2007</strong><br />
Financial statements<br />
A share B share A share<br />
B share<br />
A share<br />
B share<br />
OMX Helsinki CAP<br />
OMX Helsinki<br />
Trading volumes of<br />
Kesko A and Kesko B shares<br />
Further<br />
information<br />
Earnings per share and dividend<br />
per share, €<br />
Earnings per share, diluted<br />
Dividend per share<br />
* proposal to the Annual General Meeting<br />
Market values of Kesko shares<br />
6,000<br />
5,000<br />
4,000<br />
3,000<br />
2,000<br />
1,000<br />
Share trading by month, pcs Average share price, €<br />
20,000,000<br />
60<br />
16,000,000<br />
12,000,000<br />
8,000,000<br />
4,000,000<br />
2,000,000<br />
0<br />
1/2003 1/2004 1/2005 1/2006 12/<strong>2007</strong><br />
A share<br />
B share<br />
Kesko € million<br />
0<br />
50<br />
40<br />
30<br />
20<br />
10<br />
0<br />
4.0<br />
3.5<br />
3.0<br />
2.5<br />
2.0<br />
1.5<br />
1.0<br />
0.5<br />
0<br />
< FAS IFRS ><br />
2003 2004 2004 2005 2006 <strong>2007</strong><br />
1/2003 1/2004 1/2005 1/2006 12/<strong>2007</strong><br />
145<br />
OMX € million<br />
300,000<br />
250,000<br />
200,000<br />
150,000<br />
100,000<br />
50,000<br />
OMX Helsinki CAP<br />
OMX Helsinki<br />
*<br />
0
146 <strong>Kesko's</strong> <strong>year</strong> <strong>2007</strong><br />
Latest changes in share capital<br />
Year Registration date Subscription terms Change New share capital<br />
2003 19 Dec. 2003 S 1 for 1 at €11.87 B stock option €140,200 €182,381,000<br />
S 1 for 1 at €10.11 C stock option<br />
2004 6 Feb. 2004 S 1 for 1 at €10.11 C stock option €48,600 €182,429,600<br />
2004 4 May 2004 S 1 for 1 at €9.87 B stock option €1,072,380 €183,501,980<br />
S 1 for 1 at €8.11 C stock option<br />
2004 4 Aug. 2004 S 1 for 1 at €9.87 B stock option €156,200 €183,658,180<br />
S 1 for 1 at €8.11 C stock option<br />
2004 31 Dec. 2004 S 1 for 1 at €9.87 B stock option €4,022,904 €187,681,084<br />
S 1 for 1 at €8.87 B stock option<br />
S 1 for 1 at €7.11 C stock option<br />
2005 15 Feb. 2005 S 1 for 1 at €8.87 B stock option €2,656,500 €190,337,584<br />
S 1 for 1 at €7.11 C stock option<br />
2005 4 May 2005 S 1 for 1 at €7.87 B stock option €912,390 €191,249,974<br />
S 1 for 1 at €6.11 C stock option<br />
S 1 for 1 at €5.63 D stock option<br />
2005 8 June 2005 S 1 for 1 at €7.87 B stock option €536,600 €191,786,574<br />
S 1 for 1 at €6.11 C stock option<br />
S 1 for 1 at €5.63 D stock option<br />
2005 3 Aug. 2005 S 1 for 1 at €7.87 B stock option €172,676 €191,959,250<br />
S 1 for 1 at €6.11 C stock option<br />
S 1 for 1 at €5.63 D stock option<br />
2005 28 Sep. 2005 S 1 for 1 at €7.87 B stock option €588,700 €192,547,950<br />
S 1 for 1 at €6.11 C stock option<br />
S 1 for 1 at €5.63 D stock option<br />
2005 2 Nov. 2005 S 1 for 1 at €7.87 B stock option €97,960 €192,645,910<br />
S 1 for 1 at €6.11 C stock option<br />
S 1 for 1 at €5.63 D stock option<br />
2005 20 Dec. 2005 S 1 for 1 at €7.87 B stock option €321,942 €192,967,852<br />
S 1 for 1 at €6.11 C stock option<br />
S 1 for 1 at €5.63 D stock option<br />
2006 13 Feb. 2006 S 1 for 1 at €7.87 B stock option €640,500 €193,608,352<br />
S 1 for 1 at €6.11 C stock option<br />
S 1 for 1 at €5.63 D stock option<br />
2006 4 May 2006 S 1 for 1 at €7.87 B stock option €938,058 €194,546,410<br />
S 1 for 1 at €6.77 B stock option<br />
2006 9 June 2006<br />
S 1 for 1 at €6.11 C stock option<br />
S 1 for 1 at €5.01 C stock option<br />
S 1 for 1 at €4.53 D stock option<br />
S 1 for 1 at €4.53 D stock option<br />
S 1 for 1 at €12.09 E stock option<br />
€59,200 €194,605,610<br />
2006 7 Aug. 2006 S 1 for 1 at €4.53 D stock option<br />
S 1 for 1 at €12.09 E stock option<br />
€118,000 €194,723,610<br />
2006 3 Oct. 2006 S 1 for 1 at €4.53 D stock option<br />
S 1 for 1 at €12.09 E stock option<br />
€94,800 €194,818,410<br />
2006 1 Nov. 2006 S 1 for 1 at €4.53 D stock option<br />
S 1 for 1 at €12.09 E stock option<br />
€157,200 €194,975,610<br />
2006 21 Dec. 2006 S 1 for 1 at €4.53 D stock option<br />
S 1 for 1 at €12.09 E stock option<br />
€64,240 €195,039,850<br />
<strong>2007</strong> 12 Feb. <strong>2007</strong> S 1 for 1 at €4.53 D stock option<br />
S 1 for 1 at €12.09 E stock option<br />
€46,376 €195,086,226<br />
<strong>2007</strong> 26 Apr. <strong>2007</strong> S 1 for 1 at €3.03 D stock option<br />
S 1 for 1 at €10.59 E stock option<br />
€86,800, €195,173,026<br />
<strong>2007</strong> 29 May <strong>2007</strong> S 1 for 1 at €3.03 D stock option<br />
S 1 for 1 at €10.59 E stock option<br />
S 1 for 1 at €16.48 F stock option<br />
€298,572 €195,471,598<br />
<strong>2007</strong> 24 July <strong>2007</strong> S 1 for 1 at €3.03 D stock option<br />
S 1 for 1 at €10.59 E stock option<br />
€9,000 €195,480,598<br />
<strong>2007</strong> 26 Sep. <strong>2007</strong> S 1 for 1 at €3.03 D stock option<br />
S 1 for 1 at €16.48 F stock option<br />
€39,032 €195,519,630<br />
<strong>2007</strong> 19 Dec. <strong>2007</strong> S 1 for 1 at €3.03 D stock option €15,900 €195,535,530<br />
19 Dec. <strong>2007</strong> S 1 for 1 at €10.59 E stock option<br />
S = subscription with share stock options
Year <strong>2007</strong><br />
Divisions The Group<br />
Financial statements<br />
Prices and trading of Kesko A and B shares on the Helsinki Stock Exchange in <strong>2007</strong><br />
Share<br />
Share price, €<br />
31 Dec. 2006<br />
Share price, €<br />
31 Dec. <strong>2007</strong> Change,% Lowest price, € Highest price, €<br />
Further<br />
information<br />
Trading volume,<br />
1,000 pcs<br />
147<br />
Total value, €<br />
thousand<br />
A share 38.43 37.85 - 1.5 34.52 53.44 3,656 161,035<br />
B share 40.02 37.72 - 5.7 34.40 54.85 122,361 5,294,130<br />
During the <strong>year</strong>, OMXHelsinki All Share Index rose by 20.5%, OMXHelsinkiCAP Index by 3.8%, and the Helsinki Stock Exchange Consumer Staples Index<br />
by 5.4%.<br />
10 largest shareholders by number of shares (A and B series) at 31.12.<strong>2007</strong><br />
Number<br />
of shares, pcs % of shares Number of votes % of votes<br />
1 Kesko Pension Fund 3,438,885 3.52 34,388,850 8.97<br />
2 The K-Retailers´ Association 3,221,539 3.30 31,847,740 8.31<br />
3 Vähittäiskaupan Takaus Oy 2,628,533 2.69 26,285,330 6.86<br />
4 Valluga-sijoitus Oy 1,340,439 1.37 13,404,390 3.50<br />
5 Oy The English Tearoom Ab 1,008,400 1.03 1,008,400 0.26<br />
6 Varma Mutual Pension Insurance Company 930,158 0.95 930,158 0.24<br />
7 Foundation for Vocational Training in the Retail Trade 895,679 0.92 7,585,838 1.98<br />
8 The State Pension Fund 746,000 0.76 746,000 0.19<br />
9 Tapiola Mutual Pension Insurance Company 559,500 0.57 559,500 0.15<br />
10 Ilmarinen Mutual Pension Insurance Company 543,392 0.56 3,333,392 0.87<br />
10 largest shareholders, total 15,312,525 15.67 120,089,598 31.33<br />
Breakdown of share ownership by shareholder category at 31 Dec. <strong>2007</strong><br />
All shares Number of shares, pcs % of all shares<br />
Non-financial corporations and housing corporations 23,153,111 23.68<br />
Financial and insurance corporations 3,299,783 3.38<br />
General Government* 7,584,105 7.76<br />
Households 24,758,084 25.32<br />
Non-profit institutions serving households** 5,537,050 5.66<br />
Rest of the world 265,394 0.27<br />
Nominee registered 33,170,238 33.93<br />
Total 97,767,765 100<br />
A shares Number of shares, pcs % of A shares % of all shares<br />
Non-financial corporations and housing corporations 18,058,619 56.90 18.47<br />
Financial and insurance corporations 1,341,306 4.23 1.37<br />
General Government* 3,979,747 12.54 4.07<br />
Households 6,694,087 21.09 6.85<br />
Non-profit institutions serving households** 1,596,083 5.03 1.63<br />
Rest of the world 4,582 0.01 0.00<br />
Nominee registered 62,583 0.20 0.06<br />
Total 31,737,007 100 32.46<br />
B shares Number of shares, pcs % of B shares % of all shares<br />
Non-financial corporations and housing corporations 5,094,492 7.72 5.21<br />
Financial and insurance corporations 1,958,477 2.97 2.00<br />
General Government* 3,604,358 5.46 3.69<br />
Households 18,063,997 27.36 18.48<br />
Non-profit institutions serving households** 3,940,967 5.97 4.03<br />
Rest of the world 260,812 0.39 0.27<br />
Nominee registered 33,107,655 50.14 33.86<br />
Total 66,030,758 100 67.54<br />
* General government includes municipalities, the provincial administration of Åland, employment pension institutions and social security funds.<br />
** Non-profit institutions include foundations awarding scholarships, organisations safeguarding certain interests, charitable associations.
148 <strong>Kesko's</strong> <strong>year</strong> <strong>2007</strong><br />
10 largest shareholders by number of votes at 31.12.<strong>2007</strong><br />
Number of<br />
shares, pcs % of shares Number of votes % of votes<br />
1 Kesko Pension Fund 3,438,885 3.52 34,388,850 8.97<br />
2 The K-Retailers´ Association 3,221,539 3.30 31,847,740 8.31<br />
3 Vähittäiskaupan Takaus Oy 2,628,533 2.69 26,285,330 6.86<br />
4 Valluga-sijoitus Oy 1,340,439 1.37 13,404,390 3.50<br />
5 Foundation for Vocational Training in the Retail Trade 895,679 0.92 7,585,838 1.98<br />
6 Ruokacity Myyrmäki Oy 389,541 0.40 3,895,410 1.02<br />
7 Ilmarinen Mutual Pension Insurance Company 543,392 0.56 3,333,392 0.87<br />
8 The K-Food Retailers´ Club 318,955 0.33 3,189,550 0.83<br />
9 Heimo Välinen Oy 274,009 0.28 2,740,090 0.71<br />
10 Mutual Insurance Company Pension-Fennia 362,400 0.37 2,402,358 0.63<br />
10 largest shareholders, total 13,413,372 13.74 129,072,948 33.68<br />
Breakdown of share ownership by number of shares held at 31 Dec. <strong>2007</strong><br />
All shares<br />
Number of shares<br />
Number<br />
of shareholders<br />
% of share<br />
shareholders<br />
Total number<br />
of shares % of shares<br />
1–100 7,035 24.32 417,873 0.43<br />
101–500 10,548 36.47 2,959,653 3.03<br />
501–1 000 4,616 15.96 3,634,556 3.72<br />
1 001–5,000 5,132 17.74 11,539,532 11.80<br />
5,001–10,000 846 2.92 6,010,651 6.15<br />
10,001–50,000 623 2.15 12,926,586 13.22<br />
50,001–100,000 74 0.26 5,146,707 5.26<br />
100,001–500,000 38 0.13 6,939,866 7.10<br />
500,001– 13 0.04 48,192,341 49.29<br />
Total 28,925 100.00 97,767,765 100.00<br />
A shares<br />
Number<br />
% of share Total number<br />
Number of shares<br />
of shareholders shareholders<br />
of shares % of shares<br />
1–100 1,137 20.59 59,244 0.19<br />
101–500 1,165 21.09 315,832 1.00<br />
501–1,000 853 15.44 726,779 2.29<br />
1,001–5,000 1,575 28.52 3,922,779 12.36<br />
5,001–10,000 397 7.19 2,823,104 8.90<br />
10,001–50,000 340 6.16 7,170,466 22.59<br />
50,001–100,000 39 0.71 2,764,537 8.71<br />
100,001–500,000 12 0.22 2,622,369 8.26<br />
500,001– 5 0.09 11,331,897 35.71<br />
Total 5,523 100.00 31,737,007 100.00<br />
B shares<br />
Number<br />
% of share Total number<br />
Number of shares<br />
of shareholders shareholders<br />
of shares % of shares<br />
1–100 6,632 26.06 396,956 0.60<br />
101–500 10,154 39.90 2,841,576 4.30<br />
501–1,000 4,002 15.73 3,098,820 4.69<br />
1,001–5,000 3,843 15.10 8,226,127 12.46<br />
5,001–10,000 456 1.79 3,290,425 4.98<br />
10,001–50,000 303 1.19 6,332,417 9.59<br />
50,001–100,000 30 0.12 2,115,177 3.20<br />
100,001–500,000 20 0.08 3,666,337 5.55<br />
500,001– 7 0.03 36,062,923 54.62<br />
Total 25,447 100.00 66,030,758 100.00
Year <strong>2007</strong><br />
Share capital and shares<br />
Divisions The Group<br />
2002<br />
FAS<br />
2003<br />
FAS<br />
Financial statements<br />
2004<br />
FAS<br />
2004<br />
IFRS<br />
Further<br />
information<br />
Share capital € million 182 182 188 188 193 195 196<br />
Number of shares at 31 Dec. 1,000 pcs 91,120.4 91,190.5 93,840.5 93,840.5 96,483.9 97,519.9 97,767.8<br />
Adjusted number of shares at 31 Dec. 1,000 pcs 91,120.4 91,190.5 93,840.5 93,840.5 96,483.9 97,519.9 97,767.8<br />
Adjusted average number of shares<br />
during the <strong>year</strong> 1,000 pcs 90,807.3 91,435.8 93,134.9 93,134.9 97,215.5 98,027.0 98,395.3<br />
of which A shares % 35 35 34 34 33 32 32<br />
of which B shares % 65 65 66 66 67 68 68<br />
Market capitalisation, A shares € million 520 578 600 600 768 1,220 1,201<br />
Market capitalisation, B shares € million 718 825 1,115 1,115 1551 2,632 2,491<br />
Number of shareholders at 31 Dec.<br />
Share turnover<br />
pcs 25,485 28,761 29,801 29,801 29,339 28,414 28,925<br />
A share € million 15 22 23 23 29 61 161<br />
B share<br />
Share turnover<br />
€ million 249 349 1,368 1,368 1,383 2,410 5,294<br />
A share pcs 1 1 1 1 1 2 4<br />
B share<br />
Turnover rate<br />
pcs 23 31 83 83 66 77 122<br />
A share % 3.0 4.0 3.8 3.8 4.1 6.4 11.5<br />
B share<br />
Change in share turnover<br />
% 38.6 51.7 133.6 133.6 101.5 117.1 185.3<br />
A share % -23.3 32.4 -3.5 -3.5 7.6 57.2 78.8<br />
B share<br />
Share price at 31 Dec.<br />
% 60.3 34.0 158.5 158.5 -24.0 15.4 58.8<br />
A share € 16.40 18.20 18.90 18.90 24.19 38.43 37.85<br />
B share<br />
Average share price<br />
€ 12.10 13.88 17.95 17.95 23.95 40.02 37.72<br />
A share € 16.26 17.46 19.12 19.12 21.93 30.10 43.85<br />
B share<br />
Highest share price during the <strong>year</strong><br />
€ 10.92 11.38 16.49 16.49 21.04 31.34 43.36<br />
A share € 17.70 18.55 21.50 21.50 24.60 38.99 53.44<br />
B share<br />
Lowest share price during the <strong>year</strong><br />
€ 12.28 14.66 18.27 18.27 24.44 40.48 54.85<br />
A share € 14.40 16.00 15.70 15.70 18.61 23.72 34.52<br />
B share € 9.75 9.35 13.58 13.58 17.80 23.80 34.40<br />
Earnings per share, diluted € 0.75 1.05 1.26 1.89 1.87 3.76 2.90<br />
Earnings per share,basic € 0.75 1.06 1.28 1.92 1.89 3.80 2.92<br />
Equity per share, diluted € 15.02 15.07 13.34 14.73 15.35 17.94 19.53<br />
Dividend per share € 1.00 3.00 1.00 1.00 1.10 1.50 1.60*<br />
Payout ratio<br />
Cash flow from operating activities<br />
% 134.4 285.7 79.4 52.9 58.8 39.9 55.2*<br />
per share, diluted<br />
Price per earnings ratio (P/E), A share,<br />
€ 1.60 1.80 2.06 2.29 3.07 3.35 2.52<br />
diluted<br />
Price per earnings ratio (P/E), B share,<br />
21.96 17.17 14.96 10.12 11.86 10.22 13.07<br />
diluted 16.21 13.09 14.21 9.50 11.74 10.64 13.02<br />
Dividend yield, %, A share % 6.1 11.0 5.3 5.3 4.6 3.9 4.2*<br />
Dividend yield, %, B share % 8.3 14.4 5.6 5.6 4.6 3.8 4.2*<br />
Effective dividend yield of A share<br />
Effective dividend yield of B share<br />
% 9.9 11.4 14.3 14.3 16.7 21.4 30.3<br />
for the last five periods % 2.8 8.9 14.7 14.7 25.9 38.9 59.9<br />
for the last ten periods<br />
* proposal to the Annual General Meeting<br />
% 12.8 10.7 13.0 13.0 16.3 19.0 23.3<br />
2005<br />
IFRS<br />
2006<br />
IFRS<br />
149<br />
<strong>2007</strong><br />
IFRS
150 <strong>Kesko's</strong> <strong>year</strong> <strong>2007</strong><br />
Information for shareholders<br />
Financial reporting calendar and key dates in 2008<br />
Year <strong>2007</strong> financial statements 5 February 2008<br />
Year <strong>2007</strong> Annual Report and audited financial statements Week 11<br />
Year 2008 Annual General Meeting 31 March 2008<br />
Interim Financial Report for the first 3 months 22 April 2008<br />
Interim Financial Report for the first 6 months 22 July 2008<br />
Interim Financial Report for the first 9 months 21 October 2008<br />
In addition, the Kesko Group's sales figures are published monthly<br />
and the K-Group's retail sales figures are published in connection with<br />
the Interim Financial Reports.<br />
Annual General Meeting<br />
The Annual General Meeting of Kesko Corporation will be held in the Helsinki<br />
Fair Centre's congress wing, Messuaukio 1 (congress wing<br />
entrance), Helsinki, on 31 March 2008 at 13 hours.<br />
All shareholders entered in the register of Kesko Corporation shareholders<br />
kept by the Finnish Central Securities Depository Ltd on 20<br />
March 2008 (Annual General Meeting record date) are entitled to attend<br />
the Annual General Meeting.<br />
Shareholders wishing to attend the meeting should notify, not later<br />
than 25 March 2008 at 16 hours by letter to Kesko Corporation/Legal<br />
Affairs, FI-00016 Kesko, by fax to +358 1053 23421, by telephone to +358<br />
1053 23211, by e-mail to taina.hohtari@kesko.fi, or through the Internet at<br />
www.kesko.fi/investors. The notifications must be received by the end of<br />
the registration period. Any proxies authorising the holders to attend the<br />
Annual General Meeting shall be sent to the above mailing address by the<br />
end of the registration period. Shareholders may use the proxy form at<br />
www.kesko.fi/investors in giving the authorisation.<br />
More information about the Annual General Meeting, attendance and<br />
decision-making is given under the heading 'Corporate Governance<br />
Statement' on pages 57–65.<br />
The decisions of the Annual General Meeting are published without<br />
delay after the meeting in a stock exchange release.<br />
Payment of dividends<br />
The Board of Directors has decided to propose to the Annual General<br />
Meeting that a dividend of €1.60 per share be paid for <strong>2007</strong>. The dividend<br />
will be paid to all shareholders entered in the register of Kesko Corporation<br />
shareholders kept by the Finnish Central Securities Depository Ltd<br />
on 3 April 2008 (record date for the payment of dividend). Registration<br />
practice takes three banking days, so the dividends are paid to those who<br />
hold the shares at the close of the date of the Annual General Meeting on<br />
31 March 2008. Dividends for shares traded on the date of the Annual<br />
General Meeting are paid to buyers.<br />
According to the Board of Directors' proposal the payment of dividends<br />
starts on 10 April 2008.<br />
Financial publications<br />
The Annual Report and Interim Financial Reports are published in Finnish,<br />
Swedish and English. No separate printed interim financial reports<br />
are published. The Annual Report, Interim Financial Reports, monthly<br />
sales figures and other key releases are published on the Kesko Group's<br />
Internet pages at www.kesko.fi/media.<br />
Kesko also publishes a separate Corporate Responsibility Report in<br />
Finnish and English.<br />
Publications may be ordered from<br />
Kesko Corporation/Corporate Communications and Responsibility<br />
FI-00016 Kesko<br />
Tel. +358 1053 22404<br />
Fax +358 9 174 398<br />
Internet: www.kesko.fi/material<br />
Changes of address<br />
Shareholders should notify changes of address to the bank, brokerage<br />
firm or other account operator with which they have a book-entry securities<br />
account.
Year <strong>2007</strong><br />
Divisions The Group<br />
Information about Kesko for investors<br />
Communications policy and principles<br />
The purpose of <strong>Kesko's</strong> communications is to promote the business of<br />
the Group and cooperation partners by taking the initiative in providing<br />
stakeholders with correct information on Group objectives and operations.<br />
The general principles followed in providing communications also<br />
include openness, topicality and truthfulness. No comments are made on<br />
confidential or unfinished business, nor on competitors' affairs.<br />
The primary objective of communications is to describe what added<br />
value Kesko and its cooperation partners generate to consumers and<br />
other customers, whose impressions and behaviour ultimately decide<br />
<strong>Kesko's</strong> success.<br />
Investor communications<br />
In line with its IR strategy, Kesko continually produces correct and up-todate<br />
information for the markets as a basis for the formation of Kesko<br />
Corporation's share price. The aim is to make <strong>Kesko's</strong> activities better<br />
known and to increase the transparency of investor information and,<br />
therefore, the attraction of Kesko as an investment target.<br />
In its investor communications, Kesko follows the principle of impartiality<br />
and publishes all investor information on the Internet pages in<br />
Finnish, Swedish and English.<br />
Kesko publishes its Annual Report as a printed publication in Finnish,<br />
Swedish and English. The Annual Report is mailed to all shareholders.<br />
The annual finance statements release and three interim financial<br />
reports are available on <strong>Kesko's</strong> Internet pages. In addition to shareholders,<br />
the company maintains a mailing list of other persons to whom<br />
the Annual Report is sent. Those who wish their names to be entered<br />
on the mailing list may fill in the service form at the Internet site<br />
www.kesko.fi/material. <strong>Kesko's</strong> stock exchange and press releases can be<br />
ordered by e-mail through the material service at the Internet site.<br />
Brokerage firms analysing Kesko:<br />
ABN AMRO Bank NV,<br />
Helsinki Branch, Helsinki<br />
Jari Räisänen<br />
Tel. +358 9 228 321<br />
firstname.lastname@<br />
fi.abnamro.com<br />
Carnegie Investment Bank AB,<br />
Finland Branch, Helsinki<br />
Tia Lehto<br />
Tel. +358 9 6187 1236<br />
firstname.lastname@carnegie.fi<br />
Danske Markets Equities,<br />
Helsinki<br />
Kalle Karppinen<br />
Tel. +358 1023 64794<br />
firstname.lastname@<br />
fi.danskebank.com<br />
Deutsche Bank, Helsinki<br />
Pontus Grönlund<br />
Tel. +358 9 2525 2552<br />
firstname.lastname@db.com<br />
EQ Pankki Oy, Helsinki<br />
Robert Liljequist<br />
Tel. +358 9 6817 8654<br />
firstname.lastname@eq.fi<br />
Evli Pankki Oyj, Helsinki<br />
Mika Karppinen<br />
Tel. +358 9 476 690<br />
firstname.lastname@evli.com<br />
Glitnir Pankki Oy, Helsinki<br />
Kim Gorschelnik<br />
Tel. +358 9 6134 6234<br />
firstname.lastname@glitnir.fi<br />
Financial statements<br />
Goldman Sachs, London<br />
Patrick Hargreaves<br />
Tel. +44 20 7552 5003<br />
firstname.lastname@gs.com<br />
Handelsbanken Capital Markets,<br />
Helsinki<br />
Maria Wikström<br />
Tel. +358 1044 42752<br />
mawi05@handelsbanken.se<br />
JP Morgan Securities Ltd, London<br />
Alastair Johnston<br />
Tel. +44 20 7325 4523<br />
alastair.johnston@jpmorgan.com<br />
Kaupthing Bank hf.,<br />
Finnish Branch, Helsinki<br />
Martin Sundman<br />
Tel. +358 9 478 40 161<br />
firstname.lastname@<br />
kaupthing.com<br />
Further<br />
information<br />
Pohjola Pankki Oyj, Helsinki<br />
Pekka Spolander<br />
Tel. +358 1025 24351<br />
firstname.lastname@pohjola.fi<br />
SEB Enskilda, Helsinki<br />
Jutta Rahikainen<br />
Tel. +358 9 6162 8713<br />
firstname.lastname@seb.fi<br />
Standard & Poor’s Equity<br />
Research, Stockholm<br />
Stellan Hellström<br />
Tel. +46 8 5450 6963<br />
stellan_hellstrom@<br />
standardandpoors.com<br />
151<br />
Kesko arranges press conferences for analysts and the media at the<br />
time of accouncing the annual and interim financial results or other significant<br />
news, and holds Capital Market Days on various themes 1–2<br />
times a <strong>year</strong>.<br />
Kesko observes a two-week period of silence before publishing information<br />
on its results. At other times, we are happy to answer the enquiries<br />
of analysts and investors by phone or e-mail, or at the investor meetings<br />
arranged.<br />
IR contacts<br />
Riikka Toivonen, Investor Relations Manager<br />
Tel. +358 1053 23495<br />
Mobile +358 500 708 337<br />
Fax +358 9 174 398<br />
Arja Talma, Senior Vice President, CFO<br />
Tel. +358 1053 22113<br />
Fax +358 9 657 465<br />
Jukka Pokki, Investor Relations Manager<br />
Tel. +358 1053 22645<br />
Mobile +358 50 65 632<br />
Fax +358 9 174 398<br />
Corporate Communications and Responsibility<br />
Paavo Moilanen, Senior Vice President<br />
Tel. +358 1053 22764<br />
Fax +358 9 174 398<br />
E-mail: firstname.lastname@kesko.fi
152 <strong>Kesko's</strong> <strong>year</strong> <strong>2007</strong><br />
Organisation, management and contact information<br />
Kesko Corporation's Board of Directors and<br />
Corporate Management Board are presented<br />
on pages 66–67 and 68–69.<br />
Kesko Corporation<br />
Satamakatu 3, Helsinki, FI-00016 Kesko<br />
Tel. +358 10 5311, fax +358 9 174 398<br />
E-mail firstname.lastname@kesko.fi<br />
President and CEO Matti Halmesmäki<br />
Finance: Senior Vice President, CFO Arja Talma<br />
Corporate Accounting: Vice President,<br />
Corporate Controller Jukka Erlund<br />
Treasury: Vice President, Group Treasurer<br />
Heikki Ala-Seppälä<br />
IT Management:<br />
Vice President, CIO Markku Laak<br />
Human Resources: Senior Vice President<br />
Riitta Laitasalo<br />
Legal Affairs, Risk Management and Internal<br />
Audit: Vice President, General Counsel<br />
Anne Leppälä-Nilsson<br />
Corporate Communications and<br />
Responsibility: Senior Vice President<br />
Paavo Moilanen<br />
Corporate Responsibility:<br />
Assistant Vice President Ulla Rehell<br />
Brand Management:<br />
Brand Director Anne Laakso<br />
Subsidiaries<br />
K-instituutti Oy<br />
Siikajärventie 88–90, FI-02860 Espoo<br />
Tel. Customer service +358 1053 37370,<br />
reception +358 1053 37271<br />
Fax +358 9 863 8571<br />
www.k-instituutti.fi<br />
Managing Director Eija Jantunen<br />
K-Plus Oy<br />
Satamakatu 3, Helsinki, FI-00016 Kesko<br />
Tel. +358 10 53020, fax +358 9 698 6952<br />
www.plussa.com<br />
Managing Director Niina Ryynänen<br />
District operations<br />
The Greater Helsinki area, Helsinki<br />
Satamakatu 3, Helsinki, FI-00016 Kesko<br />
Tel. +358 10 5311, fax +358 1053 23494<br />
District Director Eero Ahtela<br />
Uusimaa, Helsinki<br />
Satamakatu 3, Helsinki, FI-00016 Kesko<br />
Tel. +358 10 5311, fax +358 9 655 473<br />
District Director Timo Huurtola<br />
Eastern Finland, Kuopio<br />
Siunauskappelintie 2, P.O.B. 46, FI-70701<br />
Kuopio<br />
Tel. +358 10 5311, fax +358 1052 29020<br />
District Director Pertti Rusanen<br />
The Finnish Lakeland, Jyväskylä<br />
c/o K-citymarket Keljo<br />
Kylmälahdentie 6, FI-40500 Jyväskylä<br />
Tel. +358 10 5311<br />
District Director Merja Haverinen<br />
Southeastern Finland, Lahti<br />
c/o K-citymarket Lahti Laune<br />
Ajokatu 53, FI-15500 Lahti<br />
Tel. +358 10 5311, fax +358 20 720 3318<br />
District Director Timo Heikkilä<br />
Southwestern Finland, Turku<br />
Rydönnotko 1, P.O.B. 116, FI-20101 Turku<br />
Tel. +358 10 5311, fax +358 1053 21309<br />
District Director Olli Setänen<br />
Pirkanmaa, Tampere<br />
Jokipohjantie 28, P.O.B. 330, FI-33101 Tampere<br />
Tel. +358 10 5311, fax +358 1053 25448<br />
District Director Jari Alanen<br />
Ostrobothnia, Seinäjoki<br />
c/o K-maatalous Seinäjoki<br />
Hautomonkatu 2, FI-60100 Seinäjoki<br />
Tel. +358 10 5311, fax +358 1053 26333<br />
District Director Heikki Tynjälä<br />
Northern Finland, Oulu<br />
Äimäkuja 6, P.O.B. 16, FI-90401 Oulu<br />
Tel. +358 10 5311, fax +358 1053 30227<br />
District Director Jari Saarinen (e-mail:<br />
jari.k.saarinen@kesko.fi)<br />
Kesko Food Ltd<br />
Satamakatu 3, Helsinki, FI-00016 Kesko<br />
Tel. +358 10 53030, fax +358 1053 23467<br />
President Terho Kalliokoski<br />
K-citymarket, Food:<br />
Vice President Mika Rautiainen<br />
K-citymarket Oy:<br />
Managing Director Juha Ahtinen<br />
K-supermarket:<br />
Vice President Minna Kurunsaari<br />
K-market (K-market, K-extra):<br />
Vice President Ari Svensk<br />
Commerce: Vice President Ari Akseli<br />
Customer relationship:<br />
Vice President Niina Ryynänen<br />
Retail services: Vice President Kari Heiskanen<br />
(e-mail: kari.j.heiskanen@kesko.fi)<br />
Logistics and finance:<br />
Vice President Petteri Niemi<br />
Subsidiaries<br />
K-citymarket Oy<br />
Satamakatu 3, Helsinki, FI-00016 Kesko<br />
Tel. +358 10 53030, fax +358 1053 23492<br />
www.citymarket.fi<br />
Managing Director Juha Ahtinen<br />
Kespro Ltd<br />
Sähkötie 1, Vantaa, P.O.B. 15, FI-00016 Kesko<br />
Tel. +358 10 53040, fax +358 9 851 4452<br />
www.kespro.com<br />
Managing Director Jorma Rauhala<br />
Pikoil Oy<br />
Satamakatu 3, Helsinki, FI-00016 Kesko<br />
Tel. +358 20 742 2000, fax +358 20 742 2099<br />
www.pikoil.fi<br />
Managing Director Ari Svensk<br />
Keslog Ltd<br />
Jokiniementie 31, P.O.B. 47, FI-01301 Vantaa<br />
Tel. +358 10 53050, fax +358 1053 27021<br />
www.keslog.fi<br />
Managing Director Mika Salmijärvi<br />
Rautakesko Ltd<br />
Tikkurilantie 10, P.O.B. 75, FI-01301 Vantaa<br />
Tel. +358 1053 032, fax +358 9 857 4783<br />
E-mail: rautakesko.info@kesko.fi<br />
www.rautakesko.com<br />
President Jari Lind<br />
HR and Communications:<br />
HR Manager Anu Wiikeri<br />
Customers and concepts:<br />
Concept Director Jaakko-Pekka Vehmas<br />
Business support:<br />
Vice President Jouko Björkman<br />
K-rauta chain: Vice President Olli Honkasaari<br />
Rautia chain: Vice President Kimmo Vilppula<br />
Rautia chain: Vice President Jorma Mykrä<br />
Commerce: Vice President Sakari Malka<br />
International projects: Vice President Matti<br />
Vatanen, Director Seppo Paalasmaa<br />
Norway and Sweden:<br />
Region Director Jarmo Turunen<br />
Baltic countries and Russia:<br />
Region Director Raul Kadaru<br />
Country Manager for Russia: Mikko Pasanen<br />
Subsidiaries<br />
Norway<br />
Byggmakker Norge AS<br />
Snipetjenveien 7, Postboks 650, NO-1401 Ski,<br />
Norway<br />
Tel. +47 6491 4000<br />
Fax +47 6491 4090<br />
E-mail: webmaster@norgros.no<br />
www.byggmakker.no<br />
Managing Director Espen Hoff<br />
Sweden<br />
K-rauta AB<br />
Bagarbyvägen 61, SE-19134 Sollentuna, Sweden<br />
Tel. +46 8 625 6900, fax +46 8 625 6998<br />
E-mail: info@k-rauta.se<br />
www.k-rauta.com<br />
Managing Director Jani Jylhä<br />
Estonia<br />
Rautakesko AS<br />
Tähetorni 100a, EE-11625 Tallinn, Estonia<br />
Tel. +372 6 257 501, fax +372 6 257 563<br />
E-mail: info@rautakesko.ee<br />
www.rautakesko.ee<br />
Managing Director Alo Ivask
Year <strong>2007</strong><br />
Latvia<br />
Rautakesko A/S<br />
Rencenu iela 21, LV-1073 Riga, Latvia<br />
Tel. +371 7 810 090, fax +371 7 810 178<br />
E-mail: rautakesko@rautakesko.lv<br />
www.k-rauta.lv<br />
Managing Director Guntis Sokolovskis<br />
Lithuania<br />
UAB Senuku prekybos centras<br />
Pramones pr. 6, LT-51500, Kaunas-31,<br />
Lithuania<br />
Tel. +370 37 304 999, fax +370 37 304 605<br />
E-mail: marketing@senukai.lt<br />
www.senukai.lt<br />
President Arturas Rakauskas<br />
Russia<br />
ZAO Stroymaster<br />
Utkin pr. 15, RU-195112 St. Petersburg, Russia<br />
Tel. +7 812 326 9595, fax +7 812 529 2581<br />
E-mail: info@kesko.ru<br />
www.k-rauta.ru, www.stroymaster.su<br />
Managing Director Aleksandr Rudenko<br />
ZAO Kestroy<br />
Ul Ryabinovaya 43 A, RU-121471 Moscow,<br />
Russia<br />
Tel. +7 495 447 1836, fax +7 495 913 9048<br />
E-mail: sales@kestroy.ru<br />
www.kestroy.com<br />
Managing Director Jouni Paasirova<br />
VV-Auto Group Oy<br />
Hitsaajankatu 7 B, P.O.B. 80, FI-00811 Helsinki<br />
Tel. +358 9 75 831, fax +358 9 758 3267<br />
www.vv-auto.fi, www.audi.fi, www.seat.fi,<br />
www.volkswagen.fi<br />
President Pekka Lahti<br />
Audi: Brand Manager Esko Kiesi<br />
Volkswagen passenger cars:<br />
Brand Manager Lauri Haapala<br />
Volkswagen commercial vehicles:<br />
Brand Manager Carl-Gustaf Sergejeff<br />
After-sales services: Director Jarmo Toivanen<br />
Business support:<br />
Financial Director Arto Manninen<br />
Dealer network and business development:<br />
Director Mia Miettinen<br />
Subsidiaries<br />
Auto-Span Oy<br />
Hitsaajankatu 7 C, P.O.B. 80, FI-00811 Helsinki<br />
Tel. +358 9 75 831, fax +358 9 758 3356<br />
Managing Director Veikko Ålander<br />
VV-Autotalot Oy<br />
Mekaanikonkatu 10, FI-00880 Helsinki<br />
Tel. +358 1053 33200, fax +358 1053 33300<br />
Managing Director Timo Virtanen<br />
Turun VV-Auto Oy<br />
Rieskalähteentie 89, FI-20300 Turku<br />
Tel. +358 2 338 881, fax +358 2 338 8880<br />
Managing Director Timo Virtanen<br />
Divisions The Group<br />
Anttila Oy<br />
Valimotie 17, Helsinki, P.O.B. 1060,<br />
FI-00016 Kesko<br />
Tel. +358 10 5343, fax +358 1053 40109<br />
www.anttila.fi<br />
President Matti Leminen<br />
Subsidiaries<br />
Estonia<br />
Anttila AS<br />
Uus 33, EE-71033 Viljandi, Estonia<br />
Tel. +372 43 53 360, fax +372 43 33 334<br />
E-mail: anttila@anttila.ee<br />
www.anttila.ee<br />
Managing Director Tauno Tuula<br />
Latvia<br />
SIA Antti<br />
Jersikas iela 12/14, LV-1003 Riga, Latvia<br />
Tel. +371 703 3301, fax +371 703 3334<br />
E-mail: anttila@anttila.lv<br />
www.anttila.lv<br />
Director Kalle Lill<br />
Kesko Agro Ltd<br />
Tikkurilantie 10, FI-01380 Vantaa (P.O.B. 54,<br />
FI-01301)<br />
Tel. +358 10 53033, fax +358 1053 20244<br />
www.k-maatalous.fi<br />
President Seppo Hämäläinen<br />
Director Kimmo Vilppula<br />
Director, agricultural trade Antti Ollilla<br />
Sales Director, machinery trade Eero Pajulahti<br />
Finance Director Timo Pesonen<br />
Director, IT and logistics Johannes Milén<br />
K-Group's Experimental Farm<br />
Hahkialantie 57, FI-14700 Hauho<br />
Tel. +358 10 53033, fax +358 1053 38130<br />
www.k-koetila.fi<br />
Subsidiaries<br />
Härkätien rauta-maatalous<br />
Härkätie 3, FI-31400 Somero<br />
Tel. +358 2 779 300, fax +358 2 779 3015<br />
www.k-maatalous.fi/somero<br />
Kesko Agro Eesti AS<br />
Põrguvälja tee 3 a, Pildiküla, Rae vald,<br />
EE-75301 Harju mk, Estonia<br />
Tel. +372 605 9100, fax +372 605 9101<br />
www.keskoagro.com<br />
Managing Director Tõnu Kelder<br />
SIA Kesko Agro Latvija<br />
Tiraines iela 15, LV-1058 Riga, Latvia<br />
Tel. +371 7 805 421, fax +371 7 805 420<br />
www.keskoagro.com<br />
Managing Director Peteris Stupans<br />
UAB Kesko Agro Lietuva<br />
Savanoriu pr. 191, LT-02300 Vilnius, Lithuania<br />
Tel. +370 5 247 7400, fax +370 5 247 7420<br />
www.keskoagro.com<br />
Managing Director Paulius Kibisa<br />
Financial statements<br />
Further<br />
information<br />
Other operating activities<br />
153<br />
Konekesko Ltd<br />
Vanha Porvoontie 245, P.O.B. 145,<br />
FI-01301 Vantaa<br />
Tel. +358 10 53034, fax +358 1053 20505<br />
www.konekesko.com<br />
President Aatos Kivelä<br />
Indoor Group Ltd<br />
Iso-Paavolankatu 2, P.O.B. 200, FI-15101 Lahti<br />
Tel. +358 3 554 11, fax +358 3 554 2400<br />
E-mail: firstname.lastname@indoorgroup.fi<br />
www.indoorgroup.fi<br />
President Pasi Mäkinen<br />
Intersport Finland Ltd<br />
Kutojantie 4, FI-02630 Espoo<br />
Tel. +358 10 53031, fax +358 9 176 780<br />
www.intersport.fi<br />
President Juha Nurminen<br />
Musta Pörssi Ltd<br />
Kutojantie 4, FI-02630 Espoo<br />
Tel. +358 10 53031, fax +358 1053 40929<br />
www.mustaporssi.fi<br />
President Jussi Mikkola<br />
Kenkäkesko Ltd<br />
Kutojantie 4, FI-02630 Espoo<br />
Tel. +358 10 53031, fax +358 1053 39286<br />
President Martti Toivanen<br />
Tähti Optikko Group Oy<br />
Kutojantie 4, P.O.B. 40, FI-02631 Espoo<br />
Tel. +358 9 852 991, fax +358 9 854 3053<br />
www.tahtioptikko.fi<br />
President Rainer Nyman<br />
Kauko-Telko Ltd<br />
Kutojantie 4, P.O.B. 40, FI-02631 Espoo<br />
Tel. +358 9 5211, fax +358 9 521 2102<br />
www.telkogroup.com<br />
President Mikko Teittinen<br />
Service numbers<br />
Plussa customer service<br />
Mon-Fri 8.00–18.00<br />
Tel. +358 800-0-5588<br />
E-mail: plussa@kesko.fi<br />
Kesko Food's customer service<br />
Mon-Fri 9.00–13.00<br />
Tel. +358 800-0-1000<br />
E-mail: ruokakesko.kuluttajapalvelu@kesko.fi
154 <strong>Kesko's</strong> <strong>year</strong> <strong>2007</strong><br />
Glossary In this glossary we have compiled a list of some key terms used in the Annual Report.<br />
After-sales marketing refers in the car and<br />
machinery trade in particular to after-sales<br />
activities, such as maintenance, repairs, sales<br />
of spare parts, accessories and equipment.<br />
AMS is an abbreviation of AMS Sourcing BV.<br />
Kesko Food works in cooperation with the leading<br />
European food chains in AMS, and is a<br />
partner in the WorldWide Retail Exchange.<br />
The WWRE is a business-to-business web<br />
marketplace.<br />
Assortment is the number of product categories<br />
sold for different purposes (e.g. food, clothing,<br />
shoes, cosmetics, books and domestic<br />
appliances). The assortment can be wide, such<br />
as in department stores, or narrow, such as in<br />
speciality stores.<br />
Brand is a trademark, logo or branded product.<br />
It is an embodiment of all information relating<br />
to the company product or service. A brand is<br />
an image, created by the way of doing things,<br />
by quality and the willingness to reach the set<br />
destination.<br />
Certification of goods sold by stores is an<br />
audit carried out by an independent third to<br />
verify the compliance of operating systems<br />
with certain criteria (e.g. with an ISO<br />
standard).<br />
Chain agreement is a contract between the<br />
retailer and Kesko that enables the retailer join<br />
one of Kesko’s retail store chains. Under the<br />
terms of the chain agreement, the retailer and<br />
Kesko agree on their rights and responsibilities<br />
regarding chain operations.<br />
Chain concept is a comprehensive description<br />
of retail business operations and guidelines for<br />
their similar implementation in all stores of<br />
the chain.<br />
Chain Executive Committee is a body elected<br />
by retailers from their midst. It can make proposals<br />
and give opinions to the chain unit in<br />
matters concerning chain cooperation.<br />
Chain planning groups are groups that plan<br />
different areas of chain operations. They<br />
include chain retailers, their personnel and<br />
chain unit representatives.<br />
Chain selection in the K-Group is that part of a<br />
selection which is the same in all stores of the<br />
chain. The chain unit makes decisions concerning<br />
the selection.<br />
Chain unit is the Kesko unit responsible for<br />
store chain operations and chain concept development<br />
in the K-Group. It has decision-making<br />
power in matters concerning the chain.<br />
Corporate responsibility refers to voluntary<br />
responsibility towards key stakeholders. It is<br />
measurable, based on the company’s values<br />
and objectives, and is divided into economic,<br />
social and environmental responsibility.<br />
Customer value refers to the chain’s way of<br />
defining and communicating the benefits or<br />
values that it generates to the customer.<br />
Dealer, for instance in the car trade, is a company<br />
authorised by the importer to sell and<br />
service branded products. The dealer meets the<br />
quality standards set by the manufacturer and<br />
the importer.<br />
Department store is a retail store that sells a<br />
wide variety of goods. Its sales area is at least<br />
2,500 m 2 . In a department store, no product<br />
category accounts for over half of the total<br />
sales area.<br />
Discounter (discount store) is a store type that<br />
relies on low prices as competitive tools. Typical<br />
features of a discounter also include a varying<br />
selection of home and speciality goods,<br />
self-service, and warehouse-type displays.<br />
Distance sales refers to trading activities<br />
where customers do not visit store premises,<br />
but instead trade through the Internet, other<br />
electronic media or mail order.<br />
Fair trade is a form of international trade,<br />
illustrated by a formalised parrot logo. The<br />
logo indicates that business is carried out<br />
directly with small producers of the third world<br />
without intermediaries. Producers receive a<br />
guaranteed price for their products that is usually<br />
significantly higher that the world market<br />
price. They are also given guarantees of long<br />
contracts and opportunities for advance<br />
financing.<br />
Groceries refer to food and other everyday<br />
products that people are used to buying when<br />
they shop for food. Groceries include food,<br />
beverages, tobacco, home chemical products,<br />
household papers, magazines and cosmetics.<br />
Grocery store is, in most cases, a self-service<br />
food store that sells the full range of the above<br />
groceries. Food accounts for about 80% of grocery<br />
stores’ total sales.<br />
Home and speciality goods stores include<br />
clothing, shoe, sports, home technology, home<br />
goods, furniture and interior decoration stores.<br />
HoReCa is a category consisting of large customers<br />
in the food trade, including hotels, restaurants<br />
and other catering companies.<br />
Hypermarket is a retail store selling a wide<br />
variety of goods mainly on the self-service principle.<br />
Its sales area exceeds 2,500 m². In a<br />
hypermarket, food accounts for about half of<br />
the total area, but sales focus on groceries<br />
(food and other everyday items).<br />
Hypermarket centre is usually located on one<br />
level. The hypermarket accounts for over 50%<br />
of the total business premises.<br />
Intellectual capital refers to the resource that<br />
arises from the mutual interaction between the<br />
knowledge and competencies of the individuals<br />
operating in the organisation, the attitudes<br />
prevailing in the organisation and its environment,<br />
and the data management and communications<br />
systems. The company’s intellectual<br />
capital arises from information, data and<br />
competencies.<br />
K-Group consists of the K-retailers, the K-Retailers’<br />
Association and the Kesko Group.<br />
K-retailer is an independent chain entrepreneur<br />
who, through good service, competence<br />
and local expertise, provides additional<br />
strength for chain operations. The K-retailer<br />
entrepreneurs are responsible for their stores’<br />
customer satisfaction, personnel and profitable<br />
business operations.<br />
K-Retailers’ Association is a body that looks<br />
after the interests of the K-retailers. Its key<br />
function is to promote and strengthen the conditions<br />
for the entrepreneurial activities of<br />
K-retailers. All the K-retailers – about 1,285 –<br />
are members of the K-Retailers’ Association.
Year <strong>2007</strong><br />
Logistics is a process in which information<br />
management is used to direct the goods flow<br />
and related services throughout the entire supply<br />
chain. Logistics help optimise the quality<br />
and cost-efficiency of operations.<br />
Neighbourhood store is usually a small grocery<br />
store, located close to consumers and easily<br />
accessible by foot. It is usually a self-service<br />
store of less than 400 m². In Finland they have<br />
unrestricted opening hours even in town plan<br />
areas.<br />
New establishment (greenfielding) refers to<br />
new store sites or business premises.<br />
Operations control system (ERP Enterprise<br />
Resource Planning system) is an information<br />
system that supports the planning and control<br />
of business operations. It includes the information<br />
systems supporting the core processes of<br />
the company, such as category management<br />
and purchasing logistics in the trading sector,<br />
e.g. SAP R3.<br />
Organic product is, according to the EU regulation<br />
on organic production, a product in which<br />
at least 95% of the raw materials of agricultural<br />
origin have been organically produced.<br />
Private label (own brand, house brand) product<br />
is a branded product made for the trading company<br />
by a manufacturer and marketed as part<br />
of a larger product family under one brand<br />
name. A company markets its private label<br />
products through its own network.<br />
Retail trade refers to sales to consumer<br />
customers.<br />
Sales area refers to the store area reserved for<br />
sales, such as goods areas, aisles, service<br />
counters, checkout areas and air lock<br />
entrances.<br />
Selection is the range of products sold for the<br />
same purpose, for instance a selection of bread.<br />
Speciality stores carry a deep selection in the<br />
category.<br />
Divisions The Group<br />
Financial statements<br />
Self-control is an entrepreneur’s own control<br />
system, the purpose of which is to prevent<br />
problems arising in food hygiene. In compliance<br />
with legislation, self-control is based on<br />
HACCP (Hazard Analysis and Critical Control<br />
Points) principles. The hazards related to products<br />
are assessed, the critical control points<br />
needed for hazard monitoring are identified<br />
and then controlled. The system is applied to<br />
the hygiene of manufacturing plants’ machinery<br />
and equipment, the quality of raw materials<br />
and products, the effectiveness of manufacturing<br />
processes, and transportation and warehousing<br />
conditions.<br />
Service company is an enterprise that offers<br />
all the products and services wanted or<br />
expected by customers at the same time. The<br />
service company provides customers with a<br />
combination of products and related services,<br />
taking care of product assemblies and other<br />
user functions that may be required.<br />
Shopping centre houses many trading companies,<br />
but has joint management and marketing.<br />
A shopping centre has one or more main<br />
companies, but no individual store accounts<br />
for over 50% of the total business premises.<br />
A shopping centre has a minimum of 10 stores,<br />
in most cases joined by a common mall.<br />
Store-specific selection in the K-Group is that<br />
part of the selection of a store that is adapted<br />
for the special needs of the local market.<br />
Store site is a business property or premises<br />
where the chain concept and related auxiliary<br />
services are carried out.<br />
Store site fee is the term used for the payment<br />
made by the retailer to Kesko as a compensation<br />
for the use of the store site under the<br />
chain agreement and the related services<br />
offered by Kesko. The store site fee is, as a rule,<br />
calculated as a percentage of the retailer’s<br />
gross profit or net sales.<br />
Strategy is a comprehensive plan of the means<br />
the organisation intends to use in order to<br />
achieve its visions and goals.<br />
Supermarket is a grocery store that focuses on<br />
food sales and works on a self-service principle.<br />
Its sales area is at least 400 m², with food<br />
accounting for over half of the total sales area.<br />
Further<br />
information<br />
155<br />
Trading house is a company that offers its<br />
principals sales services and international<br />
trading in various forms. A company that is<br />
engaged in imports, exports or trading between<br />
third countries in products manufactured<br />
by other companies can be considered as a<br />
trading house.<br />
Value chain is used to define the combination<br />
of all the activities and resources needed for<br />
generating products and services. The value<br />
chain often consists of several operators (manufacturing<br />
industry, wholesale trade, retail<br />
trade, customer, etc.). The value chain ends<br />
with the customer.<br />
Wholesale trade is purchasing from suppliers<br />
in large quantities and then selling to enterprises<br />
engaged in the retail trade.
156 <strong>Kesko's</strong> <strong>year</strong> <strong>2007</strong>
Design and layout: Incognito<br />
Photos: Kirsi Salovaara<br />
Photos of Board Members: Rami Salle<br />
Printed by: Libris Oy
www.kesko.fi<br />
Business ID 0109862-8