Pdf version (3.2 MB) - Kesko
Pdf version (3.2 MB) - Kesko
Pdf version (3.2 MB) - Kesko

You also want an ePaper? Increase the reach of your titles
YUMPU automatically turns print PDFs into web optimized ePapers that Google loves.
TOTAL WEIGHT OF WASTE BY TYPE AND DISPOSAL<br />
mETHOD, EN22<br />
The total amount of waste generated in companies in Finland<br />
(<strong>Kesko</strong> Food Ltd (logistics), Kespro Ltd, Anttila Oy (logistics centre),<br />
Konekesko Ltd, Rautakesko Ltd and VV-Auto Group Oy) was 10,776<br />
tons, of which 92% was recovered. The aggregate quantity of waste<br />
in the other operating countries was 9,628 tons, and the recovery<br />
rate there was 67%. In Finland, <strong>Kesko</strong>’s waste statistics mainly cover<br />
warehousing operations, while in the other countries, most of the<br />
waste included in statistics is generated in retail stores.<br />
In Finland, the quantity of mixed waste decreased significantly,<br />
as the new operating system for organic waste was fully introduced<br />
in the central warehouses. In 2011, the recovery rate in <strong>Kesko</strong> Food’s<br />
warehouses clearly improved from the previous year reaching 95%<br />
(84% in 2010). In 2011, the amount of mixed waste per cubic metre<br />
delivered was 0.15 kg (0.44 kg in 2010).<br />
The recovery rate of Anttila's new logistics centre opened in 2011<br />
is over 99%.<br />
There are 223 recycling points made available to customers in<br />
K-food stores. A total of 338 million cans and 111 million recyclable<br />
plastic bottles were returned.<br />
In spring 2011, a reusable Chep crate replaced the Transbox crate in<br />
vegetable transportation. Their share of transportation via terminals<br />
operated by Keslog increased slightly.<br />
This year, the amounts of batteries and accumulators recovered<br />
through the K-Group stores were reported for the first time. The<br />
quantities are presented for the whole time during which they have<br />
been recovered in Finland.<br />
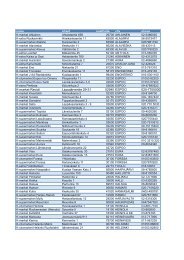
Waste management statistics on operations in Finland, tons<br />
<strong>Kesko</strong> Food (logistics) Kespro 4) Anttila (logistics centre) Rautakesko Car and machinery trade<br />
2011 2010 2009 2011 2011 2010 2009 2011 2010 2009 2011 2010 2009<br />
Waste for recovery 7,245 5,596 5,638 941 423 471 539 439 405 414 689 969 599<br />
WEEE 14 - - - 96 94 95 - - - -<br />
Landfill waste 1) 2) 391 1100 3) 901 3) 316 2 15 14 52 59 100 75 130 147<br />
Hazardous waste 2) 18 3 - 12 - 3 - - - 61 120 65<br />
Total 7,668 6,698 6,539 1,269 521 581 651 491 464 514 825 1,219 811<br />
Recovery rate, % 95 84 86 75 99 97 97 89 87 81 91 79 74<br />
1) Mixed waste and other components not suitable for recovery.<br />
2) Composted organic waste and hazardous waste (from 2011) are included in the recovery rate.<br />
3) In addition, in 2009: 110 tons and in 2010: 96 tons of building and special waste was treated, but such a one-off batch was not included in the calculation.<br />
4) Reported by Kespro for 2011 for the first time.<br />
Waste management statistics for Sweden and Norway, tons<br />
Sweden Norway<br />
2011 2010 2009 2011 2010 2009<br />
Waste for recovery 1,482 2,055 2,044 1,224 699 654<br />
Landfill waste 441 480 555 22 504 574<br />
Hazardous waste 41 - 48 37 38 8<br />
Total 1,964 2,535 2,647 1,283 1,241 1,236<br />
Recovery rate, % 75 81 77 95 56 53<br />
environmental resPonsibility<br />
Packaging delivered by <strong>Kesko</strong> Food's return logistics for recovery and<br />
reuse, 1,000 pcs<br />
2011 2010 2009<br />
Aluminium cans 100,236 103,149 74,161<br />
PET bottles 56,841 53,540 28,463<br />
Disposable bottles 5,107 4,266 2,685<br />
Deposit bottles 356 452 362<br />
Reusable crates 11,429 10,885 9,856<br />
Impregnated timber and lead-acid batteries recycled by the building and<br />
home improvement trade (K-rauta and Rautia), Finland, tons<br />
2011 2010 2009<br />
Impregnated timber 931 840 858<br />
Lead-acid batteries 4 5 22<br />
Batteries and accumulators (Recser) collected in the K-Group stores,<br />
Finland, tons<br />
2011 2010 2009<br />
Batteries and accumulators 130 108 80<br />
TOTAL NUmBER AND VOLUmE OF SIGNIFICANT<br />
SPILLS, EN23, AND COmPLIANCE WITH<br />
ENVIRONmENTAL LAWS AND REGULATIONS, EN28<br />
The ISO 14001 certified <strong>Kesko</strong> units manage their environmental<br />
risks and readiness to act in exceptional and emergency situations in<br />
accordance with the requirements of the standard. One of the biggest<br />
risks for trading sector companies is fire, which is why employees<br />
have been given appropriate instructions and training. In 2011, there<br />
were no reportable environmental damages or accidents within<br />
the Group.<br />
Waste management statistics for the Baltics, Russia and Belarus, tons<br />
Estonia Latvia 1) Lithuania Russia Belarus1) 2011 2010 2009 2011 2011 2010 2009 2011 2010 2009 2011<br />
Waste for recovery 402 158 196 189 2,300 1,905 2,069 574 2,343 1,906 8<br />
Landfill waste 43 271 422 478 1,050 796 992 1,113 771 889 , 53<br />
Hazardous waste 7 - 8 7 25 11 21 - - - 132<br />
Total 452 428 626 674 3,375 2,711 3,082 1,687 3,114 2,795 , 193<br />
Recovery rate, % 89 37 31 28 68 70 67 34 75 68 ,2) 4<br />
1) Data of Latvia and Belarus for 2011 only.<br />
<strong>Kesko</strong> Corporate Responsibility Report 2011 77