growers@sgcotton.com.au Roger Tomkins - Greenmount Press
growers@sgcotton.com.au Roger Tomkins - Greenmount Press
growers@sgcotton.com.au Roger Tomkins - Greenmount Press

Create successful ePaper yourself
Turn your PDF publications into a flip-book with our unique Google optimized e-Paper software.
Mapping estimated deep drainage<br />
in the lower Namoi Valley<br />
■ By Alice Woodforth and John Triantafilis<br />
THE Murray Darling Basin (MDB) is a prime agricultural region<br />
of southeastern Australia. It accounts for half of all water<br />
used for irrigation in Australia. But there are increasing<br />
pressures on irrigators to improve water use efficiency (WUE)<br />
owing to increasing demands on water for environmental flows,<br />
new mining industries (such as coal seam gas production) and<br />
in some instances to manage shallow water tables. In addition,<br />
climate change modeling suggests that not only will rainfall<br />
decrease but it will also be<strong>com</strong>e more variable in the MDB.<br />
One way to improve WUE in irrigated areas is to reduce<br />
deep drainage (DD). This is bec<strong>au</strong>se DD is synonymous with the<br />
network of prior stream channels that characterise the Riverine<br />
Plains of the MDB. The most accurate way to measure DD is to<br />
use a lysimeter. But these are expensive to install and require<br />
significant time to equilibrate. More <strong>com</strong>monly, DD is estimated<br />
using chloride mass balance (CMB) models.<br />
Despite this advantage, the labour in the field and laboratory<br />
time and expense of gaining estimates of DD means the spatial<br />
variability across a district scale is usually still not attainable.<br />
Electromagnetic (EM) induction instruments are useful in valueadding<br />
to the limited number of estimates. This is bec<strong>au</strong>se an EM<br />
instrument measures many soil properties that can affect the rate<br />
of DD (such as clay content).<br />
In this research project, we explored the use of a CMB model<br />
coupled with EM34 data to map the spatial distribution of DD<br />
across the predominantly irrigated cotton growing area around<br />
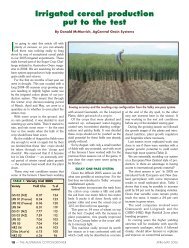
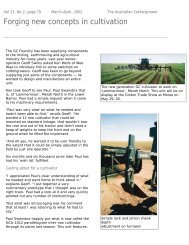
Wee Waa. The main features of the valley are the clay plains,<br />
prior stream formations, the Pilliga scrub and a coarse-textured<br />
dissected flood plain (Figure 1).<br />
EM Survey, CMB modeling and calibration<br />
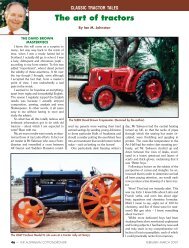
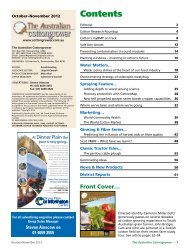
EM34 measurements were made on an approximate 1 km<br />
grid, with a total of 1869 sites visited (Figure 2). In order to<br />
<strong>com</strong>plement this data, a soil sampling scheme was developed<br />
from the EM34 data and approximately 36 soil sample locations<br />
were selected across the study area. At each site soil samples<br />
FIGuRE 1: Map of physiographic units<br />
(Stannard and Kelly, 1977)<br />
were obtained at one metre depths and to a maximum depth of<br />
9–18 metres across the study area.<br />
The soil samples were analysed for chloride ion concentration.<br />
The data was then entered into a simple CMB model along with<br />
other information obtained from previous research. This included<br />
an estimate of the concentration of chloride in irrigation water<br />
and rainfall, an estimate of irrigation water application (i.e. 600<br />
mm/year) and the average annual rainfall (i.e. 584 mm/year)<br />
around Wee Waa.<br />
Figure 3 shows the relationships between DD and EM34<br />
data. The relationship can approximately be described as curvelinear.<br />
Using a slightly more statistically rigorous analysis of this<br />
relationship (for example, we log transformed the estimates of<br />
DD), we used the subsequent relationship to estimate DD from<br />
the EM34 data.<br />
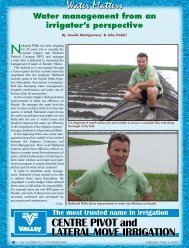
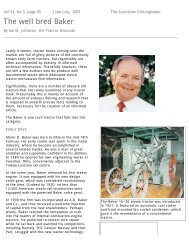
Map of estimated DD<br />
Figure 4 shows the spatial distribution of estimated DD (mm/<br />
year) generated from our calibrated EM34 data. The largest<br />
estimates are associated with the Pilliga Scrub (around >450<br />
mm) which is located to the south of Wee Waa. Some c<strong>au</strong>tion is<br />
required with these estimates of DD bec<strong>au</strong>se only one soil sample<br />
location was collected in this area. Nevertheless, estimated DD is<br />
consistent with the fact that few irrigated cotton growing farms<br />
have been developed for furrow irrigation here.<br />
Where fields have been developed for furrow irrigation, the<br />
length of the field is short (about 300 metres). More <strong>com</strong>monly,<br />
irrigation is limited to sprinkler or trickle irrigation and for the<br />
purpose of vegetable (e.g. potatoes) or horticultural (e.g. table<br />
grapes) production, respectively. The former is grown under<br />
centre pivot irrigation.<br />
In terms of physiographic units upon which fields have been<br />
developed for irrigated cotton production, the largest estimates<br />
of DD (350-450 mm/year) correspond with the low dissected<br />
floodplain west of the ACRI and either side of the Spring Plain<br />
road. Here, the irrigated fields are small – the length of the<br />
FIGuRE 2: Location of EM34 measurement sites<br />
and soil sample locations<br />
44 — The Australian Cottongrower August–September 2012