growers@sgcotton.com.au Roger Tomkins - Greenmount Press
growers@sgcotton.com.au Roger Tomkins - Greenmount Press
growers@sgcotton.com.au Roger Tomkins - Greenmount Press

Create successful ePaper yourself
Turn your PDF publications into a flip-book with our unique Google optimized e-Paper software.
Nutrition<br />
feature…<br />
TABLE 2: Crop N uptake (kg/ha) and lint yield (kg/<br />
ha) measured at four N fertiliser rates<br />
N applied Crop N Lint yield<br />
0 148 2570<br />
120 201 3110<br />
200 244 3120<br />
320 239 3100<br />
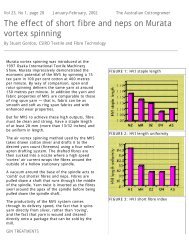
Figure 1 shows that N 2 O emissions did not increase above<br />
the background emission level until approxiamately 170 kg-N/ha<br />
which is below the agronomic optimum N fertiliser rate.<br />
Excessive N equals large emissions<br />
This research confirms the idea that excessive N fertiliser<br />
application results in large emissions of N O. This is costly in terms<br />
2<br />
of wasted N fertiliser and damaging to the environment. Further<br />
work is needed to validate the optimum fertiliser rate to minimise<br />
N O emissions under different environmental conditions.<br />
2<br />
Additionally once the eCO is measured from the <strong>com</strong>plete crop<br />
2<br />
rotation it will be possible to calculate the gross margin and the<br />
economic optimum N fertiliser application.<br />
The economic optimum N fertiliser rate is quite readily<br />
estimated by soil analysis prior to fertiliser application, and<br />
adjusted through the season where tissue analyses indicate<br />
deficient levels of N in the crop.<br />
Over use of N fertiliser is <strong>com</strong>mon within the cotton industry<br />
and profits are reduced bec<strong>au</strong>se of reduced production and<br />
wasted N fertiliser. Under current policy settings N costs are likely<br />
to rise as energy costs increase and this will result in further<br />
economic penalties due to inefficient fertiliser use.<br />
N 2 O emissions increase after irrigation.<br />
FIGuRE 1: The potential optimum fertiliser rate<br />
which minimizes N 2 O production and maintains<br />
lint yield<br />
Nitrous oxide emissions increased after each irrigation or rain<br />
fall, so management of irrigations to minimise water-logging and<br />
promote better drainage will reduce those emissions.<br />
To sum up<br />
Excessively high N fertiliser application exponentially increases<br />
N 2 O emissions.<br />
Those crops that have received N fertiliser applications at or<br />
less than the economic optimum N fertiliser rate emit relatively<br />
small quantities of N 2 O.<br />
*Emissions factor equation:<br />
E = N2O.N (treatment) – N O.N (control)<br />
2<br />
Fertiliser applied kg (N/ha)<br />
This research was funded by the Cotton CRC and CRDC.<br />
1 CSIRO Land and Water, Canberra, ACT, ben.macdonald@csiro.<strong>au</strong><br />
2 CSIRO Land and Water, Narrabri, NSW, anthony.nadelko@csiro.<strong>au</strong><br />
3 CSIRO Plant Industry, Narrabri, NSW, ian.rochester@csiro.<strong>au</strong><br />
Monitoring N 2 O emissions.<br />
28 — The Australian Cottongrower August–September 2012