growers@sgcotton.com.au Roger Tomkins - Greenmount Press
growers@sgcotton.com.au Roger Tomkins - Greenmount Press
growers@sgcotton.com.au Roger Tomkins - Greenmount Press

You also want an ePaper? Increase the reach of your titles
YUMPU automatically turns print PDFs into web optimized ePapers that Google loves.
Nutrition<br />
feature…<br />
Impact of nitrogen fertiliser losses<br />
from cotton<br />
■ By Ben Macdonald 1 , Tony Nadelko 2 and Ian Rochester 3<br />
THE application of nitrogen fertiliser is the direct c<strong>au</strong>se<br />
of nitrous oxide (N 2 O) emissions from cropping systems.<br />
Nitrous oxide is a powerful greenhouse gas (GHG) and<br />
has a warming potential 310 times greater than carbon dioxide<br />
(CO 2 ). Should agricultural producers choose to take advantage of<br />
carbon trading initiatives, they will need to target and reduce the<br />
emission of greenhouse gases, especially N 2 O emissions.<br />
We have set out to examine the relationship between N<br />
fertiliser application rates and the goals of achieving maximum<br />
lint yield and with minimal N 2 O emissions in an irrigated cotton<br />
system at Narrabri.<br />
Monitoring N O 2<br />
GHG monitoring equipment was installed in an existing<br />
nitrogen fertiliser rate experiment. We measured nitrous oxide<br />
(N O), carbon dioxide (CO ) and methane (CH4) concentrations;<br />
2 2<br />
this allowed us to determine GHG emissions on an hourly basis.<br />
We <strong>com</strong>menced measuring GHG emissions from the cotton<br />
phase of a cotton-faba bean-fallow system in September 2011.<br />
The N O data presented here are up to the time the field flooded<br />
2<br />
in late January 2012.<br />
We monitored N O emissions from a randomised field trial<br />
2<br />
where urea was applied at four rates (0, 120, 200, 320 kg N/ha).<br />
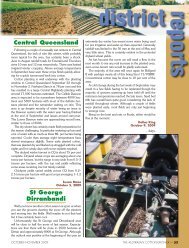
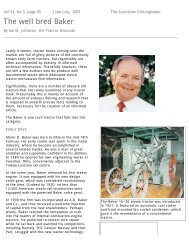
Chambers deployed in the spring of 2011. In the background<br />
is the trailer which houses the gas chromatograph and<br />
<strong>com</strong>puter system used to measure the GHG concentrations in<br />
the chambers.<br />
in brieF…<br />
We measured the emission of nitrous oxide (N 2 O) from<br />
irrigated cotton that had been fertilised at four rates of N.<br />
Cotton that received N fertiliser applications at or below the<br />
economic optimum for lint production emitted relatively small<br />
quantities of N 2 O.<br />
Excessively high N fertiliser application increased N 2 O<br />
emissions exponentially.<br />
The 0, 120, 200 N rates represent the range of optimum N rates<br />
determined for this rotation in the past three years, whereas the<br />
320 N rate is more typical of the N fertiliser management in some<br />
<strong>com</strong>mercial cotton crops.<br />
Twelve <strong>au</strong>tomatic chambers, coupled to a gas chromatograph,<br />
were used to measure emissions from the field. Three replicate<br />
chambers were installed in each N fertiliser treatment.<br />
An emission factor (EF) was calculated which indicates how<br />
much N O is emitted per unit of fertiliser N applied*.<br />
2<br />
In this case the 0 fertiliser rate plots were used as the control.<br />
The cost of the emission per hectare was calculated assuming the<br />
carbon dioxide equivalent (eCO ) price of $23 per tonne. In a free<br />
2<br />
market situation this price will fluctuate according to demand.<br />
N O emissions<br />
2<br />
The amounts of N O measured at each N fertiliser rate are<br />
2<br />
shown in Table 1.<br />
The emissions factor indicates that relatively more N from the<br />
fertiliser is lost as N O as the N fertiliser rate increases. So, not<br />
2<br />
only does the total N loss increase, so does the proportion of<br />
N O, relative to N .<br />
2 2<br />
The point at which lint yield was maximised was about 200 kg<br />
N per hectare, i.e. the economic optimal N fertiliser rate. Similarly,<br />
crop N uptake was maximised at this level of N fertiliser. There<br />
was no agronomic benefit to apply more N fertiliser than the<br />
optimal 200 kg N per hectare.<br />
TABLE 1: Nitrous oxide (N 2 O) emissions at four N<br />
fertiliser rates, the emissions factor and cost of<br />
those emissions from a cotton crop<br />
N applied N 2 O lost Emission factor $/ha<br />
0 0.47 na 3.22<br />
120 0.59 0.10 4.04<br />
200 1.03 0.28 7.06<br />
320 4.07 1.13 27.90<br />
August–September 2012 The Australian Cottongrower — 27