Role of Intestinal Microbiota in Ulcerative Colitis
Role of Intestinal Microbiota in Ulcerative Colitis
Role of Intestinal Microbiota in Ulcerative Colitis

Create successful ePaper yourself
Turn your PDF publications into a flip-book with our unique Google optimized e-Paper software.
VOL. 77, 2011 IN VITRO FERMENTATION OF ARABINO-OLIGOSACCHARIDES 8339<br />
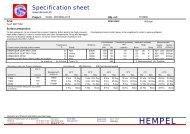
FIG. 1. Relative quantities <strong>of</strong> gene targets <strong>of</strong> the orig<strong>in</strong>al bacterial<br />
community <strong>in</strong> fecal samples from healthy controls (white), ulcerative<br />
colitis patients <strong>in</strong> remission (gray), and ulcerative colitis patients <strong>in</strong><br />
relapse (black). Target genes encoded 16S rRNA from Lactobacillus<br />
spp., Bifidobacterium spp., Firmicutes, Bacteroidetes, Clostridium coccoides<br />
group, Clostridium leptum subgroup, Faecalibacterium prausnitzii,<br />
and Desulfovibrio spp. The relative quantities (RQ) were calculated<br />
as RQ � E �CT , where E represents the primer efficiency and �CT<br />
was the C T value <strong>of</strong> the bacterial target normalized aga<strong>in</strong>st the C T<br />
value <strong>of</strong> the total bacterial population <strong>in</strong> the sample. Total bacteria<br />
were set to 100% (<strong>in</strong>dicated by dotted l<strong>in</strong>e). Error bars represent<br />
averages � standard errors <strong>of</strong> the means <strong>of</strong> relative quantities <strong>in</strong> target<br />
species <strong>in</strong> each <strong>of</strong> the six samples <strong>in</strong> each group. Asterisks <strong>in</strong>dicate a<br />
significant difference among groups (P � 0.05).<br />
<strong>in</strong> remission and relapse, respectively, was observed. However,<br />
there was a trend <strong>of</strong> lower densities <strong>of</strong> lactobacilli <strong>in</strong> the relapse<br />
than <strong>in</strong> the remission group (0.05 � P � 0.10). Densities<br />
<strong>of</strong> the Bacteroidetes phylum were significantly lower <strong>in</strong> the UC<br />
patients <strong>in</strong> remission than <strong>in</strong> healthy controls (P � 0.05). The<br />
mean relative quantity <strong>of</strong> Bifidobacterium spp. was lower <strong>in</strong> the<br />
UC patients <strong>in</strong> relapse than <strong>in</strong> the other groups, although this<br />
was not statistically significant, probably due to high <strong>in</strong>ter<strong>in</strong>dividual<br />
variation <strong>in</strong> the three groups. There were no significant<br />
differences <strong>in</strong> the densities <strong>of</strong> the Firmicutes, the Clostridium coccoides<br />
group, the Clostridium leptum subgroup, Faecalibacterium<br />
prausnitzii, and Desulfovibrio spp. between the three groups.<br />
Changes <strong>in</strong> fecal microbial communities after <strong>in</strong> vitro fermentation.<br />
After fermentation <strong>of</strong> FOS and AOS <strong>in</strong> fecal slurries<br />
obta<strong>in</strong>ed from healthy subjects and UC patients <strong>in</strong> either<br />
remission or relapse, qPCR was applied to measure the density<br />
<strong>of</strong> gene targets encod<strong>in</strong>g 16S rRNA genes <strong>of</strong> selected bacterial<br />
taxonomic units (Fig. 2). In fecal communities derived from<br />
healthy subjects and UC patients <strong>in</strong> remission, fermentation <strong>of</strong><br />
FOS resulted <strong>in</strong> a significant <strong>in</strong>crease <strong>in</strong> the content <strong>of</strong> Bifidobacterium<br />
spp. (P � 0.05). However, fermentation <strong>of</strong> AOS did<br />
not similarly <strong>in</strong>crease the proportion <strong>of</strong> bifidobacteria <strong>in</strong> these<br />
samples, although a trend for higher levels <strong>of</strong> bifidobacteria <strong>in</strong><br />
the communities from healthy subjects was observed (P �<br />
0.078). The communities derived from patients with UC <strong>in</strong><br />
relapse showed a significant <strong>in</strong>crease <strong>in</strong> the density <strong>of</strong> bifidobacteria<br />
after fermentation with FOS as well as with AOS (P �<br />
0.05). The relative abundances <strong>of</strong> Lactobacillus spp. <strong>in</strong> fecal<br />
microbiota derived from patients with UC <strong>in</strong> remission and<br />
relapse were significantly <strong>in</strong>creased after fermentation with<br />
either FOS or AOS (P � 0.05). The fecal communities from<br />
healthy subjects conta<strong>in</strong>ed a significantly higher density <strong>of</strong> lac-<br />
tobacilli after fermentation with FOS (P � 0.05). Although this<br />
was only borderl<strong>in</strong>e significant for the samples fermented with<br />
AOS, there was a strong trend <strong>of</strong> a similar effect (P � 0.057).<br />
A significant reduction <strong>of</strong> the Firmicutes phylum and <strong>of</strong> taxa<br />
belong<strong>in</strong>g to the Firmicutes (C. coccoides group, C. leptum<br />
subgroup, and F. prausnitzii) was measured <strong>in</strong> all three fecal<br />
microbiota groups after fermentation with AOS (P � 0.05).<br />
Firmicutes phylum levels <strong>in</strong> the samples fermented with FOS<br />
were unaffected, although levels <strong>of</strong> the C. coccoides group, the<br />
C. leptum subgroup, and F. prausnitzii were significantly reduced<br />
(P � 0.05). FOS and AOS fermentation both resulted <strong>in</strong><br />
a decrease <strong>of</strong> the relative abundance <strong>of</strong> Bacteroidetes phylum<br />
and Desulfovibrio spp. (genus belong<strong>in</strong>g to the Proteobacteria<br />
phylum) after fermentation <strong>of</strong> all three fecal microbiota groups<br />
(P � 0.05).<br />
No significant differences between the effects <strong>of</strong> the two<br />
carbohydrate sources AOS and FOS were observed, except <strong>in</strong><br />
the case <strong>of</strong> Bifidobacterium spp., which were more abundant<br />
(P � 0.05) <strong>in</strong> the samples from healthy subjects after <strong>in</strong>cubation<br />
with FOS than <strong>in</strong> those <strong>in</strong>cubated with AOS, and Desulfovibrio<br />
spp., where the density was significantly lower (P �<br />
0.05) <strong>in</strong> the samples from UC patients <strong>in</strong> remission after <strong>in</strong>cubation<br />
with FOS than after <strong>in</strong>cubation with AOS.<br />
SCFA analysis and pH measurements after fermentation.<br />
Amounts <strong>of</strong> SCFA (acetate, propionate, butyrate) produced by<br />
fermentation <strong>of</strong> FOS and AOS and pH measurements are<br />
shown <strong>in</strong> Table 2. For all types <strong>of</strong> samples (healthy, remission,<br />
and relapse), the pH was lower <strong>in</strong> samples <strong>in</strong>cubated with FOS<br />
and AOS than <strong>in</strong> the samples <strong>in</strong>cubated without added substrate.<br />
The amount <strong>of</strong> acetate was significantly higher (P �<br />
0.05) <strong>in</strong> all types <strong>of</strong> samples fermented with FOS than <strong>in</strong> the<br />
samples with no substrate added. Additionally, acetate was<br />
higher <strong>in</strong> samples from patients <strong>in</strong> relapse <strong>in</strong>cubated with<br />
AOS. A significantly lower (P � 0.05) amount <strong>of</strong> propionate<br />
was measured <strong>in</strong> samples from healthy subjects <strong>in</strong>cubated with<br />
FOS than <strong>in</strong> samples <strong>in</strong>cubated with no substrate added. No<br />
significant difference was observed <strong>in</strong> the amount <strong>of</strong> butyrate<br />
after fermentation, <strong>in</strong>dependent <strong>of</strong> substrate and orig<strong>in</strong> <strong>of</strong> the<br />
microbial community.<br />
Pr<strong>in</strong>cipal component analysis (PCA) <strong>of</strong> bacterial composition.<br />
The different bacterial taxonomic units as a function <strong>of</strong><br />
disease status and <strong>in</strong>cubation with FOS or AOS were subjected<br />
to PCA to generate an overview <strong>of</strong> the variation <strong>in</strong> the ability<br />
<strong>of</strong> the microbial communities from either healthy subjects, UC<br />
patients <strong>in</strong> remission, or UC patients <strong>in</strong> relapse to ferment the<br />
two carbohydrate sources. Data were visualized <strong>in</strong> two dimensions<br />
us<strong>in</strong>g a pr<strong>in</strong>cipal component score and load<strong>in</strong>g plot (Fig.<br />
3A and B, respectively). Two pr<strong>in</strong>cipal components were calculated<br />
for the model with a total <strong>of</strong> 73.60% <strong>of</strong> variance expressed.<br />
The samples before (orig<strong>in</strong>al bacterial communities)<br />
and after <strong>in</strong>cubation with or without either FOS or AOS for all<br />
three stages <strong>of</strong> disease were clearly differentiated by the PC1,<br />
with the fermented samples cluster<strong>in</strong>g to the left <strong>of</strong> the PCA<br />
score plot (Fig. 3A). However, differentiation between samples<br />
<strong>in</strong>cubated with FOS and AOS was not seen. The load<strong>in</strong>g plot<br />
revealed that the primary bacterial taxa <strong>in</strong>fluenc<strong>in</strong>g the differentiation<br />
between the orig<strong>in</strong>al bacterial communities and samples<br />
<strong>in</strong>cubated with added substrate were the Bifidobacterium<br />
spp. and the Lactobacillus spp. (Fig. 3B).<br />
Downloaded from<br />
http://aem.asm.org/<br />
on November 28, 2011 by guest