DATA HIGHLIGHTS - Census of India Website
DATA HIGHLIGHTS - Census of India Website
DATA HIGHLIGHTS - Census of India Website

You also want an ePaper? Increase the reach of your titles
YUMPU automatically turns print PDFs into web optimized ePapers that Google loves.
MANIPUR<br />
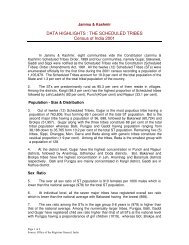
<strong>DATA</strong> <strong>HIGHLIGHTS</strong> : THE SCHEDULED TRIBES<br />
<strong>Census</strong> <strong>of</strong> <strong>India</strong> 2001<br />
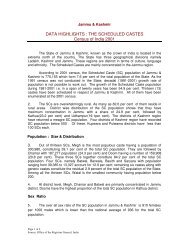
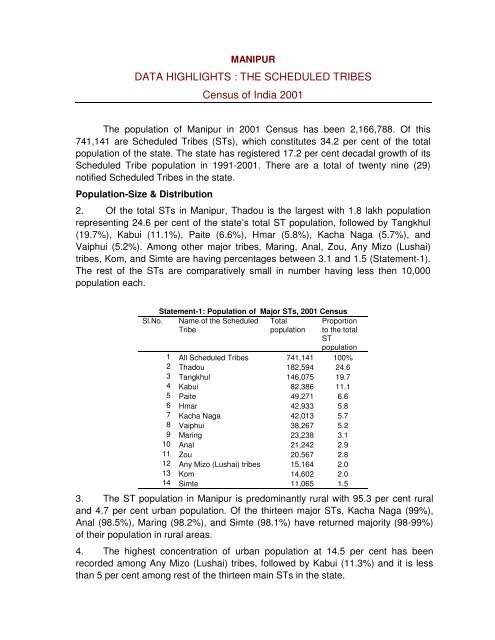
The population <strong>of</strong> Manipur in 2001 <strong>Census</strong> has been 2,166,788. Of this<br />
741,141 are Scheduled Tribes (STs), which constitutes 34.2 per cent <strong>of</strong> the total<br />
population <strong>of</strong> the state. The state has registered 17.2 per cent decadal growth <strong>of</strong> its<br />
Scheduled Tribe population in 1991-2001. There are a total <strong>of</strong> twenty nine (29)<br />
notified Scheduled Tribes in the state.<br />
Population-Size & Distribution<br />
2. Of the total STs in Manipur, Thadou is the largest with 1.8 lakh population<br />
representing 24.6 per cent <strong>of</strong> the state’s total ST population, followed by Tangkhul<br />
(19.7%), Kabui (11.1%), Paite (6.6%), Hmar (5.8%), Kacha Naga (5.7%), and<br />
Vaiphui (5.2%). Among other major tribes, Maring, Anal, Zou, Any Mizo (Lushai)<br />
tribes, Kom, and Simte are having percentages between 3.1 and 1.5 (Statement-1).<br />
The rest <strong>of</strong> the STs are comparatively small in number having less then 10,000<br />
population each.<br />
Statement-1: Population <strong>of</strong> Major STs, 2001 <strong>Census</strong><br />
Sl.No. Name <strong>of</strong> the Scheduled<br />
Tribe<br />
Total<br />
population<br />
Proportion<br />
to the total<br />
ST<br />
population<br />
1 All Scheduled Tribes 741,141 100%<br />
2 Thadou 182,594 24.6<br />
3 Tangkhul 146,075 19.7<br />
4 Kabui 82,386 11.1<br />
5 Paite 49,271 6.6<br />
6 Hmar 42,933 5.8<br />
7 Kacha Naga 42,013 5.7<br />
8 Vaiphui 38,267 5.2<br />
9 Maring 23,238 3.1<br />
10 Anal 21,242 2.9<br />
11 Zou 20,567 2.8<br />
12 Any Mizo (Lushai) tribes 15,164 2.0<br />
13 Kom 14,602 2.0<br />
14 Simte 11,065 1.5<br />
3. The ST population in Manipur is predominantly rural with 95.3 per cent rural<br />
and 4.7 per cent urban population. Of the thirteen major STs, Kacha Naga (99%),<br />
Anal (98.5%), Maring (98.2%), and Simte (98.1%) have returned majority (98-99%)<br />
<strong>of</strong> their population in rural areas.<br />
4. The highest concentration <strong>of</strong> urban population at 14.5 per cent has been<br />
recorded among Any Mizo (Lushai) tribes, followed by Kabui (11.3%) and it is less<br />
than 5 per cent among rest <strong>of</strong> the thirteen main STs in the state.
5. The Ukhrul, Tamenglong, Churachandpur, and Chandel are predominantly<br />
tribal districts having more than 90 per cent <strong>of</strong> the district’s population as ST. The<br />
Senapati has recorded 78.5 per cent <strong>of</strong> its population as ST. These five districts<br />
together hold 92.4 per cent <strong>of</strong> the state’s total ST population. The rest <strong>of</strong> the four<br />
districts <strong>of</strong> Manipur have negligible percentage <strong>of</strong> ST population, Statement-2.<br />
Sex Ratio<br />
Sl.<br />
No<br />
Page 2 <strong>of</strong> 5<br />
Source: Office <strong>of</strong> the Registrar General, <strong>India</strong><br />
Statement-2: District wise ST population<br />
State/ District Percentage <strong>of</strong><br />
STs to total<br />
population <strong>of</strong><br />
the State/<br />
District<br />
District wise<br />
percentage <strong>of</strong><br />
total ST<br />
population<br />
1 MANIPUR* 34.2 100<br />
2 Ukhrul 95.5 18.1<br />
3 Tamenglong 95.4 14.3<br />
4 Churachandpur 93.2 28.7<br />
5 Chandel 91.9 14.7<br />
6 Senapati* 78.5 16.6<br />
7 Imphal East 6.3 3.3<br />
8 Imphal West 4.8 2.8<br />
9 Bishnupur 2.9 0.8<br />
10 Thoubal 1.2 0.6<br />
* Excluding three subdivisions (Paomata, Mao-Maram, & Purul )<br />
<strong>of</strong> Senapati district<br />
6. As per 2001 <strong>Census</strong>, sex ratio <strong>of</strong> the ST population is 980, which is higher<br />
than the national average for STs (978). The state, however, has recorded low child<br />
sex ratio (0-6 age group) <strong>of</strong> 959 as compared to the national average (973).<br />
7. Of the thirteen main STs, Anal has recorded preponderance <strong>of</strong> females over<br />
males with the highest sex ratio <strong>of</strong> 1031. Simte has recorded a balanced sex ratio<br />
(1000). The sex ratio is, however, comparatively low among Maring (954), Kacha<br />
Naga (961), and Tangkhul (965).<br />
8. The Simte (1039) and Vaiphui (1001) have recorded more girls per<br />
thousand boys in the age group 0-6. The Kabui (930), Hmar (932), Kacha Naga<br />
(936), Tangkhul (941), and Zau (944) have recorded child sex ratio below the state<br />
average for STs. Kom has recorded the lowest child sex ratio at 903.<br />
Literacy & Educational Level<br />
9. The Scheduled Tribe population in Manipur has recorded 65.9 per cent<br />
literacy, which is above the national average for STs (47.1%). The females are<br />
lagging behind by 14.7 per cent points in literacy rates than their male counterpart<br />
with male and female literacy at 73.2 per cent and 58.4 per cent respectively.<br />
10. Of the thirteen major STs, Hmar has recorded the highest literacy <strong>of</strong><br />
79.8 per cent, followed by Paite (79%), Any Mizo (Lushai) tribes (74%), Anal<br />
(73.9%), and Tangkhul (72.7%). On the contrary literacy rate is less than 50 per cent
among Maring (53.1%), Thadou (57.1%), Kacha Naga (58.7%), and Vaiphui<br />
(59.8%), Statement-3.<br />
SL.<br />
No<br />
Page 3 <strong>of</strong> 5<br />
Source: Office <strong>of</strong> the Registrar General, <strong>India</strong><br />
Statement-3: Literacy among Major STs<br />
Name <strong>of</strong> the Scheduled<br />
Tribe<br />
Total<br />
% <strong>of</strong> Literate<br />
Male Female<br />
1 All Scheduled Tribes 65.9 73.2 58.4<br />
2 Anal 73.9 81.6 66.5<br />
3 Hmar 79.8 84.3 75.2<br />
4 Kabui 63.9 72.5 55.2<br />
5 Kacha Naga 58.7 67.1 50.0<br />
6 Kom 63.9 70.0 57.8<br />
7 Maring 53.1 63.4 42.3<br />
8 Any Mizo (Lushai) tribes 74.0 79.8 68.0<br />
9 Paite 79.0 85.2 72.8<br />
10 Simte 67.3 76.2 58.3<br />
11 Tangkhul 72.7 79.4 65.9<br />
12 Thadou 57.1 64.5 49.6<br />
13 Vaiphui 59.8 67.7 51.7<br />
14 Zou 61.6 70.2 53.0<br />
11. The highest gender gap in literacy has been recorded among Maring. With<br />
63.4 per cent male and 42.3 per cent female literacy, the Maring females are lagging<br />
behind by 21.1 percentage points. The gender gap is the lowest at 9.1 percentage<br />
points among Hmar.<br />
12. In the age group 5-14 years, 69.2 per cent <strong>of</strong> the ST population is attending<br />
schools or any other educational institutions. Of the thirteen major STs, Paite has<br />
recorded the highest 79.9 per cent, closely followed by Tangkhul (77.9%), Hmar<br />
(73.9%), Anal (71.9%), and Kom (71.3%). Thadou (60.5%) has the lowest<br />
percentage attending school in the age group 5-14 years.<br />
13. Of the total ST literates 6.2 per cent are having educational level graduation<br />
and above. The Tangkhul has recorded the highest at 8.2 per cent among the<br />
thirteen main STs in the state, closely followed by Any Mizo (Lushai) tribes (8%). It<br />
is, however, the lowest at 3.6 per cent among Kacha Naga.<br />
Work Participation Rate (WPR)<br />
14. In 2001 <strong>Census</strong>, 44.1 per cent <strong>of</strong> the ST population <strong>of</strong> the state has been<br />
recorded as workers, which is below the aggregated national figure for STs as a<br />
whole (49.1%). Of the total workers, 73.8 per cent have been recorded as main<br />
workers and 26.2 per cent as marginal workers. The female WPR (41.8 per cent) is<br />
lower than male WPR (46.4%). Among female workers 65 per cent have been<br />
recorded as main workers against 81.6 per cent among males.
Statement-4: Distribution <strong>of</strong> Total, Main & Marginal Workers among<br />
STs<br />
T/M/F Total Workers (%<br />
to Total Population)<br />
Page 4 <strong>of</strong> 5<br />
Source: Office <strong>of</strong> the Registrar General, <strong>India</strong><br />
Main Workers (%<br />
to Total Workers)<br />
Marginal<br />
Workers (%<br />
to Total<br />
Workers)<br />
85,631<br />
Total<br />
326,986 (44.1%) 241,355 (73.8%) (26.2%)<br />
Male<br />
31,975<br />
173,688 (46.4%) 141,713 (81.6%) (18.4%)<br />
Female 153,298 (41.8%) 99,642 (65%) 53,656 (35%)<br />
15. Of the thirteen major STs, Maring has recorded the highest WPR at 50.4 per<br />
cent, while it is the lowest among Paite (37.5%).<br />
16. It is significant that among Maring and Kacha Naga the female WPR is higher<br />
than that <strong>of</strong> their male counter parts. On the contrary the gender gap in work<br />
participation is significant among Any Mizo (Lushai) tribes (male 46.2%, female<br />
35.8%), Paite (male 42.4%, female 32.6%) and Anal (male 47.3%, female 38.5%).<br />
Category <strong>of</strong> Workers<br />
17. The STs in Manipur are predominantly cultivators as 69.7 per cent <strong>of</strong> the total<br />
ST main workers have been recorded as ‘cultivators’ and 4.4 per cent ‘agricultural<br />
labourer’.<br />
18. Individual ST wise, among the thirteen major STs, Kacha Naga has recorded<br />
the highest 87.2 per cent <strong>of</strong> main workers as cultivators. It is more than 70 per cent<br />
among Simte (77.2%), Maring (75%), Hmar (74.3%), Thadou (73.6%), and Tangkhul<br />
(71.9%). On the other hand the Paite has recorded the lowest at 50.6 per cent as<br />
cultivators.<br />
Marital Status<br />
19. The distribution <strong>of</strong> ST population by marital status shows that 61 per cent is<br />
never married, 36.1 per cent currently married, 2.5 per cent widowed, and merely 0.5<br />
per cent divorced /separated, Statement-5.<br />
Sl.<br />
No<br />
Statement-5: Marital Status Wise Population among Major STs<br />
Name <strong>of</strong> the Scheduled<br />
Tribe<br />
% to Total Population<br />
Never Currently Widowed Divorced/<br />
married married<br />
Separated<br />
1<br />
All Scheduled Tribes 61 36.1 2.5 0.5<br />
2 Anal 59.2 37.1 2.8 0.9<br />
3 Hmar 59 37.1 2.8 1.2<br />
4 Kabui 61.6 35.3 2.5 0.6<br />
5 Kacha Naga 64.5 33.5 1.6 0.4<br />
6 Kom 57.3 38.4 3.4 0.8<br />
7 Maring 57.7 39.2 2.9 0.2<br />
8 Any Mizo (Lushai) tribes 57.2 38.5 3.5 0.8<br />
9 Paite 59.2 37.3 2.9 0.6<br />
10 Simte 61.1 35.9 2.6 0.3
11 Tangkhul 62.8 34.5 2.3 0.4<br />
12 Thadou 61.3 36.2 2.2 0.4<br />
13 Vaiphui 59.8 37.3 2.5 0.4<br />
14 Zou 60.6 36.2 2.8 0.4<br />
20. Merely 1.3 per cent <strong>of</strong> the ST female population below 18 years – the<br />
minimum legal age for marriage – has been recorded as ever married. The ever<br />
married males below 21 years constitute only 1.2 per cent <strong>of</strong> the total ST population<br />
Of the thirteen major STs, Kabui has recorded the highest percentage <strong>of</strong> ever<br />
married female (1.7%) and male (1.6%) below the legal age at the 2001 <strong>Census</strong>.<br />
Religion<br />
21. The ST population in Mizoram is predominantly Christian. As per 2001<br />
<strong>Census</strong>, <strong>of</strong> the total 741,141 ST population 717,604 are Christians constituting 96.8<br />
per cent. ‘Other religions and persuasions’ account for 1.6 per cent and just one per<br />
cent are Hindus.<br />
Page 5 <strong>of</strong> 5<br />
Source: Office <strong>of</strong> the Registrar General, <strong>India</strong><br />
--------------------------------------