Global Sustainability Perspective magazine - Jones Lang LaSalle
Global Sustainability Perspective magazine - Jones Lang LaSalle
Global Sustainability Perspective magazine - Jones Lang LaSalle

You also want an ePaper? Increase the reach of your titles
YUMPU automatically turns print PDFs into web optimized ePapers that Google loves.
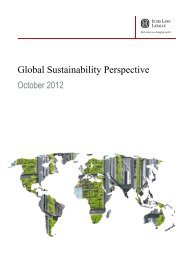
China’s<br />
Five-Year Plan<br />
GLOBAL<br />
SUSTAINABILITY PERSPECTIVE<br />
Half-yearly Magazine | June 2012<br />
Olympian Steps<br />
for <strong>Sustainability</strong><br />
Eco Cities<br />
Urbanization &<br />
<strong>Sustainability</strong><br />
Focus on Asia<br />
Catalysts for Sustainable<br />
Neighborhood Development
<strong>Global</strong> <strong>Sustainability</strong> <strong>Perspective</strong> June 2012 <strong>Jones</strong> <strong>Lang</strong> <strong>LaSalle</strong><br />
GLOBAL<br />
SUSTAINABILITY PERSPECTIVE<br />
Half-yearly Magazine | June 2012<br />
Welcome to <strong>Global</strong> <strong>Sustainability</strong> <strong>Perspective</strong>, a half-yearly publication developed<br />
by executives of <strong>Jones</strong> <strong>Lang</strong> <strong>LaSalle</strong> to highlight real estate energy and sustainability issues<br />
worldwide. You’re holding the first issue to be printed on paper, but our team has been discussing<br />
and writing about global energy and sustainability concerns on a quarterly basis for more than two<br />
years. Our initial goal was to foster a better understanding of what sustainability means around the<br />
world on behalf of our global clients, including international real estate investors and multi-national<br />
corporations. Along the way, we have learned that the discipline of sharing information from around<br />
the world has uncovered ideas and practices that enrich our own knowledge and ultimately make us<br />
all better at what we do.<br />
In this issue we focus on Sustainable Urban Development and look at how the “Eco City” vision is<br />
influencing the way cities are planned, built, lived and worked in. We comment on issues that stem<br />
from thinking about the ultimate goal – built environments that provide environmental, social and<br />
economic quality for today’s and for tomorrow’s citizens and organizations.<br />
As a companion piece, we explore factors that define a sustainable neighborhood within a city and<br />
examine the catalysts which we use with developers, city authorities and investors to model the<br />
performance of these projects and measure their long-term success.<br />
And in another timely feature, we note that planners of the 2012 Summer Olympics in London believe it<br />
will be the greenest Games in history. With a couple of generations of lessons learned, from Montreal’s<br />
Summer Games of 1976 to the 2008 Beijing Olympics, they may well prove to be correct – at least,<br />
until 2016, when Olympics host city Rio de Janeiro plans to take sustainability to even greater lengths.<br />
I hope you find this publication informative and helpful in understanding the complexities and<br />
commonalities of sustainable real estate that we all face in balancing the long-term needs of<br />
society with the immediate needs of commerce and quality of life.<br />
Dan Probst<br />
Chairman, Energy and <strong>Sustainability</strong> Services,<br />
<strong>Jones</strong> <strong>Lang</strong> <strong>LaSalle</strong><br />
Table of Contents<br />
1<br />
Eco Cities<br />
10<br />
Urbanization & <strong>Sustainability</strong><br />
Focus on Asia<br />
20<br />
Australia’s Aggressive<br />
New Green Mandates<br />
28<br />
The City of Light Goes Electric<br />
Is Paris providing the model<br />
for all cities to follow?<br />
2<br />
Olympian Steps<br />
for <strong>Sustainability</strong><br />
12<br />
China’s Five-Year Plan<br />
Banking on sustainability<br />
as a growth engine<br />
22<br />
City Conditions:<br />
What real estate investors<br />
know and don’t know about<br />
climate change<br />
30<br />
LEED’s International Impact<br />
An insider’s view<br />
7<br />
Catalyst for Sustainable<br />
Neighborhood Development<br />
Our model for developers and investors<br />
18<br />
The Growth of Eco Cities<br />
A Chinese perspective<br />
26<br />
Changing U.S. Logistics Patterns<br />
Bode Well for <strong>Sustainability</strong><br />
33<br />
Introducing <strong>Sustainability</strong><br />
Transparency<br />
All Rights Reserved © <strong>Jones</strong> <strong>Lang</strong> <strong>LaSalle</strong> 2012
<strong>Global</strong> <strong>Sustainability</strong> <strong>Perspective</strong><br />
Eco Cities<br />
June 2012<br />
The description “Eco” City has a strong,<br />
optimistic, almost personal ring to it, as it<br />
should have, being derived from the ancient<br />
Greek term oikos meaning a “place to live.”<br />
When Richard Register first coined the term in his 1987 book “Ecocity<br />
Berkeley: Building Cities for a Healthy Future,” most of us would not<br />
have foreseen the extent to which his thinking would eventually come to<br />
influence the development of cities, nor how the changes he advocated<br />
in the way cities are planned, used, lived and worked in would become<br />
such imperatives. And even while the term Eco City may not yet be<br />
wholly, comprehensively or consistently defined it has certainly entered<br />
the mainstream and is used extensively as the backdrop for a wide<br />
range of activities in urban sustainability.<br />
The debate around what constitutes an Eco City has been gathering<br />
momentum since the early nineties. Eco City summits in Montreal,<br />
Istanbul, Shenzhen, Curitiba and others have explored philosophy,<br />
policy and practice, while challenging thinkers like Herbert Giradet and<br />
Mark Roseland have produced an extensive range of literature and<br />
guidance on creating Eco and sustainable cities.<br />
In the last five years or so it has been the likes of the ambitious and<br />
high profile UAE Masdar City and the Sino-Singapore Tianjin Eco-city<br />
which have gained the headlines. These showcase examples are rich<br />
in intelligence around new technologies, innovative urban planning<br />
processes, 21st century mobility, and funding mechanisms. They also<br />
demonstrate the deep challenges of carbon neutrality and of proving<br />
commercial returns.<br />
But while these all inclusive models of urban sustainability are pushed,<br />
pummeled and pressed to prove their durability, a huge range of<br />
cities are testing micro models of Eco district and neighborhood<br />
development. They are embracing in a more local way the core Eco<br />
City principle of minimizing environmental impact and maximizing<br />
social and economic good.<br />
This incremental approach reflects both the difficulties of trying to create a<br />
universal blueprint of the Eco City and the practicalities of large scale<br />
transformation in established cities. What is clear however, is that Eco<br />
City metrics of performance will be as important to the market as the<br />
measurement of the value add of green buildings. Understanding risks,<br />
returns and benchmarking one city against another, will be an important<br />
feature in the Eco City arena. But how can we measure what is not well<br />
4 1<br />
<strong>Jones</strong> <strong>Lang</strong> <strong>LaSalle</strong><br />
defined? This is an uncomfortable question from the purist researchers’<br />
viewpoint, but pragmatism demands that some measures are better than<br />
none and experience tells us that markers in the ground are important.<br />
Companies like Siemens and their Sustainable Cities Index and Mercer with<br />
their Eco City ranking have begun the process of measurement and<br />
comparison. CDP Cities with whom <strong>Jones</strong> <strong>Lang</strong> <strong>LaSalle</strong> is proud to partner<br />
are now delving very deeply into a very wide range of sustainability practices<br />
in cities. Forty-eight cities are now filling in a very detailed questionnaire<br />
about sustainability aspects of governance, strategy, finance, partnerships<br />
and risk awareness amongst many other issues. The results of the survey<br />
give a very clear insight into the different measures of challenge and<br />
progress across cities and the very different routes they are taking<br />
towards a sustainable future.<br />
Our <strong>Global</strong> <strong>Sustainability</strong> <strong>Perspective</strong> comments on many of the issues<br />
that stem from thinking about the ultimate goal – for all cities to be Eco<br />
in the sense of working together towards a built and living environment that<br />
gives environmental, social and economic quality now and protects it for<br />
future generations. We look at the current gaps between the commercial<br />
and city hall views with regards to creating a common approach to instilling<br />
sustainable behaviors and outcomes, at the extensive activity in China, the<br />
injection of major sustainable schemes in the London Olympics and inland<br />
Ports in the USA and at Green City mobility in Paris.<br />
The transformation of our cities will largely be through incremental change,<br />
through the spread of best practice and through assessing and measuring<br />
what works and what is, bluntly, effective and affordable. The likelihood is<br />
that in the next few years this column will be covering the definition of not<br />
just Eco Cities, but how we assess affordability in the light of continuing<br />
environmental and social challenge.<br />
For further information please contact:<br />
Rosemary Feenan<br />
Head of <strong>Global</strong> Research Programmes<br />
Rosemary.Feenan@eu.jll.com
<strong>Global</strong> <strong>Sustainability</strong> <strong>Perspective</strong><br />
Olympian Steps<br />
for <strong>Sustainability</strong><br />
When the torch is lit to launch the 2012 Summer Olympics in London<br />
this July, planners maintain it will be the greenest Games in history. And<br />
with a couple of generations of lessons learned – good and bad – from<br />
previous Olympic efforts, they may well prove to be correct. The trend line<br />
of Olympic Games in recent decades shows a steadily increasing focus on<br />
sustainability as it relates to land use and real estate development. With the<br />
2012 London Olympics right around the corner and Rio de Janeiro already<br />
planning for the 2016 Games, the time is right to look at the evolution of<br />
sustainability as envisioned by Olympic planners – past, present and future.<br />
First, it’s important to understand that “sustainability” in this context means<br />
much more than simply setting up recycling bins around the Olympic<br />
Village and seeking ways to reduce the carbon footprint of the Games.<br />
In its most generic form, it refers to activities that can be sustained<br />
indefinitely. The term is appropriately applied to environmental concerns<br />
as an antidote to non-renewable resources, non-recyclable products,<br />
and pollution of our air and water supplies – all activities that lead to<br />
an ecological dead end. But cities are also concerned with social and<br />
economic sustainability, practices that help ensure the long-term viability<br />
of the region in terms of attracting residents and businesses and enabling<br />
them to thrive. Hosting the Olympics costs a city millions of dollars that<br />
can’t easily be recaptured during the Games themselves; what happens<br />
at the site and across the city after the Games ultimately decides whether<br />
hosting the Olympics was financially worthwhile.<br />
For cities, economic and environmental sustainability in particular are<br />
highly interconnected concepts. Environmental programs to improve air<br />
quality, address climate change threats or plant trees hold direct and<br />
indirect economic benefits, such as promoting public health and helping<br />
to attract environmentally conscious residents and businesses. Land use<br />
and real estate development strategies are also central to both economic<br />
and environmental sustainability, particularly because any large-scale<br />
development will be in place for decades and must be viable from a<br />
financial and ecological standpoint over the long term.<br />
This long-term focus requires Olympic host cities to consider how sites<br />
will be used long after the Games are over. The Olympics places a<br />
spotlight on a city, hopefully to advance its position on the world stage<br />
and help establish sustainable economic growth. But a poorly planned<br />
development that fails to consider what will become of Olympic sites<br />
and buildings after the Games are over can drive a city into debt,<br />
squander economic development opportunities, and potentially damage<br />
its international reputation. Recent Olympic host cities have shown<br />
they understand the stakes by considering the long-term economic and<br />
environmental sustainability of sites in their development plans.<br />
Reining in “bigness”<br />
June 2012<br />
For the first half-century, the Olympic Games were a relatively modest,<br />
if important, sports extravaganza. That began to change with the first<br />
television broadcast of the games outside of the host country in 1956.<br />
Viewership increased exponentially with the first worldwide satellite<br />
broadcast in 1964, and had reached an estimated 600 million during<br />
the Mexico City Summer Olympics of 1968. Increasingly, the whole<br />
world was watching the Olympic Games, and host cities ramped up the<br />
level – and expense – of their spectacle to make a global impression.<br />
Like a spent marathon runner, Olympic “bigness” hit the wall at the<br />
Montreal Summer Games of 1976. The city, flush with success from<br />
its 1967 Montreal Expo – considered one of the most successful<br />
World’s Fairs ever – was eager to expand on its new cosmopolitan<br />
stature with a no-holds-barred financial approach to its Olympic<br />
Games. Mayor Jean Drapeau, who had presided over the wellattended<br />
Expo 67, famously declared that, “The Olympics can no<br />
more lose money than a man can have a baby.” He estimated that<br />
Montreal could stage the games for only $310 million.<br />
To everyone’s shock the eventual cost spiralled to a then-staggering<br />
$1.5 billion, more than $1 billion of which was spent on a new Olympic<br />
Stadium alone. Its complex design was to include the world’s tallest<br />
inclined tower, and the first retractable roof on an outdoor facility.<br />
The overreaching project became an embarrassment: The tower and<br />
retractable roof were not completed until the 1980s; and even then,<br />
the roof performed so poorly that it was removed a decade later. After<br />
the Montreal Expos baseball team left the city in 2004, the 66,000-seat<br />
stadium has been used only sporadically while accruing maintenance<br />
costs, and its debt was not fully repaid until 2006 – 30 years after it<br />
had hosted the Olympic Games.<br />
After a multi-nation Olympic boycott in 1980, Los Angeles hosted the<br />
1984 Summer Games with the clear intent not to fall into Montreal’s<br />
trap. Though “sustainability” was not yet a household word, the city<br />
embraced the re-use concept by using existing facilities, including<br />
the main stadium, which had been originally constructed for the 1932<br />
Summer Games. Only two of the 31 venues were newly constructed,<br />
and those were covered by corporate sponsorships. The Los Angeles<br />
1984 Games are considered among the most financially successful<br />
ever, and a victory for adaptive re-use of facilities such as the Rose<br />
Bowl, which hosted the football (soccer) final.<br />
Toward a greener games<br />
In 1994 the International Olympic Committee added “Environment”<br />
to “Sport” and “Culture” as a guiding principle. As such, the 1996<br />
Summer Games in Atlanta advanced the concept of new Olympic<br />
development from the start with an eye toward a legacy of community<br />
service after the athletes had gone home. For the first time, more than<br />
token consideration was given to sustainable re-use of new Olympic<br />
construction after the Games. The Olympic Village and Centennial<br />
Olympic Park, a major gathering area for spectators and athletes, was<br />
repurposed from a run-down area of the city. Mid-rise dormitories in the<br />
Olympic Village were successfully converted to college student housing<br />
after the Games, and the park is now one of Atlanta’s most-visited<br />
destinations. The 1996 Summer Olympics utilized nearby landmarks<br />
such as the Georgia World Congress Center and Georgia Dome, and<br />
subsequent developments immediately north of Centennial Park,<br />
including Georgia Aquarium and the New World of Coca-Cola, were<br />
made possible by the revitalization of the area due to the Olympics.<br />
Even the newly-built Olympic Stadium, now known as Turner Field, was<br />
designed upfront to be reconfigured after the Games into a new home<br />
for baseball’s Atlanta Braves, with seating reduced by 40 percent to<br />
save maintenance costs.<br />
The 2000 Summer Olympics in Sydney were considered not only a<br />
global coming-out party for the city “down under,” but also a showcase<br />
for world-leading sustainability efforts in Australia. The Games were sited<br />
on a spent riverfront industrial brownfield that had previously housed<br />
brickworks, a slaughterhouse and eight rubbish dumps. The end result<br />
was an Olympic Village that became the world’s largest solar powered<br />
settlement at that time, comprising 2,000 residences with capacity for<br />
5,000 people, all powered by 19,000 solar collectors capable of producing<br />
160,000 kilowatt hours. Many of the competition venues generated<br />
their own clean power as well, and virtually all the main Olympic<br />
sites were served by public transportation, including a ferry service<br />
that was commissioned just before the Games. After the festivities the<br />
site became the Sydney suburb of Newington, with a comprehensive<br />
sustainable plan for its next 30 years of growth.<br />
Beijing raises the bar<br />
2 3<br />
<strong>Jones</strong> <strong>Lang</strong> <strong>LaSalle</strong><br />
In contrast to Sydney’s long time environmental recognition, Beijing won<br />
the competition to host the 2008 Games as one of the most polluted<br />
major cities in the world. Chinese officials promised a green city by the<br />
competition date, and while some have questioned their measurements,<br />
many people were surprised by their genuine progress toward reducing<br />
the city’s carbon footprint. Though the nation definitely used the Beijing<br />
Olympics as a platform to “gain face” as a responsible world power,<br />
China realistically had no choice but to address an environmental<br />
condition that had dramatically worsened during almost 30 years of near<br />
or above double-digit growth in gross domestic product (GDP).<br />
Between 2001 and 2008, an estimated USD $17 billion was directed<br />
toward a series of 20 key environmental improvements such as:<br />
• Extension of public transit from 113 kilometers to 197 kilometers<br />
of track, and building 53 new stations to help reduce the estimated<br />
1,200 cars that were being added to Beijing streets daily.<br />
• Planting a 126-kilometer ring of trees around Beijing to help absorb<br />
surrounding pollen and dust before it enters the city. To help<br />
cleanse air within the city, 720 acres of green space – three times<br />
the size of New York’s Central Park – were cleared and planted with<br />
more than 30 million trees and rosebushes.<br />
• Renewable technologies such as a 130-kilowatt solar array to<br />
light the National Stadium, and a geothermal system deployed for<br />
heating and air conditioning at the Olympic Green Tennis Centre.<br />
Overall, more than 20 percent of all electricity supplied to the<br />
venues came from renewable energy.<br />
• Vehicle emissions standards were raised to a Euro IV level<br />
shortly before the Games.<br />
The number of “blue sky” days – with an Air Pollution Index of 100<br />
or below – rose from fewer than 180 days in 2000 to 274 days in 2008.<br />
Though this measurement raised some skepticism since it was not<br />
verified outside of China, a post-Games report by the United Nations
<strong>Global</strong> <strong>Sustainability</strong> <strong>Perspective</strong><br />
Environment Programme (UNEP) concluded that the air athletes and<br />
spectators in Beijing breathed in August 2008 was much cleaner than in<br />
previous years. Though conceding that weather conditions at the time in<br />
Beijing such as evening showers and wind directions played a helpful role,<br />
city conditions showed reductions of 47 percent in carbon monoxide, 30<br />
percent in volatile organic compounds, 20 percent in particulate matter,<br />
and 14 percent in sulfur dioxide. City authorities also achieved a complete<br />
phase-out of hydrochlorofluorocarbons (HCFCs) 22 years ahead of their<br />
2030 target.<br />
• Waste classification and recycling goals were exceeded by 2 and<br />
5 percent, respectively. Hazardous and medical waste treatment<br />
facilities were expanded and updated, all solid waste was sorted in<br />
venues, and the recycling rate in the Olympic venues was 23 percent<br />
higher than the committed level.<br />
From a development standpoint, from the visually spectacular venues<br />
such as the “Bird’s Nest” National Stadium and Aquatics Center to the<br />
huge Olympic Green park that housed venues and athletes, Olympic sites<br />
are being actively used for sporting events or redeveloped for housing or<br />
other useful purposes. The sustainability of Beijing’s other achievements,<br />
particularly in air quality, are more subject to debate. Researchers from<br />
the World Health Organization found that soot particles smaller than 2.5<br />
microns, which are not subject to Chinese standards, exceeded safe limits<br />
for the entire duration of the Games.<br />
A team of scientists from Oregon State University in the U.S. and Peking<br />
University in China went further in pronouncing the Beijing Games as the<br />
most polluted Olympic event ever, with air contaminant levels two-tofour<br />
times higher than Los Angeles on an average day. Soot levels were<br />
allegedly 3.5 times higher than at the Sydney Games, the cleanest<br />
Summer Olympics of the 21st century. The researchers, who took<br />
samples before, during and after the games and published their findings<br />
in the journal “Environmental Science and Technology,” found pollution<br />
levels about one-third higher than Chinese government officials claimed.<br />
Other critics pointed out that even the air quality increase Beijing achieved<br />
was due in part to “artificial” means such as factory shutdowns and vehicle<br />
use restrictions prior to the games that were not maintained. Even the<br />
relatively benign UNEP report noted that, “there remains significant<br />
room for improvement in Beijing’s air quality.”<br />
On the other hand, questionable as Beijing’s air properties were, its<br />
“before and after” improvement rate was arguably equal to or better<br />
than most other Games. Ultimately, the 2008 Beijing Olympics probably<br />
served as a laboratory for obtaining aggressive sustainable improvements<br />
mandated in China’s more recent Five-Year Plan, rolled out in 2011.<br />
Included in the plan’s national requirements are reduction of carbon<br />
emissions per unit of GDP of 17 percent and an increase in the<br />
percentage of clean fuels in China’s energy consumption mix.<br />
London calling: What’s in store for 2012?<br />
Organizers of the 2012 London Olympics have promised the greenest<br />
Games ever, a guarantee that even the most optimistic Beijing principals<br />
declined to offer. Teaming with worldwide environmental groups such as<br />
the World Wildlife Fund (WWF) and BioRegional, London has created a<br />
“One Planet Olympics” concept to position the world’s premier gathering<br />
June 2012<br />
as a model for global sustainable communities. The plan’s holistic goals<br />
covering energy¸ carbon, water and waste reduction; biodiversity; access<br />
and inclusion; health and employment, include:<br />
• The development of a decentralized energy network using Combined<br />
Heat and Power (CHP) technology. These systems are built around a<br />
network of local infrastructure, taking advantage of efficiencies gained<br />
from producing and consuming energy “locally” — typically saving up to<br />
30 percent when compared to standard national grid-supplied electricity<br />
and individual housing unit heating.<br />
• Use of renewable sources for 20 percent of energy needs. This target<br />
is in jeopardy; Bloomberg Businessweek has reported that due to<br />
unforeseen problems such as an on-site 2-megawatt wind turbine that<br />
was scrapped for safety reasons, the Commission for a Sustainable<br />
London 2012 reduced its renewable energy forecast to 11 percent for<br />
the Games. However, organizers report that through other measures<br />
such as renting instead of buying many infrastructure components<br />
and cutting 969,000 square feet from venue spaces, overall carbon<br />
emission forecasts are about 315,000 metric tons – 20 percent less<br />
than an estimate of two years ago.<br />
One thing is clear:<br />
Regardless of who wins the individual events at<br />
London, Rio and beyond, it seems that the Olympic<br />
Games will permanently encourage a gold medal<br />
performance for sustainability.<br />
• Venues that are being designed to use 40 percent less water,<br />
and athlete housing 30 percent less, than standard. Much of the<br />
improvement will come from a dual system in new buildings with<br />
separate supplies of drinking and recycled water, to assure that<br />
potable water will be used only when necessary.<br />
• Instead of the frequent practice of landfilling contaminated soil – which<br />
only shifts the problem from one spot to another – Olympic authorities<br />
have chosen to clean up all contaminated soil on site, using five soil<br />
washing machines and a bioremediation plant that will clean 1.3<br />
million tons of soil by the time they are finished.<br />
• Reclamation and re-use/recycling of 90 percent of demolition waste<br />
by weight. To date, that goal has been exceeded with a remarkable<br />
98 percent demolition waste reclamation. In addition, 63 percent of<br />
new construction materials have been transported to Olympic Park<br />
by rail or water.<br />
• As part of a pledge to send zero waste to landfill during the Games,<br />
food packaging that cannot be re-used or recycled will be made from<br />
compostable materials such as starch and cellulose-based bioplastics.<br />
After use, many of these materials will be suitable for anaerobic<br />
digestion, enabling them to be converted into renewable energy.<br />
• Making the Olympic Park one of the most nature-friendly Gamesrelated<br />
venues ever, with 45 hectares of wildlife wetland habitat and<br />
675 bird nesting boxes, ensuring that otters, swans, bats and scores<br />
of other wildlife will occupy the same area as athletes and spectators.<br />
In addition, remediation of invasive Japanese knotweed has enabled<br />
more diverse native species to proliferate.<br />
Perhaps the most advanced green thinking applied to the London initiatives<br />
is the concept of not just adapting Olympic Park and sporting venues to post-<br />
Olympic use, but making their sustainable legacy the primary consideration<br />
in all design and planning. Flats built for about 17,000 athletes have been<br />
built specifically to be used after the Games, as are 12,000 additional new<br />
homes surrounding the Olympic Village in Stratford City, an East London<br />
development located close to the city centre on the site of a former railroad<br />
yard. A new legacy shopping centre in Stratford City designed for Olympic<br />
use and beyond is also exemplary in its design, making use of natural<br />
light, effective insulation, high efficiency lighting, heating and cooling, and<br />
control of solar gain to ensure that the buildings are at least 10 percent more<br />
energy efficient than local regulations require. The centre will use a<br />
250,000-square-foot rainwater system for toilet flushing.<br />
4 5<br />
<strong>Jones</strong> <strong>Lang</strong> <strong>LaSalle</strong><br />
In June 2012, <strong>Jones</strong> <strong>Lang</strong> <strong>LaSalle</strong> is also publishing a more in-depth white<br />
paper on the sustainability achievements of the London Olympics and its<br />
impact on the broader industry. When this white paper is published, it will<br />
be made available on the <strong>Global</strong> <strong>Sustainability</strong> <strong>Perspective</strong> website.<br />
Rio and the rainforest<br />
Like London, Rio de Janeiro ran on a strong environmental theme, “Green<br />
Games for a Blue Planet,” to help win hosting of the 2016 Summer Olympic<br />
Games. And as with Beijing, the host nation – in this case, Brazil – will use<br />
the Games to position itself as a first-tier global superpower with the seventhlargest<br />
gross domestic product.<br />
Environmentally, Rio already has some sustainable distinctions from<br />
other Olympic host cities. For one thing, according to the Major Events<br />
International information portal, a whopping 45 percent of Brazil’s energy<br />
already comes from renewable sources. The city’s goal is to power 100<br />
percent of its public transportation with clean biodiesel ethanol by the<br />
Games, and create a network of bike paths connecting all Olympic facilities.<br />
On the downside, according to the Rio 2016 <strong>Sustainability</strong> Management<br />
Plan, as of 2008, only 32 percent of the waste dumped into Rio’s bays<br />
was treated. Officials have set an ambitious goal of 80 percent treated<br />
sewage by the beginning of the Games in 2016. Like Los Angeles and<br />
Atlanta, Rio will “recycle” many existing facilities for key events, including<br />
the opening and closing ceremonies, track and field, football, aquatics,<br />
basketball, volleyball and gymnastics. And like post-millennial Games,<br />
much of the energy for new venues will come from renewable sources.<br />
One of the most dazzling components of the 2016 Rio Games should be its<br />
Olympic Village, a green paradise of flora and fauna meant to emulate the<br />
Amazon rainforest. It remains to be seen whether this verdant park will call<br />
to attention the plight of Brazil’s actual receding rainforest, much as media<br />
attention – and television cameras – in 2008 focused on the continual haze<br />
in Beijing. Some critics have already pointed out that regardless of what<br />
Brazil does at Olympic venues, its greatest sustainable legacy would be<br />
to reverse deforestation of the Amazon jungle, an act considered by many<br />
to affect global climate change. With the eyes of the world on Brazil, the<br />
nation’s leaders may consider strengthening their efforts to preserve<br />
one of the planet’s greatest natural resources.
<strong>Global</strong> <strong>Sustainability</strong> <strong>Perspective</strong><br />
For further information please contact:<br />
Katie Kopec<br />
Director, Development Consulting<br />
Katie.Kopec@eu.jll.com<br />
June 2012<br />
<strong>Jones</strong> <strong>Lang</strong> <strong>LaSalle</strong>’s Olympics track record<br />
<strong>Jones</strong> <strong>Lang</strong> <strong>LaSalle</strong> has a strong track record in advising on<br />
Olympic infrastructure-related projects, particularly in the area<br />
of city regeneration.<br />
For Beijing 2008, <strong>Jones</strong> <strong>Lang</strong> <strong>LaSalle</strong> helped deliver a sustainable legacy<br />
for China. From working with the Chinese government on their Olympic<br />
vision, to contributing to more than 45 million sqare feet of Olympicsrelated<br />
properties, including the “Bird’s Nest” national stadium, the Olympic<br />
Village and International Convention Centre, we helped produce an<br />
unforgettable Games.<br />
Whilst much of our work for the London 2012 Olympics remains confidential<br />
we have been from early on, and continue to be today, key project advisers to<br />
the implementation and policy bodies involved in delivering the games. In<br />
the bidding stage of the Olympics we advised the London Development<br />
Agency and its stakeholder partners on the investment framework for the<br />
Lower Lea Valley (LLV) Regeneration Strategy and from early in the process<br />
we have been involved in a variety of stages for the Olympic stadium,<br />
including a legacy option analysis for the venue. More widely we have also<br />
acted and continue to act as development advisor to a joint venture for the<br />
creation of a “metropolitan centre” for East London at Stratford.<br />
Catalyst for<br />
Sustainable<br />
Neighborhood<br />
Development<br />
Our model for<br />
developers<br />
and investors<br />
6 7<br />
<strong>Jones</strong> <strong>Lang</strong> <strong>LaSalle</strong><br />
The other day, a friend and I were discussing our sustainability “stories.”<br />
Our personal elevator pitches. What was interesting was the commonality:<br />
For both of us these stories involved moving from one neighborhood<br />
to another neighbourhood in our childhoods, and viscerally feeling<br />
the difference. I distinctly remember my 7-year-old self moving from<br />
Germany to the U.K., feeling shocked: “Where are the trams?”; “Why do<br />
I have to be driven to school?”; “Where are the cycle paths?”; “Where is<br />
the recycling?” For my friend, it was noticing social differences in different<br />
neighborhoods in the same city – a lower quality of life felt through an<br />
absence of parks and a lack of beautiful architecture. Neither of us knew<br />
what “sustainability” meant at young ages but both of us sensed the impact<br />
in the neighborhoods and cities where we lived.
<strong>Global</strong> <strong>Sustainability</strong> <strong>Perspective</strong><br />
The global groundswell<br />
As we move incessantly towards urbanization, an increasing amount of<br />
the world’s population is also feeling that impact. It is almost as if there<br />
is a collective global groundswell of understanding of the challenges<br />
of, and interest in, sustainable cities and neighborhoods.<br />
I experience this through the increase in the number of city authorities<br />
and major developers who ask <strong>Jones</strong> <strong>Lang</strong> <strong>LaSalle</strong> about this topic. I<br />
see this through the sheer number of conferences to which I am invited<br />
addressing the topics of Eco Cities, SMART cities, sustainable cities and<br />
low carbon cities around the world.<br />
In response to this global sensibility around the importance of sustainable<br />
cities, <strong>Jones</strong> <strong>Lang</strong> <strong>LaSalle</strong> has been exploring the factors that define a<br />
sustainable city and, on a smaller scale, a sustainable neighborhood within<br />
a city. We have been working with global developers, investors, occupiers<br />
and city authorities to develop our thinking and approach, assessing<br />
the progress made by a number of city developments and regeneration<br />
projects around the world. More recently, we have been actively<br />
exploring the drivers for low carbon investment in cities through<br />
our research partnership with the CDP Cities, as discussed in this<br />
quarter’s <strong>Global</strong> <strong>Sustainability</strong> <strong>Perspective</strong><br />
All of this thinking has led us to create our catalysts for sustainable<br />
neighborhood development.<br />
Catalysts for a sustainable neighborhood<br />
development<br />
These catalysts are criteria that we use with developers and city<br />
authorities to ensure that neighborhood scale developments and<br />
redevelopments are being designed to be successful and sustainable.<br />
They are built on detailed analysis of what makes a sustainable<br />
development at a large scale – and what ensures its success from<br />
master-planning to design, construction and in to operational or legacy<br />
mode. Our model is built to ensure success over at least a 20-year<br />
time horizon, and on a development scale of up to 360 acres or 1.5<br />
million square meters. Its preeminent aim is to make sure that the<br />
aspirations follow through in to real performance improvements.<br />
Catalysts for a sustainable<br />
neighborhood development<br />
1. A vision that is memorable<br />
2. Engagemen that influences design and enables<br />
sustainable outcomes<br />
3. Leadership that thinks long-term<br />
4. A governance structure that works<br />
5. Targets and KPIs that are meaningful<br />
6. Transparent communication of successes and failures<br />
7. Consistent use of sustainability standards and ratings<br />
8. A culture of constant innovation<br />
Let me bring these alive with examples of neighborhood scale<br />
developments that we believe demonstrate the application<br />
of these catalysts around the world.<br />
Catalyst 1 - A vision that is memorable<br />
June 2012<br />
For a developer, embedding sustainability clearly into the vision for<br />
the neighborhood is vital for ensuring that design and project teams<br />
understand what they are expected to achieve. Equally important is<br />
engaging with both the local community and prospective tenants<br />
during the creation of the vision.<br />
As an example of a strong and memorable sustainability vision, Park<br />
20|20 outside Amsterdam bills itself as “the first full service Cradle<br />
to Cradle working environment in The Netherlands.” In Park 20|20 a<br />
unique level of sustainability is created together with a human-centered<br />
design approach to realize the cleanest, most inspiring and productive<br />
working environment to date.<br />
Catalyst 2 - Engagement that influences design<br />
and enables sustainable outcomes<br />
This catalyst recognizes the importance of people and the way that they<br />
behave for driving social and environmental sustainability in a development.<br />
You can design the most aesthetically stunning public realm but if you<br />
forget to consider how the social fabric of the neighborhood will be knitted<br />
together, then the space will become sterile and unused. Similarly, you can<br />
design in the most efficient of environmental technologies but if the users<br />
do not understand how they work, it is liable to lead to an increase in carbon<br />
emissions, rather than a decrease. A project that is tackling this head on<br />
is ProjectZero in Sonderborg, Denmark, which is running an active<br />
Citizen Participation programme including ZEROfamily, where more<br />
than 100 families learned how to save energy and water; ZEROhouse<br />
to help 18,600 private house owners energy retrofit their homes; and a<br />
3-month free testing programme for electric vehicles.<br />
Catalyst 3 - Leadership that thinks long-term<br />
Positively there is an increasing number of examples of long-term thinking<br />
by leaders in city governments and in developers around the world. As<br />
examples, I would point to all the city leaders and developers who<br />
are involved in trialing the Climate Positive Development Programme,<br />
formed by the Clinton Climate Initiative and the C40 group of cities. These<br />
worldwide cities – through specific neighborhood developments – are<br />
aiming to demonstrate that they can grow in ways that reduce the amount<br />
of on-site CO2 emissions to below zero through efficient operations and<br />
investment in community infrastructure and onsite energy production.<br />
A participating city-scale development is Panama Pacifico, Panama.<br />
Catalyst 4 - A governance structure that works<br />
Experience has taught me many times that it is possible to have the<br />
most innovative, exciting and aspirational sustainability vision for a<br />
neighborhood but if you do not put in place the governance structures<br />
– during planning, design, delivery and once the neighborhood is<br />
inhabited and tenanted – then sustainable outcomes will not be<br />
achieved. Furthermore, this governance structure must be clear to all<br />
stakeholders, enabling full engagement. One of the best approaches<br />
I have seen was taken by the London Olympics, one of the first<br />
developments in the world where an auditing body, the Commission<br />
for a Sustainable London, was involved regularly to support robust<br />
and effective sustainability delivery. On the other side of the world, in<br />
Barangaroo, Sydney, Australia, the New South Wales government<br />
created the Barangaroo Delivery Authority to ensure project delivery<br />
in a coordinated and financially responsible manner and is very<br />
transparent about how this governance structure works.<br />
Catalyst 5 - Targets and KPIs that are meaningful<br />
Targets and Key Performance Indicators are the backbone of any<br />
robust approach to sustainability implementation, whether it is for a<br />
local government, a corporation or a development. They should be<br />
selected to drive performance over time and potentially benchmark it<br />
against peer developments. Sonoma Mountain Village, California,<br />
U.S., a $1 billion redevelopment of an 81-hectare ex-industrial site, has<br />
set itself targets aligned to the One Planet Living principles, including an<br />
82 percent reduction in transport emissions, 65% percent of food for the<br />
community to come from within 300 miles and 65 percent reduction in<br />
use of municipal water. It reported in 2011 on how it was doing against<br />
these targets.<br />
Catalyst 6 - Transparent communication<br />
of successes and failures<br />
The London Olympics development is a world-class example of<br />
communicating progress across all development phases and as<br />
responsibility passes from different bodies. This development<br />
is also a leader in realizing how important it is to share both<br />
successes and failures. For example, we know that the Olympic<br />
Delivery Authority has:<br />
• Exceeded by 17 percent its target to deliver 50 percent of<br />
materials by rail or water<br />
• Missed its target of 50 percent fewer carbon emissions and is<br />
instead offsetting by putting over £1 million into energy efficiency<br />
for nearby homes and schools<br />
8 9<br />
<strong>Jones</strong> <strong>Lang</strong> <strong>LaSalle</strong><br />
The Learning Legacy website is a fantastic resource, with numerous case<br />
studies covering topics such as waste and resources management, biodiversity,<br />
health and inclusion, and carbon management. This high level of transparency<br />
means that the techniques, innovations and best practices can be adopted and<br />
replicated within the wider industry.<br />
Catalyst 7 - Consistent use of sustainability<br />
standards and ratings<br />
Exemplary practice here is to take a site-wide commitment to high LEED<br />
or BREEAM ratings on individual buildings and increasingly to use a<br />
neighborhood rating system such as LEED for Neighborhood Development<br />
or BREEAM Communities. One hundred and five developments have<br />
been certified to either the pilot or 2009 version of LEED for Neighborhood<br />
Development. More than 80 percent of those projects are in the U.S., with<br />
the remainder in Canada, China and the U.K. The first major development<br />
to achieve BREEAM Communities with an Excellent Rating is Media City<br />
in Salford Quays, U.K. One of the most significant neighborhood-wide<br />
achievements here was a gas-powered tri-generation plant and district network<br />
that uses water from the Manchester Ship Canal for cooling and is twice as<br />
efficient as traditional grid electricity.<br />
Other sustainability standards are important for other development phases.<br />
In particular, as a best practice, I expect the use of an integrated quality health<br />
and safety and environmental management system by both the developer and<br />
the main contractor, ideally certified to independent standards including ISO<br />
9001, OHSAS 18001 and ISO 14001. Use of these management systems<br />
is particularly important in emerging markets, where the local standards and<br />
expectations as set through legal codes may be lower than international best<br />
practice, and these standards can be a key tool to influence the performance<br />
of the local supply chain.<br />
Catalyst 8 - A culture of constant innovation<br />
A fantastic example of innovation, in terms of vision, visual architecture and<br />
technology supporting this, is Gardens by the Bay in Singapore, which aims<br />
to provide high-end entertainment and education within a sustainable green<br />
infrastructure. The Gardens are being designed to enhance the image of<br />
Singapore as a “Garden City,” including two biomes representing cool dry<br />
conditions of the Mediterranean springtime and the cool moist conditions of<br />
tropical mountain regions. As Singapore has a hot, humid environment, these<br />
biomes are designed to minimize energy demand to exemplar levels and are<br />
controlled with liquid desiccant systems and extraordinary “supertrees.” These<br />
supertrees incorporate photo-voltaics, solar thermal panels and rainwater<br />
harvesting. Further innovations include the installation of a plant that turns<br />
horticultural residue into an active energy supply. It will displace the cost of<br />
imported utility energy and the ash stream from the biomass boiler combustion<br />
creates high-grade compost and concrete aggregates. This design is moving<br />
towards a closed loop system.<br />
For further information please contact:<br />
Sophie Walker<br />
Director, Energy and <strong>Sustainability</strong> Services<br />
Sophie.Walker@eu.jll.com
<strong>Global</strong> <strong>Sustainability</strong> <strong>Perspective</strong><br />
June 2012<br />
As increasing resource constraints and recent legislative policies accelerate the shift to greener<br />
buildings, and the rate of urbanization multiplies adoption into an historic scale, we expect the<br />
next few years will demonstrate the region’s emerging role as the leader in environmentally<br />
Urbanization& sustainable business practice in real estate. As a committed partner to this shift, <strong>Jones</strong> <strong>Lang</strong><br />
<strong>LaSalle</strong> will continue to advise our clients and the community through channels like this<br />
publication on how they can align these trends with their own business strategies.<br />
For further information please contact:<br />
<strong>Sustainability</strong><br />
Peter Hilderson<br />
<strong>Jones</strong> <strong>Lang</strong> <strong>LaSalle</strong>,Asia Pacific, Energy and <strong>Sustainability</strong> Services<br />
Peter.Hilderson@ap.jll.com<br />
10 11<br />
<strong>Jones</strong> <strong>Lang</strong> <strong>LaSalle</strong><br />
Focus on Asia<br />
Our <strong>Global</strong> Chairman of Energy & <strong>Sustainability</strong> Services, Dan Probst, recently spoke about<br />
the trends impacting real estate sustainability practices – improvements in transparency,<br />
consistency in standards, public-private partnerships and growth in solar. Across Asia Pacific,<br />
these industry trends are encountering a set of regional dynamics that are likely to increase the<br />
probability that Asia will soon become the world leader in environmentally sustainable business<br />
practices. The impact on the real estate sector is immense, and is encouraging property<br />
investors and occupiers to fundamentally change the way they approach the procurement of<br />
assets or the acquisition of space.<br />
The region is in the middle of a building boom unprecedented in human history. This<br />
is driven by perhaps the single most seismic change under way, the rapid transition to<br />
urbanization. At present only 40 percent of Asia’s population lives in cities, compared to over<br />
70 percent in most Western countries. As the region develops and the population moves<br />
to the cities for jobs, demand for built space seems insatiable. In China and India alone,<br />
more than a half billion people are expected to move from the countryside to cities by 2050.<br />
Such a rate of development, unless planned correctly, will lead to risks in the quality of that<br />
development and adverse impacts on the environment.<br />
The migration of people to cities, and the growth of companies and industry that follow, will<br />
place a huge strain on the region’s natural resources. The economic and social ramifications<br />
of this resource squeeze have thus far been mitigated by the leaps in “quality of life” stemming<br />
from rapid growth. However, after a decade of development, the equilibrium between<br />
improvement in “quality of life” from economic growth and deterioration in “quality of life” from<br />
unchecked development is shifting. Local communities are becoming increasingly vocal over<br />
the impact on the environment and their “quality of life.” This is leading property developers and<br />
corporates around the region to aggressively improve and market their green credentials to the<br />
point where building certifications will soon be the new “normal” for prime properties.<br />
These threats of mass urbanization and resource constraints are leading Asia into progressive<br />
environmental policy. The pressure is forcing policy makers to view sustainability as a vehicle<br />
for growth rather than a hurdle, encouraging them to leverage proven economic models, such<br />
as caps with trading options, to integrate sustainability into the fundamental underpinnings of the<br />
region. The examples of these initiatives are many. Australia has introduced a carbon tax and<br />
property disclosure requirements; China’s 12th Five-Year Plan is centered around clean tech<br />
industries and carbon trading; and Singapore is mandating green buildings, to name just a few.
<strong>Global</strong> <strong>Sustainability</strong> <strong>Perspective</strong><br />
China’s<br />
Five-Year Plan:<br />
Banking on sustainability as a growth engine<br />
Since 1951, the Chinese government has issued a Five-Year Plan (FYP)<br />
as a strategic guideline for economic and social policy in the upcoming halfdecade.<br />
Though not officially mandatory, FYPs have always been closely<br />
adhered to in shaping subsequent legally binding policy, and they can be<br />
reliably treated as a blueprint for future planning in China.<br />
Priorities have changed dramatically as China’s economic structure has<br />
evolved into a more market-driven “state capitalism” model, and the two<br />
most recent FYPs in 2006 and 2011 have embraced sustainability. While<br />
this is significant in itself for one of the world’s two largest carbon emitters<br />
(the other being the United States), the most recent plan is notable for not<br />
June 2012<br />
only the “what” of its green goals but for the “why.” <strong>Sustainability</strong> is being<br />
viewed not as just an environmental necessity but as one of the most viable<br />
paths to business growth and job creation in the world’s largest nation<br />
– soon to have the world’s largest economy.<br />
This analysis explores the major sustainability goals of the 12th FYP, the<br />
Chinese government’s incentives to meet those objectives, and the impact<br />
on real estate and industry, including greentech, in China and beyond. We<br />
also take a look at Australia, another Pacific Rim country entering 2012 with<br />
some of the world’s most aggressive new green legislation.<br />
Green means “go” in China<br />
12 13<br />
<strong>Jones</strong> <strong>Lang</strong> <strong>LaSalle</strong><br />
For more than 60 years the FYP has been China’s largest policy-making event, generating the country’s<br />
social and economic road map for the next five years. It covers a wide range of social and economic<br />
issues including growth, industrial policy, healthcare, environmental issues and energy. It dictates<br />
“end goals,” and primarily relies on regional and local stakeholder groups to achieve them. The one<br />
constant over the years is that state and local officials who contribute to achieving the FYP priorities are<br />
rewarded with recognition and political advancement, so this makes achieving them a very high priority.<br />
The 2006 FYP ushered in China’s first important strides toward transparent sustainable<br />
measurement and reporting. For the first time, the nation not only reported on but set<br />
aggressive greentech targets to reduce:<br />
• Energy use per unit of GDP<br />
• Water use per unit of value-added industrial output<br />
• Sulfur dioxide emissions<br />
From 2006 to 2010, China exceeded all of those targets except one, achieving 19.1 of a mandated 20<br />
percent reduction in the energy/GDP goal.<br />
The 12th FYP, rolled out in 2011, established new metrics for continued improvement in all of these<br />
areas, but also added specific goals for 2016.<br />
Green targets for 2016 in China’s current FYP (based on 2010 levels)<br />
• Reduction in energy use per unit of GDP: 16 percent<br />
• Reduction of carbon emissions per unit of GDP: 17 percent<br />
• Reduction of water use per unit of value-added industrial output: 30 percent<br />
• Reduction of chemical oxygen demand: 8 percent<br />
• Reduction of sulfur dioxide: 8 percent<br />
• Share of non-fossil fuel in primary energy consumption: 11.4 percent<br />
• Reduction of nitrogen from ammonia and nitrogen oxides: 10 percent<br />
• “Strategic Emerging Industries” as percentage of overall GDP: 8 percent<br />
• Annual energy consumption: 4 billion TCE (Tons Coal Equivalent)<br />
• Reduction of carbon emissions per unit of GDP of 17 percent by<br />
2015 over the 2010 level<br />
• Increased share of non-fossil fuel in primary energy consumption<br />
• Reduction of nitrogen from ammonia and nitrogen oxides<br />
Also included as non-mandatory targets are 8 percent GDP growth for “Strategic Emerging Industries”<br />
(such as cleantech) and annual energy consumption of 4 billion tons of coal equivalent.<br />
Perhaps the most sweeping of the new mandates in the 12th FYP is the carbon reduction<br />
requirement. China’s planning agency, the National Development and Reform Commission,<br />
has informed seven provinces and cities that they need to set emissions caps to prepare for<br />
sustainability measures such as a carbon trading program. Guangdong province, China’s main<br />
manufacturing hub and largest emitter, has already received approval for its own plan, which<br />
exceeds FYP requirements by cutting carbon intensity by 19 percent and increasing non-fossil<br />
fuels to 20 percent of its primary energy mix by 2015.
<strong>Global</strong> <strong>Sustainability</strong> <strong>Perspective</strong><br />
<strong>Sustainability</strong> equals growth in the new China<br />
There are three key themes running through China’s most recent FYP:<br />
1. Economic restructuring:<br />
• Promote a GDP growth rate target of 7 percent<br />
• Move from investment and export-led growth<br />
toward domestic consumption<br />
• Promote the service industry<br />
• Consolidate specific sectors<br />
• Support China’s “Strategic Emerging Industries”<br />
2. Social equality:<br />
• Close the urban/rural divide and promote urbanization<br />
• Support regional development in western and central China<br />
• Close the income gap with higher minimum wages<br />
3. Energy and environment:<br />
• Create more mandatory “green” targets<br />
• Promote industries for energy savings and clean energy<br />
• Set green development indicators to hold local officials accountable<br />
• Expand renewable energy such as hydro, solar, wind and nuclear<br />
Aggressive green goals<br />
China plans to ramp up power generation capacity from its 950 GW 2010<br />
level to 1,350 GW by 2015. In doing so, the FYP calls for a renewable<br />
energy increase during that period from 26.4 percent to 33 percent of<br />
the overall electrical power mix. By comparison, 14.3 percent of overall<br />
power supply in the U.S., the world’s other major consumer, came from<br />
renewables during the first six months of 2011.<br />
Targets for 2015 among China’s three largest<br />
renewable electric power sources include:<br />
Hydro (75 percent of the present renewable mix):<br />
• 57 percent increase in installed capacity from 2010 levels,<br />
from 211 GW to 331 GW<br />
Wind (23 percent of the present renewable mix):<br />
• 200 percent increase in installed capacity from 2010, from 35<br />
GW to 105 GW<br />
• Offshore installations are planned for 15 GW of the new capacity<br />
Solar (1 percent of the present renewable mix):<br />
• 733 percent increase in installed capacity from 2010,<br />
from 0.6 GW to 5 GW capacity<br />
June 2012<br />
China’s Premier, Wen Jiabao, said in 2011: “We can no longer sacrifice the<br />
environment for the sake of rapid development and rash construction.” In<br />
reality, however, the drivers behind the FYP’s embrace of sustainability<br />
reach far deeper than altruism. China needs to create a whopping 25<br />
million new jobs each year to maintain its growth level within its 1.34 billion<br />
population. The nation’s leadership clearly believes that sustainability<br />
and greentech industries are among the most opportunistic routes to that<br />
economic success.<br />
Unlike in some nations, recent years have proven that China’s sustainable<br />
goals are not just “greenwashing” ideals that are ultimately ignored.<br />
During the recent recession, the Chinese government pumped a<br />
massive infusion of cash into state-owned industries, creating a surge in<br />
manufacturing production. By late 2009 leaders realized that this boost<br />
threatened the green goals of the current FYP. In 2010 they ordered<br />
regional authorities to get sustainability numbers back on track, enabling<br />
local leaders with “Iron Fist” authority, such as ordering “brownouts” of<br />
heavy industrial districts. Many factories were forced to close until the<br />
power was turned back on. This dramatic gesture demonstrated that in<br />
the world’s highest producing nation, green growth now trumps unbridled<br />
consumption for future economic strength.<br />
Water has been similarly targeted for sustainable improvement. The current<br />
FYP calls for reducing economic loss from flood by 0.7 percent of GDP;<br />
improving management of water supply and waste water; and controlling<br />
phosphorus, nitrogen, heavy metals and ammonia nitrogen pollution.<br />
Specific water targets include:<br />
Water supply:<br />
• 60 percent water intensity reduction by 2020, and 30 percent<br />
consumption reduction in industry<br />
• 40 billion cubic meters addition to urban water supply capacity,<br />
and 70 percent improvement of large irrigation districts<br />
Waste water:<br />
• Nearly 50 percent more standards by 2015, including more urban<br />
wastewater treatment plants and rural small-scale treatment systems<br />
“What I love about China is that it’s transparent<br />
... you don’t have to guess. You just say: ‘What’s<br />
the next Five-Year Plan? OK, here’s our company<br />
strategy ... here’s where we’re going.’”<br />
Jeffrey Immelt, CEO, General Electric, speaking<br />
at the 2010 Shanghai World Expo<br />
The current FYP also includes<br />
aggressive targets for green<br />
building such as:<br />
• New buildings: A 65 percent reduction in energy<br />
consumption compared to 1980 building stock, an<br />
increase in the number of buildings that qualify for<br />
China’s 3-Star sustainability rating, and a housing<br />
industrialization program<br />
• Retrofits: Secondary energy audits for large urban<br />
public buildings, and continuation of national energy<br />
efficiency programs<br />
While China’s FYP mandates exponential growth for<br />
most renewable energies, it is also slowly putting the<br />
brakes on fossil fuel sources.<br />
The plan calls for differences from<br />
2010 to 2015 including<br />
• 30 percent reduction in total oil consumption and<br />
carbon intensity from new vehicles<br />
• 15 percent emissions reduction and 30 percent lower<br />
energy use for passenger operators such as buses<br />
and taxis<br />
• 20 percent emissions reduction and 12 percent lower<br />
energy use for freight operators such as trucks and<br />
barges<br />
Coal, the backbone of China’s energy supply (at 47 percent<br />
of the world’s total consumption), is not going away anytime<br />
soon. Although its share of the energy mix is mandated<br />
to reduce from 70 percent to 63 percent, consumption is<br />
projected to grow by 18 percent, from 3.2 billion to 3.8 billion<br />
tons. Much of this demand will be met by new generation<br />
“clean coal” plants replacing older ones. The government is<br />
expecte to increase capacity for other conventional energy<br />
forms such as oil and natural gas, and nuclear as well.<br />
Nuclear alone is forecast to increase from 11 GW production<br />
capacity in 2010 to 50 GW by 2015, with the help of a $75<br />
million investment from the United States.<br />
14 15<br />
<strong>Jones</strong> <strong>Lang</strong> <strong>LaSalle</strong>
<strong>Global</strong> <strong>Sustainability</strong> <strong>Perspective</strong><br />
Green pastures for cleantech players<br />
All of this means a huge playing field of opportunity for greentech<br />
manufacturers, energy suppliers and investors. Though many of<br />
the “how tos” of the current FYP are being worked out, the Chinese<br />
government has used a “carrot and stick” approach in recent years<br />
to help achieve its sustainability mandates. It is easier to apply for<br />
loans and purchase land for an industrial development that will run<br />
on renewable energy. And thanks to government tax credits and other<br />
incentives, prices are competitive with – sometimes even lower than<br />
– rates for power from conventional sources. As a result, mandates to<br />
meet FYP goals through required use of renewable energy seem less<br />
onerous because the price is frequently more attractive.<br />
For those wishing to make the most of China’s sustainability drive,<br />
opportunities abound for greentech companies that supply components<br />
and technological expertise for renewable energies, as well as lowercarbon<br />
fossil fuel solutions such as clean coal. Among those cited in the<br />
FYP as ‘Strategic Emerging Industries’ are:<br />
• Energy saving equipment, energy service companies<br />
and recycling providers<br />
• Renewable energies, nuclear and clean coal<br />
• Hybrid and electric vehicles and advanced batteries<br />
• LED lighting and green building materials<br />
• High-speed railway equipment<br />
• Smart grid and smart metering<br />
Understand, though, that the Chinese themselves have given a green<br />
light to domestic renewable energy initiatives such as solar plants and<br />
cell manufacturers, as well as wind farms and windmills over the past<br />
few years, as much of the rest of the world was backing away due to<br />
the recession. By the end of this year, while China is expected to be the<br />
world’s largest consumer of both wind and solar energy, it is also the<br />
largest producer of windmills and solar cells. Other nations entering the<br />
Chinese market may find it tough to establish a foothold, since they will<br />
be jumping on an already-rolling bandwagon.<br />
Foreign companies establishing plants or offices in China will<br />
have to be as sustainable as their domestic Chinese counterparts.<br />
Offshore organizations that don’t align their operations with the FYP<br />
can expect hostile local authorities, expensive and possibly scarce<br />
energy resources, and competition that will crowd them out by<br />
toeing the government’s line.<br />
For further information please contact:<br />
Parker White<br />
Greater China Head of Energy and <strong>Sustainability</strong><br />
Services parker.white@ap.jll.com<br />
Breaching China’s great green wall:<br />
what foreign companies can expect<br />
June 2012<br />
Whether you’re already manufacturing or marketing in China, or preparing<br />
to venture into the nation for the first time, here’s what you will encounter<br />
as a result of the 12th FYP:<br />
• China is probably the world’s greatest market for greentech products,<br />
technology and services. By the end of this year, the Chinese will be<br />
the largest consumers of wind and solar energy. Among fossil fuels,<br />
clean coal will be in demand.<br />
• Competition for this market will be intense from the Chinese themselves,<br />
who ramped up their cleantech capability as many other nations held<br />
back during the recession. China is the largest producer of windmills and<br />
solar cells, and foreign competitors for these and many other cleantech<br />
products will find it challenging to beat their price points. Some of the<br />
best opportunities for overseas firms may be in transfers of sophisticated<br />
green technologies, or specialized expertise in areas the Chinese will<br />
need, such as offshore wind farms and utility-scale solar.<br />
• When trying to align a China strategy for real estate with the prevailing<br />
national trends, the FYP should be the primary source for setting strategy<br />
at the highest level. Narrowing that strategy down into a portfolio or<br />
asset level or generating specific, actionable tactics can be much more<br />
difficult without clear visibility of the intricate and unique rollouts of<br />
the FYP at the ministerial, provincial, and even district level. Investors<br />
and occupiers aligning with the FYP can mitigate the risk of missed<br />
government incentive by establishing public-private partnerships<br />
with local government ministries. With support from professionals<br />
who have proven, on-the-ground track records of working with<br />
local governments and capturing national subsidies, creating such<br />
partnerships and necessary visibility can ensure the FYP is a tool for<br />
increasing competitive advantage rather than a bureaucratic obstacle.<br />
• Foreign companies opening manufacturing or other operations in<br />
China will likely find environmental standards for emissions tougher<br />
than those in most other locations. And there is rarely much “wiggle<br />
room”: Companies must comply or face stiff penalties, even potential<br />
cutbacks in power supply. The good news is that China is ahead<br />
of the curve on bringing down the cost of renewable energy and,<br />
with support from government initiatives, clean power should be<br />
competitively priced in coming years. There should be some carbontrading<br />
opportunities as well.<br />
• For new industrial plants and other foreign-driven developments<br />
in China, the greener the better as far as applying for loans,<br />
purchasing land, even getting basic cooperation from regional<br />
and local authorities. A plan for a sustainable facility running on<br />
clean energy will likely pass through Chinese bureaucracy much<br />
quicker than one that is not.<br />
16 17<br />
<strong>Jones</strong> <strong>Lang</strong> <strong>LaSalle</strong><br />
Not easily replicable, but not to be ignored<br />
China’s 12th FYP is “game on” for most A-list global sustainability<br />
initiatives, including carbon taxation; improved building standards and<br />
requirements; mandates for energy efficiency; several government<br />
incentives for solar, wind and geothermal power; and better access to<br />
grid connectivity. Why doesn’t the rest of the world just fall in line?<br />
For one thing, democracy, and the dissent inevitably accompanying it,<br />
creates an obstacle for Western powers such as the U.S. and Europe.<br />
As New York Times columnist Thomas Friedman notes in his book “Hot,<br />
Flat and Crowded,” an important advantage is “the ability of China’s<br />
current generation of leaders – if they want – to cut through all their<br />
legacy industries, all the pleading special interests, all the bureaucratic<br />
obstacles, all the worries of a voter backlash, and simply order top-down<br />
the sweeping changes in prices, regulations, standards, education, and<br />
infrastructure that reflect China’s long-term strategic national interests<br />
– changes that would normally take Western democracies years or<br />
decades to debate and implement.” Add to that leverage the fact that the<br />
Chinese government controls its national flow of capital more directly<br />
than any other major power in the world, and the nation’s fairly short<br />
history of capitalism makes it less tradition-bound and more nimble than<br />
its Western counterparts.<br />
It is true that most of the world’s economic leaders cannot mandate broad<br />
sustainable gains with the unequivocal alacrity of the Chinese. That doesn’t<br />
mean that the nation and its mandates shouldn’t be held up as a model<br />
for linking sustainability to economic growth, a major goal of virtually all<br />
industrialized nations. At the very least, China should be closely watched as<br />
a laboratory to see how well a green economic machine can work.
<strong>Global</strong> <strong>Sustainability</strong> <strong>Perspective</strong><br />
The Growth of<br />
Eco Cities<br />
A Chinese perspective<br />
June 2012<br />
Interview with Parker White, Greater<br />
China Head of Energy and <strong>Sustainability</strong><br />
Services, <strong>Jones</strong> <strong>Lang</strong> <strong>LaSalle</strong><br />
How would you define an Eco City?<br />
It is very difficult to define what an Eco City is, because you have so<br />
many different variables at play with a city. It becomes very regional in<br />
terms of defining specific parameters. I think you would end up falling<br />
back on the general definition for sustainable development, which is<br />
to leverage your existing resources today without sacrificing future<br />
resources for generations tomorrow.<br />
Are there any overall standards for these Eco Cities?<br />
There are emerging standards, and specifically within China the<br />
framework for that has really been the 12th Five-Year Plan, which<br />
has refined further what government has already been doing with<br />
Eco Cities. It’s very much like a building process, what was an Eco City<br />
yesterday is not an Eco City today.<br />
Who actually comes up with the idea for an Eco<br />
City? Is it pitched? Or do the governments go to<br />
someone to do it?<br />
There’s no one size fits all in China, and there very rarely is for any<br />
major economic policy. China is famous for the approach of letting the<br />
different districts and regions work for themselves and seeing which<br />
system works out the best. In some cases the mayor of a city may have<br />
a development in place and chooses to set environmental parameters<br />
around that development.<br />
What about the financing here for these cities?<br />
Just like any other real estate development project, it’s entirely contingent<br />
on the type of development. If you were to look at the <strong>Lang</strong>fang Eco City,<br />
south of Beijing, this was a private developer, so he was driving that.<br />
Compare it to the Hongqiao transportation hub – that’s the Shanghai<br />
Airport Authority. That’s very much a government entity, and they were<br />
driving this project at a district level.<br />
18 19<br />
<strong>Jones</strong> <strong>Lang</strong> <strong>LaSalle</strong><br />
So investors vary, as well, depending on the project?<br />
In Tianjin, for example, you have the Chinese government, the Tianjin<br />
government and the Singapore government coming together as a<br />
partnership. They did all the master planning work. Then they sold<br />
off the plots of land within the community to individual developers. So<br />
that means you have a lot of stakeholders involved. You have got the<br />
initial investment in the form of land coming from the government, the<br />
subsequent investment coming from developers buying the land and<br />
constructing the buildings, and you have the integrated master plan that<br />
comes from the front end with the government as the primary driver.<br />
What opportunities are there for foreign developers<br />
and contractors?<br />
We spend most of our time connecting the right solution providers<br />
to the right consumers, and with what we’ve seen, there’s no shortage<br />
of demand in this market for best practice. If anything, there’s a<br />
shortage of suppliers. It’s an ever-growing market because it needs<br />
to be. As long as the need for development continues, there will<br />
continue to be a need for solution providers.<br />
As far as these Eco Cities go, are governments<br />
addressing that after these Eco Cities are built,<br />
people may not want to live there?<br />
The first test of development is to go through a financial feasibility<br />
assessment. If it is financially feasible, it means that there is a natural<br />
demand; and that’s always a first consideration: Is there a natural<br />
demand for this? A lot of times it’s years and years of pent up demand.<br />
As people migrate to jobs, there’s new demand.
<strong>Global</strong> <strong>Sustainability</strong> <strong>Perspective</strong><br />
Australia’s<br />
Aggressive New Green Mandates<br />
China isn’t the only Pacific Rim nation with a government bullish on<br />
sustainability. Australia enters 2012 with tough new green mandates<br />
of its own. Among them, beginning in July 2012, is a carbon tax of<br />
$23 (Australian) per metric ton on about 500 companies accounting for<br />
about 60 percent of the nation’s greenhouse gas emissions. Most of the<br />
companies subject to the tax are producers of non-renewable fuels such<br />
as coal, oil and natural gas; power companies that rely heavily on fossil<br />
sources; and members of industries emitting high carbon levels in<br />
production such as steel, cement and aluminum. Few commercial<br />
properties such as office buildings, which account for only about 10 percent<br />
of Australia’s carbon emissions, should be directly subject to the tax.<br />
While “the jury is still out” on the full impact of the carbon tax on<br />
commercial portfolios, here are some likely scenarios:<br />
• Cost of building supplies such as cement and steel could rise 2 to<br />
5 percent at the source, but expected government assistance to<br />
polluters in their efforts to become more sustainable should reduce<br />
that impact to an actual price increase of about 0.5 percent or less<br />
for new construction and renovations.<br />
June 2012<br />
• After a decline in real expense for the past 50 years, electricity<br />
costs will rise for most commercial users as energy companies<br />
invest in green production technologies. For example, in 2011<br />
electricity generated from wind farms cost approximately $100 to<br />
$125 per megawatt-hour (MWh), while existing coal-fired generation<br />
cost approximately $30 to $40 per MWh. This disparity will decline<br />
steadily with increases in renewable production efficiencies and<br />
potential government subsidy increases, but expect to see higher<br />
electricity costs in the near term.<br />
• As with all cost increases, investors and landlords that provide some<br />
or all of utilities in their leases will have to determine whether to absorb<br />
them or, most likely, pass them on to tenants. Tenants paying their<br />
own utility costs will have increased motivation to seek energy-efficient<br />
buildings where their expenses will be lower.<br />
Another measure that will directly impact office stakeholders will be<br />
Australia’s Commercial Building Disclosure (CBD) program, which went<br />
into full effect at the end of 2011. CBD requires the disclosure of a Building<br />
Energy Efficiency Certificate (BEEC) during the sale, lease or sub-lease<br />
of commercial office space greater than 2,000 square meters.<br />
The BEEC must include:<br />
• A NABERS Energy rating, Australia’s efficiency measurement that<br />
awards buildings between 0 and 6 stars in half-star increments<br />
• A tenancy lighting assessment that provides a nominal lighting power<br />
density measurement in watts per square meter, and grades the result<br />
on a scale of excellent to poor<br />
• General energy efficiency guidance not specific to the disclosureaffected<br />
area<br />
The NABERS rating system – comparable to ENERGY STAR in the<br />
US – has already been implemented in many Australian office buildings.<br />
The new requirement will not only make it mandatory, but will strengthen<br />
the role of sustainability in commercial property transactions. Potential<br />
buyers and lessees can now determine at a glance how buildings<br />
compare in energy efficiency. Though owners are not required to reach<br />
a particular NABERS level, highly rated buildings already use their<br />
achievement as a marketing tool, while those that disregard it, do so at<br />
their peril. At this early stage, CBD seems to be affecting leasing more<br />
20 21<br />
<strong>Jones</strong> <strong>Lang</strong> <strong>LaSalle</strong><br />
than sales transactions, but as NABERS triggers full energy efficiency<br />
transparency in buildings, it is expected to be a larger consideration in<br />
all office deals.<br />
CBD will complement Australia’s Green Star measurement system<br />
for new buildings (comparable to LEED in the U.S.), but is forecast to<br />
have an even greater impact since only about 2 percent of the nation’s<br />
building stock is replaced each year. Like China, Australian businesses<br />
and investors have, for the most part, supported the majority of the<br />
nation’s sustainable measures to position Australia among the leaders<br />
on many global green indexes.<br />
For further information please contact:<br />
Joel Quintal<br />
Director of <strong>Sustainability</strong>, Australia<br />
joel.quintal@ap.jll.com
<strong>Global</strong> <strong>Sustainability</strong> <strong>Perspective</strong><br />
City Conditions<br />
What real estate investors know and<br />
don’t know about climate change<br />
The power of cities: understanding<br />
their significance<br />
Cities hold a pivotal role in achieving a sustainable future. You don’t agree?<br />
Let’s start with a few facts: Cities consume approximately 60 percent<br />
to 80 percent of the world’s primary energy production. They occupy<br />
only 2 percent of the world’s land surfaces, but are home to more than<br />
50 percent of the world’s population. And if you are not convinced yet,<br />
estimates show that urban areas could be responsible for up to 80<br />
percent of total greenhouse gas emissions.<br />
According to “The Case for City Disclosure,” a report jointly authored by<br />
the Carbon Disclosure Project (CDP) and Accenture, this is a challenge<br />
cities are willing to take, as they are “well placed to act quickly and<br />
June 2012<br />
effectively to combat climate change and its effect.” But does the right<br />
information exist for investors to make informed decisions at the citylevel?<br />
Do city leaders truly understand the impacts and sources of their<br />
highest emitting activities?<br />
We think cities and the investment community are still trying to come to<br />
terms with the necessary information, which is why <strong>Jones</strong> <strong>Lang</strong> <strong>LaSalle</strong><br />
and CDP Cities are publishing a series of research snapshots on the<br />
implications of city climate change data for investors and businesses,<br />
focusing on the real estate sector.<br />
“New York is concerned<br />
about the quality of the<br />
building and its impact<br />
on the environment. In<br />
Sao Paulo, there is not<br />
the same level of concern<br />
yet. So one needs to ask<br />
‘what’s the difference?’<br />
The difference is the city.”<br />
Fabio Maceira (Sao Paulo)<br />
Large World Cities (ranked by 2010 GDP)<br />
22 23<br />
Cities<br />
New York<br />
Paris<br />
Moscow<br />
London<br />
Shanghai<br />
Sao Paulo<br />
Delhi<br />
Sydney<br />
Tianjin<br />
Johannesburg<br />
Dubai<br />
Country<br />
United States<br />
France<br />
Russia<br />
United Kingdom<br />
China<br />
Brazil<br />
India<br />
Australia<br />
China<br />
South Africa<br />
UAE<br />
* PPP = Purchasing Power Parity adjusted values<br />
** Some stock figures relate to Grade A only<br />
*** These are Prime Office Rents<br />
Source: <strong>Jones</strong> <strong>Lang</strong> <strong>LaSalle</strong><br />
City GDP 2010<br />
US$ PPP* in billions<br />
1,206<br />
618<br />
547<br />
491<br />
355<br />
348<br />
222<br />
174<br />
148<br />
144<br />
67<br />
<strong>Jones</strong> <strong>Lang</strong> <strong>LaSalle</strong><br />
This article is our first research snapshot, revealing our findings to date<br />
and the future direction of our collaborative research. It also features<br />
quotes from interviews with our own local expert panel around the world.<br />
Cities are significant: New York City’s 2010 GDP is roughly equivalent<br />
to Korea’s, Mexico’s or Australia’s GDP. The economic scale and<br />
impact of cities is great and growing relative to national GDPs in many<br />
cases. This is evident in the eleven cities around the world seen in the<br />
chart below, taken from data held by <strong>Jones</strong> <strong>Lang</strong> <strong>LaSalle</strong> as part of its<br />
World Winning Cities database of 660 cities. But there’s still progress<br />
to be made around cities’ abilities to enable attractive investment<br />
conditions through meaningful information.<br />
Investment Volumes<br />
US$ in billions<br />
34<br />
27<br />
8<br />
46<br />
11<br />
3<br />
0<br />
8<br />
na<br />
na<br />
0<br />
Office Stock**<br />
Millions m2<br />
58<br />
52<br />
13<br />
33<br />
4<br />
3<br />
5<br />
9<br />
0<br />
8<br />
6<br />
Office Rents**<br />
US$/m2/pa<br />
771<br />
1,094<br />
1,200<br />
1,636<br />
751<br />
881<br />
443<br />
484<br />
230<br />
320<br />
439<br />
Vacancy<br />
In %<br />
10.5<br />
6.8<br />
16.5<br />
5.4<br />
11.9<br />
11.9<br />
17<br />
8.8<br />
28.7<br />
9.8<br />
45.0
<strong>Global</strong> <strong>Sustainability</strong> <strong>Perspective</strong><br />
Shedding light on the ideal conditions:<br />
what we’ve found so far<br />
Due to this current state of play – the fact that cities hold a lot of<br />
significance, but do not provide investors with robust and detailed<br />
information – we have endeavoured to better understand the levers<br />
required for cities to increase economic competiveness, including<br />
how climate change data impacts investment in real estate. We are<br />
addressing the following through our research: firstly, what creates<br />
attractive urban investment conditions; secondly, what is the role<br />
of a city government in creating these attractive urban investment<br />
conditions; thirdly, how climate change will impact the value of real<br />
estate investments; and finally, what is the role of climate change data<br />
in enabling decisions at the city level.<br />
To shape our initial findings, we conducted 13 interviews across the 11<br />
cities listed in the chart on the previous page with <strong>Jones</strong> <strong>Lang</strong> <strong>LaSalle</strong><br />
experts who were asked to reflect on their view of the market and<br />
externalities. We also carried out a series of brainstorming workshops<br />
to facilitate conclusions and to conduct a global review of our experts’<br />
insights.<br />
Outcomes to date reveal five main themes:<br />
• Short-term vs. long-term investment outlooks: Unsurprisingly, climate<br />
change is not currently front-of-mind for real estate investors, as most<br />
investment horizons are three-to-five years, whereas climate risk is<br />
perceived to be on a 25+ year horizon. Investors consider anything<br />
that is cost-related in the short-term; and outside of energy costs,<br />
climate change is perceived to pose little to no known short-term costs.<br />
Platforms such as CDP Cities, which provide annual self-reported risk<br />
assessments, have the potential to reduce this investor myopia. In<br />
particular, CDP Cities can provide current snapshots of city risk and<br />
can help accelerate the time lapse as we move towards an undefined<br />
tipping point in investor perception.<br />
“I think most people know climate change is a real risk, but I also think<br />
it is human nature to not respond practically to long-term risk. It’s the<br />
same reason people ignore the long-term consequences of smoking.”<br />
— Dana Schneider (New York City)<br />
• Challenges of key city “actors”: There is a gap between the data<br />
investors have access to and the data investors need to make<br />
informed, long-term decisions and to understand climate change<br />
risks. Equally, city incentives, such as tax deductions or incentives<br />
based on a location decision, are rare in relation to low carbon real<br />
estate investment. Thus, city representatives and policies seldom<br />
influence investor behavior by rewarding them for considering<br />
climate change as a primary criterion. Additionally, we found that<br />
cities could appeal directly to investors through better marketing of<br />
their sustainability initiatives.<br />
“In terms of attractiveness, governance is absolutely critical. Having<br />
a ‘go to person’ in a strong position of power is vital to encourage the<br />
flow of real estate investment.”<br />
–Lee Elliott (London)<br />
June 2012<br />
• Established cities vs. growth cities: Different factors should be<br />
considered depending on the maturity of the market, which is one<br />
of the key aspects an investor considers, given varying drivers and<br />
priorities related to economic progression. For example, growth cities<br />
offer significantly higher margins than established cities. Therefore,<br />
investment in growth cities is less likely to be driven by criteria such as<br />
environmental regulation, governance and labor markets.<br />
“That’s the challenge: basic information that is readily available in other<br />
global cities is still not readily available in India.”<br />
— Deepak Bhavsar (New Delhi)<br />
• Transparency: Investors look for good economic growth prospects,<br />
robust governance, sufficient labor, regulatory incentives and solid<br />
infrastructure as a few examples of criteria that create attractive<br />
urban investment conditions. We found that roughly half the cities<br />
in our study do not effectively and openly communicate the status of<br />
these conditions. Thus, markets lack the transparency necessary for<br />
investors to make informed decisions. City governments must enable<br />
more comprehensive and more readily available information, thereby<br />
increasing the attractiveness of the urban landscape.<br />
“There is a general lack of transparency in Shanghai’s market – it is<br />
improving and has been improving for years – but if you look at <strong>Jones</strong><br />
<strong>Lang</strong> <strong>LaSalle</strong>’s <strong>Global</strong> Real Estate Transparency Index (the 2012 Index<br />
will be released in June), it is one of the most important aspects for<br />
investors. Transparency applies to sustainability just like any other<br />
metric you are trying to measure.”<br />
— Parker White (Shanghai)<br />
• City level indicators: The Financial Times recently concluded: “<strong>Global</strong><br />
investors usually think in terms of countries. They should be paying<br />
more attention to cities.” For years, investors have paid careful attention<br />
to the actions of national governments to determine if their investments<br />
will remain safe and remunerative. As the world urbanizes, however,<br />
city governments are also playing an increasing role in creating lowcarbon,<br />
climate-safe communities that are attractive places to invest.<br />
The investment community must better understand the role of the local<br />
government in minimizing risk and maximizing investment opportunity<br />
in cities.This is true of all data, not just sustainability data.<br />
“Defining a new indicator for investors won’t make them change<br />
their behavior in a fundamental way. I think if we want behavior to<br />
change, the legal approach has to be more constrictive by saying,<br />
for example, ‘buildings have to enhance performance on item x by<br />
y percent.’This, in conjunction with a shift in occupiers’ demands for<br />
green buildings that cause investors to adapt accordingly, will lead to<br />
progressive changes.”<br />
— Virginie Houzé (Paris)<br />
Collectively, these five themes set the stage for defining the ideal<br />
scenario to enable sustainable investment in cities.<br />
Next steps: how we will shift the debate<br />
and enable action<br />
Now that we have an understanding of the challenges for investors<br />
and businesses, what’s our plan? We will take a collaborative, multistakeholder<br />
approach to more precisely express the barriers and the<br />
potential solutions. Our aim is to define the ideal scenario for enabling<br />
sustainable investment in cities, which will be brought to life through<br />
10 conditions. Our resulting recommendations are intended to shift the<br />
debate and to move from the current state to the necessary threshold<br />
for low-carbon, sustainable cities. We are aiming to publish the results<br />
of this endeavor jointly with CDP Cities later in 2012.<br />
Progress by cities to date: a special<br />
preview of 2012 CDP Cities report findings<br />
CDP Cities hosts disclosure from 73 cities and local governments this<br />
year – up from 48 last year – from all corners of the globe. Participants<br />
range in size from the city of Tokyo, with a population of 13 million, to the<br />
village of Kadiovacik in Turkey, with a population of 216.<br />
For further information please contact:<br />
Sarah Nicholls<br />
<strong>Jones</strong> <strong>Lang</strong> <strong>LaSalle</strong><br />
Sarah.Nicholls@eu.jll.com<br />
Conor Riffle<br />
CDP Cities Project<br />
24 25<br />
<strong>Jones</strong> <strong>Lang</strong> <strong>LaSalle</strong><br />
The CDP Cities report findings will show:<br />
• Reducing citywide emissions through actions related to energy<br />
demand in buildings is a key area for private sector involvement.<br />
Although cities are for the most part relying on their own budgets<br />
to finance emissions reduction projects, actions related to reducing<br />
emissions from energy demand in buildings show high utilization<br />
rates of outside or private funding sources.<br />
• Planning and construction of the built environment is a key area for<br />
cities’ adaptation and resilience strategies. A large number of the<br />
adaptation actions reported by cities fall under this important category.<br />
The full report will be released 7 June 2012 on the CDP Cities website.
<strong>Global</strong> <strong>Sustainability</strong> <strong>Perspective</strong><br />
Changing U.S. Logistics Patterns<br />
Bode Well For <strong>Sustainability</strong><br />
Inland Port Connections<br />
USA-Canada-Mexico<br />
Due to increasing demand for speed to market at minimum cost –<br />
particularly in retail and most especially for the booming e-commerce<br />
segment – shipping procedures are changing at major U.S. seaports and<br />
inland logistics hubs. And though the evolving supply chain efficiencies<br />
are driven more by savings and speed than by sustainability, the results<br />
are greening U.S. commercial transportation as well. Trends that provide<br />
environmental as well as economic benefits include:<br />
• More trains, fewer trucks by comparison: The economics of<br />
American long- and short-haul rail shipping are steadily improving.<br />
Railroads have made major financial commitments to infrastructure<br />
and terminal overhauls, as well as service, in recent years.<br />
Though trucking still accounts for more than 70 percent of U.S.<br />
freight shipments according to the American Trucking Association,<br />
the fastest growing mode of transportation has been intermodal.<br />
According to the U.S. Bureau of Transportation Statistics, over 440<br />
billion rail freight revenue ton miles were recorded for Q1 2012,<br />
22 percent above that shipped during the same period three years<br />
June 2012<br />
ago. This is good news since rail is a far more sustainable mode of<br />
transportation – producing up to 10 times fewer carbon emissions<br />
per ton-kilometer than trucking, according to a recent University<br />
of California-Berkeley research report on Transport and Carbon<br />
Emissions in the United States.<br />
Rail and intermodal transportation will likely continue to increase<br />
in popularity as rail’s economies of scale continue to improve with<br />
rising fuel costs. Union Pacific, for example, expanded its intermodal<br />
volume about 20 percent between 2009 and 2010. Rail’s biggest<br />
inroads are expected in shipments of less than 500 miles, where<br />
trucking has traditionally been considered more competitive.<br />
• The rise of “inland ports”: Economic and efficiency gains in<br />
U.S. railroads are well timed as a means of helping to relieve<br />
increasing congestion at U.S. seaports. Increasingly, inbound<br />
cargo from overseas will be transferred directly from an ocean<br />
vessel to railcars and then transported to an inland location, away<br />
from the more congested port itself, for further processing and<br />
distribution. These inland locations, or intermodal centers, serve<br />
as “inland ports,” with some handling as much cargo volumes<br />
as their coastal counterparts.<br />
Inland ports act as an integrated component to U.S. port systems,<br />
creating a logistics “barbell.” With port systems growing in size<br />
and capacity, the inland port provides the counterbalance, with<br />
the two ends connected by a dedicated rail line, originating ondock<br />
at the container terminals with direct access to the inland<br />
port destination. In such fashion, the inland hub provides the<br />
means for ocean cargo to pass through the waterfront terminals<br />
more quickly and more cost effectively, literally “clearing the<br />
decks” for the arrival of the next vessel.<br />
Conclusion: Less shipping pain is sustainability’s gain: What does all this<br />
mean for sustainability? Besides an increase in more environmentallyfriendly<br />
rail transportation, many inland ports are less established than<br />
their coastal counterparts that have been around for decades, even<br />
centuries. Inland ports can be designed from a comparatively clean slate,<br />
incorporating green technologies and practices ranging from renewable<br />
power and water conservation to site plans that preserve natural habitat.<br />
Even when sustainability isn’t in the forefront of American logistical<br />
planning – which is often the case – one thing is clear: The changes<br />
afoot to streamline distribution patterns within the world’s largest<br />
consumer economy should make the U.S. a greener country, as well.<br />
For further information please contact:<br />
Aaron L. Ahlburn<br />
Vice President, Americas Director of<br />
Research, Industrial & Retail,<br />
aaron.ahlburn@am.jll.com<br />
26 27<br />
<strong>Jones</strong> <strong>Lang</strong> <strong>LaSalle</strong><br />
About 40 miles from Chicago, bordered by a BNSF<br />
main railroad on one side and Interstate 55, a major<br />
highway, on the other, is possibly America’s most<br />
sustainable inland port. The RidgePort Logistics Center<br />
contains 14 million square feet of buildings ranging from<br />
200,000 square feet to 2 million square feet, but equally<br />
impressive are environmental benefits such as:<br />
• Almost one-third of the land area set aside for natural habitat<br />
• Wastewater filtration using four different green technologies<br />
• A required tenant composting program, with the end result<br />
used in site planting and landscaping projects<br />
• Plans to construct a limestone mine 200 feet under the<br />
property for aggregate stone used for roads and buildings; this<br />
is expected to eliminate truck trips using 540,000 gallons of<br />
fuel and prevent 10,476,000 pounds of CO2 emissions<br />
• Best management practices to minimize storm water impact<br />
• Solar and wind energy generation<br />
• A sustainable tree farm
<strong>Global</strong> <strong>Sustainability</strong> <strong>Perspective</strong><br />
The<br />
City of Light<br />
In the last few years, rising oil prices and increasing awareness<br />
of environmental challenges have caused the re-emergence of car<br />
sharing initiatives in large cities throughout the world. In 2008, the car<br />
manufacturer Daimler launched Car2Go, the first car sharing program<br />
that allowed customers to leave the car in any available public parking<br />
space. The program was implemented in cities in Germany, the U.S.<br />
and Canada with gasoline versions of Smart Fortwo cars, and at the end of<br />
2011 two fleets of 300 electric vehicles (EV) were launched in Amsterdam<br />
and San Diego, as a test for large scale electric vehicle car sharing.<br />
The example of Paris<br />
Goes Electric<br />
After the successful introduction of its public bicycle sharing program in<br />
Paris in 2007, with more than 20,000 bicycles and 1,800 renting stations,<br />
the City of Paris decided to mark a significant milestone in December<br />
2011 when the Autolib’ electric vehicle car sharing program was started.<br />
The goal to be reached before 2014 is to have 3,000 EVs available. The<br />
June 2012<br />
car sharing scheme uses Bluecars – specially designed EVs by the<br />
French manufacturer Bolloré. The cars are available for short-term<br />
rental in Paris and 45 surrounding cities, under the Autolib’ brand.<br />
The Autolib’ system is based on self-service and maximum autonomy:<br />
Once registered as a member, one can pick up a car in any station,<br />
drive around and leave the car to recharge in the station of choice. The<br />
payment is based on the time spent in the vehicle on a roughly 7-europer-half-hour<br />
basis. The service offers a 24/7 videophone assistance<br />
and the possibility to book a vehicle or a parking space.<br />
A flexible feature of the scheme is that Autolib charging stations are not<br />
reserved for Bluecars only: Privately owned EVs, outside of the Autolib’<br />
scheme, can also be left to recharge. This results in an increase of<br />
publicly available charging points in the city and the end of “range<br />
anxiety” for EV owners, i.e. the fear of running out of battery and not<br />
being near a charging point.<br />
Rapid impact<br />
Is Paris providing<br />
the model for all<br />
cities to follow?<br />
In April 2012, Autolib’ reached the 100,000th rental, with only 1,740 vehicles<br />
released so far into the streets. Five hundred stations are spread around<br />
Paris and the neighboring cities. By October 2012, 100 more should be<br />
installed in underground parking areas and the total should reach 1,000<br />
stations with more than 5,000 charging points. Bolloré claims that every<br />
week, its member base increases by 10 percent.<br />
Once the 3,000 Autolib’ EV goal is completed, Bolloré will start manufacturing<br />
Bluecars for private owners. The Paris experience will be both a largescale<br />
test and a showcase for the car before its arrival in a market<br />
that is expected to take off in the next few years: All the major car<br />
28 29<br />
<strong>Jones</strong> <strong>Lang</strong> <strong>LaSalle</strong><br />
manufacturers already have or are designing hybrid vehicles, and there is<br />
serious competition in fully electric motorization. There are still a number<br />
of technical, usage and production cost issues to be solved, with batteries<br />
and their costs of up to one-third of an electric car’s total price tag, as<br />
one of the main drivers for slow take-up.<br />
What are the benefits?<br />
The wide-spread usage of such EV car sharing programs will allow for<br />
considerable reductions in local Greenhouse Gas emission, as well<br />
as in noise and city traffic congestion. Such measures will contribute<br />
to France’s commitment to reduce GHG emissions by 20 percent by<br />
2020. In addition, it provides a means for developing a more healthy<br />
and comfortable living environment in urban areas through reduced local air<br />
pollution from fuel combustion.<br />
The City of Paris has estimated that once the Autolib’ program has<br />
reached its full capacity, it should replace the need for 22,500 private<br />
vehicles and save 165 million kilometers driven per year. Such a largescale<br />
experience has never been attempted before. According to plans of<br />
the French government, there will be 400,000 public charge points put<br />
in place across France by 2020. It expects to take the number of EVs and<br />
hybrids in circulation to 2 million by 2020.<br />
The EV car sharing scheme example could be followed by large campuses,<br />
where the experience of Autolib’ is replicable on a corporate scale, with dozens<br />
of small EVs serving as an intermodal link to mass transit stations during<br />
commuting hours and as a corporate fleet during working hours.<br />
What does this mean for property owners?<br />
Related to the push for introducing electric vehicles in France and to create<br />
user interest in EVs through EV car sharing schemes, the French government<br />
introduced a complementary new obligation for property owners in terms of<br />
the construction of the infrastructure for electric and hybrid vehicle charging<br />
stations. This obligation covers enclosed and covered parking areas in office<br />
buildings, which need to allow at least 10 percent of their parking space<br />
to be EV-friendly. In practice, it means that cable ducts and cable trays<br />
must be provided from the central electric panel to the parking spaces,<br />
and that electricity supply must take into account those future EV charging<br />
demands. The obligation is already in force for all new office buildings with a<br />
planning permit received after 1 July 2012 and will be extended to existing<br />
buildings from 1 January 2015.<br />
For further information please contact:<br />
Franz Jenowein,<br />
Director, Sustainable Real Estate Consulting & Research<br />
franz.jenowein@eu.jll.com
<strong>Global</strong> <strong>Sustainability</strong> <strong>Perspective</strong><br />
The US Green Building Council’s (USGBC) LEED program is the world’s<br />
most widely followed green building rating system, as owners, developers<br />
and tenants in more than 30 countries have sought and received LEED<br />
certification; however, it is not the only system. Countries around the world<br />
have their own rating systems designed to address their national priorities,<br />
and owners seeking green building certification must decide whether to<br />
pursue the national system, LEED or both. Those who choose LEED may<br />
face special challenges in interpreting and applying the system.<br />
The USGBC is the first to recognize the need for guidance to practitioners<br />
outside the U.S., and has a dedicated International Operations Division not<br />
only to work with its own members and LEED Accredited Professionals<br />
(AP) throughout the world, but also to provide cooperative support for nonaffiliated<br />
green building organizations at national and regional levels.<br />
<strong>Global</strong> <strong>Sustainability</strong> <strong>Perspective</strong> recently asked USGBC Vice President of<br />
International Operations Jennivine Kwan to share her insights on LEED’s<br />
relationship to other certification initiatives throughout the world, and how<br />
different organizations can work together toward common green building<br />
goals. Here are some excerpts from our conversation:<br />
Q. How would you characterize USGBC and LEED’s<br />
accord with other green building groups and systems<br />
in different parts of the world?<br />
A. We definitely see our relationship as symbiotic, not competitive.<br />
All the groups coexist toward the same end result of increasing green<br />
building initiatives, regardless of the impetus. Our own goal is to<br />
enable LEED to be a catalyst for sustainability however it can best<br />
be utilized in any particular location throughout the world. If that’s<br />
determined to be LEED certification, fine, but if LEED can be used<br />
as a benchmark or facilitator for another group’s effort, that’s just as<br />
valuable as far as we’re concerned.<br />
For example, the measurement tool preferred by China’s government<br />
is its Three Star System, with One Star and Two Star versions geared<br />
to regional and local markets. We support that system in any way we<br />
can, because it encourages the entire green building industry to grow in<br />
China. From my perspective of working in China for several years, I think<br />
that LEED’s international reputation as an effective tool helped the China<br />
Green Building Council in developing its own preferred system. And it’s<br />
notable that more than 300 Chinese buildings have received or applied<br />
for LEED certification, which demonstrates how LEED and USGBC can<br />
contribute to and learn from sister initiatives throughout the world.<br />
June 2012<br />
LEED’s International<br />
Impact: An insider’s view<br />
Q. USGBC has some chapters in other countries, but<br />
it seems to be somewhat limited, even though LEED<br />
is internationally recognized. Is this your preferred<br />
approach, and why?<br />
A. Our international strategy is not really to develop as many chapters<br />
as possible. It is to make LEED the common language of green building;<br />
to provide a sense of unity, community and a common way to talk about<br />
the same thing. We know that there are different regional characteristics<br />
and issues, and we try to make LEED adaptable for use itself, or as a<br />
benchmark for a nation’s own system.<br />
By the same token, our overall strategy behind forming international<br />
USGBC chapters is that we want to support the local green leaders<br />
as effectively as we can, while making the best use of our resources.<br />
We take a case-by-case approach. If the local interest is high but the<br />
organization level is not, then a new chapter might be in order. If the<br />
area already has a strong green building network, it makes more sense to<br />
support their efforts than to devote our time and resources toward forming<br />
a chapter that, instead of helping the overall effort, may even be seen<br />
as divisive by the local leaders. Most often, the most productive path for<br />
us seems to be supporting the local infrastructure with LEED and other<br />
assistance we can provide.<br />
Q. Is there confusion internationally about the<br />
difference between USGBC, the World Green<br />
Building Council (WGBC) and other worldwide<br />
councils and green building organizations?<br />
A. You bet. And the confusion extends beyond USGBC to LEED<br />
itself. A surprising number of outsiders think that both LEED and the<br />
USGBC are run by the U.S. government, and as such are biased<br />
toward “American” interests. Needless to say, one of most important<br />
tasks is to remove that type of misconception, and convince them that<br />
we are totally transparent in partnering toward whatever best serves<br />
their sustainable goals.<br />
And yes, we do get confused with WGBC. As the name infers, WGBC<br />
is an umbrella organization for green building councils at national,<br />
regional and local levels throughout the world. USGBC did have an<br />
important development role as one of the eight national councils that<br />
launched WGBC in 1999, and we’re gratified that with the support<br />
of WGBC, green building councils are on the ground partnering with<br />
industry and government in more than 80 countries. I think that as<br />
the market matures, so will the understanding of distinctions among<br />
LEED, USGBC, WGBC and other green building councils.<br />
Q. How do LEED practitioners share ideas in<br />
countries where LEED is not the primary system?<br />
A. Until a couple of years ago, even though we had LEED chapter<br />
members and APs in many countries, the personal motivation and sense<br />
of urgency to bond together to share information wasn’t always there.<br />
The situation has changed a lot in recent years. <strong>Sustainability</strong> has<br />
proven to be more than a fad, and it is becoming government mandated<br />
in many places. Though some markets are more mature than others,<br />
there’s a hunger for green building information at some level almost<br />
everywhere in the developed world.<br />
LEED interest has always been very much a grassroots movement. It’s<br />
a voluntary system and its practitioners are in it for their passion for<br />
sustainable living. Increasingly, I’m seeing LEED APs getting together<br />
informally with non-LEED people with green interests as professional<br />
colleagues, or just groups of friends with a shared environmental<br />
commitment. They talk about LEED and other green facilitators, sharing<br />
ideas and experiences and discussing how sustainable building can best<br />
move forward in their part of the world. It really mirrors the scenario in the<br />
US that led to the USGBC and LEED, and it’s very satisfying to see that<br />
initial enthusiasm rekindled in so many new places.<br />
30 31<br />
<strong>Jones</strong> <strong>Lang</strong> <strong>LaSalle</strong><br />
Q. Many LEED credits are based on standards set<br />
by other organizations, such as the American Society<br />
of Heating, Refrigeration, and Air-Conditioning<br />
Engineers (ASHRAE), which may not be the<br />
applicable standards in every country. How adaptable<br />
is your system in allowing standards other than<br />
ASHRAE to be used in LEED certifications?<br />
A. That’s a complex issue that USGBC is discussing right now. We really<br />
want to make LEED as flexible as possible, and one way we’re doing<br />
that is by establishing alternative paths for LEED pursuits outside the<br />
US. The challenge is to achieve this without either raising or lowering<br />
the measurement bar, because LEED’s utility is based on its consistency<br />
everywhere it is used. We look at the outcome and what we want the<br />
building to do in the end through LEED certification, rather than try to<br />
micromanage the steps in getting there. For some of the LEED credits,<br />
it’s a simple matter of a change in the credit language that enables<br />
people to use something that is an apples-to-apples equivalent.<br />
With ASHRAE, that might not be so easy. LEED is not a standard itself, but<br />
a measurement tool that relies on other standards USGBC has chosen as<br />
benchmarks for sustainable building excellence. ASHRAE is a great standard<br />
that predates the development of LEED. A lot of work went into creating the<br />
ASHRAE standards, and we don’t need to re-create it. If people want to use<br />
another standard for measurements covered by ASHRAE like the energy<br />
credits, we have to make sure that it is fully compatible with the ASHRAE<br />
standard requirements; otherwise LEED loses its validity as a measurement<br />
tool. That’s not saying that other standards might not be as demanding as<br />
ASHRAE; some may indeed be more stringent. LEED is neither the easiest<br />
nor the toughest measurement system around. What is critical is that any<br />
other international standard used must really align with the LEED standard it<br />
is replacing for our tool to remain consistent.<br />
Q. Are LEED materials available in multiple<br />
languages?<br />
A. Currently much of our information is available in English, Spanish,<br />
Chinese, Portuguese, French and Italian versions. These cover a<br />
large percentage of the world’s population, especially where there is<br />
green building going on. We’ll certainly consider other languages as<br />
the demand occurs.
<strong>Global</strong> <strong>Sustainability</strong> <strong>Perspective</strong><br />
Q. Our LEED APs in countries with other systems<br />
sometimes run into difficulty getting construction and<br />
design professionals to guarantee compliance with<br />
LEED criteria. The same issues arose in the U.S. at<br />
first when LEED was not well-known. Overall, how has<br />
the international reception toward LEED compared to<br />
that of the U.S.?<br />
A. The initial reception is almost the same. When people in both the<br />
US and other nations are getting acquainted with LEED, there are<br />
some enthusiastic supporters and, quite frankly, a larger number of<br />
skeptics. There are always those who say that it just can’t be done<br />
June 2012<br />
in their organization; that the necessary green products and technologies<br />
cost too much, or are not adequate for their operational needs; that they’ll<br />
be over budget and in trouble with their executive leadership; that they<br />
don’t have time to spend learning and fulfilling LEED requirements.<br />
USGBC faced the same hurdles when they introduced LEED into the U.S.<br />
in 1999 because people were doubtful of the unknown. Now we have<br />
a strong American track record, and we can demonstrate as proof that<br />
LEED certification can be achieved by almost anyone if they make the<br />
commitment, and it’s not a budget breaker. It’s the same story elsewhere<br />
in the world as green building emerges. We try to communicate with and<br />
educate people to help them make the right decisions upfront for the green<br />
building process. If they do, it is possible, for little extra effort and often no<br />
extra expense, to create a green building that will save money in reduced<br />
energy costs, and be a marketing tool in satisfying tenants or employees.<br />
What we need in every new region is that first success story. I worked in<br />
Chile for a company that originally stonewalled green building, except for<br />
one charismatic leader who kept championing a LEED pursuit for a new<br />
facility until it became a reality. This company has since become one<br />
of the biggest leaders of sustainable building in that region and a leader<br />
of the emerging Chile Green Building Council.<br />
Q. What’s ahead internationally for USGBC<br />
and LEED?<br />
A. Our tangible goals include a greater outreach toward our existing<br />
USGBC members and LEED APs throughout the world. We want to<br />
bridge any gaps, assure our international stakeholders that they are<br />
valued, and set up channels such as a forum for their insights and<br />
questions to make sure this happens. On the technical side, we’re<br />
working on making LEED more user-friendly for people of all nations.<br />
And since China is surging in LEED interest and applications, we are<br />
hiring someone who will focus specifically on our member and AP base<br />
in that nation. We also want to integrate the entire life cycle of a building<br />
more fully into our process, so LEED more automatically becomes the<br />
first step of an ongoing sustainability effort where it is used.<br />
Beyond outreach, we are trying to become more international ourselves<br />
by learning from our colleagues in other nations, and trying to create<br />
a more international voice for everything we do. We want to effectively<br />
connect with green building advocates everywhere so they can<br />
understand the thought and complexity that goes into developing the<br />
LEED system. We want to help them understand that LEED is not a<br />
tool to push American interests, but a system developed by volunteers<br />
who care very deeply about sustainability. We hope to augment our<br />
world-class tool with insights from those with an international point of<br />
view to make LEED as valuable as possible for everyone in the green<br />
building community, all around the world.<br />
For further information please contact:<br />
Jennivine Kwan<br />
Joined USGBC in 2010 as Vice President of International Operations. She<br />
previously held regional responsibilities in energy and green solutions for<br />
Johnson Controls, working in China and Chile.<br />
Introducing<br />
<strong>Sustainability</strong><br />
Transparency<br />
A new index tracking transparency<br />
of sustainability-related issues<br />
The <strong>Global</strong> Real Estate Transparency Index has been published by<br />
<strong>Jones</strong> <strong>Lang</strong> <strong>LaSalle</strong> since 1999. It is a unique survey that quantifies<br />
the key components of real estate transparency such as performance<br />
benchmarks, market fundamentals data, transaction process and the<br />
regulatory environment across almost 100 markets worldwide. This<br />
year, we have for the first time included a quantitative assessment of the<br />
transparency of sustainability related issues.<br />
32 33<br />
<strong>Jones</strong> <strong>Lang</strong> <strong>LaSalle</strong><br />
For a subset of 28 countries covered by the Index, we have looked at<br />
a number of elements that render sustainability features of markets<br />
and assets more transparent. An assessment of building energy<br />
efficiency requirements, energy performance benchmarking, carbon<br />
emissions reporting, green building rating systems, green lease clauses<br />
and performance indices of green real estate has been undertaken<br />
to produce the world’s first comparative benchmark of real estate<br />
transparency of sustainability-related issues.
<strong>Global</strong> <strong>Sustainability</strong> <strong>Perspective</strong><br />
Real Value<br />
34<br />
June 2012<br />
We are in business to create and deliver real value for clients, shareholders and our own people in a complex world that is constantly changing.<br />
<strong>Jones</strong> <strong>Lang</strong> <strong>LaSalle</strong> is a financial and professional services firm specializing in real estate services and investment management. Our more than 40,000 people in 1,000 locations in 70<br />
countries serve the local, regional and global real estate needs of those clients, growing our company in the process. In response to changing client expectations and market conditions,<br />
we assemble teams of experts who deliver integrated services built on market insight and foresight, sound research and relevant market knowledge. We attract, develop and reward the<br />
best, and most diverse, people in our industry, challenging them to develop enduring client relationships built on quality service, collaboration and trust.<br />
<strong>Global</strong> Energy and <strong>Sustainability</strong> Services Contacts:<br />
Dan Probst<br />
Chairman, Energy &<br />
<strong>Sustainability</strong> Services<br />
+1 312 228 2859<br />
dan.probst@am.jll.com<br />
Julie Hirigoyen<br />
EMEA Head of<br />
<strong>Sustainability</strong> Services<br />
+44 (0)20 7399 5330<br />
julie.hirigoyen@eu.jll.com<br />
Peter Hilderson<br />
Asia Pacific Head of Energy<br />
& <strong>Sustainability</strong> Services<br />
+61 2 9220 8735<br />
peter.hilderson@ap.jll.com<br />
More than 120 offices worldwide<br />
Bob Best<br />
Americas Head of Energy &<br />
<strong>Sustainability</strong> Services<br />
+1 312 228 2047<br />
bob.best@am.jll.com<br />
Franz Jenowein<br />
<strong>Global</strong> <strong>Sustainability</strong><br />
<strong>Perspective</strong><br />
+33 1 40 55 85 31<br />
franz.jenowein@eu.jll.com<br />
COPYRIGHT © <strong>Jones</strong> <strong>Lang</strong> <strong>LaSalle</strong> IP, INC. 2012<br />
This publication is the sole property of <strong>Jones</strong> <strong>Lang</strong> <strong>LaSalle</strong> IP, Inc. and must not be copied, reproduced or transmitted in any form or by any means, either in whole or in part, without the prior written consent of <strong>Jones</strong> <strong>Lang</strong> <strong>LaSalle</strong> IP, Inc. The information contained in this publication has been obtained from<br />
sources generally regarded to be reliable. However, no representation is made, or warranty given, in respect of the accuracy of this information. We would like to be informed of any inaccuracies so that we may correct them. <strong>Jones</strong> <strong>Lang</strong> <strong>LaSalle</strong> does not accept any liability in negligence or otherwise for<br />
any loss or damage suffered by any party resulting from reliance on this publication.<br />
This <strong>magazine</strong> is printed on 30% recycled paper. Please recycle.