Franke, Ulrich, Lubos Polerecky, Elimar Precht, and Markus ... - ASLO
Franke, Ulrich, Lubos Polerecky, Elimar Precht, and Markus ... - ASLO
Franke, Ulrich, Lubos Polerecky, Elimar Precht, and Markus ... - ASLO

Create successful ePaper yourself
Turn your PDF publications into a flip-book with our unique Google optimized e-Paper software.
Limnol. Oceanogr., 51(2), 2006, 1084–1096<br />
� 2006, by the American Society of Limnology <strong>and</strong> Oceanography, Inc.<br />
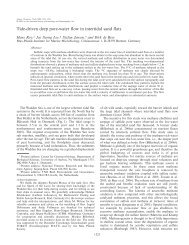
Wave tank study of particulate organic matter degradation in permeable sediments<br />
<strong>Ulrich</strong> <strong>Franke</strong>, 1 <strong>Lubos</strong> <strong>Polerecky</strong>, <strong>Elimar</strong> <strong>Precht</strong>, 2 <strong>and</strong> <strong>Markus</strong> Huettel 3<br />
Max Planck Institute for Marine Microbiology, Celsiusstrasse 1, D-28359 Bremen, Germany<br />
Abstract<br />
We used a wave tank to study the influence of pore-water flow <strong>and</strong> diffusive transport on the degradation of<br />
labile particular organic matter (POM: Ulva lactuca pieces) embedded in permeable sediment. Pore-water advection,<br />
induced by the interaction of the wave-driven oscillatory boundary flow <strong>and</strong> stationary sediment ripples, reproducibly<br />
exposed POM buried in the top 2 cm of the sediment to oxic or anoxic conditions lasting between days <strong>and</strong><br />
weeks. Planar oxygen optodes together with carbon <strong>and</strong> nitrogen analyses were used to visualize <strong>and</strong> quantify the<br />
degradation rates. Oxygen consumption rates (OCR) were up to 18-times higher at locations of the buried POM<br />
compared to the surrounding sediment. Elevated OCR were also detected downstream the POM locations. Despite<br />
high permeability of the sediment <strong>and</strong> exposure to oxygenated pore-water flows, suboxic <strong>and</strong> anoxic sites <strong>and</strong><br />
suboxic pore-water ‘‘plumes’’ developed at <strong>and</strong> downstream of the locations of POM in otherwise oxygenated<br />
sediment regions. The carbon loss of the buried U. lactuca discs derived from the OCR measurements was only<br />
4–15% of that measured by the carbon analysis of the recovered pieces, suggesting that the bacterial degradation<br />
of POM <strong>and</strong> the final degradation of dissolved organic matter (DOM) were spatially decoupled by the pore-water<br />
flow. Advection can thus enhance the rate of organic matter degradation by efficiently distributing DOM from the<br />
‘‘hotspots’’ of organic matter mineralization to larger volumes of permeable sediments <strong>and</strong> associated microbial<br />
communities.<br />
Permeable sediments are abundant in the global continental<br />
shelf regions (Emery 1968). These nonaccumulating<br />
s<strong>and</strong>s are generally poor in organic carbon <strong>and</strong> have been<br />
considered long time as relatively inactive habitats that do<br />
not contribute substantially to the cycling of organic matter<br />
(Boudreau et al. 2001). Recent studies, however, indicate<br />
that the low concentration of organics is more likely the<br />
result of rapid turnover <strong>and</strong> high exchange rates (Huettel et<br />
al. 1998; Rusch et al. 2003). When the interaction of the<br />
boundary-layer flow (e.g., unidirectional or oscillatory flow<br />
induced by currents <strong>and</strong> gravity surface waves, respectively)<br />
<strong>and</strong> sediment topography enables dynamic advective porewater<br />
flow, the solute exchange at the sediment-water interface<br />
can exceed transport by molecular diffusion by several<br />
1 Present address: FAB Anlagenbau GmbH, Ostarastr. 5, 51107<br />
Cologne, Germany (u.franke@fab-anlagenbau.com).<br />
2 Present address: DHI Wasser & Umwelt, Wiesenstrasse 10A, D-<br />
28857 Syke, Germany<br />
3 Present address: Florida State University, Department of Oceanography,<br />
0517 OSB, West Call Street, Tallahassee, Florida 32306-<br />
4320.<br />
Acknowledgments<br />
We thank Björn Grunwald <strong>and</strong> Gerhard Holst for assistance with<br />
the MOLLI system. Ingo Klimant (Institute for Analytical Chemistry,<br />
Micro- <strong>and</strong> Radiochemistry, Technical University of Graz,<br />
Austria) <strong>and</strong> Claudia Schröder (Institute for Analytical Chemistry,<br />
Bio- <strong>and</strong> Chemo-Sensors, University of Regensburg, Germany) are<br />
thanked for the recipe, the technical advice, <strong>and</strong> help with the preparation<br />
of planar O2 optodes. Bo Barker Jørgensen is acknowledged<br />
for constant interest <strong>and</strong> support of this work, Dirk de Beer for<br />
valuable comments <strong>and</strong> discussion. Georg Herz, Alfred Kutsche,<br />
Volker Meyer, <strong>and</strong> Paul Färber are acknowledged for their help with<br />
the wave tank setup <strong>and</strong> electronics. Valuable comments of Ronnie<br />
Glud <strong>and</strong> two anonymous reviewers are much appreciated. The<br />
study was funded by the German Federal Ministry of Education <strong>and</strong><br />
Research (BMBF, project 03F0284A) <strong>and</strong> the Max Planck Society<br />
(MPG).<br />
1084<br />
orders of magnitude (Rutgers van der Loeff 1981; <strong>Precht</strong><br />
<strong>and</strong> Huettel 2004; Reimers et al. 2004). Advection can significantly<br />
increase the oxygen penetration depths in sediments<br />
(Forster et al. 1996; Lohse et al. 1996; Ziebis et al.<br />
1996a) as well as the transport of organic particles (Huettel<br />
et al. 1996; Rusch <strong>and</strong> Huettel 2000), resulting in enhanced<br />
sedimentary oxygen consumption <strong>and</strong> organic matter degradation<br />
(Forster et al. 1996; Ziebis et al. 1996b; Reimers et<br />
al. 2004).<br />
The increased degradation activity in advective sedimentary<br />
systems is most likely the result of several factors.<br />
Transport of nutrients towards the sedimentary bacteria,<br />
which can be the limiting factor under stagnant, diffusivedominated<br />
conditions, is enhanced by fluid motion (van<br />
Loosdrecht et al. 1990). Furthermore, efficient directed transport<br />
of oxygen <strong>and</strong> other electron acceptors as well as organic<br />
matter from the overlying water to the sedimentary<br />
community, combined with fast transport of inhibitory products<br />
like ammonia <strong>and</strong> sulphide out of the sediment, can<br />
enhance bacterial activity under advection (Ziebis et al.<br />
1996b; Huettel et al. 1998).<br />
The biogeochemical reactions in the sediment <strong>and</strong> advective<br />
transport of organic particles <strong>and</strong> solutes result in a complex<br />
three-dimensional zonation of oxygen, organic material,<br />
nutrients, <strong>and</strong> heavy metals. In contrast to many diffusiondominated<br />
sediments, this zonation is highly dynamic, as it<br />
is tightly linked to rapidly changing sediment topography<br />
<strong>and</strong> overlaying water flow (Ziebis et al. 1996b; Huettel et<br />
al. 1998; <strong>Precht</strong> et al. 2004). Metabolic activity at the transition<br />
between oxic <strong>and</strong> anoxic zones is considered to be<br />
very intensive, especially when these zones show temporal<br />
or spatial oscillations (Aller 1994; Huettel et al. 1998).<br />
Total sediment mineralization can be estimated from the<br />
measurements of benthic oxygen uptake (Thamdrup <strong>and</strong><br />
Canfield 2000). This approach is applicable in systems, e.g.,<br />
cohesive sediments, where minor electron sinks, such as the
Visualization of degradation<br />
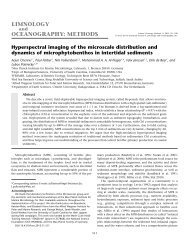
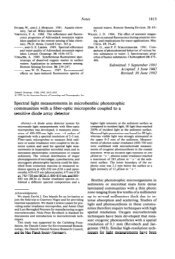
Fig. 1. The experimental wave tank setup. (A) Overview with locations of circular pieces of U. lactuca placed in the sediment in front<br />
of the semi-transparent planar O 2 optode, preferably under ripple troughs; WP � wave paddle, AB � artificial beach. (B) Cross-section of<br />
the wave tank showing the setup for the simultaneous sediment surface <strong>and</strong> oxygen imaging.<br />
release of dinitrogen <strong>and</strong> permanent burial of metal sulfides,<br />
can be ignored, as oxygen is the terminal electron acceptor<br />
for benthic degradation processes of organic matter (Canfield<br />
et al. 1993). In permeable sediments, oxygen consumption<br />
is typically determined by sealable sediment enclosures in<br />
which close to natural flow conditions can be mimicked.<br />
Typical examples include flume setups (Forster et al. 1996;<br />
Ziebis et al. 1996b) or diverse benthic chambers used under<br />
laboratory or in situ conditions (e.g., Malan <strong>and</strong> McLachlan<br />
1991; Huettel <strong>and</strong> Gust 1992; Glud et al. 1996a). Other,<br />
more recent approaches include flow-through sediment column<br />
systems (Reimers et al. 2004; de Beer et al. 2005; <strong>Polerecky</strong><br />
et al. 2005) <strong>and</strong> the in situ eddy-correlation technique<br />
(Berg et al. 2003). The method of <strong>Polerecky</strong> et al.<br />
(2005) can give insight into the small scale spatial distribution<br />
of two-dimensional oxygen consumption rates (OCR)<br />
in the sediment, which is impossible to assess with the other<br />
methods. This was enabled by the use of a planar oxygen<br />
optode, introduced to marine systems by Glud et al. (1996b),<br />
which allows two-dimensional oxygen measurements in the<br />
sediment with a high spatio-temporal resolution. Planar oxygen<br />
optodes have been used successfully to measure oxygen<br />
dynamics <strong>and</strong> distributions in diverse marine applications<br />
(e.g., Glud et al. 1999; <strong>Precht</strong> et al. 2004; Wenzhöfer<br />
<strong>and</strong> Glud 2004).<br />
This study aims to assess the spatial <strong>and</strong> temporal variability<br />
of aerobic degradation of particular organic matter<br />
(POM) buried in permeable sediment, <strong>and</strong> to investigate the<br />
influence of different transport modes (advective vs. diffusive)<br />
on the degradation rates. Experiments were conducted<br />
in a wave tank so as to mimic natural conditions. Planar<br />
oxygen optodes allowed the estimation of the aerobic POM<br />
1085<br />
degradation without disturbing the samples, the sediment, or<br />
the degradation conditions. The planar optode measurements<br />
were supplemented with carbon <strong>and</strong> nitrogen analyses, providing<br />
a direct quantification of the degradation of the POM<br />
samples removed from the sediments. By comparing these<br />
two approaches, a possible mechanism by which advection<br />
can enhance the POM degradation could be identified.<br />
Materials <strong>and</strong> methods<br />
Wave tank setup—Experiments were carried out in a laboratory<br />
wave tank setup identical to that described by <strong>Precht</strong><br />
et al. (2004) (Fig. 1A). The wave tank was filled with natural<br />
s<strong>and</strong>y sediment (median grain size 180 �m, porosity 35.2%,<br />
permeability 13.0 � 0.3 � 10 �12 m 2 ) <strong>and</strong> artificial seawater<br />
(salinity 32). Over a period of �1 year prior to our experiments,<br />
extensive advective process studies were conducted<br />
(<strong>Precht</strong> et al. 2004), during which food (powdered dried red<br />
algae, equivalent to an input of 1 g m �2 ) was added biweekly<br />
to the sediment. The nourishment was stopped three weeks<br />
before our experiments. Organic carbon (C) <strong>and</strong> nitrogen (N)<br />
contents of the top 5 cm of sediment, analysed using a Fisons<br />
NCS 1500 elemental analyzer, were 800 � 25 (n � 5)<br />
<strong>and</strong> 30 � 9(n � 5) �g g �1 dry weight, respectively. Neither<br />
oligochaetes nor active microphytobenthos were present in<br />
the sediment, as concluded from the missing burrowing activity<br />
at the sediment surface <strong>and</strong> no oxygen increase after<br />
long illumination periods, respectively. The top sediment horizon<br />
(1–3 cm thick) was frequently oxygenated by advection,<br />
while the deeper sediment layers remained reduced.<br />
Sediment surface topography was created by sinusoidal
1086 <strong>Franke</strong> et al.<br />
waves generated at the upstream end of the wave tank using<br />
a wave paddle (Fig. 1A, see <strong>Precht</strong> et al. (2004) for further<br />
details). In particular, propagating ripples were produced by<br />
adjusting the water level to a height (h) of 19 cm above the<br />
sediment surface <strong>and</strong> the wave amplitude (a) to 7 cm, wavelength<br />
(�) to 70 cm <strong>and</strong> frequency (f) to 1.25 Hz (settings<br />
1). With these settings, root mean square value of the horizontal<br />
flow velocity directly above the sediment was U RMS<br />
� 0.12 m s �1 , as measured with a three-beam DANTEC�<br />
LDA (Laser Doppler Anemometer). When the settings were<br />
changed to h � 15 cm, a � 5 cm, � � 80 cm <strong>and</strong> f � 1.1<br />
Hz (settings 2), resulting in U RMS � 0.08 m s �1 , the formed<br />
ripples remained stationary.<br />
Two-dimensional oxygen distributions—Two-dimensional<br />
(2D) oxygen distributions were measured with a semi-transparent<br />
planar oxygen optode (14 cm wide, 10 cm high) glued<br />
to the wave tank wall by transparent silicone (Elastosil� E4,<br />
Wacker). The optode was prepared as described in <strong>Precht</strong> et<br />
al. (2004). The sensing layer (30 �m thick) was made from<br />
a solution containing 10 mg of fluorophore Platinum(II)<br />
meso—tetra (pentafluoro-phenyl) porphyrin (Pt-PFP) (Porphyrin<br />
Products), 490 mg Polystyrene (Sigma-Aldrich), 3<br />
mL Chloroform (Merck) <strong>and</strong> 330 mg titanium dioxide (TiO 2)<br />
particles (�5 �m, Aldrich). Oxygen images were recorded<br />
using the luminescence lifetime imaging system (Holst et al.<br />
1998; Holst <strong>and</strong> Grunwald 2001), which is based on the<br />
dynamic quenching of fluorophore’s luminescence lifetime<br />
by oxygen (Kautsky 1939). The accuracy of oxygen readings<br />
was between 2% air saturation (AS) <strong>and</strong> 7% AS in the regions<br />
of 0–10% AS <strong>and</strong> 75–100% AS, respectively. The<br />
images (640 � 480 pixels) covered an area of 80 � 60 mm,<br />
resulting in a spatial resolution of 125 � 125 �m pixel �1 .<br />
The oxygen images were superimposed with the sediment<br />
surface images recorded synchronously using a second CCD<br />
camera mounted on the other side of the wave tank channel<br />
(Fig. 1B) (<strong>Precht</strong> et al. 2004).<br />
2D oxygen consumption rate (OCR) measurements—Oxygen<br />
was transported into the sediment by advection induced<br />
by the interaction of the overlaying water flow <strong>and</strong> the sediment<br />
topography (<strong>Precht</strong> et al. 2004). Initial steady state<br />
oxygen distributions, denoted as ci, were achieved by producing<br />
waves for a period of 3–5 h (using settings 2, see<br />
previous). After the waves were stopped, oxygen transport<br />
in the sediment was governed by molecular diffusion <strong>and</strong><br />
the initial oxygen dynamics was formally described by the<br />
diffusion equation (�c/�t) i � Ds �ci � R. Here, Ds �ci represents<br />
the diffusive transport in the sediment characterised<br />
by the diffusion coefficient Ds <strong>and</strong> R � 0 is the local OCR<br />
(note that R � 0 would describe oxygen production rate)<br />
(Crank 1975). Rearranging this equation, R can be calculated<br />
as<br />
R � Ds �ci � (�c/�t) i<br />
(1)<br />
Since both Ds �ci <strong>and</strong> (�c/�t) i are calculated from oxygen<br />
images measured by the planar optode at the wall, R in Eq.<br />
1 represents the local OCR at or close to the wall.<br />
The time series of oxygen images recorded every 30 s for<br />
50 min after the waves were stopped were used to quantify<br />
(�c/�t) i. The concentrations in each pixel were fitted by the<br />
most suitable polynomial (order between 0 <strong>and</strong> 4), <strong>and</strong> the<br />
initial time-derivative of the fit was taken as the value of<br />
(�c/�t) i in the corresponding pixel (see <strong>Polerecky</strong> et al. 2005<br />
for details of the fitting procedure). The diffusive term D s<br />
�c i in Eq. 1 was determined from the 2D oxygen distribution<br />
measured immediately (�2–5 s) before the waves were<br />
stopped. Since the effect of the wall (planar optode) on the<br />
diffusion in porous medium could not be accurately determined,<br />
two effective diffusion coefficients were used, namely<br />
D s1 � (�/� 2 ) � D w � 0.21 � 10 �9 m 2 s �1 <strong>and</strong> D s2 � D w<br />
� 1.83 � 10 �9 m 2 s �1 D s1 was calculated according to Boudreau<br />
(1996), taking into account the sediment porosity (� �<br />
35.2%) <strong>and</strong> tortuosity (� 2 � 1 � ln(� 2 ) � 3.1). D w is the<br />
diffusion of oxygen in seawater corrected for salinity (32)<br />
<strong>and</strong> temperature (17�C) (Li <strong>and</strong> Gregory 1974). The term<br />
�c i �� 2 c i/�x 2 �� 2 c i/�y 2 was calculated using the 2D Savitzky-Golay<br />
smoothing algorithm (Krumm 2001: http://<br />
research.microsoft.com/users/jckrumm/SavGol/SavGol.htm).<br />
All calculations were implemented in Matlab�.<br />
Particular organic matter—Samples of U. lactuca were<br />
provided from the Alfred Wegener Institute for Polar <strong>and</strong><br />
Marine Research (Helgol<strong>and</strong> Isl<strong>and</strong>), stored in artificial seawater<br />
(instant sea�, salinity 32, temperature 15�C) under 12<br />
h light/12 h dark conditions. Circular pieces (diameter ø 5<br />
mm, dry weight 900–1,200 mg) of U. lactuca were cut from<br />
a fresh large thallus <strong>and</strong> served as POM in the experiments.<br />
Experimental procedure<br />
Sediment ripples were generated using the wave tank settings<br />
1 (see previous). Subsequently, 4 circular pieces of U.<br />
lactuca were placed directly flat against the optode at a sediment<br />
depth of 0.5–1.5 cm. The Ulva pieces were placed<br />
under the ripple troughs (Fig. 1A), <strong>and</strong> the wave tank settings<br />
2 were adjusted (sediment ripples remained stationary,<br />
see previous), which enabled easy manipulation of the oxygen<br />
content under the ripple troughs <strong>and</strong> the locations of<br />
the Ulva by turning on <strong>and</strong> off the wave action that controlled<br />
the advective pore-water exchange (<strong>Precht</strong> et al.<br />
2004).<br />
Three degradation scenarios, each characterized by different<br />
redox conditions prevailing during the degradation, were<br />
investigated (Fig. 2). In Experiment 1, the U. lactuca discs<br />
<strong>and</strong> the sediment surrounding them were kept continuously<br />
oxic <strong>and</strong> under advection-dominated conditions. The exceptions<br />
were the five OCR measurements conducted at 6-d<br />
intervals, when the waves were stopped for approx. 1 h. In<br />
Experiment 2, U. lactuca <strong>and</strong> the surrounding sediment were<br />
maintained under anoxic <strong>and</strong> diffusion-dominated conditions<br />
(no waves). The exceptions were the three OCR measurements<br />
performed on days 0, 12, <strong>and</strong> 24, when the waves<br />
were switched on for 3–5 h in order to oxygenate the sediment<br />
allowing the measurement of its depletion rate by the<br />
planar optode technique (see previous). In Experiment 3, U.<br />
lactuca <strong>and</strong> the surrounding sediment were kept under alternating<br />
oxic (advection-dominated) <strong>and</strong> anoxic (diffusiondominated)<br />
conditions of three days each. OCR measurements<br />
were performed every 3 days.
Visualization of degradation<br />
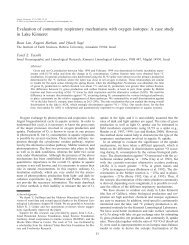
Fig. 2. Time-protocols of the three degradation experiments specifying the conditions of Ulva lactuca <strong>and</strong> the surounding sediment.<br />
Arrows indicate the time (after the OCR measurements) at which 1–2 discs of U. lactuca were removed for the carbon <strong>and</strong> nitrogen<br />
analyses. The duration (h) of the advective- <strong>and</strong> diffusive- conditions is indicated by the numbers insight the panels. OCR measuremts in<br />
each experiment lasted �1 h.<br />
Analytical procedures<br />
Plant material—Wave tank degradation experiments: A<br />
direct measurement of the total carbon <strong>and</strong> nitrogen loss of<br />
the buried U. lactuca pieces was done using a Fisons NCS<br />
1500 elemental analyzer. After 12 d <strong>and</strong> at the end of each<br />
experiment (Fig. 2), 1–2 Ulva pieces were removed from the<br />
sediment <strong>and</strong> dried overnight at 60�C. Each disc was cut<br />
into 4 pieces <strong>and</strong> analyzed for total carbon <strong>and</strong> nitrogen content.<br />
The control experiments were done by applying the<br />
same procedure to freshly cut U. lactuca stored in aerated,<br />
artificial seawater in the dark at 17�C for the same periods.<br />
Test tubes DOC experiment: An additional control experiment<br />
was conducted to test whether DOC was produced by<br />
U. lactuca itself, by bacteria already attached to it, or by<br />
bacteria living in the sediment. Ulva discs (ø 5 mm) were<br />
placed at the wall of 21 test tubes (10 mL) <strong>and</strong> covered with<br />
�1 cm 3 sterile sediment <strong>and</strong> 5 mL of artificial nonsterile<br />
seawater (salinity 32). Test tubes without algae served as<br />
controls. Every third day, U. lactuca discs were removed<br />
from 3 test tubes. The sediment was mixed by a vortex shaker<br />
<strong>and</strong> allowed to settle for 5 min. The water from each test<br />
tube was decanted into a 10 mL syringe, filtered through a<br />
nylon filter (Millex-GN Filter Unit, Millipore, pore size 0.2<br />
�m) <strong>and</strong> kept frozen at �20�C until analysis. The DOC analysis<br />
was conducted using a Shimadzu TOC-5050A total organic<br />
carbon analyzer, which determines the total dissolved<br />
carbon (TDC) <strong>and</strong> dissolved inorganic carbon (DIC). DOC<br />
was calculated by subtracting DIC from TDC.<br />
Calculations of consumed carbon from OCR—The<br />
amount of carbon mineralized during the wave tank experiments<br />
deduced from the time-series of OCR measurements<br />
(Fig. 2) was calculated by the following procedure. First, the<br />
measured OCR was converted into carbon mineralization<br />
rate (CMR) according to Florek <strong>and</strong> Rowe (1983) as<br />
�3 �1 �3 �1<br />
CMR (ng cm day ) � OCR (ng cm day )<br />
� 12/32 � RQ (2)<br />
assuming a simplified reaction CH2O � O2 → CO2 � H2O 1087<br />
for the organic matter degradation <strong>and</strong> a respiratory quotient<br />
(RQ) of 0.85 (Rowe et al. 1994). The factor 12/32 takes into<br />
account the carbon : oxygen molar weight ratio.<br />
Second, it was assumed that the OCR measured at locations<br />
of the Ulva discs were not limited only to the immediate<br />
vicinity of the algae but extended over a half sphere<br />
of the disc diameter into the sediment (ø � 0.5 cm; volume<br />
�V � 0.033 cm 3 ). The CMR per disc of U. lactuca (ng<br />
disc �1 day �1 ) could then be calculated by multiplying the<br />
volumetric CMR in Eq. 2 with the volume �V. The same<br />
procedure was applied to the OCR of the sediment in central<br />
areas under ripple troughs to allow a direct comparison with<br />
the CMR at the Ulva locations. Finally, the time-series of<br />
the CMR values were integrated over 24 d to estimate the<br />
total amount of carbon mineralized over the entire experimental<br />
period.<br />
Results<br />
Steady state oxygen distributions—Steady state oxygen<br />
distributions maintained under long-term advective conditions<br />
were similar in all experiments (Fig. 3A, C, D). Characteristic<br />
undulating patterns of oxygen-rich pore water developed<br />
under ripple troughs <strong>and</strong> oxygen depleted<br />
pore-water upwelling zones formed under ripple crests<br />
(<strong>Precht</strong> et al. 2004). Oxygen penetration was enhanced under<br />
ripple troughs (0.5–2.4 cm), <strong>and</strong> strong vertical as well as<br />
horizontal oxygen gradients developed (Table 1, Fig. 3).<br />
When diffusive conditions lasted for more than 4 h, oxygen<br />
was completely consumed in deeper sediment layers <strong>and</strong> its<br />
penetration was limited to the top 0.5–0.7 cm (Fig. 3, Table<br />
1). Under these conditions, oxygen distributions in experiments<br />
3 (Fig 3B) <strong>and</strong> 2 (data not shown) were very similar.<br />
Figures 3C <strong>and</strong> 3D demonstrate that steady local zones of<br />
reduced oxygen concentrations (5–70 �mol L �1 ) developed<br />
at the locations of the U. lactuca discs as well as in the<br />
sediment downstream the discs. This was caused by the enhanced<br />
oxygen consumption at the Ulva discs, which compared<br />
in magnitude to the advective oxygen supply. In contrast,<br />
no such oxygen-reduced zones were observed in the
1088 <strong>Franke</strong> et al.<br />
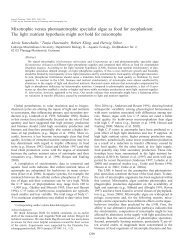
Fig. 3. Quasi-steady-state oxygen distributions maintained during the long-term degradation experiments under advection (oxic) <strong>and</strong><br />
diffusion (anoxic) conditions, respectively. Panels A, C, <strong>and</strong> D show typical steady state oxygen distributions under advective conditions<br />
prior to OCR measurements conducted during Exp. 1, 2, <strong>and</strong> 3, respectively. Panel B shows exemplarily a typical steady state oxygen<br />
distribution during long term diffusive conditions in Exp. 3. Circles show the positions of U. lactuca discs, black horizontal lines the<br />
sediment surface, <strong>and</strong> the arrows indicate the approximate streamlines of the porewater flow estimated according to Shum <strong>and</strong> Sundby<br />
(1996). Vertical lines 1–3 in panel C indicate three selected sediment regions from which vertical oxygen profiles were extracted <strong>and</strong> plotted<br />
as a function of time in Fig. 4.<br />
surrounding sediment, where the oxygen consumption was<br />
relatively low.<br />
Oxygen dynamics—To illustrate the qualitatively different<br />
dynamic behavior of oxygen distributions <strong>and</strong> penetration<br />
depths in the sediment under alternating advective <strong>and</strong> diffusive<br />
conditions, selected vertical oxygen profiles were extracted<br />
from the oxygen images <strong>and</strong> plotted as a function of<br />
time (Fig. 4; see also Fig. 3C for the positions of the extracted<br />
profiles). Below ripple crests, anoxic pore water was<br />
initially driven towards the sediment surface after the wave-<br />
Table 1. Summary of the ripple wavelengths, ripple amplitudes,<br />
<strong>and</strong> typical maximum oxygen penetration depths during the experiments.<br />
Exp.<br />
1<br />
2<br />
3<br />
Ripple<br />
wavelengths<br />
(cm)<br />
2.5–4.0<br />
1.4–2.5<br />
�2.7<br />
Ripple<br />
amplitudes<br />
(cm)<br />
0.1–0.4<br />
0.1–0.3<br />
0.2–0.4<br />
Typical oxygen penetration<br />
depths under<br />
Advection<br />
(cm)<br />
1.3–2.4<br />
0.5–1.8<br />
1.8–2.0<br />
Diffusion<br />
(cm)<br />
0.5–0.7<br />
0.5–0.7<br />
0.5–0.7<br />
induced transition from diffusion- to advection-dominated<br />
conditions (Fig. 4A, left panel). With time, the upwelling<br />
water became gradually mixed with oxygen-rich pore water<br />
coming from the ripple flank, resulting in a slow increase of<br />
the oxygen penetration depth. Due to the absence of advection-driven<br />
upwelling of anoxic pore water after the waves<br />
were stopped (Fig. 3A, right panel), oxygen was transported<br />
deeper into the sediment by diffusion. Below ripple troughs,<br />
oxygen was pushed rapidly deeper into the sediment after<br />
the onset of advective transport (Fig. 4B, left panel), whereas<br />
oxygen penetration slowly decreased after the advection was<br />
stopped <strong>and</strong> the transport was dominated by diffusion (Fig.<br />
4B, right panel).<br />
The situation was qualitatively different when U. lactuca<br />
was present under a ripple trough. After the transition from<br />
the diffusion- to advection-dominated conditions (Fig. 4C,<br />
left panel), the initial rapid advection-driven increase of oxygen<br />
penetration into the sediment was temporally stopped<br />
after �20 min at the position of the Ulva disc. This was<br />
caused by the elevated oxygen consumption that exceeded<br />
the mainly downward advective supply. Due to the threedimensional<br />
transport characteristics of the pore-water flow,<br />
oxygen was gradually transported below the U. lactuca disc<br />
from the surrounding sediment. However, a local suboxic
Visualization of degradation<br />
Fig. 4. Typical time evolutions of selected vertical oxygen profiles in the sediment with freshly buried POM after an abrupt change of<br />
the transport conditions from diffusion- to advection-dominated (left panels) <strong>and</strong> from advection- to diffusion-dominated (right panels). The<br />
respective abrupt changes were induced by switching the waves on <strong>and</strong> off at times indicated by arrows. The positions of the profiles in<br />
panels A, B, <strong>and</strong> C are indicated in Fig. 3C by the vertical lines 1, 3, <strong>and</strong> 2, respectively. The circle <strong>and</strong> the vertical line in panel C indicate<br />
the location of the U. lactuca disc in the sediment <strong>and</strong> the relative position of the extracted profile with respect to Ulva, respectively. The<br />
black horizontal lines show the sediment surface. The greyscale was adjusted so as to enhance the contrast at lower oxygen concentrations.<br />
Note that the widths of the figures are not to scale.<br />
region (�70 �mol L �1 ) remained at the position of the U.<br />
lactuca disc during the entire advective period. After the<br />
waves were stopped (Fig. 4C, right panel), the removal of<br />
oxygen was considerably faster at the location of the U. lactuca<br />
disc, where anoxia was reached within 15–70 min, depending<br />
on the experiment. The presence of Ulva, thus, resulted<br />
in reversed oxygen gradients in deeper sediment<br />
during both advective <strong>and</strong> diffusive conditions.<br />
The oxygen dynamics under advective <strong>and</strong> diffusive con-<br />
1089<br />
ditions are more clearly demonstrated in movies produced<br />
from temporal sequences of the oxygen images that can be<br />
found in Web Appendix 1 (http://www.aslo.org/lo/toc/<br />
vol�51/issue�2/1084a1.html). The movies show the development<br />
of steady state oxygen distribution beneath stationary<br />
sediment ripples after the U. lactuca discs were placed<br />
in the sediment <strong>and</strong> the waves were switched on, as well as<br />
the oxygen dynamics after the waves were stopped (corresponding<br />
to Fig. 3).
1090 <strong>Franke</strong> et al.<br />
Table 2. OCR values (�mol L �1 min �1 ) averaged over selected<br />
U. lactuca discs (� 5 mm diameter), calculated without (column 2)<br />
<strong>and</strong> with (columns 3 <strong>and</strong> 4) diffusion correction. The st<strong>and</strong>ard deviations<br />
indicate the variability of the OCR values within the averaged<br />
area.<br />
Exp. R��(�c/�t) i Eq. 1 using D sl Eq. 1 using D s2<br />
1<br />
2<br />
3<br />
4.5�1.8<br />
5.8�3.0<br />
2.9�1.2<br />
4.9�2.3<br />
5.9�3.6<br />
3.0�1.7<br />
5.1�2.4<br />
6.1�4.0<br />
3.2�2.5<br />
2D OCR measurements—The correction of the OCR images<br />
for diffusion (Eq. 1) did not produce satisfactory results using<br />
neither with D s1 nor with D s2 (data not shown). When<br />
the lower (D s1) value was used, the R image still contained<br />
areas with apparent oxygen production under the ripple<br />
crests. On the other h<strong>and</strong>, the higher value (D s2) resulted in<br />
occasional patches of apparent oxygen production in areas<br />
under the ripple troughs, which was also unacceptable. The<br />
possible reasons for these artefacts could be twofold. Heavy<br />
smoothing had to be applied to the rather noisy oxygen images<br />
(2D Savitzky-Golay Filter, polynomial of order 3, patch<br />
size of 17 � 17 pixels), which could have lowered �c i in<br />
pixels where oxygen gradients varied abruptly (e.g., under<br />
the ripple crests). On the other h<strong>and</strong>, the value of D s2 was<br />
probably too high to describe diffusion in a porous medium<br />
near a wall.<br />
Nevertheless, the systematic error introduced to the OCR<br />
values at the locations of U. lactuca discs by not including<br />
the diffusion-correction, i.e., by calculating the OCR image<br />
from R ��(�c/�t) i (compare to Eq. 1), did not exceed 10–<br />
15% (Table 2). Since the initial 2D oxygen distributions of<br />
the OCR measurements were very similar for each experiment<br />
(data not shown), this inaccuracy was the same for<br />
each calculated OCR image. Because the minor underestimation<br />
of the OCR values does not influence the main conclusions<br />
of our study, only the diffusion-uncorrected OCR<br />
values (R ��(�c/�t) i) will be presented below.<br />
Typical OCR images are shown in Fig. 5. The positions<br />
of U. lactuca discs were clearly visible as areas of significantly<br />
elevated OCR values compared to the surrounding<br />
sediment. These areas were slightly larger (ø 7.1–8.8 mm)<br />
than the actual size of the U. lactuca discs (ø 5 mm). When<br />
the Ulva discs were removed (day 12 of the experiments),<br />
the regions of increased OCR disappeared (Fig. 5D). Peak<br />
sediment OCR values appeared at the transition zones between<br />
the oxic <strong>and</strong> anoxic sediment areas as well as close<br />
to U. lactuca discs. Lowest sediment OCRs were measured<br />
in the central areas of ripple troughs.<br />
The OCR values were averaged over circular areas (ø 5<br />
mm) either at the locations of U. lactuca or in the central<br />
area under the ripple troughs for all conducted OCR measurements<br />
summarised in Fig. 2, <strong>and</strong> are shown in Fig. 6A.<br />
At the locations of U. lactuca discs, OCR decreased expo-<br />
Fig. 5. Typical examples of the calculated OCR images. Images A, B, C, <strong>and</strong> D correspond to the OCR measurement number 1 (day<br />
0), 2 (day 3), 3 (day 6), <strong>and</strong> 6 (day 15) of Experiment 3, respectively (see Fig. 2). OCR values are expressed per volume of porewater.<br />
Black horizontal lines indicate the sediment surface, <strong>and</strong> circles show the locations of U. lactuca discs. Grey regions indicate deep sediment<br />
areas where no (�c/�t) i was measurable due to the lack of oxygen, whereas white regions in the sediment correspond to areas with (�c/�t) i<br />
� 0.
Visualization of degradation<br />
Fig. 6. OCR values averaged over circular areas (5 mm diameter) at locations of (A) U. lactuca <strong>and</strong> (B) in the central area under the<br />
ripple troughs. Error bars indicate the variability of the OCR over the averaged area. Solid <strong>and</strong> dotted lines represent the long-term anoxic<br />
<strong>and</strong> oxic periods preceding the OCR measurements, respectively. Note different scaling of panels A <strong>and</strong> B.<br />
nentially (from �4.5 to �1.0 �mol L �1 min �1 ) under longterm<br />
oxic conditions (Exp. 1), whereas the values changed<br />
only slightly (from �5.6 to �5.0 �mol L �1 min �1 ) when the<br />
degradation took place during prolonged anoxic conditions<br />
(Exp. 2). In Experiment 3, OCR decreased rapidly <strong>and</strong> increased<br />
slightly after the Ulva pieces were exposed to oxic<br />
<strong>and</strong> anoxic conditions, respectively. The overall decrease of<br />
OCR in this experiment was approx. exponential (from �3.0<br />
to �0.5 �mol L �1 min �1 ; Fig. 6A).<br />
In contrast, only minor decreases (from 0.22–0.29 to<br />
0.15–0.25 �mol L �1 min �1 ) in the sedimentary OCR were<br />
observed during the 24-d duration of the three experiments<br />
(Fig. 6B). The OCR were approx. 10–20 times lower than<br />
those at positions of Ulva pieces measured at the beginning<br />
of each experiment or during the entire Experiment 2. At<br />
the end of experiments with prolonged oxic conditions (Exp.<br />
1 <strong>and</strong> 3), the sediment values were only around 2–3 times<br />
smaller than the OCR at the locations of U. lactuca.<br />
Ulva lactuca analyses—Neither discs of U. lactuca taken<br />
out of the wave tank sediment for analysis after 12 <strong>and</strong> 24<br />
d, nor the U. lactuca pieces from the test tubes experiment,<br />
nor the controls stored in nonsterile artificial seawater<br />
changed significantly their appearance during the experiments,<br />
<strong>and</strong> all looked intact <strong>and</strong> greenish.<br />
Fig. 7. (A) Remaining carbon <strong>and</strong> (B) nitrogen contents of U. lactuca discs after 24 d of experiments expressed as a percentage of the<br />
initial values. Error bars were calculated from n � 2 samples, except for Exp. 1 (*) where one Ulva disc disappeared due to ripple migration.<br />
1091<br />
Wave tank degradation experiment: Carbon (C) <strong>and</strong> nitrogen<br />
(N) contents of U. lactuca varied considerably in all<br />
experiments. Carbon values ranged from 204 to 531 mg C<br />
g �1 dry weight (dw) with st<strong>and</strong>ard deviations (SD) of 30–<br />
112 mg C g �1 dw (n � 4). Nitrogen content of single discs<br />
varied between 9 <strong>and</strong> 26 �g Ng �1 dw (SD � 1–4 �g Ng �1<br />
dw; n � 4). The remaining amounts, expressed relative to<br />
the initial values, are shown in Fig. 7 In all experiments, the<br />
total amounts of carbon <strong>and</strong> nitrogen per disc decreased significantly<br />
(ANOVA test, p � 0.01) over 24 d for both U.<br />
lactuca discs buried in the sediment (Table 3, column 2) <strong>and</strong><br />
the controls (data not shown). Post-hoc pair-wise tests using<br />
the Tukey HSD procedure applied to the carbon <strong>and</strong> nitrogen<br />
data after 12 d (when at least 2 replicates were available for<br />
all experiments) revealed that the degradation in the sediment<br />
resulted in a significantly greater (p � 0.01) loss in C<br />
<strong>and</strong> N contents of Ulva compared to the degradation in the<br />
water (control). However, no significant differences between<br />
Experiments 1–3 in the loss of C <strong>and</strong> N were observed.<br />
Test tubes DOC experiment: TDC <strong>and</strong> DIC concentrations<br />
in the test tubes with <strong>and</strong> without (control) U. lactuca were<br />
generally low (Fig. 8). Although both TDC <strong>and</strong> DIC concentrations<br />
where higher <strong>and</strong> slightly increased in tubes containing<br />
pieces of Ulva, the DOC concentrations were the
1092 <strong>Franke</strong> et al.<br />
Table 3. Total carbon loss of U. lactuca derived from the carbon<br />
analysis <strong>and</strong> the OCR measurements during 24 d. Losses recorded<br />
using carbon analyses were taken as 100% values for comparison<br />
with the losses recorded using OCR measurements. Results were<br />
corrected for sediment porosity.<br />
Exp.<br />
1<br />
2<br />
3<br />
Carbon<br />
analysis<br />
(�g C<br />
per disc)<br />
�250 (100%)<br />
�150 (100%)<br />
�200 (100%)<br />
OCR<br />
measurements<br />
position of<br />
U. lactuca<br />
(�g C per<br />
0.033 cm3 )<br />
�7.4 (3%)<br />
�22.6 (15%)<br />
�4 (2%)<br />
OCR<br />
measurements<br />
position of<br />
sediment<br />
(�g C per<br />
0.033 cm 3 )<br />
�0.83<br />
�2.1<br />
�1.2<br />
Equivalent<br />
sediment<br />
volume<br />
(cm3 )<br />
�9.6<br />
�2<br />
�5.4<br />
same <strong>and</strong> remained constant during 18 d. Consequently, the<br />
increase in TDC was entirely due to the increase in DIC.<br />
Subtracting the DIC concentrations of the controls from<br />
those of the test tubes with pieces of Ulva <strong>and</strong> fitting the<br />
results with a linear model (dotted line in Fig. 8B), the carbon<br />
turnover of 1.13 ng C per disc of U. lactuca (volume<br />
of 0.033 cm �3 ) in 24 d was determined.<br />
Consumed carbon derived from OCR measurements—Total<br />
carbon loss derived from the OCR measurements (using<br />
Eq. 2 <strong>and</strong> data in Fig. 6A) ranged between 4.0 <strong>and</strong> 22.6 �g<br />
C/disc. This accounts only for 15% of the carbon that was<br />
mineralized according to the carbon analysis of the discs<br />
(Table 3). The CMR values of the surrounding sediment under<br />
ripple troughs were used to estimate the POM-free sediment<br />
volume needed to account for this difference (Table<br />
3, column 5). The corresponding sediment volumes were<br />
approx. 60–300 times larger than the assumed effective volume<br />
of the Ulva discs (0.033 cm 3 ).<br />
Discussion<br />
In a previous study, <strong>Precht</strong> et al. (2004) showed that advection<br />
caused by the interaction of wave-driven oscillatory<br />
flow <strong>and</strong> sediment topography creates alternating patterns of<br />
oxic <strong>and</strong> anoxic regions under ripple troughs <strong>and</strong> crests, respectively.<br />
These regions vary dynamically <strong>and</strong> may thus<br />
influence the conditions (either aerobic or anaerobic) of organic<br />
matter degradation within the upper sediment layer.<br />
By determining the total oxygen uptake (TOU) of the sediment<br />
using sealable flume-channels <strong>and</strong> chamber setups,<br />
‘‘hotspots’’ of organic matter degradation within the sediment<br />
<strong>and</strong> their temporal development cannot be determined<br />
because each measured signal represents a consumption rate<br />
that integrates over the entire sediment volume <strong>and</strong> a specific<br />
time period. Here, we present a technique where this lack of<br />
spatial <strong>and</strong> temporal resolutions is overcome <strong>and</strong> natural<br />
conditions can be mimicked.<br />
Labile POM in permeable sediments: ‘‘Hotspots’’ of degradation—When<br />
oxygen-rich pore water is transported<br />
through the permeable sediment by advection, it gradually<br />
becomes depleted in oxygen with a rate determined by the<br />
Fig. 8. (A) TDC, (B) DIC, <strong>and</strong> (C) DOC � TDC � DIC concentrations<br />
as a function of time in a test tube experiment. � DIC<br />
denotes the difference between the DIC concentrations with <strong>and</strong><br />
without U. lactuca. St<strong>and</strong>ard deviations were calculated from n �<br />
4 samples.<br />
pore-water flow velocity <strong>and</strong> the local volumetric OCR. No<br />
significant change in the oxygen concentration was measurable<br />
near U. lactuca placed directly under the ripple trough<br />
(e.g., Fig. 3A), where the pore-water velocities were high<br />
enough to deliver oxygen at rates exceeding by far the oxygen<br />
loss due to the oxygen consumption in the sediment<br />
upstream <strong>and</strong>/or at the location of the Ulva disc. In contrast,
sub- <strong>and</strong> anoxic zones developed when the advective oxygen<br />
delivery could not compensate the elevated OCR at or downstream<br />
the locations of Ulva (e.g., Figs. 3C–D), indicating a<br />
locally intense POM degradation. Similar phenomena were<br />
observed also on a larger scale, where large quantities of<br />
green algae buried in permeable sediments resulted in ‘‘black<br />
spots’’ at the sediment surface (Neira <strong>and</strong> Rackemann 1996).<br />
Macrophyte decomposition typically progresses through<br />
three main stages. Initially, rapid leaching <strong>and</strong> dissolution of<br />
soluble materials associated with autolysis of cells occurs<br />
(Andersen <strong>and</strong> Hargrave 1984). The labile macromolecules<br />
of POM are subsequently transformed into dissolved organic<br />
matter (DOM) by slower, bacteria-mediated decomposition<br />
using exoenzymes (Fenchel et al. 1998). In the last phase,<br />
recalcitrant, structural carbon—e.g., cellulose or hemicellulose—are<br />
degraded at very slow rates (Castaldelli et al.<br />
2003). This gradual decrease of the POM degradation rate<br />
was also apparent in our OCR measurements, particularly<br />
from the exponential decrease of OCR observed during the<br />
prolonged oxic conditions (Fig. 6A). The last phase with the<br />
slowest degradation rates occurred after 6–12 days. Similar<br />
decay patterns were found by Kristensen et al. (1995) <strong>and</strong><br />
Kristensen <strong>and</strong> Holmer (2001).<br />
The degradation rate decrease could not be confirmed directly<br />
by the carbon <strong>and</strong> nitrogen analysis, mainly due to the<br />
insufficient number of time points (limited by the number of<br />
samples). However, the carbon <strong>and</strong> nitrogen analysis did<br />
show that the degradation of U. lactuca in the sediment resulted<br />
in a significantly higher (p � 0.01) carbon <strong>and</strong> nitrogen<br />
loss than in the controls degraded in water (Fig. 7).<br />
Significant differences between the three experiments could<br />
not be demonstrated, but the amounts of degraded C <strong>and</strong> N<br />
were similar for all three experiments suggesting that the<br />
aerobic <strong>and</strong> anaerobic degradation rates were comparable<br />
(Table 3). This is important because no direct rate measurements<br />
of the anaerobic processes in the used sediment are<br />
available.<br />
Decoupling of POM <strong>and</strong> DOM degradation in permeable<br />
sediments—DOM is usually produced much faster by bacterial<br />
degradation of POM than it is consumed (Vetter et al.<br />
1998). It was shown that DOM concentrations in pore water<br />
of surface sediments can be up to an order of magnitude<br />
higher than those in the overlying water (Chen et al. 1993;<br />
Martin <strong>and</strong> McCorkle 1993). In cohesive sediments the diffusive<br />
DOM flux out of the sediment was found to be up to<br />
13% of the depth integrated sediment carbon degradation<br />
(Burdige <strong>and</strong> Homstead 1994).<br />
In our experiments the organic carbon loss of the buried<br />
U. lactuca pieces derived from the OCR measurements accounted<br />
for only 4–15% of the carbon loss determined by<br />
the carbon analysis (Table 3). The discrepancy is possibly<br />
even higher considering that the effective volume of the<br />
Ulva disc assumed in the OCR-based calculations (a halfsphere,<br />
ø 0.5 cm, �V � 0.033 cm 3 ) considerably overestimates<br />
the typical disc volume of 0.003 cm 3 (ø 0.5 cm, 2 cell<br />
layers �150 �m thick; Bobin-Dubigeon et al. 1997). This<br />
indicates that a major fraction of the organic matter of Ulva<br />
was consumed not directly at the locations of the Ulva pieces<br />
but within the surrounding sediment after conversion into<br />
Visualization of degradation<br />
1093<br />
dissolved organic matter. Such a spatial decoupling of POM<br />
<strong>and</strong> DOM degradation was enhanced by the advective porewater<br />
flow. This is consistent with the stages of macrophyte<br />
degradation listed above that involve conversion of solid into<br />
dissolved organic matter already at the early stage of decomposition.<br />
This spatial decoupling of POM <strong>and</strong> DOM degradation<br />
was well demonstrated in Experiment 1, where oxic degradation<br />
conditions prevailed. It is further supported by the<br />
elevated OCR values measured in the sediment downstream<br />
the positions of the U. lactuca discs (Fig. 5). On the other<br />
h<strong>and</strong>, no such zones were visible when diffusive conditions<br />
prevailed (e.g., in Exp. 2, OCR-data not shown).<br />
The carbon loss calculated from the OCR measurements<br />
may not reflect accurately the degree of POM degradation<br />
under anoxic (Exp. 2) <strong>and</strong> oscillating conditions (Exp. 3).<br />
Our calculations of carbon losses using the OCR measurements<br />
are based on several simplified assumptions—especially<br />
when addressing the anoxic <strong>and</strong> oscillating conditions—which<br />
consequently result in relatively high<br />
uncertainties of the calculated numbers.<br />
This occurs during anoxic conditions because reduced inorganic<br />
compounds (e.g., sulfide) could accumulate in the<br />
diffusive distance from the locations where the anaerobic<br />
degradation took place. As the reduced compounds can be<br />
re-oxidized, either chemically or biologically, they contribute<br />
to the sedimentary OCR. Evidence of this contribution<br />
were the persistently high <strong>and</strong> increasing OCR values at positions<br />
of POM observed after prolonged anoxic conditions<br />
(Fig. 6A, symbols connected by solid lines).<br />
The extent to which reduced compounds are affecting the<br />
momentarily measured OCR is difficult to estimate because<br />
the contribution of re-oxidation will change during the advective<br />
phase prior the OCR measurements as well as during<br />
the OCR measurements themselves. Additionally, re-oxidation<br />
rates depend on other unknown factors such as grain<br />
size, mineralogical composition, <strong>and</strong> crystal structure of the<br />
solid phase (Berner 1980). The anaerobic CMR values presented<br />
here were obtained under the assumption that the rate<br />
of anaerobic carbon mineralization is on average 100% of<br />
the the CMR derived from the momentarily measured OCR.<br />
Assuming a rate of 50% (e.g., Jørgensen 1982) would result<br />
in even lower OCR-derived carbon loss (e.g., � 8% of the<br />
total carbon loss determined by carbon analysis in Exp. 2).<br />
However, anaerobic degradation processes (e.g., the reduction<br />
of sulfate, Mn- <strong>and</strong> Fe oxides) <strong>and</strong> the subsequent reoxidation<br />
of the reduced products such as H 2S, Mn 2� ,Fe 2� ,<br />
<strong>and</strong> FeS by oxygen have the net stochiometry of oxygen<br />
respiration. This means that the amount of carbon remineralized<br />
is approximated by the amount of oxygen taken up<br />
by the sediment irrespective of the mineralization pathway<br />
(Canfield et al. 1993), as formulated in Eq. 2. Therefore, the<br />
OCR values after prolonged anoxic conditions in Exp. 2<br />
(Fig. 6A) would have to be �7 times higher to account for<br />
the carbon loss determined by the carbon analysis (Table 3).<br />
However, no such high OCR values were measured. A possible<br />
explanation could be that the rates were underestimated<br />
due to the experimental procedure, as advection had to be<br />
started for 4–5 h prior to each OCR measurements. During<br />
that period, the reduced solid substances (e.g., FeS precipi-
1094 <strong>Franke</strong> et al.<br />
Fig. 9. Scheme of POM degradation in permeable <strong>and</strong> cohesive sediments. Advection-dominated conditions: Interaction of oscillatory<br />
boundary layer flow <strong>and</strong> sediment topography results in advective porewater flow. Oxygen-rich surface water is forced deep into the<br />
sediment under ripple troughs, whereas anoxic water from deeper sediment horizons leaves the sediment at ripple crests. Bacteria-mediated<br />
aerobic degradation of labile particular organic matter (POM) is enhanced (star) in the advection affected sediment horizon (up to several<br />
cm in depth) by oxygen supply combined with transport of inhibiting products <strong>and</strong> remnants of organic matter degradation out of the<br />
sediment. Highly enhanced degradation activity can result in anoxic or suboxic (mirco) sites in oxygenated sediment. The porewater flow<br />
can spatially decouple POM <strong>and</strong> the final DOM degradation, whereby bacteria in a larger sediment volume could be nourished. DOM can<br />
even be transported out of the sediment. Diffusion-dominated conditions: degradation of buried POM is mainly driven by anaerobic bacteria<br />
as only a thin oxic subsurface layer (typically a few mm) covers the anoxic sediment. Bacterial degradation activity can become diffusion<br />
limited. Additionally, inhibiting products can accumulate <strong>and</strong> decrease mineralization activity. DOM <strong>and</strong> nutrients can spread only in the<br />
diffusive distance, affecting a small sediment volume.<br />
tates) could have been already oxidised <strong>and</strong> the reduced solutes<br />
could have been dispersed by the advective pore-water<br />
flow <strong>and</strong> their re-oxidation may have taken place in sediment<br />
regions invisible to the planar optode.<br />
Wall effect—Because the oxygen measurements were conducted<br />
at the wave tank wall, wall effects may have affected<br />
our results. The pore-water flow during advective conditions<br />
could be slightly reduced near the wall as indicated by dye<br />
experiments in a similar set up (Huettel <strong>and</strong> Gust 1992). This<br />
would reduce the effect of advective pore-water flow on oxygen<br />
penetration <strong>and</strong> OCR near the wall, however, these effects<br />
would not affect the conclusions of our observations<br />
for advective conditions. During diffusive conditions, the<br />
diffusion field is restricted by the planar optode, which could<br />
result in possibly overestimated oxygen heterogeneities.<br />
However, comparisons of advective pore-water flow patterns<br />
at the flume wall <strong>and</strong> in the center of the flume revealed that<br />
the side wall effect had no significant influence on the advective<br />
flow pattern (Huettel et al. 1996). The oxygen distribution<br />
patterns under ripples observed in our experiments<br />
<strong>and</strong> also in experiments by <strong>Precht</strong> et al. (2004) near the<br />
flume wall agree with those distributions modeled by Shum<br />
<strong>and</strong> Sundby (1996). Furthermore, the effect of the thickness<br />
of the diffusive boundary layer on the OCR due to the presence<br />
of the wall, as described by Glud et al. (1996b), was<br />
not relevant in our case, as the derivation of OCR was based<br />
on oxygen dynamics measured inside the sediment (next to<br />
the planar optode) during purely diffusive conditions (i.e.,<br />
no flow). Therefore, we think it is reasonable to assume that<br />
the wall effects did not have a significant influence on our<br />
results <strong>and</strong> the conclusions drawn.<br />
The role of advection in POM degradation—In contrast<br />
to cohesive sediments, where diffusion is the main transport<br />
mechanism <strong>and</strong> the transport of solutes is relatively slow,<br />
DOM in permeable sediments can be transported more rapidly<br />
<strong>and</strong> spread over larger volumes of sediment when porewater<br />
flows are present. We estimated this volume to be<br />
approx. 60–300 times the effective volume influenced by<br />
diffusion (Table 3). Consequently, the products of the degrading<br />
POM may reach <strong>and</strong> nourish more bacteria, which<br />
can result in a faster organic matter turnover. When the organic<br />
matter is located close to the sediment surface, the<br />
sedimentary produced DOM could be transported out of the<br />
sediment <strong>and</strong> remineralized in the overlying water.<br />
This highlights a major difference between permeable <strong>and</strong><br />
cohesive sediments as schematically depicted in Fig. 9. In<br />
permeable sediments advection not only enhances the transport<br />
<strong>and</strong> exchange of electron acceptors <strong>and</strong> substrates as<br />
well as the transport of inhibitory remnants of organic matter<br />
mineralization out of the sediment, but also decouples POM<br />
<strong>and</strong> DOM degradation <strong>and</strong> enhances the dispersion of labile<br />
DOM. In contrast, in cohesive sediments the locations of<br />
POM <strong>and</strong> the final degradation of DOM are more tightly<br />
linked because of the slow diffusive transport, with bioirrigation<br />
as an exception.
Variable influence of buried POM on carbon cycling under<br />
natural conditions—Under natural conditions, sediment<br />
ripples develop when the boundary flow velocity is sufficiently<br />
high. The bacteria attached to s<strong>and</strong>-grains of the top<br />
sediment layer can be exposed to rapidly changing conditions<br />
due to the tight coupling between the ripple propagation<br />
<strong>and</strong> the advective pore-water flow field (<strong>Precht</strong> et al.<br />
2004). These bacteria have to be not only tolerant to both<br />
oxic <strong>and</strong> anoxic conditions, but also able to react instantly<br />
when their favorable conditions, possibly lasting only minutes<br />
or hours, arise. This fast reaction of the sedimentary<br />
aerobic bacterial community was detected in our experiments<br />
as up to 18 times higher OCR values at positions of<br />
U. lactuca compared to the surrounding sediment only minutes<br />
after the U. lactuca discs were placed into the sediment.<br />
That the bacteria living in the surrounding sediment <strong>and</strong> not<br />
the bacteria attached to the U. lactuca discs were the main<br />
degraders was confirmed by the negligible increase of DIC<br />
in a sterile sediment (dotted line in Fig. 8B).<br />
We conclude that in the upper layers of permeable sediments,<br />
where transport is dominated by advective pore-water<br />
flow, highly elevated aerobic mineralization rates at locations<br />
of labile organic matter decomposition may lead to<br />
suboxic or anoxic (micro) sites in an otherwise oxygenated<br />
sediment. The rapid advective transport can lead to the spatial<br />
decoupling of POM degradation <strong>and</strong> the final DOM mineralisation.<br />
The temporally <strong>and</strong> spatially changing advective<br />
DOM transport can reach <strong>and</strong> nourish bacterial communities<br />
of a relatively large sediment volume, which may enhance<br />
organic matter degradation. Our experiments showed that<br />
permeable sediments have a large mineralization potential<br />
sustained by a microbial community that can react instantly<br />
to the input of labile particulate <strong>and</strong> dissolved organic material.<br />
References<br />
ALLER, R. C. 1994. Bioturbation <strong>and</strong> remineralization of sedimentary<br />
organic-matter—effects of redox oscillation. Chemical Geology<br />
114: 331–345.<br />
ANDERSEN, F. O., AND B. T. HARGRAVE. 1984. Effects of Spartina<br />
detritus enrichment on aerobic anaerobic benthic metabolism<br />
in an intertidal sediment. Mar. Ecol. Prog. Ser. 16: 161–171.<br />
BERG, P., H. ROY, F.JANSSEN, V.MEYER, B.B.JøRGENSEN, M.<br />
HUETTEL, AND D. DE BEER. 2003. Oxygen uptake by aquatic<br />
sediments measured with a novel non-invasive eddy-correlation<br />
technique. Mar. Ecol. Prog. Ser. 261: 75–83.<br />
BERNER, R. A. 1980. Early diagenesis: A theoretical approach.<br />
Princeton University Press, Princeton, New Jersey.<br />
BOBIN-DUBIGEON, C., M. LAHAYE, F.GUILLON, J.L.BARRY, AND<br />
D. J. GALLANT. 1997. Factors limiting the biodegradation of<br />
Ulva sp cell-wall polysaccharides. Journal of the Science of<br />
Food <strong>and</strong> Agriculture 75: 341–351.<br />
BOUDREAU, B. P. 1996. The diffusive tortuosity of fine-grained unlithified<br />
sediments. Geochim. Cosmochim. Acta 60: 3139–<br />
3142.<br />
, AND OTHERS. 2001. Permeable marine sediments: overturning<br />
an old paradigm. EOS Trans. Am. Geophys. Unioni 82:<br />
133–136.<br />
BURDIGE, D.J., AND J. HOMSTEAD. 1994. Fluxes of dissolved organic-carbon<br />
from Chesapeake Bay sediments. Geochim. Cosmochim.<br />
Acta 58: 3407–3424.<br />
Visualization of degradation<br />
1095<br />
CANFIELD, D.E.,AND OTHERS. 1993. Pathways of organic carbon<br />
oxidation in three continental margin sediments. Marine Geology<br />
113: 27–40.<br />
CASTALDELLI, G., D. T. WELSH, G.FLACHI, G.ZUCCHINI, G.CO-<br />
LOMBO, R.ROSSI, AND E. A. FANO. 2003. Decomposition dynamics<br />
of the bloom forming macroalga Ulva rigida C. Agardh<br />
determined using a C-14-carbon radio-tracer technique. Aquatic<br />
Botany 75: 111–122.<br />
CHEN, R. F., J. L. BADA, AND Y. SUZUKI. 1993. The relationship<br />
between dissolved organic-carbon (Doc) <strong>and</strong> fluorescence in<br />
anoxic marine porewaters–implications for estimating benthic<br />
Doc fluxes. Geochim. Cosmochim. Acta 57: 2149–2153.<br />
CRANK, J. 1975. The mathematics of diffusion. 2nd ed. Oxford University<br />
Press Inc.<br />
DE BEER, D., AND OTHERS. 2005. Transport <strong>and</strong> mineralization rates<br />
in North Sea s<strong>and</strong>y intertidal sediments Sylt-Rømø basin, Wadden<br />
Sea. Limnol. Oceanogr. 50(1): 113–127.<br />
EMERY, K. O. 1968. Relict sediments on continental shelves of the<br />
world. Am. Assoc. Pet. Geol. Bull. 52: 445–464.<br />
FENCHEL, T., G. M. KING, AND T. H. BLACKBURN. 1998. Bactrial<br />
biogeochemistry. The ecophysiology of mineral cycling, 2nd<br />
ed. Academic Press.<br />
FLOREK, R.J., AND G. T. ROWE. 1983. Oxygen-consumption <strong>and</strong><br />
dissolved inorganic nutrient production in marine coastal <strong>and</strong><br />
shelf sediments of the Middle Atlantic Bight. Internationale<br />
Revue Der Gesamten Hydrobiologie 68: 73–112.<br />
FORSTER, S., M. HUETTEL, AND W. ZIEBIS. 1996. Impact of boundary<br />
layer flow velocity on oxygen utilisation in coastal sediments.<br />
Mar. Ecol. Prog. Ser. 143: 173–185.<br />
GLUD, R. N., S. FORSTER, AND M. HUETTEL. 1996a. Influence of<br />
radial pressure gradients on solute exchange in stirred benthic<br />
chambers. Mar. Ecol. Prog. Ser. 141: 303–311.<br />
,M.KUHL, O.KOHLS, AND N. B. RAMSING. 1999. Heterogeneity<br />
of oxygen production <strong>and</strong> consumption in a photosynthetic<br />
microbial mat as studied by planar optodes. J. Phycol.<br />
35: 270–279.<br />
,N.B.RAMSING, J.K.GUNDERSEN, AND I. KLIMANT. 1996b.<br />
Planar optrodes: A new tool for fine scale measurements of<br />
two-dimensional O-2 distribution in benthic communities. Mar.<br />
Ecol. Prog. Ser. 140: 217–226.<br />
HOLST, G., AND B. GRUNWALD. 2001. Luminescence lifetime imaging<br />
with transparent oxygen optodes. Sens. Actuator B<br />
Chem. 74: 78–90.<br />
,O.KOHLS, I.KLIMANT, B.KONIG, M.KUHL, AND T. RICH-<br />
TER. 1998. A modular luminescence lifetime imaging system<br />
for mapping oxygen distribution in biological samples. Sens.<br />
Actuator B Chem. 51: 163–170.<br />
HUETTEL, M., AND G. GUST. 1992. Solute release mechanisms from<br />
confined sediment cores in stirred benthic chambers <strong>and</strong> flume<br />
flows. Mar. Ecol. Prog. Ser. 82: 187–197.<br />
,W.ZIEBIS, S.FORSTER, AND G. LUTHER, III. 1998. Advective<br />
transport affecting metal <strong>and</strong> nutrient distribution <strong>and</strong> interfacial<br />
fluxes in permeable sediments Geochim. Cosmochim.<br />
Acta 62: 613–631.<br />
, , AND . 1996. Flow-induced uptake of particulate<br />
matter in permeable sediments. Limnol. <strong>and</strong> Oceanogr.<br />
41: 309–322.<br />
JøRGENSEN, B. B. 1982. Mineralization of organic-matter in the sea<br />
bed–the role of sulfate reduction. Nature 296: 643–645.<br />
KAUTSKY, H. 1939. Quenching of luminescence by oxygen. Trans<br />
Faraday Soc 35: 216–219.<br />
KRISTENSEN, E., S. I. AHMED, AND A. H. DEVOL. 1995. Aerobic<br />
<strong>and</strong> anaerobic decomposition of organic matter in marine sediment:<br />
Which is fastest? Limnol. <strong>and</strong> Oceanogr. 40: 1430–<br />
1437.<br />
, AND M. HOLMER. 2001. Decomposition of plant materials
1096 <strong>Franke</strong> et al.<br />
in marine sediment exposed to different electron accepters<br />
(O �2 ,NO 3� , <strong>and</strong> SO 4 2� ), with emphasis on substrate origin,<br />
degradation kinetics, <strong>and</strong> the role of bioturbation. Geochim.<br />
Cosmochim. Acta 65: 419–433.<br />
LI, Y. H., AND S. GREGORY. 1974. Diffusion of ions in sea-water<br />
<strong>and</strong> in deep-sea sediments. Geochim. Cosmochim. Acta 38:<br />
703–714.<br />
LOHSE, L., E.H.G. EPPING, W.HELDER, AND W. VAN RAAPHORST.<br />
1996. Oxygen pore water profiles in continental shelf sediments<br />
of the North Sea: Turbulent versus molecular diffusion.<br />
Mar. Ecol. Prog. Ser. 145: 63–75.<br />
MALAN, D.E.,AND A. MCLACHLAN. 1991. In situ benthic oxygen<br />
fluxes in a nearshore coastal marine system: a new approach<br />
to quantify the effect of wave action. Mar. Ecol. Prog. Ser. 73:<br />
69–81.<br />
MARTIN, W.R., AND D. C. MCCORKLE. 1993. Dissolved organiccarbon<br />
concentrations in marine pore waters determined by<br />
high-temperature oxidation. Limnol. <strong>and</strong> Oceanogr. 38: 1464–<br />
1479.<br />
NEIRA, C., AND M. RACKEMANN. 1996. Black spots produced by<br />
buried macroalgae in intertidal s<strong>and</strong>y sediments of the Wadden<br />
Sea: Effects on the meiobenthos. J. Sea Res. 36: 153–170.<br />
POLERECKY, L., U. FRANKE, U.WERNER, B.GRUNWALD, AND D.<br />
DE BEER. 2005. High spatial resolution measurement of oxygen<br />
consumption rates in permeable sediments. Limnol. Oceanogr.:<br />
Methods 3, 75–85.<br />
PRECHT, E., U. FRANKE, L.POLERECKY, AND M. HUETTEL. 2004.<br />
Oxygen dynamics in permeable sediments with wave-driven<br />
pore water exchange. Limnol. <strong>and</strong> Oceanogr. 49: 693–705.<br />
, AND M. HUETTEL. 2004. Rapid wave-driven advective pore<br />
water exchange in permeable coastal sediment. J. Sea Res. 51:<br />
93–107.<br />
REIMERS, C.E., AND OTHERS. 2004. In situ measurements of advective<br />
solute transport in permeable shelf s<strong>and</strong>s. Cont. Shelf<br />
Res. 24: 183–201.<br />
ROWE, G. T., G. S. BOLAND, W.C.PHOEL, R.F.ANDERSON, AND<br />
P. E. BISCAYE. 1994. Deep-sea floor respiration as an indication<br />
of lateral input of biogenic detritus from continental margins.<br />
Deep-Sea Res. Part II 41: 657–668.<br />
RUSCH, A., AND M. HUETTEL. 2000. Advective particle transport<br />
into permeable sediments–evidence from experiments in an intertidal<br />
s<strong>and</strong>flat. Limnol. <strong>and</strong> Oceanogr. 45: 525–533.<br />
, ,C.E.REIMERS, G.L.TAGHON, AND C. M. FULLER.<br />
2003. Activity <strong>and</strong> distribution of bacterial populations in Middle<br />
Atlantic Bight shelf s<strong>and</strong>s. Fems Microbiology Ecology 44:<br />
89–100.<br />
RUTGERS VAN DER LOEFF, M. M. 1981. Wave effects on sediment<br />
water exchange in a submerged s<strong>and</strong> bed. Neth. J. Sea Res.<br />
15: 100–112.<br />
SHUM, K.T.,AND B. SUNDBY. 1996. Organic matter processing in<br />
continental shelf sediments–the subtidal pump revisited. Mar.<br />
Chem. 53: 81–87.<br />
THAMDRUP, B., AND D. E. CANFIELD. 2000. Benthic respiration in<br />
aquatic sediments, p. 86–103. In O. E. R. Sala, R. B. Jackson,<br />
H. A. Mooney, <strong>and</strong> R. W. Horwarth [eds.], Methods in ecosystem<br />
science. Springer.<br />
VAN LOOSDRECHT, M. C. M., J. LYKLEMA, W.NORDE, AND A. J.<br />
B. ZEHNDER. 1990. Influence of interfaces on microbial activity.<br />
Microbiological Reviews 54: 75–87.<br />
VETTER, Y. A., J. W. DEMING, P.A.JUMARS, AND B. B. KRIEGER-<br />
BROCKETT. 1998. A predictive model of bacterial foraging by<br />
means of freely released extracellular enzymes. Microbial<br />
Ecology 36: 75–92.<br />
WENZHÖFER, F., AND R. N. GLUD. 2004. Small-scale spatial <strong>and</strong><br />
temporal variability in benthic O2 dynamics of coastal sediments:<br />
Effects of fauna activity. Limnol. Oceanogr. 49: 1471–<br />
1481.<br />
ZIEBIS, W., S. FORSTER, M.HUETTEL, AND B. B. JøRGENSEN. 1996a.<br />
Complex burrows of the mud shrimp Callianassa truncata <strong>and</strong><br />
their geochemical impact in the sea bed. Nature 382: 619–622.<br />
,M.HUETTEL, AND S. FORSTER. 1996b. Impact of biogenic<br />
sediment topography on oxygen fluxes in permeable seabeds.<br />
Mar. Ecol. Prog. Ser. 140: 227–237.<br />
Received: 2 December 2004<br />
Accepted: 20 November 2005<br />
Amended: 15 November 2005