MBBR TO MBR – UNIQUE PROCESS CONFIGURATION FOR ...
MBBR TO MBR – UNIQUE PROCESS CONFIGURATION FOR ...
MBBR TO MBR – UNIQUE PROCESS CONFIGURATION FOR ...

Create successful ePaper yourself
Turn your PDF publications into a flip-book with our unique Google optimized e-Paper software.
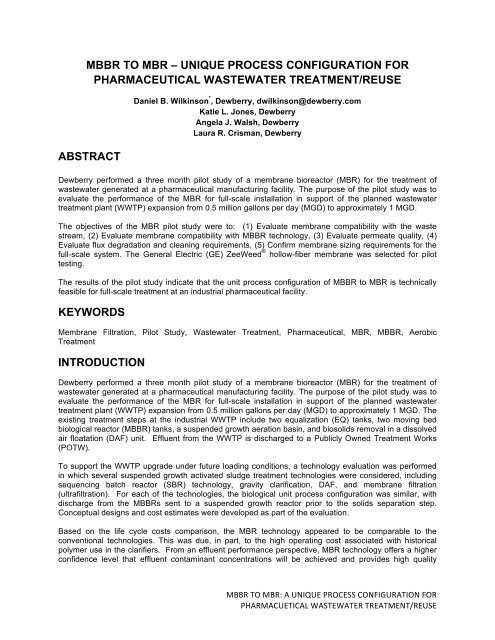
<strong>MBBR</strong> <strong>TO</strong> <strong>MBR</strong> – <strong>UNIQUE</strong> <strong>PROCESS</strong> <strong>CONFIGURATION</strong> <strong>FOR</strong><br />
PHARMACEUTICAL WASTEWATER TREATMENT/REUSE<br />
ABSTRACT<br />
Daniel B. Wilkinson * , Dewberry, dwilkinson@dewberry.com<br />
Katie L. Jones, Dewberry<br />
Angela J. Walsh, Dewberry<br />
Laura R. Crisman, Dewberry<br />
Dewberry performed a three month pilot study of a membrane bioreactor (<strong>MBR</strong>) for the treatment of<br />
wastewater generated at a pharmaceutical manufacturing facility. The purpose of the pilot study was to<br />
evaluate the performance of the <strong>MBR</strong> for full-scale installation in support of the planned wastewater<br />
treatment plant (WWTP) expansion from 0.5 million gallons per day (MGD) to approximately 1 MGD.<br />
The objectives of the <strong>MBR</strong> pilot study were to: (1) Evaluate membrane compatibility with the waste<br />
stream, (2) Evaluate membrane compatibility with <strong>MBBR</strong> technology, (3) Evaluate permeate quality, (4)<br />
Evaluate flux degradation and cleaning requirements, (5) Confirm membrane sizing requirements for the<br />
full-scale system. The General Electric (GE) ZeeWeed ® hollow-fiber membrane was selected for pilot<br />
testing.<br />
The results of the pilot study indicate that the unit process configuration of <strong>MBBR</strong> to <strong>MBR</strong> is technically<br />
feasible for full-scale treatment at an industrial pharmaceutical facility.<br />
KEYWORDS<br />
Membrane Filtration, Pilot Study, Wastewater Treatment, Pharmaceutical, <strong>MBR</strong>, <strong>MBBR</strong>, Aerobic<br />
Treatment<br />
INTRODUCTION<br />
Dewberry performed a three month pilot study of a membrane bioreactor (<strong>MBR</strong>) for the treatment of<br />
wastewater generated at a pharmaceutical manufacturing facility. The purpose of the pilot study was to<br />
evaluate the performance of the <strong>MBR</strong> for full-scale installation in support of the planned wastewater<br />
treatment plant (WWTP) expansion from 0.5 million gallons per day (MGD) to approximately 1 MGD. The<br />
existing treatment steps at the industrial WWTP include two equalization (EQ) tanks, two moving bed<br />
biological reactor (<strong>MBBR</strong>) tanks, a suspended growth aeration basin, and biosolids removal in a dissolved<br />
air floatation (DAF) unit. Effluent from the WWTP is discharged to a Publicly Owned Treatment Works<br />
(POTW).<br />
To support the WWTP upgrade under future loading conditions, a technology evaluation was performed<br />
in which several suspended growth activated sludge treatment technologies were considered, including<br />
sequencing batch reactor (SBR) technology, gravity clarification, DAF, and membrane filtration<br />
(ultrafiltration). For each of the technologies, the biological unit process configuration was similar, with<br />
discharge from the <strong>MBBR</strong>s sent to a suspended growth reactor prior to the solids separation step.<br />
Conceptual designs and cost estimates were developed as part of the evaluation.<br />
Based on the life cycle costs comparison, the <strong>MBR</strong> technology appeared to be comparable to the<br />
conventional technologies. This was due, in part, to the high operating cost associated with historical<br />
polymer use in the clarifiers. From an effluent performance perspective, <strong>MBR</strong> technology offers a higher<br />
confidence level that effluent contaminant concentrations will be achieved and provides high quality<br />
<strong>MBBR</strong> <strong>TO</strong> <strong>MBR</strong>: A <strong>UNIQUE</strong> <strong>PROCESS</strong> <strong>CONFIGURATION</strong> <strong>FOR</strong><br />
PHARMACUETICAL WASTEWATER TREATMENT/REUSE
effluent for water reuse onsite. Because the <strong>MBR</strong> technology appeared to offer advantages over other<br />
technologies in this application, the <strong>MBR</strong> pilot study was conducted.<br />
The objectives of the <strong>MBR</strong> pilot study were to: (1) Evaluate membrane compatibility with the waste<br />
stream, (2) Evaluate membrane compatibility with <strong>MBBR</strong> technology, (3) Evaluate permeate quality, (4)<br />
Evaluate flux degradation and cleaning requirements, (5) Confirm membrane sizing requirements for the<br />
full-scale system. In order to accomplish the objectives of this pilot study, the General Electric (GE),<br />
ZeeWeed ® (GE Water and Process Technologies, Ontario) hollow-fiber membrane was selected for pilot<br />
testing.<br />
METHODOLOGY<br />
GE supplied the ZeeWeed® 10 <strong>MBR</strong> Pilot unit, which is rated at 100 gallons per day (gpd) of wastewater.<br />
The skid-mounted pilot system included a suspended growth reactor tank, followed by a membrane tank,<br />
both equipped with air blowers and a diffusion plate, a feed tank, a permeate collection tank, various<br />
pumps, and a PLC. The pilot unit’s components are pictured in Figure 1 and Figure 2.<br />
Figure 1: <strong>MBR</strong> Pilot Unit Bioreactor (left), Membrane Tank (center), and Supplemental Feed Tank (right).<br />
<strong>MBBR</strong> <strong>TO</strong> <strong>MBR</strong>: A <strong>UNIQUE</strong> <strong>PROCESS</strong> <strong>CONFIGURATION</strong> <strong>FOR</strong><br />
PHARMACUETICAL WASTEWATER TREATMENT/REUSE
Figure 2: <strong>MBR</strong> Pilot Unit PLC Control Panel (left) and Bioreactor (right).<br />
The pilot unit was continuously fed wastewater from two locations in the existing treatment train: (1) Raw<br />
wastewater from the EQ tanks, and (2) Treated wastewater from the <strong>MBBR</strong> effluent. A process flow<br />
diagram for the <strong>MBR</strong> pilot unit is presented below in Figure 3.<br />
Plant<br />
Water<br />
F/S<br />
Effluent<br />
<strong>MBBR</strong><br />
Effluent<br />
Transfer line with<br />
shutoff valve<br />
Transfer line with<br />
throttling valve<br />
(50-‐200 gpd)and<br />
rotameter<br />
Supplemental<br />
Feed Tank<br />
(120 gallons)<br />
Overflow<br />
to Drain<br />
Feed Pump<br />
(0 -‐ 760 gpd)<br />
air blower<br />
(5 cfm )<br />
ZeeWeed®10<strong>MBR</strong> Pilot Skid<br />
ReactorTank<br />
(100 gallons)<br />
Figure 3: Process Flow Diagram of Membrane Bioreactor (<strong>MBR</strong>)<br />
Permeate<br />
Collection<br />
tank<br />
(5 gallons)<br />
ZeeWeed®<br />
<strong>MBR</strong><br />
(10 ft 2 of membrane<br />
in<br />
5.3 gal tank)<br />
air blower<br />
(5 cfm )<br />
Reversible<br />
gear drive pump<br />
<strong>MBR</strong><br />
Permeate<br />
Discharge<br />
(access to drain)<br />
Waste<br />
Sludge<br />
Discharge<br />
(access to drain)<br />
The study was completed in the following four phases: (1) Acclimation Phase during which MLSS was<br />
increased to target ~8,000 mg/L in the membrane tank; (2) Phase I, intermediate F:M conditions ; (3),<br />
Phase II, low F:M conditions, consisting of Phase IIA, low DO conditions to promote SNdN, and Phase<br />
Overflow<br />
to Drain<br />
Overflow<br />
Transfer<br />
Pump<br />
<strong>MBBR</strong> <strong>TO</strong> <strong>MBR</strong>: A <strong>UNIQUE</strong> <strong>PROCESS</strong> <strong>CONFIGURATION</strong> <strong>FOR</strong><br />
PHARMACUETICAL WASTEWATER TREATMENT/REUSE<br />
PI<br />
CIP<br />
Chemicals
IIB, high DO conditions to discourage SNdN; and (4) Stress Test, low F:M and high mixed liquor<br />
suspended solids (MLSS) conditions. Table 1 provides study setup data.<br />
Table 1: <strong>MBR</strong> Pilot Study - Average Operating Conditions<br />
Parameter Units Acclimation Phase I Phase II A & B Stress Test<br />
Dates of Operation<br />
F/S Effluent Feed<br />
Rate<br />
<strong>MBBR</strong> Effluent<br />
Feed Rate<br />
Reactor Tank<br />
MLSS<br />
Influent soluble<br />
COD loading to<br />
Reactor Tank<br />
F:M<br />
July 26 –<br />
Aug 7<br />
Aug 8 –<br />
Aug 29<br />
Aug 30 –<br />
Sept 27<br />
Oct 6 –<br />
Oct 18<br />
gpd 104 90 - 180 0 0<br />
gpd 0 180 - 90 260 280<br />
mg/L 6,400 7,200 8,900 13,400<br />
lb<br />
COD/day<br />
lb<br />
sCOD/lb<br />
MLVSS-d<br />
Reactor Tank DO mg/L 2.5 4.2<br />
Membrane Flux<br />
Rate<br />
2.3 1.2 0.3 0.3<br />
1.5 0.5 0.09 0.06<br />
2.2 (Phase IIA)<br />
5.3 (Phase IIB)<br />
gpd/ft 2 10 10 10 10<br />
Operating parameters were monitored on a daily basis, including: flow rates to and from the system,<br />
MLSS and dissolved oxygen (DO) concentration in the suspended growth reactor, pH, temperature,<br />
trans-membrane pressure (TMP), COD in the influent and permeate. Four membrane cleaning<br />
mechanisms were utilized on the pilot system: (1) continuous scouring via the air blower/diffuser system,<br />
(2) backpulsing of the membrane by reversing the permeate pump, (3) maintenance cleaning cycle with<br />
dilute chemical solution, (4) recovery cleaning cycle with more concentrated chemical solution once<br />
during the study.<br />
RESULTS<br />
The <strong>MBR</strong> pilot system was operated successfully for the three month duration of the pilot study,<br />
maintaining high quality permeate with no indication of significant or irreversible membrane fouling.<br />
Table 2 presents selected indicators of system performance for each phase of the study. Average<br />
parameter results during the three month study (excluding acclimation phase) are highlighted below:<br />
• Permeate COD = 55 mg/l<br />
• Permeate BOD5 = 12 mg/l<br />
• Permeate TSS < 3 mg/l (all samples were below the detection limit)<br />
• TMP = -0.8 psi (average of before and after backpulse)<br />
• Average hydraulic flux rate through the membrane was 10 gallons per day per square foot of<br />
membrane area (gfd);<br />
• MLSS in the reactor tank = 9,171 mg/L (maximum MLSS in the reactor tank was 17,700 mg/L)<br />
• F:M = 0.26 lb sCOD/lb VSS-d (F:M varied between 0.03 and 1.2)<br />
• Specific substrate utilization rate = 0.25 lb sCOD/lb VSS (rate varied between 0.02 and 1.1)<br />
• NH3-N < 0.5 mg/l; NO3-N = 4.2 mg/l; TP = 3.8 mg/l.<br />
2.1<br />
<strong>MBBR</strong> <strong>TO</strong> <strong>MBR</strong>: A <strong>UNIQUE</strong> <strong>PROCESS</strong> <strong>CONFIGURATION</strong> <strong>FOR</strong><br />
PHARMACUETICAL WASTEWATER TREATMENT/REUSE
Table 2: <strong>MBR</strong> Pilot Results - Average Performance Parameters<br />
Units Acclimation* Phase<br />
I<br />
Phase IIA Phase IIB<br />
Stress<br />
Test<br />
Permeate Quality<br />
COD mg/L 84 64 58 42 46<br />
BOD5 mg/L 11.7 11.6 5.2 2 31<br />
TSS mg/L BDL BDL BDL BDL BDL<br />
Ammonia (NH3-N) mg/L Limited data 0.6 0.6 0.1 0.8<br />
Nitrate (NO3-N) mg/L No data 2.3 3.4 5.3 2.8<br />
Total Phosphorous mg/L 0.4 3.9 8.3 3.6 1.2<br />
Other Key Parameters<br />
MLSS mg/L 6,438 7,238 9,540 8,121 13,381<br />
Before Backpulse TMP psi -0.6 -0.6 -0.8 -1.0<br />
During Backpulse TMP psi 1.4 1.7 2.1 7.1<br />
After Backpulse TMP psi<br />
lb sCOD/lb<br />
-0.2 -0.3 -0.6 -0.4<br />
F:M<br />
MLVSS-d 1.2 0.5 0.08 0.09 0.06<br />
Specific Substrate<br />
Utilization Rate<br />
lb sCOD/lb<br />
MLVSS-d 1.1 0.5 0.06 .08 0.05<br />
Reactor Tank<br />
Dissolved Oxygen (DO) mg/L 2.3 4.2 2.2 5.3 2.1<br />
* After July 27, 2011<br />
Biological performance results<br />
The pilot study phases were established to evaluate the <strong>MBR</strong> system for COD removal under varying F:M<br />
conditions. During the acclimation phase, there was potential to observe high residual COD in the<br />
permeate as the reactor was operated at high F:M (1.5 lb sCOD/lb VSS-d) conditions to simulate biomass<br />
growth. Despite the high F:M conditions, the average permeate COD during the acclimation phase after<br />
July 27 was 84 mg/l and the specific substrate utilization rate averaged over 1 lb sCOD/lb MLVSS-d. This<br />
data indicates that the F/S effluent was readily biodegradable under the conditions of the acclimation<br />
phase.<br />
During the intermediate F:M conditions of Phase I (0.5 lb sCOD/lb MLVSS-d), a higher permeate effluent<br />
quality was observed, as COD averaged less than 64 mg/L. Phase II, which operated at low F:M<br />
conditions (0.09 lb sCOD/lb MLVSS-d), produced the highest quality permeate, with effluent COD<br />
average of 50 mg/l.<br />
Figure 4 presents permeate COD, specific substrate utilization rate, and F:M ratios for the study. In<br />
general, the substrate utilization rate corresponded well with the F:M ratio, which is as expected given the<br />
consistently low residual COD in the permeate throughout the study period. It is interesting to note that,<br />
excluding the first day of acclimation, the permeate COD did not exceed 150 mg/l during the study. Given<br />
this data, the F/S and <strong>MBBR</strong> effluents appear to be very readily biodegradable at the conditions observed<br />
in the study.<br />
<strong>MBBR</strong> <strong>TO</strong> <strong>MBR</strong>: A <strong>UNIQUE</strong> <strong>PROCESS</strong> <strong>CONFIGURATION</strong> <strong>FOR</strong><br />
PHARMACUETICAL WASTEWATER TREATMENT/REUSE
800<br />
700<br />
600<br />
500<br />
Permeate COD, mg/L<br />
400<br />
300<br />
200<br />
100<br />
0<br />
Permeate COD<br />
Reactor Tank F:M<br />
Substrate Utilization Rate<br />
Mechanical Upset Period<br />
7/16/11 7/26/11 8/5/11 8/15/11 8/25/11 9/4/11 9/14/11 9/24/11 10/4/11 10/14/11 10/24/11<br />
Figure 4: Permeate COD, Substrate Utilization Rate, and F:M Ratio<br />
Phase IIA operated at an average dissolved oxygen (DO) concentration of 2.2 mg/L in order to provide<br />
conditions in the reactor for SNdN to occur; Phase IIB operated at an average DO of 5.3 mg/L to<br />
discourage SNdN and to observe nitrate concentrations in the permeate. Nitrate concentration in the<br />
permeate is dependent on a number of factors, including DO concentration, F:M, and influent nitrogen to<br />
COD ratio (N/COD). The higher the influent N/COD ratio, the greater the potential is to generate nitrate.<br />
Lower F:M conditions can also lead to an increase in nitrate formation.<br />
Figure 5 presents the nitrate data for Phase II. Since the influent N/COD during Phase IIA was higher<br />
than during Phase IIB, and the F:M for Phase IIA was lower than Phase IIB, it is expected that more<br />
nitrate was generated during Phase IIA than during Phase IIB. The average permeate nitrate<br />
concentrations for Phase IIA and Phase IIB were 3.4 mg/l and 5.3 mg/l respectively. This data indicates<br />
that it is likely that SNdN was occurring at a higher rate in Phase IIA.<br />
1.80<br />
1.55<br />
1.30<br />
1.05<br />
0.80<br />
0.55<br />
0.30<br />
0.05<br />
-‐0.20<br />
<strong>MBBR</strong> <strong>TO</strong> <strong>MBR</strong>: A <strong>UNIQUE</strong> <strong>PROCESS</strong> <strong>CONFIGURATION</strong> <strong>FOR</strong><br />
PHARMACUETICAL WASTEWATER TREATMENT/REUSE<br />
Food-‐to-‐Biomass Ratio, lb sCOD/lb MLVSS-‐d<br />
Specific Substrate Utilization Rate, lb sCOD/lb MLVSS-‐d
Nitrate in Permeate,mg/l<br />
10<br />
9<br />
8<br />
7<br />
6<br />
5<br />
4<br />
3<br />
2<br />
1<br />
0<br />
PHASEIIAAverages: DO = 2.2 mg/l,<br />
F:M= 0.08, Nitrate = 3.4 mg/l<br />
8/25/11 8/30/11 9/4/11 9/9/11 9/14/11 9/19/11 9/24/11 9/29/11<br />
Figure 5: Phase II SNdN Evaluation Nitrate Results<br />
Membrane performance results<br />
Nitrate NH3-‐N/sCOD Ratio<br />
PHASEIIB Averages: DO = 5.3 mg/l, F:M = 0.10,<br />
Nitrate = 5.3 mg/l<br />
A plot of the transmembrane pressure (TMP) throughout the course of the study is presented in Figure 6.<br />
We observed excellent membrane performance during the study. The after backpulse TMP averaged -<br />
0.5 psi, which is well below the trigger level for a recovery clean. We consistently observed pressures<br />
after backpulse that were lower than pressures before backpulse, which is indicates that the backpulse<br />
was providing an effective membrane cleaning mechanism by scouring the solids off of the surface of the<br />
membrane.<br />
<strong>MBBR</strong> <strong>TO</strong> <strong>MBR</strong>: A <strong>UNIQUE</strong> <strong>PROCESS</strong> <strong>CONFIGURATION</strong> <strong>FOR</strong><br />
PHARMACUETICAL WASTEWATER TREATMENT/REUSE<br />
0.18<br />
0.16<br />
0.14<br />
0.12<br />
0.11<br />
0.09<br />
0.07<br />
0.05<br />
0.04<br />
0.02<br />
0.00<br />
Influent NH3-‐N/sCOD Ratio
TMP, psi<br />
12.0<br />
10.0<br />
8.0<br />
6.0<br />
4.0<br />
2.0<br />
0.0<br />
-‐2.0<br />
-‐4.0<br />
-‐6.0<br />
Before Backpulse Pressure<br />
During Backpulse Pressure<br />
After Backpulse Pressure<br />
Recovery clean<br />
Stress Test<br />
Replaced Pressure Gauge<br />
7/16/11 7/26/11 8/5/11 8/15/11 8/25/11 9/4/11 9/14/11 9/24/11 10/4/11 10/14/11 10/24/11<br />
Figure 6: Transmembrane Pressure (TMP) Results<br />
Although TMPs above the recovery clean trigger level were not observed, a recovery clean was<br />
performed to evaluate if membrane fouling was reversible. Just prior to the recovery clean, the TMP had<br />
increased to -5 psi before backpulse and -2 psi after backpulse.<br />
Figure 7 shows the TMP of the initial membrane condition (at the beginning of the pilot study), and the<br />
TMP immediately before and after the recovery clean cycle with each chemical. The results indicate that<br />
citric acid proved the more effective cleaning chemical during the recovery clean, as TMP was decreased<br />
to the initial membrane condition (~-0.3 psi) after cleaning with this chemical. The TMP recovery<br />
suggests that the membrane fouling was largely reversible. It should be noted that the difference in TMP<br />
during the clean water tests before and after citric and hypo cleans was very small, which indicates that<br />
the membrane fouling was minimal.<br />
<strong>MBBR</strong> <strong>TO</strong> <strong>MBR</strong>: A <strong>UNIQUE</strong> <strong>PROCESS</strong> <strong>CONFIGURATION</strong> <strong>FOR</strong><br />
PHARMACUETICAL WASTEWATER TREATMENT/REUSE
Transmembrane Pressure (TMP), psi<br />
0.0<br />
-‐0.1<br />
-‐0.2<br />
-‐0.3<br />
-‐0.4<br />
-‐0.5<br />
Initial Condition (July-‐26) Before recovery clean (Oct-‐4) After Hypo recovery clean (Oct-‐4) After Citric recovery clean (Oct-‐5)<br />
Figure 7: <strong>MBR</strong> Pilot Recovery Clean - Flux Test Results<br />
During the stress test phase, the MLSS was increased to ~ 13,400 mg/l in the reactor tank to observe the<br />
impacts on membrane performance. As expected, the TMP during backpulse increased, up to 7 psi, and<br />
the TMP before backpulse increased to -2 psi. Yet the TMP after backpulse was in line with the study<br />
average, at less than -0.5 psi. This data indicates that while the high MLSS concentration in the<br />
membrane tank was causing additional solids deposition on the membrane surface, the backpulse<br />
cleaning mechanism was effective in scouring the solids off of the surface. A picture of the membrane<br />
unit after the pilot test is presented below in Figure 8.<br />
Figure 8: Membrane Unit at the Conclusion of Pilot Testing<br />
Mixed Liquor Test<br />
Clean Water Test<br />
<strong>MBBR</strong> <strong>TO</strong> <strong>MBR</strong>: A <strong>UNIQUE</strong> <strong>PROCESS</strong> <strong>CONFIGURATION</strong> <strong>FOR</strong><br />
PHARMACUETICAL WASTEWATER TREATMENT/REUSE
DISCUSSION AND CONCLUSIONS<br />
The results of the pilot study indicate that the unit process configuration of <strong>MBBR</strong> to <strong>MBR</strong> is technically<br />
feasible for full-scale treatment at an industrial pharmaceutical facility. We do not find it likely that this<br />
configuration will be widely installed because of capital cost considerations. However, in this application,<br />
the <strong>MBR</strong> technology is economically feasible because the owner was willing to perform the evaluation<br />
based on a life cycle cost analysis.<br />
On a capital cost basis, <strong>MBR</strong> technology is more expensive than conventional solids separation<br />
technologies for this application (including the cost credit for a smaller reactor). However, when taking<br />
into account life cycle costs, the <strong>MBR</strong> technology in this application would allow for an estimated<br />
$272,000 per year savings related to clarifier polymer costs.<br />
In this case, the <strong>MBR</strong> would be added to an existing treatment plant with <strong>MBBR</strong> technology. The drivers<br />
for selection of <strong>MBR</strong> technology in this application is the owner’s desire to:<br />
• Avoid any permit compliance issues,<br />
• Install a technology that facilitates on-site effluent reuse, and<br />
• Reduce chemical and polymer costs which are historically high,<br />
Because we are not aware of other full scale installations with this configuration we wanted to rigorously<br />
test membrane flux degradation rates and membrane recovery post cleaning to confirm membrane life<br />
cycle estimates. We operated the <strong>MBR</strong> reactor in a stress test mode with MLSS values well above the<br />
recommended concentration of 8,000 mg/l. Test results showed that we could successfully clean the<br />
membrane without any visible deposition or TMP increase after the stress test. This increased our<br />
confidence level that we would not have rapid flux degradation at the full scale and that the membrane life<br />
would be satisfactory.<br />
A preliminary design is currently being developed for a full-scale system at this pharmaceutical<br />
manufacturing facility.<br />
<strong>MBBR</strong> <strong>TO</strong> <strong>MBR</strong>: A <strong>UNIQUE</strong> <strong>PROCESS</strong> <strong>CONFIGURATION</strong> <strong>FOR</strong><br />
PHARMACUETICAL WASTEWATER TREATMENT/REUSE